1. Introduction
Stress perception and cardiovascular health assessment rely on the analysis of heart rate and heart rate variability (HRV), crucial indicators particularly valuable for monitoring the autonomic nervous system in surgical, critically ill, and COVID-19 patients [
1,
2,
3]. Photoplethysmography (PPG) serves as a non-invasive detection method, capturing changes in blood volume in living tissue through video recordings from a network camera and utilizing an active appearance model for facial landmarks and head detection [
4,
5]. A mathematical model for Remote Photoplethysmography (rPPG) measurement, based on optical and physiological considerations and assuming a single light source with a constant spectrum, has been proposed [
6]. The analysis in [
6] reveals that combining models such as Plane-Orthogonal-to-Skin (POS) and Chrominance-Bass (CHROM) rPPG, each based on different assumptions, allows the development of diverse algorithms for extracting pulse signals from video data. To extract biometric information from facial videos, the process involves pre-processing images through low-pass (LP) filtering and detrending. Subsequently, independent components are generated and compared, with Fast Fourier Transform (FFT) employed to calculate and select the component exhibiting a significant maximum within the expected frequency range [
7]. Zhang et al. [
8] proposed using standard RGB cameras to record facial videos, extracting facial and background regions of interest (ROI) signals from each video. Joint Blind Source Separation (JBSS) is then applied to eliminate common illumination components from facial and background ROI signals, resulting in a new facial ROI signal. Independent Component Analysis (ICA) [
9] is utilized to extract pulse signals from this new facial ROI signal, and HR is calculated using Fast Fourier Transform (FFT).
Timothy Burton et al. conducted a study [
10] utilizing smartphones and remote Photoplethysmography (rPPG) technology to compare signals from hairless and non-hairless skin areas. Their results revealed that rPPG measurements obtained from hairless skin areas exhibited a notable average time advantage in milliseconds compared to non-hairless regions. Moreover, pulse signal amplitudes in hairless areas were approximately 31% higher. The comparison of rPPG signals from these distinct regions suggested that hairless skin areas might provide more robust pulse signals, leading to more accurate measurements of heart rate and heart rate variability. In a different approach, Unursaikhan et al. [
11] proposed a methodology using a network camera to monitor RGB hue variations in the facial region of interest caused by arterial pulsation for measuring inter-beat intervals (IBI). They applied wavelet transformation to extract pulse waves and calculated heart rate variability (HRV) parameters. Logistic regression analysis, incorporating these parameters during pre-rest, mental task, and post-rest periods, was conducted to distinguish patients with major depressive disorder (MDD) from healthy volunteers. The non-contact MDD screening system demonstrated a sensitivity of 73% and specificity of 85%, offering mental health professionals a valuable tool for preliminary assessments before detailed patient histories, thereby reducing the misdiagnosis rate. In a separate approach, Al Fahoum [
12] employed data mining techniques to integrate critical features of the Photoplethysmography (PPG) signal with demographic information, allowing differentiation between healthy individuals and those with cardiovascular disease (CVD). This innovative method aims to enhance diagnostic capabilities by combining physiological signals with additional patient information.
The rPPG methods and ICA-based BSS method mentioned earlier exhibit prolonged convergence times, while POS and CHROM entail intricate model operations. Moreover, they primarily concentrate on analyzing signal-to-noise ratio, neglecting a comprehensive discussion on the response time and accuracy of heart rate and HRV measurements. To circumvent these drawbacks, A method using a regular webcam to obtain continuous images, tracking facial landmarks, and extracting region images was delved by Su et al. [
13]. They analyzed heart rate variability parameters in the green wavelength of the RGB color space, utilized Independent Component Analysis (ICA) combined with Particle Swarm Optimization (PSO) for signal elimination, and obtained physiological information using bandpass filtering, Fast Fourier Transform (FFT), Detrended Fluctuation Analysis (DFA) and power spectrum Density (PSD). In this research is based on capturing the Photoplethysmography (PPG) signal of the palm image and measuring heart rate and heart rate variability data by combining the intelligent algorithm Particle Swarm Optimization (PSO) and Independent Components Analysis (ICA) signal separation method. The palm image measurement method was used to replace the forehead image measurement method and The particle swarm optimization algorithm can accelerate the convergence of signal processing. In addition to preventing hair from interfering with the measurement, it can also obtain less measure time and more accurate research results to enhance the accuracy and convenience of medical diagnosis.
The remainder of this paper follows the following structure. In the upcoming sections,
Section 2 provides a comprehensive description of the proposed approach, elucidating its methodology and system architecture design. The experimental results obtained from the application of this approach are presented and discussed in
Section 3. Subsequently,
Section 4 delves into the discussion of the study's findings. Finally, the concluding remarks are presented in the last section, summarizing the key insights and implications drawn from the research.
2. Methodologies
In this paper methodologies are described as following, in order to enhance computational speed and accuracy in this study, we utilized palm tracking and Region Of Interest (ROI) to obtain palm images. These images were then transformed into time-domain waveforms using an average pixel approach, followed by waveform normalization. This method represents a preferable choice as it eliminates the need for complex mathematical equations.
2.1. System Architecture
Figure 1 depicts the system architecture for this research. The primary objective of this study is to develop a diagnostic tool that can support healthcare professionals in the process of diagnosing medical conditions. The system's architecture is outlined as follows: Initially, an image sensor equipped with a charge-coupled device on the webcam captures images. When light is directed onto the sensor's surface, it generates electrical charges, which are then converted into voltage signals. These voltage signals are used to create and output images in real-time. Subsequently, an Analog-to-Digital Converter (ADC) is employed to transform the analog voltage signals into digital ones, and these digital signals are transmitted to a PC via USB serial communication. The system leverages techniques in image recognition and digital signal processing to manage and analyze significant volumes of data, ultimately extracting the user's physiological signals. The system then computes various physiological parameters, including heart rate and heart rate variability, to assist healthcare providers in diagnosing medical conditions. This approach aims to enhance diagnostic efficiency and mitigate the risk of misdiagnosis.
architecture diagram
The system is characterized by the following features:
- ■
Operation System: Window’s 10 Professional (×64);
- ■
CPU: Intel(R) Core(TM) i7-9700 CPU @ 3.00GHz);
- ■
Memory: 16 GB DDR3 1333 MHz;
- ■
Developer Interface: TensorfloW-Keras (Spyder4.2.0);
- ■
Program: Python3.6;
- ■
Webcam: E-books E-PCC072 (1080 p/30 fps);
- ■
Dynamic Resolution: 1920 × 1080.
2.2. Independent components analysis, ICA
The ICA algorithm was presented by J. Herault and C. Jutten [
14] with the aim of describing the problem of Blind Separation Systems. As specified in equation (1), (2), the observations are modeled as follows:
where
x,
s and
A are the input vector, the vector of independent sources and the merging matrix, respectively. The main target is to obtain the separating matrix
W, from input vector
x to form the prediction sources vector, which is yield provided as follows:
where
is the vector of prediction sources.
W is derived by the PSO algorithm with speed-up convergence in this paper.
2.3. Particle Swarm Optimization, PSO
Particle Swarm Optimization is an evolutionary computation technique. Similar to genetic algorithms, PSO is a population-based optimization tool inspired by social behavior among individuals. Each particle i maintains a record of the position of its previous best performance in a vector called pbest. The nbest is another "best" value that is tracked by the particle swarm optimizer. Each particle calculates its own velocity and updates its position in each iteration. Let pi,d denote the best previous position encountered by the ith particle, pg,d denotes the global best position thus far, and t denotes the iteration counter. The current velocity of the dth dimension of the ith particle at time t is
In the above formula, rand() is a random function in the range [0, 1], positive constants c1 and c2 are personal and social learning factors, and w is the inertia weight. The new position of a particle is calculated using the following formula:
2.4. Region of interest (ROI) and Palm Images
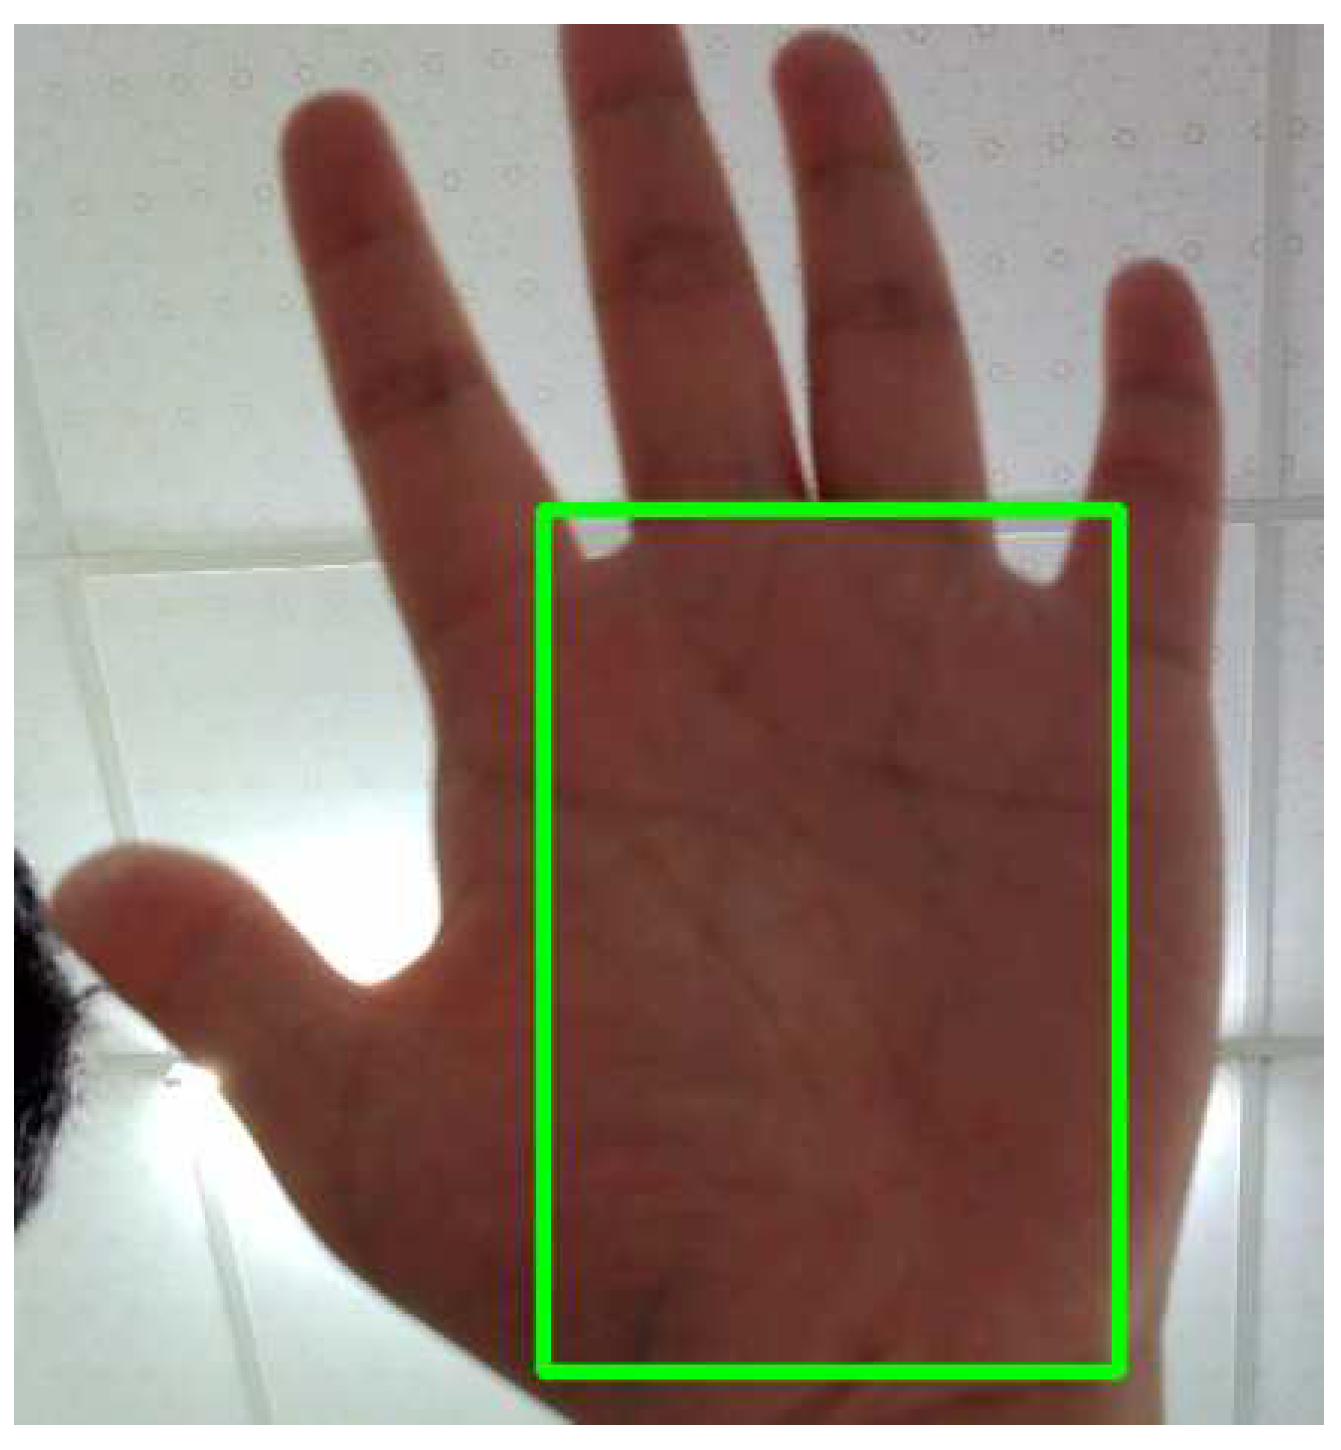
The selection of Region of Interest (ROI) represents the first step in obtaining rPPG signals. ROI selection excludes non-skin regions, and most methods for measuring heart rate using rPPG signals require the use of ROI. Choosing the palm region as the model's input for predicting RPPG signals can help avoid interference from non-skin areas, as depicted in
Figure 2.
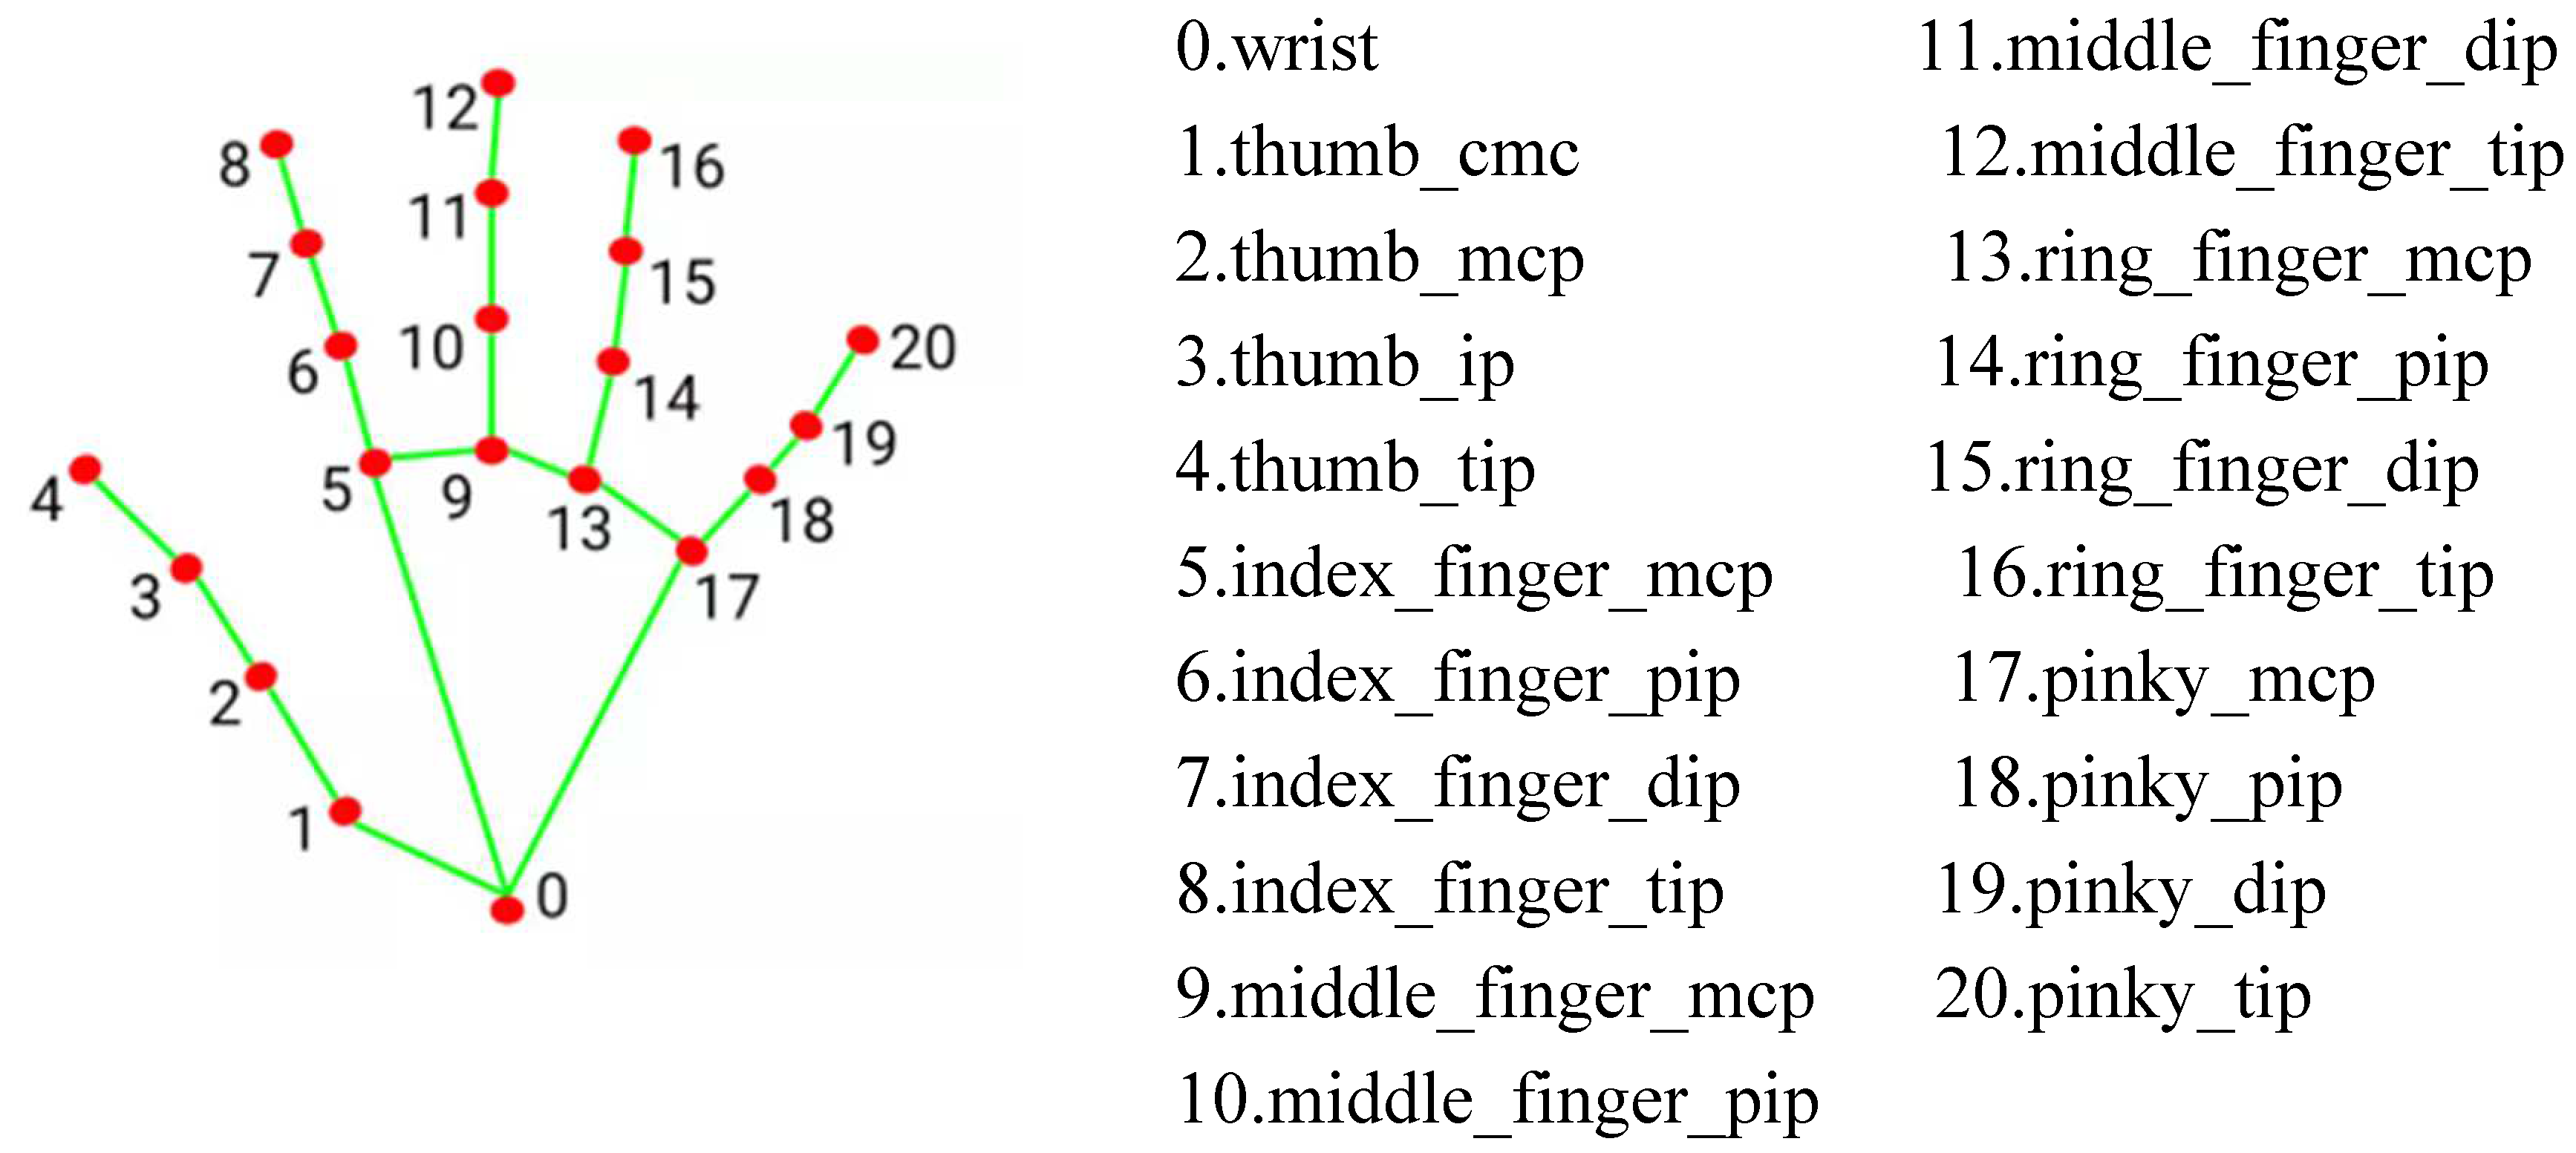
This study employed the Palm Images functionality of MediaPipe, focused on applications in visual and audio processing [
16,
17]. After detecting the palm using the hand landmark model bundle detects the key point localization of 21 hand-knuckle coordinates within the detected hand regions. The model was trained on approximately 30K real-world images, as well as several rendered synthetic hand models imposed over various backgrounds. in
Figure 3.
2.5. Heart Rate and Heart Rate Variability, HRV
Heart Rate (HR), measured in beats per minute, quantifies the number of heartbeats within a minute. It does not necessitate exact timing; rather, it represents the average count of beats within a designated time period. For instance, a HR of 60 beats per minute could denote one beat per second or an average of one beat every 0.5 seconds, 1.5 seconds, 0.5 seconds, 1.5 seconds, and so forth.
BPM stands for beats per minute and is the unit of measurement for heart rate. It represents the number of heartbeats occurring in one minute. Heart rate refers to the number of times the heart contracts and relaxes within a minute and is typically expressed in BPM. For example, if the heart rate is 60 BPM, it means the heart beats 60 times per minute. Heart rate is one of the essential indicators for assessing overall health and cardiovascular system function and is widely used in the medical and healthcare fields.
Measuring heart rate typically involves analyzing the QRS complex wave in an electrocardiogram (ECG) signal, where the QRS complex represents the major visible peaks in the ECG signal. An algorithm proposed by Jiapu Pan and Willis J. Tompkins in 1985 is used to measure this wave [
18]. This algorithm employs a 0.4-10 Hz bandpass filter to highlight the frequency content of this rapid heart depolarization and remove background noise. Subsequently, the signal is squared to enhance the QRS complex, making the identification of the QRS complex more straightforward.
HRV measurement involves specific variations in the time (or variability) between consecutive heartbeats, known as 'Inter-Beat Interval (IBI).' Following the automatic detection of R-wave peaks in the QRS complex, ectopic heartbeats are scanned and removed to eliminate artifacts from all data sets. After this process, RR intervals are calculated in milliseconds. Artiifact [
19] and Kubios [
20] are used to obtain HRV parameters from the generated graphs. Both applications are utilized for double-checking the accuracy and consistency of the results.
Calculating HR and HRV parameters
The acquired measurements necessitate conversion into interpretable values utilizing designated formulas and algorithms. The ensuing time-domain parameters are specified: Standard Deviation of Normal-to-Normal intervals (SDNN) and Root Mean Square of Successive Differences (RMSSD).
where RR is the period between two follow-up R-peaks of heartbeats, N is the number of RR intervals, RR i is the period of the RR interval, and
is the mean period of all RR intervals.
Heart Rate Variability Time Domain Analysis
Heart Rate Variability (HRV) serves as an indicator of cardiac function resulting from the intricate interaction between the cardiac system and the nonlinear processes of the autonomic nervous system (ANS). HRV is an emerging characteristic of interconnected regulatory systems that function across various time scales, aiding in our adaptation to environmental and psychological challenges. It provides insights into the regulation of autonomic nervous balance, blood pressure (BP), gas exchange, gastrointestinal function, heart activity, vascular tone, and more. To describe HRV, various measures are employed, including time-domain, frequency-domain, and nonlinear assessments, covering periods of 24 hours, short-term intervals (5 minutes), or ultra-short-term durations (<5 minutes).
Heart Rate Variability Frequency Domain Analysis
The Working Group of the European Society of Cardiology and the North American Pacing and Electrophysiology Society (1996) [
21] classified heart rate variability into four frequency bands: ultra-low frequency (ULF), very low frequency (VLF), low frequency (LF), and high frequency (HF), with respective spectral ranges of ≤0.003 Hz, 0.0033–0.04 Hz, 0.04–0.15 Hz, and 0.15–0.40 Hz. These units serve as a quantification measure for heart rate variability. 'n.u.' denotes normalized units, a standardization unit applied to heart rate variability.
2.5.1. Waveform Processing
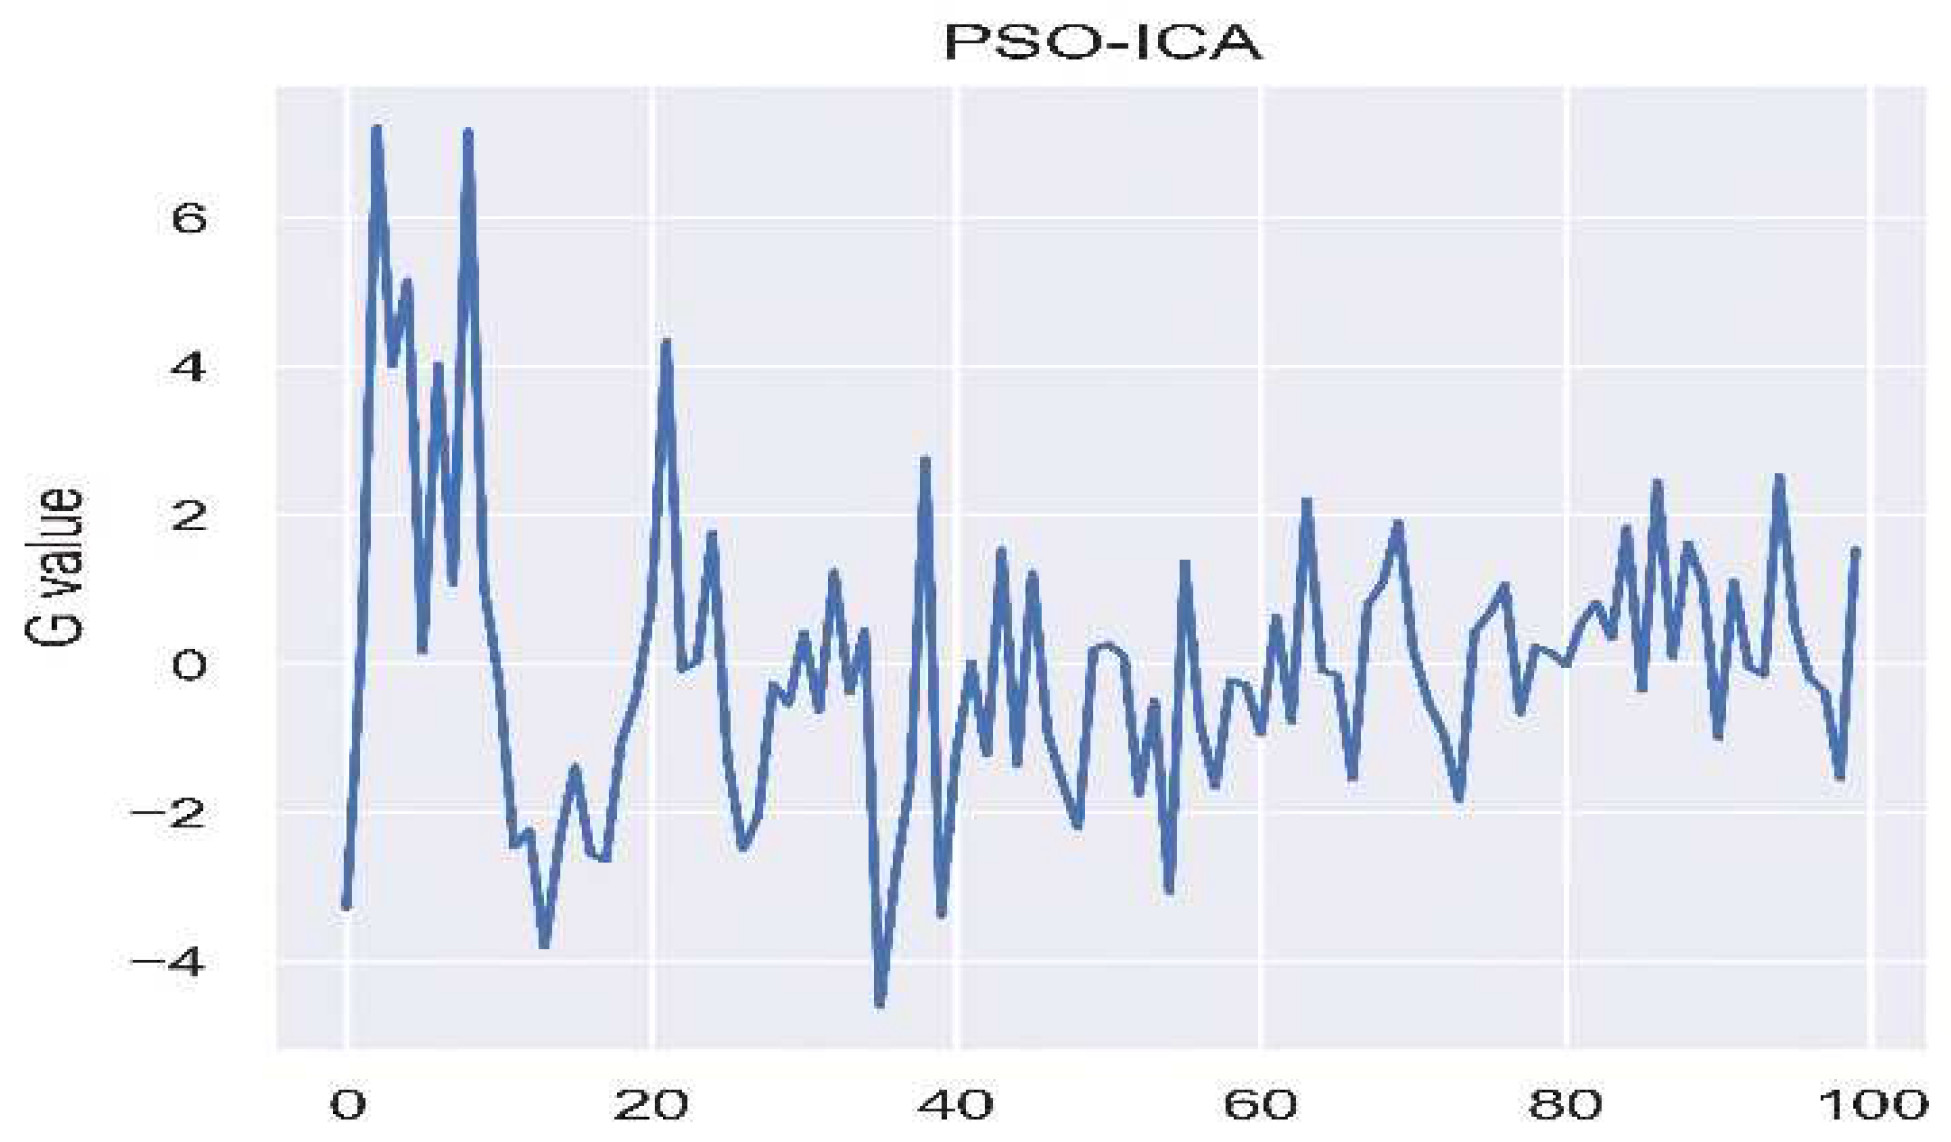
The measurement of Remote Photoplethysmography (RPPG) is often prone to interference from ambient light. To tackle this issue, PSO-ICA is utilized, as shown in
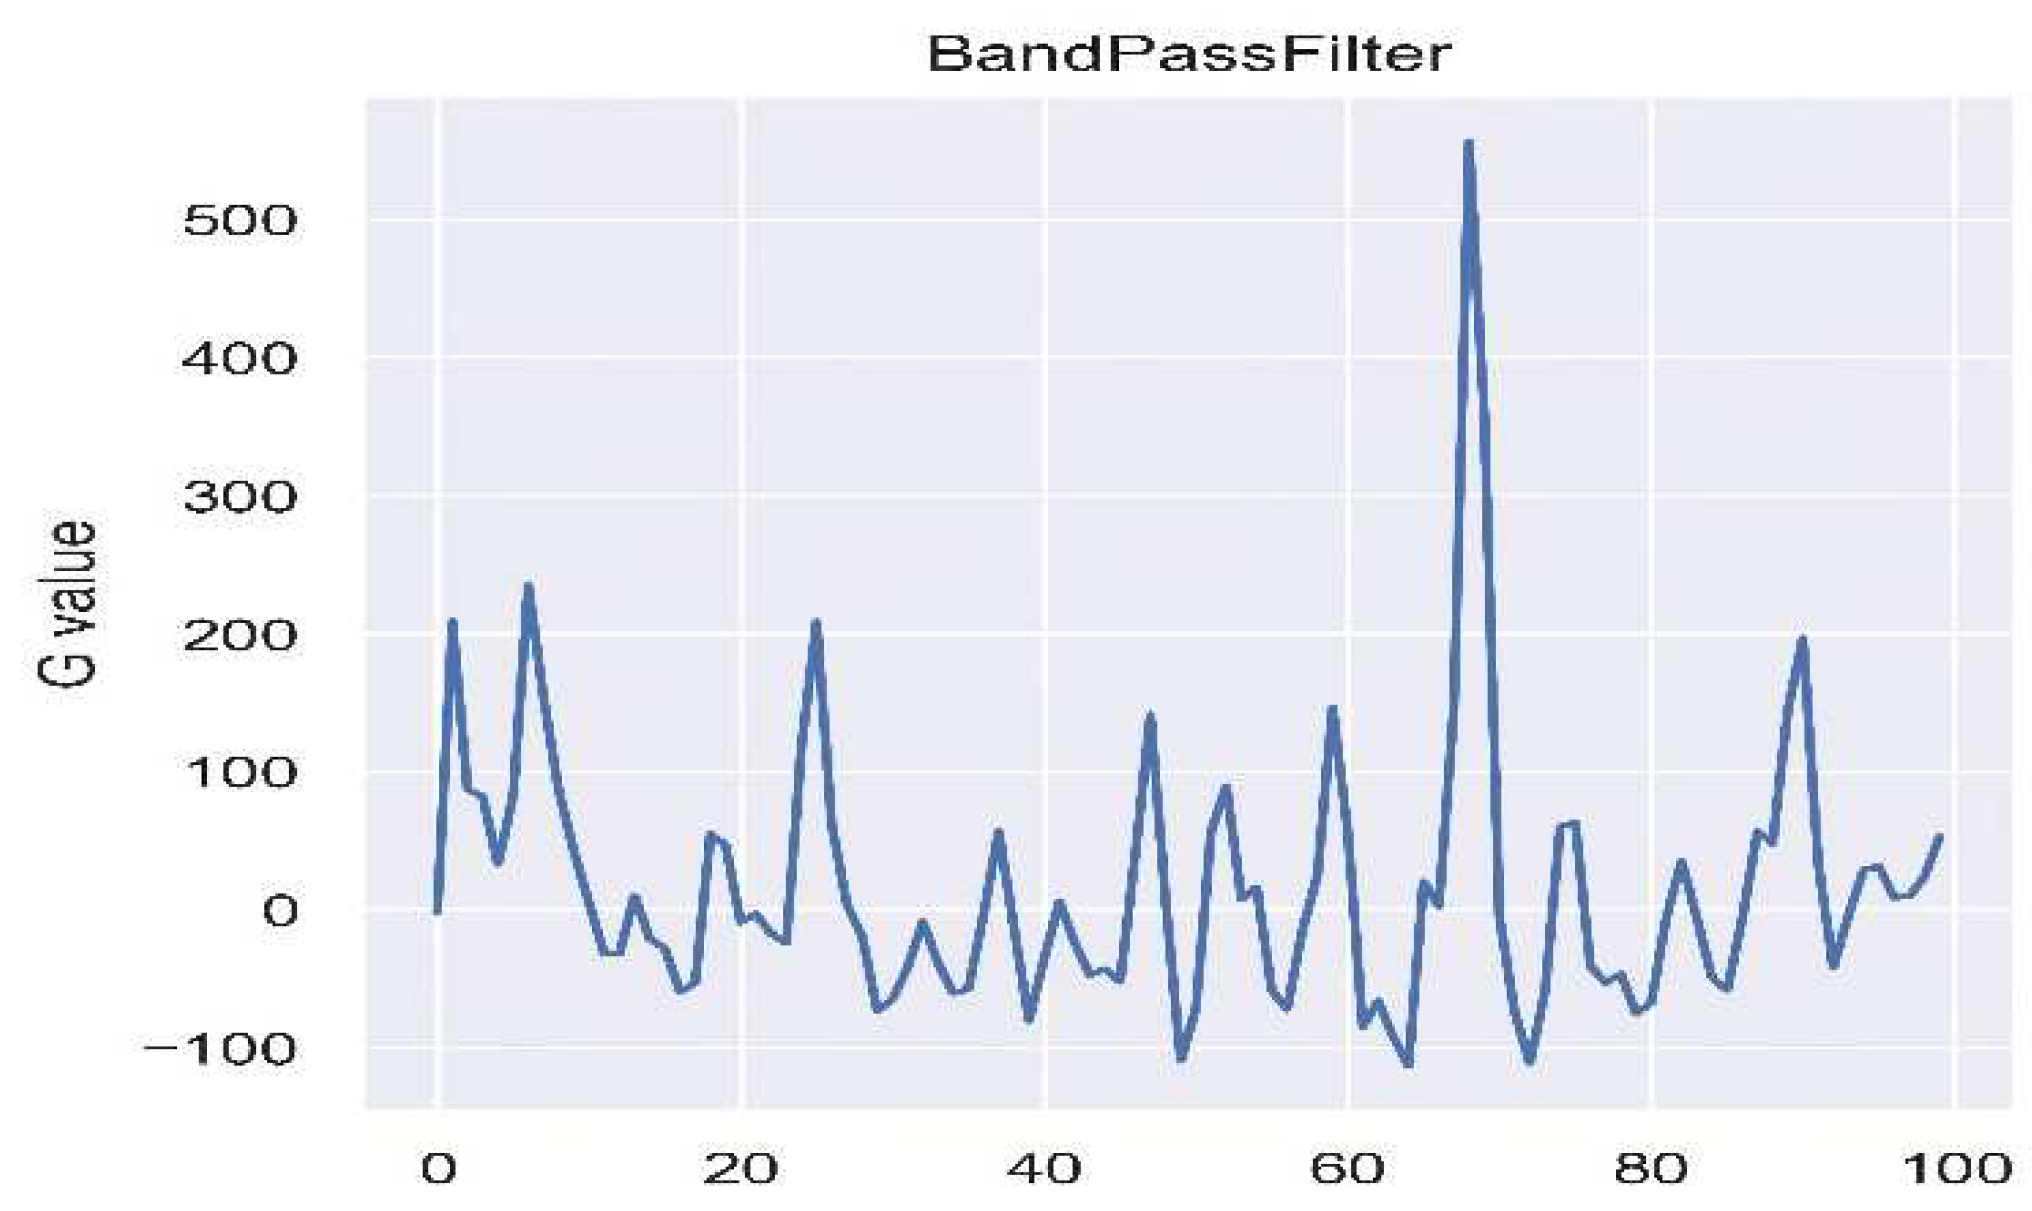
Figure 4, to alleviate the influence of light. Following this, noise is filtered, and the signal undergoes amplification through a band-pass filter ranging from 0.4 to 10Hz, as illustrated in
Figure 5. Subsequently, peak-to-peak detection is carried out, and the time difference between peaks is calculated using the frame rate to determine the data processing time.
2.5.2. Frequency Domain Transformation
As shown in
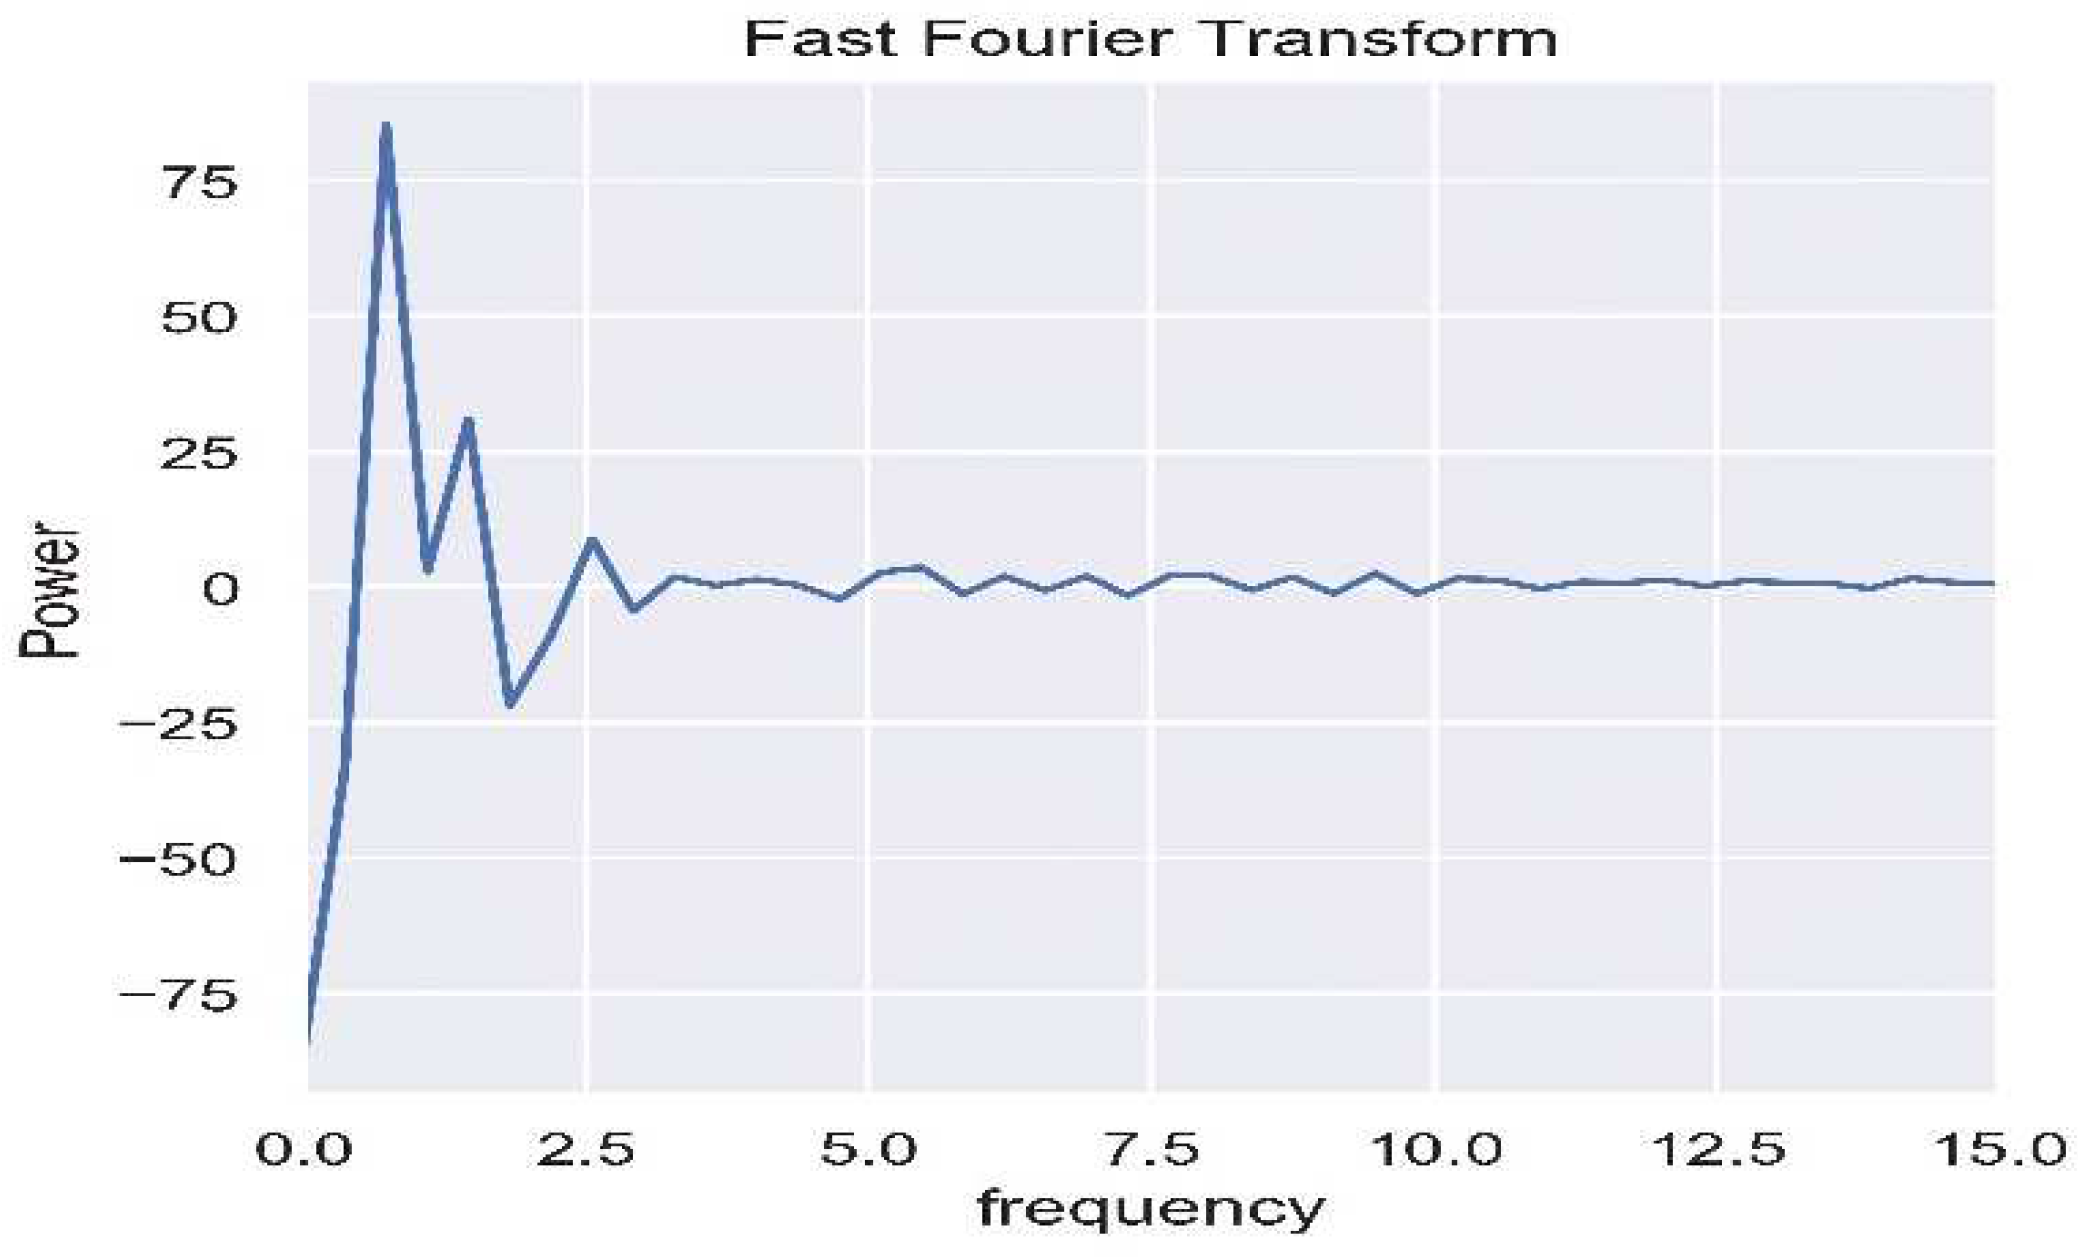
Figure 6, the waveform, after being subjected to bandpass filtering, is transformed into the frequency domain using Fast Fourier Transform (FFT), and the heart rate is calculated using a specified formula. The High-Frequency (HF) and Low-Frequency (LF) bands are separated through the bandpass filter and then transformed into the frequency domain using power spectral density, as illustrated in
Figure 7. HRV parameters are subsequently computed using a dedicated formula.
2.5.3. Bandpass filter, BF
The main target of the Bandpass filter is to eliminate waveform noise and narrow down the feature space. Since the heart undergoes frequency variations with each heartbeat, resulting in changes in carrier frequency, this paper utilizes the Bandpass filter to isolate the carrier frequency of the heartbeat. According to reference [
22], Kohler suggested a typical frequency component range for the QRS complex of approximately 0.4Hz to 10Hz. Therefore, in this study, the filter is configured within the range of 0.4~10Hz, defining two frequency bands for Heart Rate Variability (HRV): (1) the Low-Frequency (LF) band ranging from 0.045 to 0.15 Hz and (2) the High-Frequency (HF) band spanning from 0.15 to 0.4 Hz.
FFT, which stands for Fast Fourier Transform, functions as an expedited technique for computing the Discrete Fourier Transform (DFT) and is widely employed in frequency analysis. FFT analysis enables the conversion of the signal from the time domain to the frequency domain. As explained in reference [
23], the key difference between FFT and DFT lies in their time complexity, with FFT exhibiting a time complexity of O(Nlog₂(N)) iterations, as illustrated in equation (7), where N represents the number of samples in the sequence.
In this research, the sequence undergoes Fourier transformation at a frequency of 10 Hz with a uniformly distributed rate. The Power Spectral Density (PSD) is divided into the Very Low Frequency (VLF: 0 to 0.2 Hz), Low Frequency (LF: 0.20 to 0.75 Hz), and High Frequency (HF: 0.75 to 3.0 Hz) bands. The spectrum for each band is estimated using the Hanning window. Subsequently, the area is computed using the trapezoidal formula, and the LF/HF ratio is determined to assess the balance between the sympathetic and parasympathetic nervous systems.
The calculation of frequency domain parameters involves the trapezoidal formula f(x) (eq. 8), which calculates the area under the power spectral density spectrum within the specified frequency domain range. The abbreviations for the frequency domain parameters are defined as follows: Heart Rate (HR) (eq. 9), Very Low Frequency (VLF) represents power within the extremely low-frequency range (eq. 10), Low Frequency (LF) represents power within the low-frequency range (eq. 11), and High Frequency (HF) represents power within the high-frequency range (eq. 12).
In this investigation, normalized parameters, namely normalized low frequency power (nLFP) (eq. 13), normalized high frequency power (nHFP) (eq. 14), and the ratio of low to high frequency power (eq. 15), are employed for validation purposes.
2.5.4. Power Spectral Density, PSD
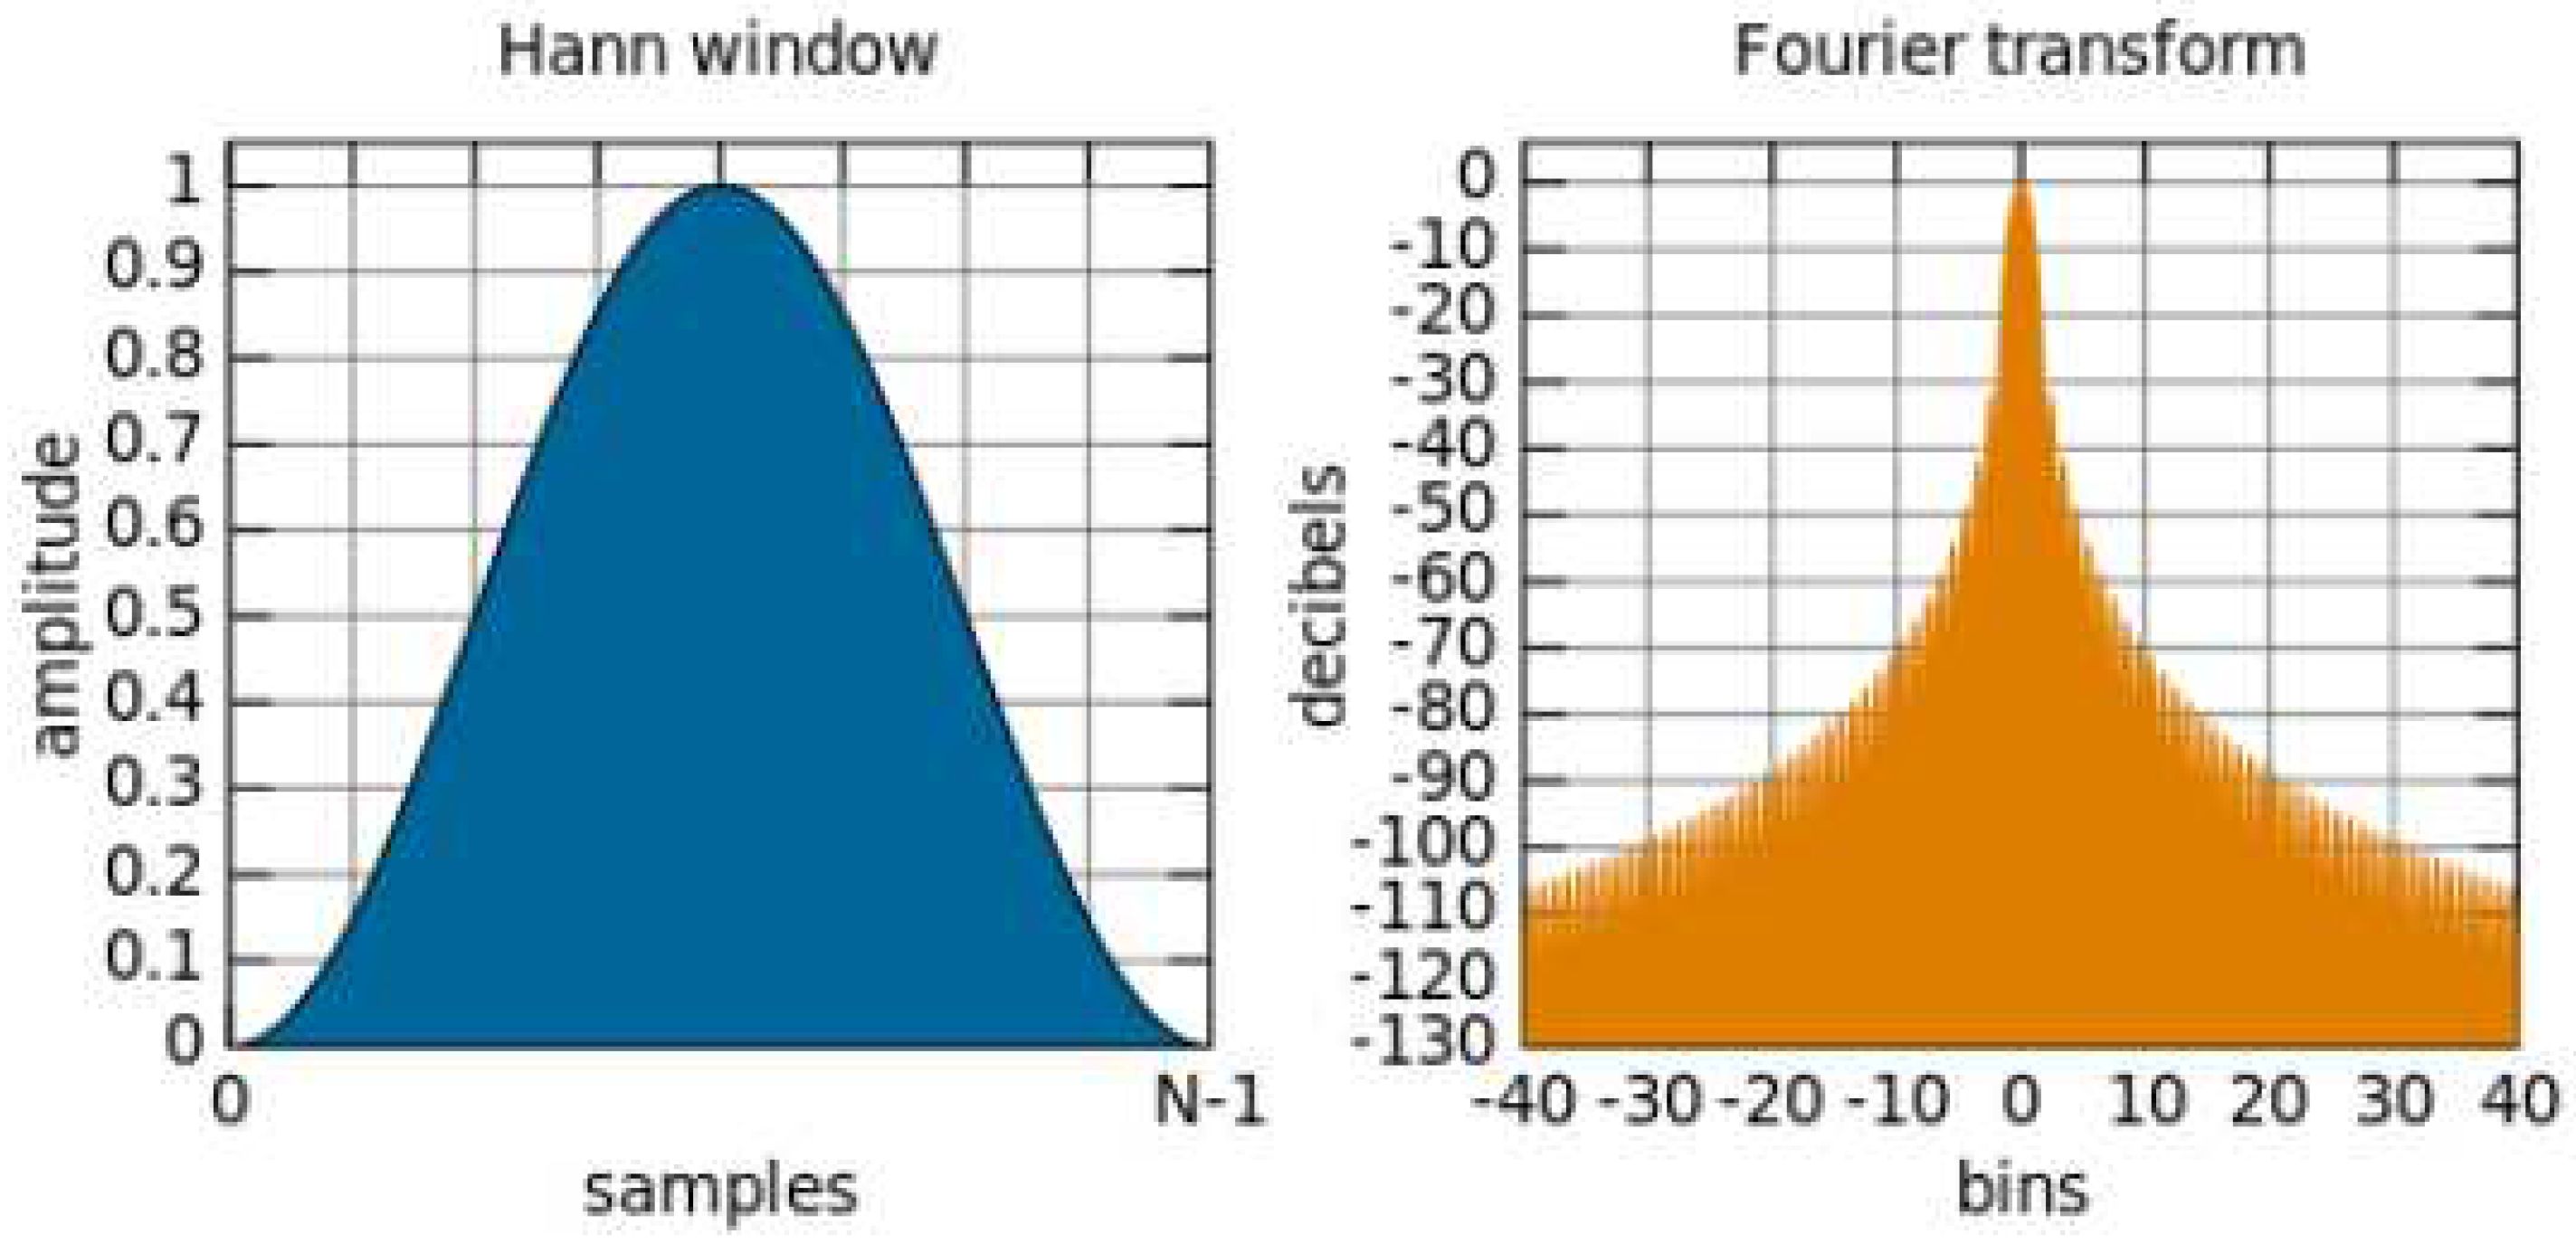
In this manuscript, FFT was utilized in conjunction with the Hanning window method for visualization, as demonstrated in
Figure 8. The Hanning window function, represented as W(t) (eq. 16), was applied to enhance the mitigation of spectral energy leakage. The signal underwent transformation with a sampling rate of 10 Hz, and PSD integration was employed to categorize the signal into three distinct frequency bands: Very Low Frequency (VLF: 0-0.2 Hz), Low Frequency (LF: 0.20-0.75 Hz), and High Frequency (HF: 0.75-3.0 Hz). Each band featured a spectrum estimated by the Hanning window, and the area was computed using the trapezoidal rule. Ultimately, the LF/HF ratio was determined to assess the balance between the sympathetic and parasympathetic nervous systems.
2.6. Detrended Fluctuation Analysis, DFA
In this study, Detrended Fluctuation Analysis (DFA) was utilized to analyze the similarity of waveforms and integrate the trends of non-stationary signals. The DFA algorithm is explained as follows: Given a time series, it can be mapped to a self-similar process through integration or summation (eq. 17). First, a time length 'k' is defined, where 'Δt(i)' represents the i-th time interval, and 'Δt' is the mean time interval. 'y(k)' denotes the local trend. The detrending of the time series is performed using root mean square analysis (eq. 18) with a length of 'n,' resulting in a sequence of local linear trends. This process is repeated iteratively to obtain the Detrended Fluctuation Analysis.
2.7. Normalization
Normalization is the process of organizing data within a database. The normalization process has three main goals: unifying data scales, avoiding numerical overflow, and enhancing algorithm stability. All three of these goals are valuable as they reduce the amount of space consumed by the database and ensure the logical storage of data. In this study, the average RGB values for each color channel within the ROI frame are calculated, and this process is repeated for each frame of the video. Once the video processing is complete, each color channel is saved as a signal and normalized for subsequent algorithm calculations.
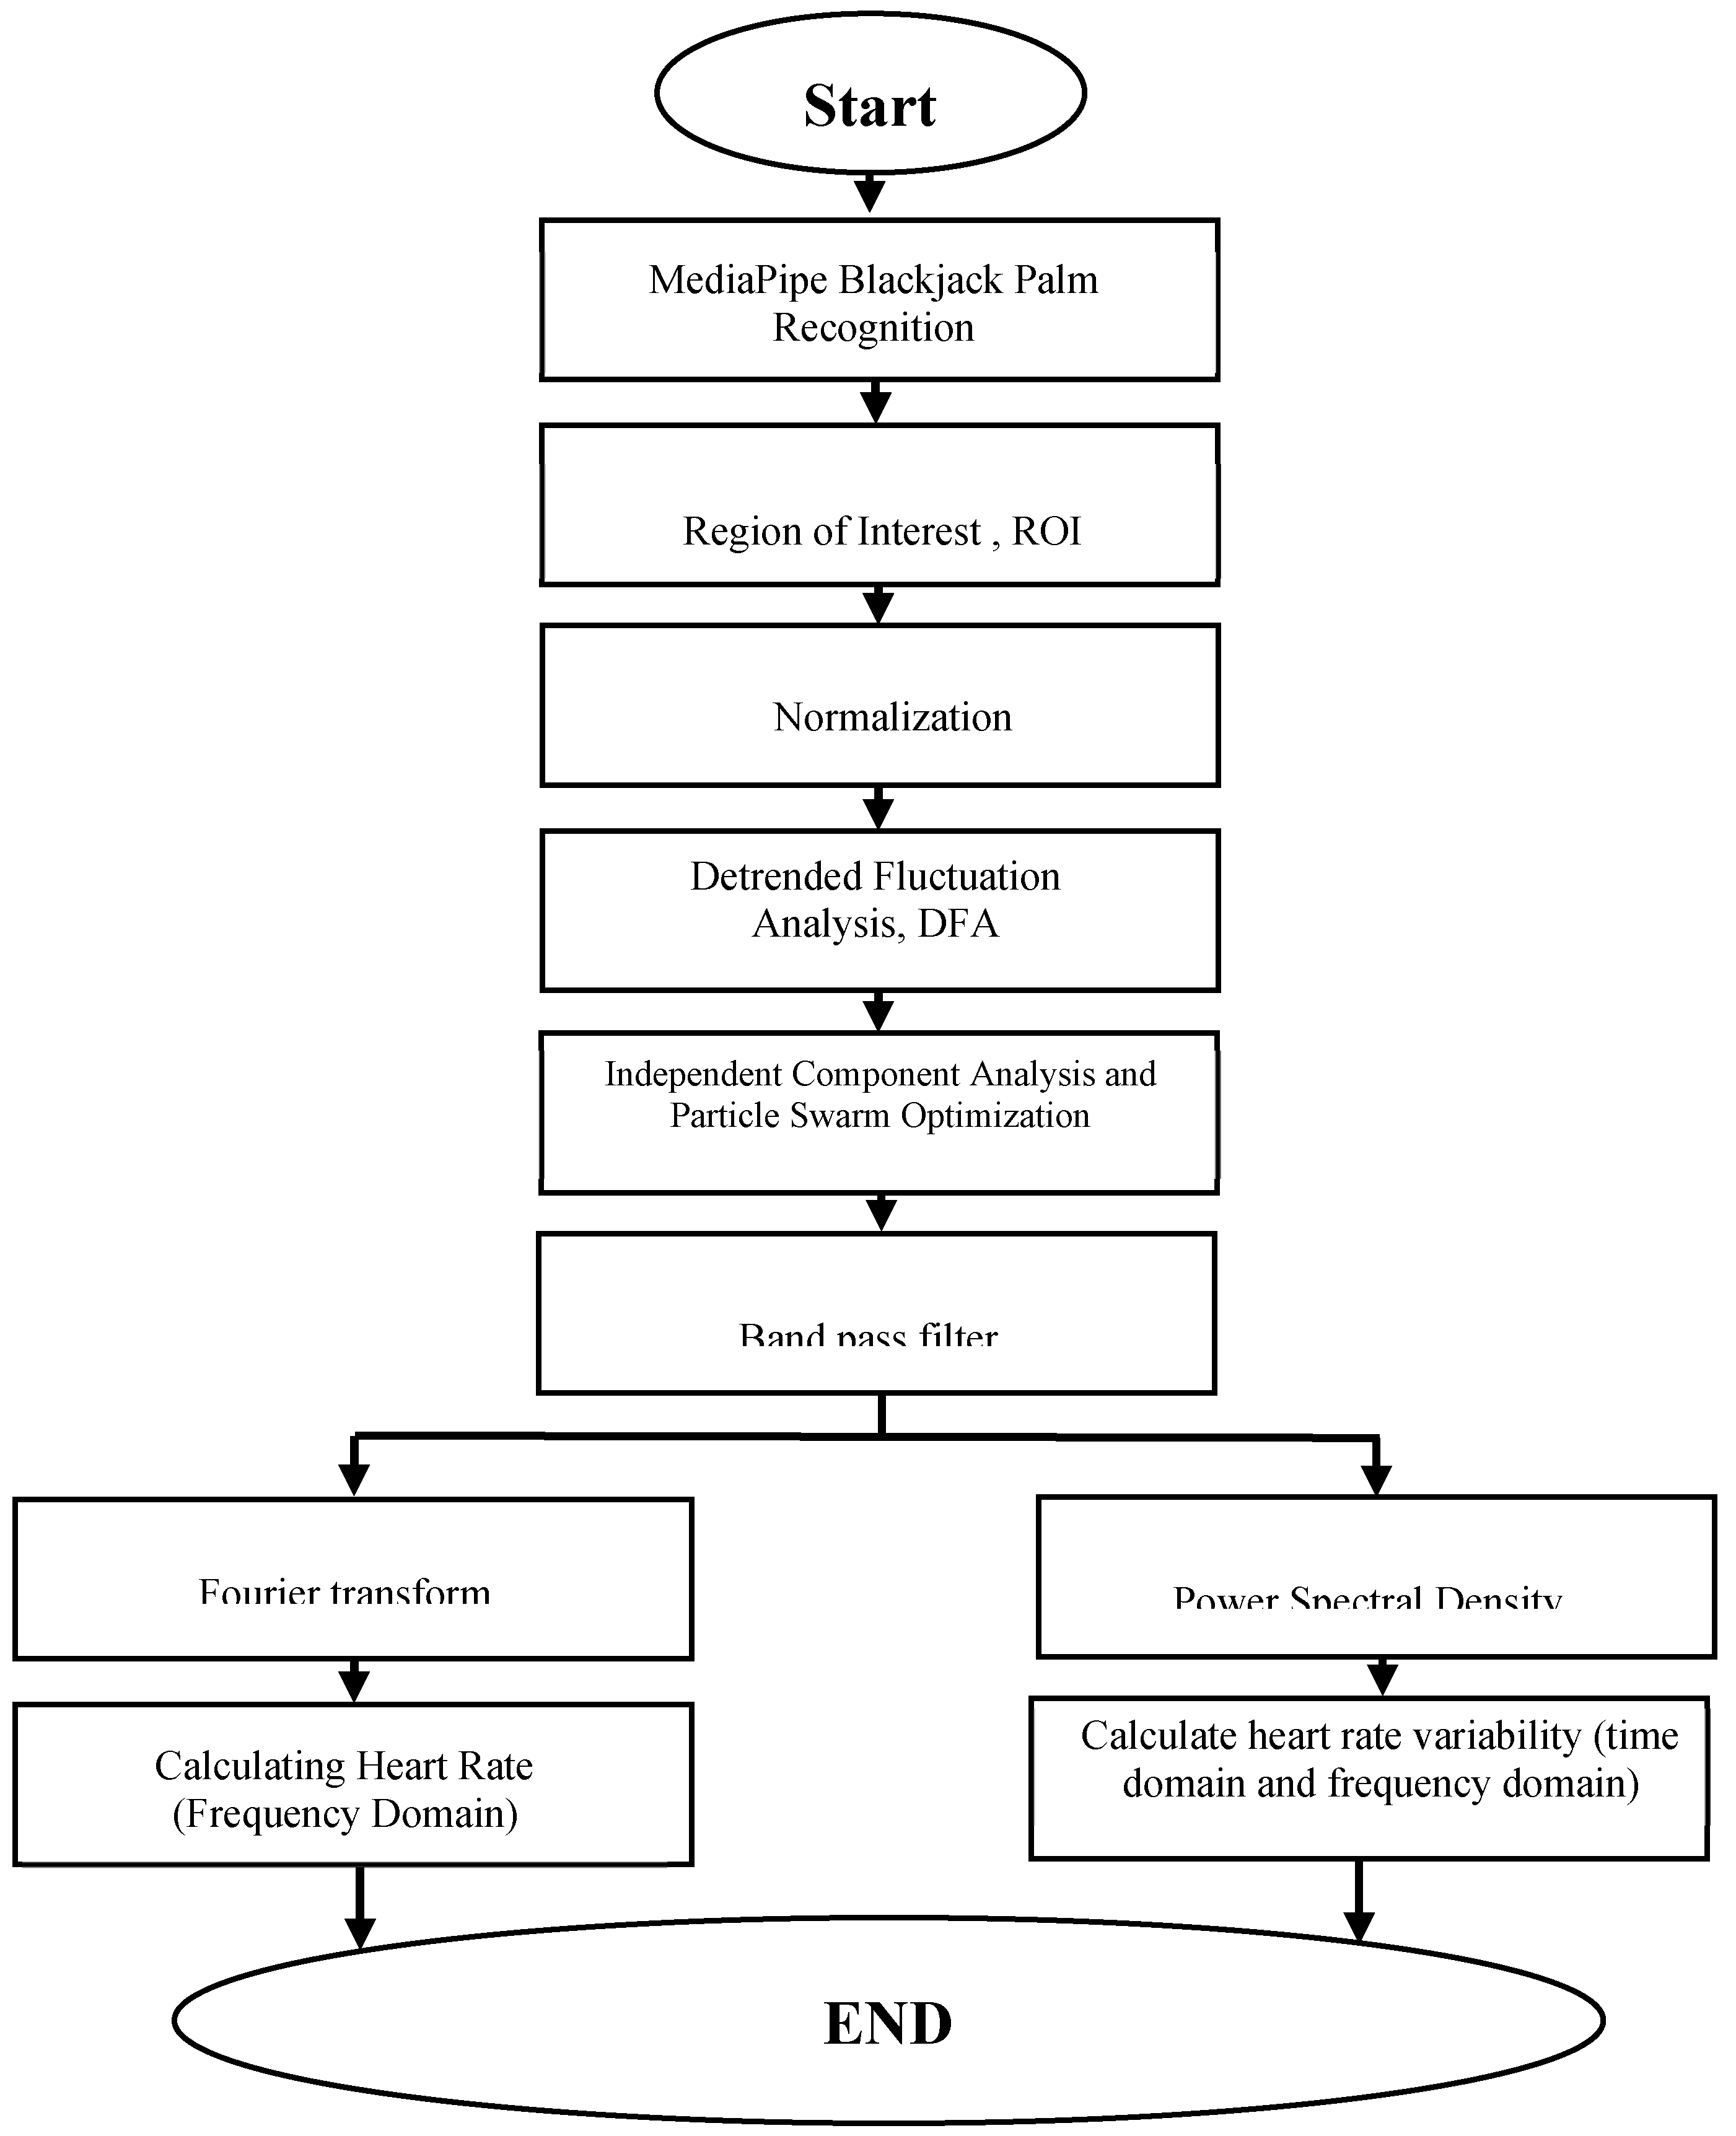
Figure 9 illustrates the workflow of the non-contact physiological signal measurement system developed in this study. The system is primarily divided into four main components: Signal Preprocessing, Waveform Processing, Frequency Domain Transformation, and Physiological Parameter Calculation.
(1) By utilizing the 21-point hand recognition algorithm of MediaPipe to identify hand features, the system confirms the presence of the participant's hand within the captured webcam frame. When this is confirmed, the system displays the image captured by the webcam, with the XY axis delineated by feature points in a region known as the Region of Interest (ROI). The system then performs a segmentation action on the detected area to reduce noise interference in the analyzed images.After capturing the ROI, the system separates the signals into the RGB color channels, specifically extracting the green signal. The system calculates the average of the captured green signal images, accumulating a signal sequence for each measurement, where the vertical axis represents the green signal, and the horizontal axis represents the sequence of data.
(2) The signals were detrended and normalized to adjust signal levels. Independent Component Analysis (ICA) combined with Particle Swarm Optimization (PSO) was employed to eliminate waveform artifacts. Subsequently, bandpass filtering was applied to extract the heart rate and heart rate variability bandwidth.
(3) The waveform filtered by the bandpass filter was subjected to a Fast Fourier Transform (FFT) to convert the time-series of heartbeat signals into the frequency domain. The peak value of the waveform was identified as the output, and Power Spectral Density (PSD) was used to represent heart rate variability in Very Low Frequency (VLF), Low Frequency (LF), and High Frequency (HF) bands.
(4) Finally, the measured physiological signals must be transformed into comprehensible values through various formulas and algorithms.
3. Results
This study recruited a cohort of five male participants within the age range of 20 to 30 years. The dataset was stratified based on several conditions, including varying distances of 15 cm and 50 cm, regions of interest located on the palm, as well as different levels of illuminance: below 200 lux, between 350 and 550 lux, and above 600 lux at a distance of 15 cm. In the subsequent sections, we will systematically present accuracy evaluation metrics, research outcomes, and data analysis specific to each of these experimental conditions. Finally, we will delve into a comprehensive discussion and comparative analysis of the experimental results.
3.1. Metrics
The experimental purpose of this study is to serve as an auxiliary diagnostic tool, and the ultimate determination relies on pathological reports and professional medical expertise. Therefore, this research employs Root Mean Square Error (RMSE), Mean Absolute Percentage Error (MAPE), and the coefficient of determination (R-squared, R²) as accuracy assessment metrics, as calculated in equations (19),(20), and (21), respectively. By observing these three metrics, the accuracy of the system can be assessed.
where
is the actual value of the
sample,
is the measured value of the
sample,
n is the total number of test samples, and
is the mean of n test samples.
3.2. Distance
In order to analyze the accuracy of the system and the impact of ambient light on the system, this study conducted actual tests on 5 people and compared the calculation errors of heart rate and heart rate variability measured by the system and the instrument. Due to the limited number of measurements in this study, the performance of the two measurement distances is summarized in
Table 1. The better experimental value is obtained at 15 cm.
3.3. Illumination
The experimental method in this study relies on the principle of light reflection. Therefore, the intensity of light indirectly affects the numerical values obtained in the experiments. The following analysis is primarily intended to test the system's performance under various lighting conditions, with lighting levels categorized as follows: below 200 lux, between 350 and 550 lux, and above 600 lux. The palm region was used for measurements at a distance of 15 centimeters. The measured heart rate represents the system's performance under varying lighting conditions, and the associated errors are summarized in
Table 2. As shown in
Table 2, it is evident that measurements performed under an illumination level of 350-550 lux yield superior results. In contrast, measurements conducted in extreme lighting conditions, such as complete darkness or with desk lamp supplementation, exhibited higher errors, likely due to artificially induced environmental factors. Consequently, it can be deduced that the optimal conditions for this study involve an illumination level between 350-550 lux, a measurement distance of 15 centimeters, and the palm region as the area of interest Heart Rate.
3.4. Measurement time
That using the palm as the region of interest (ROI) results in shorter computation times compared to using the forehead. This is attributed to the reduced interference caused by hair, making images of hairless skin more advantageous in acquiring rPPG signals. The total time required for measuring physiological parameters on the palm and forehead is 8 seconds and 10 seconds, respectively, resulting in approximately 2 seconds of time savings.
3.5. Comparisons for Forehead images and Palm images
The Comparisons, Heart Rate, SDNN, LF and HF for forehead images and palm images. With distance 15 cm and illumination 350-550 lumens are listed in
Table 3.
4. Discussion
This study has improved the algorithm method in several aspects, as demonstrated in
Table 4.
Table 4 provides a comparison between the algorithm method for physiological signal extraction in this study and the approaches presented in prior works by Su [
14], Lin [
10] and Zhang [
9]. This research optimized four key components:
(1) By employing detrended fluctuation analysis to adjust the waveform baseline, this algorithm enhancement has the potential to improve the accuracy of heart rate and heart rate variability measurements.
(2) This study introduces PSO-ICA to significantly reduce system computation time and address the issue of ICA iteratively converging to local optima under poor initial conditions.
(3) Testing the palm as a region of interest confirmed that palm image captures improved measurement accuracy and reduced the heart rate error to 1.5%, which was smaller than measurements performed at other parts of the body in previous studies.
(4) The optimal measurement distance in this study is 15 centimeters, and the preferred illuminance falls within the range of 350-550 lumens.
(4) While most physiological parameter measurements in the market are currently performed using contact-based methods with optical volume signal description, often coupled with electrocardiography, ultrasound sensors, or piezoelectric sensors, recent research literature has explored non-contact measurements in terms of performance and accuracy as shown in
Table 5. In this study, using the palm as the region of interest yielded higher results compared to measurements using the forehead as the measurement area. The heart rate measurements proposed in this study were validated using a device approved by the Taiwan Department of Health, with a MAPE of 2%.
5. Conclusions
This study implements a low-cost system combining ICA with PSO for instantaneous heart rate and heart rate variability estimation based on palm imaging. The palm image measurement method is used to replace the forehead image measurement method. In addition to avoiding the interference of hair on measurement, shorter measurement time and more accurate physiological parameters, namely RMSE and MAPE, can also be obtained. The result of this research is to help medical professionals quickly make appropriate diagnoses based on current patient data. The new proposed method can effectively not only avoid infection concerns but also obtain Heart Rate and HRV quickly and conveniently. At same time this study provides higher accuracy for physiological parameters, root mean square error (RMSE, 2.00 bpm), mean absolute percentage error (MAPE, 1.5%), and Measure time (8s), compared to those in recently published papers. Future research will integrate computer vision and deep learning to investigate the measurement of relevant physiological signals.
References
- Trimmel, M. Relationship of Heart Rate Variability (HRV) Parameters Including pNNxx With the Subjective Experience of Stress, Depression, Well-Being, and EveryDay Trait Moods (TRIM-T): A Pilot Study. The Ergonomics Open Journal 2015, 8, 32–37. [Google Scholar] [CrossRef]
- Liao, D.; Cai, J.; Brancati, F.L.; Folsom, A.; Barnes, R.W.; Tyroler, H.A.; Heiss, G. Association of vagal tone with serum insulin, glucose, and diabetes mellitus The ARIC Study. Diabetes Res. Clin. Pract. 1995, 30, 211–221. [Google Scholar] [CrossRef] [PubMed]
- Duanping, L.; Mercedes, C.; Gregory, W.E.; Wayne, E.C.; Gerardo, H. Lower heart rate variability is associated with the development of coronary heart disease in individuals with diabetes: The atherosclerosis risk in communities (ARIC) study. Diabetes 2002, 51, 3524–3531. [Google Scholar] [CrossRef]
- Allen, J.; Overbeck, K.; Stansby, G.; Murray, A. Photoplethysmography assessments in cardiovascular disease. Meas. Control. 2006, 39, 80–83. [Google Scholar] [CrossRef]
- Mannapperuma, K.; Holton, B.D.; Lesniewski, P.J.; Thomas, J.C. Performance limits of ICA-based heart rate identification techniques in imaging photoplethysmography. Physiol. Meas. 2015, 36, 67–83. [Google Scholar] [CrossRef] [PubMed]
- Wang, W.; den Brinker, A.C.; Stuijk, S.; de Haan, G. Algorithmic Principles of Remote PPG. IEEE Trans. Biomed. Eng. 2017, 64, 1479–1491. [Google Scholar] [CrossRef] [PubMed]
- Wang, C.; Pun, T.; Chanel, G. A Comparative Survey of Methods for Remote Heart Rate Detection from Frontal Face Videos. Front. Bioeng. Biotechnol. 2018, 6, 33. [Google Scholar] [CrossRef] [PubMed]
- Zhang, B.; Li, H.; Xu, L.; Lin, Q.; Yao, Y.; Greenwald, S.E. Noncontact Heart Rate Measurement Using a Webcam, Based on Joint Blind Source Separation and a Skin Reflection Model: For a Wide Range of Imaging Conditions. Journal of Sensors 2021, 2021, 18. [Google Scholar] [CrossRef]
- Qi, L.; Yu, H.; Xu, L.; Mpanda, R.; Greenwald, S.E. Robust heart-rate estimation from facial videos using Project_ICA. Physiol Meas 2019, 40(8), 085007. [Google Scholar] [CrossRef] [PubMed]
- Burton, T.; Saiko, G.; Cao, M.; Douplik, A. Remote photoplesymography unmasks glabrous skin temporal lead over non-glabrous. In Proceedings of the 2022 IEEE Photonics Conference (IPC), Vancouver, BC, Canada, 2022; pp. 1–2. [Google Scholar] [CrossRef]
- Unursaikhan, B.; Tanaka, N.; Sun, G.; Watanabe, S.; Yoshii, M.; Funahashi, K.; Sekimoto, F.; Hayashibara, F.; Yoshizawa, Y.; Choimaa, L.; Matsui, T. Development of a Novel Web Camera Based Contact Free Major Depressive Disorder Screening System Using Autonomic Nervous Responses Induced by a Mental Task and Its Clinical Application. Applied Sciences 2021, 10(5), 1650. [Google Scholar] [CrossRef] [PubMed]
- Al Fahoum, A.S.; Abu Al Haija, A.O.; Alshraideh, H.A. Identification of Coronary Artery Diseases Using Photoplethysmography Signals and Practical Feature Selection Process. Bioengineering 2023, 10, 249. [Google Scholar] [CrossRef] [PubMed]
- Su, T.J.; Hung, Y.C.; Pan, T.S.; Lin, W.H.; Wang, S.M.; Lee, Y.C. Estimation of Heart Rate and Heart Rate Variability with Real-Time Images Based on Independent Component Analysis and Particle Swarm Optimization. Appl. Sci. 2023, 13, 7605. [Google Scholar] [CrossRef]
- Herault, J.; Jutten, C. Space or time adaptive signal processing by neural network models. In Neural Networks for Computing; AIP Publishing: College Park, MD, USA, 1986; pp. 206–211. [Google Scholar] [CrossRef]
- Poli, R.; Kennedy, J.; Blackwell, T. Particle swarm optimization. Swarm Intell 2007, 1, 33–57. [Google Scholar] [CrossRef]
- C. Lugaresi et al., “MediaPipe: A Framework for Building Perception Pipelines”, [Online]. 2019. Available online: http://arxiv.org/abs/1906.08172.
- Grishchenko, V. Bazarevsky, MediaPipe holistic—simultaneous face, hand and pose prediction, on device. Google AI Blog, Google, 10 Dec 2020.
- Kemp, A.H.; Quintana, D.S.; Gray, M.A.; Felmingham, K.L.; BroWn, K.; Gatt, J.M. Impact of depression and antidepressant treatment on heart rate variability: a review and meta-analysis. Biological Psychiatry 2010, 67(11), 74-1067. [Google Scholar] [CrossRef] [PubMed]
- Kaufmann, T.; Sütterlin, S.; Schulz, S.M.; Vögele, C. ARTiiFACT: a tool for heart rate artifact processing and heart rate variability analysis. Behav Res Methods 2011, 43, 1161–1170. [Google Scholar] [CrossRef] [PubMed]
- Tarvainen, M.P.; Niskanen, J.P.; Lipponen, J.A.; Ranta-ahoa, P.O.; Karjalainen, P.A. Kubios HRV–Heart rate variability analysis softWare. Comput Methods Programs Biomed 2014, 113, 210–220. [Google Scholar] [CrossRef] [PubMed]
- Köhler, B.U.; Hennig, C.; Orglmeister, R. The Principles of SoftWare QRS Detection-RevieWing and Comparing Algorithms for Detecting this Important ECG Waveform. IEEE Eng. Med. Biol. 2002, 21, 42–57. [Google Scholar] [CrossRef]
- Ranjan, R.; Bansal, A.; Zheng, J.; Xu, H.; Gleason, J.; Lu, B.; Nanduri, A.; Chen, J.C.; Castillo, C.D.; Chellappa, R. A Fast and Accurate System for Face Detection, Identification, and Verification. IEEE Transactions on Biometrics 2019, 1(2), 82–96. [Google Scholar] [CrossRef]
- Liu, X.; Wei, W.; Kuang, H.; Ma, X. Heart Rate Measurement Based on 3D Central Difference Convolution With Attention Mechanism. Remote Sensing 2022, 22(2), 688. [Google Scholar] [CrossRef]
|
Disclaimer/Publisher’s Note: The statements, opinions and data contained in all publications are solely those of the individual author(s) and contributor(s) and not of MDPI and/or the editor(s). MDPI and/or the editor(s) disclaim responsibility for any injury to people or property resulting from any ideas, methods, instructions or products referred to in the content. |
© 2024 by the authors. Licensee MDPI, Basel, Switzerland. This article is an open access article distributed under the terms and conditions of the Creative Commons Attribution (CC BY) license (http://creativecommons.org/licenses/by/4.0/).

