3.2.3. Analysis of Model Test Results
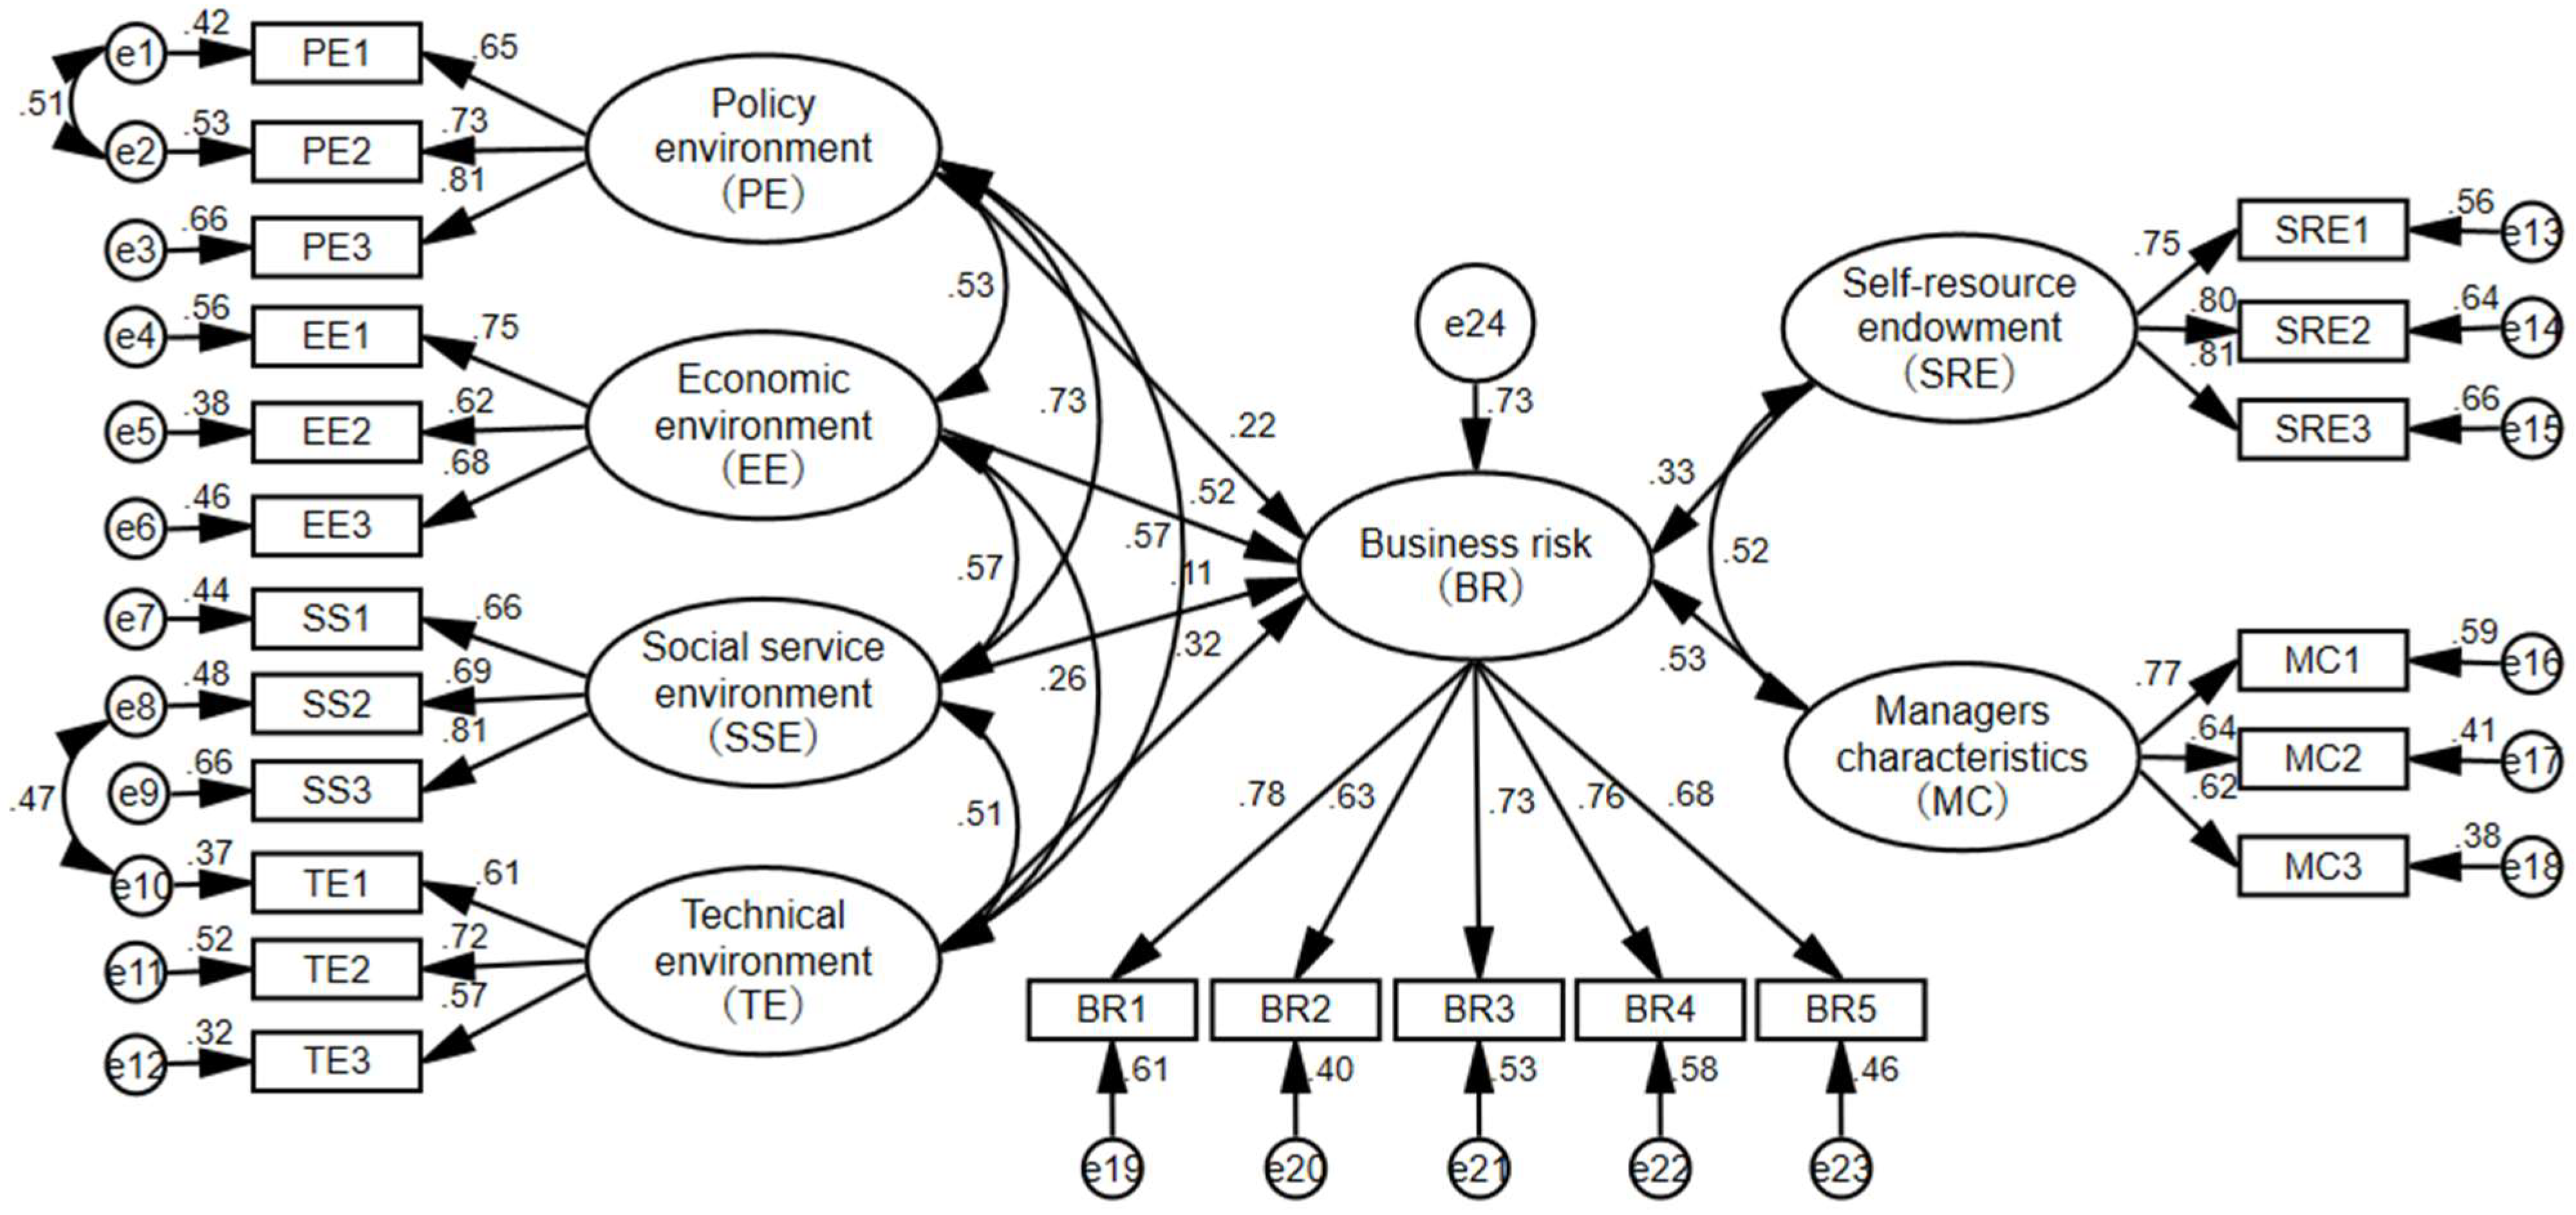
The main function of structural equation models is to reveal the structural relationships among latent variables and relationship between latent variables and observed variables through path coefficients and load coefficients of the theoretical model constructed. The final revised model and calculation results are shown in
Figure 3 and
Table 7.
According to
Figure 3 and
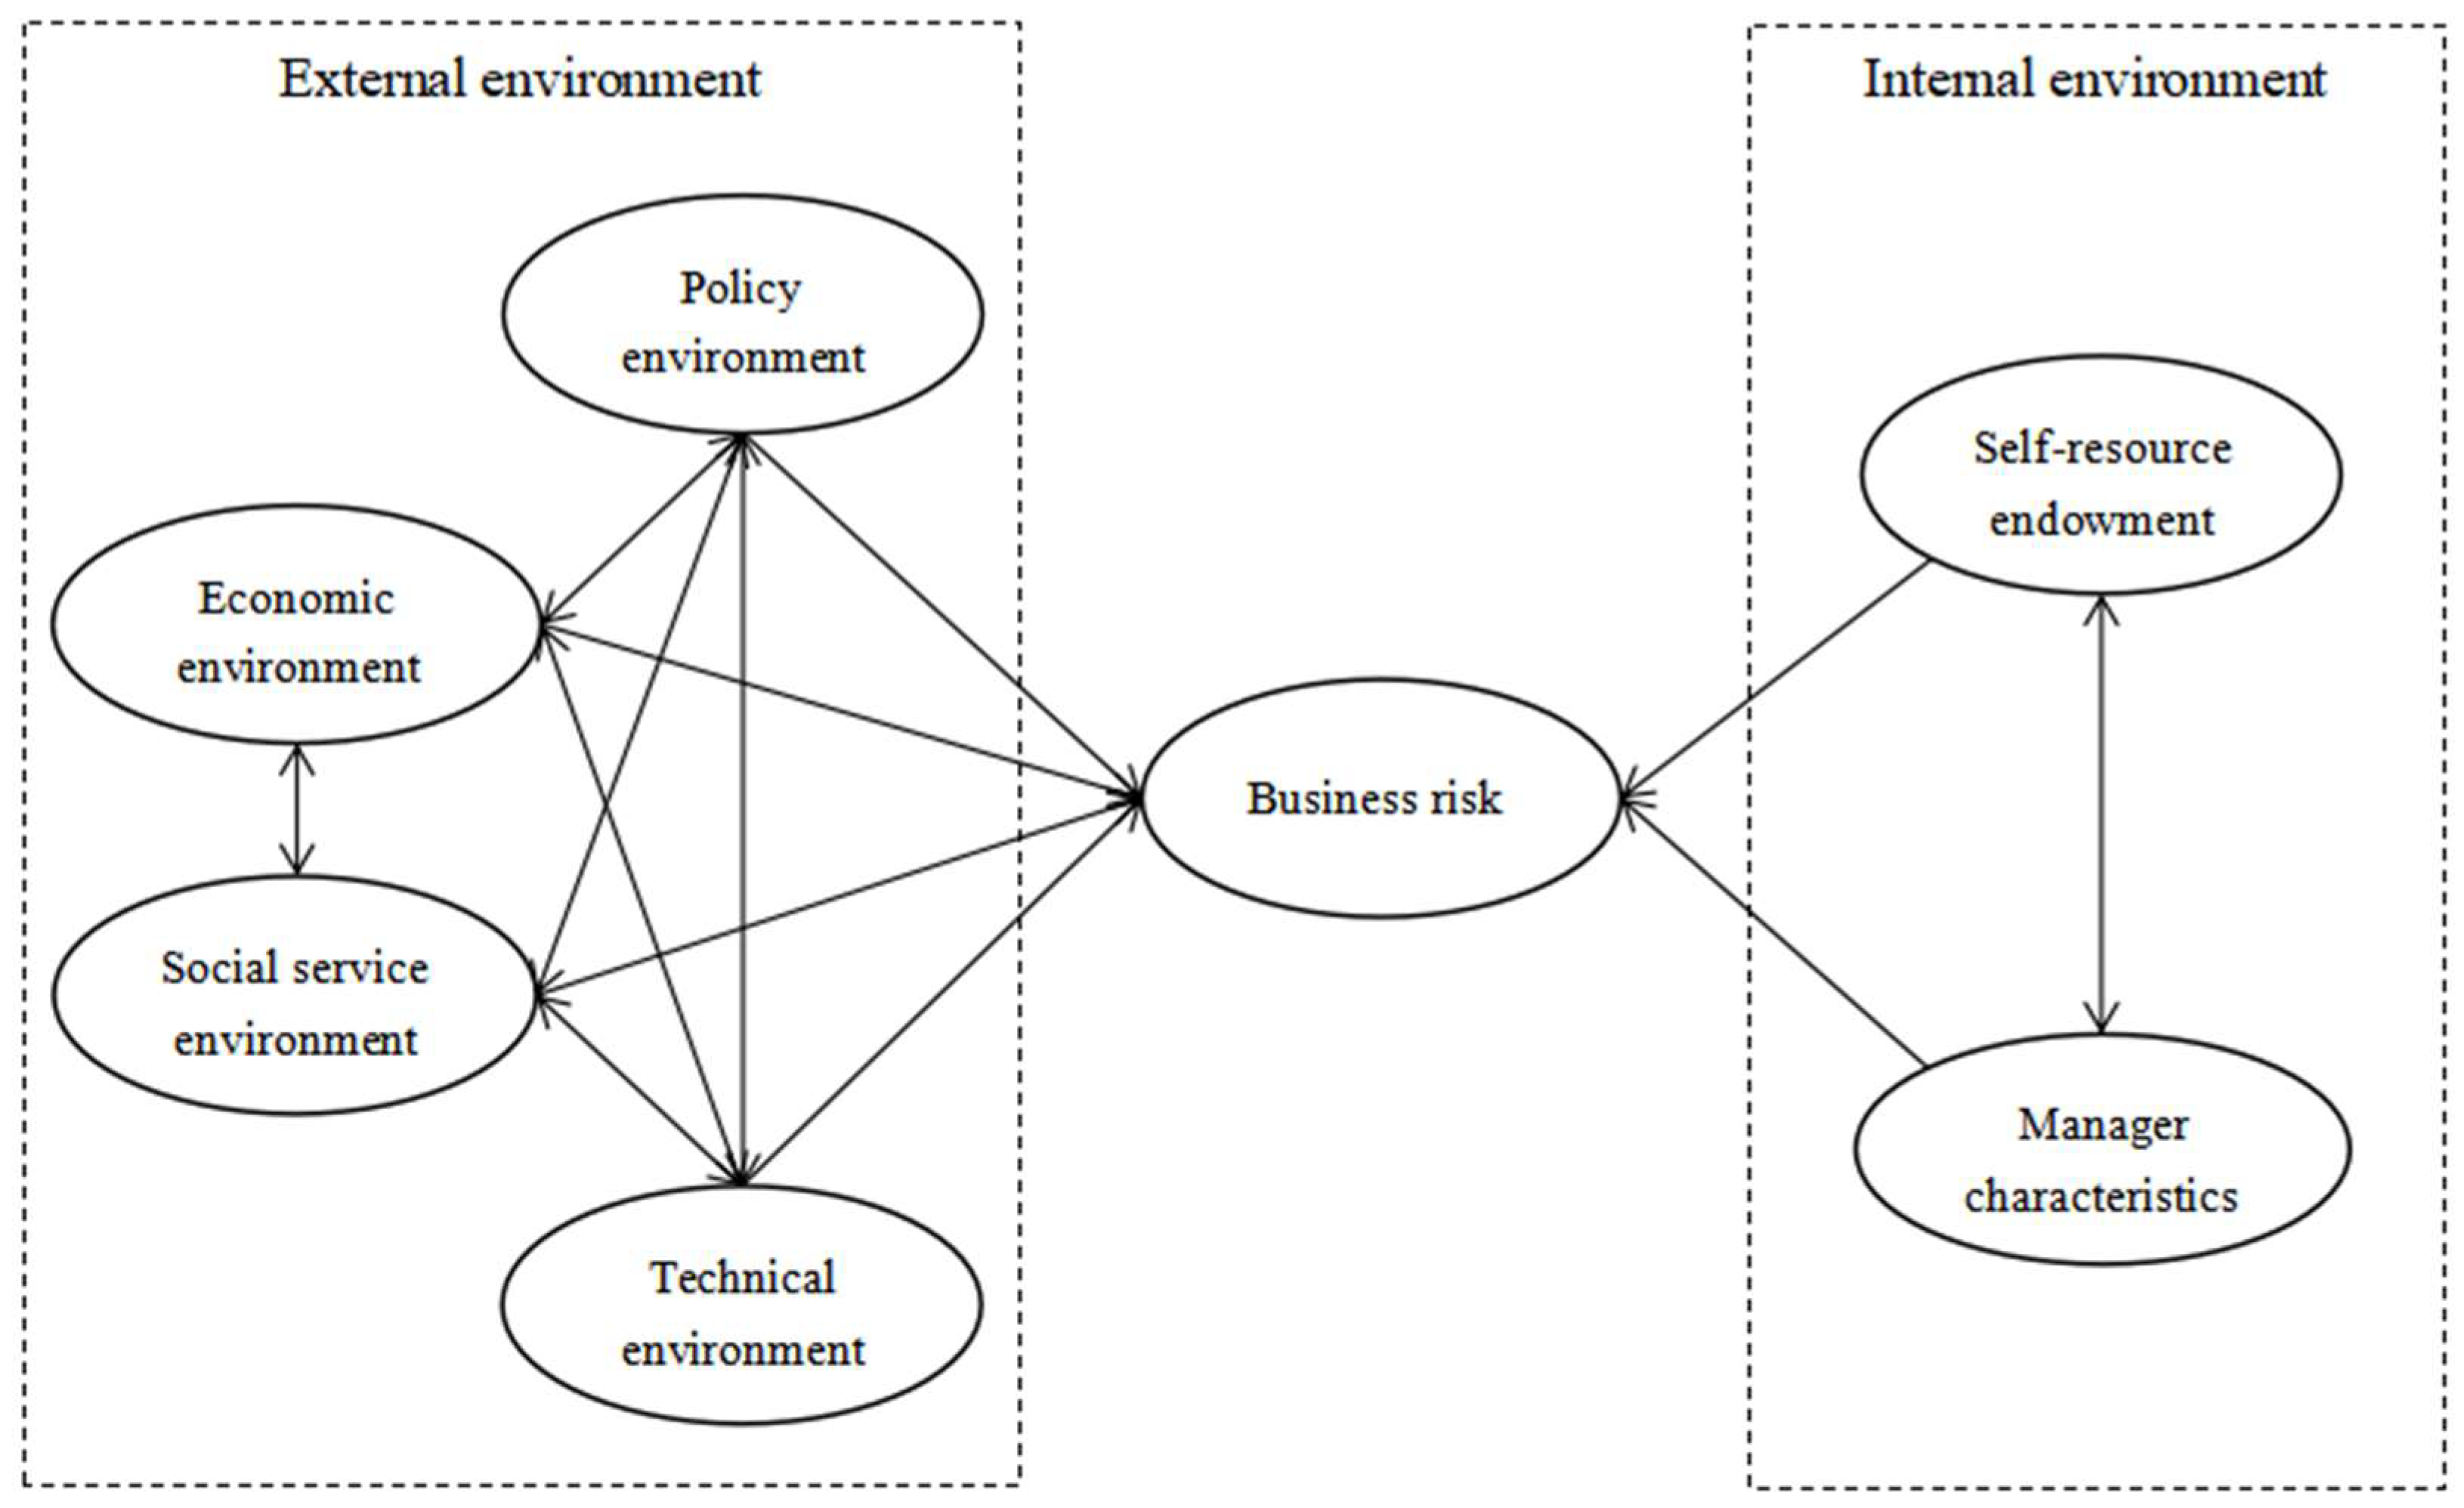
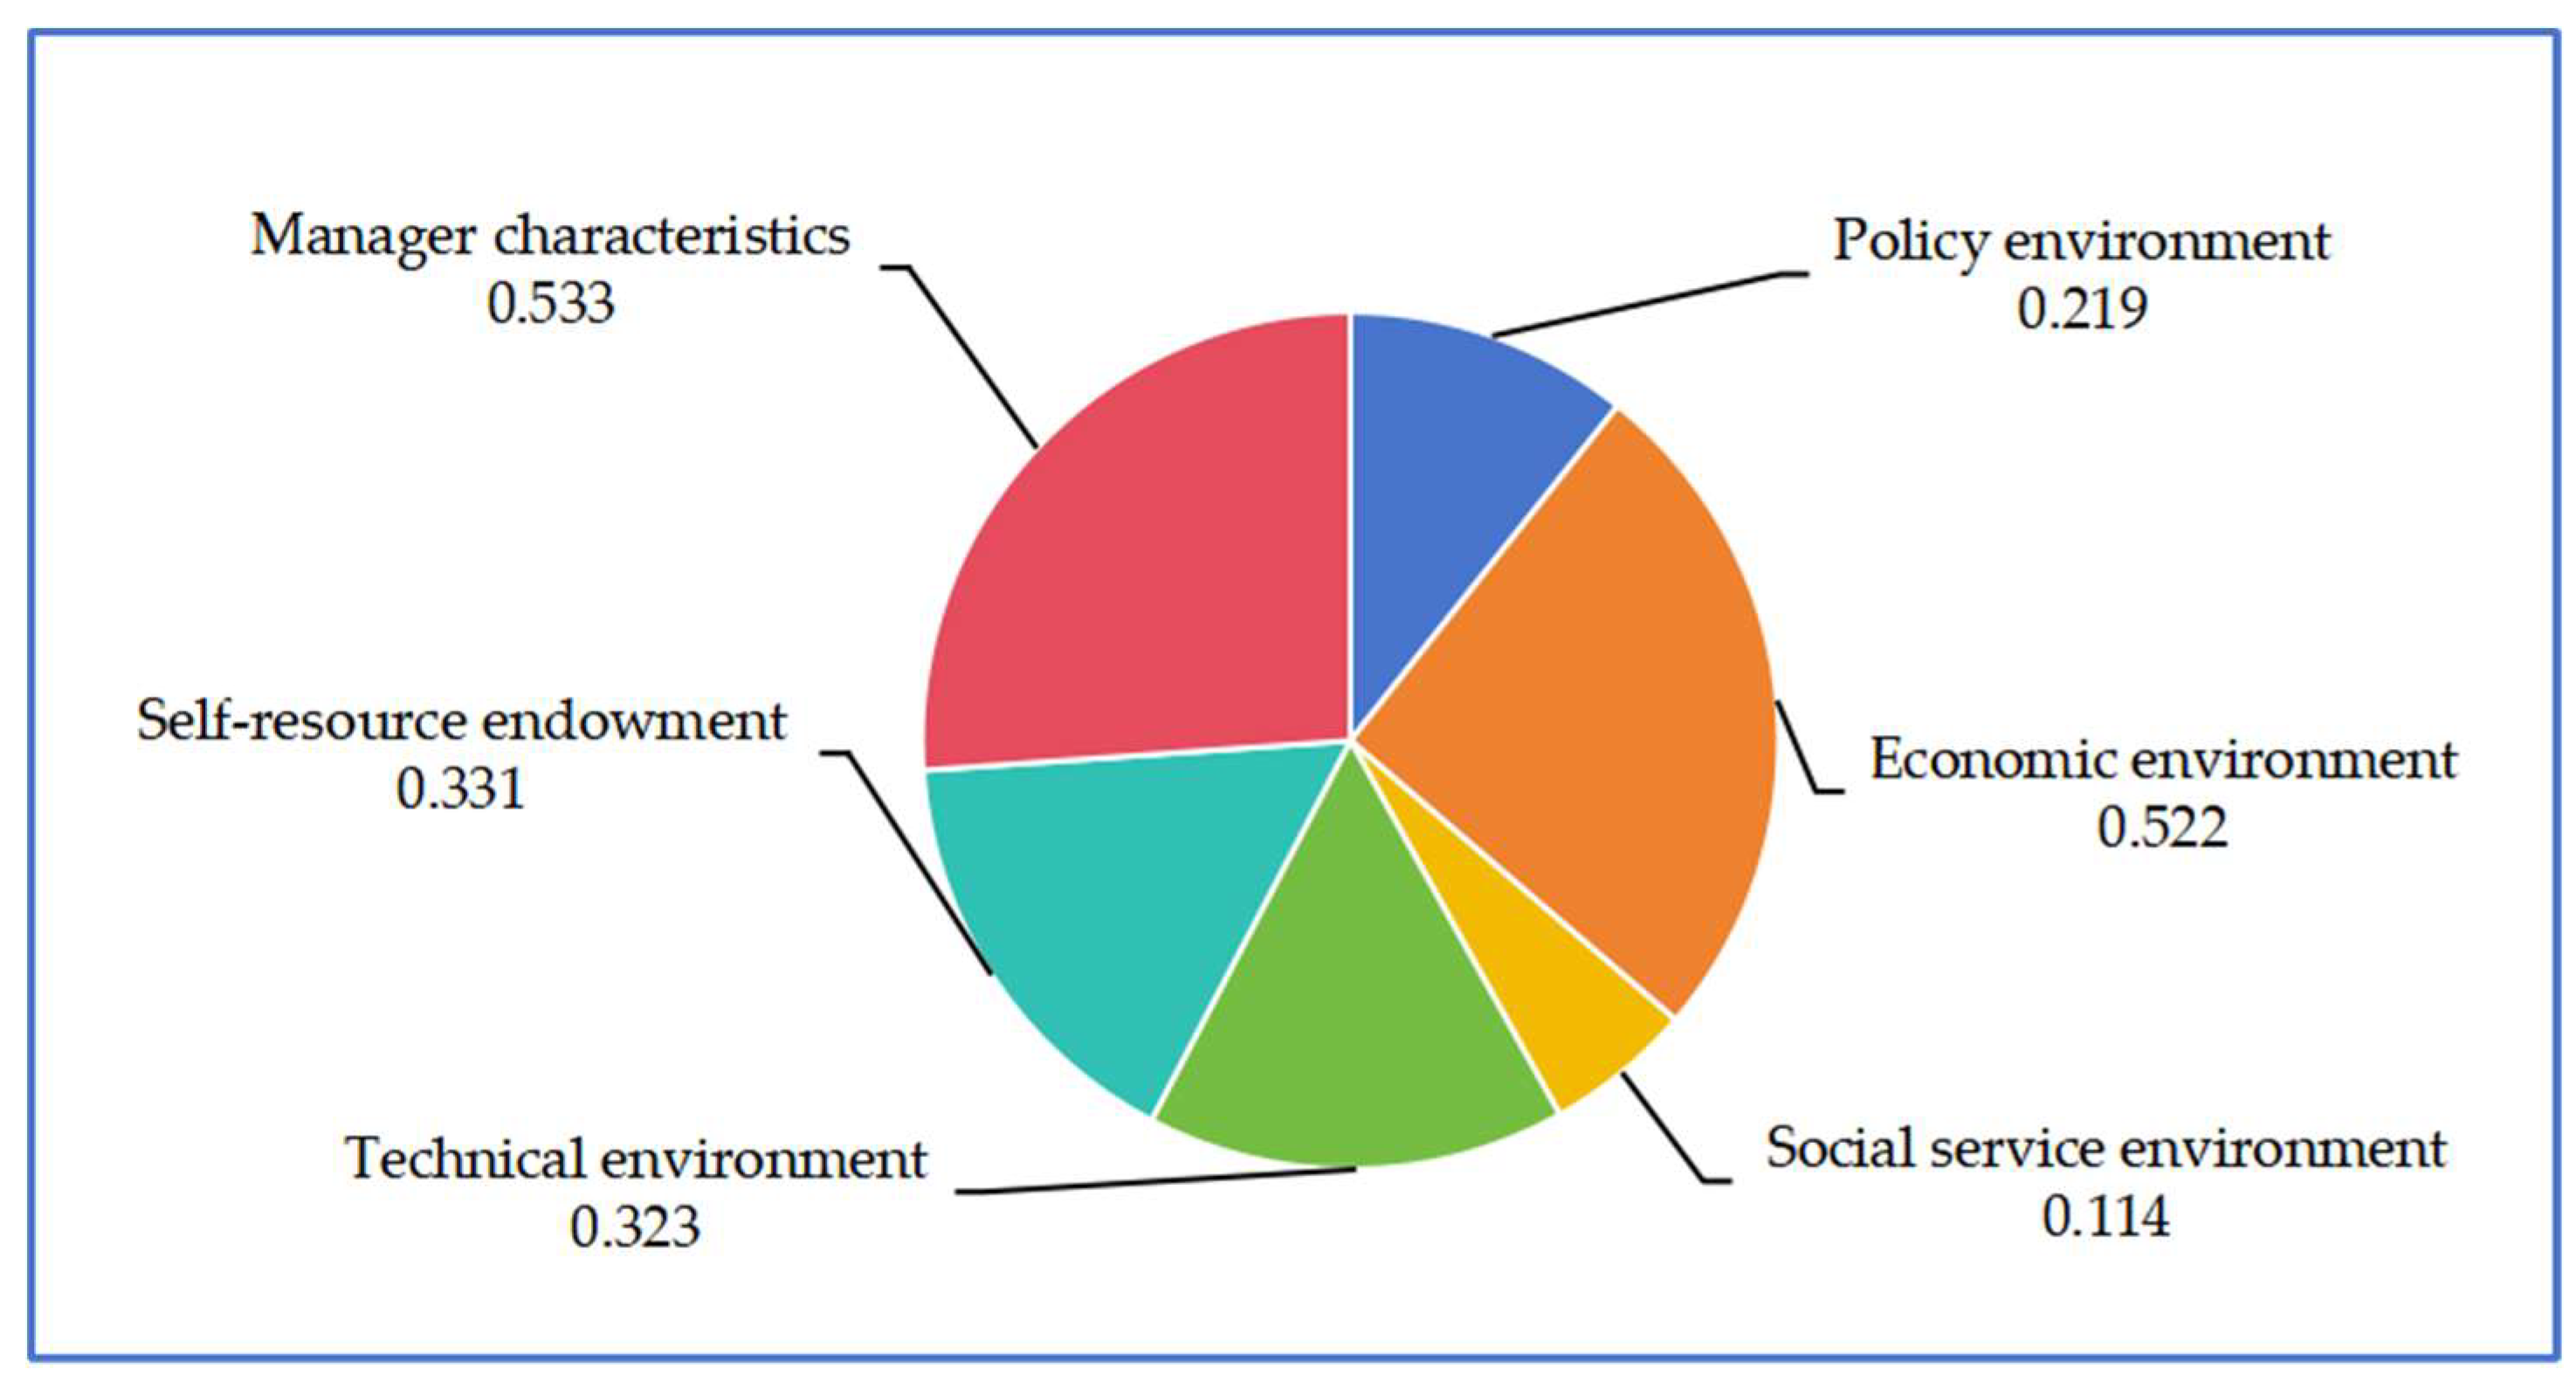
Table 7, the six latent variables of policy environment, economic environment, social service environment, technical environment, self-resource endowment, and manager characteristics have all passed the significance test, and their standardized path coefficients are 0.219, 0.522, 0.114, 0.323, 0.331, and 0.533, respectively, verifying the hypothesis H1-H6. From the perspective of influential effect, the influencing values of each influence factor on business risk are shown in
Figure 4. Among them, the economic environment and manager characteristics have strong influential effect, the technical environment and self-resource endowment have moderate influential effect, and the policy environment and social service environment have relatively weak influential effects on the business risk of plantation-based farmer cooperatives.
According to the fit results of the modified model, the latent variable of "Policy environment" has significant positive impact on the business risk of plantation-based farmer cooperatives. The standardized path load is 0.219, and hypothesis H1 can be verified. Firstly, government subsidies can not only provide direct financial support to cooperatives, but also attract investment from industrial and commercial capital [
57], thus promoting the development of cooperatives and reducing business risk. Secondly, the more support from the government and more practical implementation of resource factors, financial credit, fiscal and tax systems, the more direct and indirect benefits cooperatives can receive. Presuming other market conditions are the same, cooperatives that enjoy their policy advantages will have a significant comparative advantage and competitiveness in market competition, thereby reducing their business risk. Thirdly, moderate scale operation is an important way to improve agricultural efficiency and increase income, and it is also the main form of operation for plantation-based farmer cooperatives. Land transfer is the key to promoting moderate scale operation [
58]. Therefore, a proactive land transfer policy will promote the development of plantation-based farmer cooperatives. The more convenient the land transfer is, the lower the cost of factors paid by the cooperatives, and the easier it is to form moderate scale operation. In this way, the resistance to the development of cooperatives will become smaller and the business risk will reduce.
The “Economic environment” has significant positive impact on business risks of plantation-based farmer cooperatives. The standardized path load is 0.522 and hypothesis H2 is verified. Firstly, plantation-based farmer cooperative is the supplier in the produce market, and the produce price has a significant impact on cooperatives’ planting willingness and behavior choices. From the perspective of producers, the higher the product price, the stronger the enthusiasm of producers. When other conditions are the same and the production costs are equal, producers are more willing to produce agricultural products with higher prices to obtain greater profits; At the same time, reasonable and stable prices are the foundation for ensuring sustainable economy and market stability, and are also the key to the sound development of plantation-based farmer cooperatives. The instability of produce prices due to disrupted market and economic uncertainty will to some extent exacerbate the business risk of plantation-based farmer cooperatives. Secondly, in terms of financial supply, diverse financing channels, convenient credit processes, and diverse guarantee methods can promote the improvement of the cooperative's financing environment. The better the financing environment is, the less financial pressure the cooperatives will have, thereby reducing business risks. Thirdly, a stable and sustainable supply and marketing channel can reduce the transaction costs of produce and means of production; At the same time, a stable supply and marketing channel usually guarantees the stability of product prices through formal or informal contracts, reducing the uncertainty of product sales and thus reducing transaction risks. Therefore, the more favorable the economic environment, the lower the business risk of plantation-based farmer cooperatives.
The “Social service environment” has significant positive impact on the business risk of plantation-based farmer cooperatives. The standardized path load is 0.114 and hypothesis H3 is verified. Firstly, the more outsourcing in agricultural production processes, the more advanced the business philosophy of managers. Such managers are inclined to innovate business models, and therefore enjoy lower management risk; On the other hand, by outsourcing agricultural production, professional technologies required in corresponding process will be provided by outsourcing service provider, which evades losses due to lack of professional techniques of cooperative itself, thus reducing technical risks. Secondly, the higher the frequency of agricultural machinery leasing, the higher the level of mechanization and the degree of large-scale operation of the cooperative. In this way, cooperatives will have better economies of scale, more economic benefits, become more table in operation, and thus reduce business risk. In addition, the more complete the logistics system of agricultural products is, the more modern the facilities in storage, transportation, preservation, packaging, and other links are, which reduces the losses in these processes and improves efficiency. Value of commodities of produce will be increased, market realization will be improved, and cooperatives will enjoy more benefits and a more sound development with lower business risks.
The “Technical environment” has significant positive impact on business risks of plantation-based farmer cooperatives. The standardized path load is 0.323 and hypothesis H4 is verified. Firstly, the deep promotion and application of modern agricultural technology have lifted farmers from the passive situation of relying on natural conditions solely in agriculture. By dispatching technical talents and fostering new agricultural group leaders, agricultural science and technology are introduced into agricultural production. Modern agricultural science and technology are used in a standardized and reasonable manner, thereby reducing the technical risk in cooperative operation. Secondly, the adaptability of agricultural technology to the operational needs of cooperatives determines the degree to which cooperatives adopt this technology. The higher the adaptability, the more active the cooperatives are in using this technology, Conversely, cooperatives may consider abandoning the use of this technology (use of technology has certain cost as well). Finally, agricultural technical talents are the main force in promoting the transformation and application of agricultural scientific and technological achievements. The technical guidance and application they provide improved the technical efficiency of cooperative production. From this perspective, the more abundant the resources of agricultural technical talents are, the higher the production efficiency of plant-based farmer cooperatives will become, thus generating a more table technical environment and reducing business risk.
The “Self-resource endowment” has significant positive impact on business risks of plantation-based farmer cooperatives. The standardized path load is 0.331 and hypothesis H5 is verified. Firstly, large-scale operation can improve land use efficiency and increase income. The large scale of land operation indicates that the cooperative has strong profitability, sound development, and strong ability to respond to business risks. Secondly, the longer the operation period of a cooperative is, the more stable its development is. It represents the cooperative has more experience in responding to and prevent various risks is more capable to bear risk. Finally, industrial organization can provide continuous supplementation of industrial components such as means of production and labor, enabling cooperatives to achieve high spillover effects in terms of economic benefits; At the same time, industrial organization can improve the efficiency of agricultural product circulation and reduce circulation costs, promote communication and cooperation between cooperatives and other business entities, and establish a stable and win-win supply and marketing relationship between cooperatives and other business entities. In this way, stable supply sources of agricultural materials required for cooperative production and stable marketing channels for produce sales will be ensured, thus reducing the business risk of plantation-based farmer cooperatives.
The “Manager characteristics” has significant positive impact on the business risk of plantation-based farmer cooperatives. The standardized path load is 0.533 and hypothesis H6. Firstly, young managers have a strong ability to learn and accept new things, and are more willing to apply advanced science and technology to agricultural production, which reduces the possibility of technological risks; At the same time, young managers are more skilled in accessing online information and can obtain market information more accurately and timely. They can get hold of market demand, consumer preferences, and other information more fully, thereby reducing the possibility of market risk. Secondly, the higher the education level of the manager, the more comprehensive their understanding of relevant policies and market information, the more accurate their judgment of the development prospects of the agricultural product market, and the more scientific and reasonable their decision-making may be, reducing the possibility of management risks. Finally, entrepreneurs with firm development beliefs, pioneering and innovative spirit, strong management capability and pressure resistance abilities are more in line with the actual needs of the healthy development of cooperatives, thereby reducing the business risk of cooperatives.


