1.0. Introduction
Generally speaking, ‘Docking’ of a ship refers to putting a ship in a dock to carry out underwater inspection and maintenance. The docking facility can be a drydock (graving type), floating dock, slipway, synchro lift, or other facilities. In this research, ‘Drydocking’ refers to the same act for the same purpose (no newbuilding activities) but only in a drydock (graving dock). Because data are collected from a shipyard with drydocks for repairing/maintenance only, there are no other means of docking.
Historically, the name ‘graving dock’ derives from the dock’s original action to permit cleaning a ship’s bottom, a process known as graving. Drydocks are large, fixed bases built into the ground at the water’s edge (Denis 2018). A watertight gate is closed after a ship is floated into the drydock and positioned above the docking blocks to support it in the dry condition. Once the gate and ship are in position, the water is pumped out from the basin, causing the ship to settle on the blocks, exposing the under-body for essential purposes.
Usually, the drydock capacity is selected concerning the type and maximum deadweight of the ship planned to be drydocked. Types of ships greatly influence the deadweight of ships having similar principal dimensions (length, breadth, and depth).
Table 1 demonstrates the facts regarding the length. One can easily understand how significant the differences in deadweight are among the types. As such, during the selection process, a particular type is considered a guide to selecting the inner dimensions of the drydock. However, it does not necessarily mean that other types of ships cannot use the drydock. Here, the critical point is that ship designers have different options in choosing various combinations of length, breadth, depth, draft, and coefficient of fineness (within a reasonable range) to achieve the same deadweight.
However, the decision is usually based on the market survey on several ships’ availability, deadweight, types, and ages (prospective customers). From the shipyard’s point of view, it is essential to maximize the usage of the drydock spaces. The usage can be measured using financial data like annual profit margin, turnover, etc., which is contributed by the drydock. There are other ways to measure the usage with the help of the physical characteristics of drydock and ships using drydock. This research uses a new measuring scale called the physical performance indicator (PPI). to measure the usage level. They are,
- i.
Drydock occupancy rate (from now on DOR),
- ii.
Capacity utilization rate (from now on CUR),
- iii.
Drydock utilization rate (from now on, DUR).
A too big capacity may attract big ships without fulfilling the expected PPI level. On the other hand, too small a capacity may fulfill the expected PPI level but risk losing substantial customers because of limited drydock capacity. Finally, all these situations affect the revenue. The simple question is then, “What is the appropriate capacity.” There must be a compromise between two extreme cases to maximize the PPIs and revenue. In this research, only PPIs are considered. The PPIs mentioned above are defined and explained.
Drydock occupancy rate (
DOR): It may be defined as the ratio of the number of occupied days of the drydock (not empty) during the operating period to the available number of days of the operating period (Eq. 1). An operating period could be any duration like one month, six months, one year, or more, and the days are counted accordingly. Mathematically, the total number of busy days is the summation of drydocking days of ships during the specified operating period.
DOR is measured as a percentage of the operating period (days). Thus, mathematically,
Capacity utilization rate (
CUR): It may be defined as the ratio of the average deadweight of ships using the drydock during the operating period to the drydock installed capacity (Eq.2). The average deadweight of ships can be calculated using the total deadweight of drydocking ships during the specified operating period divided by the number of ships during the same period.
CUR is expressed as a percentage of the installed capacity of the drydock. Thus, mathematically,
Drydock utilization rate (
DUR): It may be defined as the ratio of the average generated deadweight per day during the operating period to the available deadweight per day during the operating period (Eq. 3). Generated deadweight is defined as the deadweight of a ship times the drydocking days. The average generated deadweight per day can be calculated using the total generated deadweight during the specified operating period divided by the number of days of the operating period. Available deadweight refers to the installed drydock capacity.
DUR is shown as a percentage of the installed capacity of the drydock. Thus, mathematically,
Where DTIME is drydocking time (day)
SD is the deadweight of the ship (tonne)
DCAP is the capacity of drydock (tonne)
i = 1, 2, 3, 4, 5 .......... n
n = Sample size (number of ships)
By appropriate substitutions, the below relationships are also valid (Eqs.4 and 5). Equation 4 highlights the relationship among PPIs using the basic definition. Equation 5 also uses the basic definition to display the relationship between
CUR and
DUR. The PPIs mentioned above are investigated from different viewpoints, and the findings are explained. Data collection and analysis (both analytical and graphical) are carried out.
The remainder of the article is arranged as follows: a review of the related literature is presented in section 2. In section 3, problem formulation and associated assumptions are discussed. Collected samples, initial findings, and methodology are presented in section 4. An analysis of PPIs is presented in graphical form in section 5.
Section 6 discusses the results of the investigations and the application of findings. Finally, section 7 concludes the works and proposes suggestions for future research works.
1.1. Limitations and Assumptions
The paper aims to analyze and determine how the size of ships coming to a drydock influences the internal size of a drydock. More specifically, the size and number of ships, in short, the fleet size, significantly dictates a would-be drydock's inner size (dimensions). Ideally, a final decision about the size of a drydock (internal dimensions – length, breadth, and depth) depends on many factors. Some are listed below.
- i.
Financial factors: It refers to investment and a safe and healthy return in terms of profit.
- ii.
Purpose: It refers to the type of service to be offered using the proposed drydock - repairing or newbuilding. There is a big difference in the capacities of equipment to be installed, for example, dewatering pump capacity, drydock crane capacity, etc. This difference will significantly impact capital expenditure (CAPEX) and operational expenditure (OPEX) in the long run.
- iii.
Location: It involves the infrastructure available around the area, like transportation and connectivity facilities (rail and road), etc.
- iv.
Geological condition of the location: It refers to the soil condition and other related issues to support the construction of a heavy ground structure like a graving dock.
- v.
Ships: These refer to the available customers (size and quantity of ships), which means the size of the fleets of the prospective shipping companies to support the drydock with an appropriate number of ships.
- vi.
Possible competitors and their facilities: It refers to similar organizations working around the place. Sometimes, this issue is considered globally.
- vii.
The subject paper only focused on item V), nothing else. At the very preliminary stage, before anything takes place, it is essential to know the nature of the would-be customers (ships’ size and their number) and the appropriate drydock size to cater services for them.
As such, the internal dimension of a drydock chosen based on available fleet size may not be the optimum considering the location's cost factors or geological conditions and others. Therefore, the results of this research work are valid subject to favorable financial factors, transportation facilities (road and rail) around the location, geological condition of the site, no shortage of customers (ships of appropriate size and number), no impact of competitors in the same area and no surprise in day-to-day operation.
2.0. Literature Review
Though sufficient works of literature are available on drydock structural design, construction, operation, and maintenance, very little literature was found, particularly on the selection of drydock capacity (in terms of ship’s deadweight) and related subjects. This lack of information motivated the authors, who have more than four decades of direct experience in marine and offshore industries, particularly in repairing and new building of various types and sizes of ships using drydock (graving dock), to take the task of studying the drydock capacity and related issues.
Despite the unavailability of good literature on the selection of drydock capacity, in particular, there is already some work done on graving docks and related fields. Moreover, drydocks for marine use have been subject to study and research from several points of view, such as environmental issues, hydrodynamic design, construction, geological issues, etc. Similarly, drydocking systems and their analysis have also attracted the attention of many researchers. Some of them are highlighted below.
Denis (2018) worked with the safe operations of the floating and graving docking system. In this research, a critical review of the drydocking system using a floating dock and graving dock is conducted to determine the current status of drydocking problems. Furthermore, a background study is carried out on a floating and graving drydocking system, highlighting its layout, trends, and factors affecting the selection of a drydocking system. The ship docking specification is also reviewed, and the corresponding standards and regulations of floating-graving drydocks are presented. Also highlighted are the dimensions, weight characteristics, fleet size, and general features of ships to be serviced by the dry dock, which play a vital role in selecting the capacity of the proposed drydock.
Department of Defense, USA (2002) published a comprehensive report about unified facilities criteria (UFC), especially on the design of graving docks. It highlighted different aspects of the design of graving docks. It includes:
- i.
the selection of location and type of drydock construction,
- ii.
type of activities/functionalities the drydock will perform (new building or repairing),
- iii.
the size of the ship (deadweight) and the number of ships for which the drydock is meant.
It also considered the strategic site selection to meet the present and future development/expansion requirements and general accessibility to and from the waterways. It also highlighted that the minimum inside dimensions of a graving dock (in other words, the capacity of the ship’s deadweight) depends on the types of ships to be accommodated. However, the exact configuration of the inside of the walls and the resulting shape of the inside cross-section will represent a compromise between several conflicting factors, the dominating one being the structural type that is finally selected.
Najafi and Naghavi (2009) worked with the drydock flooding time and seawater flow characteristics in the intake channels of the drydock using a numerical simulation model in the design stage. The numerical results were compared with actual data, and a good agreement was obtained. The seawater discharge through the flooding system and the required time to fill the drydock are determined. The water current velocity and pressure on the walls are also calculated.
Jiang et al. (1987) worked with predicting drydock block reactions. They developed a reliable, efficient computer program for predicting block reactions in graving and floating docks. The computer program represents a significant advance in the existing docking analysis methods. It is incredibly user-friendly, and the program’s ease of application, flexibility, speed, and accuracy make it an attractive alternative to traditional analysis methods, as claimed by the authors.
Cheng and Zeng (1995) worked with the optimum disposition of wooden blocks during ship drydocking. They proposed a mathematical model for the optimum nature of wooden blocks. The multi and constrained variable methods are adopted to obtain optimum solutions on a microcomputer. The docking results of the two ships have shown that the proposed optimum way is reliable.
Cheng et al. (2004) worked with an optimal and robust design of drydocking blocks, focusing on positioning and stiffness allocation of docking blocks. They have proposed the convex (mathematical) model in which the indeterminacy of the uncertainty variables in designing docking blocks is presented. Numerical examples were used to show that uncertainties affecting the optimal solution can increase the volume of blocks compared to deterministic optimization. A robust design method for the uncertain equivalent stiffnesses of blocks is also proposed. Numerical simulations show that the optimal result from minimization of the maximum value of unsatisfactory degree functions is superior to that from direct maximization of the minimum value of uncertainty parameters without disappointing degree functions.
Kumamoto et al. (1990) introduced a new concept to the construction process of drydock in Japanese environments. They proposed to integrate management technology scientifically, together with Japanese quality control or TQC (total quality control), into the construction process, e.g., utilizing statistical methods in execution planning and participation of all organization members in quality control and QC circle activities. The interaction of both approaches in construction is illustrated in this paper through an actual project for a drydock built without using cofferdams.
Akan (2000) worked with the quantity and quality of runoff water from marine drydocks. They investigated and found that the runoff water from a marine drydock can be a significant source of pollution for the drydock’s waterway. Because of intensive industrial activity, many pollutants build over drydock surfaces. These pollutants can be washed off during rainfall and quickly transported into the receiving water. Using two-dimensional kinematic-wave and convective transport equations for total suspended solids, they developed a mathematical model to simulate the quantity and quality of runoff water from marine drydocks. An empirical formula is used to model the wash-off process. An implicit finite-difference scheme is employed to numerically solve the governing equations of the model. The quantity and quality of stormwater runoff from a private drydock were monitored under actual rainfall-runoff conditions to validate the model. The samples collected were analyzed in the laboratory to determine the pollutant loading of the runoff, and these data were subsequently used to calibrate and verify the mathematical model.
Wu (1990) studied the stability analysis and displacement measurements of graving dock walls. Safety certification of naval graving docks is essential to support fleet operation and readiness. An analytical method is used to evaluate the structural adequacy of existing drydocks, which are naturally subjected to static and dynamic (like an earthquake) loads. Different model values are validated by comparing field observations made for naval shipyards and found to be satisfactory.
Salzer (1986) studied factors in selecting drydocking systems for shipyards. It provides comparison factors for beginning the selection of drydocking designs based on information supplied by the leading drydocking system designers and suppliers in the USA. In addition, a summary of technical factors in tabular format is presented for easy comparison.
In short, Denis (2018) worked on the safe operations of the floating and graving docking system. Department of Defense, USA, (2002) focused on the structural design of graving docks. Najafi and Naghavi (2009) and Akan (2000) studied drydock filling, running off the water, and flow characteristics. Jiang et al. (1987), Cheng and Zeng (1995), and Cheng et al. (2004) explored drydock block reactions. Kumamoto et al. (1990) investigated the construction process of drydock in Japanese environments. Wu (1990) examined the stability of graving dock walls. Salzer (1986) studied factors for selecting drydocking systems for shipyards. None of the above works had taken care of the selection process of a drydock capacity. Drydock capacity is the backbone of the whole project (the shipyard). It will drive/dictate the other facilities like material handling equipment (cranes, transporters), workshop areas and facilities (floor area, machinery, and equipment), quay size, etc.
3.0. Problem Formulation and Factors Affecting the Capacity of a Graving Dock
3.1. Problem Formulation
In general, ship owners/managers expect the drydock capacity to be large enough to have sufficient space and natural ventilation around the ship, including the bottom. It will help move quickly without any constraint during external hull inspection in the drydock, significantly, the bottom and side for equipment movement. This will also help maintain an excellent natural airflow around the ship, which finally helps cure the hull painting to achieve quality painting works. Therefore, it suggests a drydock that is bigger than the ship’s dimensions. However, there is a high risk of under-utilization due to oversized drydock.
On the other hand, the shipyard wants to fulfil the targets of various PPIs and financial indicators, suggesting a smaller drydock capacity. However, this may lead to losing potential customers because of capacity restrictions. Therefore, there should be a compromise between both extreme situations, based on some pre-determined criteria, such as available fleet size (no. of ships) and ship size (deadweight) of prospective customers (shipowners).
3.2. Factors Affecting the Selection of a Drydock System
There are many areas to consider in the process of selecting a drydock. They are mainly the location of the proposed drydock and its orientation (it includes the geological condition of the selected area), physical dimensions and capacity (it consists of the inside dimensions, length, breadth, depth and the capacity in deadweight), economic feasibility (it consists of the financial aspects of the very investment). Salzer (1986) discussed and summarized several detailed technical features.
Table 2 displays the same for drydock only. However, this research covers only drydock capacity (deadweight) and its selection procedure.
4.0. Sample Data and Methodology
To study the behavior/pattern of the PPIs of drydock usage, detailed information on the drydocking of ships and the drydock itself must be known. Accordingly, data on ship drydocking in a shipyard with two drydocks are collected. Then, the same data are analyzed, and various yearly PPIs are calculated to understand their behaviors. The shipyard has two (2) drydocks (hereinafter ‘drydock A’ and ‘drydock B’). Their physical particulars are presented in
Table 3. The capacity of a drydock refers to the maximum deadweight of the ship that can be handled in the drydock, allowing appropriate clearance between the ship and the drydock wall all around. In reality, clearance is compromised to accommodate bigger ships within the drydock’s inside dimensions in an emergency. As such, the installed capacity of a drydock does not indicate the cut-off point for using the drydock by a ship with a higher deadweight to some extent.
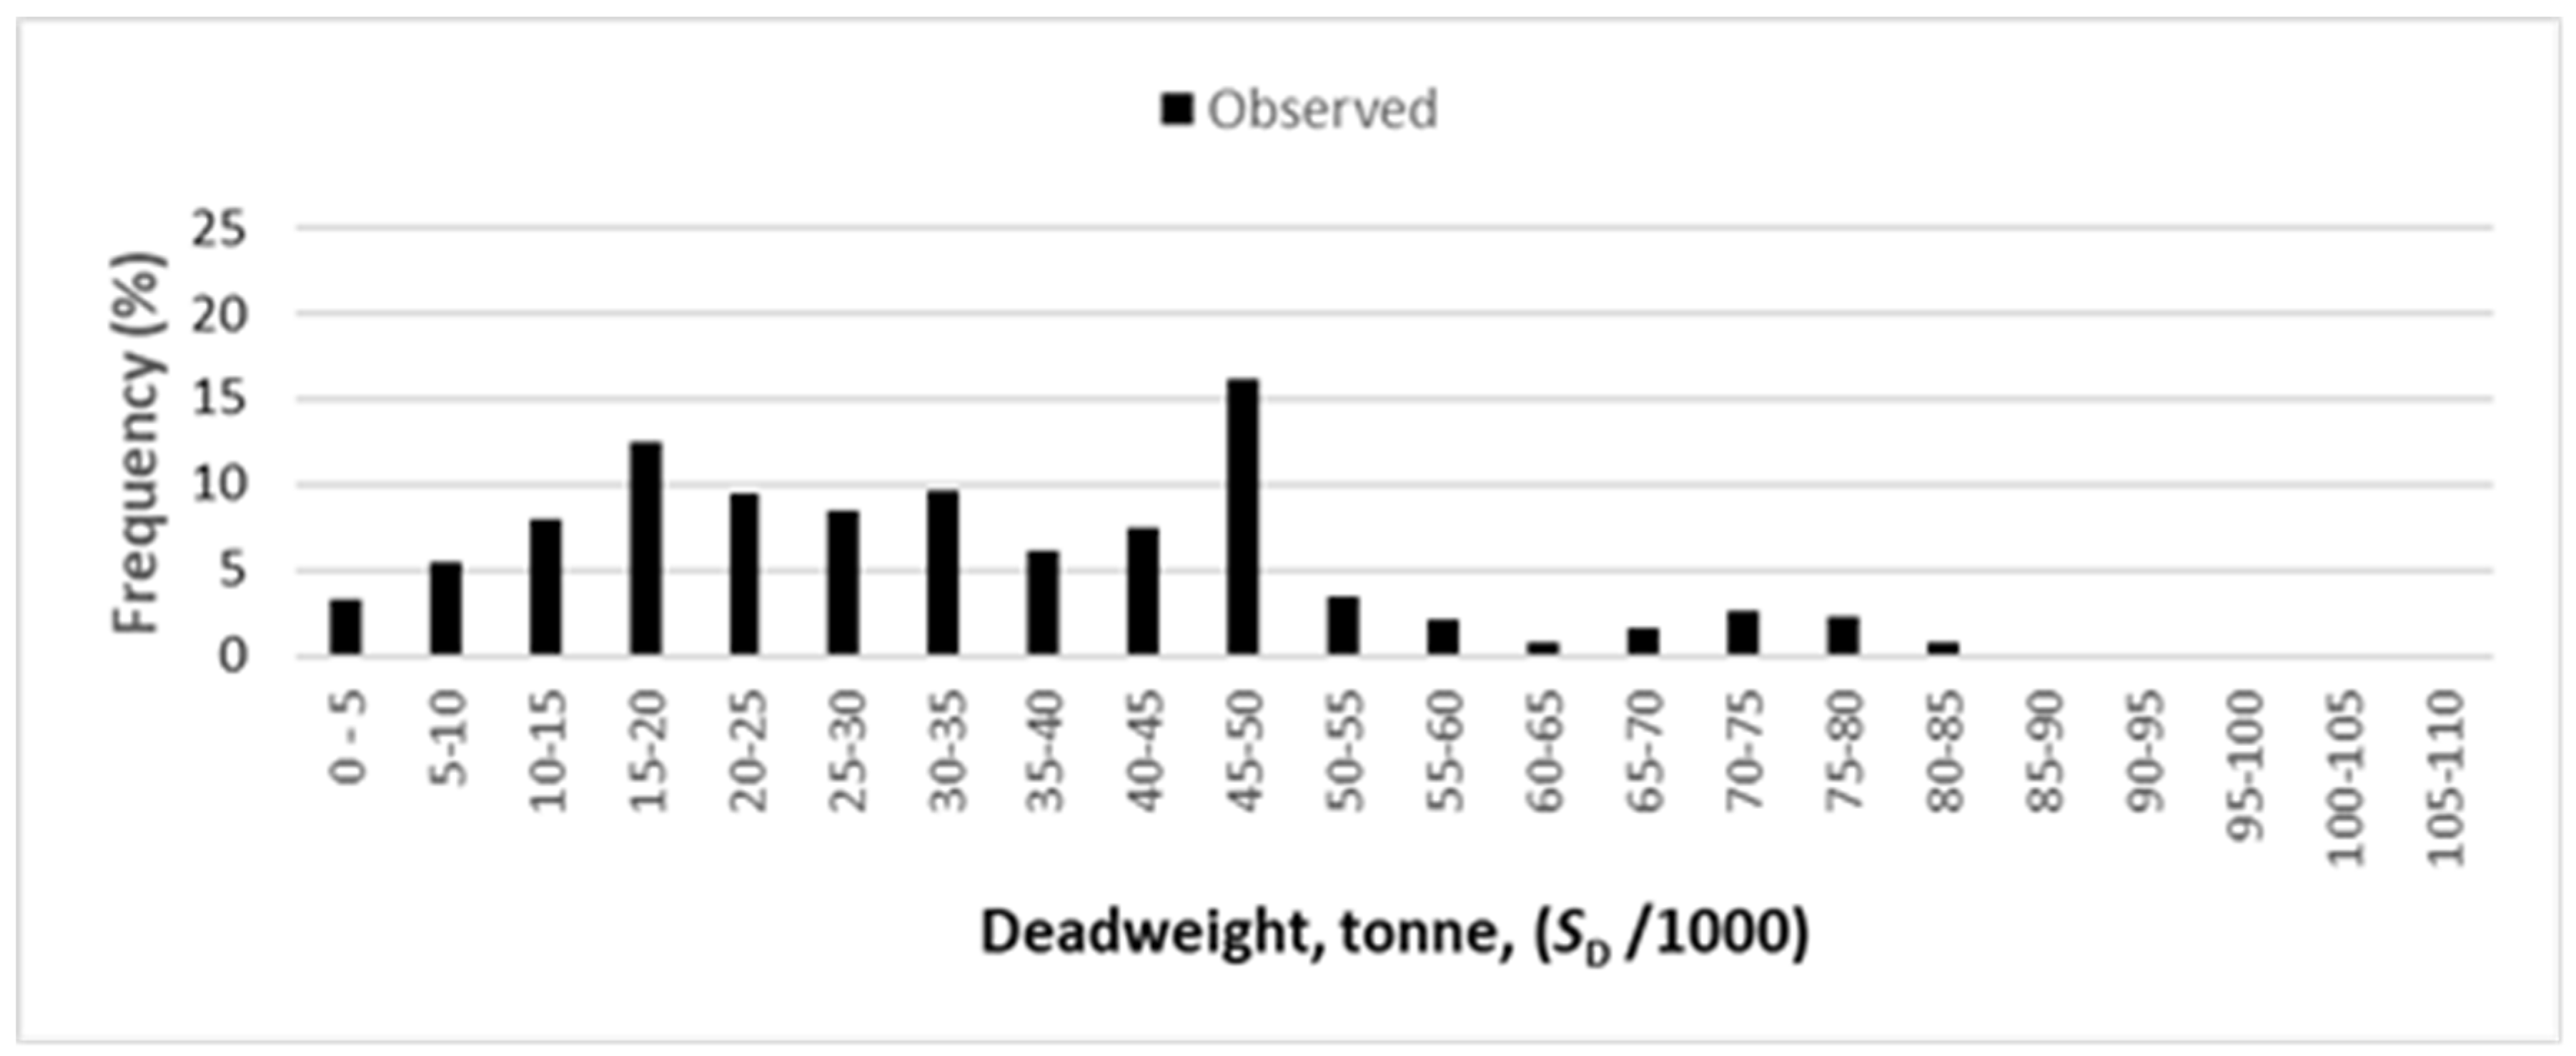
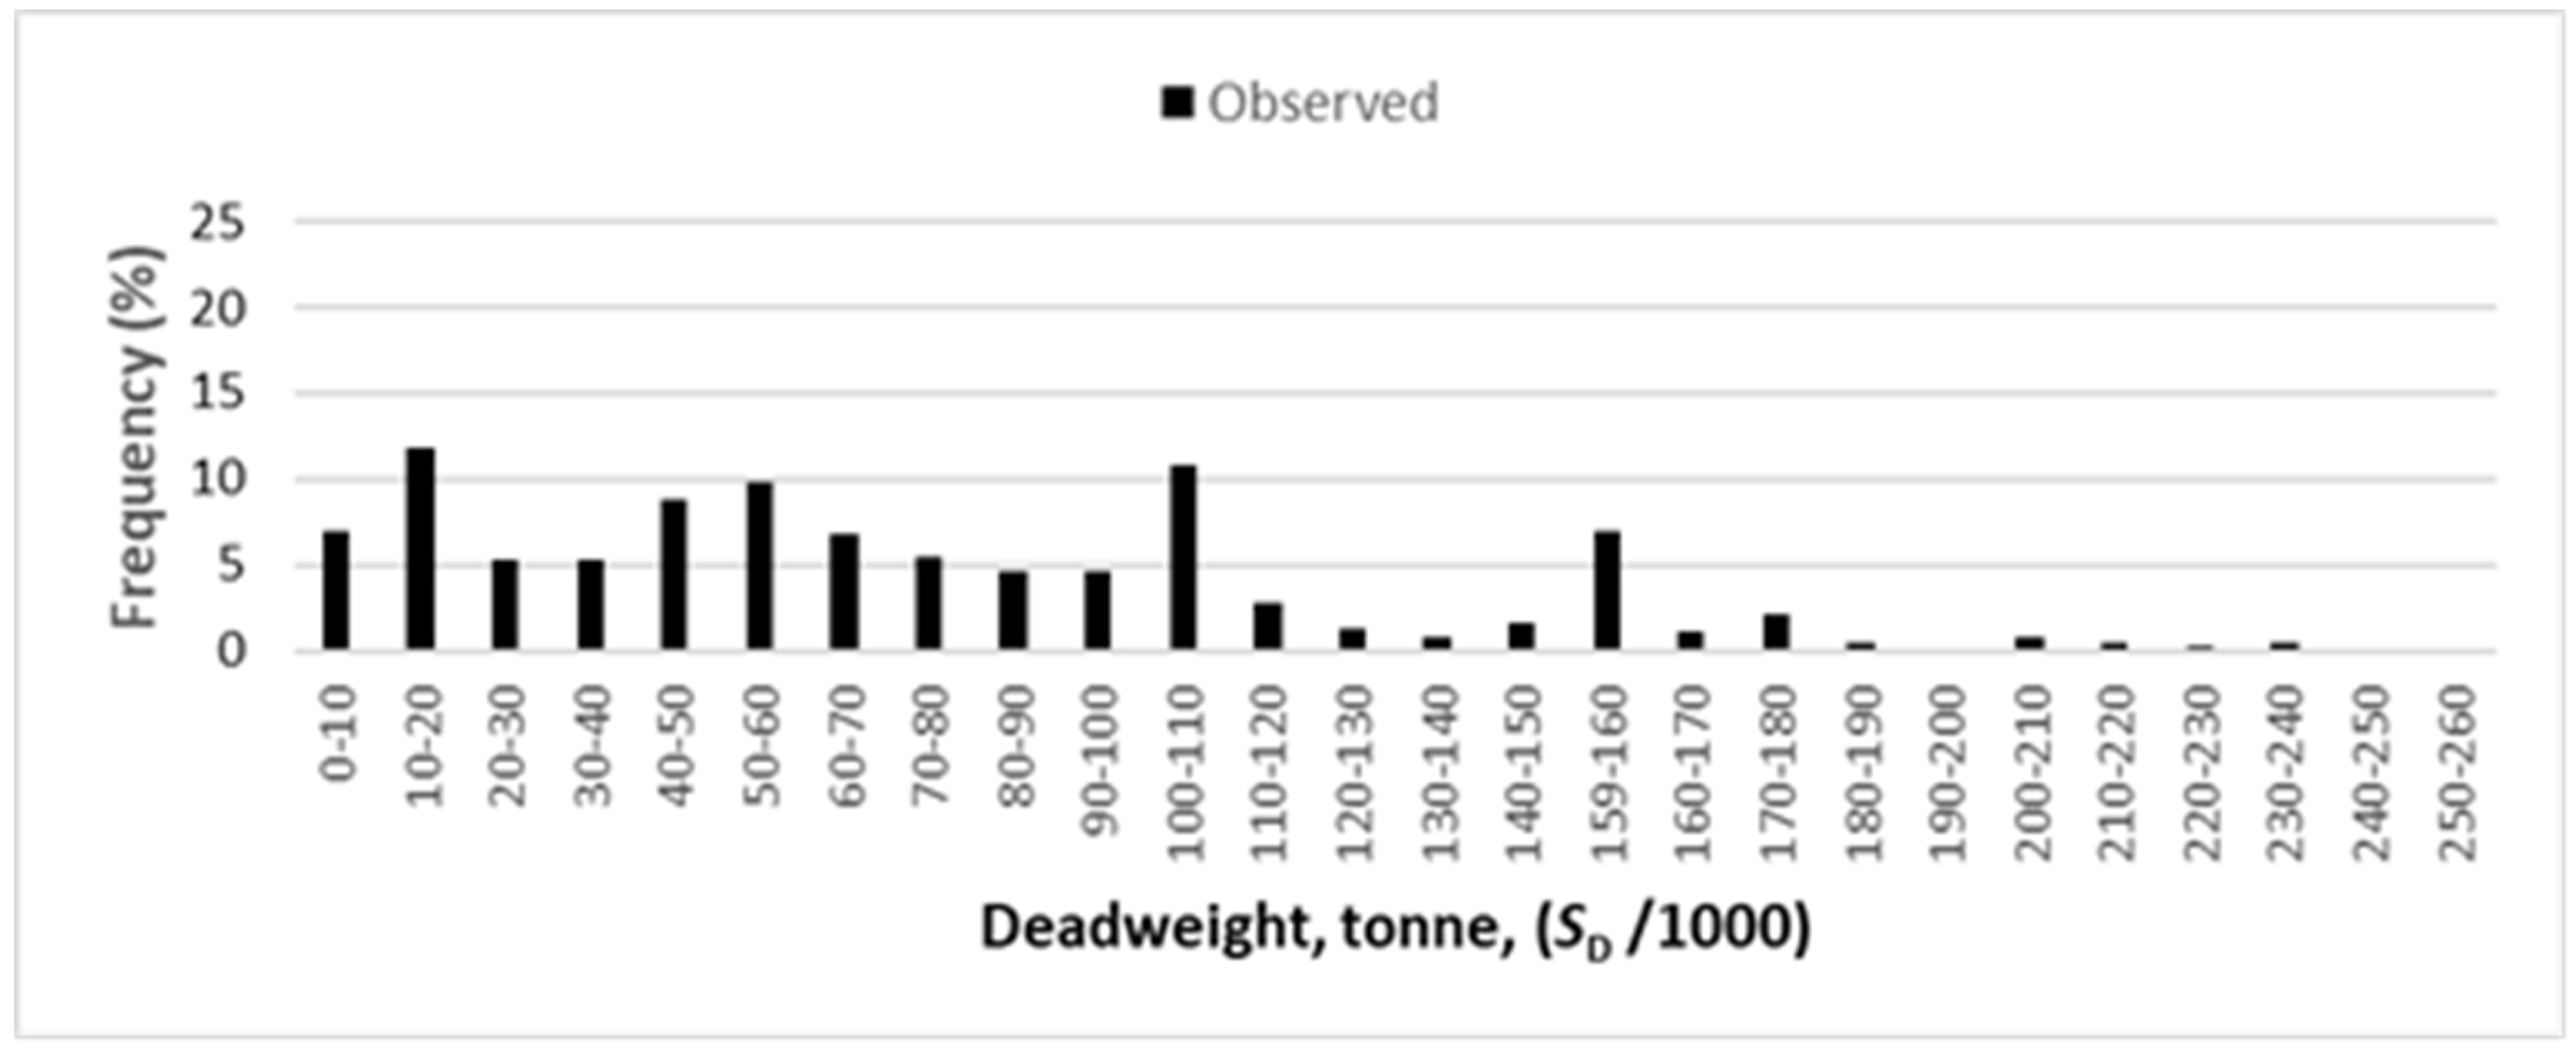
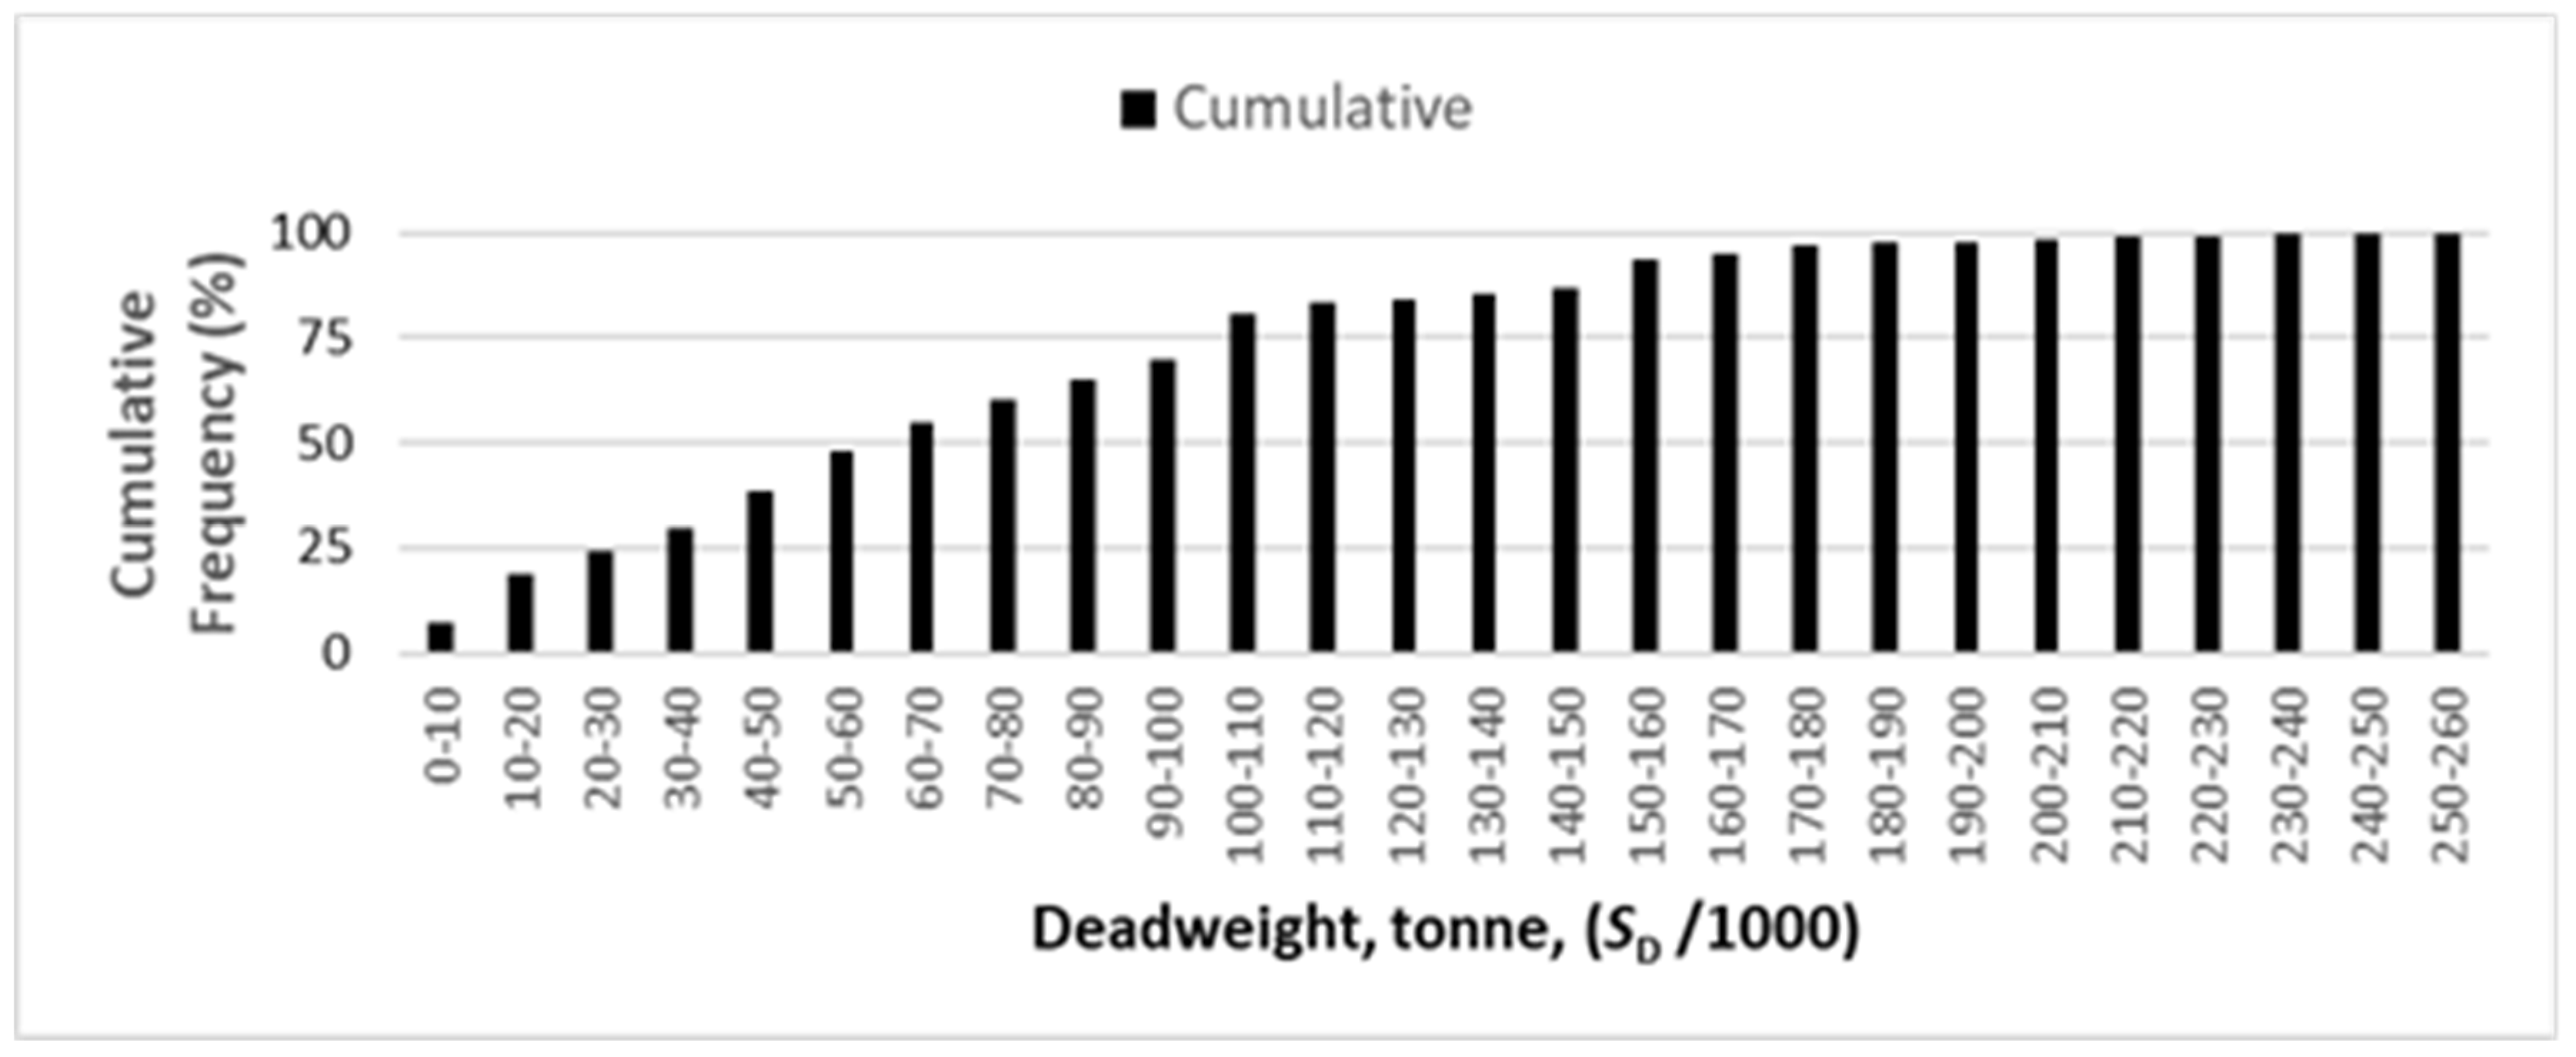
Figure 1 and
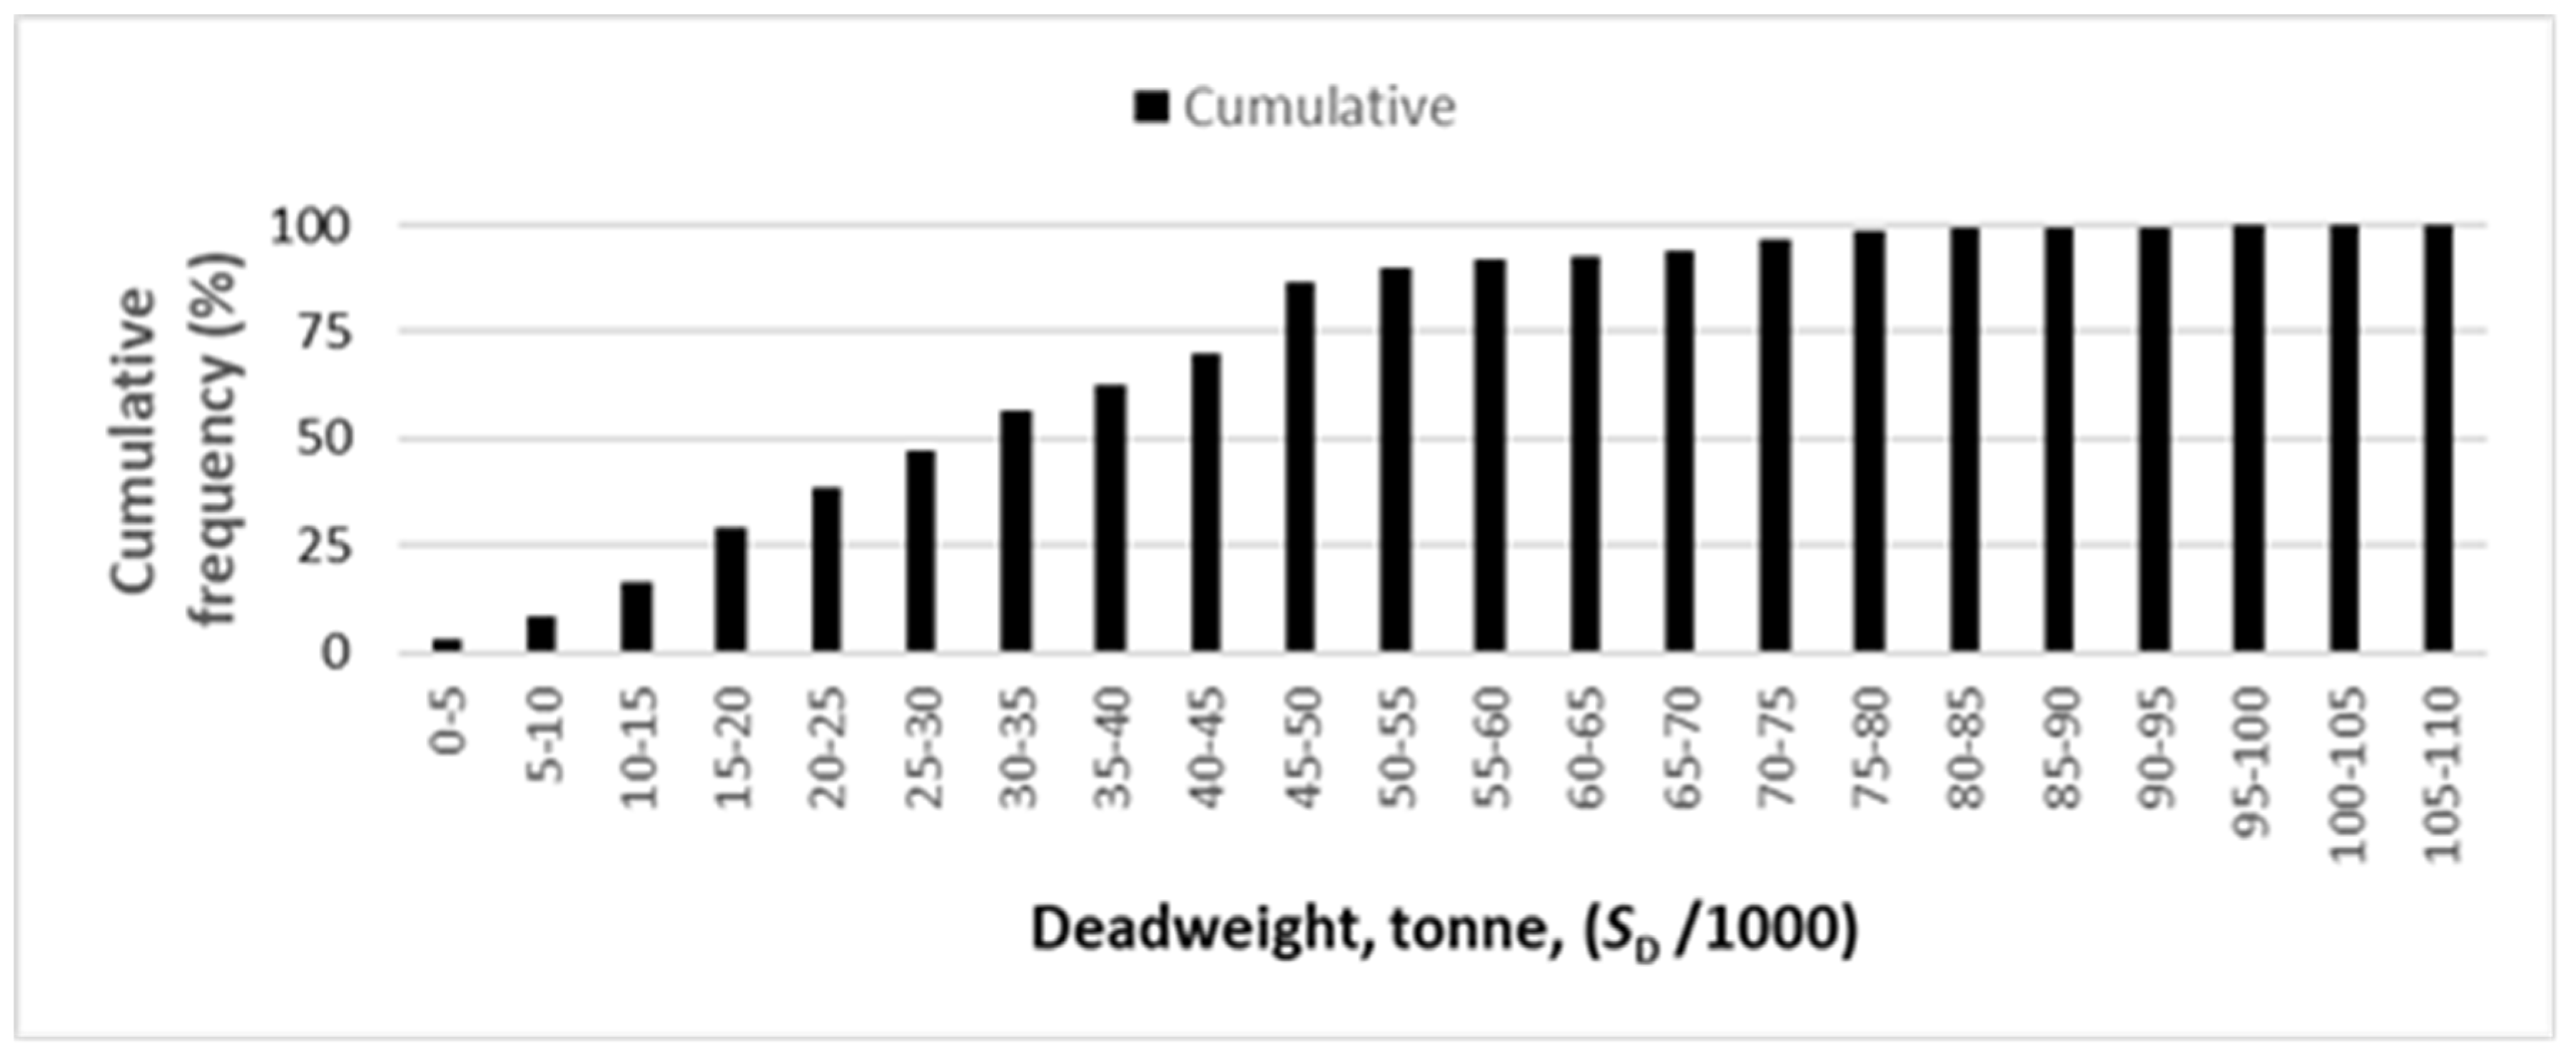
Figure 2 validate the distribution (observed and cumulative, respectively) of the deadweight of ships using drydock A with an average deadweight of 33,503 tonnes (
Table 4). It also suggests that 99% of ships are within 80,000 tonnes of deadweight for drydock A (Figure 2). However, this group of ships used only 35% of the installed capacity of the drydock, 96,000 tonnes (
Table 3). Figures also dictate that the number of ships with more than 80,000 tonnes of deadweight is only 7. So, the remaining 65% of the installed capacity was hardly used or heavily underutilized (Figure 1).
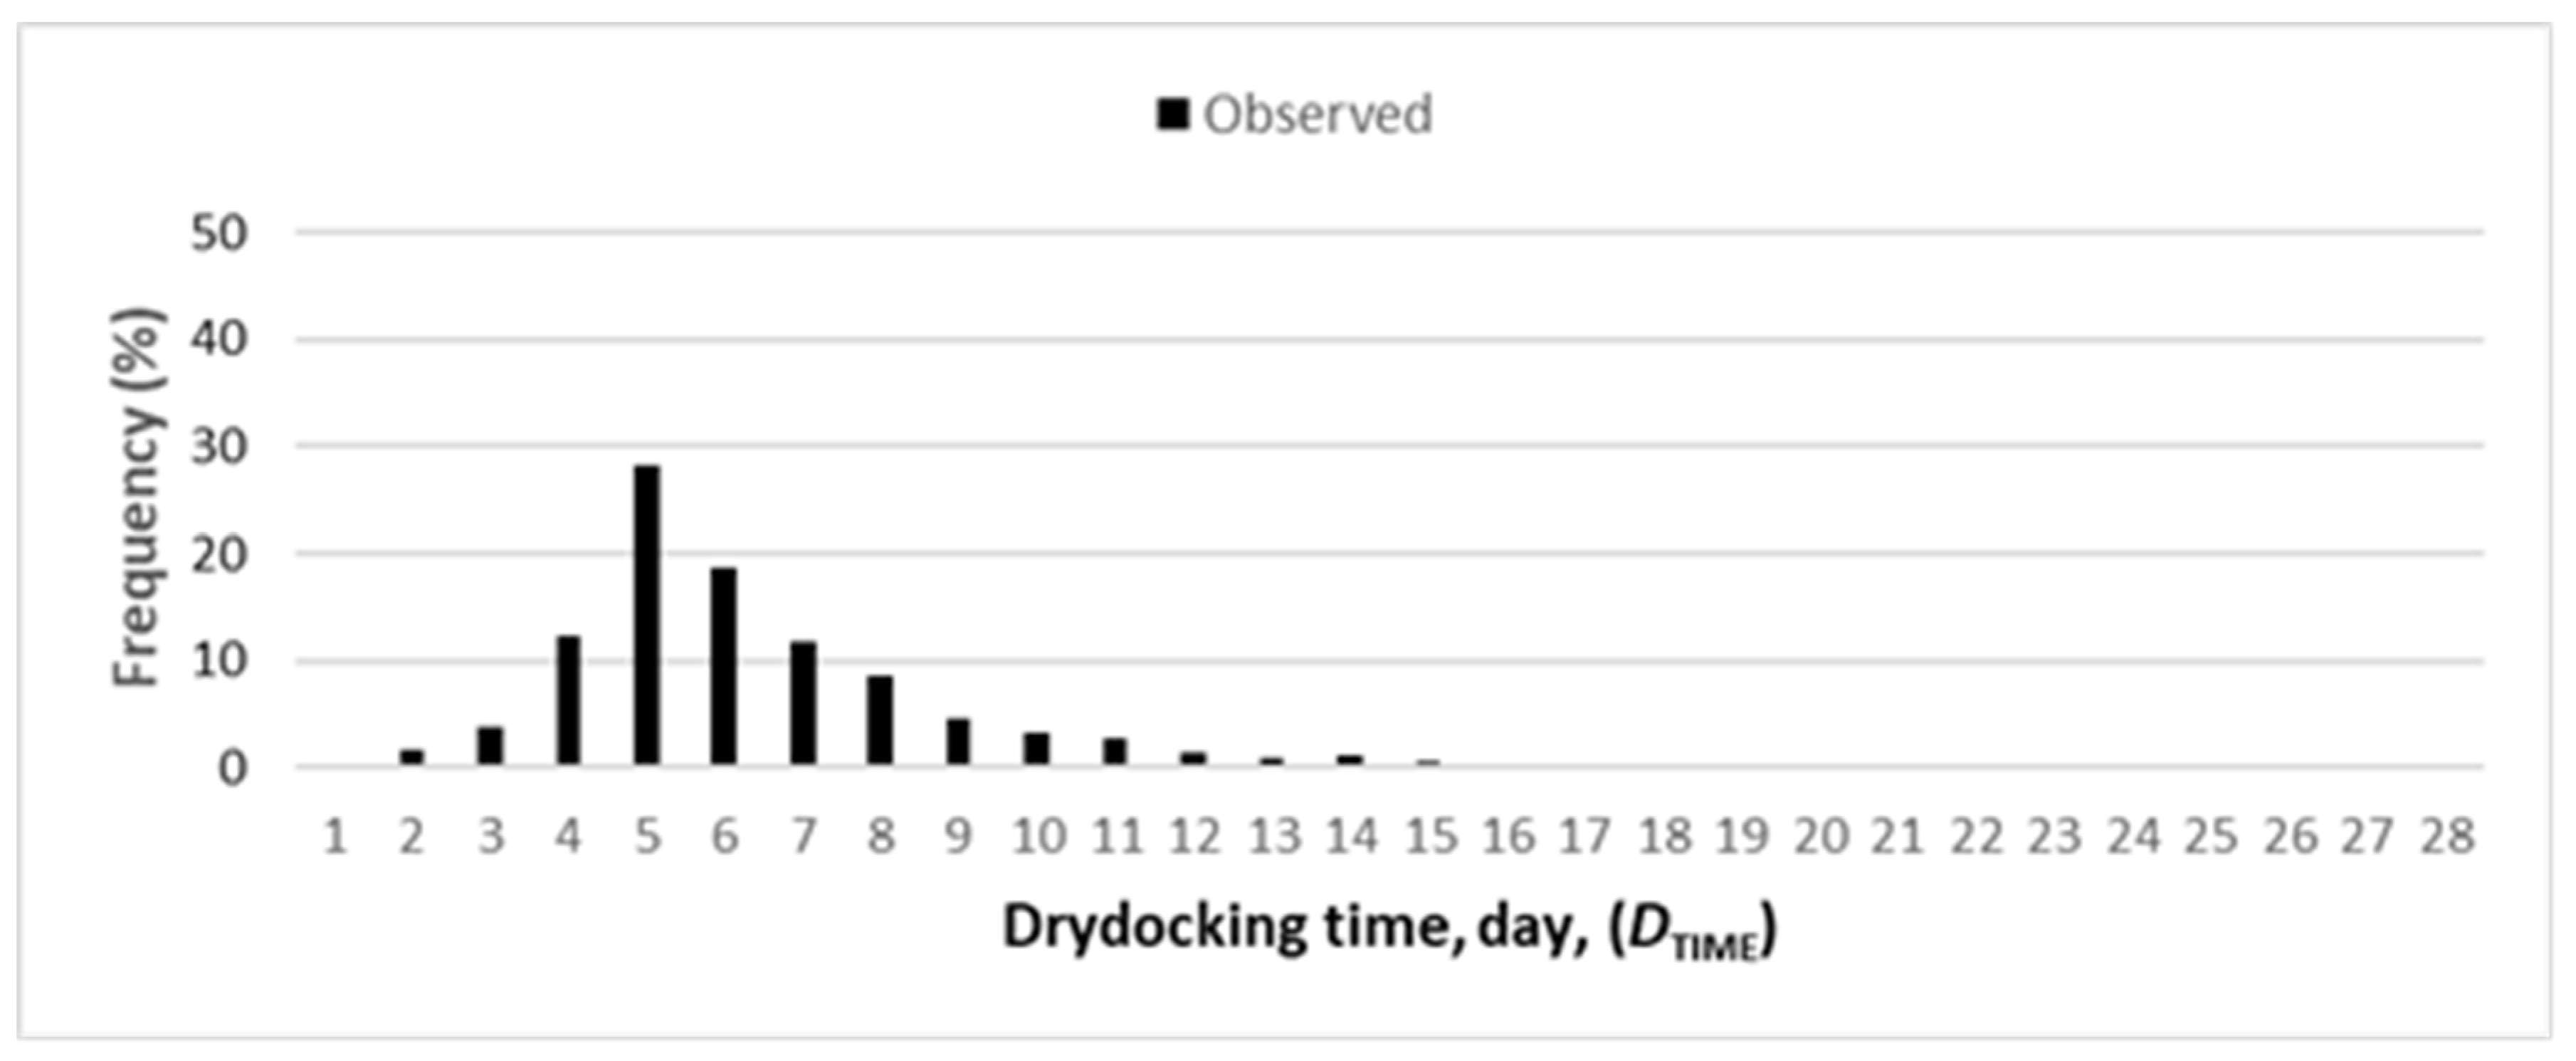
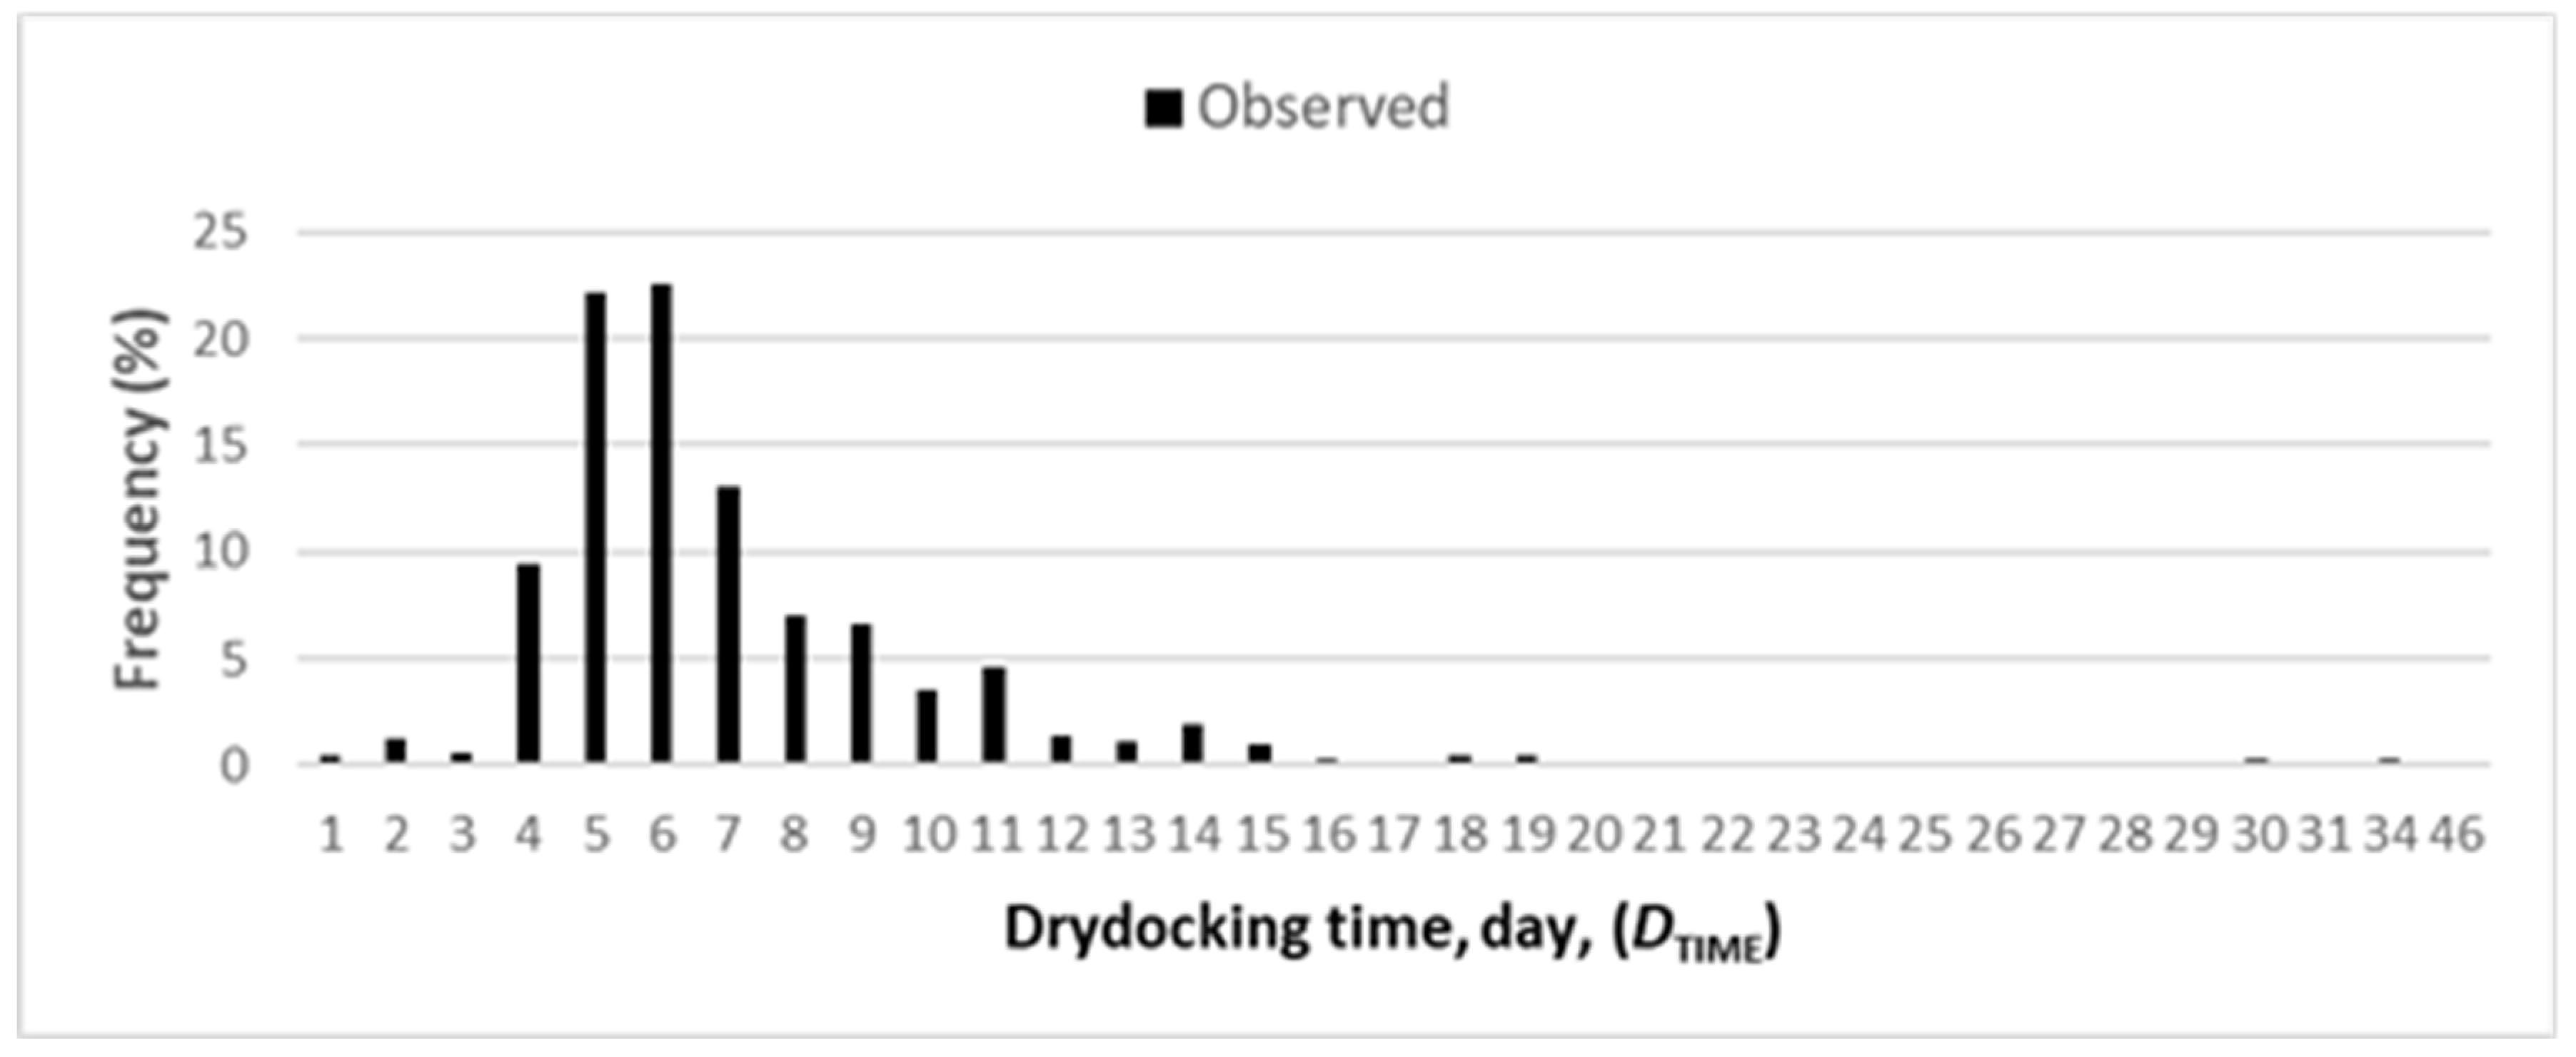
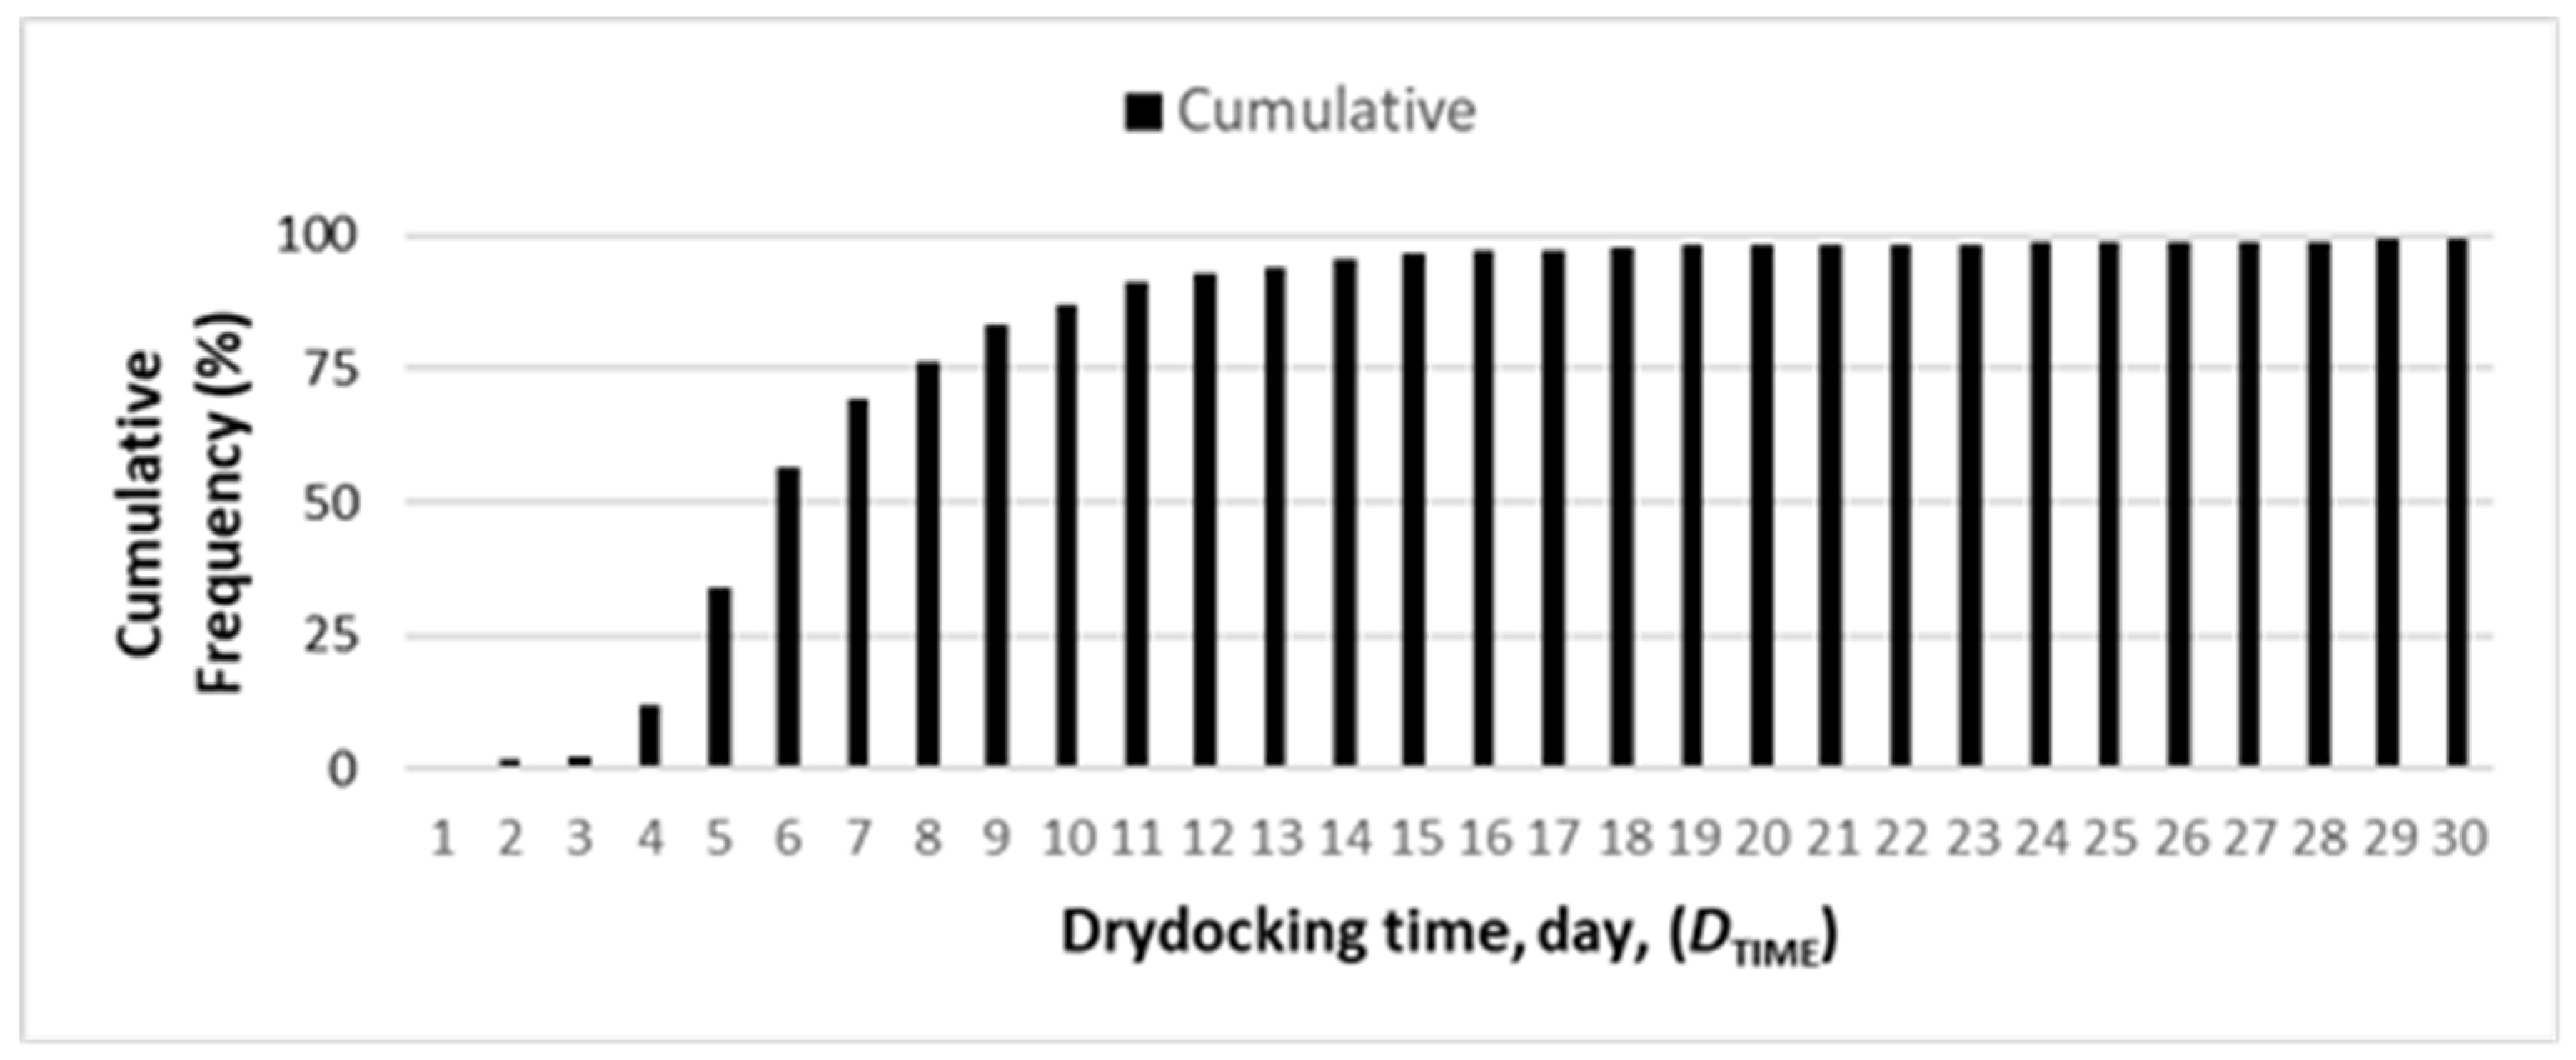
Figure 3 and
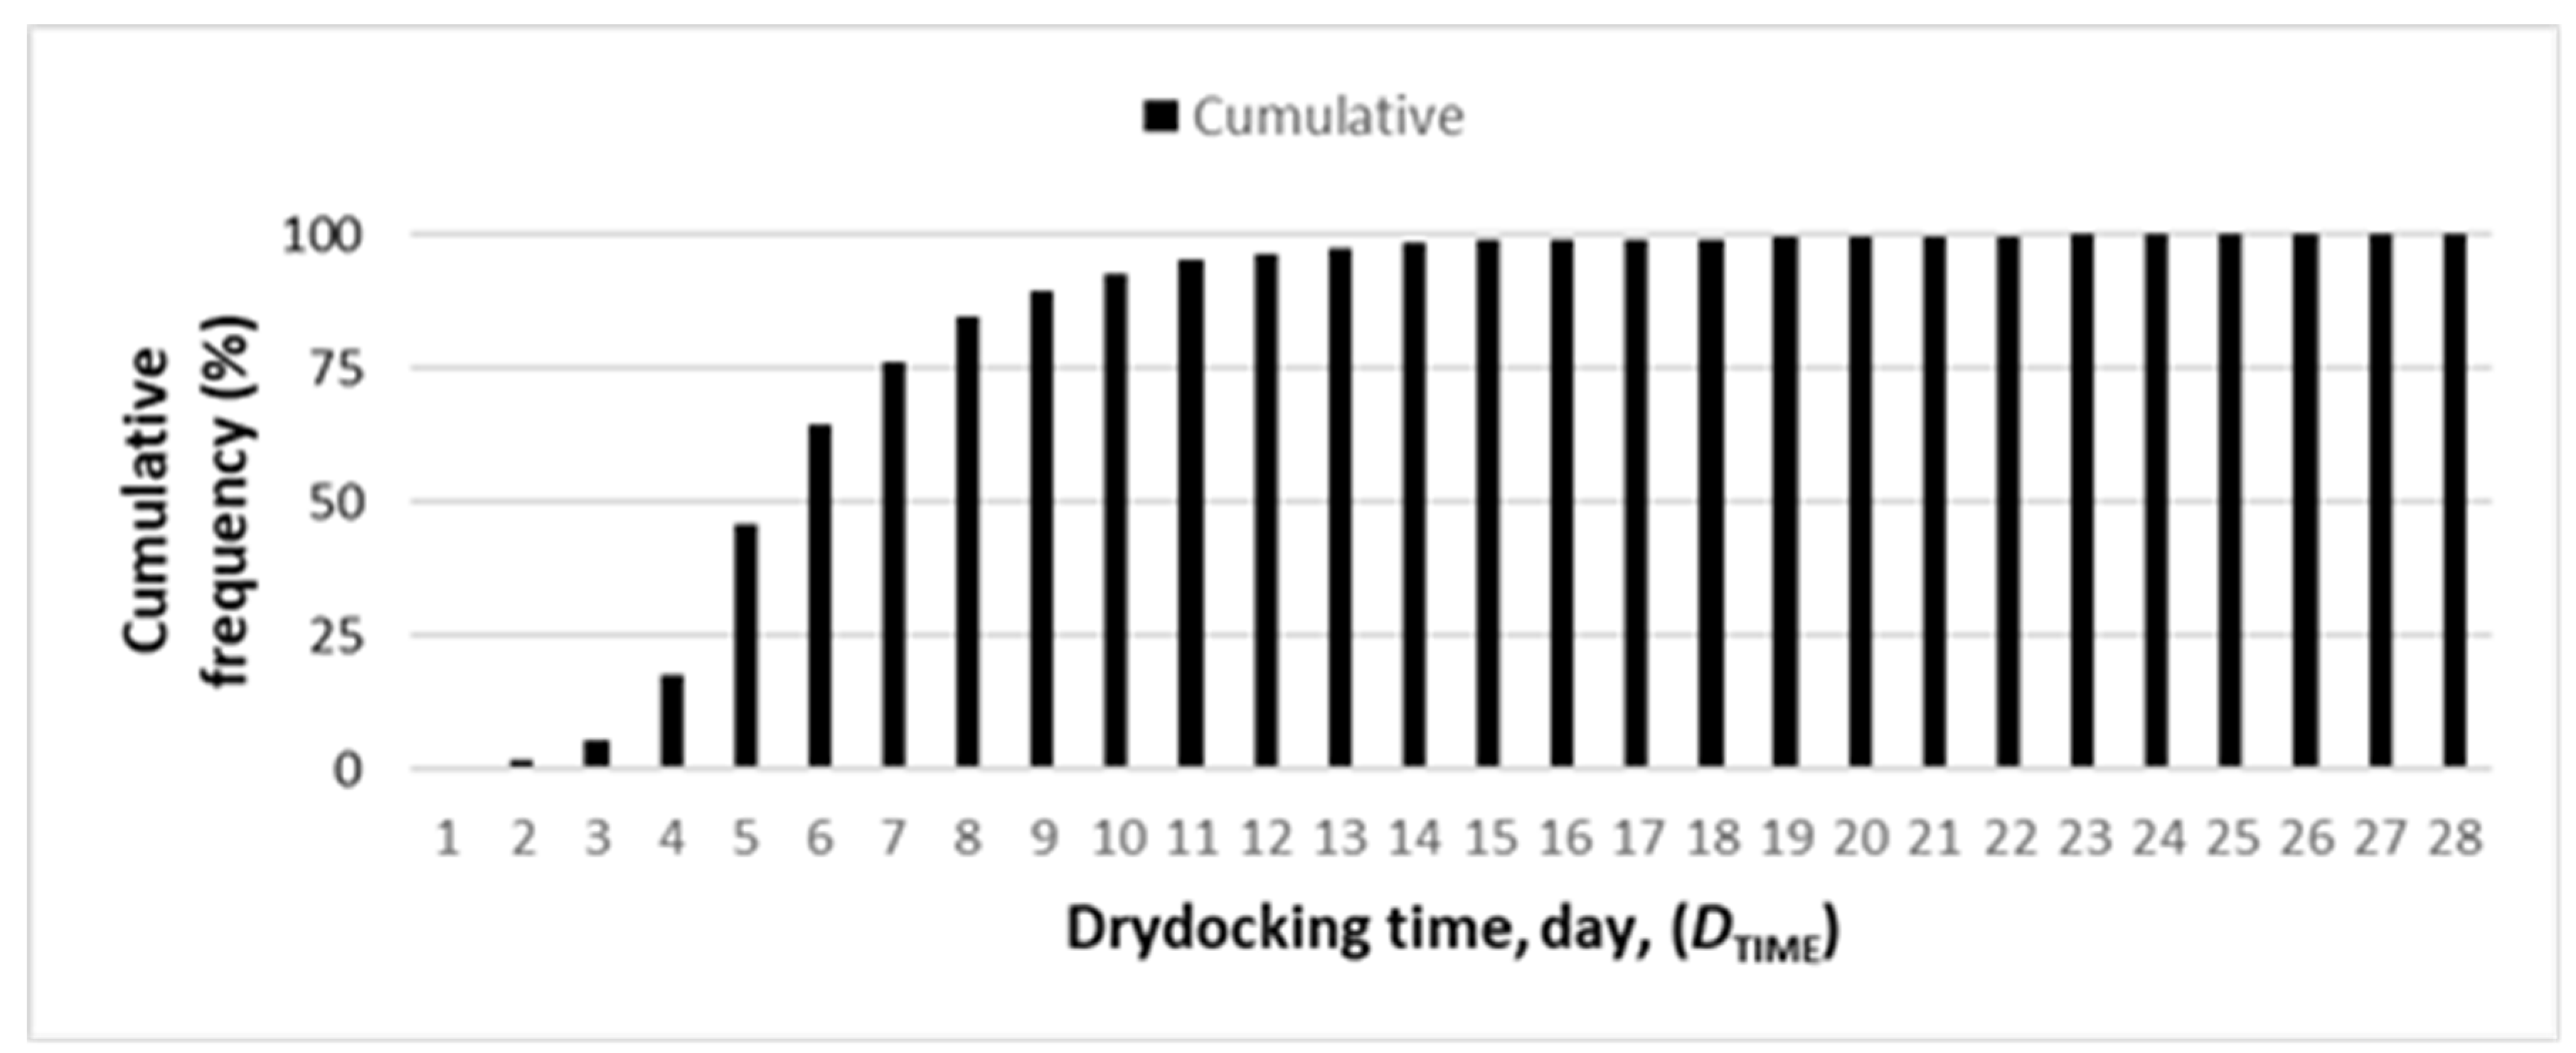
Figure 4 affirm the distribution (observed and cumulative, respectively) of drydocking time of ships using drydock A with an average drydocking time of 6.42 days (
Table 4). It also confirms that 76% of ships are within 7 days of drydocking time for drydock A (Figure 4). Focusing on the deadweight distribution of ships in drydock A (Figure 1), it seems that drydock A is oversized and underutilized.
Figure 5 and
Figure 6 convey the distribution (observed and cumulative, respectively) of the deadweight of ships using drydock B, with an average deadweight of 73,800 tonnes (
Table 5). Similarly, it demonstrates that 97% of ships are within 180,000 tonnes of deadweight range (Figure 6). This group of ships used only 24.91% of the installed capacity of the drydock, 296,000 tonnes (
Table 3). Figures also depict that the number of ships with more than 180,000 tonnes of deadweight is only 16. So, the remaining 75.09% of the installed capacity was hardly used or heavily underutilized (Figure 5).
Figure 7 and
Figure 8 display the distribution (observed and cumulative, respectively) of the drydocking time of ships using drydock B, with an average docking time of 7.35 days (
Table 5). Similarly, it also exhibits that 76% of ships are within 8 days of drydocking time for drydock B (Figure 8). Focusing on the deadweight distribution of ships in drydock B (Figure 5), it seems that drydock B is over capacity and underutilized.
5.0. Data Analyses
Table 6 displays the PPIs of drydock A in the respective operating year.
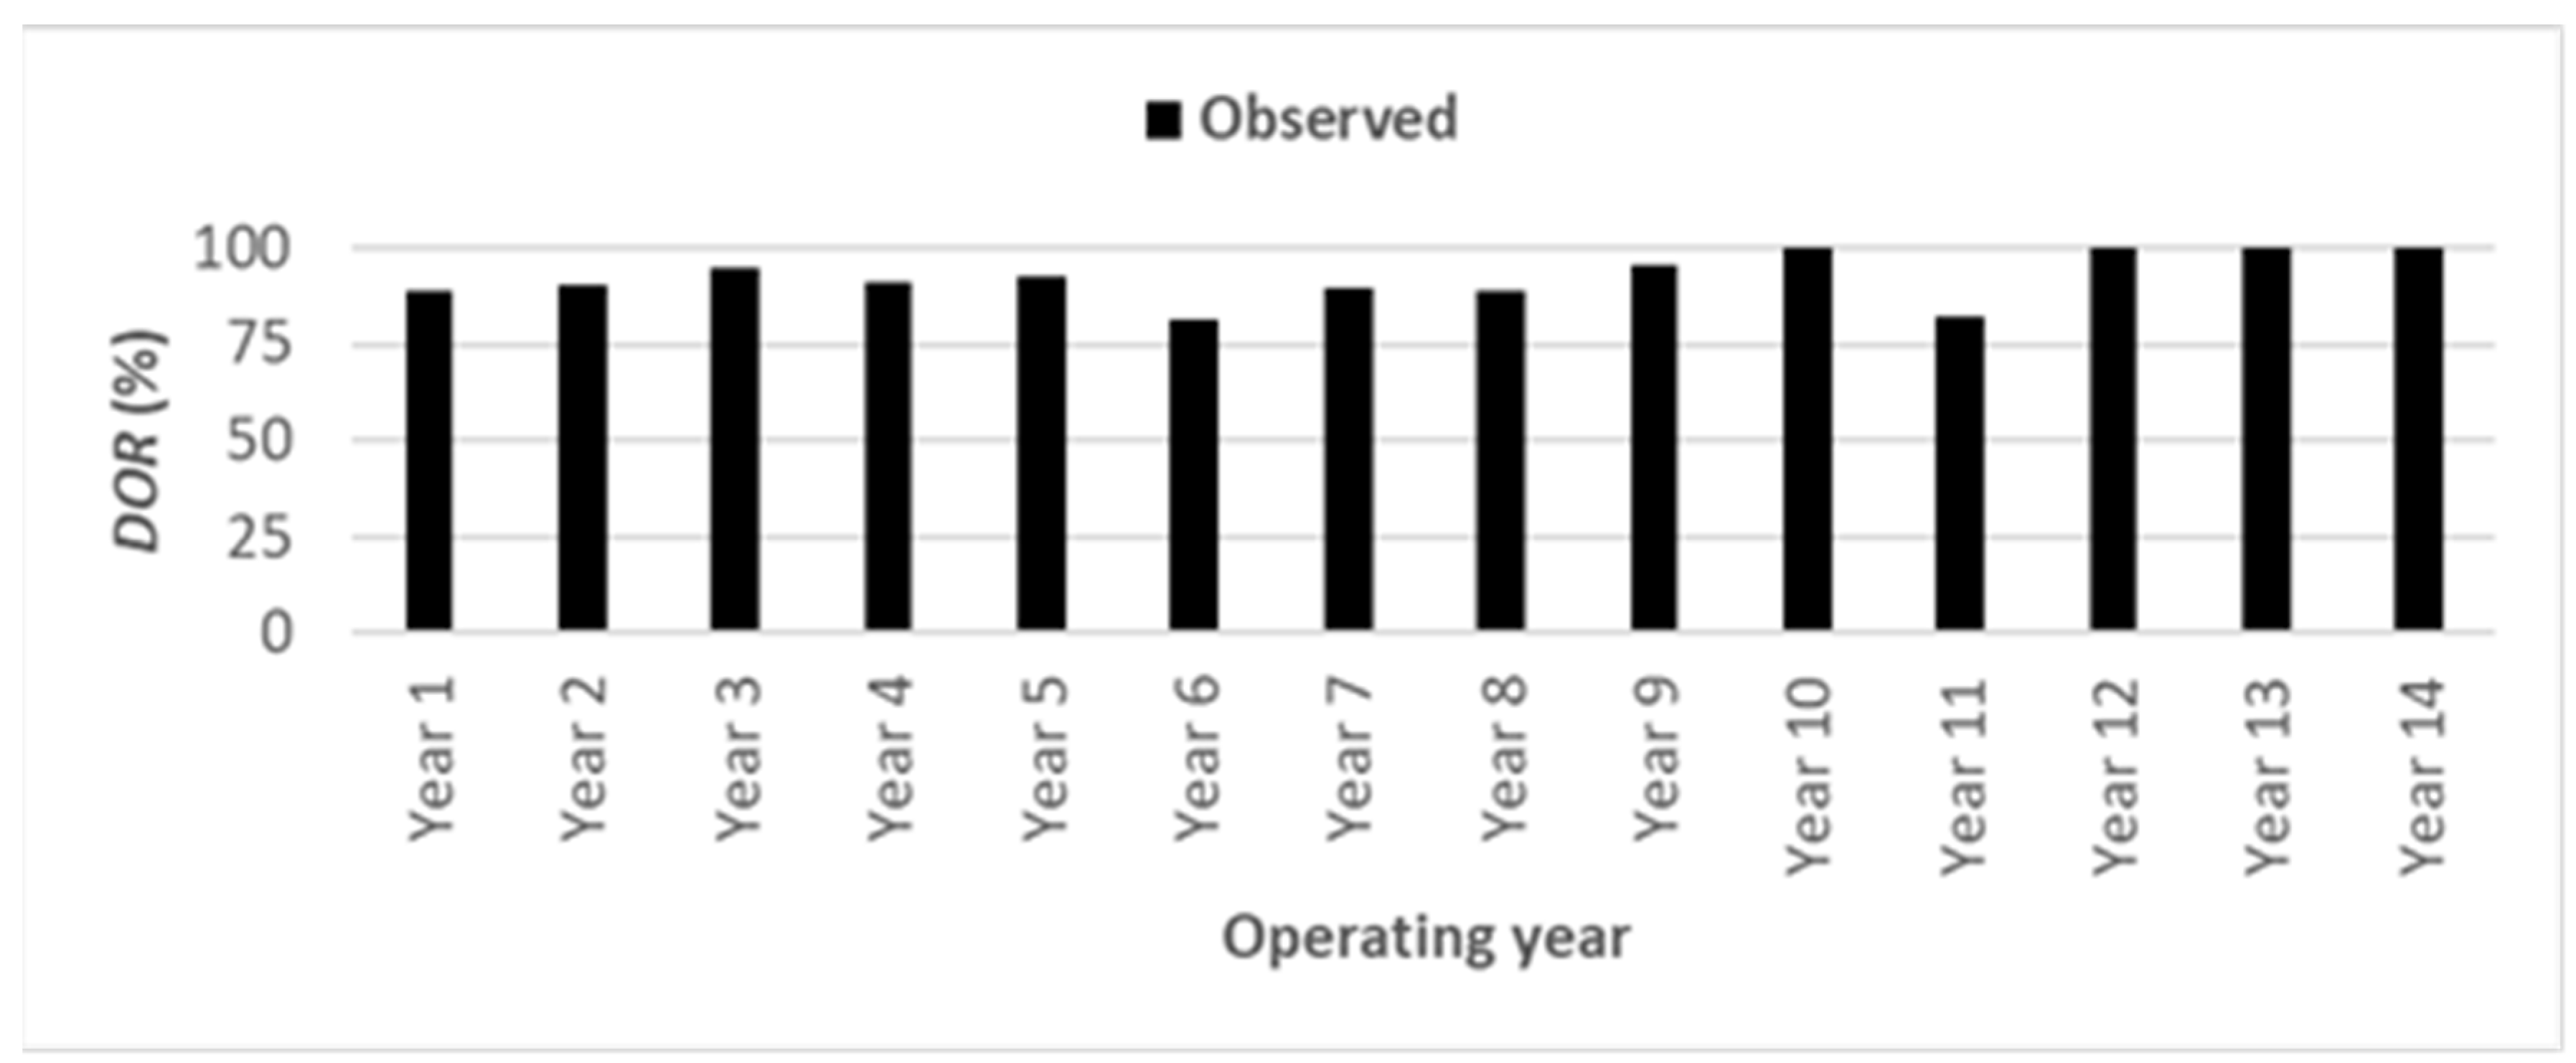
Figure 9,
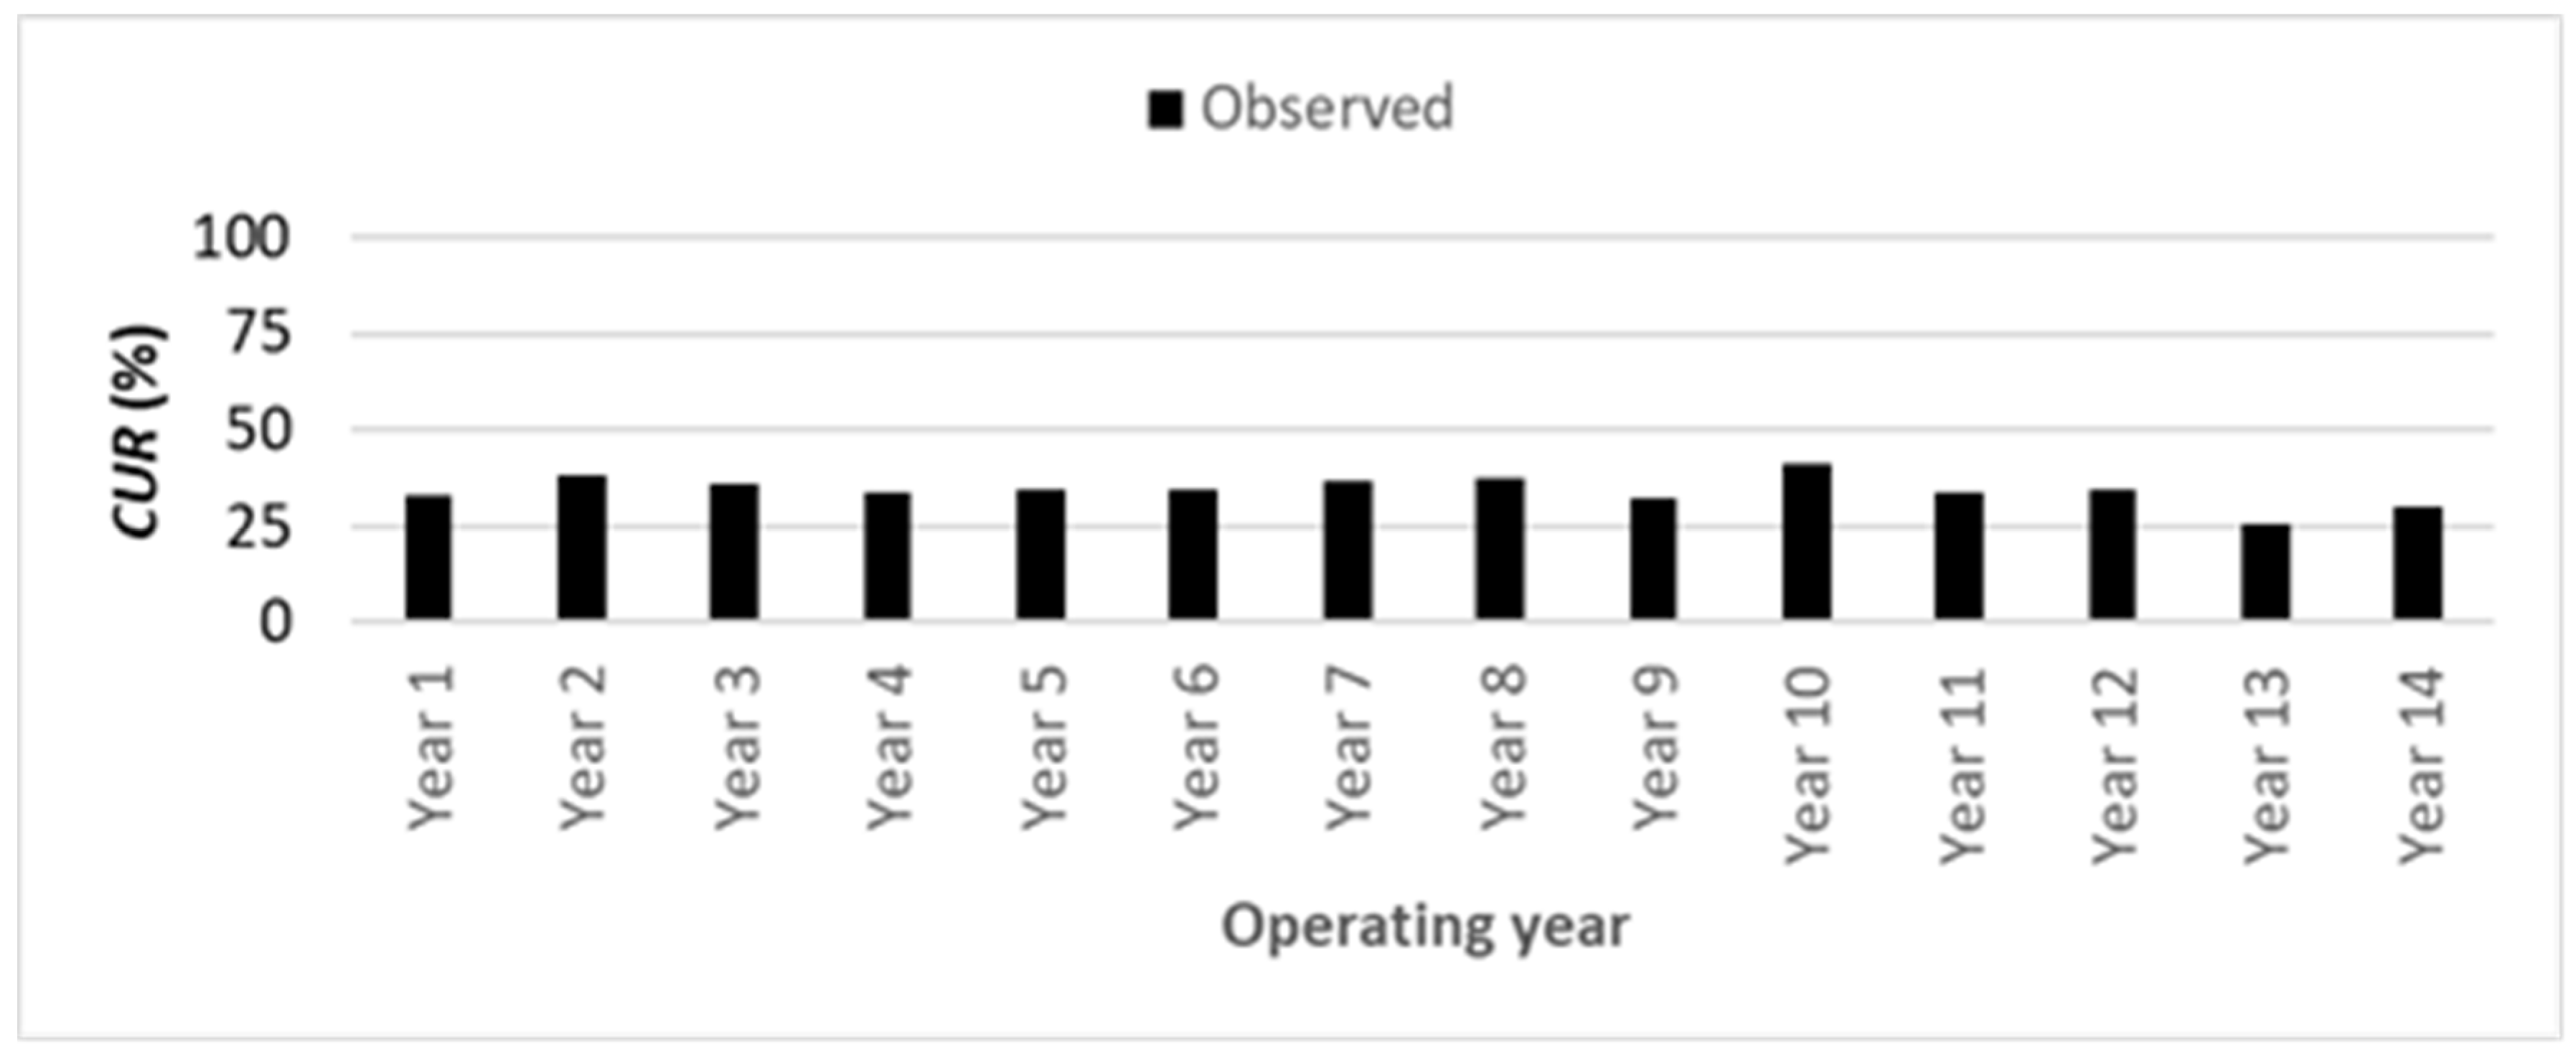
Figure 10,
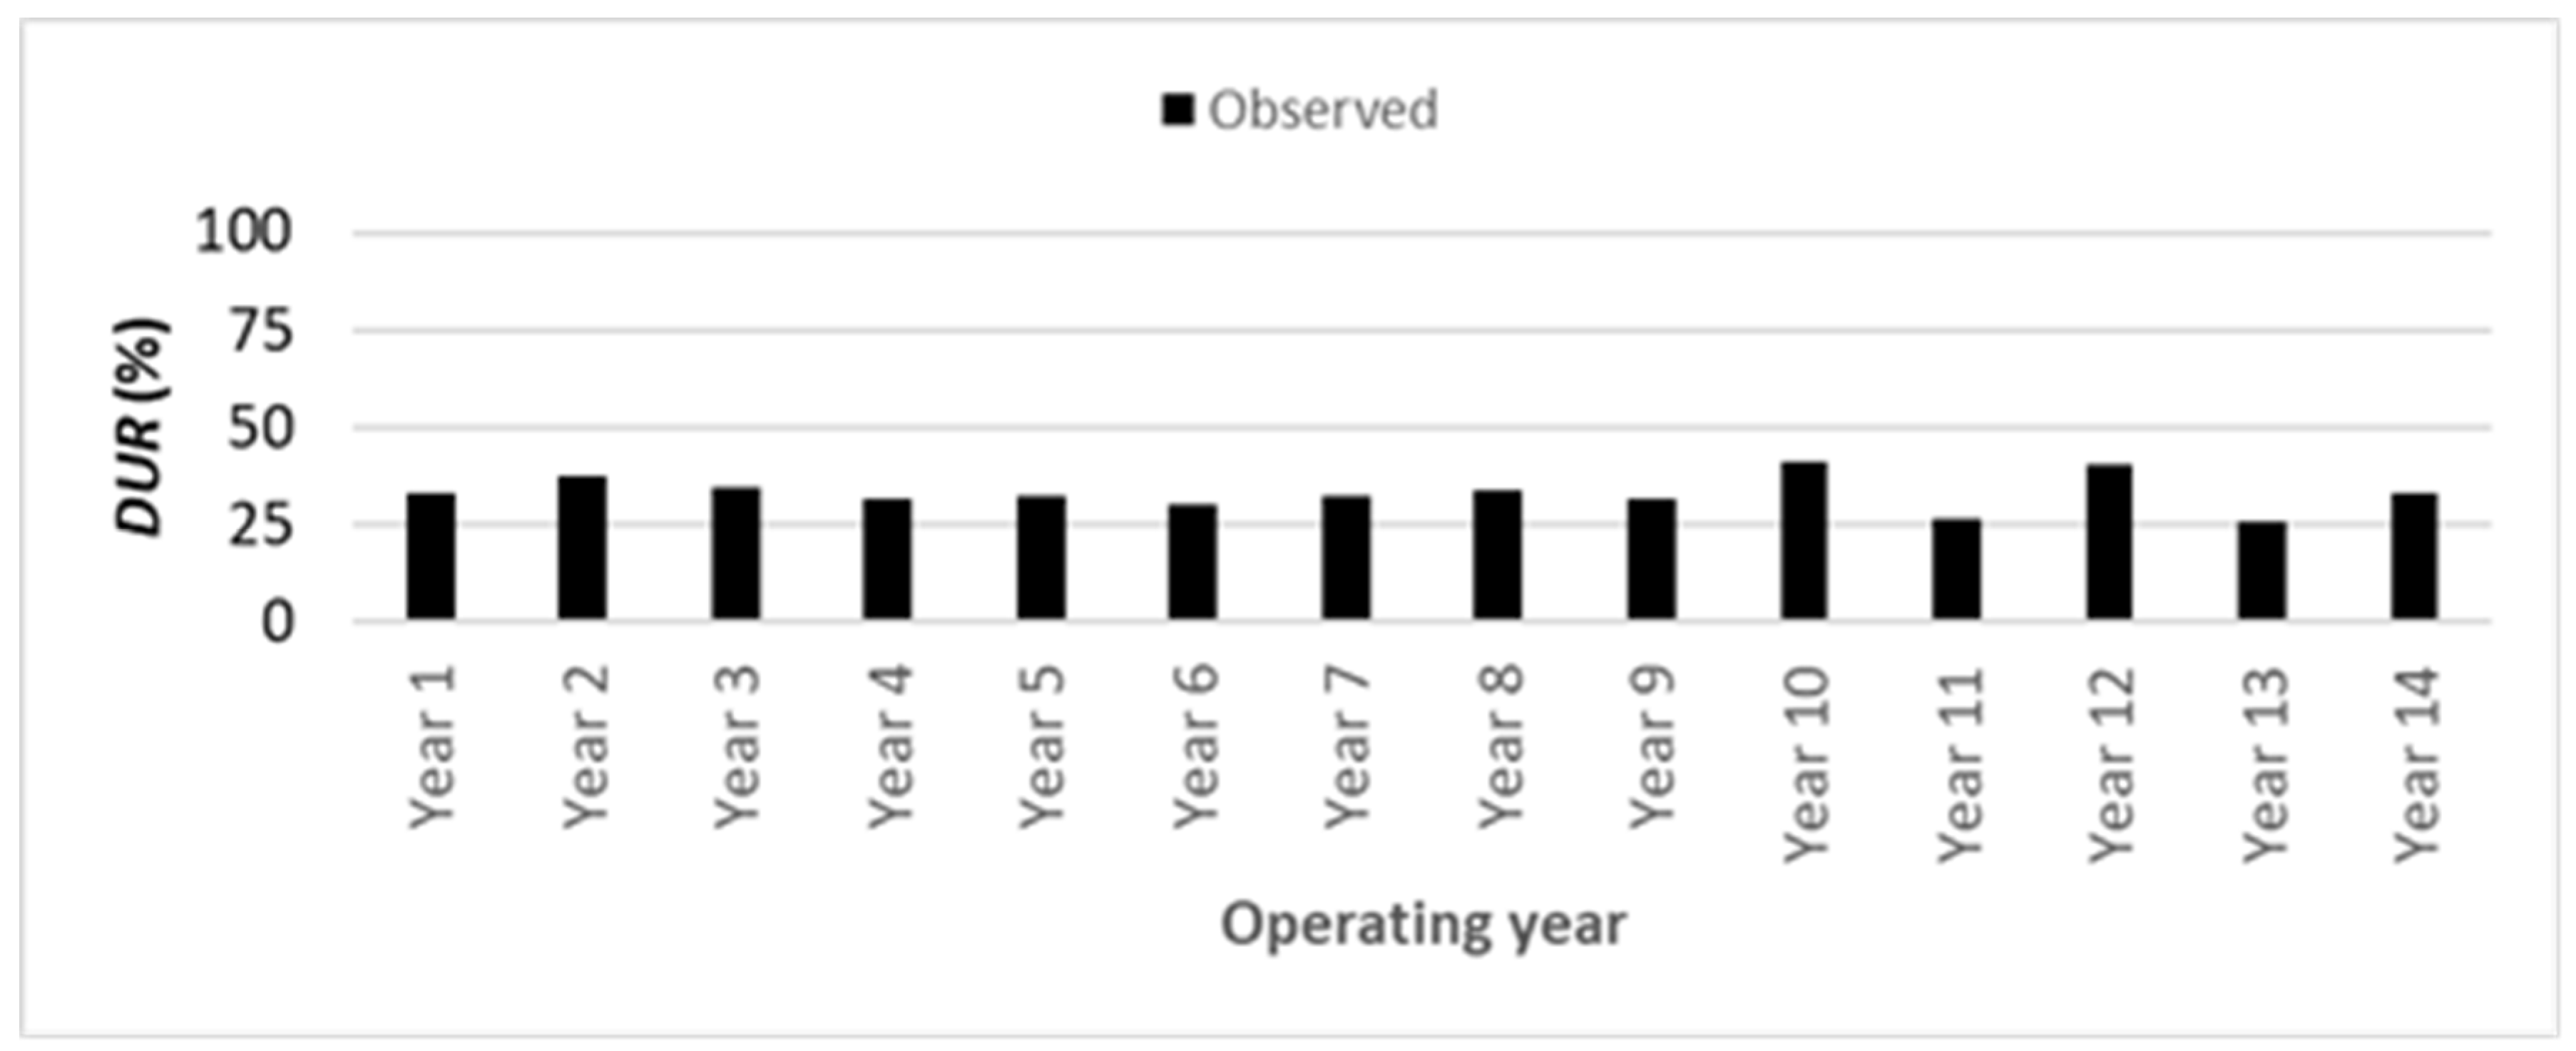
Figure 11 and
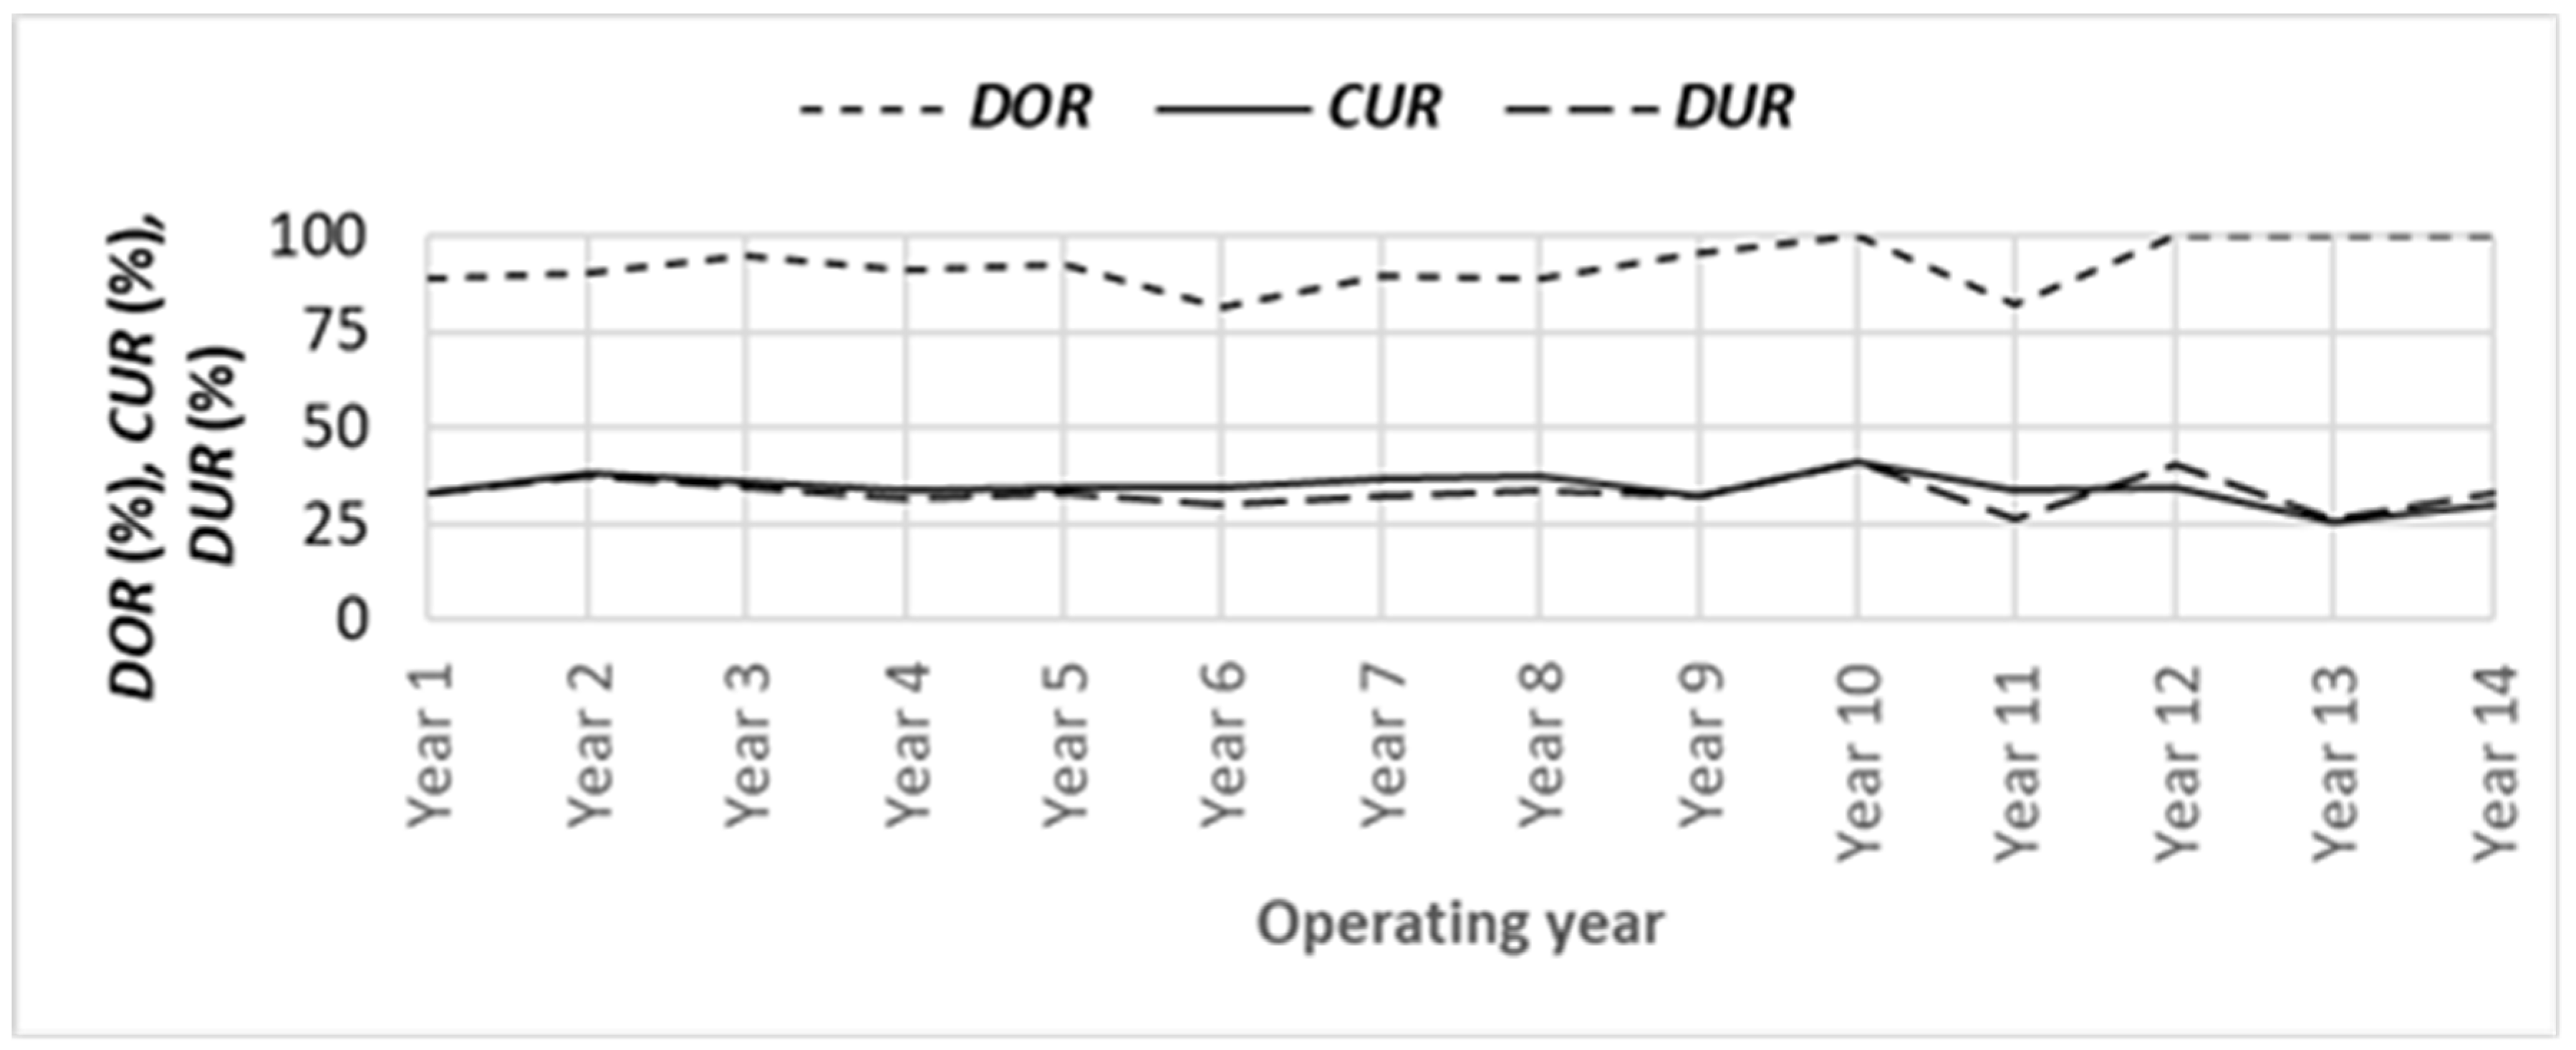
Figure 12 establish the yearly
DOR,
CUR and
DUR for drydock A. Figure 9 indicates that
DORs of drydock A are above 80%, including 100%, with an average of 94%. Figure 10 illustrates that the
CURs vary from 26% - 41%, with an average of 35%. Figure 11 shows that the
DURs differ from 26% - 42%, with an average of 34%. Figure 12 is constructed by combining
Figure 9,
Figure 10 and
Figure 11. These figures generally reveal that although the
DORs for the drydock are high (82% - 100%),
CURs and
DURs are still low.
Table 6 displays the PPIs of drydock B in the respective operating year.
Figure 13,
Figure 14,
Figure 15 and
Figure 16 establish the yearly
DOR,
CUR and
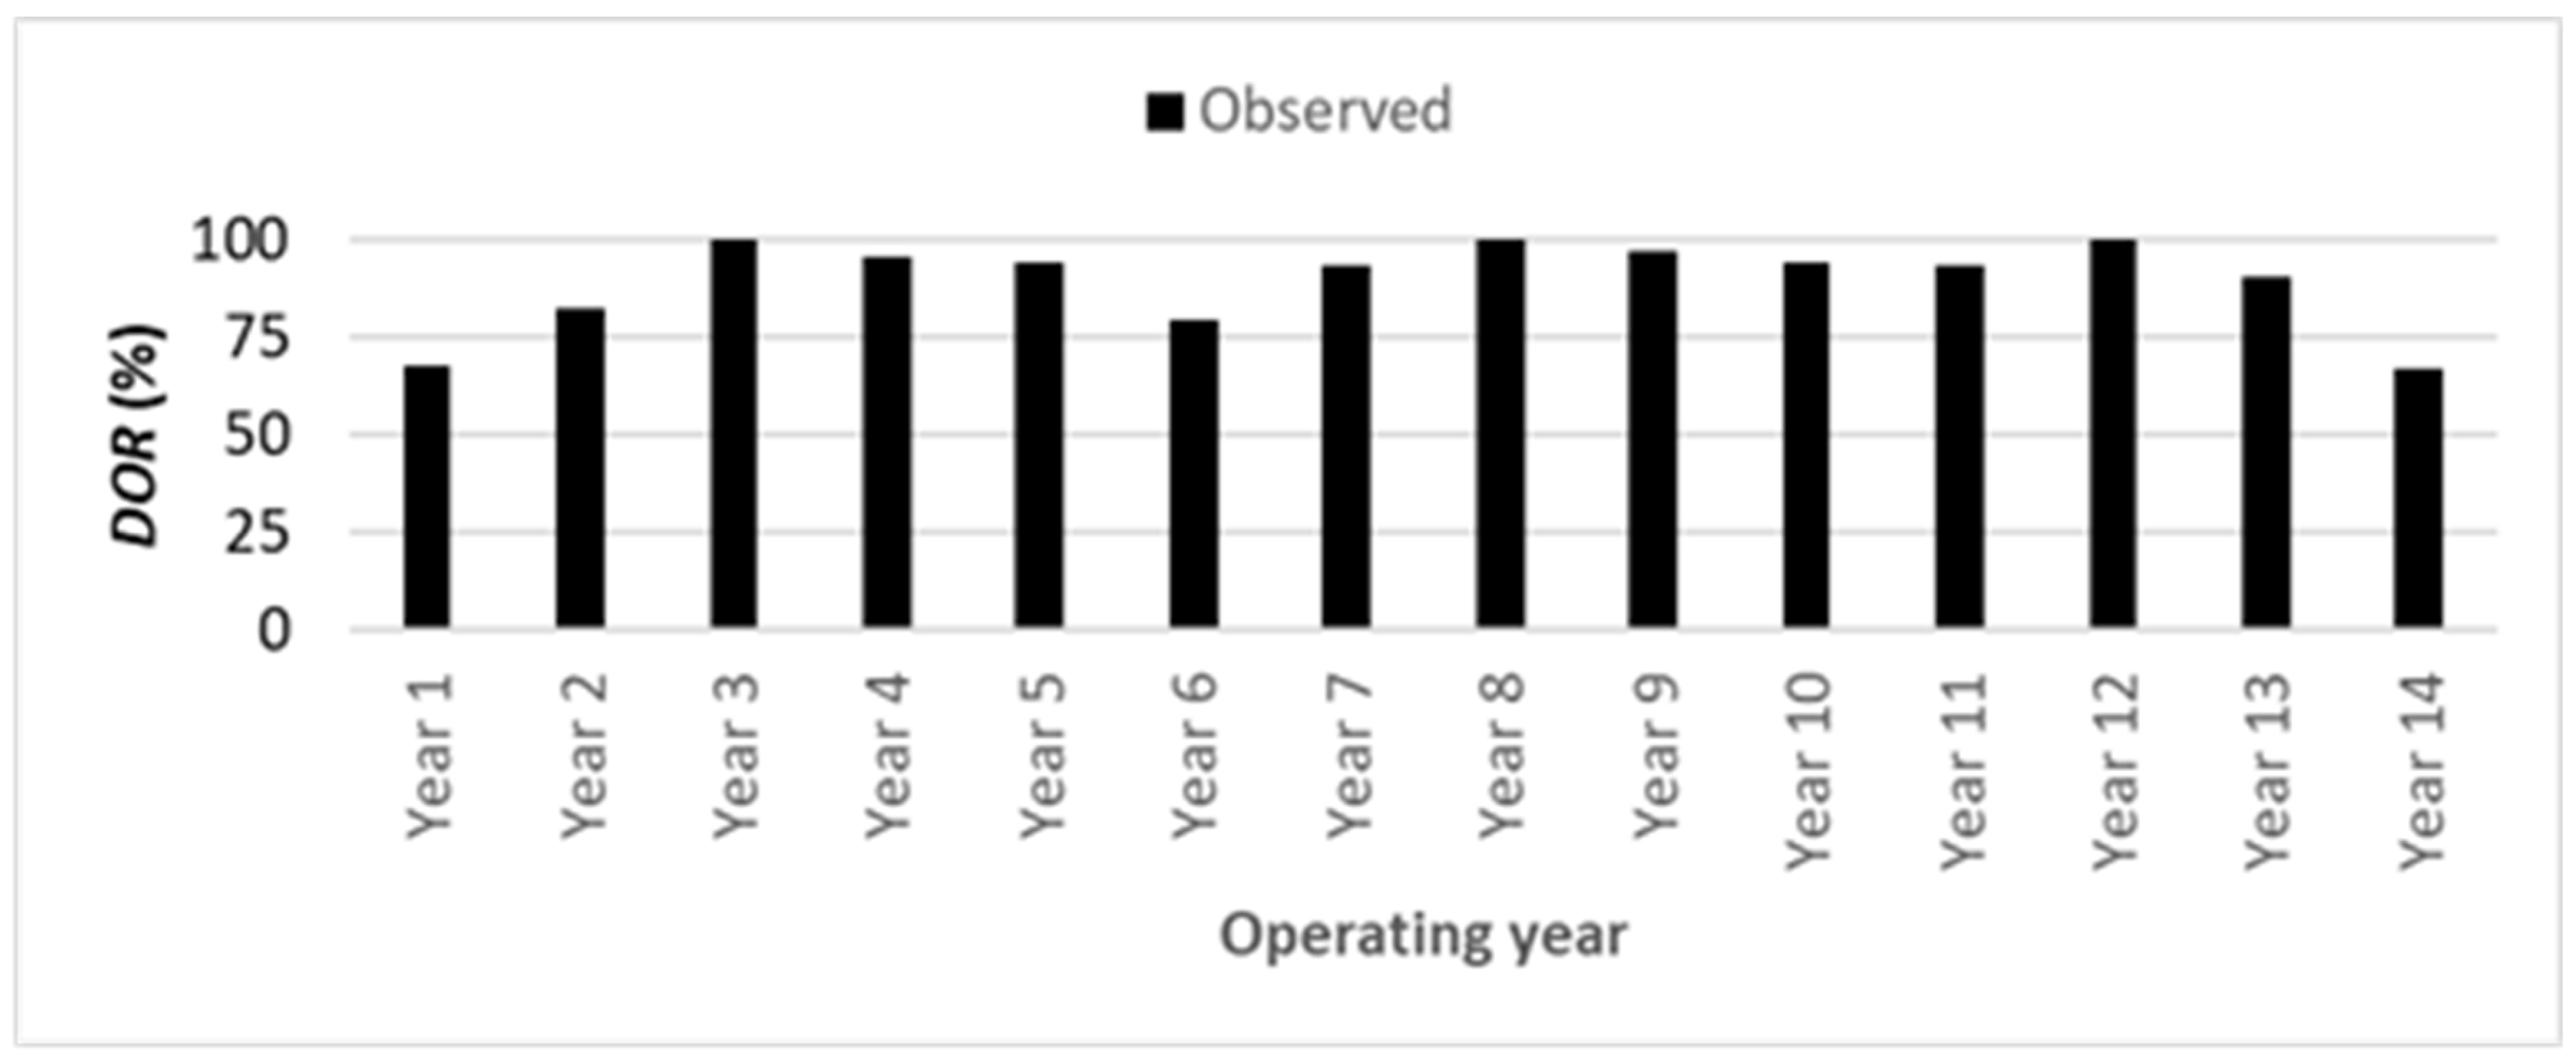
DUR for drydock B. Figure 13 demonstrates that
DORs of drydock B are above 67%, including 100%, with an average of 93%. Figure 14 displays that the
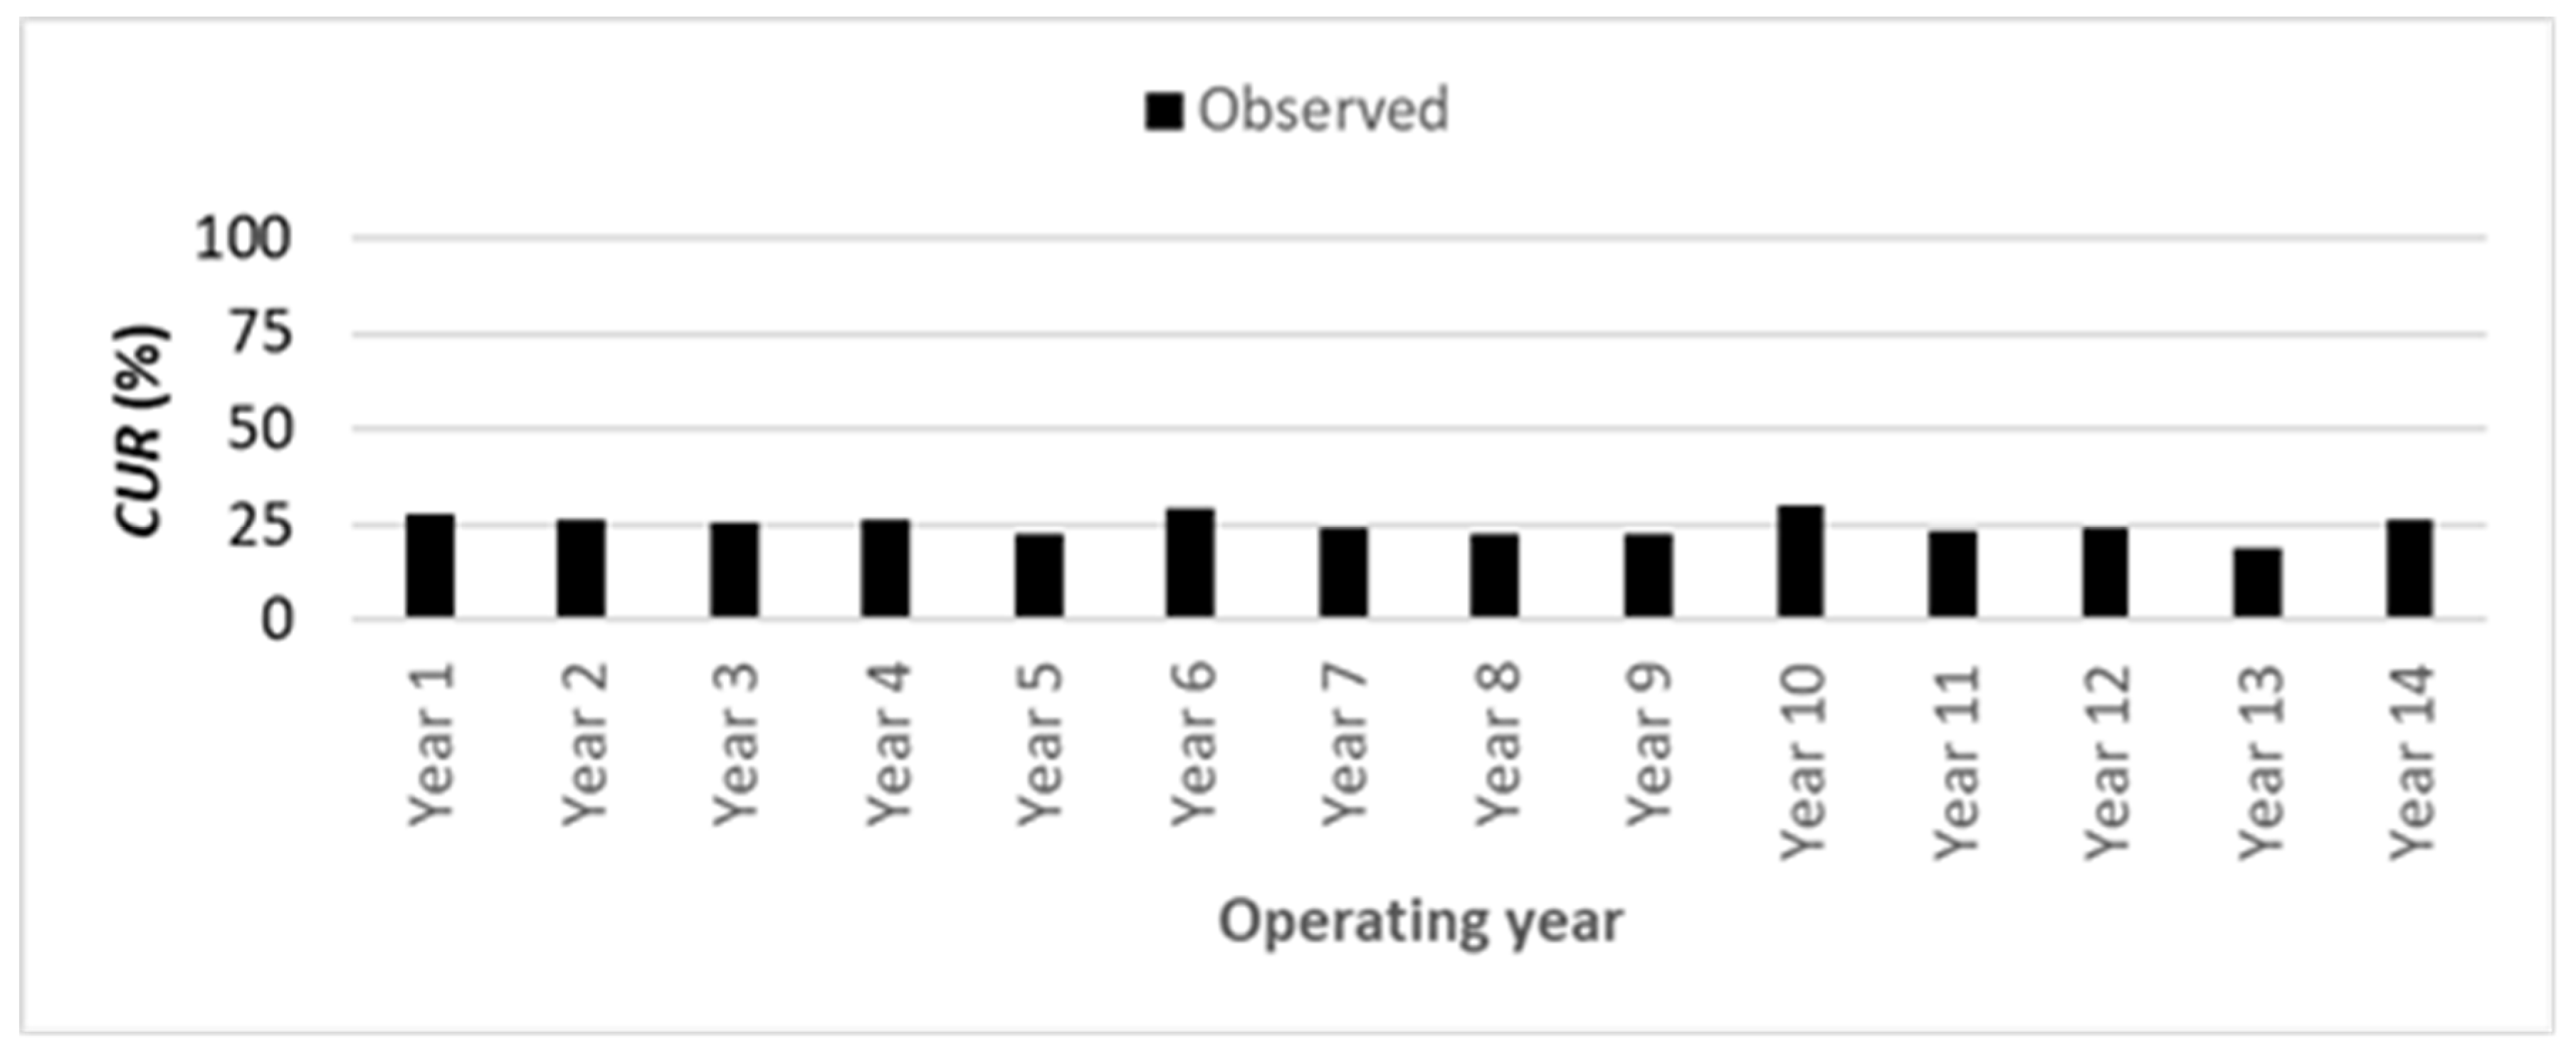
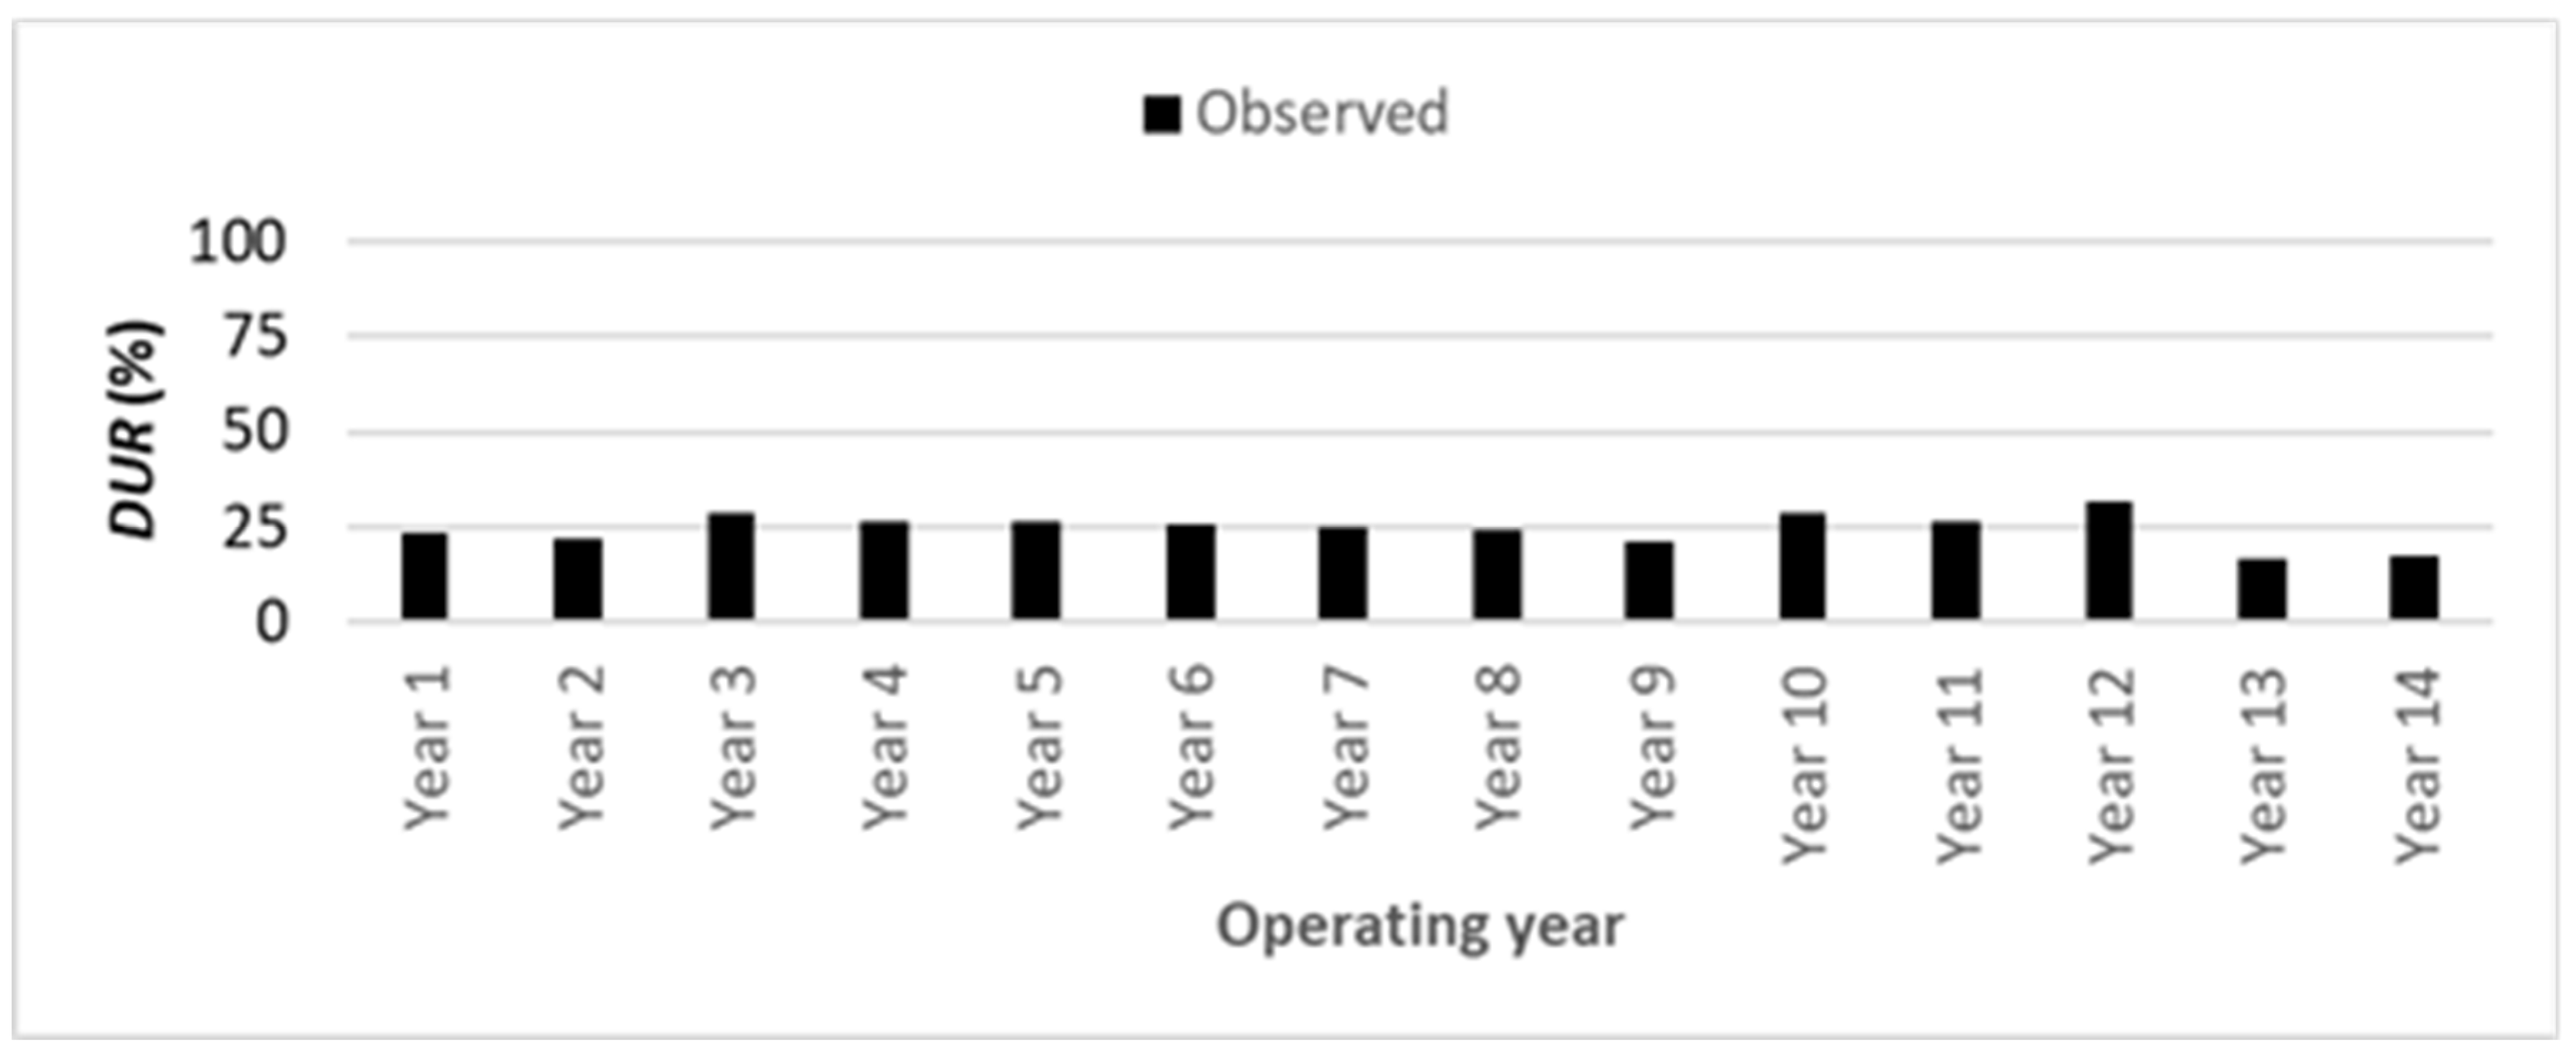
CURs vary from 19% - 30%, with an average of 25% for drydock B. Figure 15 presents that the
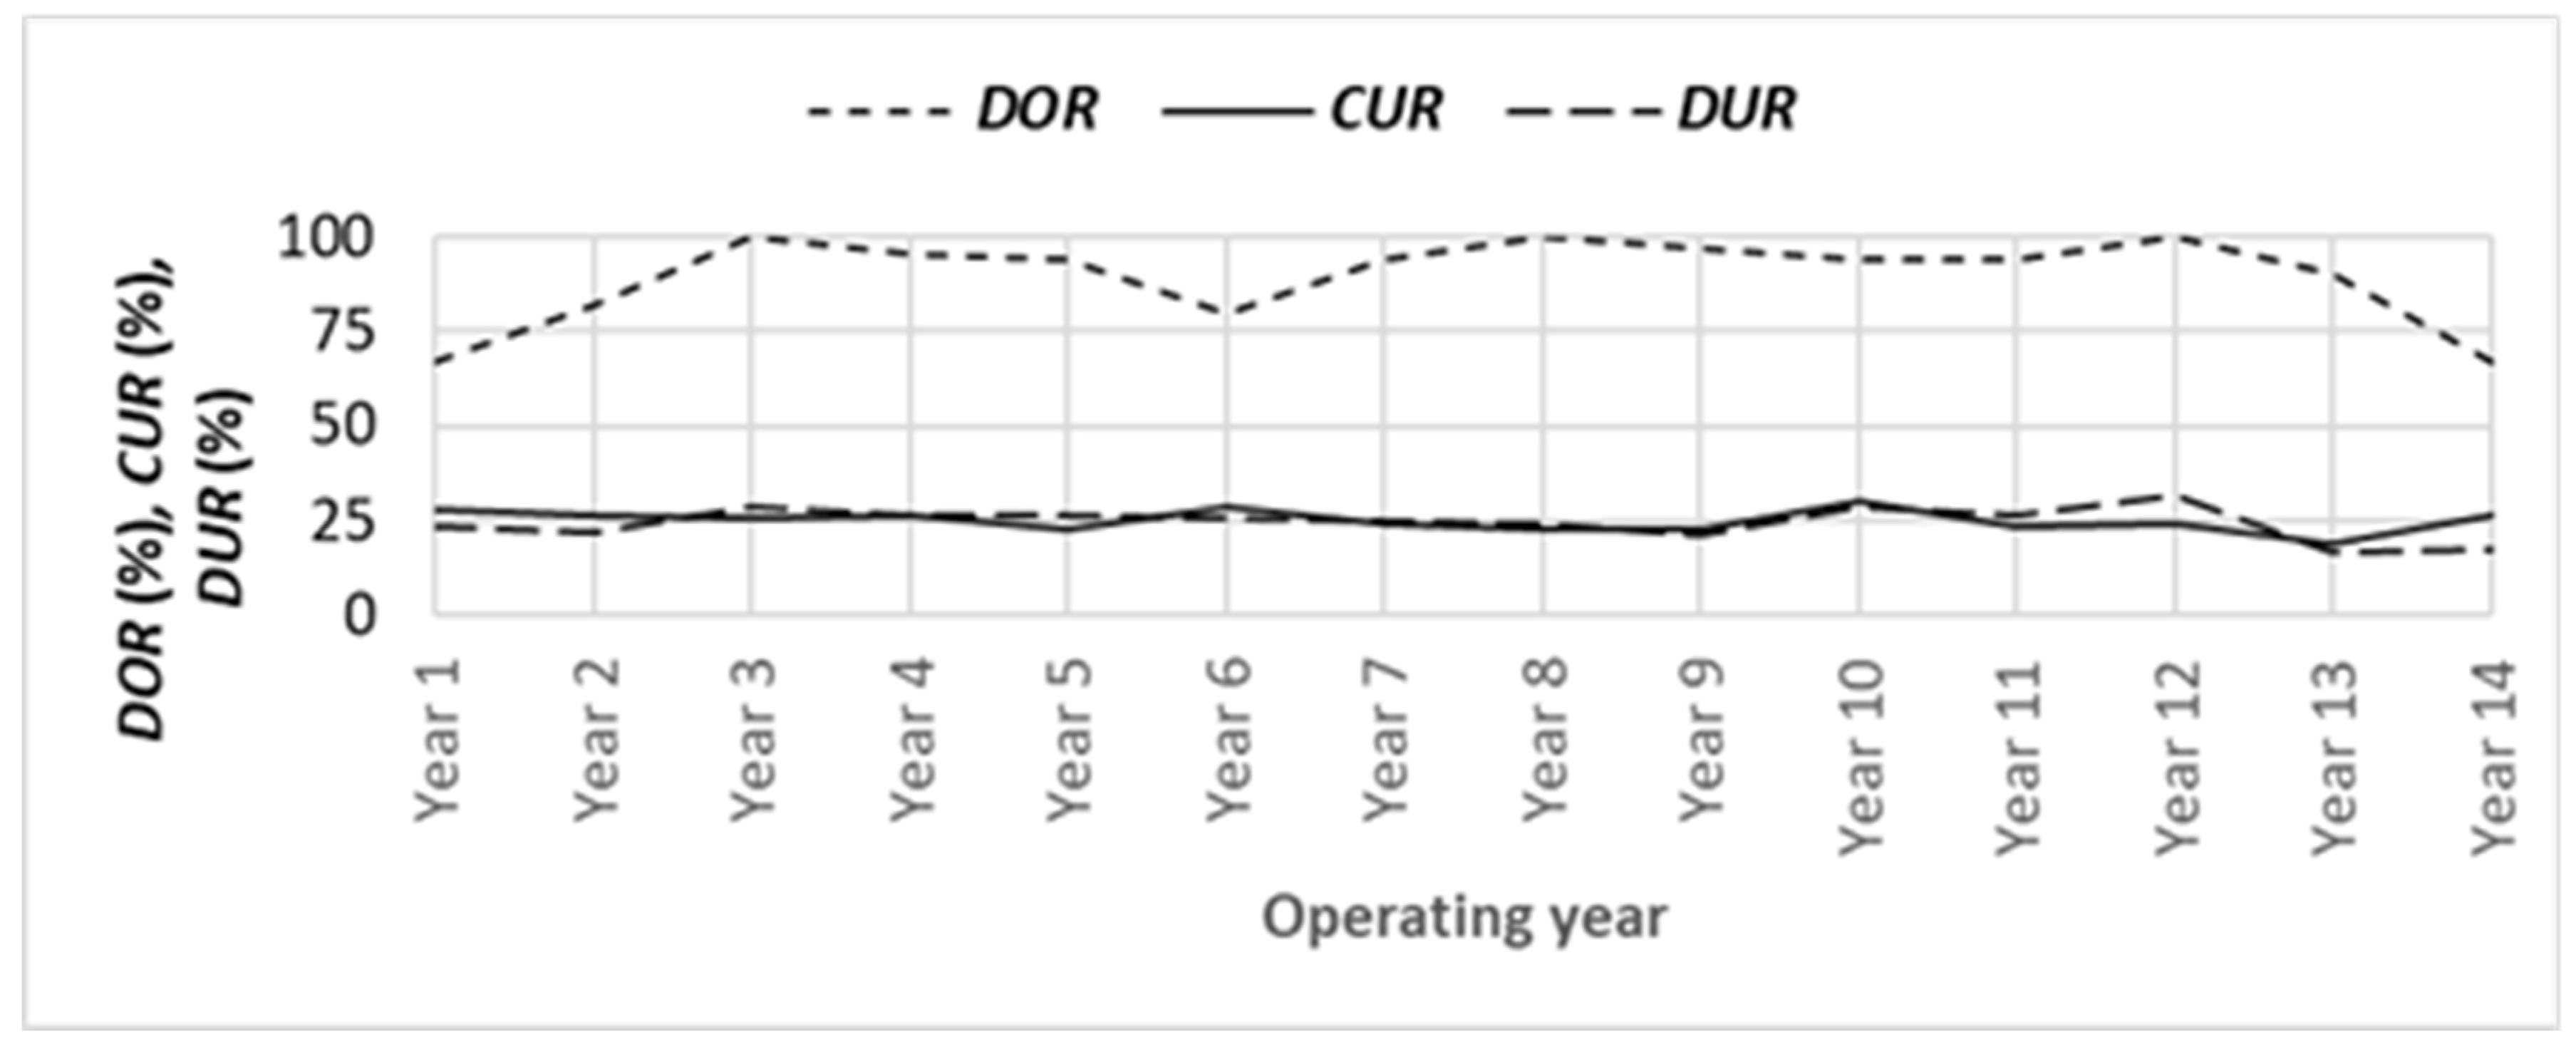
DURs differ from 17% - 31%, with an average of 25% for drydock B. Figure 16 is constructed by combining Figures13-15. All these figures generally reveal that although the
DORs for the drydock are high (67% - 100%),
CURs and
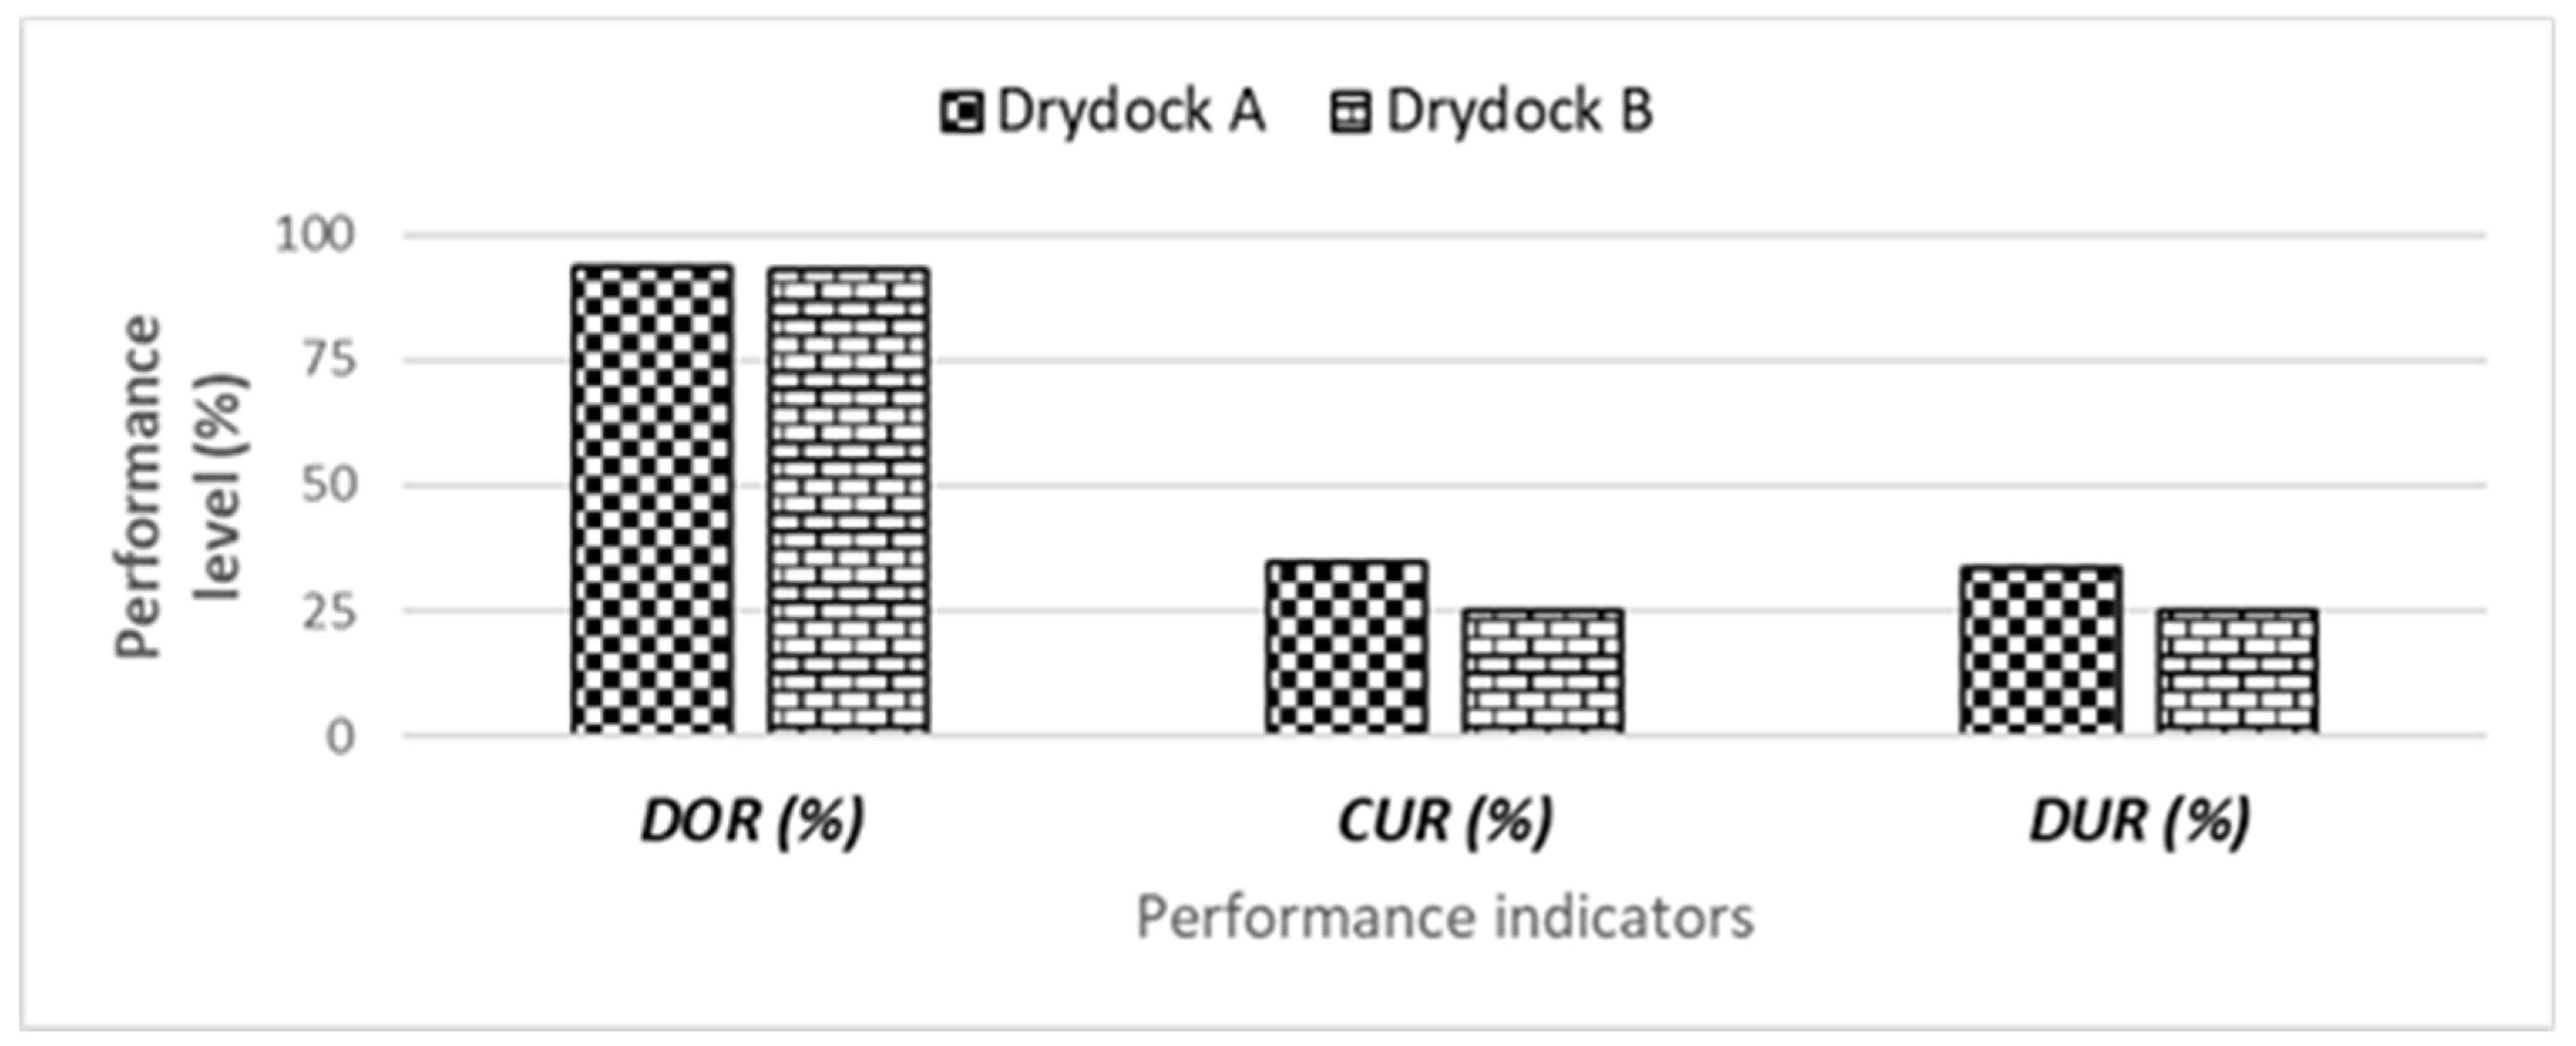
DURs are still low. Figure 17 offers the overall PPIs for drydock A and B for comparison.
Two types of problems might be responsible for situations highlighted in
Section 5.0 regarding the results of data analyses for drydocks A and B. They are external and internal. The external problem refers to the overall market situation due to the economic downturn and global business crisis beyond the control of shipowners and shipyards. This global crisis forces the owners and managers to reduce the expenditure for survival by reducing the scope of work during drydocking to a bare necessity to maintain the class certification. It also reduces the drydocking time, affecting the PPIs. Sometimes, the drydocking schedule is delayed too. The internal problem refers to the capacity of the drydock itself. Oversized drydocks always add more to the underutilization factor than the utilization factor. Moreover, during a global crisis, owners and managers rely on smaller vessels to minimize the losses, which ultimately affects the shipyard regarding the fulfilment of the target of the PPIs in terms of
CUR and
DUR, though
DOR is fulfilled.
6. Discussion
6.1. General
Some fundamental findings of drydocks A and B's physical performance indicators (PPIs) during the mentioned operating period (2008 to 2021) exist. Firstly, though the average drydock occupancy rates are pretty high (above 90%), the average capacity utilization rates and the average drydock utilization rates are comparatively meagre for drydocks A and B.
This phenomenon is mainly due to the following:
- i.
DOR is a direct function of total drydocking time during the operating period only, irrespective of the number of ships, deadweight of ships and drydock capacity (Equation 1),
- ii.
CUR is a direct function of the number of ships, total deadweight of ships during the operating period and drydock capacity irrespective of drydocking time (Equation 2),
- iii.
DUR is a direct function of ships' total deadweight x drydocking time during the operating period and drydock capacity (Equation 3).
Secondly, there were enough ships and drydocking days during operation years. Still, the corresponding deadweight was insufficient, resulting in low deadweight per ship and low generated deadweight per day, leading to lowly CUR and DUR, respectively.
Thirdly,
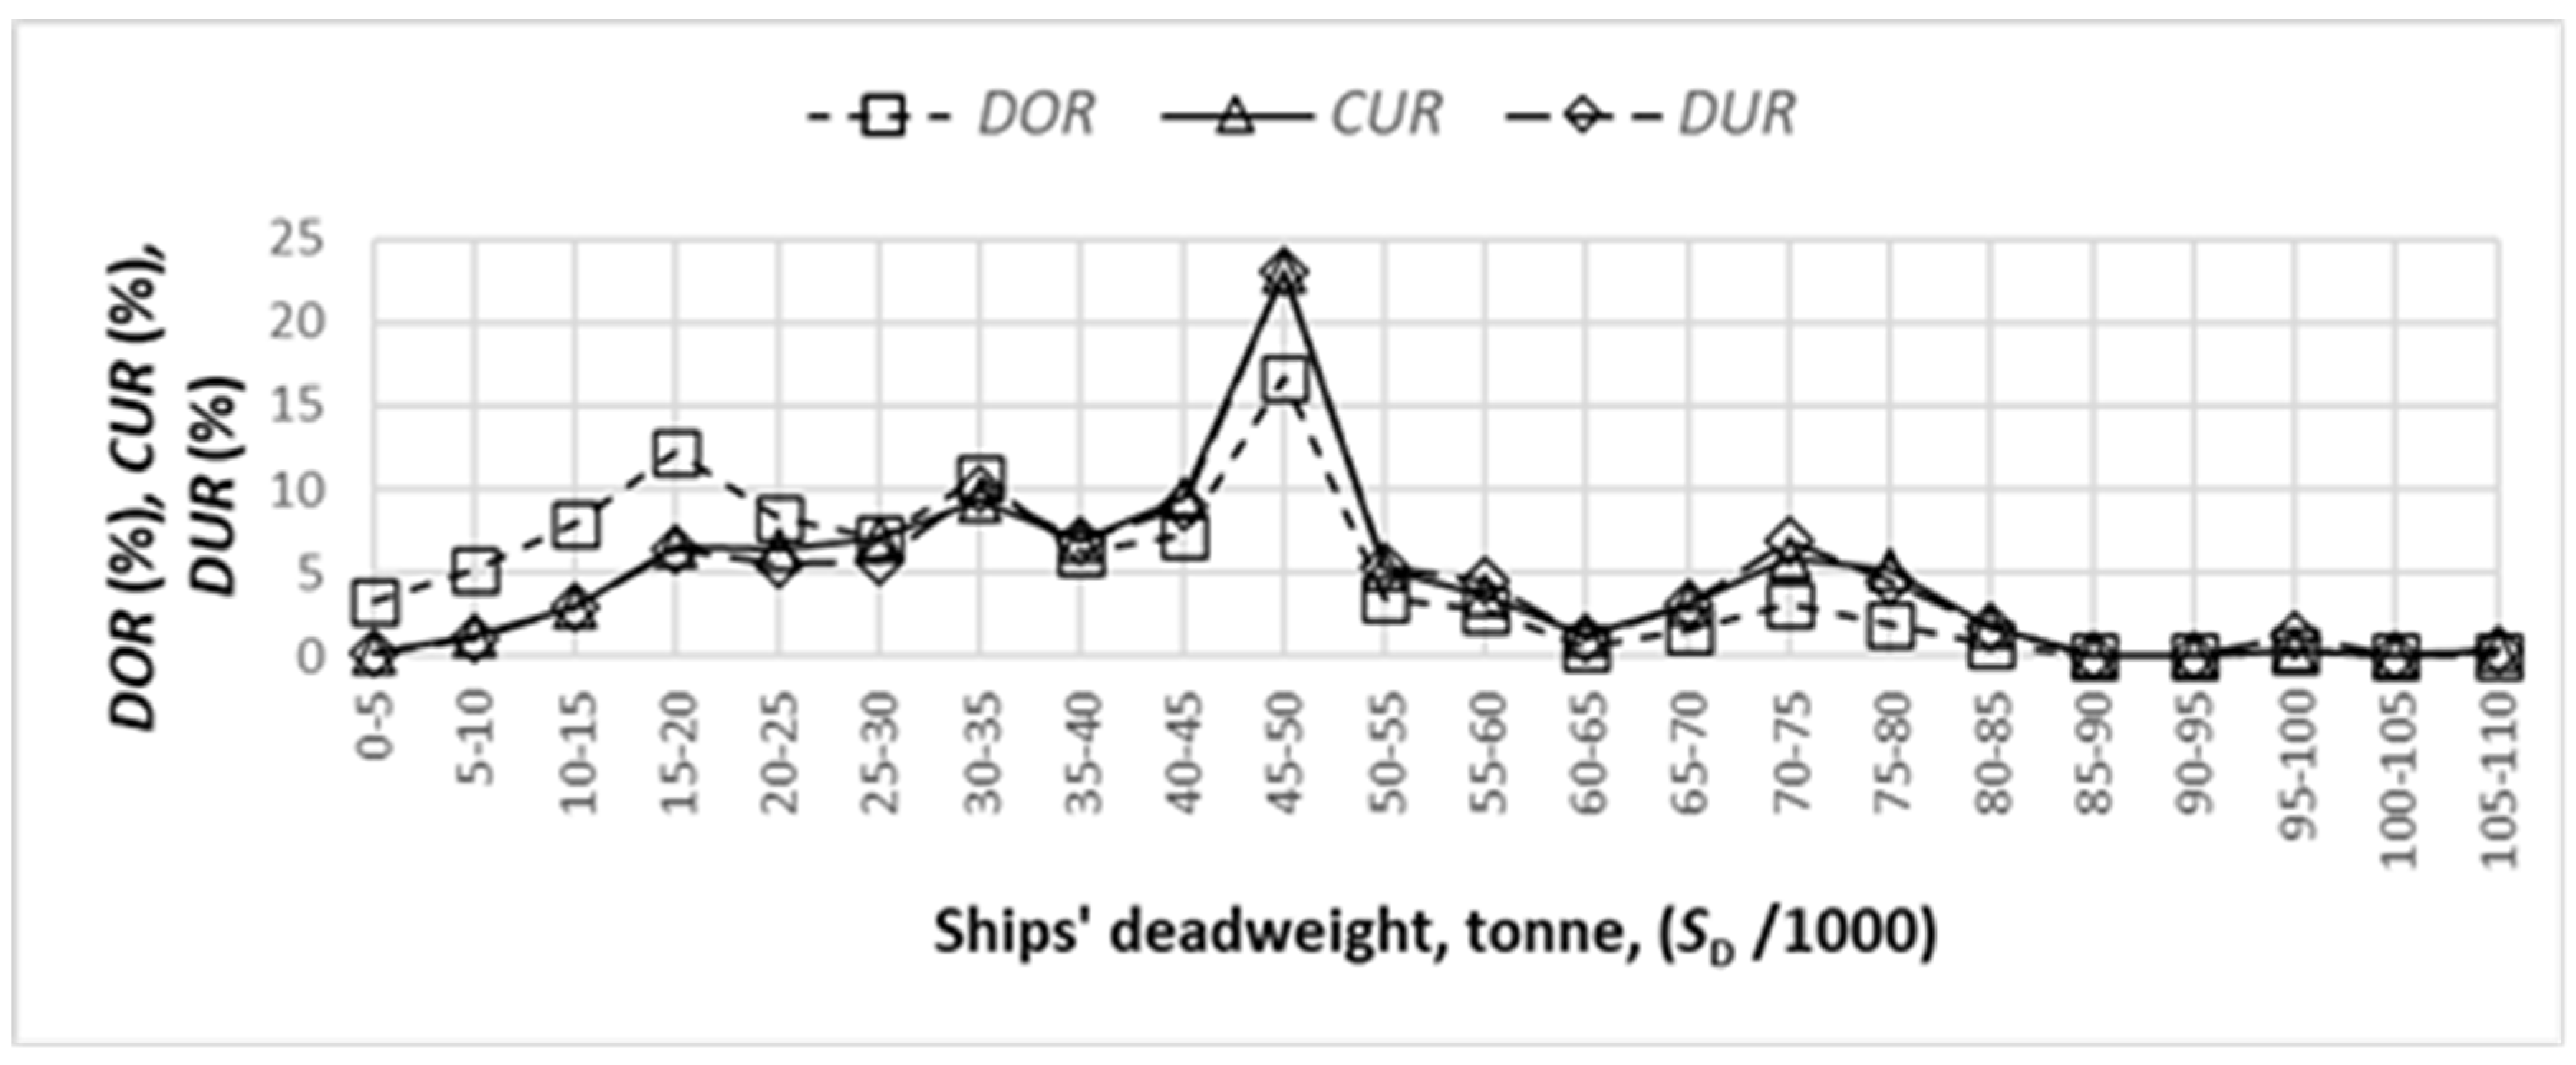
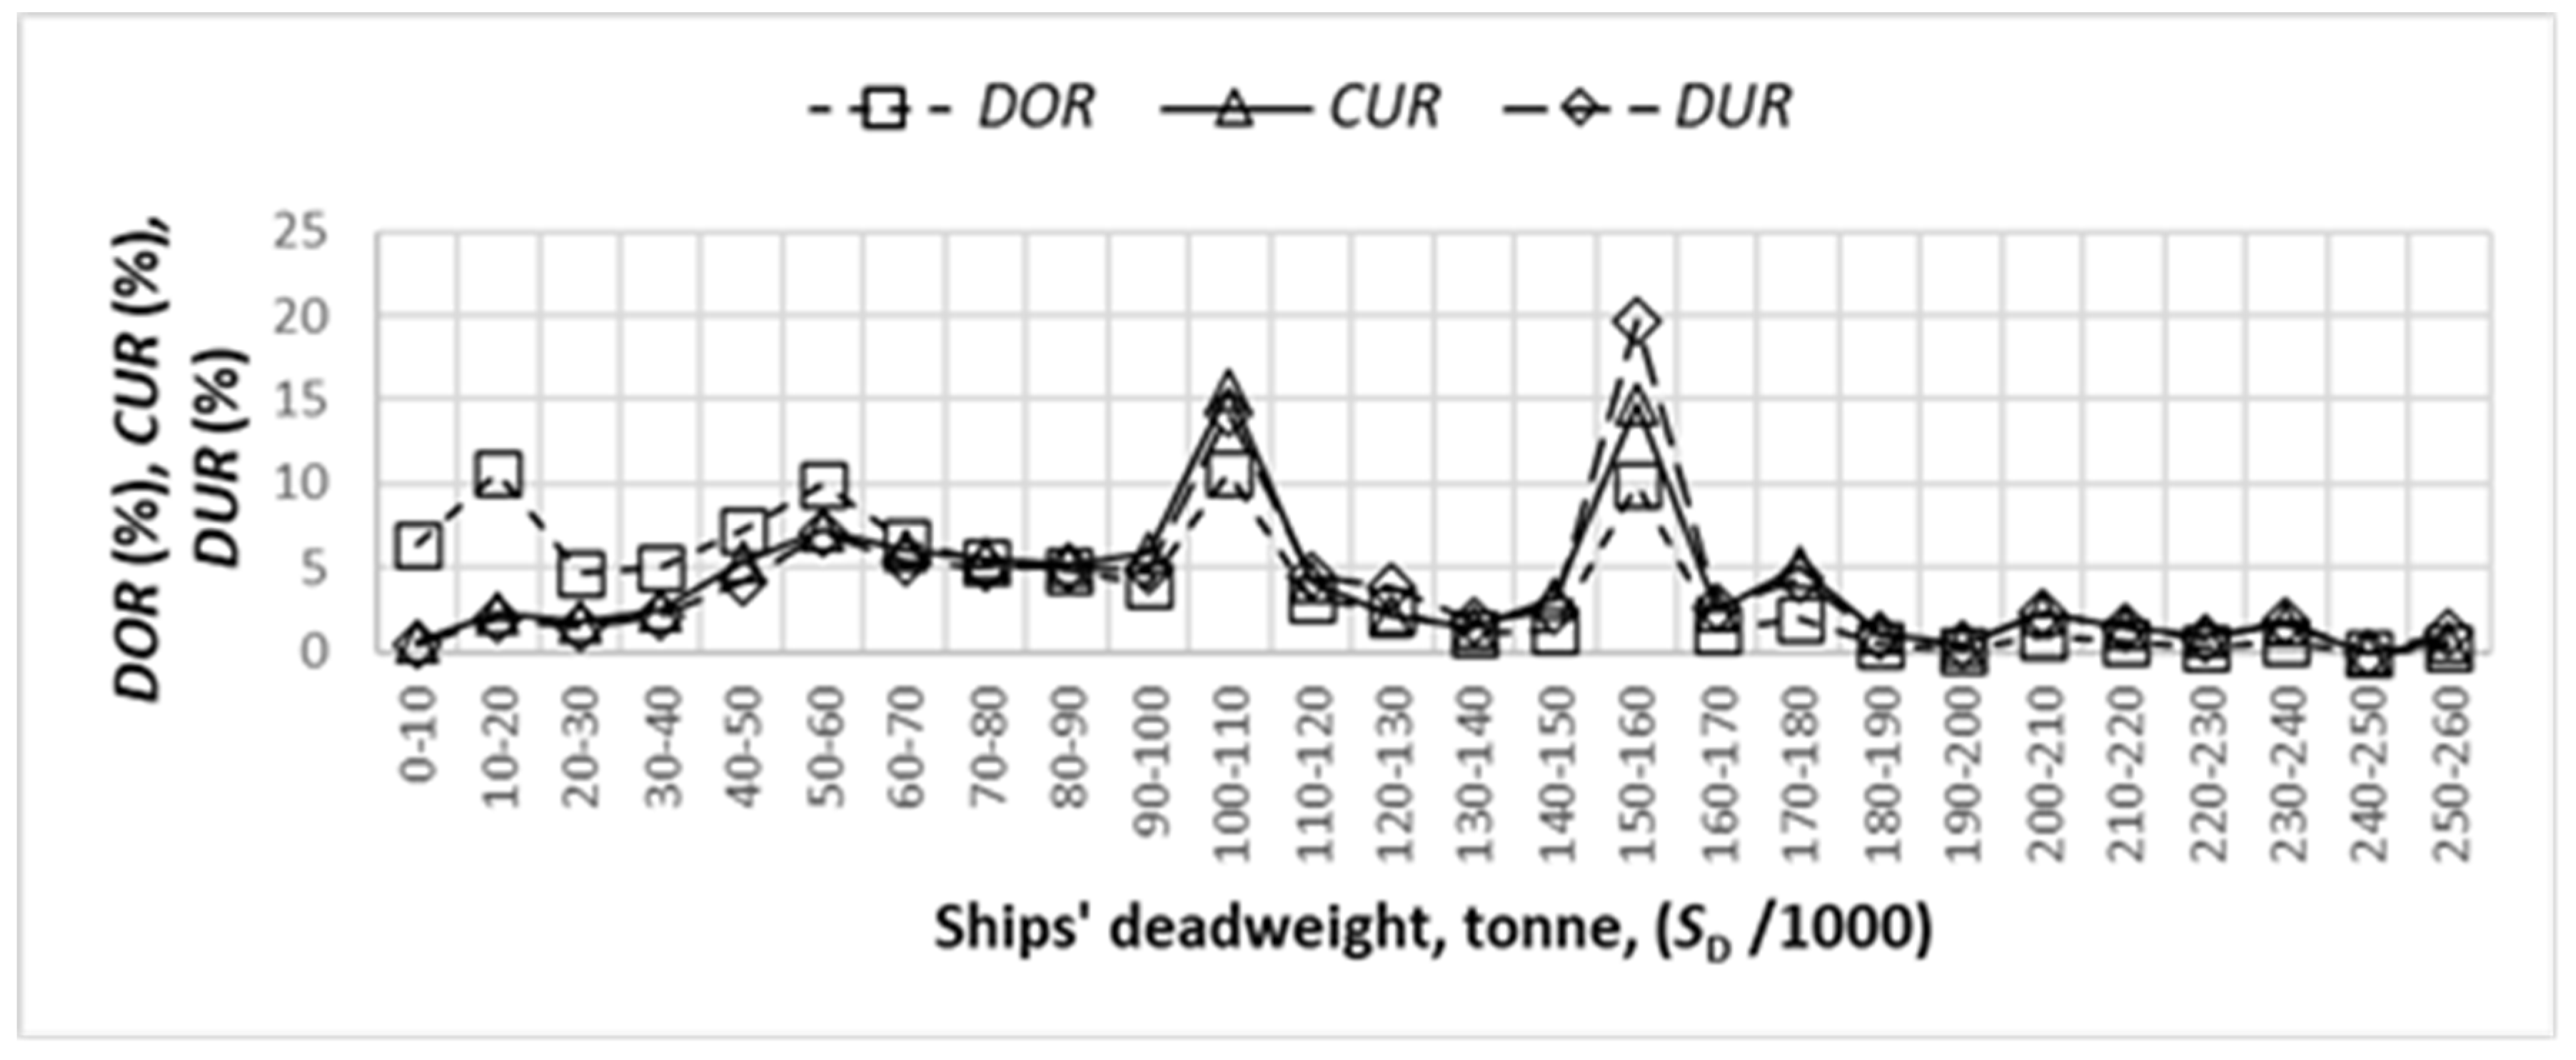
Figure 18 and
Figure 19 highlight
DOR,
CUR and
DUR against deadweight groups for drydocks A and B, respectively. It shows the contribution of deadweight groups to
DOR,
CUR and
DUR.
PPIs have identical behavior against the deadweight of drydocking ships (tonne) for drydocks A and B. This is mainly because they are strongly related to drydocking days, ship size (deadweight) and installed drydock capacity. This phenomenon agrees with Figures 1 and 5 for drydocks A and B, respectively, which display the low frequency of high-capacity ships resulting in low contribution in PPIs.
6.2. Drydock Occupancy Rate (DOR)
The annual drydock occupancy rate of drydock A appears to be above 80%, including 100% (Figure 9), with an average of 94% over the mentioned operating period. The annual drydock occupancy rate is only a function of the yearly total drydocking time. The more the drydocking time in a year, for example, (excluding empty time), the higher the DOR. Shipyards always try to keep the drydock busy (not empty), even if the vessel size is smaller than the drydock capacity during bad times. This action maintains the high drydock occupancy rate (DOR). However, on the other hand, this is one of the reasons for the low value of capacity utilization rate (CUR) and drydock utilization rate (DUR) even after having a high value of drydock occupancy rate (DOR). However, based on the drydock occupancy rate, drydock A performed well during the mentioned operating period (Figure 17).
The annual drydock occupancy rate of drydock B appears to be above 67% to 100% (Figure 13), with an average of 93% over the mentioned operating period. The probable reasons for good performance are similar to those for drydock A. However, based on the drydock occupancy rate, drydock B performed well during the mentioned operating period (Figure 17).
6.3. Capacity Utilization Rate (CUR)
The annual capacity utilization rate of drydock A varied from 26% to 41% (Figure 10), with an average of 35%, and appears to be low. Overall, 35% of the installed capacity of drydock A (96,000 tonnes) was utilized during the mentioned operating period. The annual capacity utilization rate is a function of ship size (average deadweight) using the drydock and the installed drydock capacity (tonne), irrespective of drydocking time. The bigger the average deadweight of docking ships, the higher the capacity utilization rate (
CUR). During bad times, shipyards are forced to accept smaller ships than the drydock capacity instead of keeping the drydock empty, thus adding a little bit to its capacity utilization target. It is worth mentioning that the oversized drydock may also cause this type of situation. Mathematically, an oversized drydock reduces the capacity utilization rate. Types of ships also have an impact on the average deadweight per ship.
Table 1 shows that crude oil tankers contribute the most and container carriers contribute the least deadweight for a similar principal dimension. However, based on the observed capacity utilization rate, drydock A did not perform well due to the installed capacity of the drydock and the available size of ships.
The annual capacity utilization rate of drydock B varied from 19% to 30% (Figure 14), with an average of 25%, and appeared to be low. Overall, 25% of the installed capacity of drydock B (296,000 tonnes) was utilized during the mentioned operating period. The probable reasons for this situation are similar to that for drydock A. Those are equally applicable for drydock B, too.
6.4. Drydock Utilization Rate (DUR)
The annual drydock utilization rate of drydock A varied from 26% - 42% (Figure 11), with an average of 34%, which appeared to be very low. Overall, 34% of the available facilities (96,000 tonnes per day) were generated with various combinations of deadweight and drydocking time of drydocking ships during the operating period. The annual drydock utilization rate is a function of the generated deadweight (deadweight per day) and the drydock installed capacity (tonne). The more the generated deadweight, the higher the drydock utilization rate. Smaller ships reduce the deadweight per day, and bigger ships increase the deadweight per day. Similarly, less drydocking time (in the case of idle drydock time) reduces the deadweight per day and vice versa. Mathematically, a large drydock increases the available deadweight daily and reduces the drydock utilization rate. The drydock utilization rate depends entirely on ships’ deadweight, drydocking days and installed drydock capacity for the yearly operating period. Types of ships play a part, as explained by CUR. However, based on the drydock utilization rate, drydock A did not perform well, probably due to the available size of ships and drydock installed capacity.
The annual drydock utilization rate of drydock B varied from 17%-31% (Figure 15) to an average of 25% and appeared to be very low. Overall, 25% of the available facility (296,000 tonnes per day) was generated with various combinations of deadweight and drydocking time of drydocking ships during the operating period. The probable reasons for this situation are similar to that for drydock A. Those are equally applicable for drydock B, too.
Referring to Figure 1 and as explained in
Section 4.0, 99% of ships called on drydock A are within the 80,000 tonnes deadweight range and used only 35% of the drydock capacity. In other words, 99% of ships used only 35% of the drydock installed capacity. The remaining 65% of drydock capacity was seriously under-utilized and contributed to lowering the
CUR and
DUR. Therefore, a lower-capacity drydock would have been a better choice.
Based on the drydocking history of drydock A, a set of better PPIs could have been achieved with a drydock having lesser installed capacity.
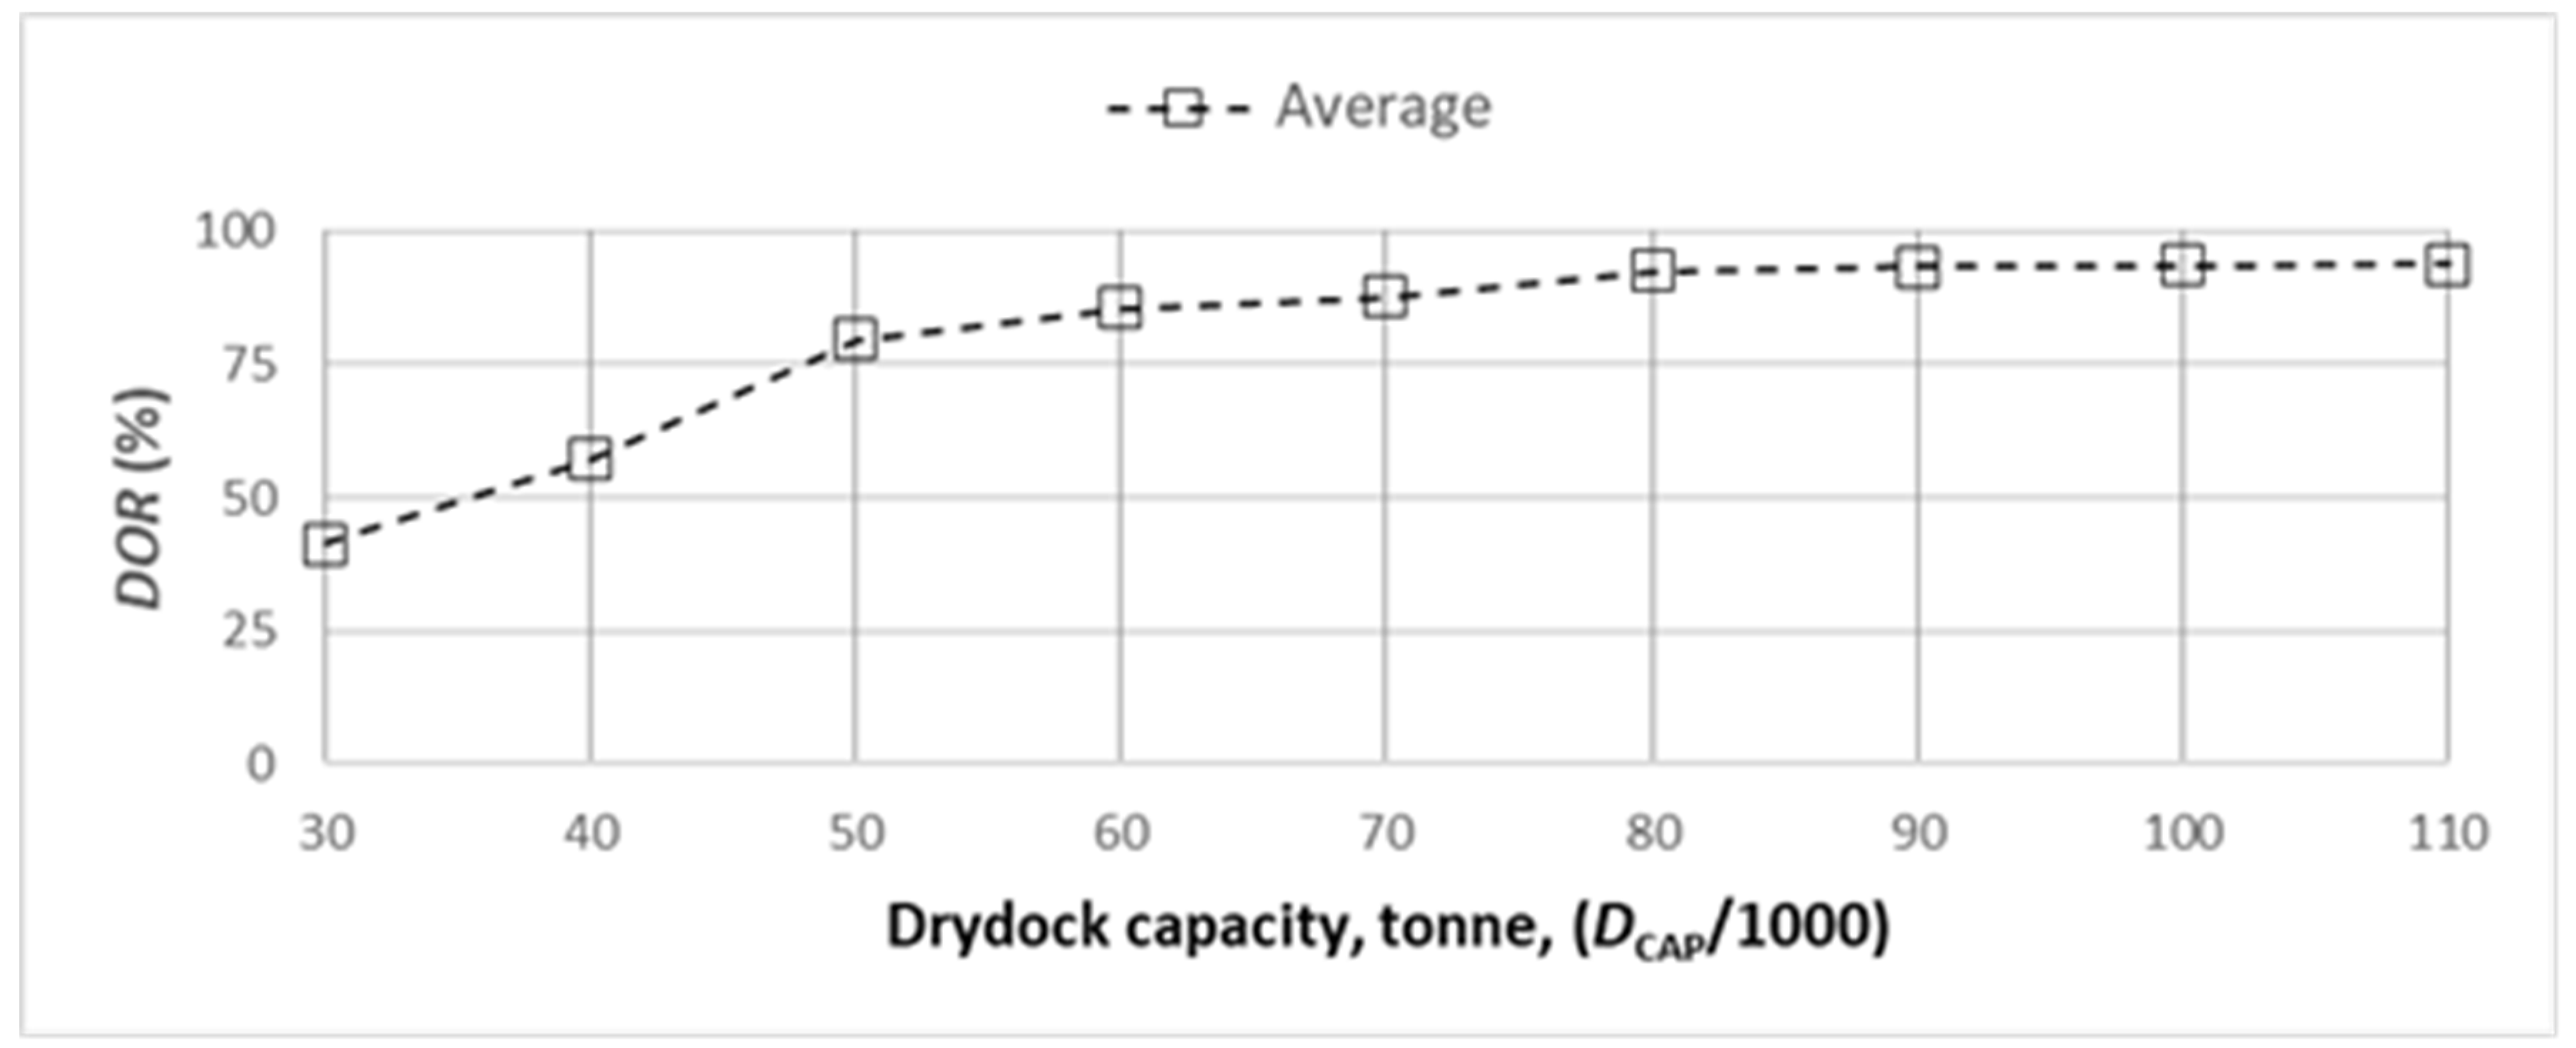
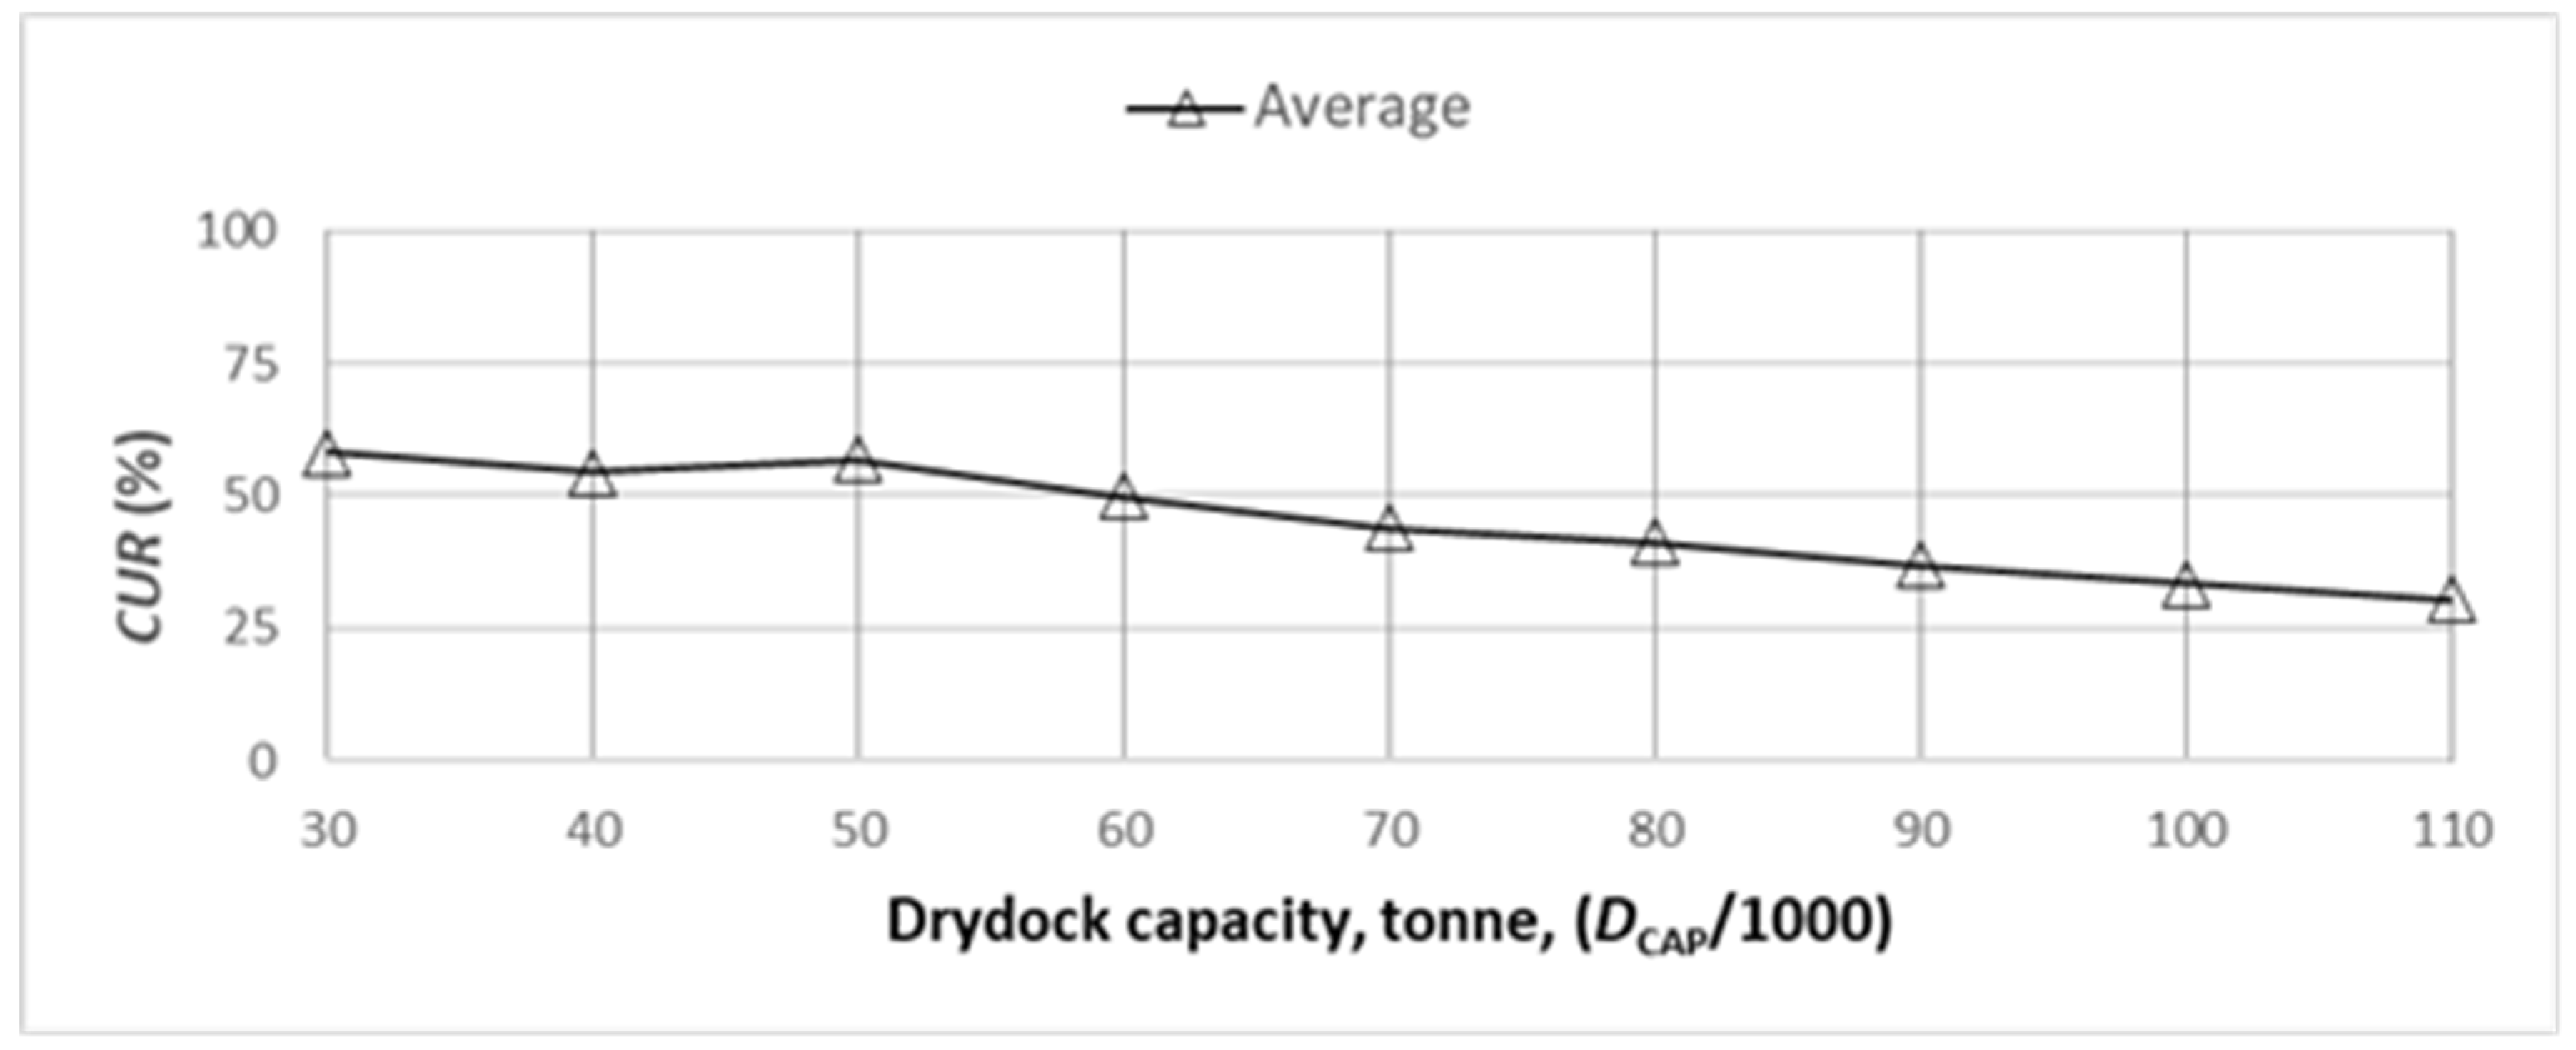
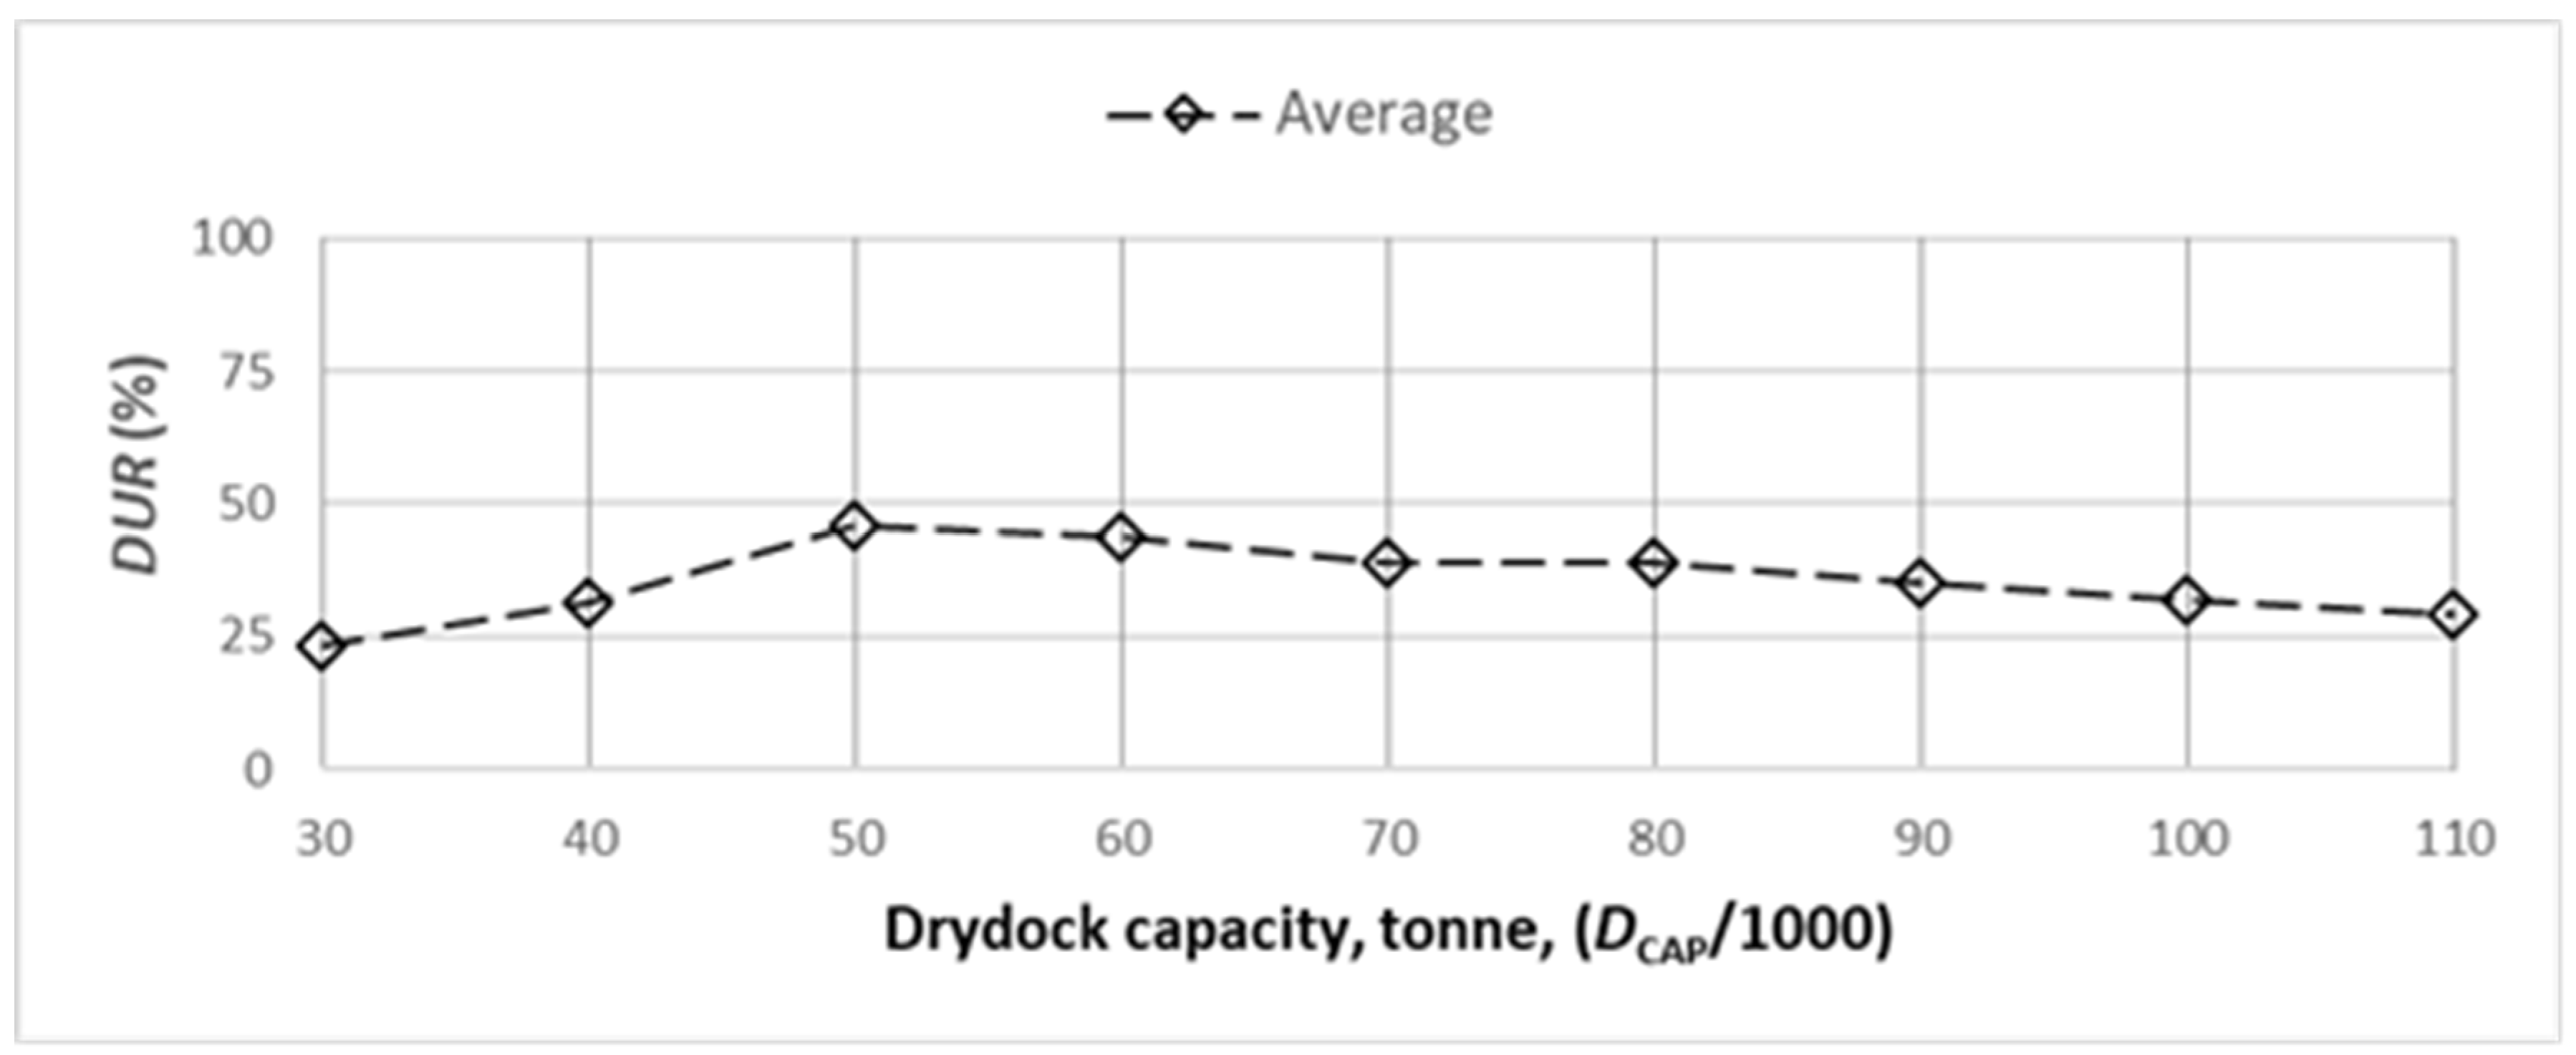
Figure 20,
Figure 21 and
Figure 22 validate a comparison of
DOR,
CUR and
DUR for different drydock capacities (30,000 to 110,000 tonnes). Figure 20 depicts no significant increase in
DOR after 80,000 tonnes. Figure 21 affirms a pattern of decreasing
CUR with increasing drydock installed capacity. This phenomenon happens when the generated deadweight does not support the increase in installed capacity (tonne) through the drydocking process of ships. In this case, for drydock A, increased installed capacity means that the available capacity is increased, but the deadweight generated through the drydocking process remains almost constant. So, the
CUR value is reduced even if it cannot maintain the present value. The situation can be improved if and only if more deadweight is generated by adding bigger size ships. However, a 70,000 to 80,000 tonnes capacity would be a better choice. Figure 22 confirms a similar phenomenon; the reasons and solutions are identical. However, a 70,000 to 80,000 tonnes capacity would have been a better choice.
Referring to Figure 5 and as explained in section 4.0, 97% of ships called on drydock B are within the 180,000 tonnes deadweight range and used only 25% of the drydock capacity. In other words, 97% of ships used only 25% of the drydock installed capacity. The remaining 75% drydock capacity was seriously under-utilized and contributed to lowering the CUR and DUR. Therefore, a smaller capacity drydock would have been a better choice.
Based on drydock B’s history, a set of better PPIs could have been achieved with a drydock having a lesser installed capacity (tonne).
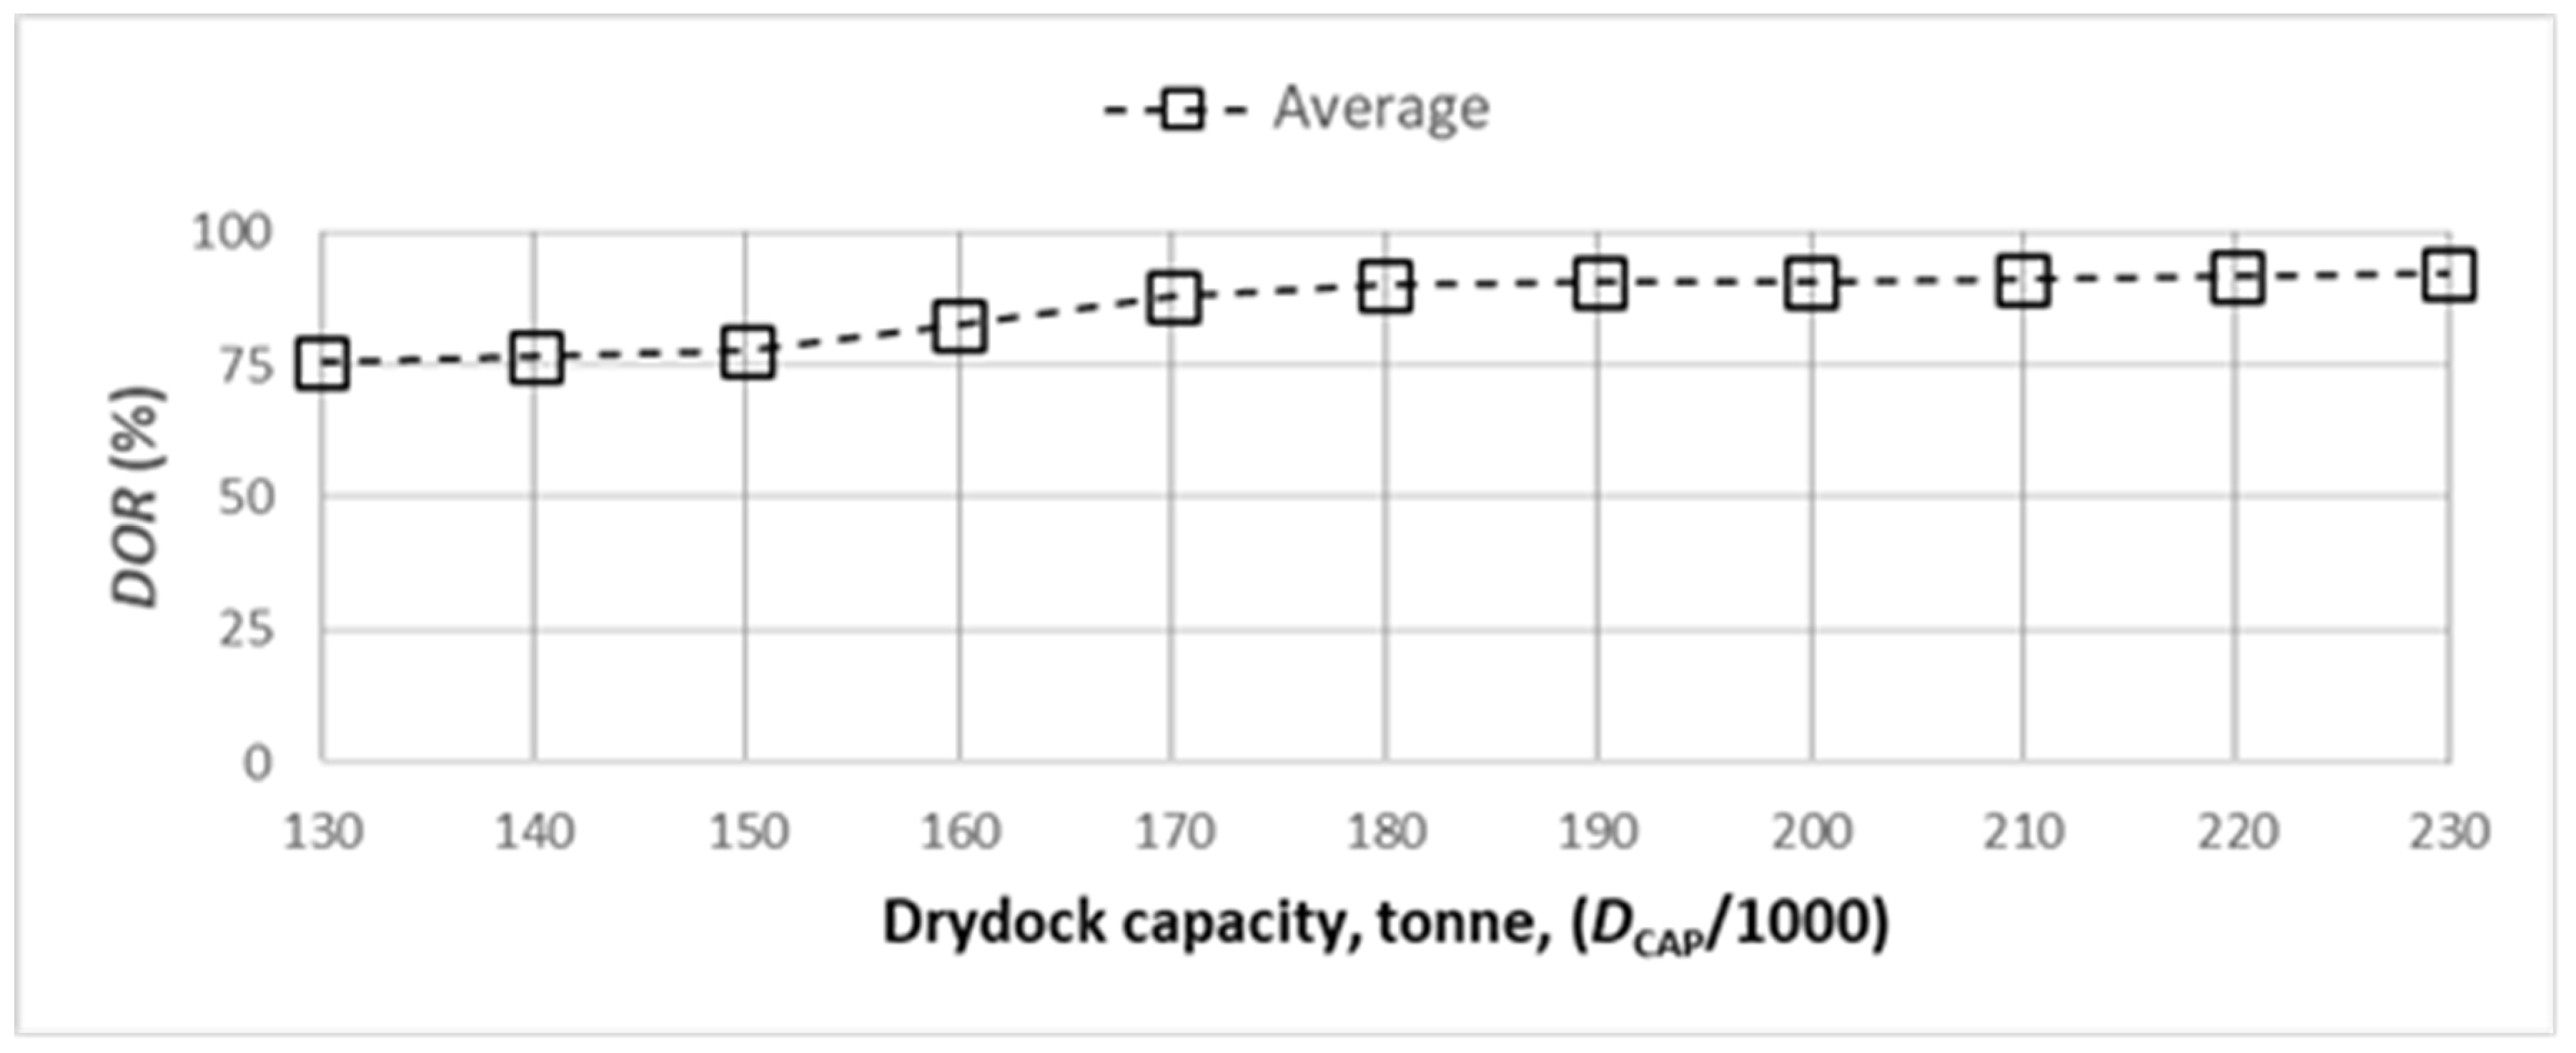
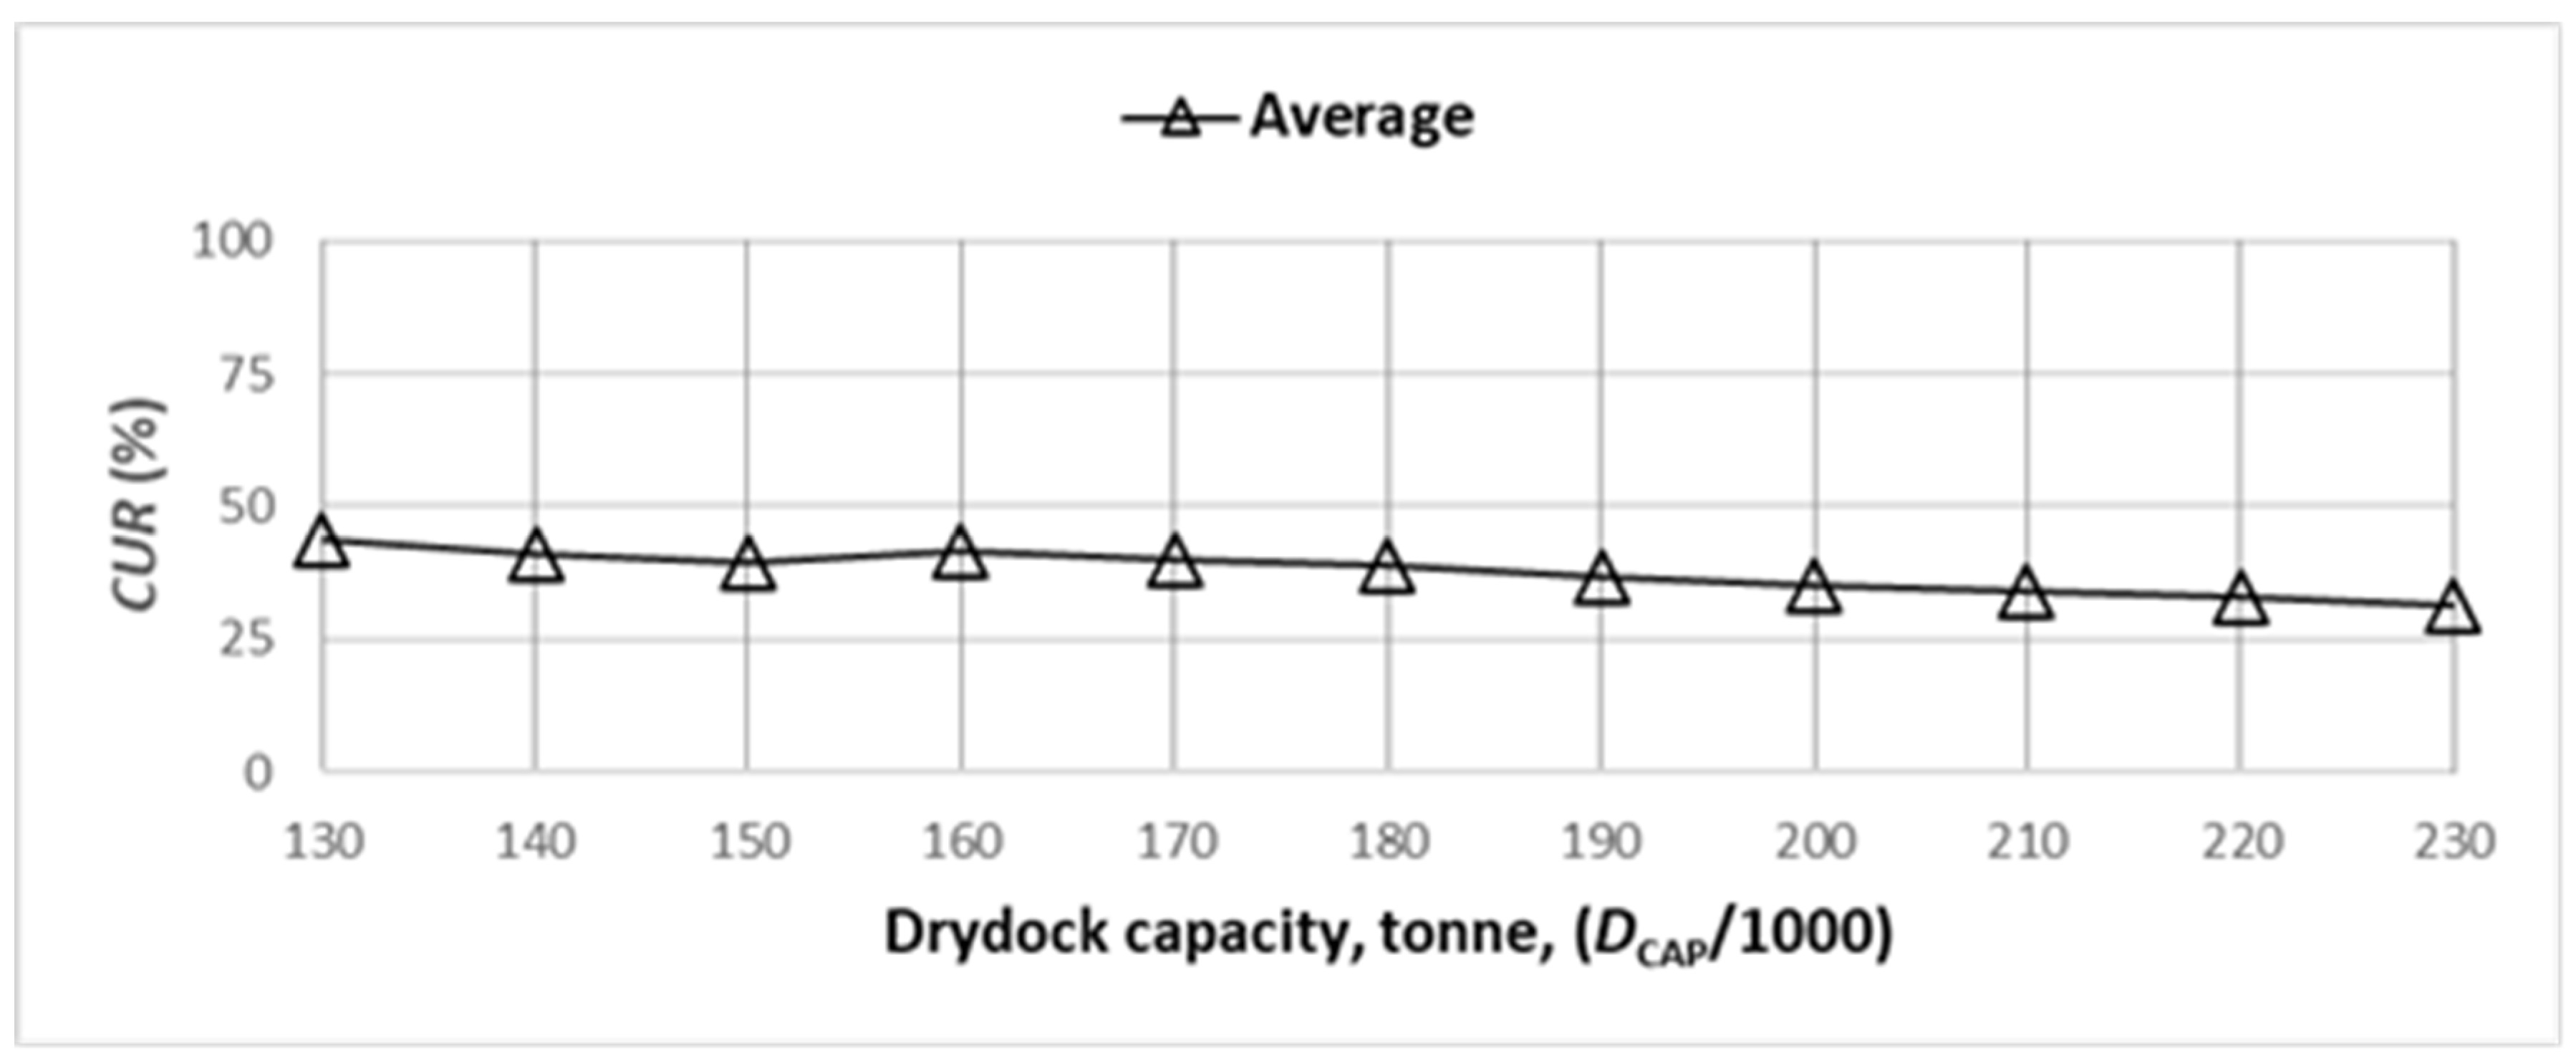
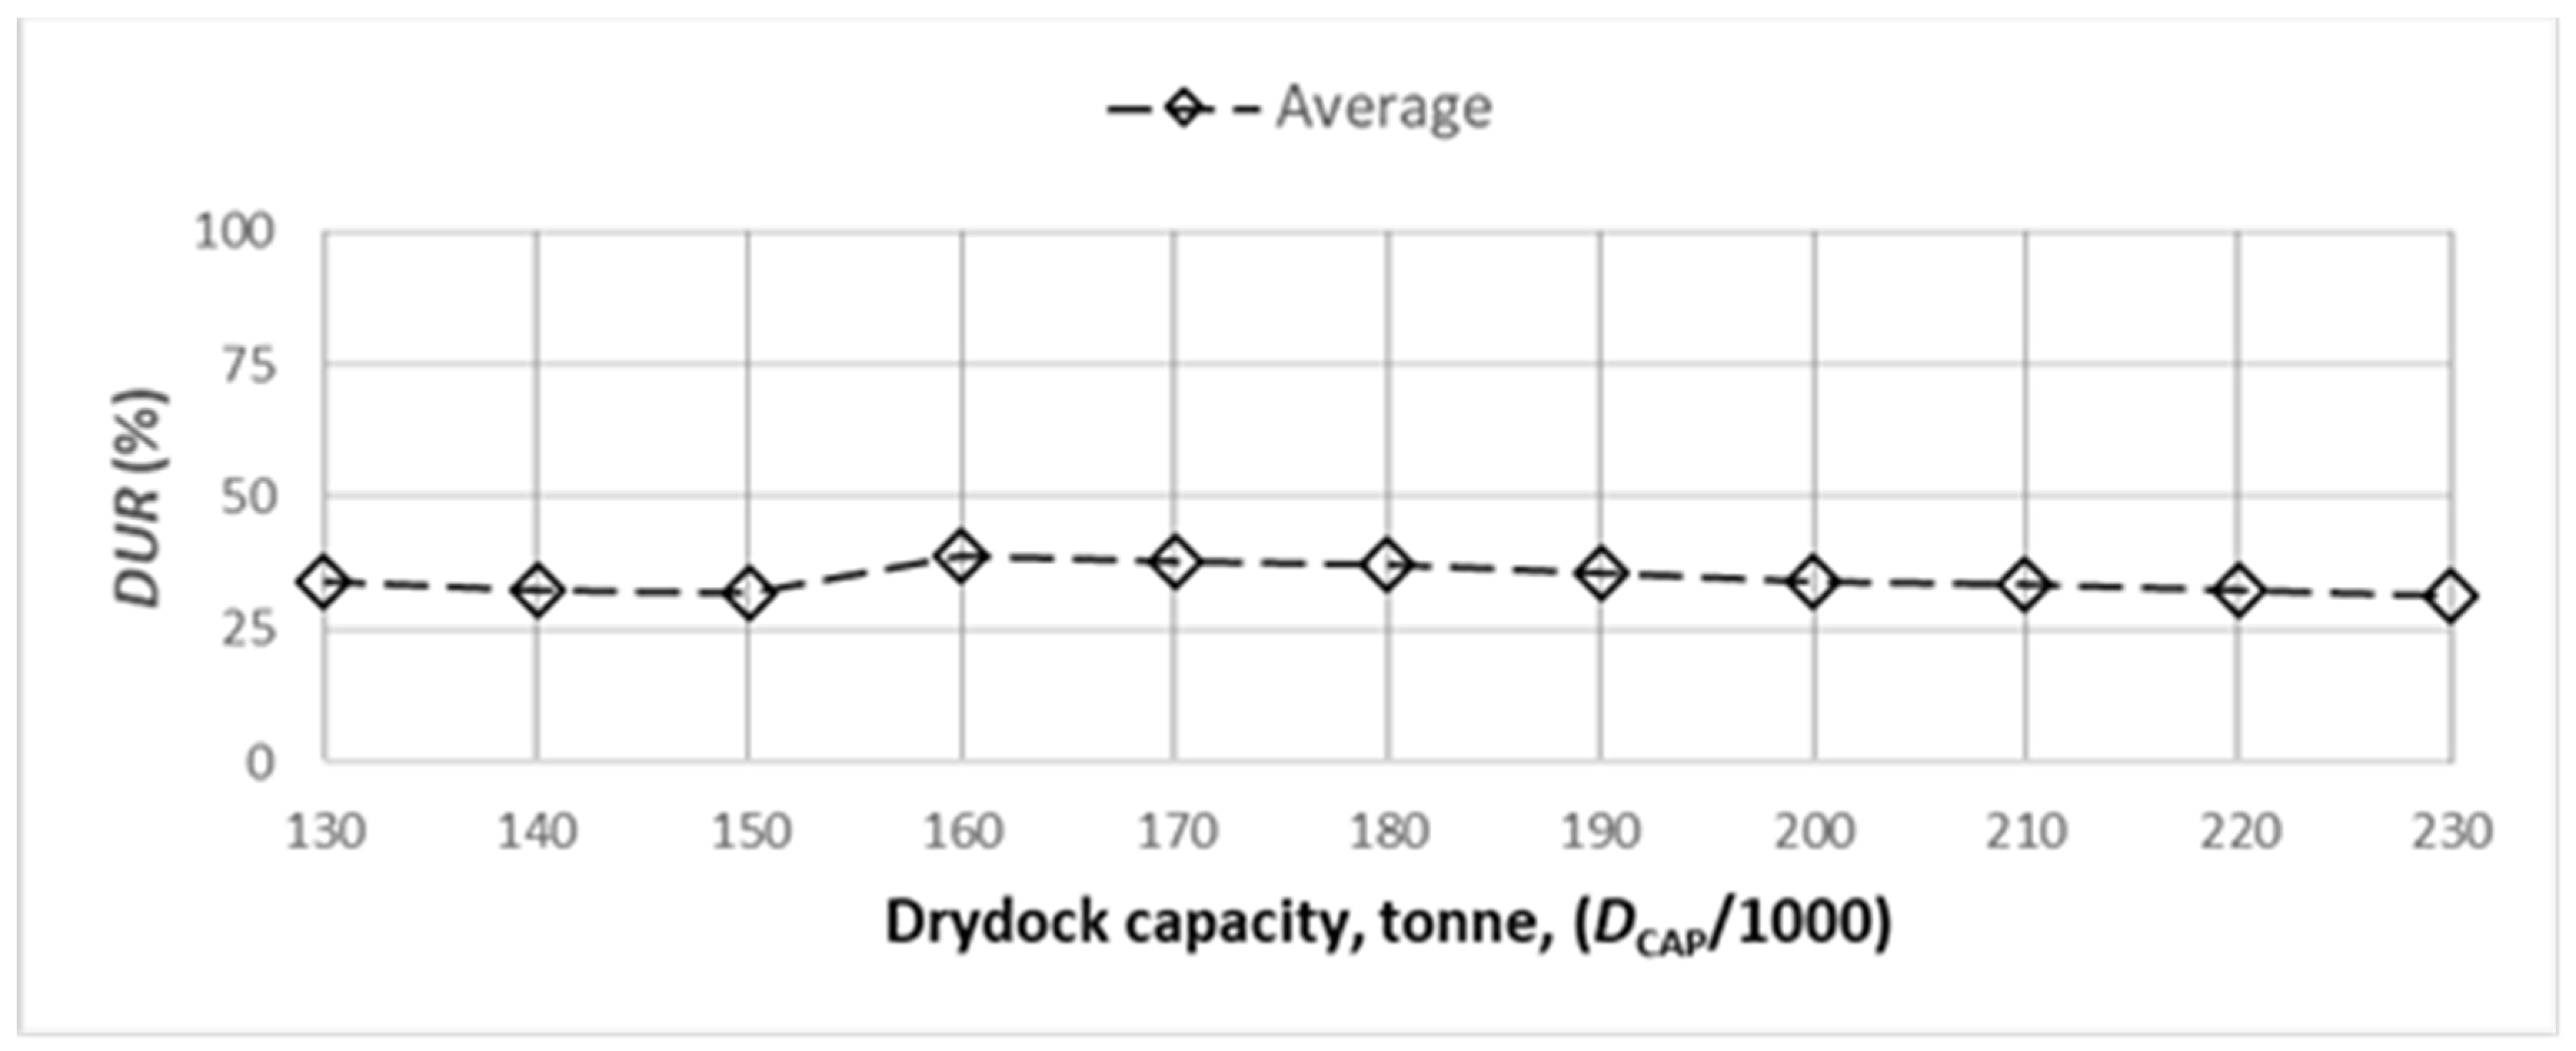
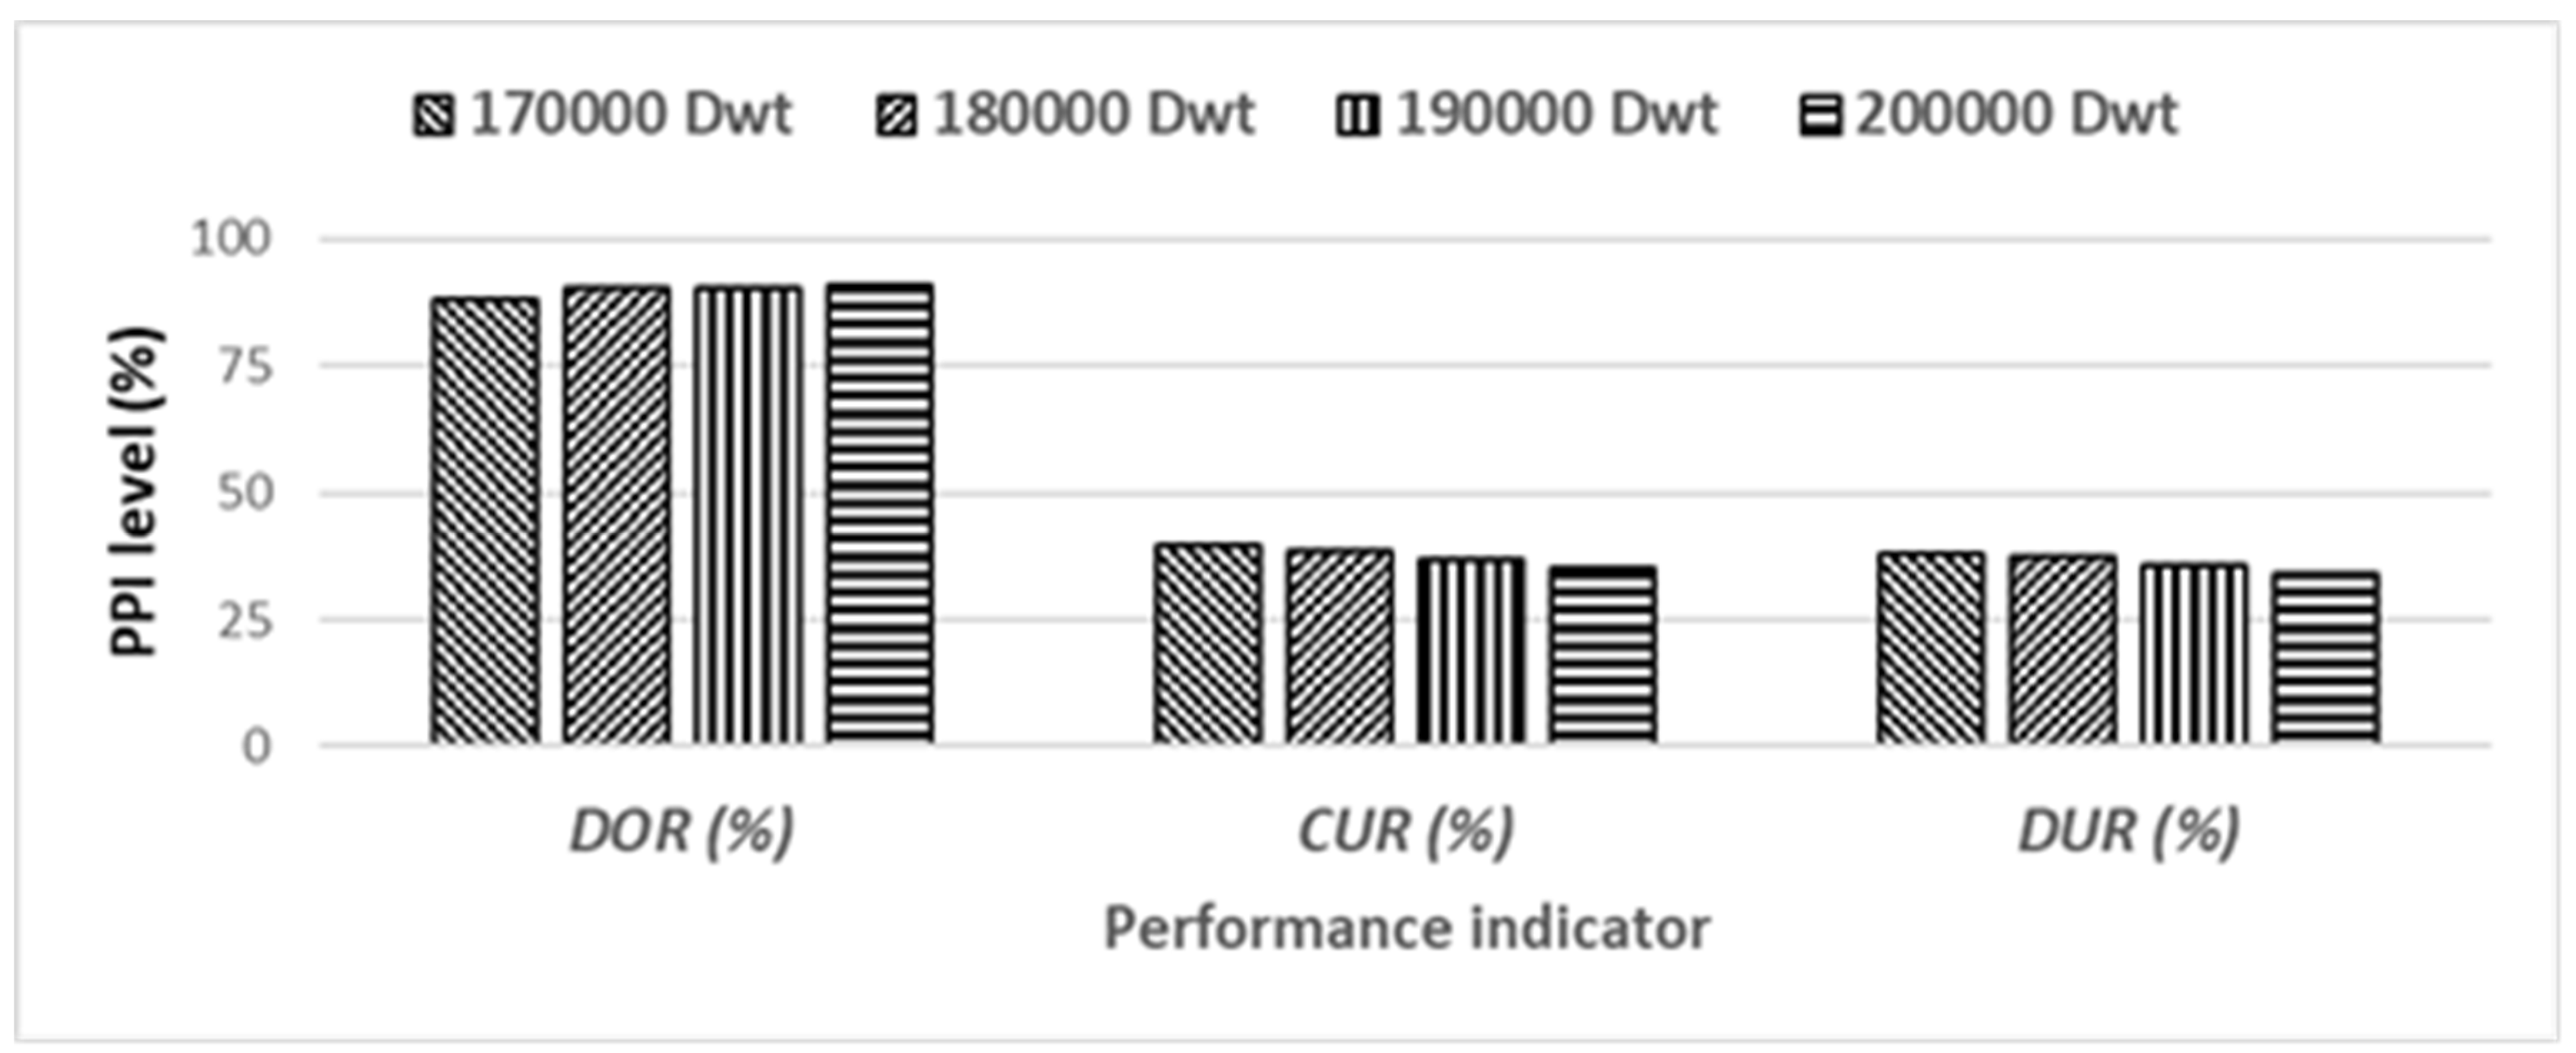
Figure 23,
Figure 24 and
Figure 25 compare
DOR,
CUR and
DUR for different drydock capacities (130,000 to 230,000 tonnes). Figure 23 depicts no significant increase in
DOR after 180,000 tonnes. Figure 24 displays a pattern similar to drydock A (Figure 21). Figure 25 exhibits a similar phenomenon to drydock A (Figure 22), and the reasons and solutions are identical. However, 170,000 to 180,000 tonnes capacity would have been a better choice.
6.5. Proposed Selection Procedure
So far, the behavior of PPIs against ships’ deadweight, generated deadweight and drydock capacity are discussed and explained in detail. It also highlighted that the deadweight of drydocking ships and their drydocking duration are the most vital factors for selecting a drydock capacity. As such, below are the proposed selection procedure/steps.
The following step-by-step guideline is proposed for selecting drydock capacity based on the expected available fleet size. The guideline duly considers prospective customers’ fleet size (deadweight and the number of ships). It may help the decision-maker select an appropriate capacity for the proposed drydock, which will perform well to achieve the pre-determined PPIs. Financial analysis (beyond the scope of the present research) should be carried out for final selection, with particular attention to the benefit-cost ratio to make the project profitable. A wide range of market surveys and a detailed analysis are required to make a final decision (Drewry Shipping Consultants, 2013). However, the following step-by-step guide may help select the appropriate drydock size from a technical point of view at the beginning stage.
Step-1: To ascertain the fleet size (number of ships and their deadweight) operating under the expected customers. It will help the decision-maker understand the regular customers and their fleet profile better.
Step-2: To develop a distribution curve of the deadweight of ships expected to use the drydock facilities (similar to
Figure 1 and
Figure 2) yearly. Because ships are put into drydock at a regular interval (not every year), the year of built will indicate the drydocking year and can be planned accordingly. This information will help the decision-maker get an initial idea of the upper limit of the drydock capacity based on the available fleet and size. This will also show the concentration of various segments of deadweight over the whole range.
Step-3: To calculate the selected PPIs based on the available fleet against various drydock capacities and then counter-check with the pre-determined value of the same (PPIs) for the final selection of drydock capacity.
Step-4: To continue step 3 until a satisfactory value is reached. In this process, the decision-maker can adjust the installed capacity of the drydock to suit the targeted PPIs, assuming the potential fleet size is constant.
The information generated in step 2 is vital in the upper limit of the deadweight of ships expected to use the proposed facilities.
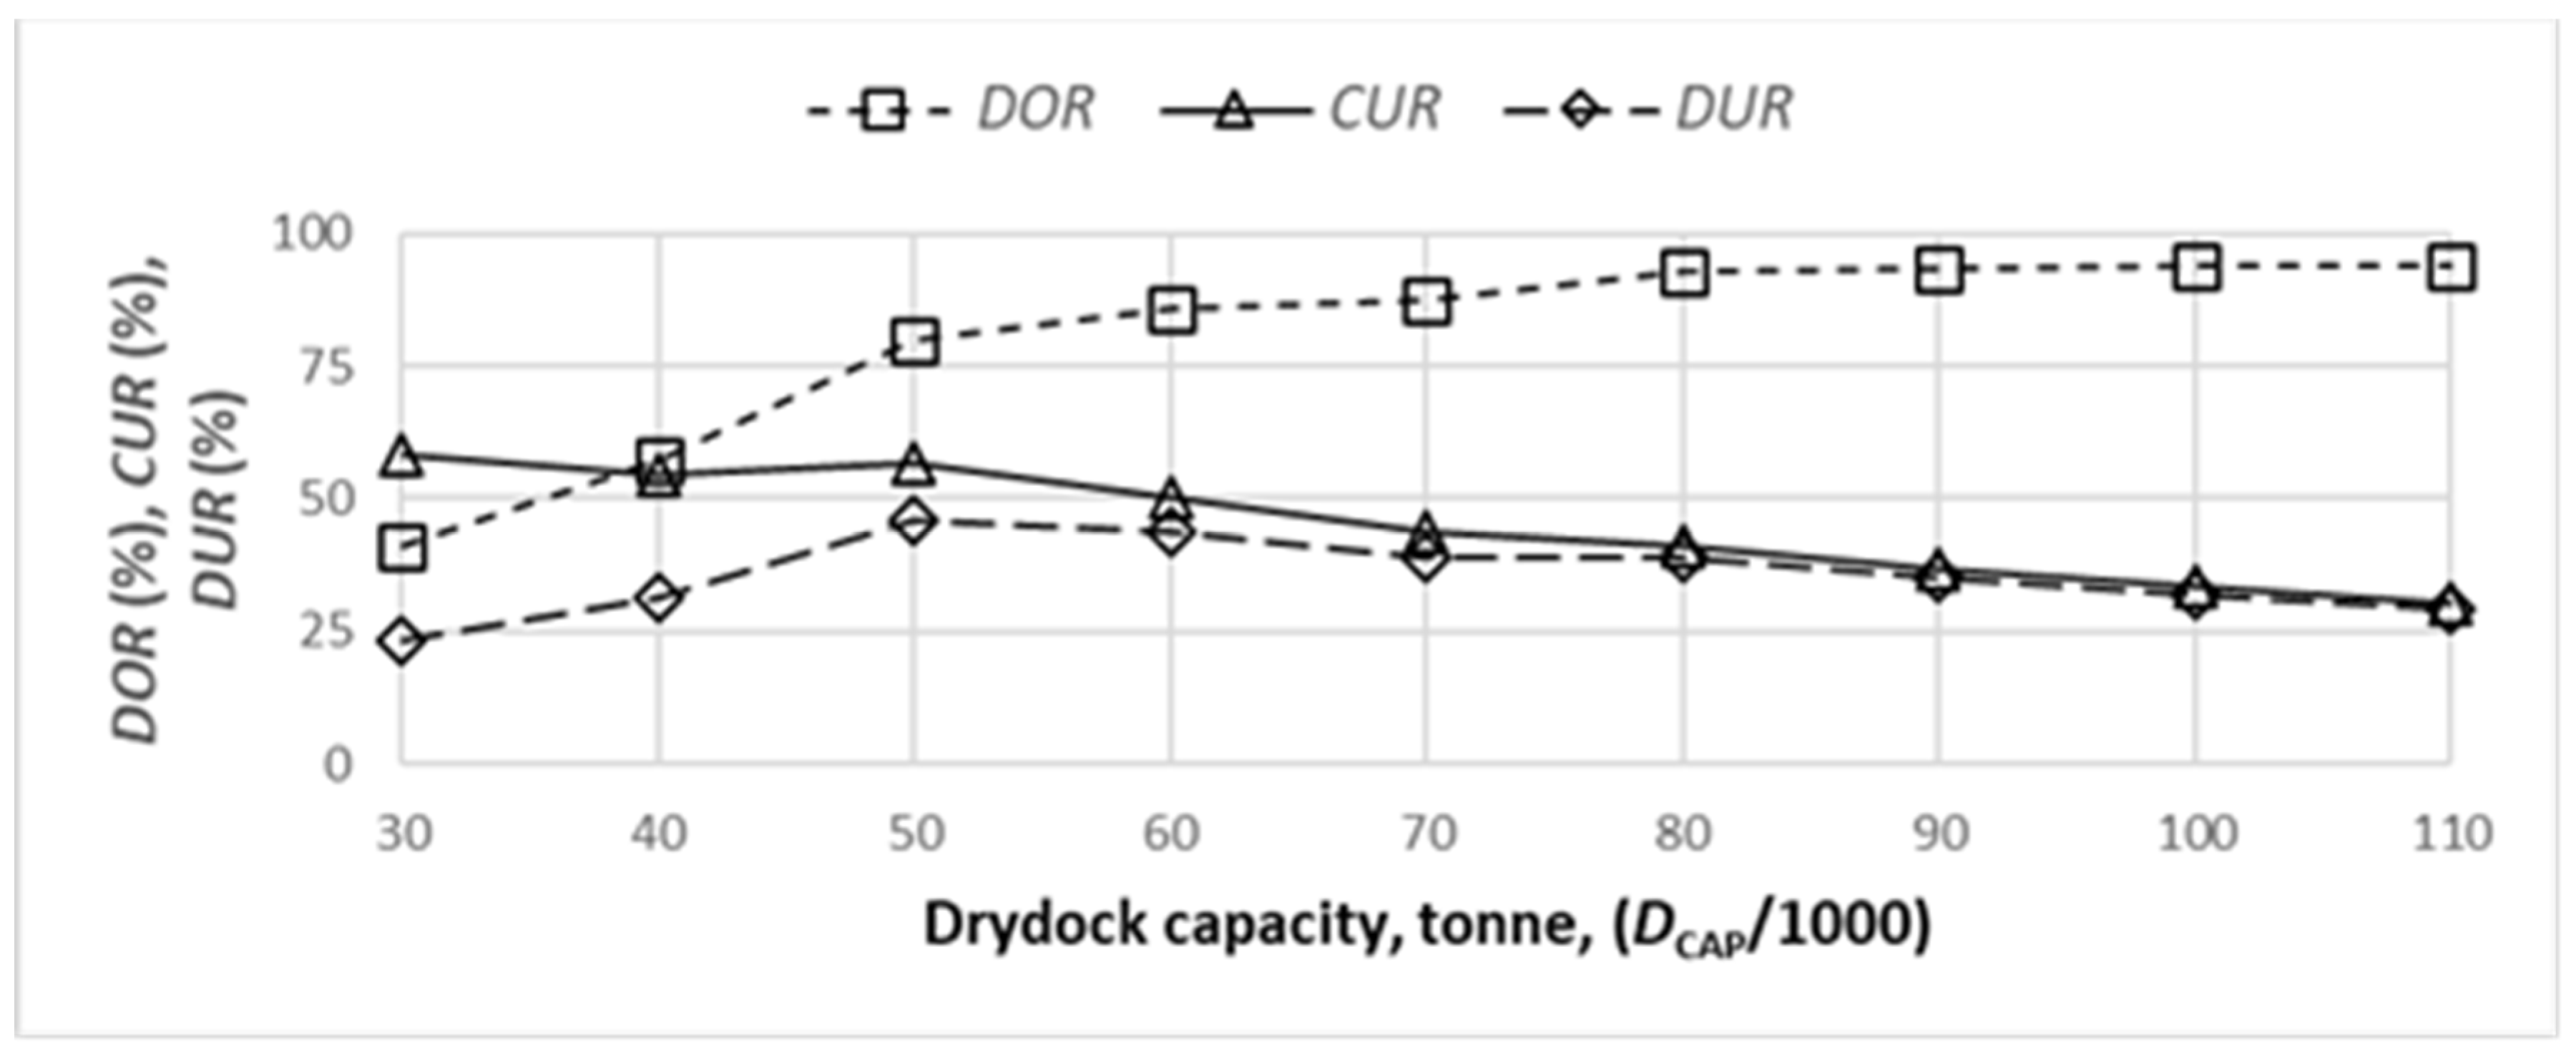
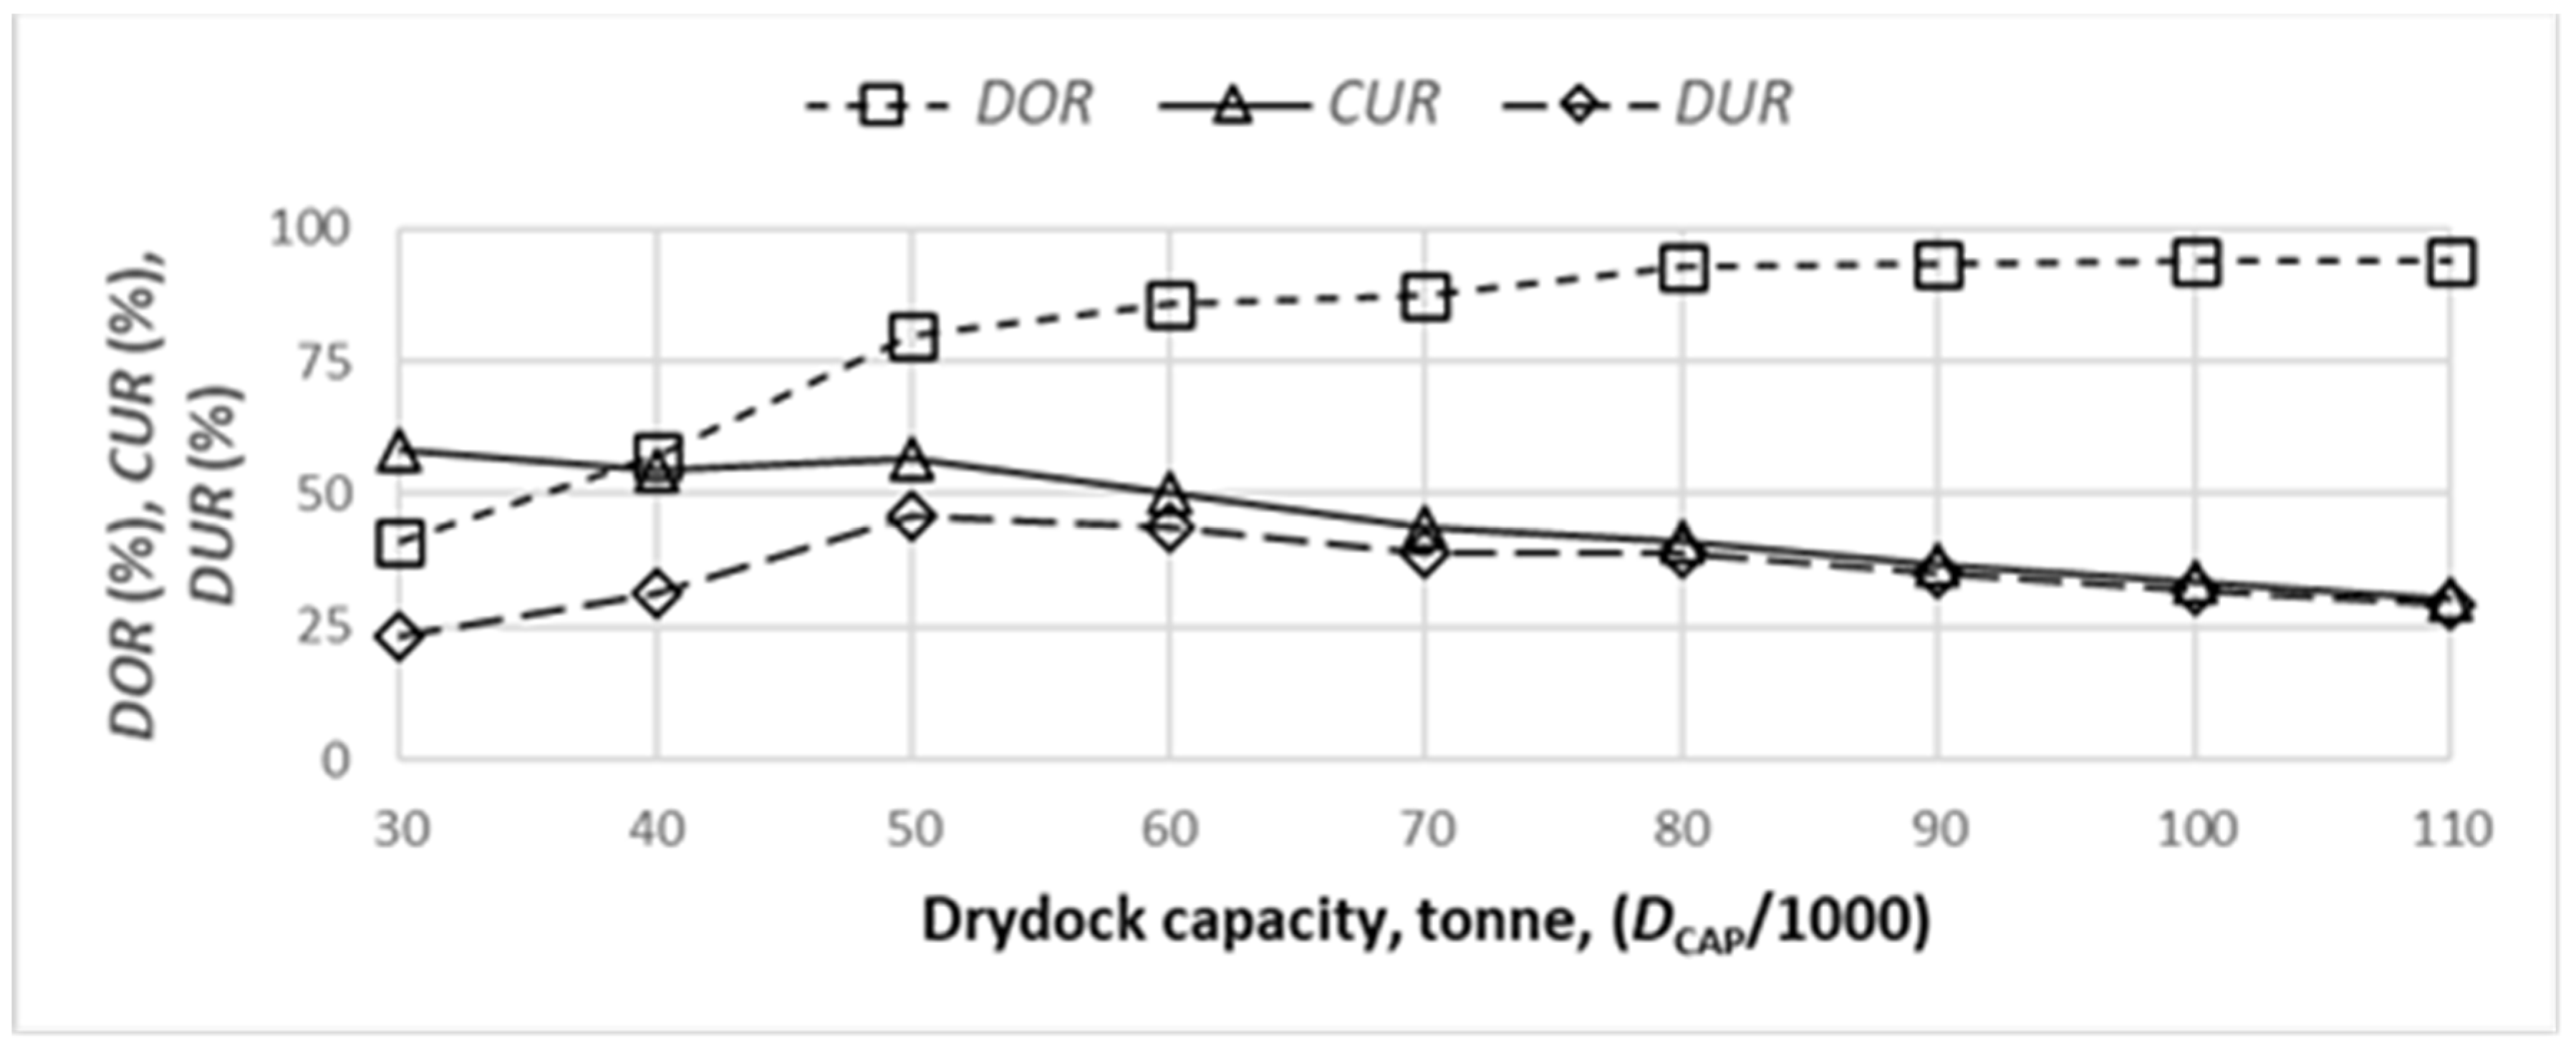
Figure 26 and
Figure 27 are constructed using
Figure 20,
Figure 21 and
Figure 22, and
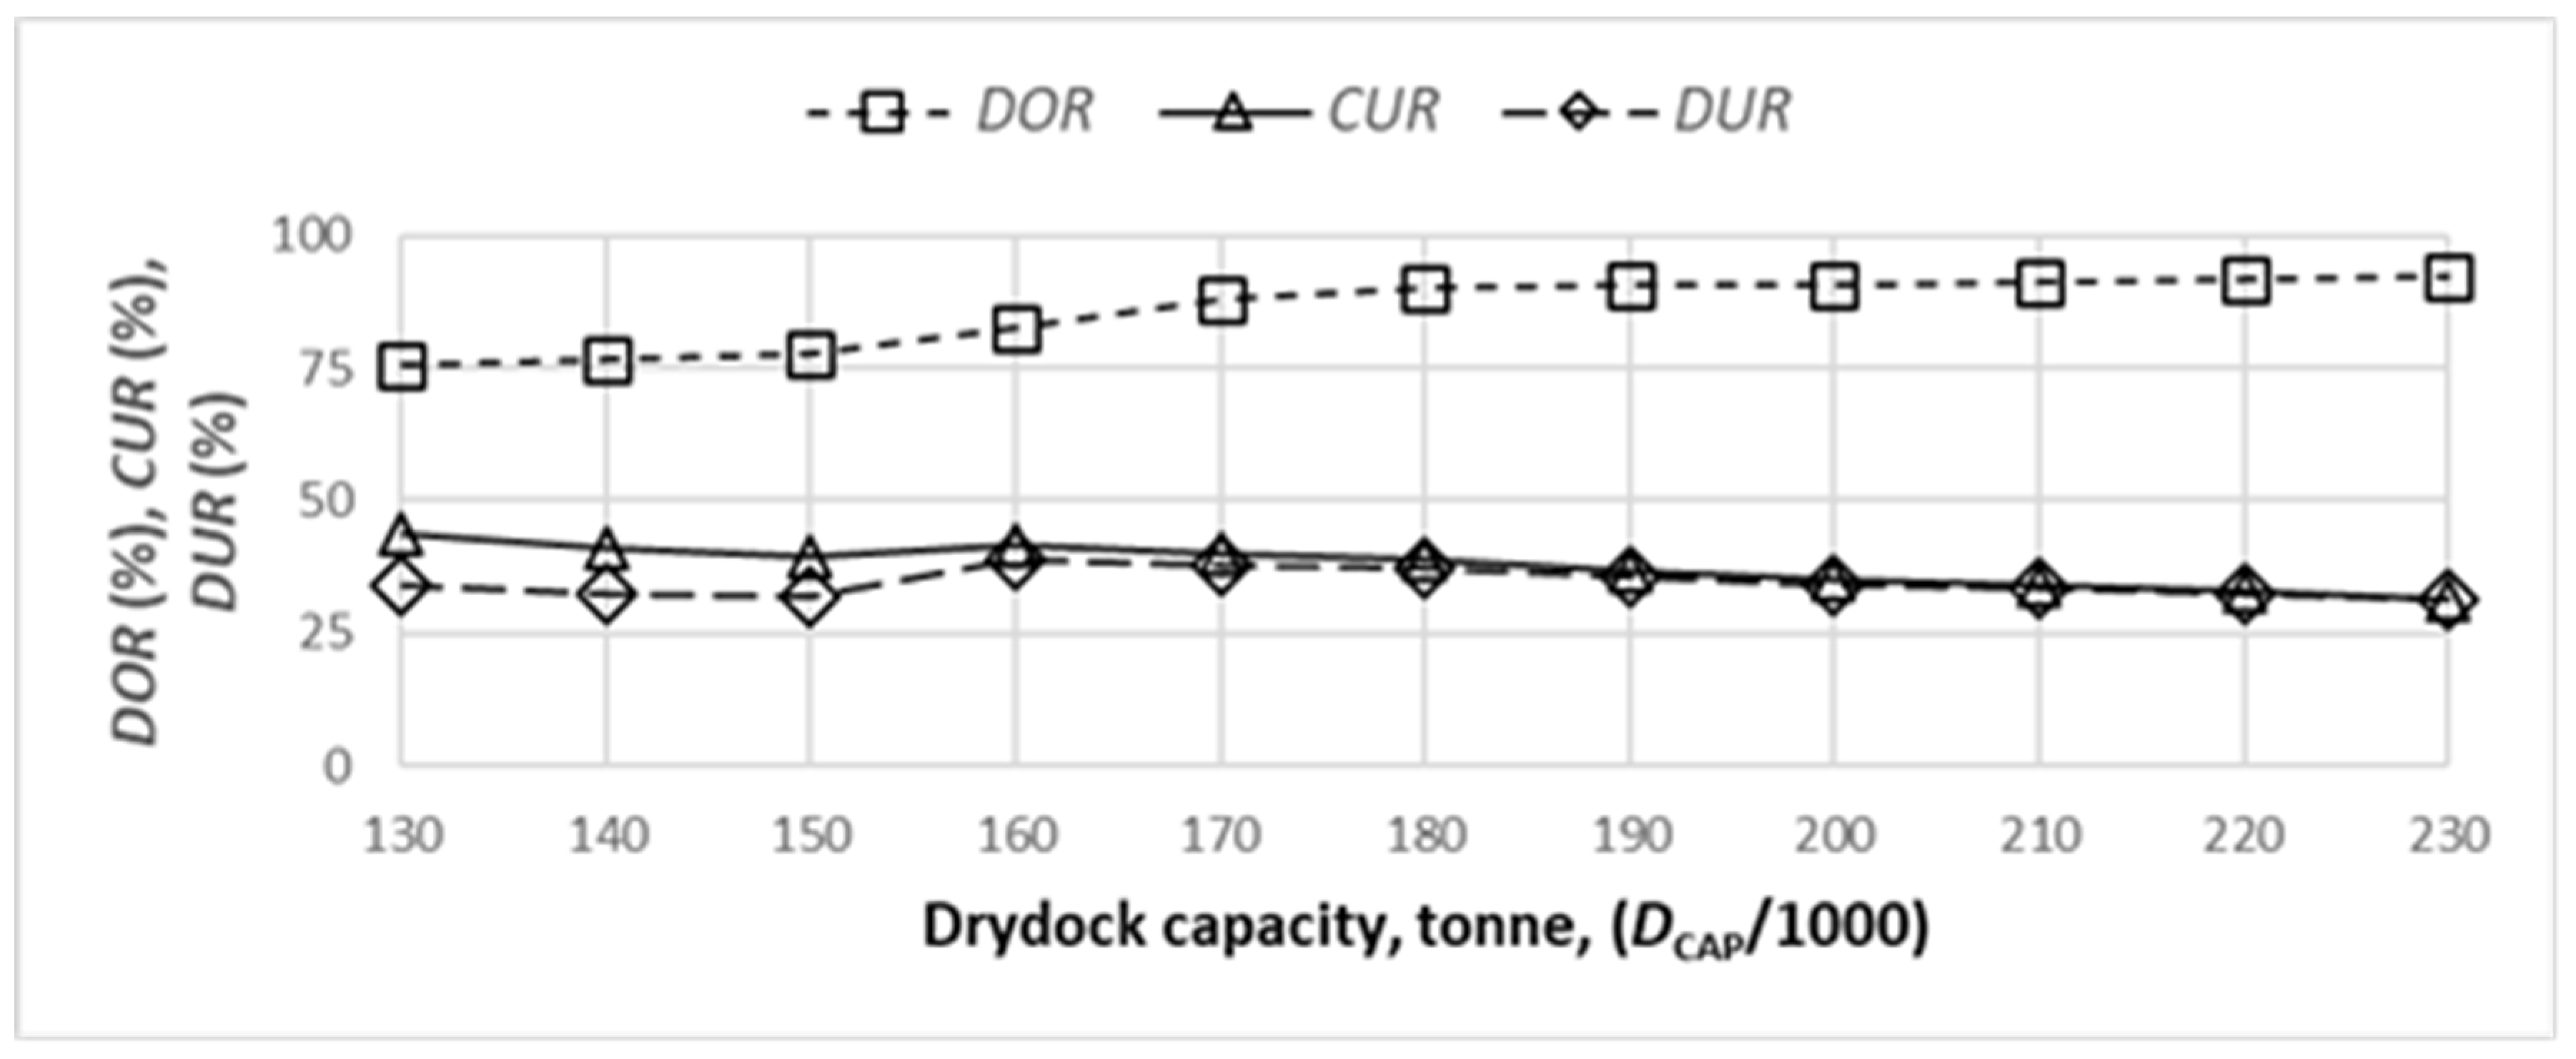
Figure 28 and
Figure 29 are formed using
Figure 23,
Figure 24 and
Figure 25, respectively. They demonstrate step 3 for drydocks A and B, respectively and show the PPI level against different drydock capacities. They also indicate that with the decrease of drydock installed capacity,
DOR decreases, but
CUR and
DUR increase, which is expected. A reduction in drydock capacity results in the rejection of a few ships and, hence, the total docking time. It directly reduces
DOR. Again, rejection of the ship reduces the average deadweight per ship, and the ratio with the reduced drydock capacity delivers higher
CUR. Similarly, rejection of the ship reduces the average deadweight per day, and the ratio with reduced drydock capacity also yields higher
DUR. It is important to note that the rate of change in
CUR and
DUR is much higher than
DOR.
6.6. Recommendations
The results of the analyses suggest that both drydocks are oversized by capacity. A smaller capacity drydock would have been better based on the available fleets and their deadweight served by respective drydocks. However, modification of installed capacity is out of the question. Still, the present situation can be improved significantly by increasing the total generated deadweight through the calling ships to both drydocks. Increased deadweight per ship and day will directly contribute to CUR and DUR. It can be achieved by securing higher deadweight ships, even rejecting smaller deadweight ships, and increasing the number of ships by reducing the drydocking time (day). New marketing strategies and skilled labor forces may be helpful in this regard.
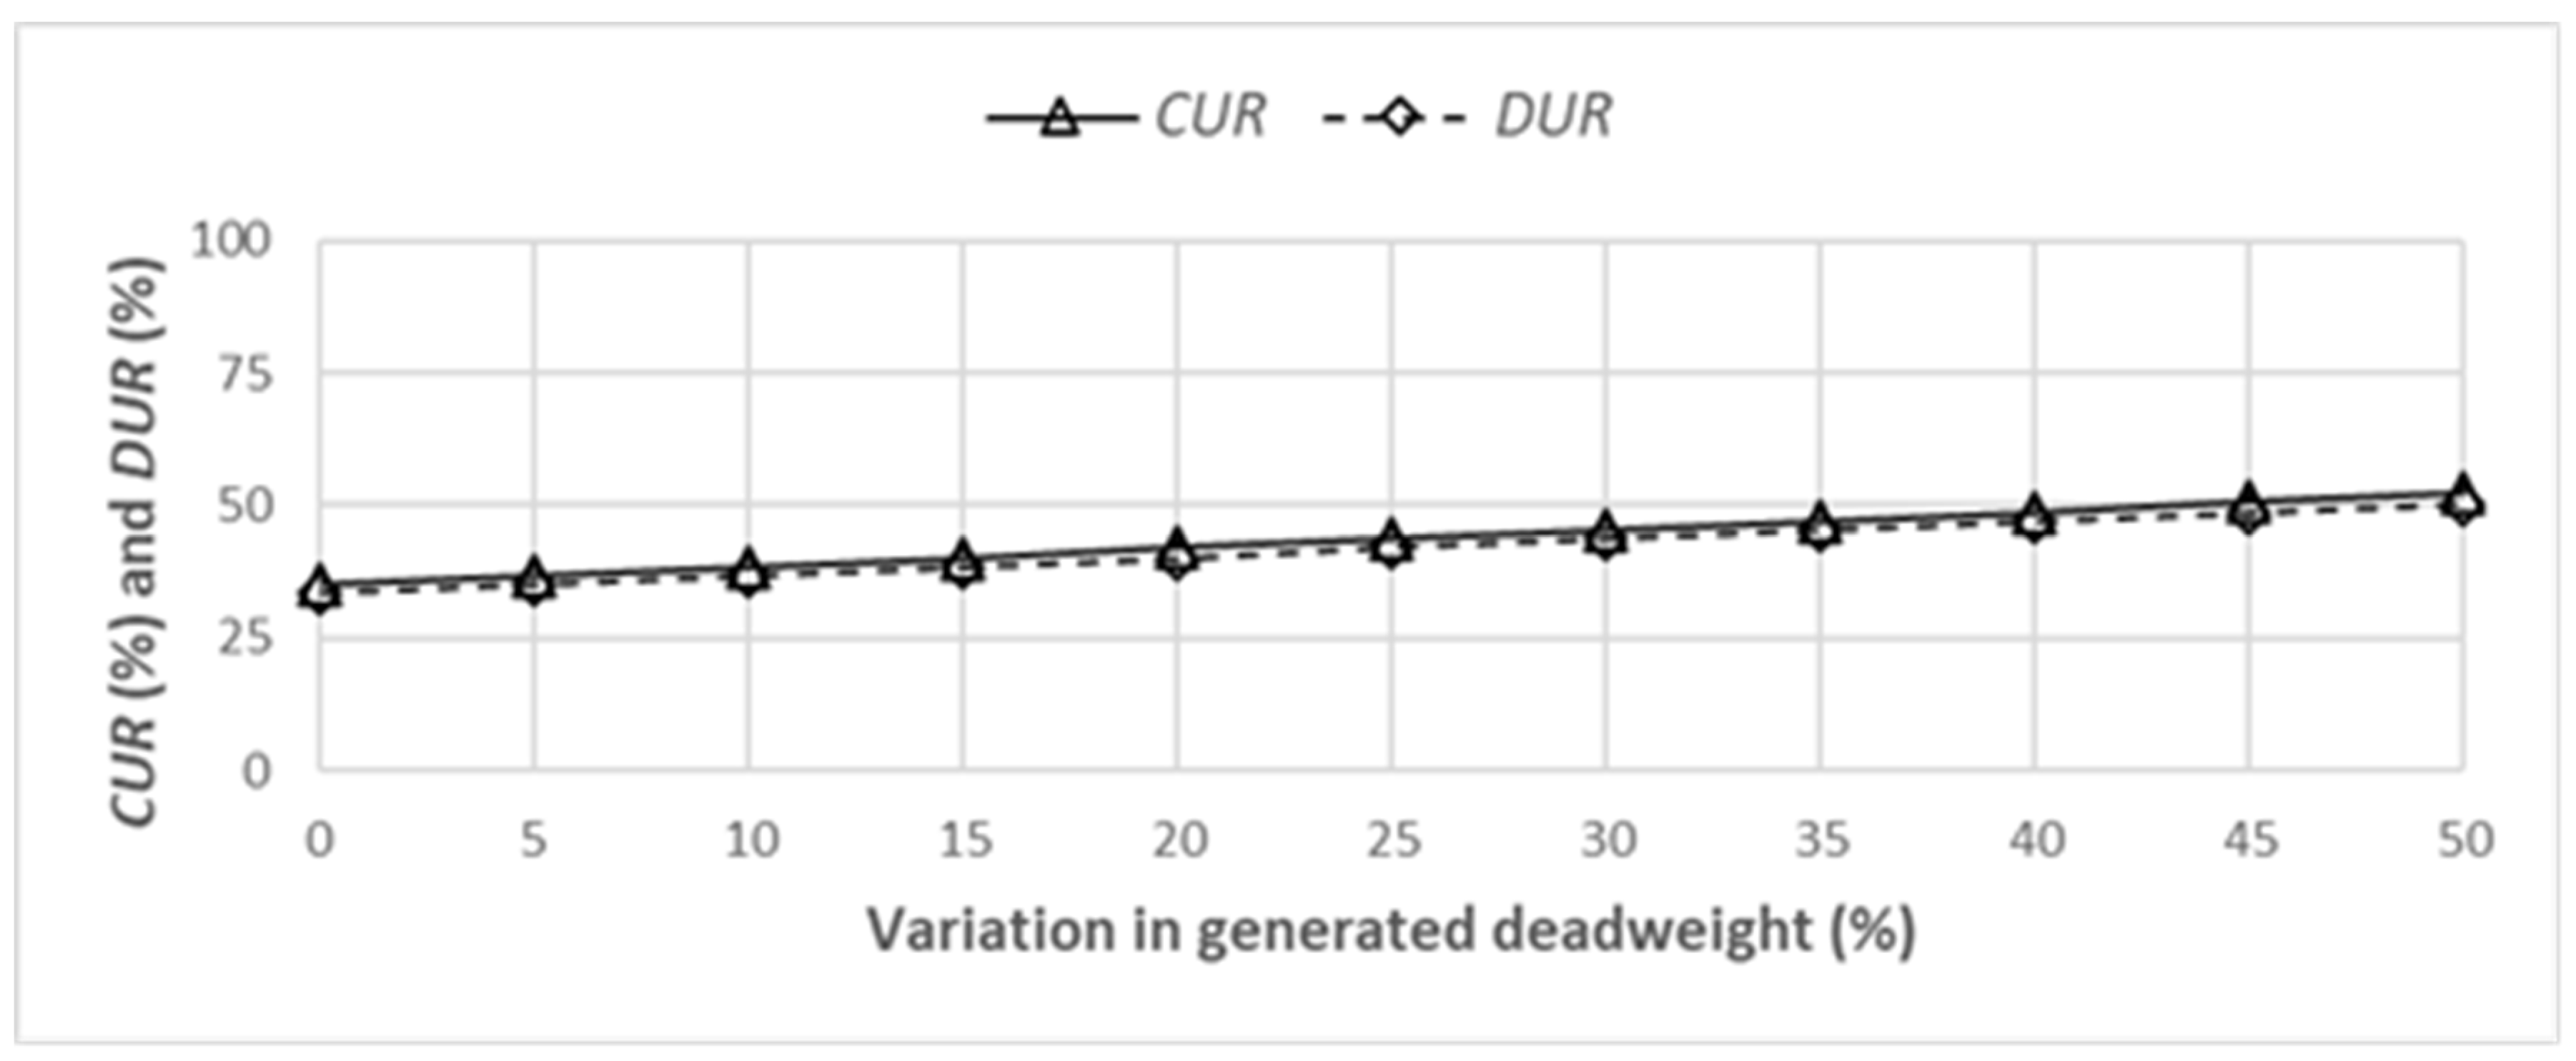
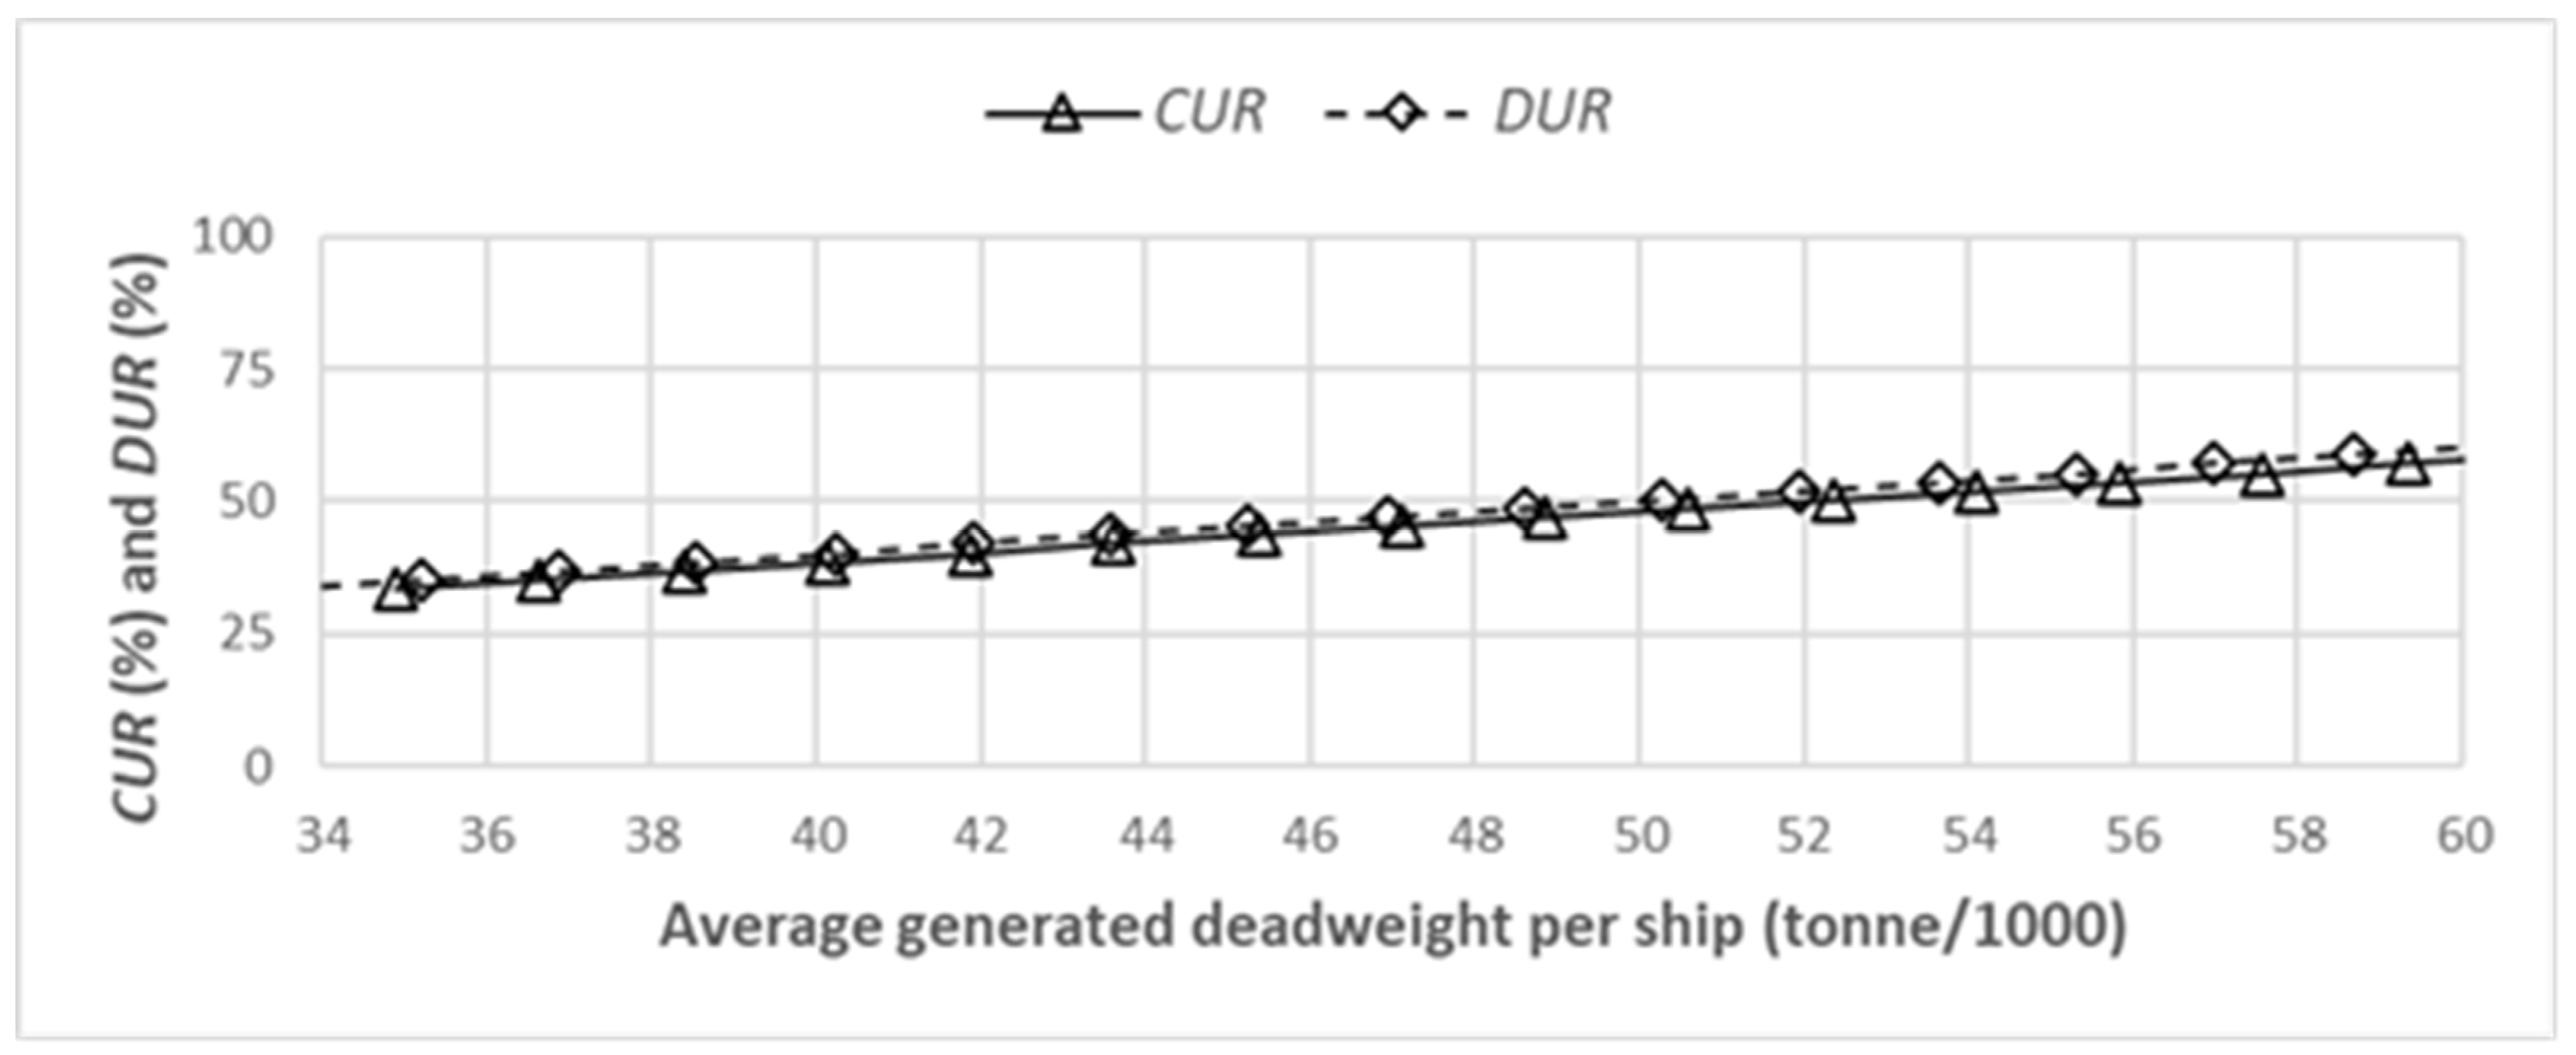
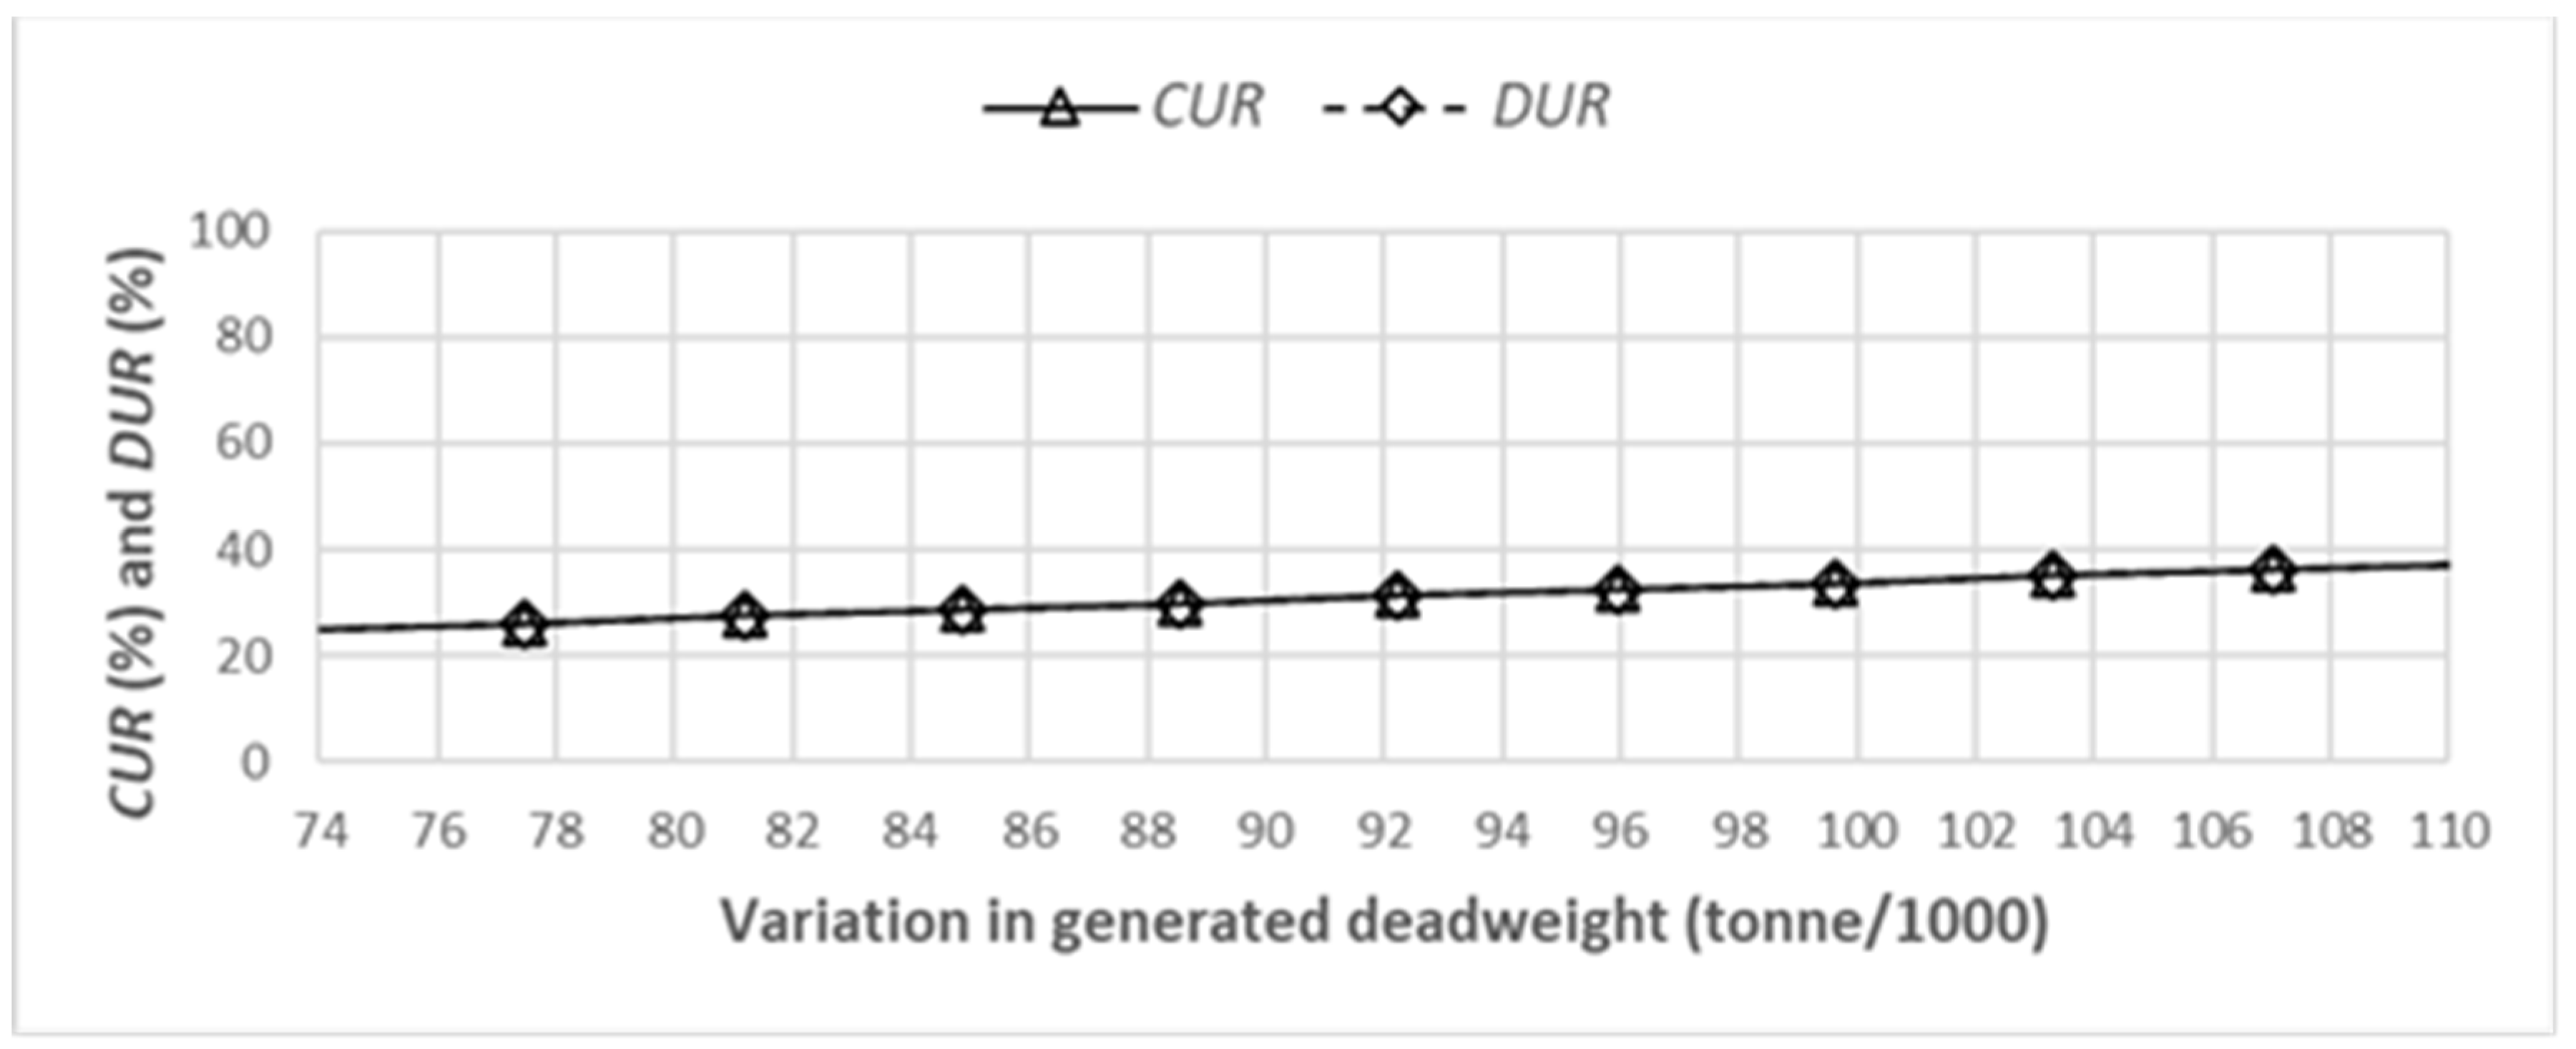
Figure 30,
Figure 31,
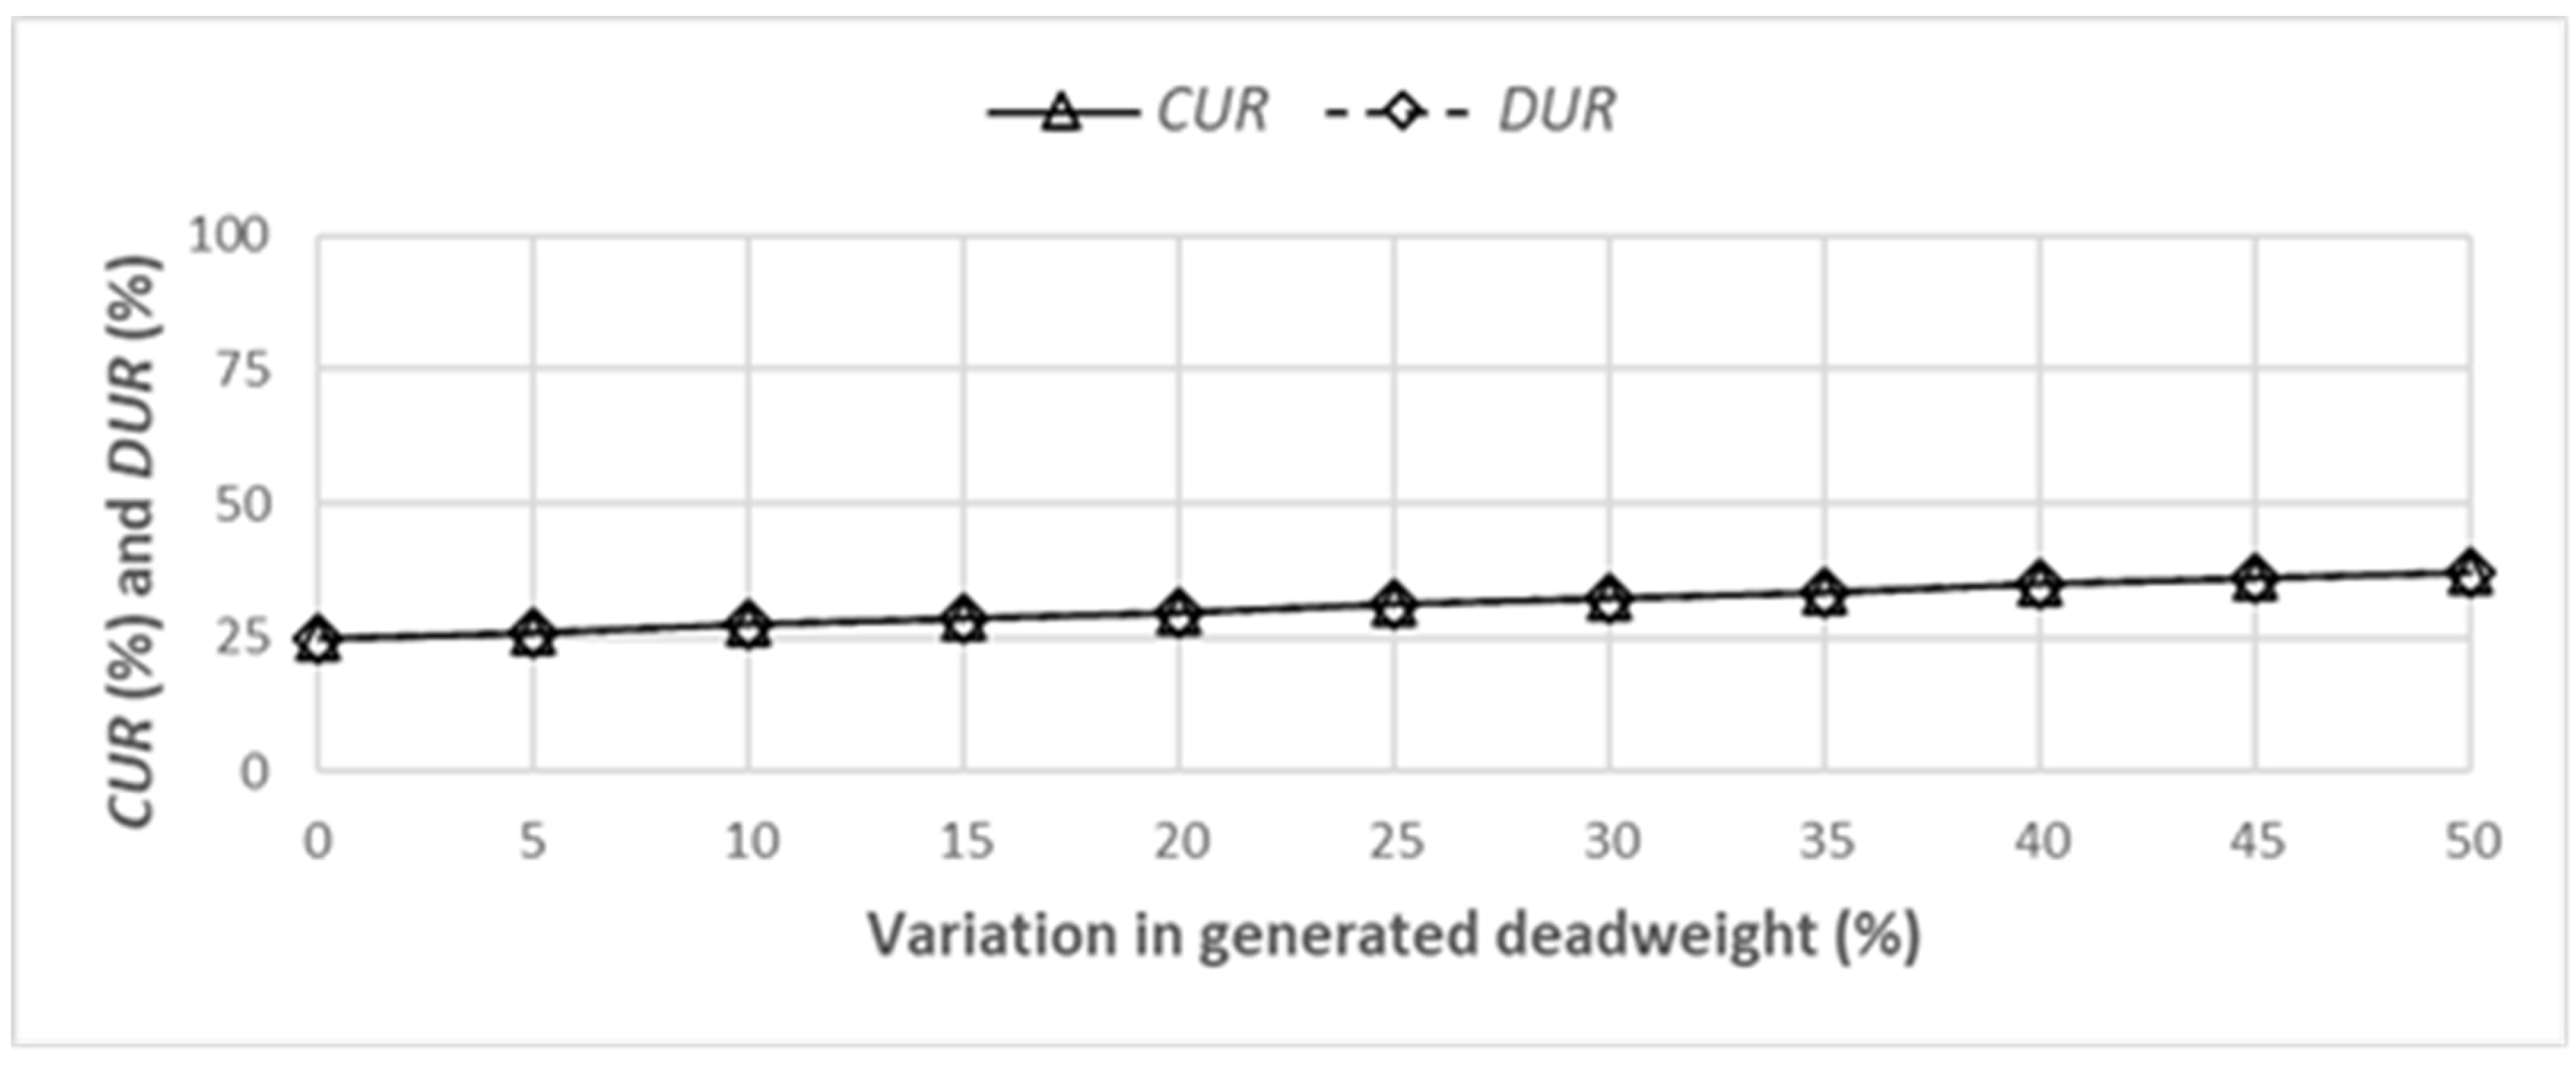
Figure 32 and
Figure 33 indicate several facts for drydocks A and B. Figure 30 illustrates the projected
CUR and
DUR against the increase in deadweight per ship and generated deadweight per day by %, respectively, for drydock A. Figure 31 represents the projected
CUR and
DUR against the rise in deadweight per ship and generated deadweight per day by absolute tonnage, respectively, for drydock A.
For example, if the increase is 20%, then CUR and DUR will be increased to about 40-42% (Figure 30). Also, a 20% increase means the average generated deadweight per day is 40,204 tonnes, corresponding to about 40-42% CUR and DUR (Figure 31).
Figure 32 illustrates the projected CUR and DUR against the increase in deadweight per ship and generated deadweight per day by %, respectively, for drydock B. Figure 33 shows the projected CUR and DUR against the rise in deadweight per ship and generated deadweight per day by absolute tonnage, respectively, for drydock B.
For example, if the increase is 20%, then CUR and DUR will be increased to about 30% (Figure 32). Also, a 20% increase means the average generated deadweight per day is 88,560 tonnes, corresponding to about 30% CUR and DUR (Figure 33). These will help to select the deadweight per ship to achieve a targeted CUR and DUR and vice versa.
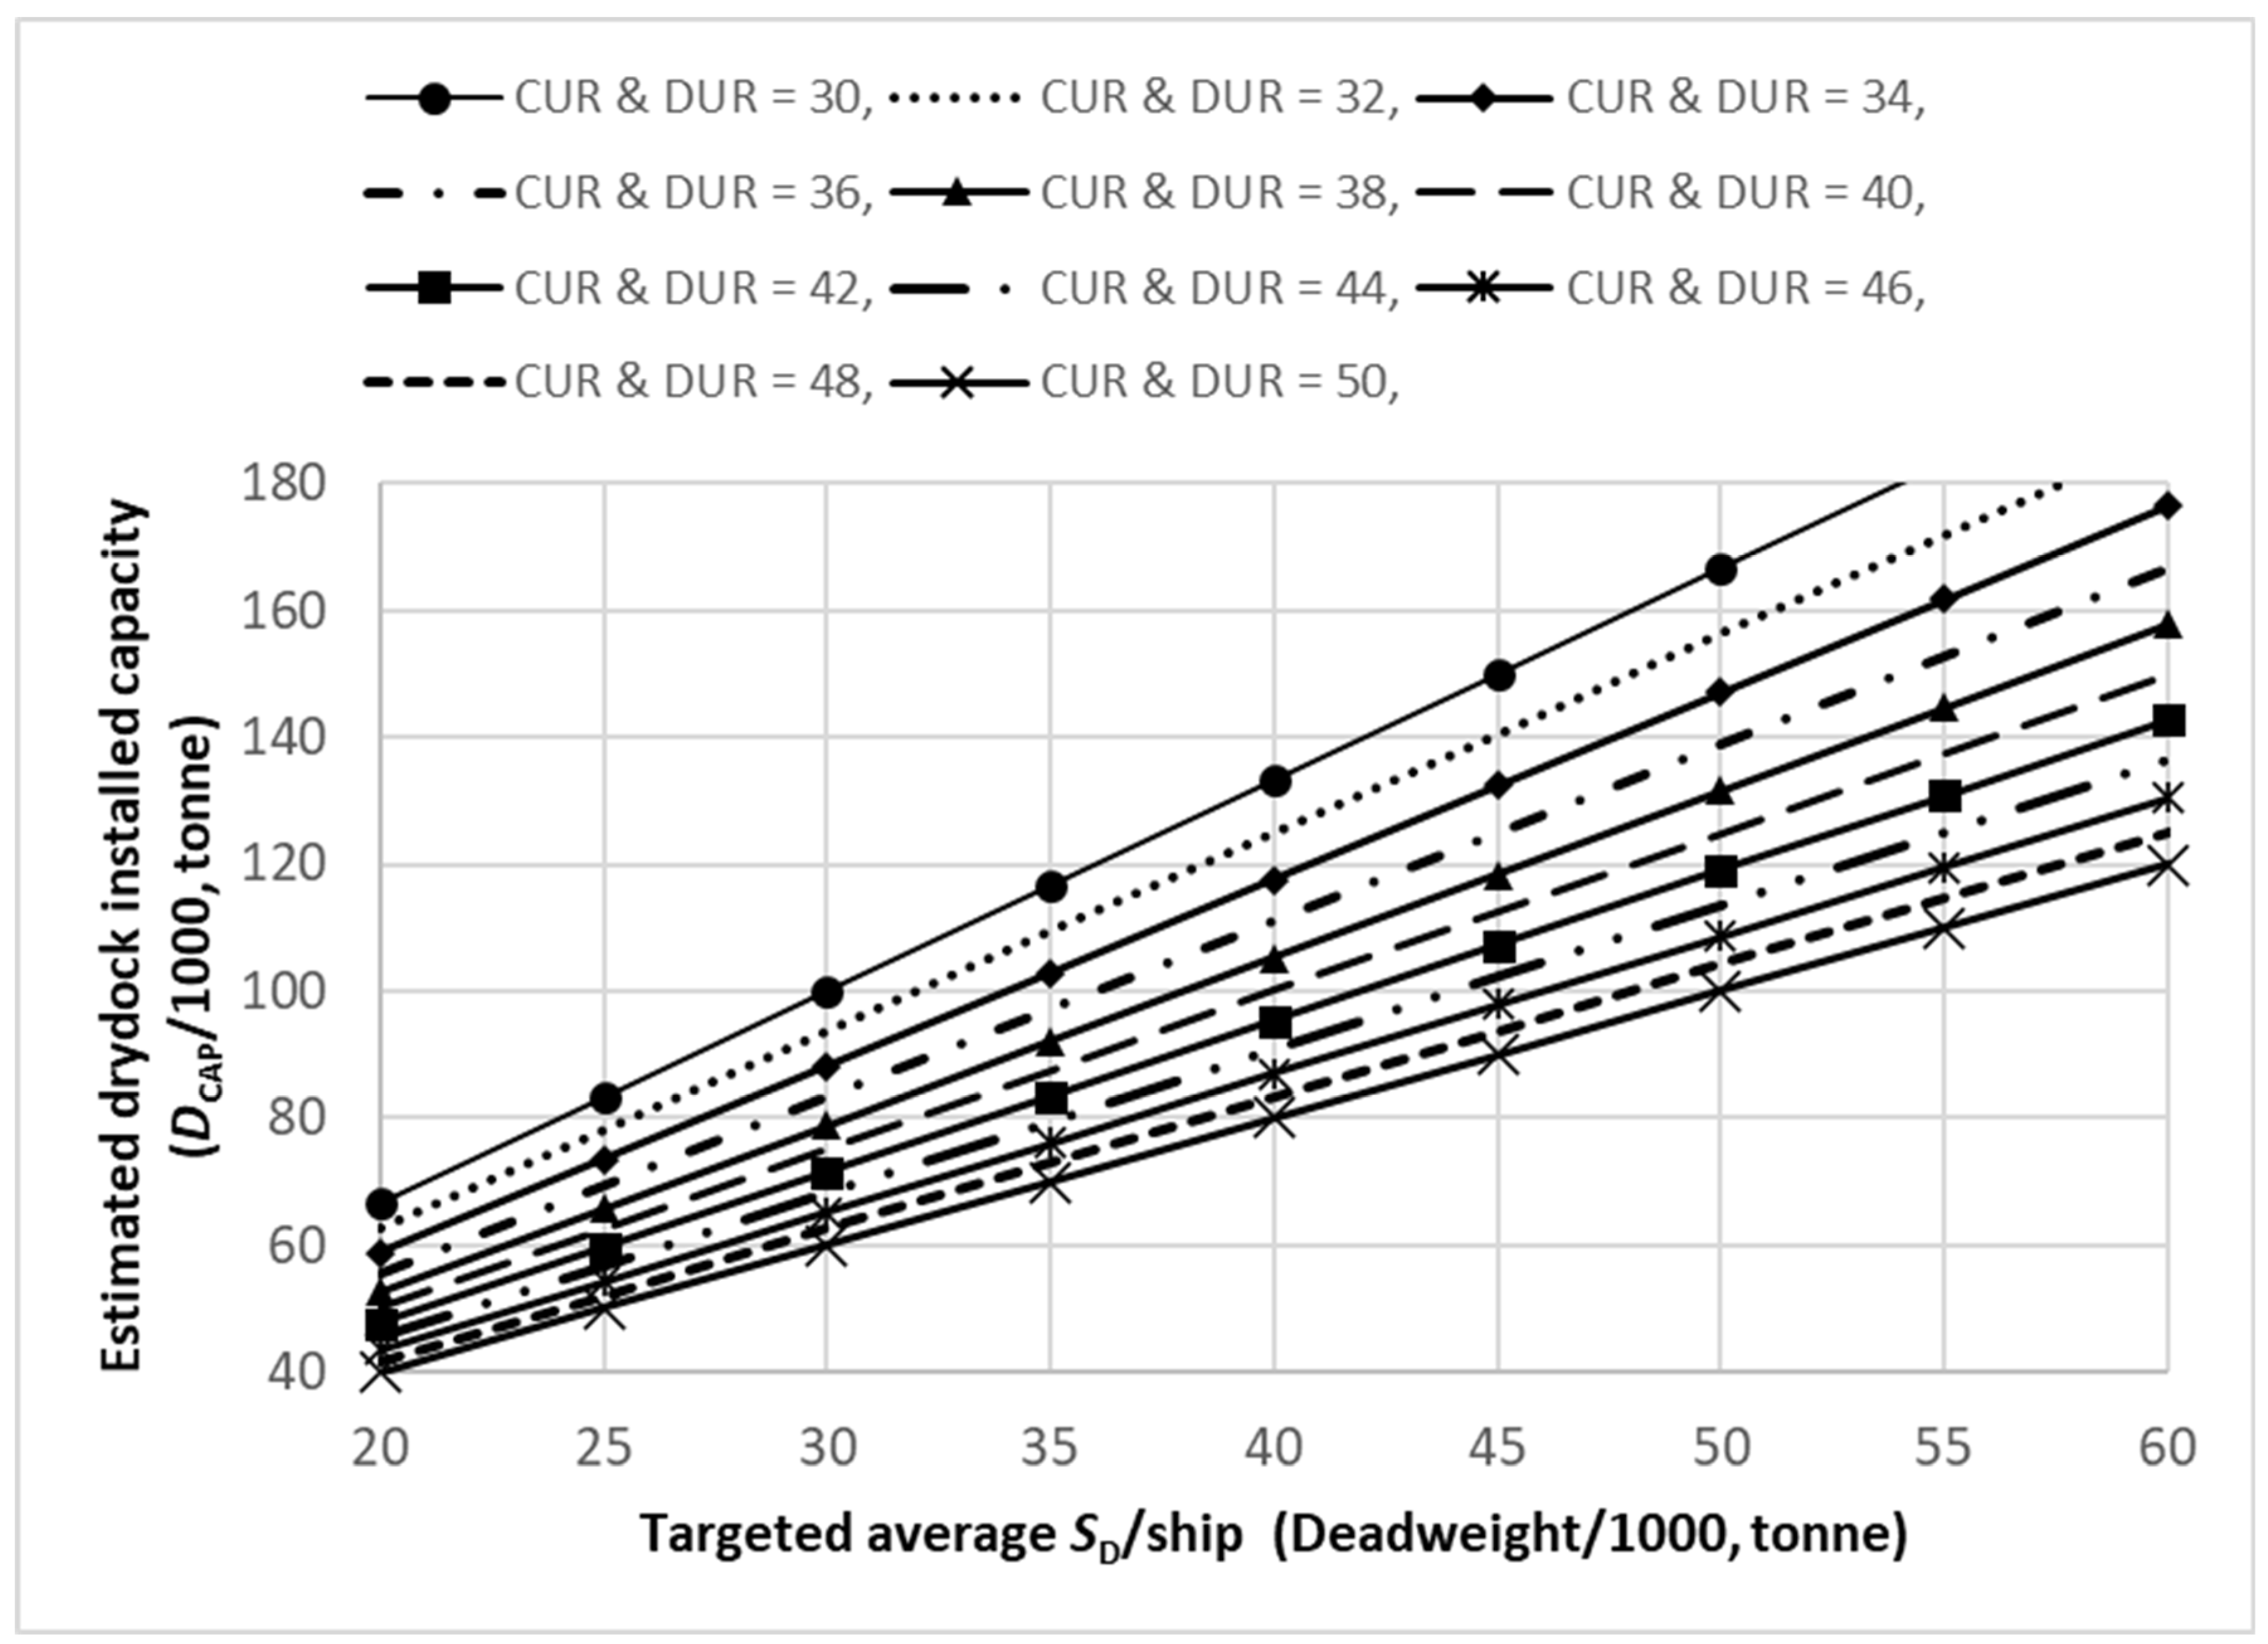
Referring to step 3 of the proposed selection guideline, Figure 34 is developed using hypothetical deadweight, CUR and DUR values. It demonstrates the relationship between ship deadweight (tonne) and drydock installed capacity for constant CUR and DUR values. Using Figure 34, the decision-maker may get a preliminary idea about the expected drydock capacity against an average deadweight per ship and a targeted CUR or DUR value. For example, for 40,000 tonnes average deadweight per ship and a targeted value of 40% CUR, the expected capacity of the drydock is about 100,000 tonnes. Of course, any other combination will work too.
7.0. Conclusions
This research investigates drydock’s selected physical performance indicators (PPIs) to choose the appropriate drydock capacity to achieve a set of pre-determined PPIs. Analyses of drydocking data of two (2) chosen drydocks over fourteen years suggest that drydocks under study are oversized to some extent and reduce the level of PPIs, resulting in underutilized drydocks. A smaller capacity drydock would have been better in DOR, CUR and DUR. However, it is shown that drydocks A and B have overcapacities, and a reduced capacity drydock would have been a better choice. A step-by-step guide is proposed to select the appropriate drydock capacity that will perform to achieve a set of pre-determined PPIs from a technical point of view. The findings may be helpful for the decision-makers in selecting the appropriate drydock capacity.
Drydock capacity in terms of a tonne (refers to the maximum deadweight of the ship that can be accommodated in the drydock) may be expressed as a function of the deadweight of drydocking ships DOR, CUR and DUR. Then, a regression equation may be developed for the capacity of a drydock (dependent variable) in terms of the size (deadweight) of the ship, DOR, CUR, and DUR (independent variables). This might be a recommended research work for the future.
References
- Akan, A.O., Schafran, G.C., Pommerenk, P. and Harrell, L.J. 2000 Modelling storm-water runoff quantity and quality from marine drydocks, Journal of Environmental Engineering Vol.125, Issue 1, January 2000.
- Becht, P.M., and Hetherman, J.H. 2016 Introduction to dry docks, Chapter 10, Design of Marine Facilities, Engineering for Port and Harbour Structures, Third Edition, ASCE Press.
- Cheng, Y.S., and Zeng, G.W. 1995 Optimum deposition of wooden blocks during ship docking. Shipbuilding of China, 1, pp.18-27.
- Cheng, Y.S., Au, F.T.K., Tham, L.G., and Zeng, W.G. 2004 Optimal and robust design of docking blocks with uncertainty. Engineering Structures, 26, pp.449-510.
- Denis, N.A. 2018 Overview of the Safety Operations in a Floating-Graving Dry-Docking System, International Journal of Advances in Scientific Research and Engineering (ijasre), Volume 4, Issue 3, March 2018.
- Department of Defense, United States of America, 2002 Unified Facilities Criteria (UFC), Design: Graving Dry Docks, UFC 4-213-10,15 August 2002.
- Jiang, I., Grubbs, K., Haith, R., and Santomartino, V. 1987 DRYDOCK: an interactive computer program for predicting dry dock blocks reactions. Transactions of Society of Naval Architects and Marine Engineers, 95, pp.29-44.
- Kumanoto, T., Kameda, H., Hoshiya, M., and Ishii, K. 1990 Construction of difficult dry dock in Yokohama, Japan. Journal of Construction Engineering and Management, 116, 2, pp. 201-220.
- Mazurkiewicz, B.K. 1980 Design and construction of dry docks. Trans Technology Publications Limited.
- Najafi-Jilani, A., and Naghavi, A. 2009 Numerical modelling of seawater flow through the flooding system of dry docks, International Journal of Naval Architecture and Ocean Engineering, Volume 1, Issue 2, December 2009, pp.57- 63.
- Salzer, J.R. 1986 Factors in the selection of drydocking systems for shipyards. Journal of Ship Production, Vol.2, No.2, May 1986, pp.110-119.
Figure 1.
Distribution of deadweight of ships (SD) in drydock A.
Figure 1.
Distribution of deadweight of ships (SD) in drydock A.
Figure 2.
Cumulative distribution of deadweight of ships (SD) in drydock A.
Figure 2.
Cumulative distribution of deadweight of ships (SD) in drydock A.
Figure 3.
Distribution of drydocking time of ships (DTIME) in drydock A.
Figure 3.
Distribution of drydocking time of ships (DTIME) in drydock A.
Figure 4.
Cumulative distribution of drydocking time of ships (DTIME) in drydock A.
Figure 4.
Cumulative distribution of drydocking time of ships (DTIME) in drydock A.
Figure 5.
Distribution of deadweight of ships (SD) in drydock B.
Figure 5.
Distribution of deadweight of ships (SD) in drydock B.
Figure 6.
Cumulative distribution of deadweight of ships (SD) in drydock B.
Figure 6.
Cumulative distribution of deadweight of ships (SD) in drydock B.
Figure 7.
Distribution of drydocking time of ships (DTIME) in drydock B.
Figure 7.
Distribution of drydocking time of ships (DTIME) in drydock B.
Figure 8.
Cumulative distribution of drydocking time of ships (DTIME) in drydock B.
Figure 8.
Cumulative distribution of drydocking time of ships (DTIME) in drydock B.
Figure 9.
Year-wise drydock occupancy rate (DOR) of drydock A.
Figure 9.
Year-wise drydock occupancy rate (DOR) of drydock A.
Figure 10.
Year-wise capacity utilization rate (CUR) of drydock A.
Figure 10.
Year-wise capacity utilization rate (CUR) of drydock A.
Figure 11.
Year-wise drydock utilization rate (DUR) of drydock A.
Figure 11.
Year-wise drydock utilization rate (DUR) of drydock A.
Figure 12.
Year-wise PPIs (DOR, CUR and DUR) of drydock A.
Figure 12.
Year-wise PPIs (DOR, CUR and DUR) of drydock A.
Figure 13.
Year-wise drydock occupancy rate (DOR) of drydock B.
Figure 13.
Year-wise drydock occupancy rate (DOR) of drydock B.
Figure 14.
Year-wise capacity utilization rate (CUR) of drydock B.
Figure 14.
Year-wise capacity utilization rate (CUR) of drydock B.
Figure 15.
Year-wise drydock utilization rate (DUR) of drydock B.
Figure 15.
Year-wise drydock utilization rate (DUR) of drydock B.
Figure 16.
Year-wise PPIs (DOR, CUR and DUR) of drydock B.
Figure 16.
Year-wise PPIs (DOR, CUR and DUR) of drydock B.
Figure 17.
Overall PPIs of drydocks A and B.
Figure 17.
Overall PPIs of drydocks A and B.
Figure 18.
Ships’ deadweight group versus average DOR, CUR and DUR for drydock A.
Figure 18.
Ships’ deadweight group versus average DOR, CUR and DUR for drydock A.
Figure 19.
Ships’ deadweight group versus average DOR, CUR and DUR for drydock B.
Figure 19.
Ships’ deadweight group versus average DOR, CUR and DUR for drydock B.
Figure 20.
Average DOR versus drydock capacity for drydock A.
Figure 20.
Average DOR versus drydock capacity for drydock A.
Figure 21.
Average CUR versus drydock capacity for drydock A.
Figure 21.
Average CUR versus drydock capacity for drydock A.
Figure 22.
Average DUR versus drydock capacity for drydock A.
Figure 22.
Average DUR versus drydock capacity for drydock A.
Figure 23.
Average DOR versus drydock capacity for drydock B.
Figure 23.
Average DOR versus drydock capacity for drydock B.
Figure 24.
Average CUR versus drydock capacity for drydock B.
Figure 24.
Average CUR versus drydock capacity for drydock B.
Figure 25.
Average DUR versus drydock capacity for drydock B.
Figure 25.
Average DUR versus drydock capacity for drydock B.
Figure 26.
Estimated PPIs versus drydock capacity for drydock A.
Figure 26.
Estimated PPIs versus drydock capacity for drydock A.
Figure 27.
Level of PPIs at different drydock capacities for drydock A.
Figure 27.
Level of PPIs at different drydock capacities for drydock A.
Figure 28.
Estimated PPIs against the drydock capacity for drydock B.
Figure 28.
Estimated PPIs against the drydock capacity for drydock B.
Figure 29.
Level of PPIs at different drydock capacities for drydock B.
Figure 29.
Level of PPIs at different drydock capacities for drydock B.
Figure 30.
Projected CUR and DUR versus variation (%) in average generated deadweight for drydock A.
Figure 30.
Projected CUR and DUR versus variation (%) in average generated deadweight for drydock A.
Figure 31.
Projected CUR and DUR versus average generated deadweight for drydock A.
Figure 31.
Projected CUR and DUR versus average generated deadweight for drydock A.
Figure 32.
Projected CUR and DUR versus variation (%) in average generated deadweight for drydock B.
Figure 32.
Projected CUR and DUR versus variation (%) in average generated deadweight for drydock B.
Figure 33.
Projected CUR and DUR versus average generated deadweight for drydock B.
Figure 33.
Projected CUR and DUR versus average generated deadweight for drydock B.
Figure 34.
Estimated drydock capacity versus average deadweight/ship at constant CUR or DUR.
Figure 34.
Estimated drydock capacity versus average deadweight/ship at constant CUR or DUR.
Table 1.
Average deadweight of ships against length for types of ships.
Table 1.
Average deadweight of ships against length for types of ships.
| |
Estimated deadweight (tonne) |
| Type of ships |
Length = 268m |
Length = 352m |
| Crude oil tanker |
150,000 |
282,000 |
| Container carrier |
65,500 |
133,000 |
| Bulk carrier |
126,000 |
275,000 |
| Chemical tanker |
101,000 |
205,000 |
| L.P.G. carrier |
68,000 |
133,000 |
Table 2.
Summary of factors to be considered in the selection of a graving drydock system.
Table 2.
Summary of factors to be considered in the selection of a graving drydock system.
| |
Factors |
Descriptions |
| 1 |
Vessel size |
Virtually unlimited, the largest docks handle vessels, over 1 million deadweight tonnes. |
| 2 |
Sitting restrictions |
Local extremes of soil conditions can create extreme variations in the initial cost. |
| 3 |
Speed of operation |
Dependent on pumping capacity. Typical installations utilize rates of between 6 to 10 hours. |
| 4 |
Dredging/Siltation |
The adjacent bottom level must be maintained below the sill of gate elevation. |
| 5 |
Maintenance |
Gate-Periodic drydocking for vessel-like maintenance. Machinery - Preventive maintenance and occasional overhaul. –Basin-in-place corrosion control and repair. Protection - impressed current cathodic protection systems and sacrificial zincs are usually provided for underwater steel elements. |
| 6 |
Guideline, Annual reserve for maintenance |
1-2% of the initial cost. |
| 7 |
Capital Recovery Potential |
None |
| 8 |
Land Area Required |
Usually, a graving dock is inset into a shipyard site and, therefore, requires an amount of real estate equal to the footprint of the dock plus access. |
| 9 |
Compatibility with transfer to land berths |
Graving docks are very seldom used in conjunction with land berths. |
| 10 |
Material flow to vessels in drydock |
All material must be removed from the area before docking and undocking. Cranes are usually installed on dock walls to facilitate handling. New docks sometimes have a vehicle ramp to remedy this traditional shortcoming. |
| 11 |
Earthquake resistance |
Particular design criteria must be considered for installing docks in earthquake-prone areas. Ships blocking must also be considered in these areas. |
| 12 |
Special features available |
Intermediate gates permit the subdivision of graving docks for more than one vessel at a time. Double-ended docks with intermediate gates sometimes enable a long dock to function as two docks. |
| 13 |
Simplicity of drydocking |
Winches and centering guides are used to assist in positioning ships. The crew size is a function of the vessel size. Operations are carried out in the relative calm of a protected basin. |
Table 3.
Particulars of drydock A and B.
Table 3.
Particulars of drydock A and B.
| Drydock |
Length (m) |
Breadth (m) |
Depth (m) |
Capacity (tonne) |
| A |
268 |
39 |
11 |
96,000 |
| B |
352 |
55 |
13 |
296,000 |
Table 4.
Year-wise handling of ships in drydock A.
Table 4.
Year-wise handling of ships in drydock A.
| |
|
Average |
| Operating year |
Number |
deadweight |
docking time |
deadweight * docking time |
| of ships |
(tonne) |
(day) |
(tonne * day) |
| Year 1 |
54 |
31,884 |
6.00 |
215,516 |
| Year 2 |
48 |
36,798 |
6.92 |
276,013 |
| Year 3 |
53 |
34,830 |
6.53 |
231,444 |
| Year 4 |
55 |
32,594 |
6.04 |
202,469 |
| Year 5 |
52 |
33,329 |
6.52 |
222,449 |
| Year 6 |
51 |
33,372 |
5.86 |
209,974 |
| Year 7 |
51 |
35,849 |
6.39 |
224,624 |
| Year 8 |
54 |
36,021 |
6.02 |
220,289 |
| Year 9 |
51 |
31,570 |
6.86 |
222,135 |
| Year 10 |
62 |
39,642 |
6.11 |
235,617 |
| Year 11 |
44 |
32,699 |
6.82 |
213,641 |
| Year 12 |
59 |
33,125 |
6.69 |
242,590 |
| Year 13 |
50 |
24,864 |
7.58 |
185,332 |
| Year 14 |
27 |
28,946 |
5.07 |
141,647 |
| |
|
33,503 |
6.42 |
220,334 |
Table 5.
Year-wise handling of ships in drydock B.
Table 5.
Year-wise handling of ships in drydock B.
| |
|
Average |
| Operating year |
Number |
deadweight |
docking time |
deadweight * docking time |
| of ships |
(tonne) |
(day) |
(tonne * day) |
| Year 1 |
29 |
83,043 |
8.48 |
869,122 |
| Year 2 |
46 |
77,966 |
6.54 |
516,864 |
| Year 3 |
56 |
76,388 |
6.96 |
554,068 |
| Year 4 |
49 |
77,869 |
7.14 |
586,914 |
| Year 5 |
43 |
67,271 |
7.98 |
657,331 |
| Year 6 |
39 |
86,065 |
7.49 |
723,913 |
| Year 7 |
45 |
72,506 |
7.60 |
603,156 |
| Year 8 |
61 |
66,689 |
6.16 |
423,875 |
| Year 9 |
44 |
66,687 |
8.05 |
521,588 |
| Year 10 |
43 |
89,655 |
8.00 |
719,822 |
| Year 11 |
42 |
69,623 |
8.14 |
685,226 |
| Year 12 |
66 |
72,071 |
6.67 |
514,982 |
| Year 13 |
39 |
57,168 |
8.44 |
458,270 |
| Year 14 |
14 |
78,099 |
5.79 |
441,255 |
| |
|
73,800 |
7.35 |
582,766 |
Table 6.
Summary of Year-wise physical performance indicators of drydock A and B.
Table 6.
Summary of Year-wise physical performance indicators of drydock A and B.
| Operating year |
Drydock A |
Drydock B |
|
DOR (%) |
CUR (%) |
DUR (%) |
DOR (%) |
CUR (%) |
DUR (%) |
| Year 1 |
88.77 |
33.21 |
33.21 |
67.40 |
28.06 |
23.33 |
| Year 2 |
90.71 |
38.33 |
37.71 |
82.24 |
26.34 |
21.95 |
| Year 3 |
94.79 |
36.28 |
35.01 |
100.00 |
25.81 |
28.72 |
| Year 4 |
90.96 |
33.95 |
31.78 |
95.89 |
26.31 |
26.62 |
| Year 5 |
92.88 |
34.72 |
33.01 |
93.97 |
22.73 |
26.16 |
| Year 6 |
81.69 |
34.76 |
30.48 |
79.78 |
29.08 |
26.06 |
| Year 7 |
89.32 |
37.34 |
32.69 |
93.70 |
24.50 |
25.12 |
| Year 8 |
89.04 |
37.52 |
33.95 |
100.00 |
22.53 |
23.93 |
| Year 9 |
95.89 |
32.89 |
32.33 |
96.99 |
22.53 |
21.24 |
| Year 10 |
100.00 |
41.29 |
41.58 |
93.99 |
30.29 |
28.57 |
| Year 11 |
82.19 |
34.06 |
26.83 |
93.70 |
23.52 |
26.64 |
| Year 12 |
100.00 |
34.50 |
40.85 |
100.00 |
24.35 |
31.46 |
| Year 13 |
100.00 |
25.90 |
26.45 |
90.14 |
19.31 |
16.54 |
| Year 14 |
100.00 |
30.15 |
33.20 |
66.94 |
26.38 |
17.39 |
|
Disclaimer/Publisher’s Note: The statements, opinions and data contained in all publications are solely those of the individual author(s) and contributor(s) and not of MDPI and/or the editor(s). MDPI and/or the editor(s) disclaim responsibility for any injury to people or property resulting from any ideas, methods, instructions or products referred to in the content. |
© 2024 by the authors. Licensee MDPI, Basel, Switzerland. This article is an open access article distributed under the terms and conditions of the Creative Commons Attribution (CC BY) license (http://creativecommons.org/licenses/by/4.0/).
