1. Introduction
With the advent of COVID-19 in 2020, South Africa enacted a strict lockdown that inadvertently had negative consequences on the economy [
1,
2]. Subsequent surveys showed that as a result of COVID-19 and the associated lockdowns (ranging from Level 1 to 5 based on severity, with 5 being the most severe), approximately 2-3 million people lost their jobs between February and April 2020, with the Organisation for Economic Cooperation and Development (OECD) estimating the economy to have shrunk by 11.5% during this period [
3]. The lockdown was unsustainable and led to increased levels of poverty, hunger, and unemployment, especially among the most vulnerable members of society [
4]. Inevitably, it was the most vulnerable members of society like older adults, people of lower socio-economic status, and migrants who bore the largest brunt of the negative effects of the pandemic [
4]. These groups also have higher rates of comorbid chronic conditions, putting them at higher risk for infection and severe illness [
5]. Bidisha, Mahmood & Hossain (2020) [
6] also reported on the relationship between socio-economic status and vulnerability their study on food poverty during COVID-19 in Bangladesh. Invariably, the pandemic further deepened the economic vulnerability which was already affecting the disadvantaged prior to its onset [
7].
Furthermore, people in low-paying occupations, those holding lower levels of education, and the youth were the most affected as the effects of the pandemic fell disproportionately on their group, while other more advantaged groups were able to adjust their working conditions through enacting measures such as working from home, working time reductions and telework [
5]. The University of Johannesburg and Human Sciences Research Council COVID-19 Democracy Survey (Round 1 survey conducted in April and May 2020) also revealed that South Africans socio-economic situation deteriorated during the pandemic with 79% of the population requesting food parcels to support vulnerable people, 66% wanted the value of social grants to be increased, 65% said that government should create a basic income grant, and 60% appealed for debt relief for 3 months to cope with the COVID-19 crisis [
8,
9]. Therefore, studies attest to the disproportionate effects of COVID-19 based on the socio-economic risk and vulnerability of society, which also has a spatial bearing [
4,
5,
8,
9].
The socio-economic risk index (SERI) has been used to measure levels of socio-economic risk vulnerability using several socio-economic indicators such as household income, employment status, dwelling type, levels of education, and mobility. The SERI can also be used to measure levels of inequality within communities. As such, the SERI has a spatial bearing, especially in South Africa with a strong divide in socio-economic structure based on the social engineering of the country as a consequence of the apartheid regime [
10]. Furthermore, the country is characterised by a twin health system – one for people of higher socio-economic status who can afford medical care, and the other dominated by people of higher socio-economic risk, who can barely afford the private, more resourced health system. Turok and Visagie (2021) [
2] reported on the unequal impact of COVID-19 on peoples’ livelihoods and well-being across different types of urban areas in South Africa. Not only does this study attest to the unequal effects of COVID-19 on the South African society, but also emphasise the spatial differences between high density and low-density suburbs, as well as informal settlements within selected cities in South Africa.
In addition to this socio-economic disparity, the effects of the pandemic have been perceived differently by the various socio-economic groups across South Africa. This is also confirmed by studies such as those by Kim et al. (2021) [
11] who found in a study of 391 individuals in a part of Gauteng that socio-economic variables such as age, gender, level of education and household density played a significant role in shaping people’s perceptions about the pandemic. Also, a Human Sciences Research Council (HSRC) study by Reddy et al. (2020) [
12] found differences in perceptions of COVID-19 amongst the urban population, particularly with those living in informal settlements perceiving COVID-19 to be a major cause of their deteriorating living conditions as it resulted in their limited access to food and exacerbated their financial conditions [
12]
Spatial variations associated with socio-economic risk in COVID-19 studies have been conducted to identify areas with greater likelihood to be affected by the pandemic in order to optimise control programmes. For example, the work by Guan et al (2020) [
13] is one of the earliest and most cited that characterised the spread of and patients of COVID-19 by age, gender, origin (by province) and migration status and found a link between the ability to travel and the rates of infection. Similarly, Ramírez-Aldana et al. (2020) [
14] in a study on Iranian provinces, used various statistical approaches to show the spatial distribution of COVID-19 cases based on climatic and socio-economic characteristics of those provinces, and how these variables could predict the spread of the disease. A similar study conducted in South Korea [
15] found a link between low socio-economic status and higher incidence of COVID-19 infections, mostly because of attitudes towards the virus and lack of access to health facilities. These, and other studies, demonstrate the importance of socio-economic factors and attitudes in the mapping of perceptions on COVID-19.
2. Materials and Methods
2.1. GCRO data
The Gauteng City Region Observatory (GCRO) has been conducting biennial Quality-of-Life surveys since 2009. These surveys give insight into the quality of life of Gauteng residents based on variables such as satisfaction with government services, life improvement or deterioration, psycho-social attitudes, and political perspectives, among others. The 2020/2021 survey was conducted between October 2020 to May 2021, and involved fieldworkers visiting 529 wards within the province to conduct face-to-face interviews. During the period of the survey, South Africa experienced a 2nd wave of COVID-19 infections in December 2020, which resulted in the increased lockdown levels from an adjusted level 1 to an adjusted level 3 at the end of December 2020. Thereafter, the lockdown was lowered from an adjusted level 3 to an adjusted level 1 on 1 March 2021 [
16,
17]. In each of the 529 wards of Gauteng, a minimum of 20 interviews were conducted, while a minimum of 600 interviews were undertaken for each of the nine municipalities in the Gauteng City Region. This was done to ensure that the sample was representative. In total, 13 616 adults aged 18 and above participated in the survey. Data was weighted against the Statistics South Africa (StatsSA) provincial population estimates for 2021 to avoid bias in the survey results.
2.2. Study Area Showing Residential Density
Gauteng comprises the Johannesburg, Tshwane and the Ekurhuleni metropolitan municipalities, and the Sedibeng and Rand West City district municipalities. According to the StatsSA mid-year population estimates for 2020, the province contributed the largest share of the population of the country, comprising 15 200 000 people, or 25.8% of the country’s population. In-migration is an important demographic factor in Gauteng, as it is estimated that for the period 2016–2021, Gauteng experienced the largest inflow of migrants of approximately 1 643 590 to its various municipalities, particularly the City of Johannesburg metro [
18] and other high-density residential areas in the other municipalities.
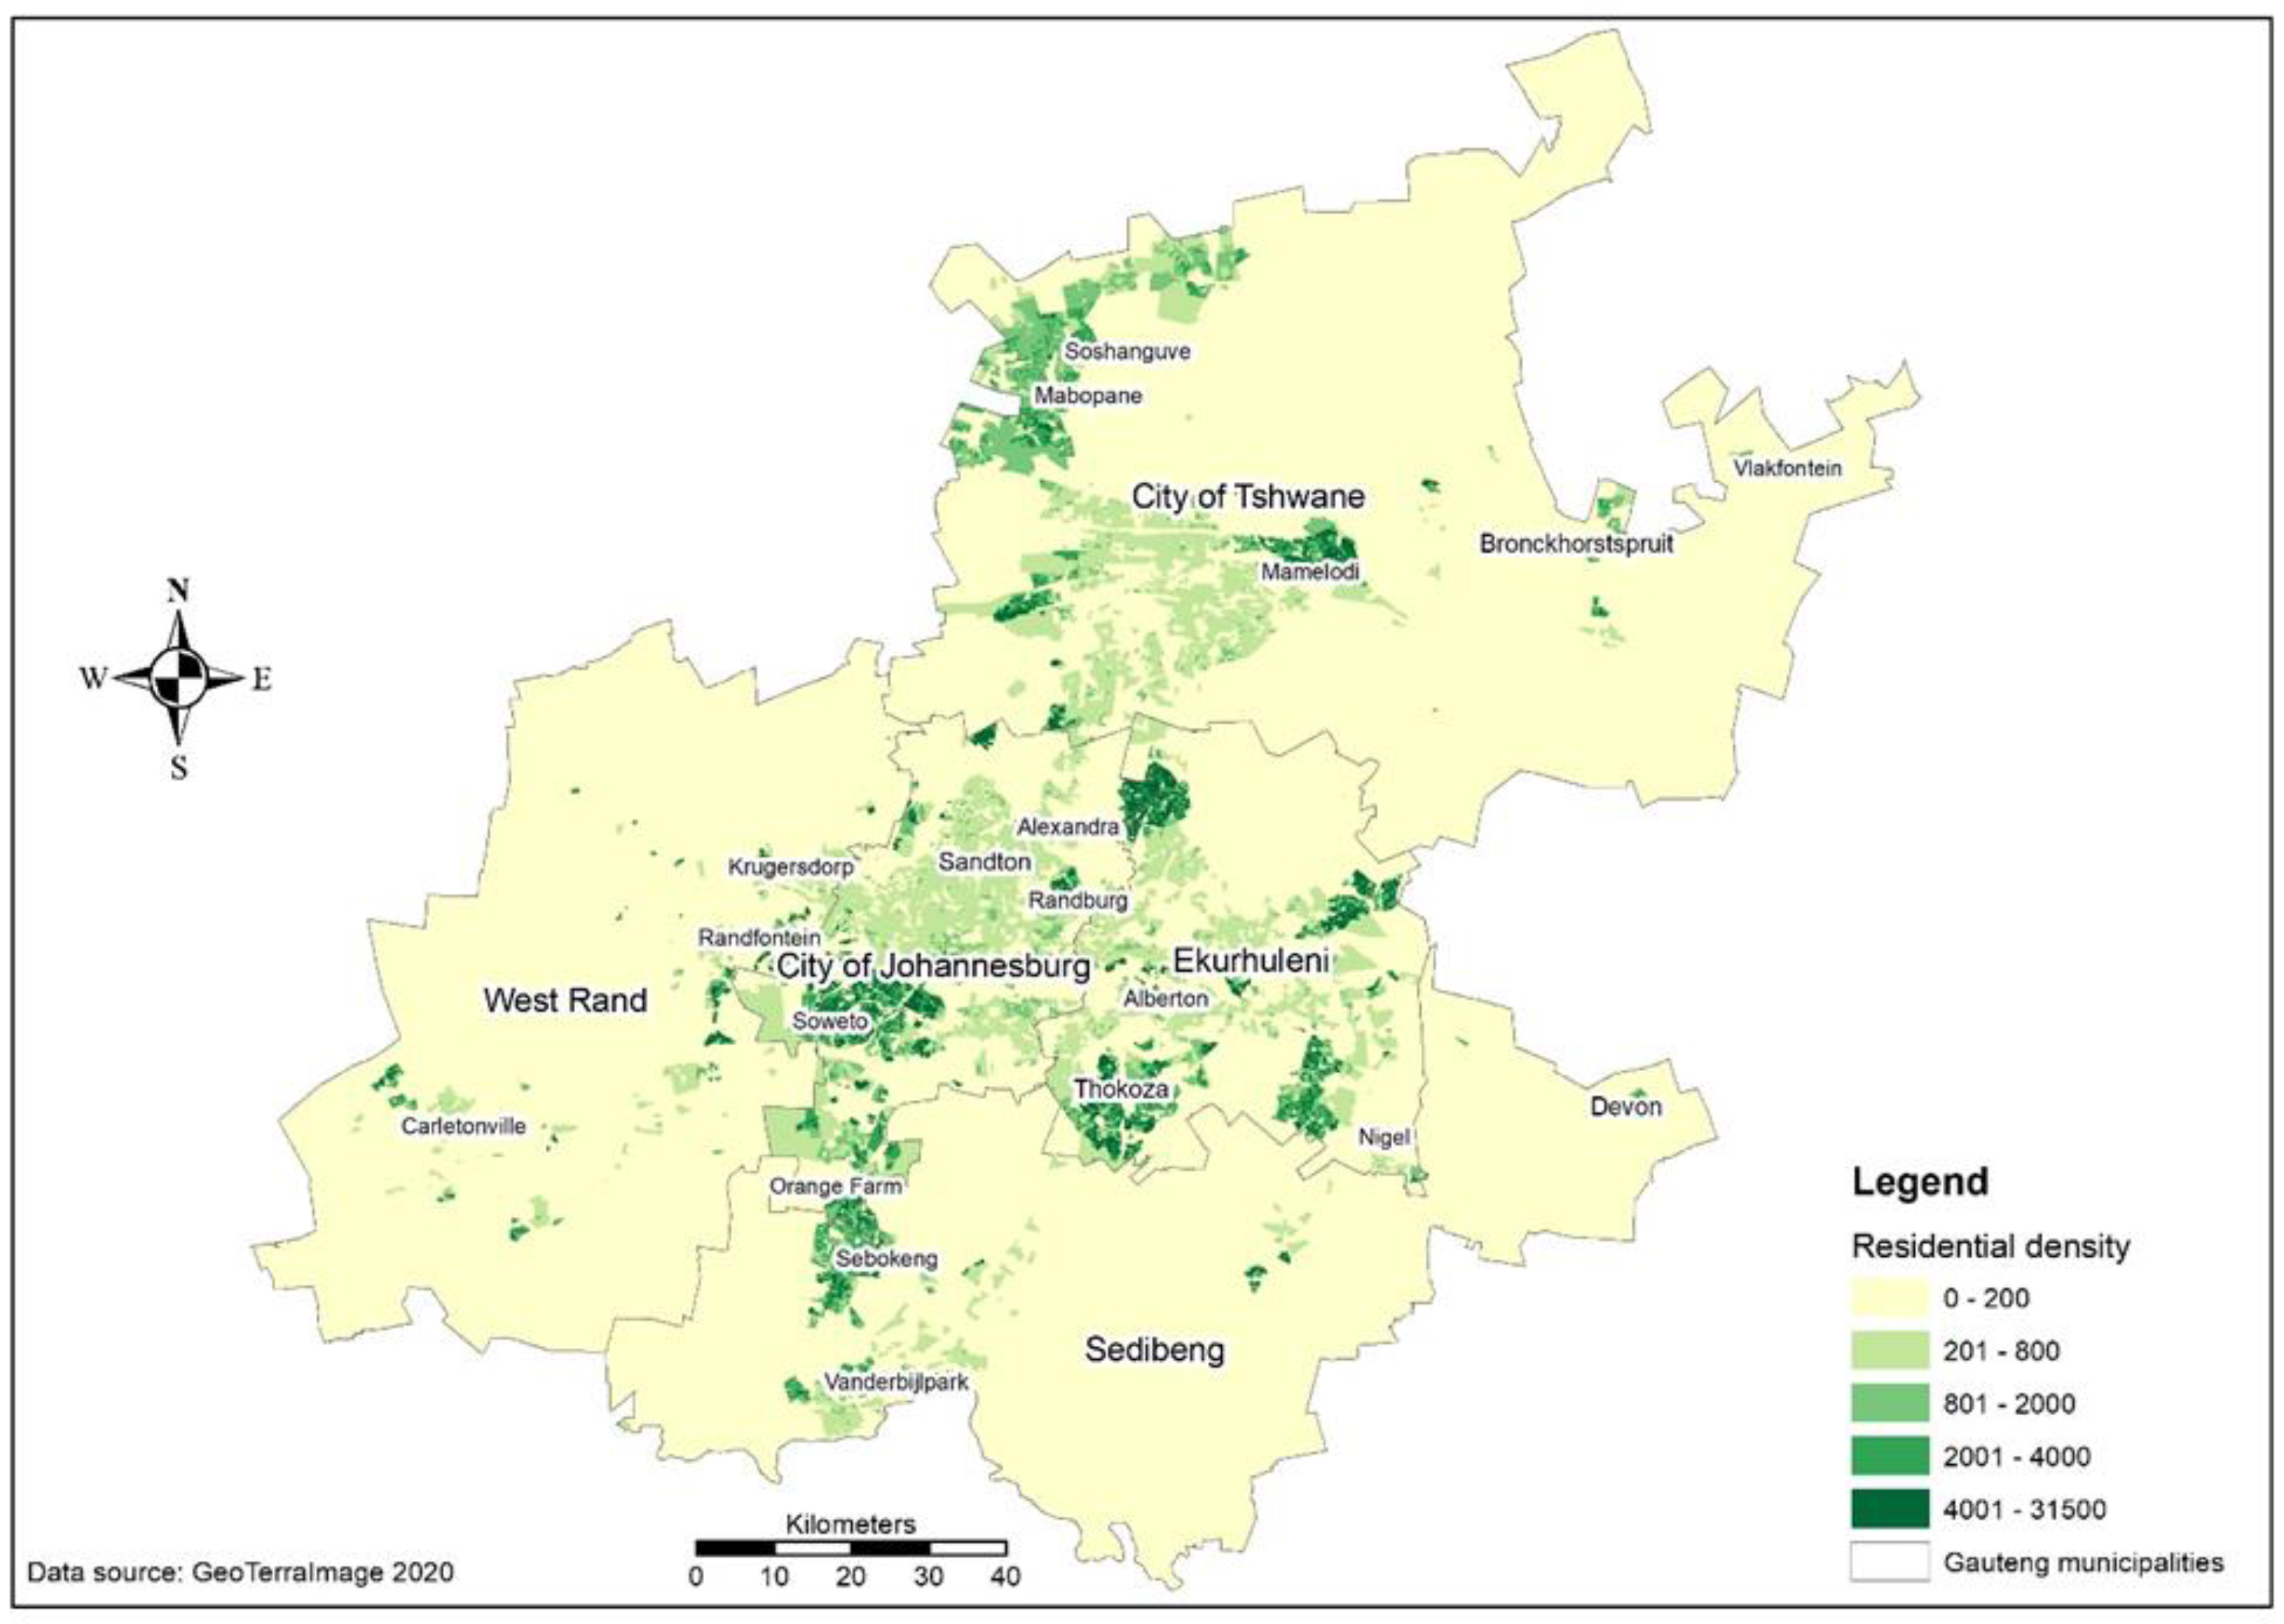
Figure 1 gives an illustration of the residential density in Gauteng [
19].
2.3 Demographic Characteristics of residents of Gauteng
According to GeoTerraImage (GTI) (2020) [
19] the population of Gauteng comprises 80.3% black people, 2.5% coloureds, 1.5% Indians/Asians, and 15.3% white people. Approximately 53.4% are females and 46.4% are males. In the past few decades, Gauteng has seen an increase in the number of informal settlements as a result of population growth [
19]. As such, 15% of the settlements in the province are classified as informal (e.g. corrugated housing, caravans), with the rest being formal dwellings in various forms. In terms of age, the population is dominated by people aged between 25 and 44, who comprise 46% of the population. Ostensibly, this age group also comprises the large immigrant population of job-seekers and workers in the province. Approximately 11% of the population either has only a primary education or none at all, 60% have a matric or equivalent, and 26% have some form of tertiary education. The unemployment rate of the province was around 31%, and of those who were employed, approximately 66% were employed in the formal sector while the rest were employed in the informal sector (GTI 2020) [
19].
2.4. Choropleth Mapping
Data from GTI (2020) [
19] was used to spatially characterise the socio-economic risk index for Gauteng, whilst data from the GCRO was used to measure and spatially characterise perceptions of COVID-19 using choropleth maps. Socio-demographic characteristics such as gender, age, dwelling type, and levels of education were used to measure people’s perceptions against selected variables namely (i). ‘
I think that the information supplied by government on COVID-19 was scant’, measured on a 5-point Likert Scale from 1-Agree to 5-Strongly disagree, (ii) ‘
How has life changed since COVID-19?, measured on a scale of 1-Worse-off, 2-No change, 3-Better, and (iii) ‘
What is your overall satisfaction with life after COVID-19?’, measured on a 5-point Likert scale of 1-Very satisfied to 5-Very dissatisfied. Choropleth mapping has been used by researchers such as Weinstein et al. (2021) [
15] in the precision mapping of COVID-19 vulnerable locales by epidemiological and socio-economic risk factors in South Korean, among other studies [
20,
21], and this study will follow an almost similar approach.
2.5. Geographically Weighted Regression for Determining Socio-Economic Factors Influencing COVID-19 Perceptions
Geographically Weighted Regression (GWR) was used to assess how perception variables on COVID-19 (dependent variables) can be explained by variations in socio-economic variables (explanatory variables) spatially. The explanatory variables included age, gender, population group and education level. These variables were selected since other variables in the data, such as income levels and unemployment status showed high levels of collinearity. GWR has been used in the mapping of COVID-19 vulnerable locales in Korea [
15] and in mapping the influence of demographic, social, and environmental factors on the COVID-19 pandemic on an urban population in Poland [
22] among several other studies. Geographically Weighted Poisson Regression Model (GWPR) is one among many regression models that take localised factors into account in the estimation of study variables, using maximum likelihood estimations [
23]. Both the spatial pattern analysis and the GWR modelling were implemented in ArcGIS Pro [
24].
Given that the outcome or dependent variables measure counts of occurrences (total number of people per ward), Poisson regression was applied to build the GWR models. GWR is different from other global models in the sense that it builds Ordinary Least Square (OLS) models at each locality by assuming non-stationarity of relationships (such as in our data where sentiments change over time) across space [
25].
The GWR estimates the weights (coefficients, β) of independent variables as:
with the estimator:
Having identified the independent variables, variations in space are then estimated using GWR, using the regression model:
With the estimator:
where, in equations 1 – 4, W(i) is a matrix of weights specific to location i such that observations nearer to i are given greater weight than observations further away; yi is the dependent variable at location i; xik is the kth independent variable at location i; β0 is the intercept parameter at location i; εi is the random error at location i. X is the matrix of the independent variables with a column of 1s for the intercept; Y is the dependent variable vector, and T is the vector of m + 1 local regression coefficients [
25].
3. Results
3.1. The Socio-Economic Risk Index and COVID-19 for Gauteng, 2020
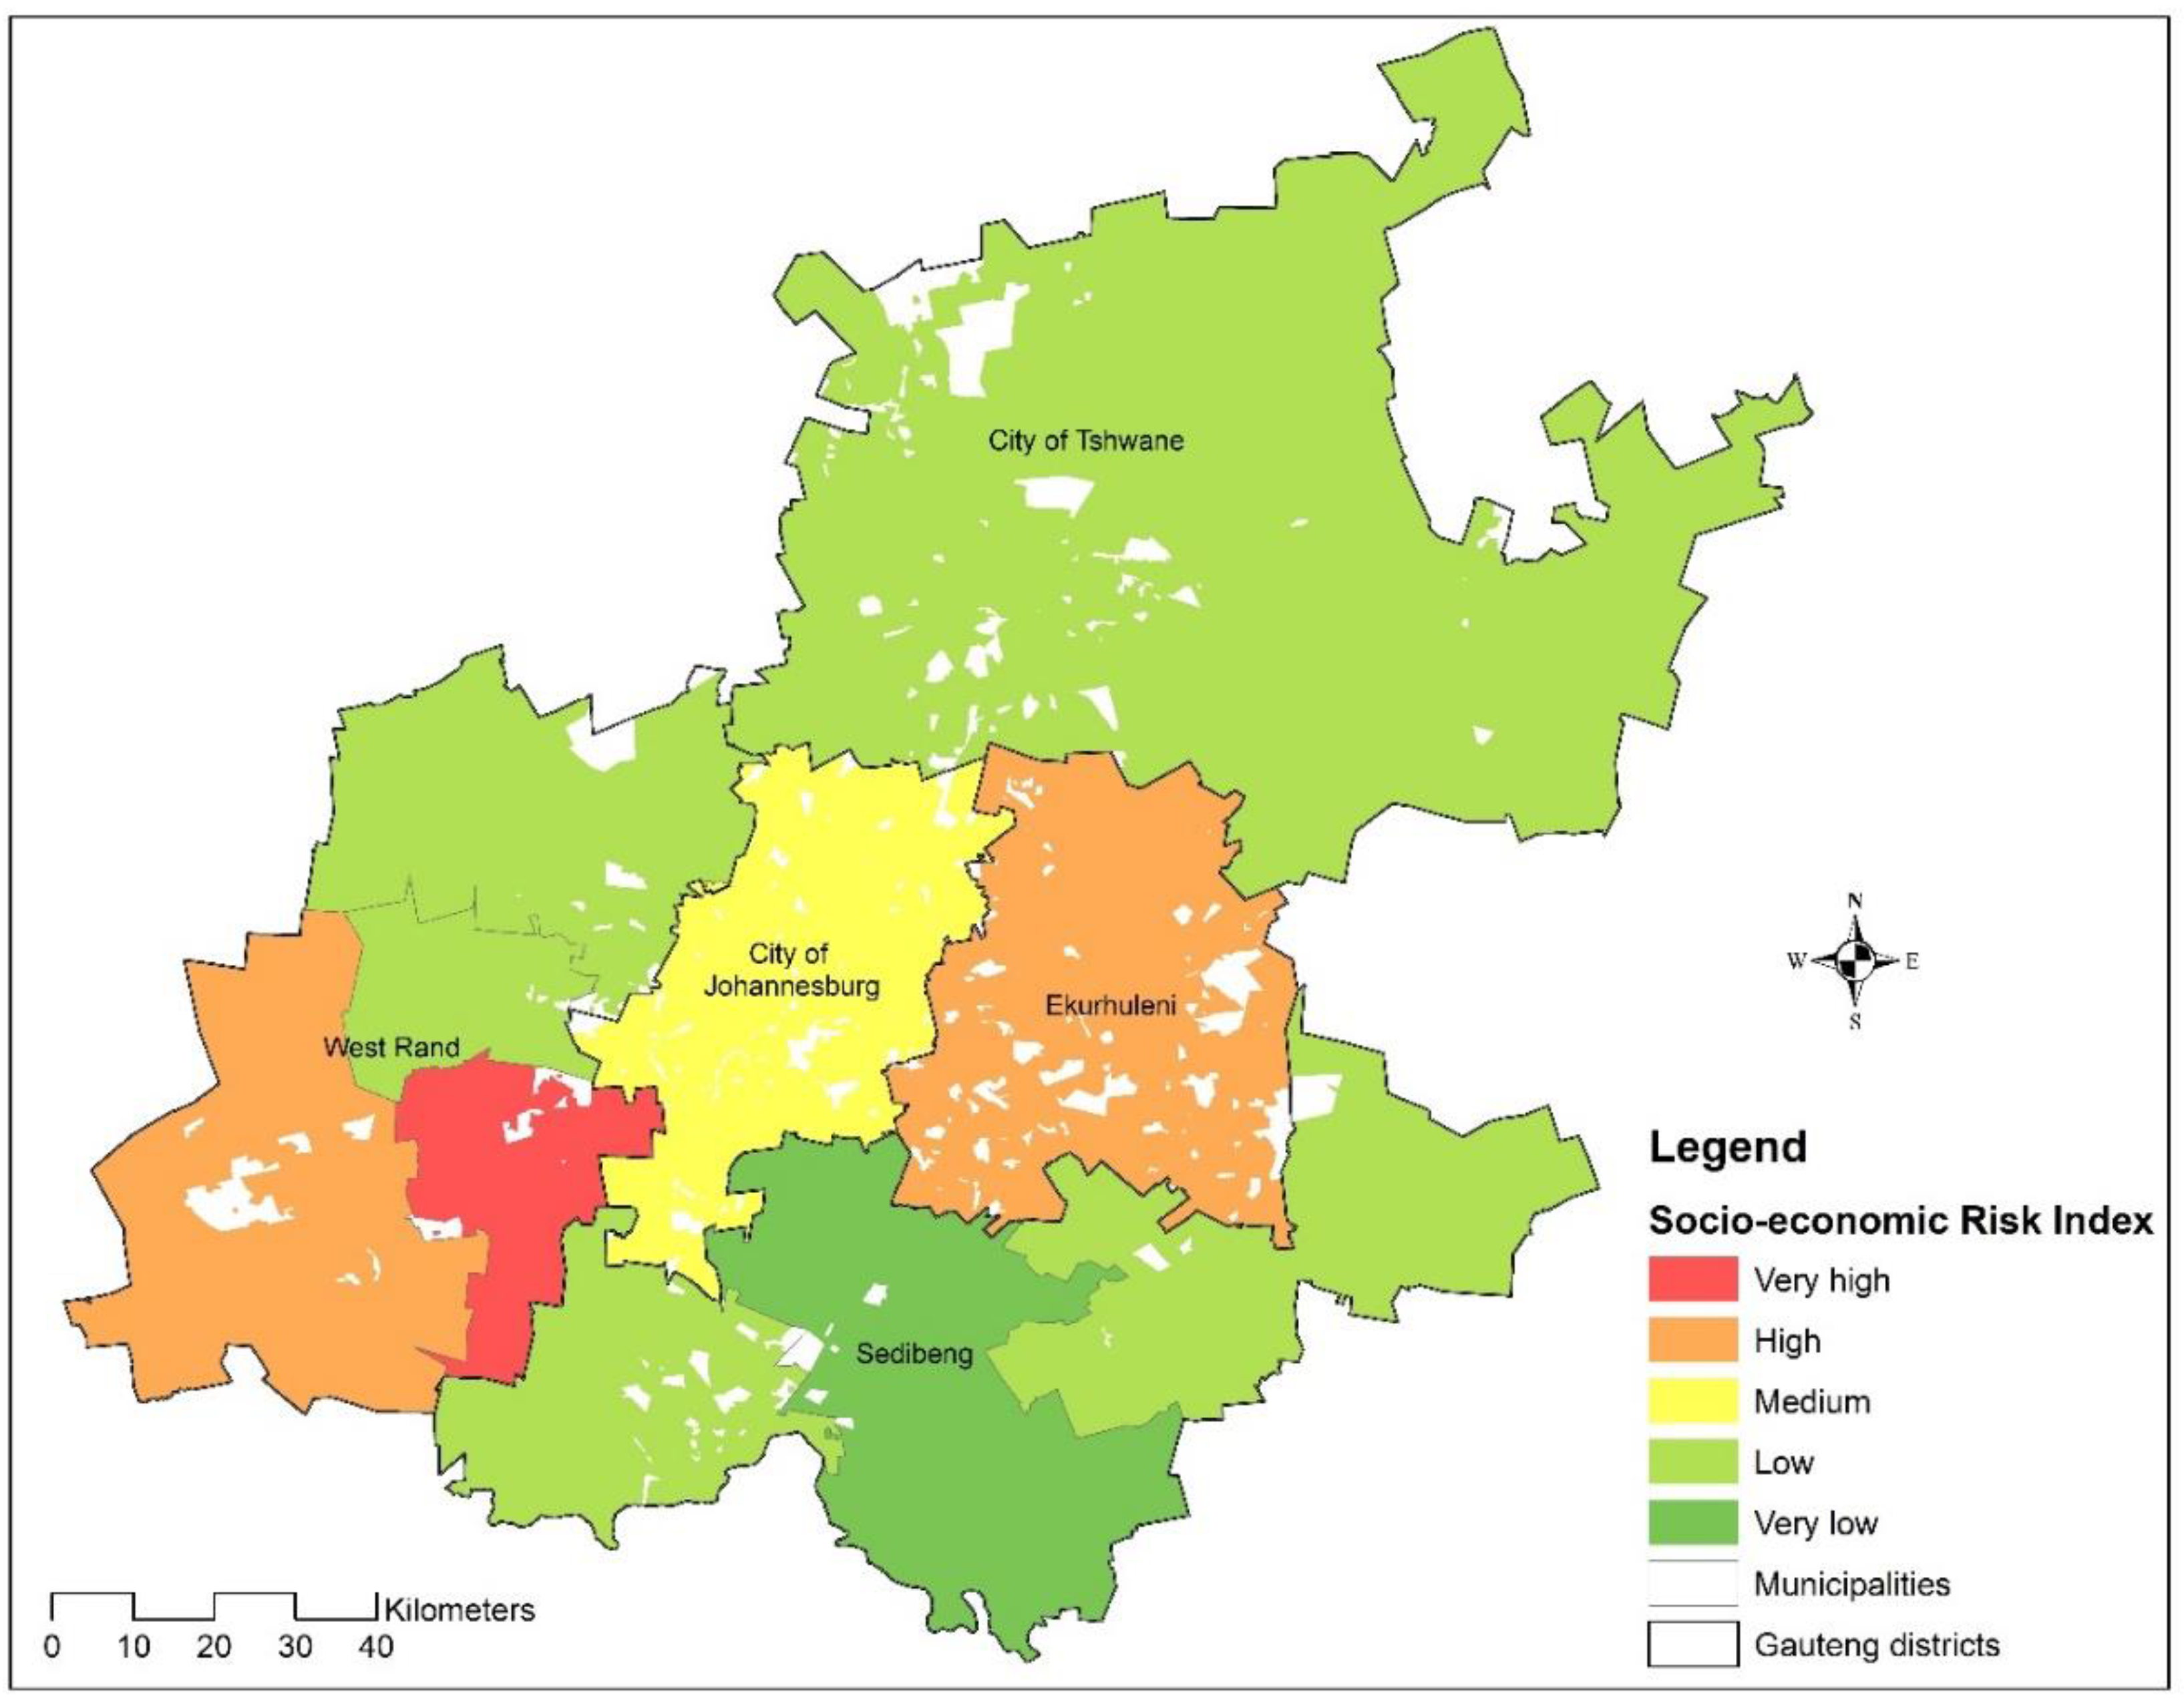
Figure 2 below shows the SERI for Gauteng municipalities, as calculated by GTI 2020 [
19]. The SERI measures the vulnerability or risk of a population, based on factors such as income, education levels, and mobility, among others. These factors determine the quality of life of an individual, and therefore susceptibility to socio-economic risk. Other studies, such as that by Gordon et al. (2020) [
20] measured vulnerability during COVID-19 used different vulnerability indicators, for example access to running water, sanitation facilities, access to information, family size within a household, and ages of people within a household (assuming that larger families and the elderly are more vulnerable to COVID-19). In
Figure 2, the SERI is ranked from very high to very low, and coincides with areas of high population density depicted in
Figure 1. For example, 1 municipality in the West Rand district (namely Rand West City) has a very high index value and the other (Merafong City) has a high value. Ekurhuleni to the east has a high SERI. These areas are also characterised by high levels of unemployment, sprouting informal settlements, and densely structured dwellings. The rest of the municipalities in the province, have a low to very low SERI, except for the City of Johannesburg which has a medium SERI.
Several studies that have assessed COVID-19 in terms of socio-economic characteristics, showed that the population that is at most risk and vulnerable to the pandemic, are those living in high-density areas and informal settlements, where social-distancing poses a challenge ([
2,
4,
26]. For instance, Shifa, David and Leibbrandt (2021) [
26] found people living in congested areas to have the lowest access to healthcare facilities, and such locations were therefore identified as COVID-19 hotspots. Turok and Visagie (2021) [
2] also found that informal settlements were less resilient than suburbs in the face of COVID-19. The same study showed that shack dwellers were more vulnerable in terms of employment loss, since by April 2020 after the Level 5 lockdown was imposed - 14% of those living in suburbs lost their jobs, 24% in townships and peri-urban areas, and 36% in informal settlements [
2]. When the hard lockdown was reduced to level 3 in May 2020, however, half of those in informal settlements who lost their jobs were able to go back to their jobs, probably because they were in employment that was not costly to resume [
2]. In comparison, the National Income Dynamics-Coronavirus Rapid Mobile Survey (NIDS-CRAM) study showed that by April 2020, almost all the informal settlements in Gauteng experienced massive declines in employment regardless of their socio-economic risk. The study found that the unemployment differential among the various settlements in the province had widened to 27% compared to 20% a year earlier, and that the townships and informal settlements were far worse off than they were before COVID-19 [
27].
3.2. COVID-19 and Overall Satisfaction with Life in Gauteng
The present study sought to measure the quality of life (QoL) of Gauteng residents in terms of socio-economic risk and vulnerability, using the variable ‘What is your overall satisfaction with life after COVID-19?’ Satisfaction with life in South Africa has long been measured before the advent of COVID-19. For example, the GCRO has been measuring satisfaction levels since the inception of their QoL surveys in 2009. Davids and Gaibie (2011) [
28] conducted a review of QoL studies in South Africa and employed the HSRC’s South Africa Social Attitudes Survey (SASAS) to examine the impact of race, gender, age, geographic location, education level, living standard measure (LSM), satisfaction with basic services, and fear of crime on QoL. The SASAS survey was also used in the last decade to explore life satisfaction in South Africa, with researchers such as Botha and Booysen (2013) [
29] using the data to correlate life satisfaction with factors such as family structure and socio-economic variables. Other research such as the UJ-HSRC COVID-19 Democracy Survey, has recently reported on life satisfaction and vulnerability in the face of COVID-19 in Gauteng. Yet other research, such as that by Adedeji et al. (2021) [
30] measured life satisfaction and race relations using SASAS data and concluded that interaction based on population group was an important predictor of satisfaction with life especially among the black Africans and coloured populations in South Africa. In addition, socio-demographic variables like education status, incomes, and living standards were significant predictors of life satisfaction for black Africans in particular. For Indians/Asians, living standards were a significant predictor of life satisfaction [
30]
These findings point to the importance of socio-demographic variables in predicting satisfaction with life. Socio-demographic variables have been shown in various studies to have a spatial bearing in South Africa, and to be important predictors of vulnerability [
11,
12]. The choropleth map depicted in
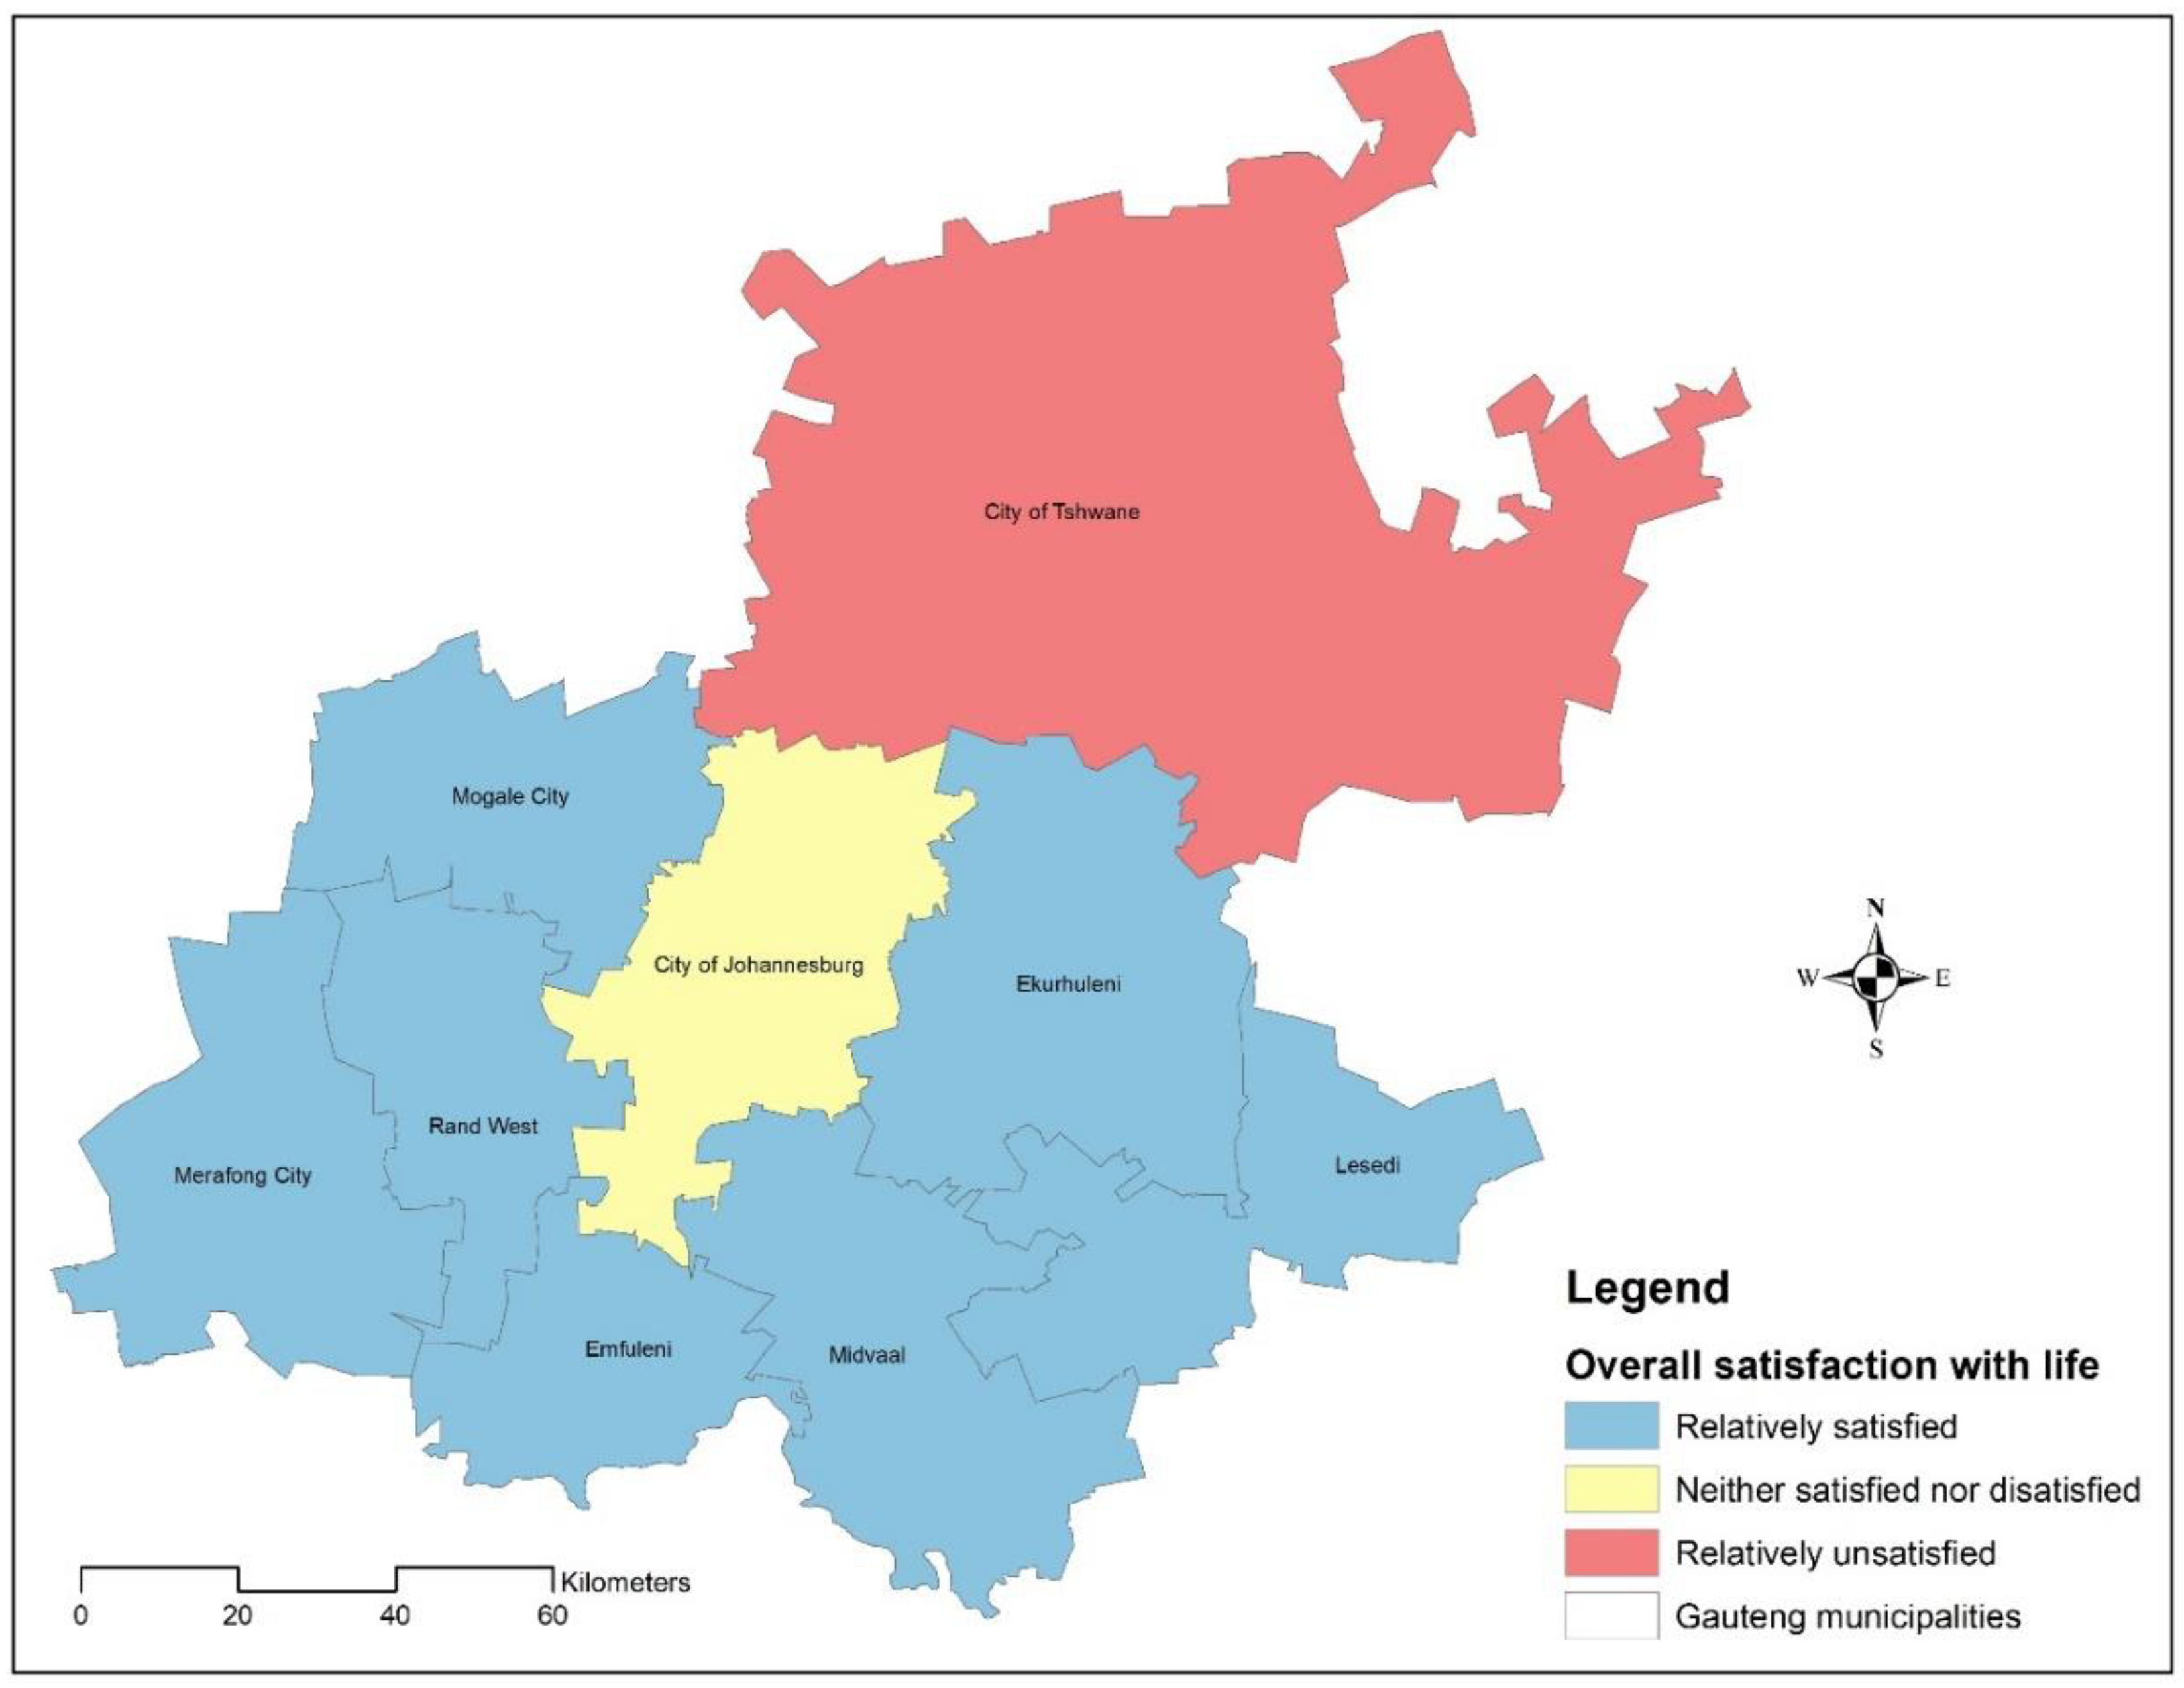
Figure 3 shows the aggregated modelled results for life satisfaction during COVID-19. Most of the respondents from the City of Tshwane indicated that they were not satisfied with life. This is concomitant to the findings of Maree (2021) [
21] who reported high levels of dissatisfaction with the South African government’s response to the pandemic by residents of Tshwane. Residents of the City of Johannesburg were relatively more non-committal, with the majority indicating that they were neither satisfied nor dissatisfied with life during COVID-19. The residents of the somewhat economically deprived municipalities of Mogale City, Rand West, Merafong City, Emfuleni, Midvaal, Ekurhuleni and Lesedi felt that they were relatively satisfied with life during COVID-19. On the other hand, Maree (2021) [
21] found that residents of all these municipalities were relatively dissatisfied with the way government responded to COVID-19 in overall terms.
3.3 Access to Information and Socio-Economic Vulnerability during COVID-19
The study also sought to determine levels of access to information on COVID-19 by residents in the municipality, using the variable ‘
I think that the information supplied by government on COVID-19 was scant.’ Knowledge, attitudes, and practices of individuals during COVID-19 has been reported to be an important factor in behavioural changes, compliance and the success of containment measures in the face of a pandemic such as COVID-19 [
31]. Additionally, the effective control of pandemics such as COVID-19 require epidemiological data drawn from extensive research based on representative samples of the population. Desalegn et al.’s study (2021) [
31] found that access to information on COVID-19 reported on the significance of geospatial differences, the nature of healthcare facilities, socio-economic and demographic factors, and methodological variabilities. Maree et al. (2021) [
21], found that respondents’ responses were largely determined by education levels and income per province. For example, the study showed that 60% of the respondents with no education concurred with the statement that information supplied by the government on COVID-19 was scant, compared to 47% of the respondents with a tertiary education expressing such a view. Similarly, more respondents earning less than R800 per month (54%) also indicated that information on COVID-19 was scant, compared to those earning more (39%). The findings therefore suggest that the economically well-off had more access to information than the poor, or that the wealthier did not necessarily rely on the government for COVID-19 information during the pandemic. These opinions also varied as satisfaction with the government’s response to the COVID-19 pandemic varied. When satisfaction was low (and when the COVID-19 cases were increasing rapidly), more respondents agreed that the government should provide information about how COVID-19 was spreading in their area [
21].
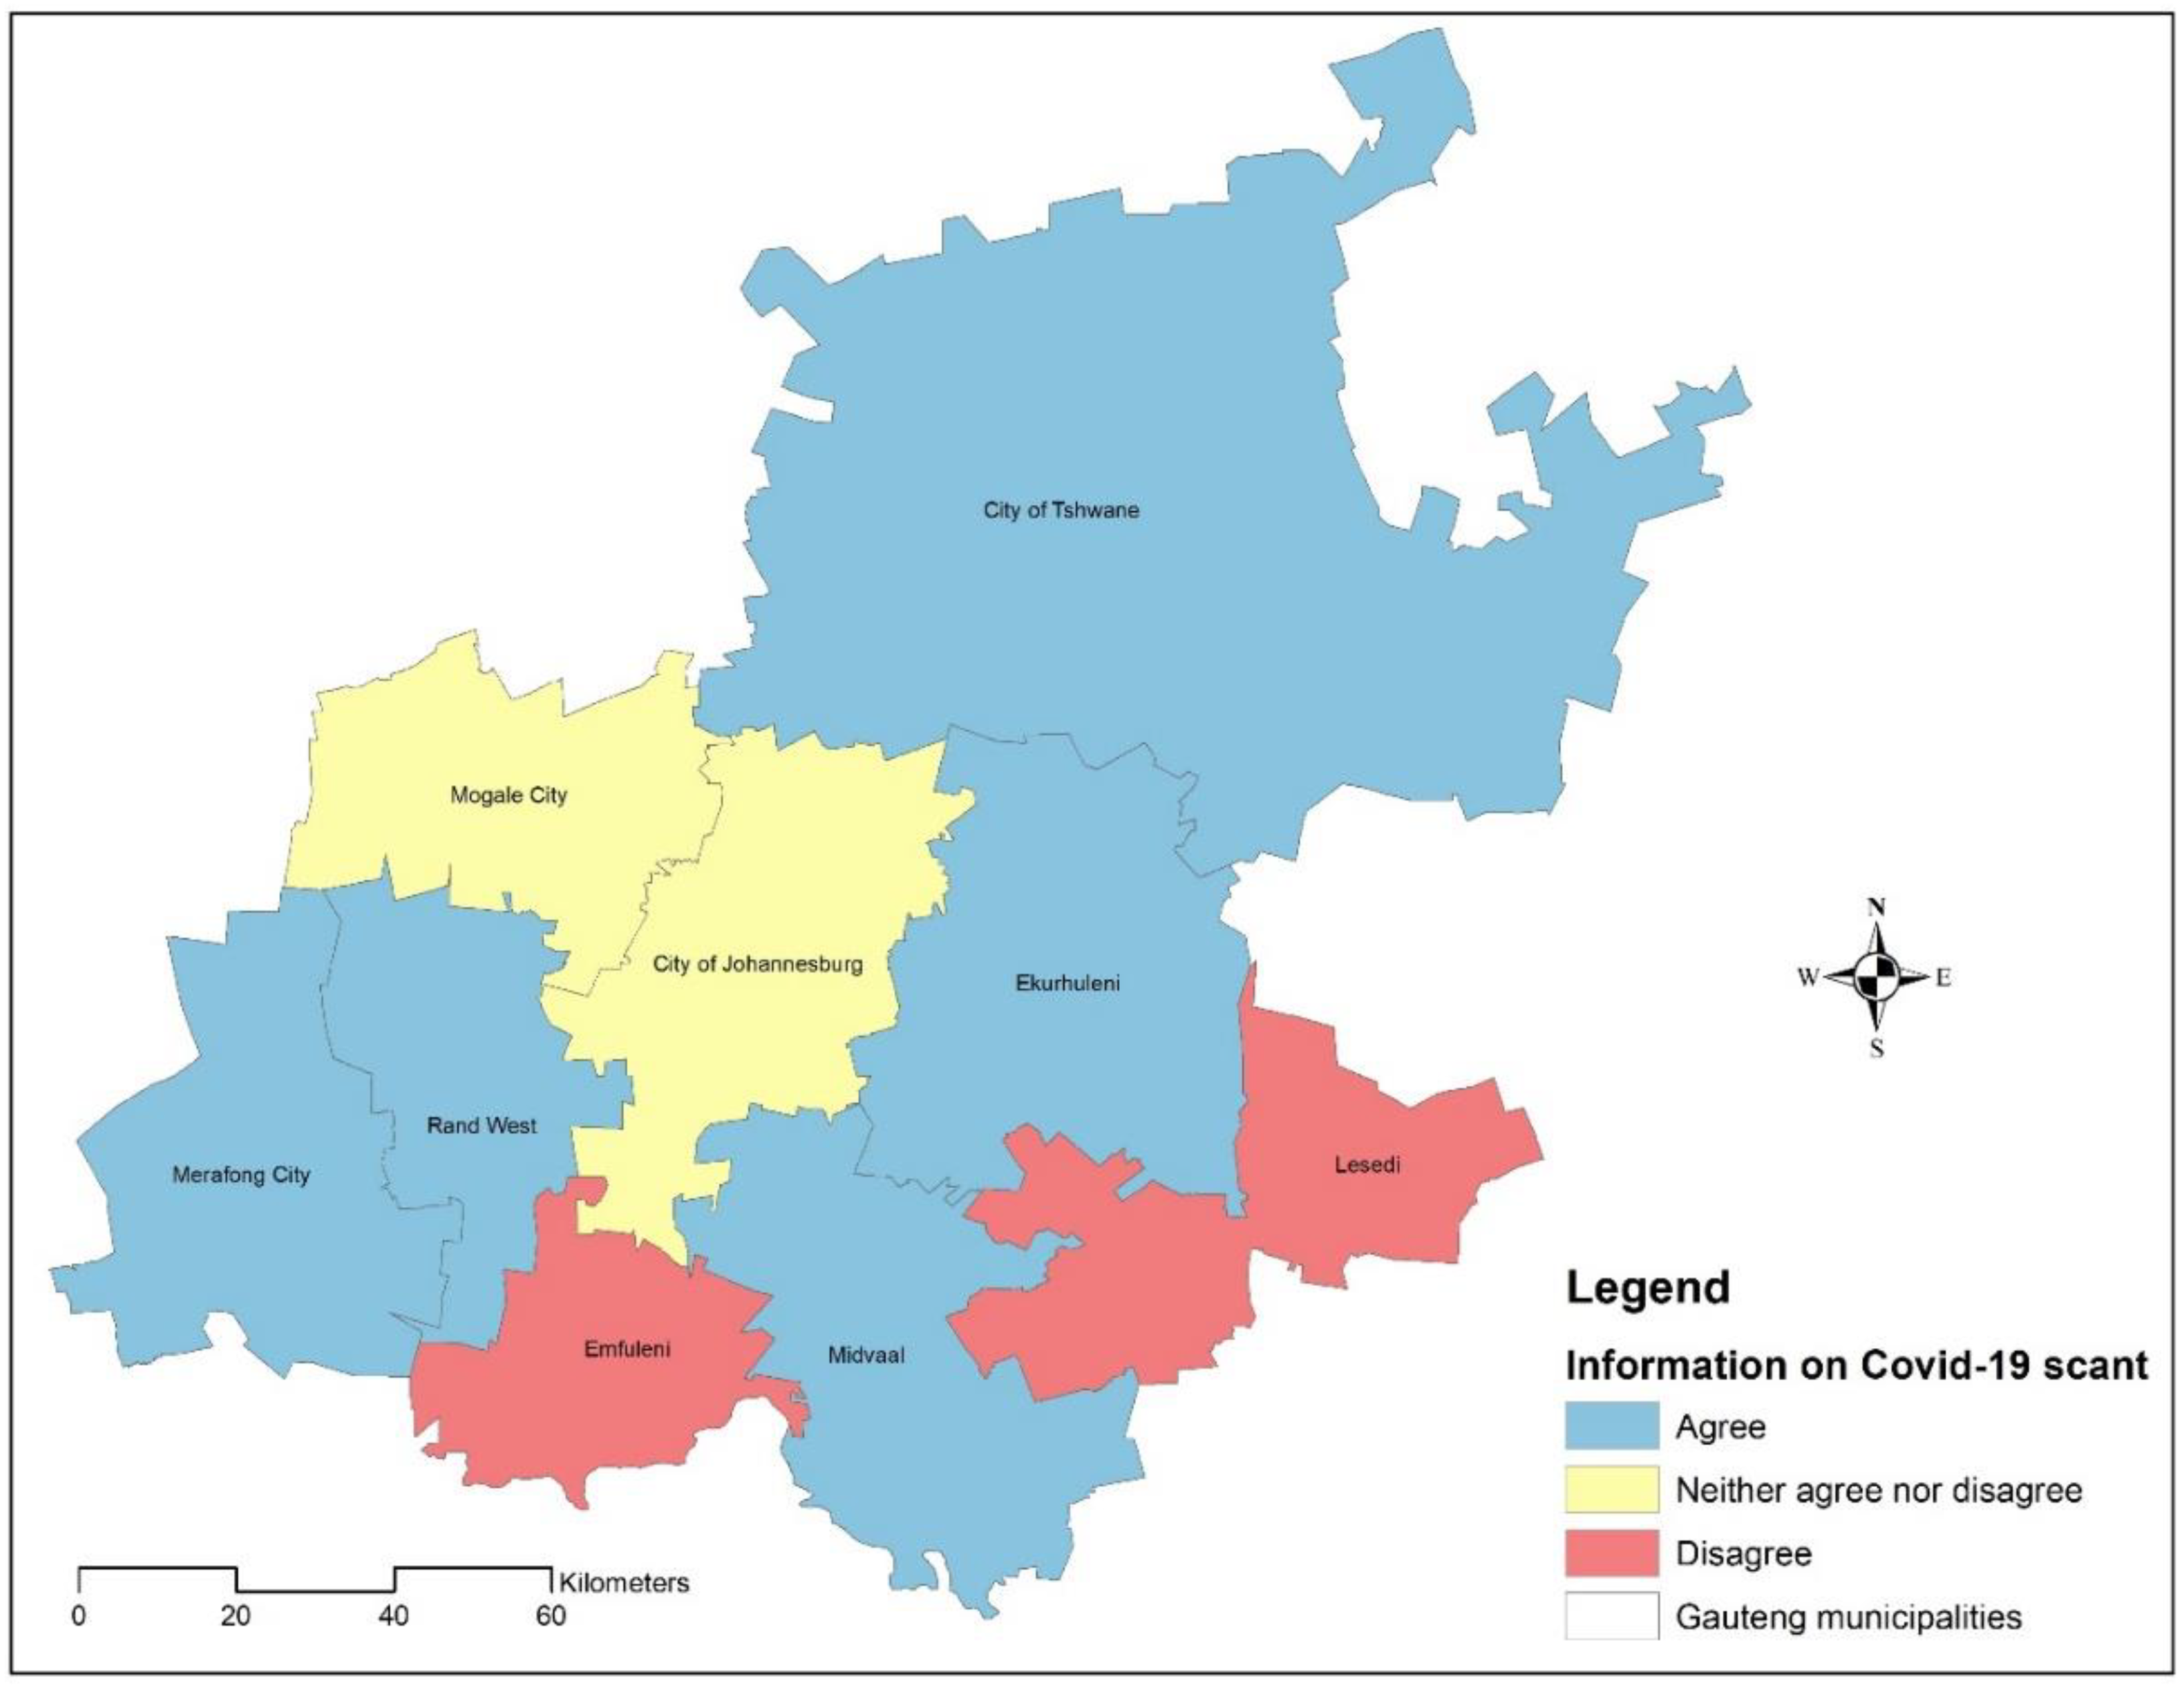
Figure 4 shows variations in people’s sentiments about the levels of information supplied by the government on COVID-19. The majority of residents in Gauteng showed dissatisfaction with the way in which government handled information on COVID-19 during the pandemic. Residents of the City of Tshwane, Ekurhuleni, Midvaal, Rand West and Merafong City indicated that they were not satisfied with the way government supplied COVID-19 information. In comparison, residents of Emfuleni and Lesedi were more satisfied. Residents from the City of Johannesburg and Mogale City were non-committal. Maree (2021) [
21] further correlated the sentiments of the various constituents of the province to variables such as education and income levels, and found that respondents with lower levels of education were less satisfied with the way government disseminated information on COVID-19.
3.4. Life Changes and Socio-Economic Vulnerability during COVID-19
The GCRO QoL Survey also sought to determine how life has changed for residents using the question ‘How has life changed since COVID-19?’, with the responses ranging from ‘worse off, no change, and better off’. Maree et al. (2021) [
21] indicated that 39% of white respondents and 29% of black respondents said that their salary had been reduced. Also interesting is that it is the respondents in the higher income brackets were more affected than the lower income brackets. Education level was also an important factor in determining life changes after COVID-19. More respondents (32%) with a qualification higher than a matric had their salaries and working hours reduced, compared to 23% of those with no matric (23%). More men (32%) reported a reduction in their salaries and working hours than women (28%). This attests to the variability of the effects of COVID-19 based on socio-demographic variables.
However, other variables point to a different picture from the above. For example, Maree et al. (2021) [
21] reported on job losses as a separate variable. Results indicated that all races were negatively impacted by job losses, with whites being less affected than the other population groups. There were no significant differences in reported job losses between men and women. In terms of education levels, the more educated were less affected than those with lower levels of education. For example, 13% of the respondents with a higher degree reported having lost a job compared to 25% of those with lower levels of education. In overall terms, results indicate that the wealthier households, and those from the white population group, were more shielded from job losses than the less educated, the poorer, and those from other population groups in South Africa [
21].
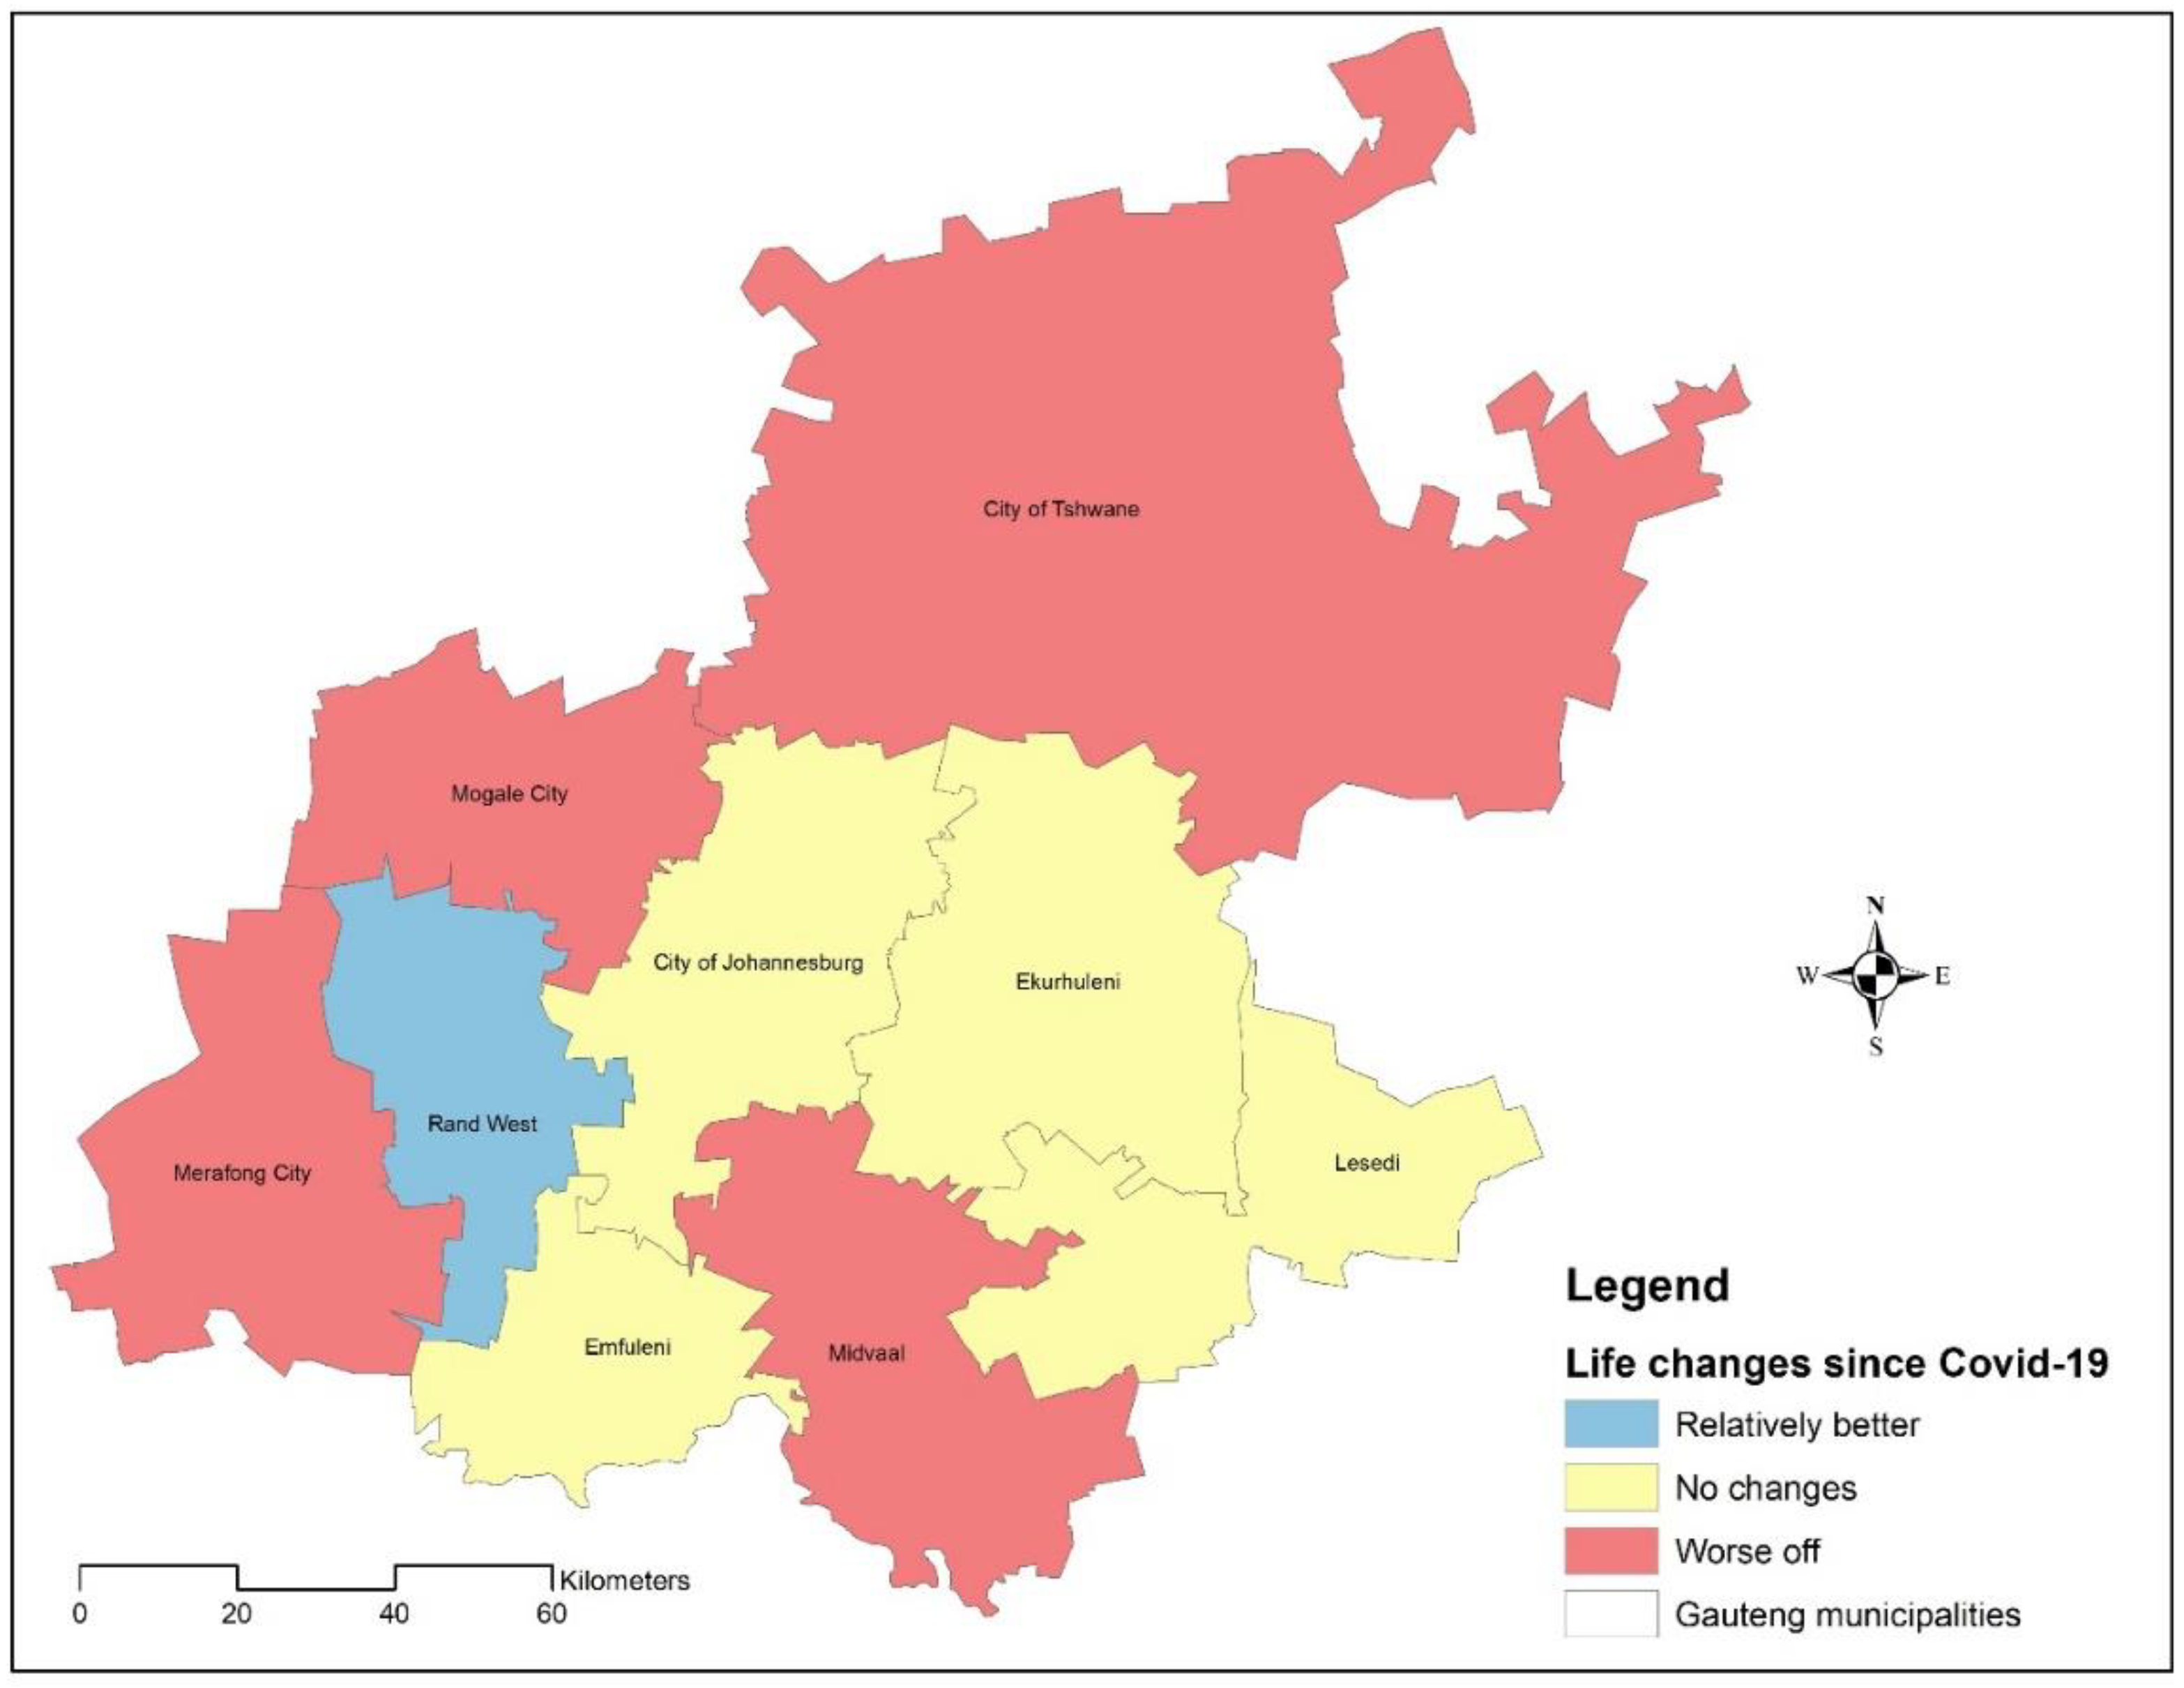
Spatially,
Figure 5 shows that a large part of the respondents in the province indicated that life changed for the worse since COVID-19. At municipal level, residents of the cities of, Tshwane, Merafong, Mogale and Midvaal indicated that life had become worse since COVID-19. Only the residents of Rand West indicated life satisfaction since COVID-19, at an aggregated level. Residents from the other four of the municipalities indicated that life had not changed since COVID-19 (
Figure 5).
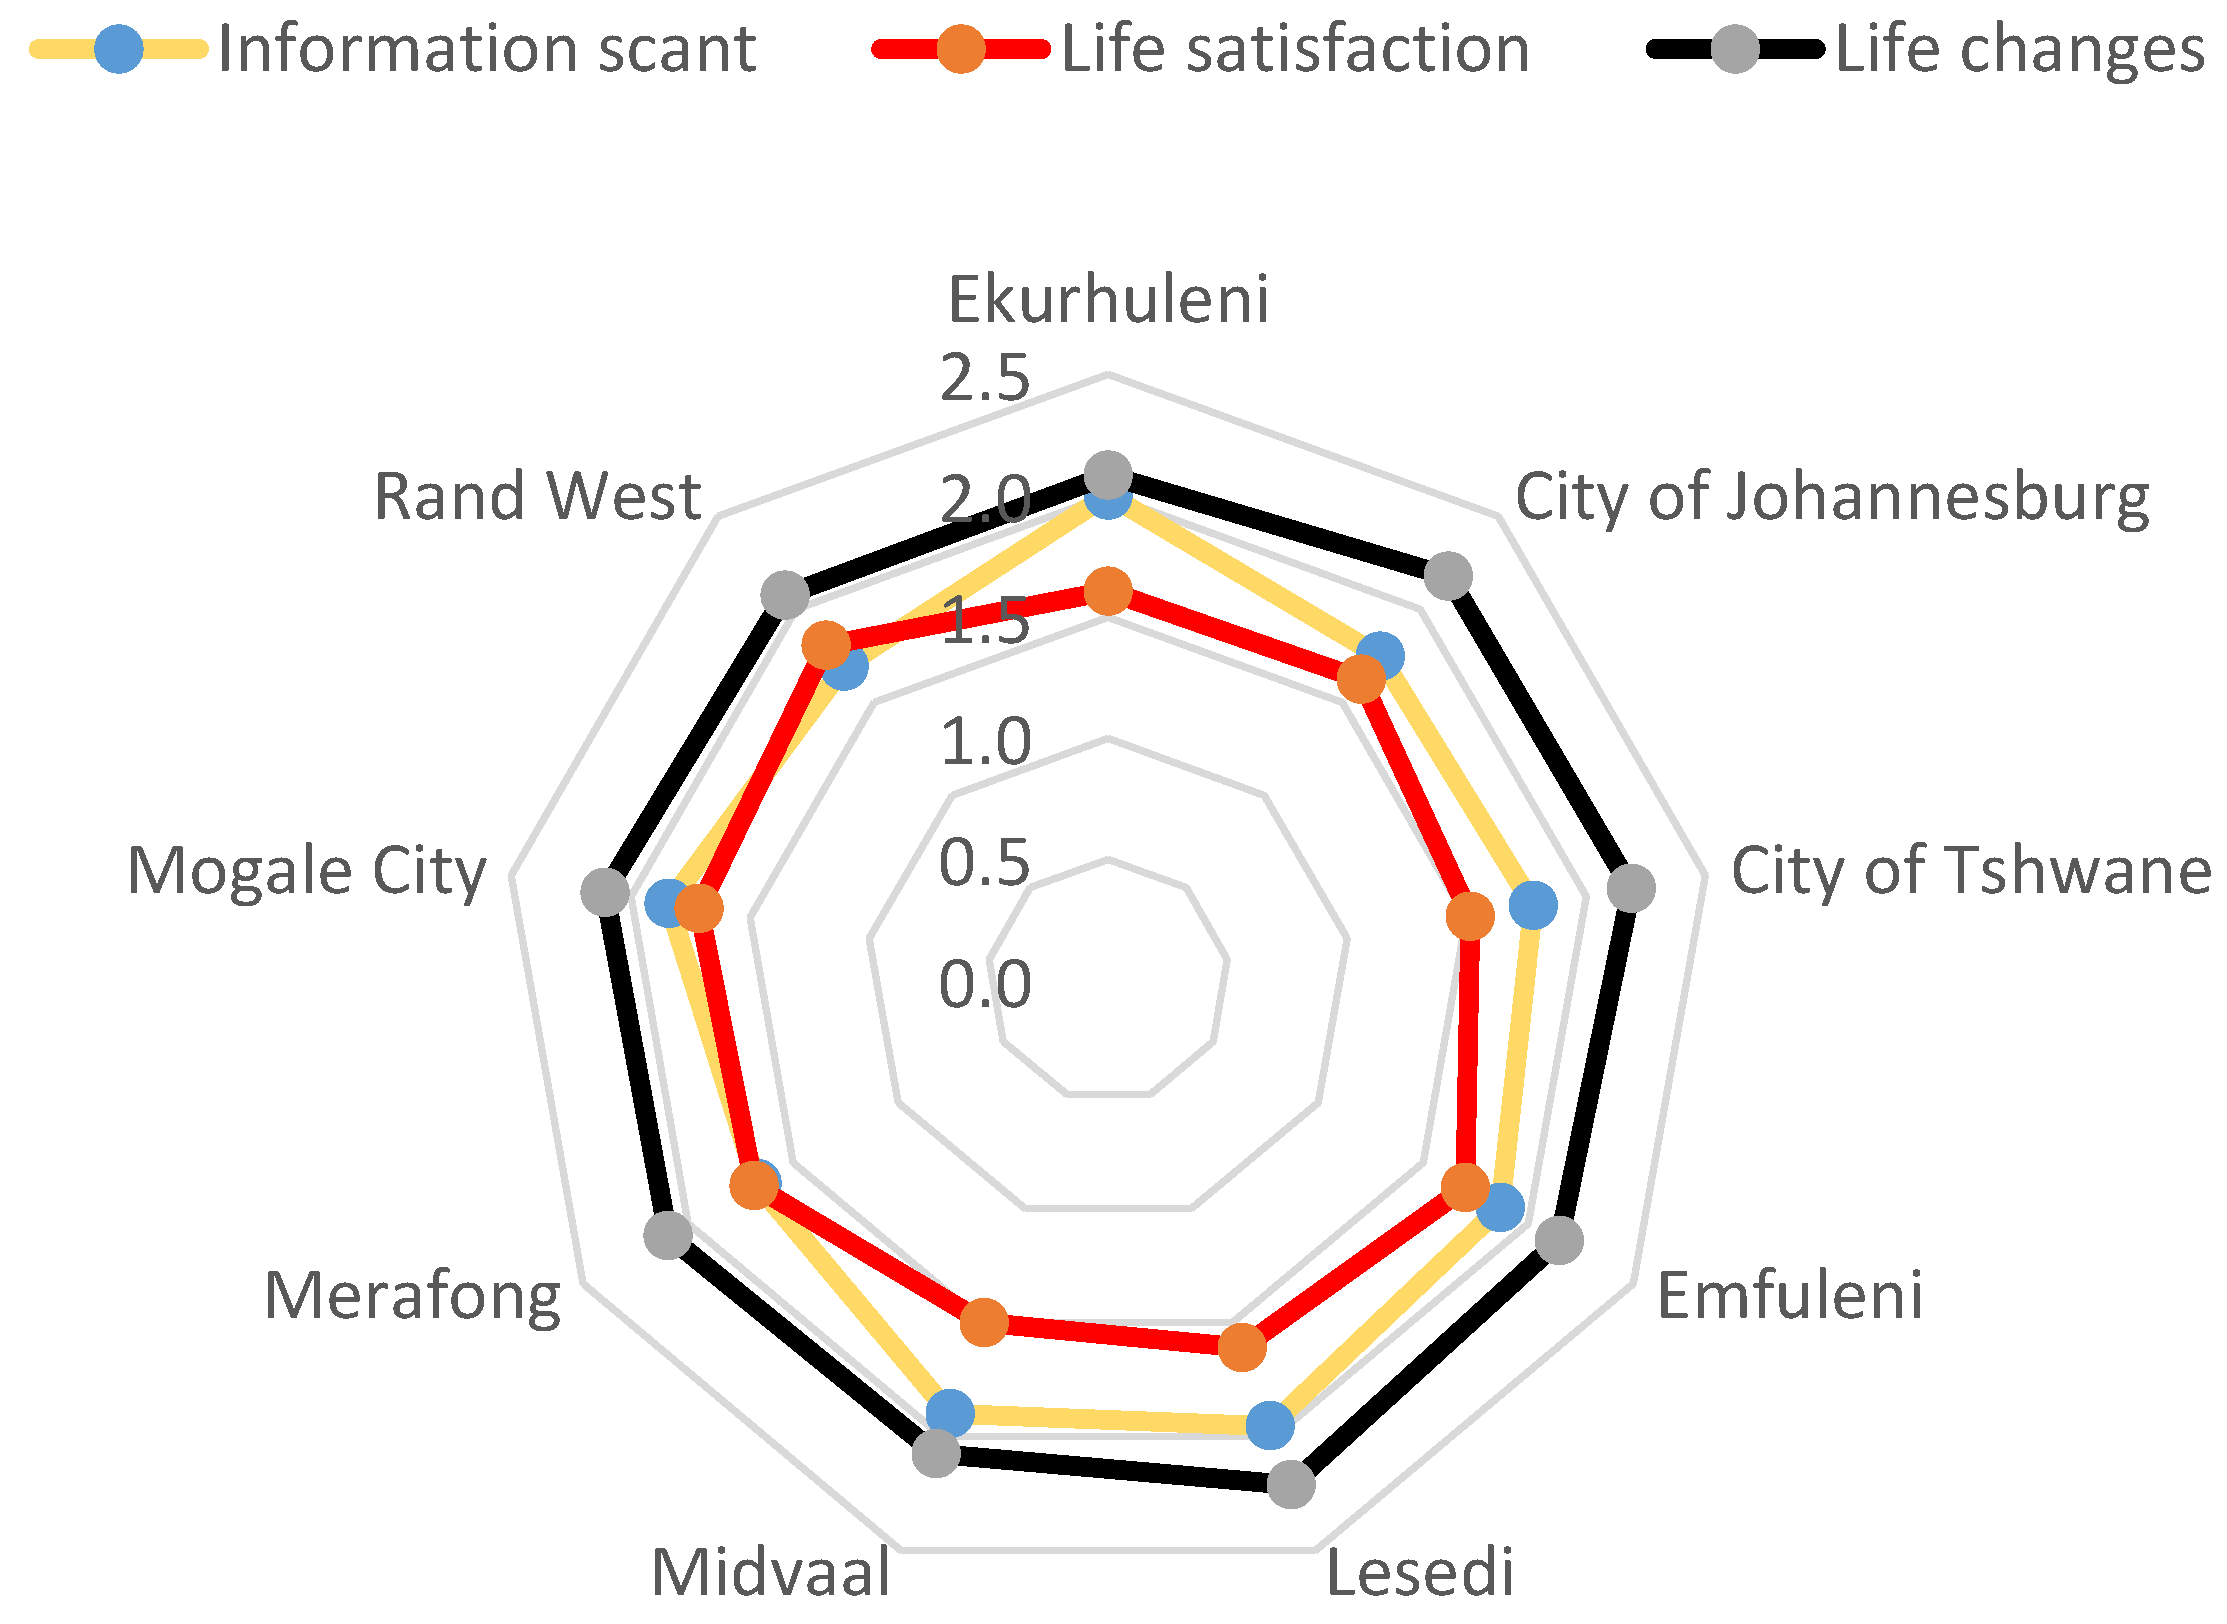
Averaged sentiments based on the three variables tested are illustrated in
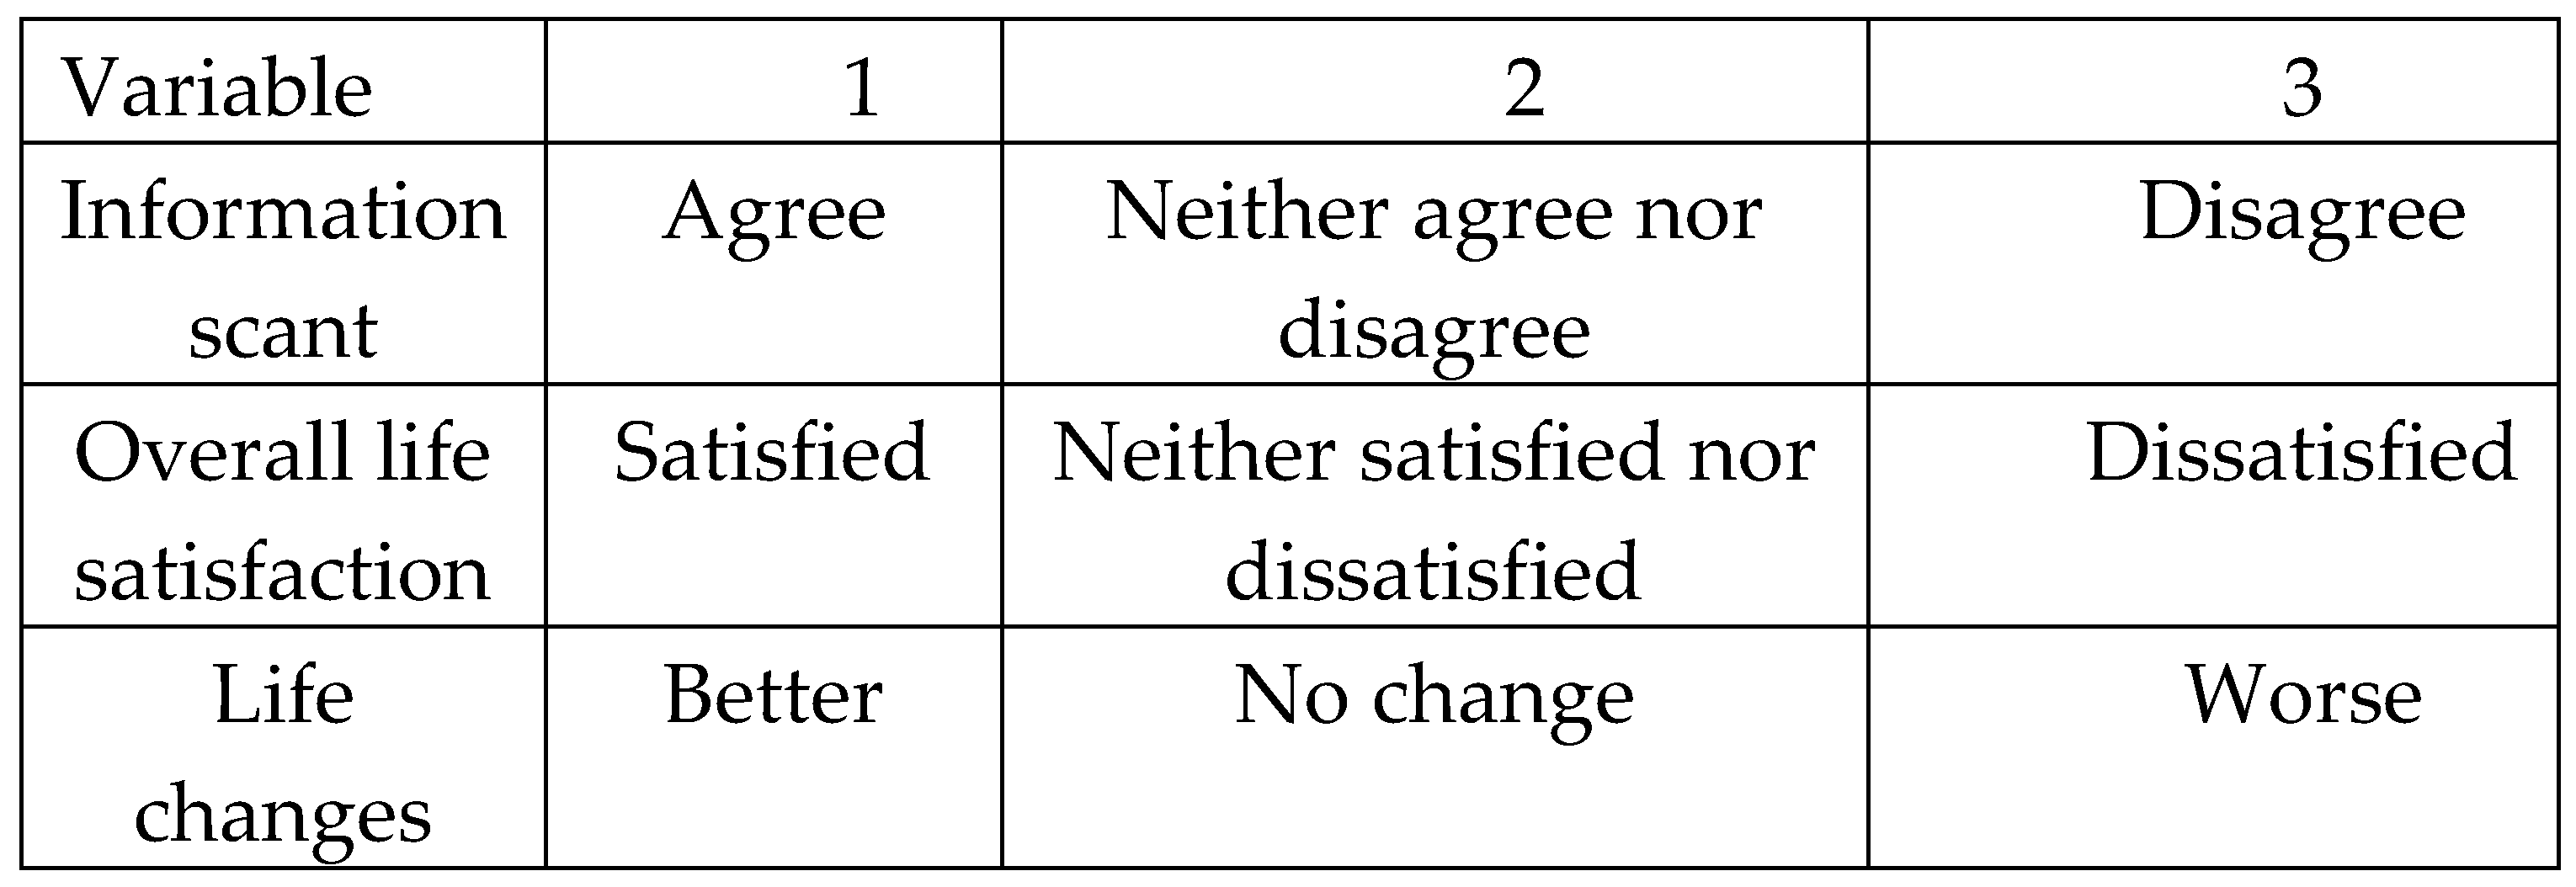
Figure 6. The figure shows that overall life satisfaction since COVID-19 was the lowest of all these variables, particularly for the City of Tshwane. Life changes show the highest average figures for life being ‘worse’ since COVID-19 for almost all the municipalities. This illustration affords the easier identification of municipalities in need of targeted intervention.
3.5. Geographically Weighted Regression for Determining Socio-Economic Factors that Influence Perceptions of COVID-19
Geographically weighted regression was conducted to assess the spatial relations between selected socio-economic variables (age, gender, population group, and education level) and COVID-19 perception variables. The socio-economic variables selected did not show a high explanatory power on the COVID-19 variables, based on R2 values (
Table 1). For example, the variation in the number of people who agreed with the assertion that ‘I think that the information supplied by government on COVID-19 was scant’ had an R2 value of 0.09. The explanatory power of the same socio-economic factors on the variation who responded to the variable on life satisfaction after COVID-19 was also low, with an R2 of 0.064. The R2 value of respondents who indicated that life had changed since COVID-19 was also low at 0.010 (
Table 1). The standard error of the estimate (S), was lowest for the variable ‘How has life changed since COVID-19?’ at S=0.53. In general, the S values are not extremely high, indicating that the socio-demographic variables used in the regression model did not have a high explanatory power on the COVID-19 variables.
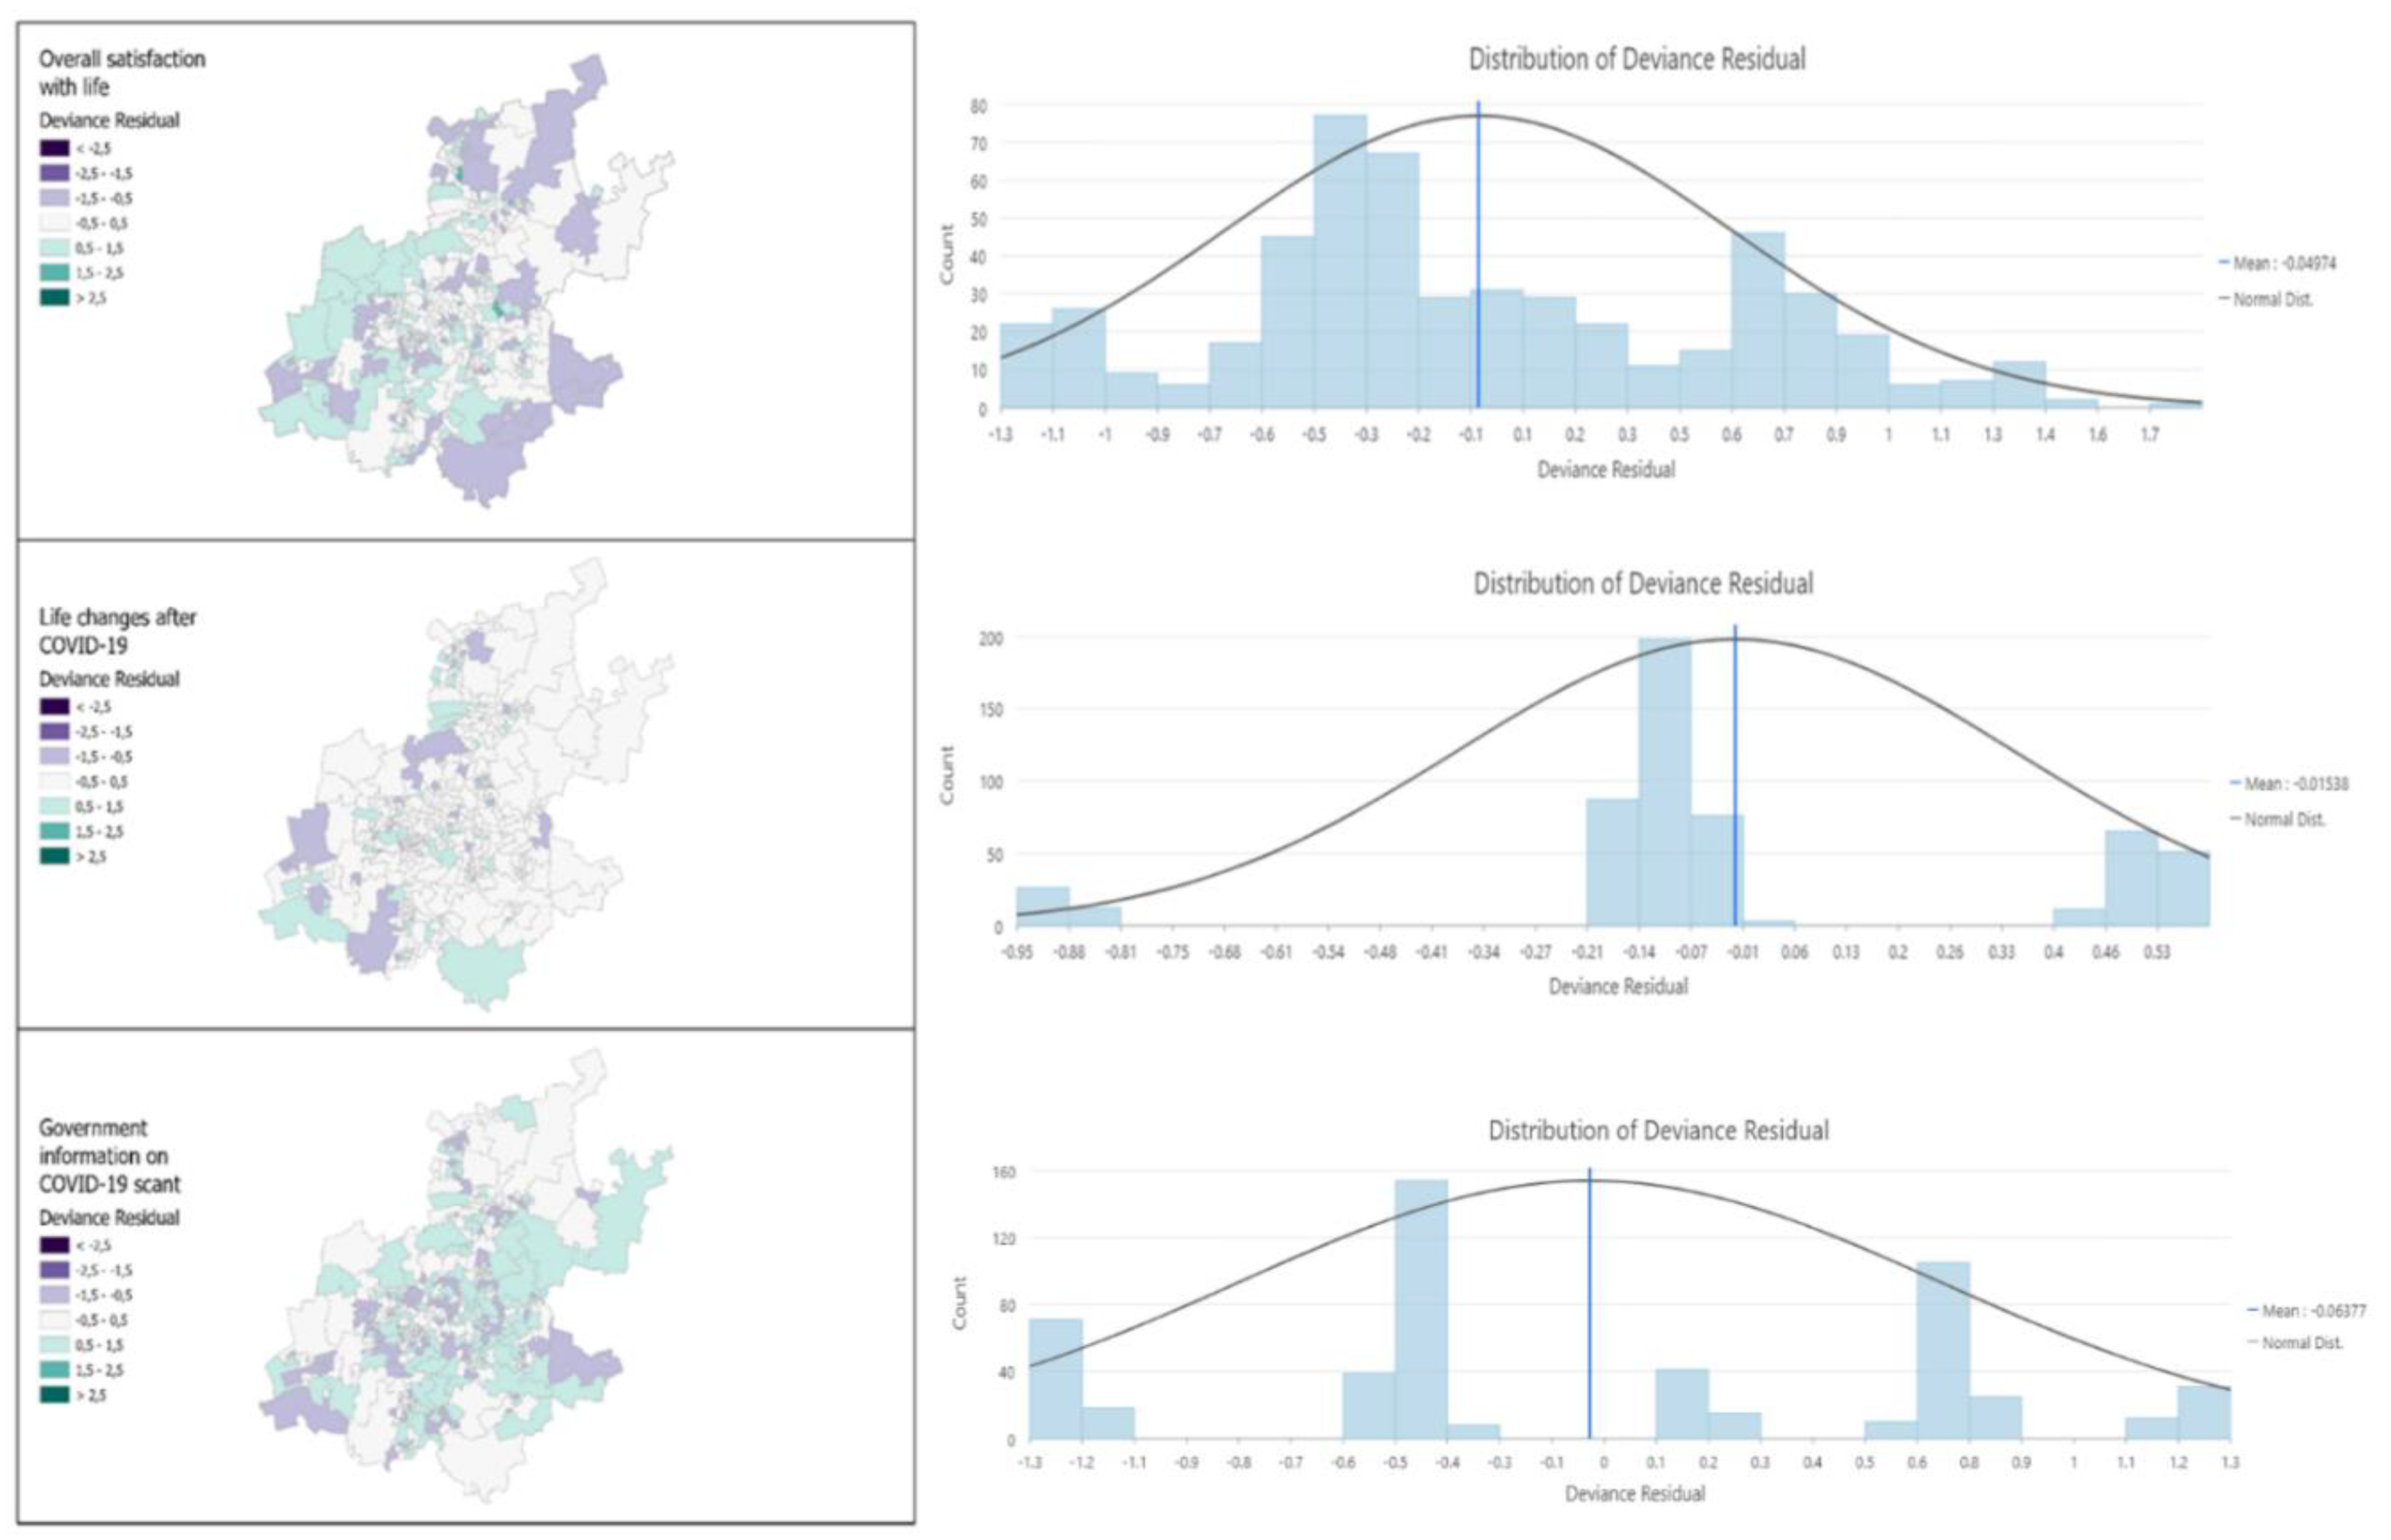
The accuracy of estimation of socio-demographic variables spatially within the province are shown using residual deviance, together with the deviances, in
Figure 7. The residual in overall satisfaction with life after COVID-19 was the lowest (-0.5 to 0.5) mostly in the less affluent districts of Rand West and Sedibeng. For the variable on life changes after COVID-19, they were also the lowest in the southern parts of the same districts, while the low values were almost evenly distributed throughout the province for the variable ‘Government information on COVID-19 was scant’. Although overestimation and underestimation (negative and positive residuals, respectively) existed, most were relatively low falling between -1.5 to -0.5 distributed evenly across the province, but were less pronounced for the variable ‘Life changes after COVID-19’. This variable also had the best estimation accuracy (residual of -0.5 to 0.5), followed by the variable on overall satisfaction with life. In terms of the distributions, the variable on overall satisfaction with life also had the best distribution, whilst there was a light positive skew on the variable relating to life changes after COVID-19.
4. Conclusions
This study took an in-depth look into the spatial distribution of sentiments relating to COVID-19 based on socio-economic inequality and levels of vulnerability in Gauteng. The COVID-19 pandemic exposed and reinforced socio-economic inequalities within the province and in the country in general. Vulnerability and high levels of socio-economic risk are often associated with high-density residential areas, the youth, the less educated, and the previously disadvantaged members of the community. Thus, the initial level of inequality can determine the level of socio-economic risk, access to information, and satisfaction levels with life in general. The present study therefore explored this further using Gauteng as a case study, being the economic hub of the country.
It is acknowledged that the current study is not the first to spatially characterise COVID-19 sentiments considering local factors like socio-economic risk. In South Africa, in particular, studies such as the NIDS-CRAM (2020) [
27], and the HSRC/UJ COVID-19 Democracy Survey [
9] have assessed the impacts of COVID-19 across various socio-economic groups in the country. This study sought to specifically characterise the spatial distribution of selected sentiments from a quality of life survey and socio-economic risk index for a localised region of the country, Gauteng.
The findings point to the importance of socio-demographic variables in predicting satisfaction with life. Socio-demographic variables have been shown in various studies to have a spatial bearing in South Africa, and to be important predictors of vulnerability. Our results show spatial variability in the variables being tested, and concur with findings from other researchers like Desalegn et al. (2021) [
31] who reported a direct link between poor access to information and low socio-economic status. Overall, the choropleth maps produced for the variable used in this study show much lower levels of satisfaction with information supplied by the government in relation to the socio-economic risk of the area. The majority of residents in the province reported life being worse off after COVID-19, as has been reported in several other studies (such as the NIDS-CRAM (2020) [
27] and the HSRC/UJ COVID-19 Democracy Survey (2021) [
9]. There appears to be a clear spatial pattern in these sentiments on life changes after COVID-19 based on the geographic location of the respondents – with residents in the more socio-economically disadvantaged municipalities such as Merafong and Mogale reporting being worse off since COVID-19. People in these municipalities reported being dissatisfied with the dissemination of information by government during this period. Traditionally, the dominant economic activities in the municipality are manufacturing and mining [
32] and are in contrast to other municipalities where the local economies are more diverse.
The study has some limitations, though. Only a few, selected variables were used to spatially characterise respondents’ sentiments on COVID-19. Other variables like income levels and employment status were excluded because of high levels of collinearity. Other studies that have used more socio-economic variables, like that by Turok and Visagie (2021) [
2] have reported a link between socio-economic risk factors like access to food, dwelling type, family earnings, among others, and the spatial distribution of the negative impacts of COVID-19. Furthermore, studies like the HSRC/UJ COVID-19 Democracy Survey study used expanded socio-economic variables and reported a direct link to people getting more sad, depressed, and feeling lonelier based on socio-economic vulnerability during the pandemic. Therefore, the results of this study, even though it concurs with other much larger studies on the pandemic in the region, should be understood based on the available data used for the review. Additionally, even though data were weighted to ensure the sample was representative enough in the province, the findings can hardly be generalised to the country where levels of inequality are high, and sentiments change as people’s levels of satisfaction with government, access to information, and satisfaction with life are bound to shift along with changes in government policy and service delivery levels.
Nevertheless, the results also point to an interesting pattern on the spatial distribution of sentiments by the vulnerable members of the province. The negative sentiments expressed by the more vulnerable locations in the province relate to high socio-economic risk indices of these areas. Even though the effects of the pandemic were to magnify the socio-economic inequalities and levels of vulnerability in the province, the study findings also mean that the government should not prematurely withdraw relief efforts such as the Social Relief of Distress (SRD) grant (still being paid out to beneficiaries at the time of writing this article) meant to cushion the vulnerable against the negative impacts of COVID-19, as this may lead to social-discontent.
Author Contributions
Conceptualization, S.D. and GWS.; methodology, S.D and GWS.; software, validation, GWS.; S.D. and Y.D.D.; formal analysis, S.D. and GWS.; investigation, S.D.; writing—original draft preparation, S.D and GWS.; writing—review and editing, S.D, GWS and YDD.; visualization, S.D.; supervision, GWS and YDD. All authors have read and agreed to the published version of the manuscript.
Funding
The APC was funded by the Development, Capable and Ethical State division, Human Sciences Research Council.
Informed Consent Statement
The study used data from the Gauteng City Region Observatory (GCRO). The GCRO obtained informed consent from all subjects involved in the study.
Data Availability Statement
Conflicts of Interest
The authors declared no potential conflicts of interest with respect to the research, authorship, and/or publication of this article.
References
- Nwosu, C.O. Oyenubi, A. Income-related health inequalities associated with the coronavirus pandemic in South Africa: A decomposition analysis. Int J Equity Health 2021, 20, 21. [Google Scholar] [CrossRef] [PubMed]
- Turok, I.; Visagie, J. COVID-19 amplifies urban inequalities. 2021. South African Journal of Science. 2021, 117, 8939. [Google Scholar] [CrossRef] [PubMed]
- OECD. OECD. Employment Outlook 2021: Navigating the COVID-19 Crisis and Recovery; OECD Publishing: Paris, 2021. [Google Scholar] [CrossRef]
- Manda, S.O.M.; Darikwa, T.; Nkwenika, T.; Bergquist, R.A. Spatial Analysis of COVID-19 in African Countries: Evaluating the Effects of Socio-Economic Vulnerabilities and Neighbouring. International Journal of Environmental Research. Public Health 2021, 18, 10783. [Google Scholar] [CrossRef]
- Shadmi, E.; Yingyao, C.; Inês, D. Inbal, F.; Furler, F.; Obando, C. et al. Health equity and COVID-19: Global perspectives. International Journal for Equity in Health. 2020, 19, 104. [Google Scholar] [CrossRef] [PubMed]
- Bidisha, S.H.; Mahmood, T.; Hossain, M.B. (2021). Assessing Food Poverty, Vulnerability and Food Consumption Inequality in the Context of COVID-19: A Case of Bangladesh. Social Indicators Research 2021, 155, 187–210. [Google Scholar] [CrossRef] [PubMed]
- Schotte, S.; Zizzamia, R. (2023). The livelihood impacts of COVID-19 in urban South Africa: A view from below. Soc Indic Res, 2023, 165, 1–30. [CrossRef]
- Runciman, C, Roberts, B, Alexander, K.; Bekker, M : Daily Maverick, 30 April, 2020. Available online: https://www.dailymaverick.co.za/article/2020-04-30-unlocking-the-publics-preferences-what-south-africans-think-of-lockdown-and-policy-responses/ (accessed on 4 May 2023).
- Runciman, C.; Alexander, K.; Roberts, B.; Orkin, M.; Nyamukokoko, M.; Bohler-Muller, N. Round 5 UJ-HSRC Covid-19 Democracy Survey 2021. Research briefing. Vaccine inequality and hesitancy. Available online: https://www.uj.ac.za/wp-content/uploads/2022/02/2022-02-02-r5-vaccine-acceptance-and-hesitancy.pdf (accessed on 10 October 2022).
- Dlamini, S.; Weir-Smith, G. The Gauteng Socio-economic Risk Index. Spatial Insights: Edition 5: 2022, Pretoria: eResearchKnowledge Centre, Human Sciences Research, 1-6. Council. Available online: http://hdl.handle.net/20.500.11910/19477.
- Kim, A.W.; Burgess, R.; Chiwandire, N.; et al. Perceptions, risk and understandings of the COVID-19 pandemic in urban South Africa. South African Journal of Psychiatry. 2021, 27, a1580. [Google Scholar] [CrossRef]
- Reddy, S.P.; Sewpaul, R.; Mabaso, M.; et al. South Africans’ understanding of and response to the COVID-19 outbreak: An online survey. South African Medical Journal 2020, 110, 894–902. [Google Scholar] [CrossRef] [PubMed]
- Guan, W.J.; Ni, Z.Y.; Hu, Y.; Liang,W.H.; Ou, C.Q.; He, J.X.; Du, B. et al. Clinical characteristics of coronavirus disease 2019 in China. N Engl J Med 2020, 382, 1708–1720. [CrossRef] [PubMed]
- Ramírez-Aldana, R.; Gomez-Verjan, J.C.; Bello-Chavolla, O.Y. Spatial analysis of COVID-19 spread in Iran: Insights into geographical and structural transmission determinants at a province level. PLoS Negl Trop Dis 2020, 14, e0008875. [Google Scholar] [CrossRef] [PubMed]
- Weinstein, B.; da Silva, A.R.; Kouzoukas, D.E.; Bose, T.; Kim, G.J.; Correa, P.A.; Pondugula, S.; Lee, Y.; Kim, J.; Carpenter, D.O. Precision Mapping of COVID-19 Vulnerable Locales by Epidemiological and Socioeconomic Risk Factors, Developed Using South Korean Data. International Journal of Environmental Research and Public Health 2021, 18, 604. [Google Scholar] [CrossRef] [PubMed]
- Potgieter, A.; Fabris-Rotelli, I.N.; Kimmie, Z.; Dudeni-Tlhone, N.; Holloway, J.; Janse van Rensburg, C.; Thiede, R.; Debba, P.; Manjoo-Docrat, R.; Abdelatif, N.; Makhanya, S. Modelling representative population mobility for COVID-19 spatial transmission in South Africa. Pre-print. 2021. [CrossRef]
- COVID-19 South African Online Portal. Statement by President Cyril Ramaphosa on Progress in the National Effort to Contain the COVID-19 Pandemic". 2020. Available online: https://sacoronavirus.co.za/2020/09/16/statement-by-president-cyril-ramaphosa-on-progress-in-the-national-effort-to-contain-the-covid-19-pandemic-3/ (accessed on 28 December 2020).
- Statistics South Africa (StatsSA). Yearly Archives 2022. StatsSA, 2022, Pretoria, South Africa. Available online: https://www.statssa.gov.za/?m=2022 (accessed on 30 December 2023).
- GTI. Spatial Modelling Data. 2020. Available online: https://geoterraimage.com/ (accessed on 10 February 2023).
- Gordon, D.; Fonta, C.; Grieve, T.; Harris, R.; Muguni, R.; Zhang, M.; et al. Who is Most Vulnerable to Catching COVID-19 and Where Do They Live?, 2020. Bristol Poverty Institute. University of Bristol. Mimeo. Bristol Poverty Institute. University of Bristol. Mimeo, 2020. [Google Scholar]
- Maree, G.; Culwick, F.; Götz, G.; Hamann, C.; Parker, A. Effects of the COVID-19 pandemic on the Gauteng City-Region: Findings from the GCRO's Quality of Life Survey 6 (2020/21). 2021, GCRO Data Brief No. 11. Johannesburg: Gauteng City-Region Observatory.
- Rząsa, K.; Ciski., M. Influence of the Demographic, Social, and Environmental Factors on the COVID-19 Pandemic—Analysis of the Local Variations Using Geographically Weighted Regression. International Journal of Environmental Research and Public Health 2022, 19, 11881. [Google Scholar] [CrossRef] [PubMed]
- Al-Hasani, G.; Asaduzzamana, M.; Soliman, A. Geographically weighted Poisson regression models with different kernels: Application to road traffic accident data. Communications in Statistics Case Studies Data Analysis and Applications, 2021, 1–16. [CrossRef]
- ESRI. 2021. ArcGIS Pro: Version 2.9. Redlands, CA: Environmental Systems Research Institute.
- Fotheringham, A.S.; Brunsdon, C.; Charlton, M. Geographically Weighted Regression: The Analysis of Spatially Varying Relationships. John Wiley & Sons: Hoboken, NJ, USA, 2002.
- Shifa M, David A, Leibbrandt, M. Spatial inequality through the prism of a pandemic: Covid-19 in South Africa. Sci Afr. 2021, 13, e00949. Epub 2021 Aug 20. PMID: 34541427; PMCID: PMC8435065. [CrossRef]
- National Income Dynamics Survey Wave 5 (NIDS-CRAM), 2020. Available online: http://www.nids.uct.ac.za/nids-data/ data-access (accessed on 13 November 2022).
- Davids, Y.D.; Gaibie, F. Quality of Life in Post-Apartheid South Africa. Politikon: South African Journal of Political Studies 2011, 38, 231–256. [Google Scholar] [CrossRef]
- Botha, F.; Booysen, F. Family Functioning and Life Satisfaction and Happiness in South African Households
. ERSA Working Paper 2012, 363, 1–21. [Google Scholar] [CrossRef]
- Adedeji, A.; Idemudia, E.; Bolarinwa, O.; Metzner, F. Racial relations and life satisfaction among South Africans: Results from the 2017 South African Social Attitudes Survey (SASAS). Journal of Psychology in Africa. 2021, 31, 522–528. [Google Scholar] [CrossRef]
- Desalegn, Z.; Deyessa, N.; Teka, B.; Shiferaw, W.; Hailemariam, D.; Addissie, A.; et al. COVID-19 and the public response: Knowledge, attitude and practice of the public in mitigating the pandemic in Addis Ababa, Ethiopia. PLoS ONE 2021, 16, e0244780. [Google Scholar] [CrossRef] [PubMed]
- Global Insight. 2015. Regional eXplorer encyclopedia. Pretoria.
|
Disclaimer/Publisher’s Note: The statements, opinions and data contained in all publications are solely those of the individual author(s) and contributor(s) and not of MDPI and/or the editor(s). MDPI and/or the editor(s) disclaim responsibility for any injury to people or property resulting from any ideas, methods, instructions or products referred to in the content. |
© 2024 by the authors. Licensee MDPI, Basel, Switzerland. This article is an open access article distributed under the terms and conditions of the Creative Commons Attribution (CC BY) license (http://creativecommons.org/licenses/by/4.0/).
