1. Introduction
Hydroxyapatite (Ca
10(PO
4)
6(OH)
2, HAP) is a widely used multifunctional biomaterial for various medical applications [
1,
2,
3,
4,
5], it has natural biocompatibility with bone tissues of the human body, due to the fact that it is the main mineral inorganic component of its bones and teeth [
3,
4]. In addition, HAP is used in other areas: environmental purification, catalysis, photoluminescence, chromatography, drug delivery and others [
3,
4,
5,
6,
7]. However, its main and most important applications are in orthopedics, traumatology and surgery, as a filler and coating for bone implants [
1,
6,
7,
8]. It is well known that biological bone HAP distinguishes from synthetic compounds in its stoichiometric differences and the presence of a large number of impurity ions and ionic groups [
4,
5,
6,
7,
8,
9,
10,
11,
12]. Moreover, the crystal structure of HAP itself allows a wide range of different substitutions, which affect all the properties of the material - from its mechanical to the antimicrobial properties [
8,
9,
10,
11,
12,
13,
14]. Therefore, to achieve the desired effects and better biocompatibility, it is extremely important to correctly select the used substituents. Among the many known ions that influence the properties of HAP, manganese (Mn) ions have long attracted the attention of researchers to be incorporated into various HAP-based bioceramics due to their positive therapeutic effects [
14,
15,
16,
17,
18].
Manganese is one of the most important microelements for human health, which is present in very small quantities (about 50 ppm) in the mineral phase of bone tissue. Interestingly, this is also one of the elements found in natural bioapatites of igneous origin. Manganese contributes to normal bone growth, bone metabolism and the body's ongoing process of bone remodeling. The presence of manganese in the structure of HAP can change the adhesion of bone cells to the implant material, which promotes the activation and proliferation of bone cells - osteoblasts [
13,
14]. Manganese can cause changes in the mineralogical structure, physical properties, reactivity and solubility of HAP, and also, due to its spin properties, affects the magnetic properties of the substance [
19].
The incorporation of Mn into the crystal structure of HAP has been studied by many different experimental and theoretical methods, including studies on the possible preferences of positions of the Ca atom for substitution by the Mn atom [
14,
15,
16,
17,
18,
19,
20,
21,
22]. It is known that calcium can occupy two different positions in the structure of HAP: Ca1 and Ca2 [
9]. This is important both for the synthesis of Mn-substituted HAP (HAP-Mn) and for its various applications. Here it is necessary to correctly understand the mechanisms of Mn incorporation into the structure of HAP, as well as the resulting structural changes in the crystal lattice of HAP. To solve such problems, modern theoretical methods, modeling methods and calculations from first principles are also used, including methods of density functional theory (DFT) [
23,
24,
25,
26,
27,
28,
29].
The purpose of this work is precisely to study the influence of manganese on the structural features and properties of HAP both by theoretical methods, using high-precision DFT methods with hybrid functional [
30,
31,
32,
33,
34] and experimentally, using the mechanochemical synthesis method [
35,
36,
37,
38]. The obtained experimental and theoretical results are analyzed and compared with a gradual change in different concentrations of replacement of calcium cations with manganese cations. The results of these studies are very important for practical implantology and bone tissue engineering.
2. Materials, models and methods
2.1. Experimental part: Synthesis of Mn-substituted HAP
The synthesis of HAP-Mn samples was carried out using the mechanochemical method [
35,
36,
37,
38] similarly to HAP-Mg samples synthesis as in [
25], where are all detailed information about one. The starting components for the synthesis of HAP-Mn were chemically pure reagents: anhydrous calcium hydrogen orthophosphate CaHPO
4 (pure grade), freshly calcined calcium oxide CaO (pure grade) and manganese (II) dihydrogen phosphate dihydrate Mn(H
2PO
4)
2·2H
2O (pure grade). The starting components were used in stoichiometric ratios, based on the relation between of the calcium cations are replacing magnesium cations according to the following reaction:
where
x = 0, 0.125, 0.25, 0.5, 0.75, 1.0.
Samples are labeled as “xMn”, where x corresponds to the concentration of the substituted calcium atoms in the chemical formula of HAP (reffered to one unit cell).
Diffraction patterns of the obtained samples were recorded on a Bruker D8 Advance diffractometer in the Bragg-Brentano geometry with CuKα-radiation. X-ray diffraction analysis of the compounds was carried out using the ICDD PDF-4 powder X-ray diffraction database (2011). Refinement of the structural characteristics of the HAP phase, such as the parameters of the unit cell (a and c) and its volume (V), was carried out using the Rietveld method in the Topas 4.2 program (Bruker, Germany).
2.2. Computational and modeling part
In this work, we applied a previously developed computational approach for two-steps high-precision DFT calculations [
24,
25,
30,
31,
32,
33,
34] on the HAP model of one unit cell and supercell. The computational methodology is based on the Perdew, Burke, Ernzerhof (PBE) functional in the generalized gradient approximation (GGA) [
39] (at the 1st step) and the hybrid exchange-correlation functional Heyd, Scuseria, Ernzerhof (HSE, HSE06) [
40,
41] (at the 2nd step).
All performed DFT calculations with the specified functionals were carried out using the QUANTUM ESPRESSO package [
42] based on the optimized norm-conserved (ONCV) DFT pseudopotentials [
43,
44].
The computational details of these our DFT calculations are fully described in [
25]. Recently we used this our method to calculate the substitution of Mg cations in the HAP supercell model [
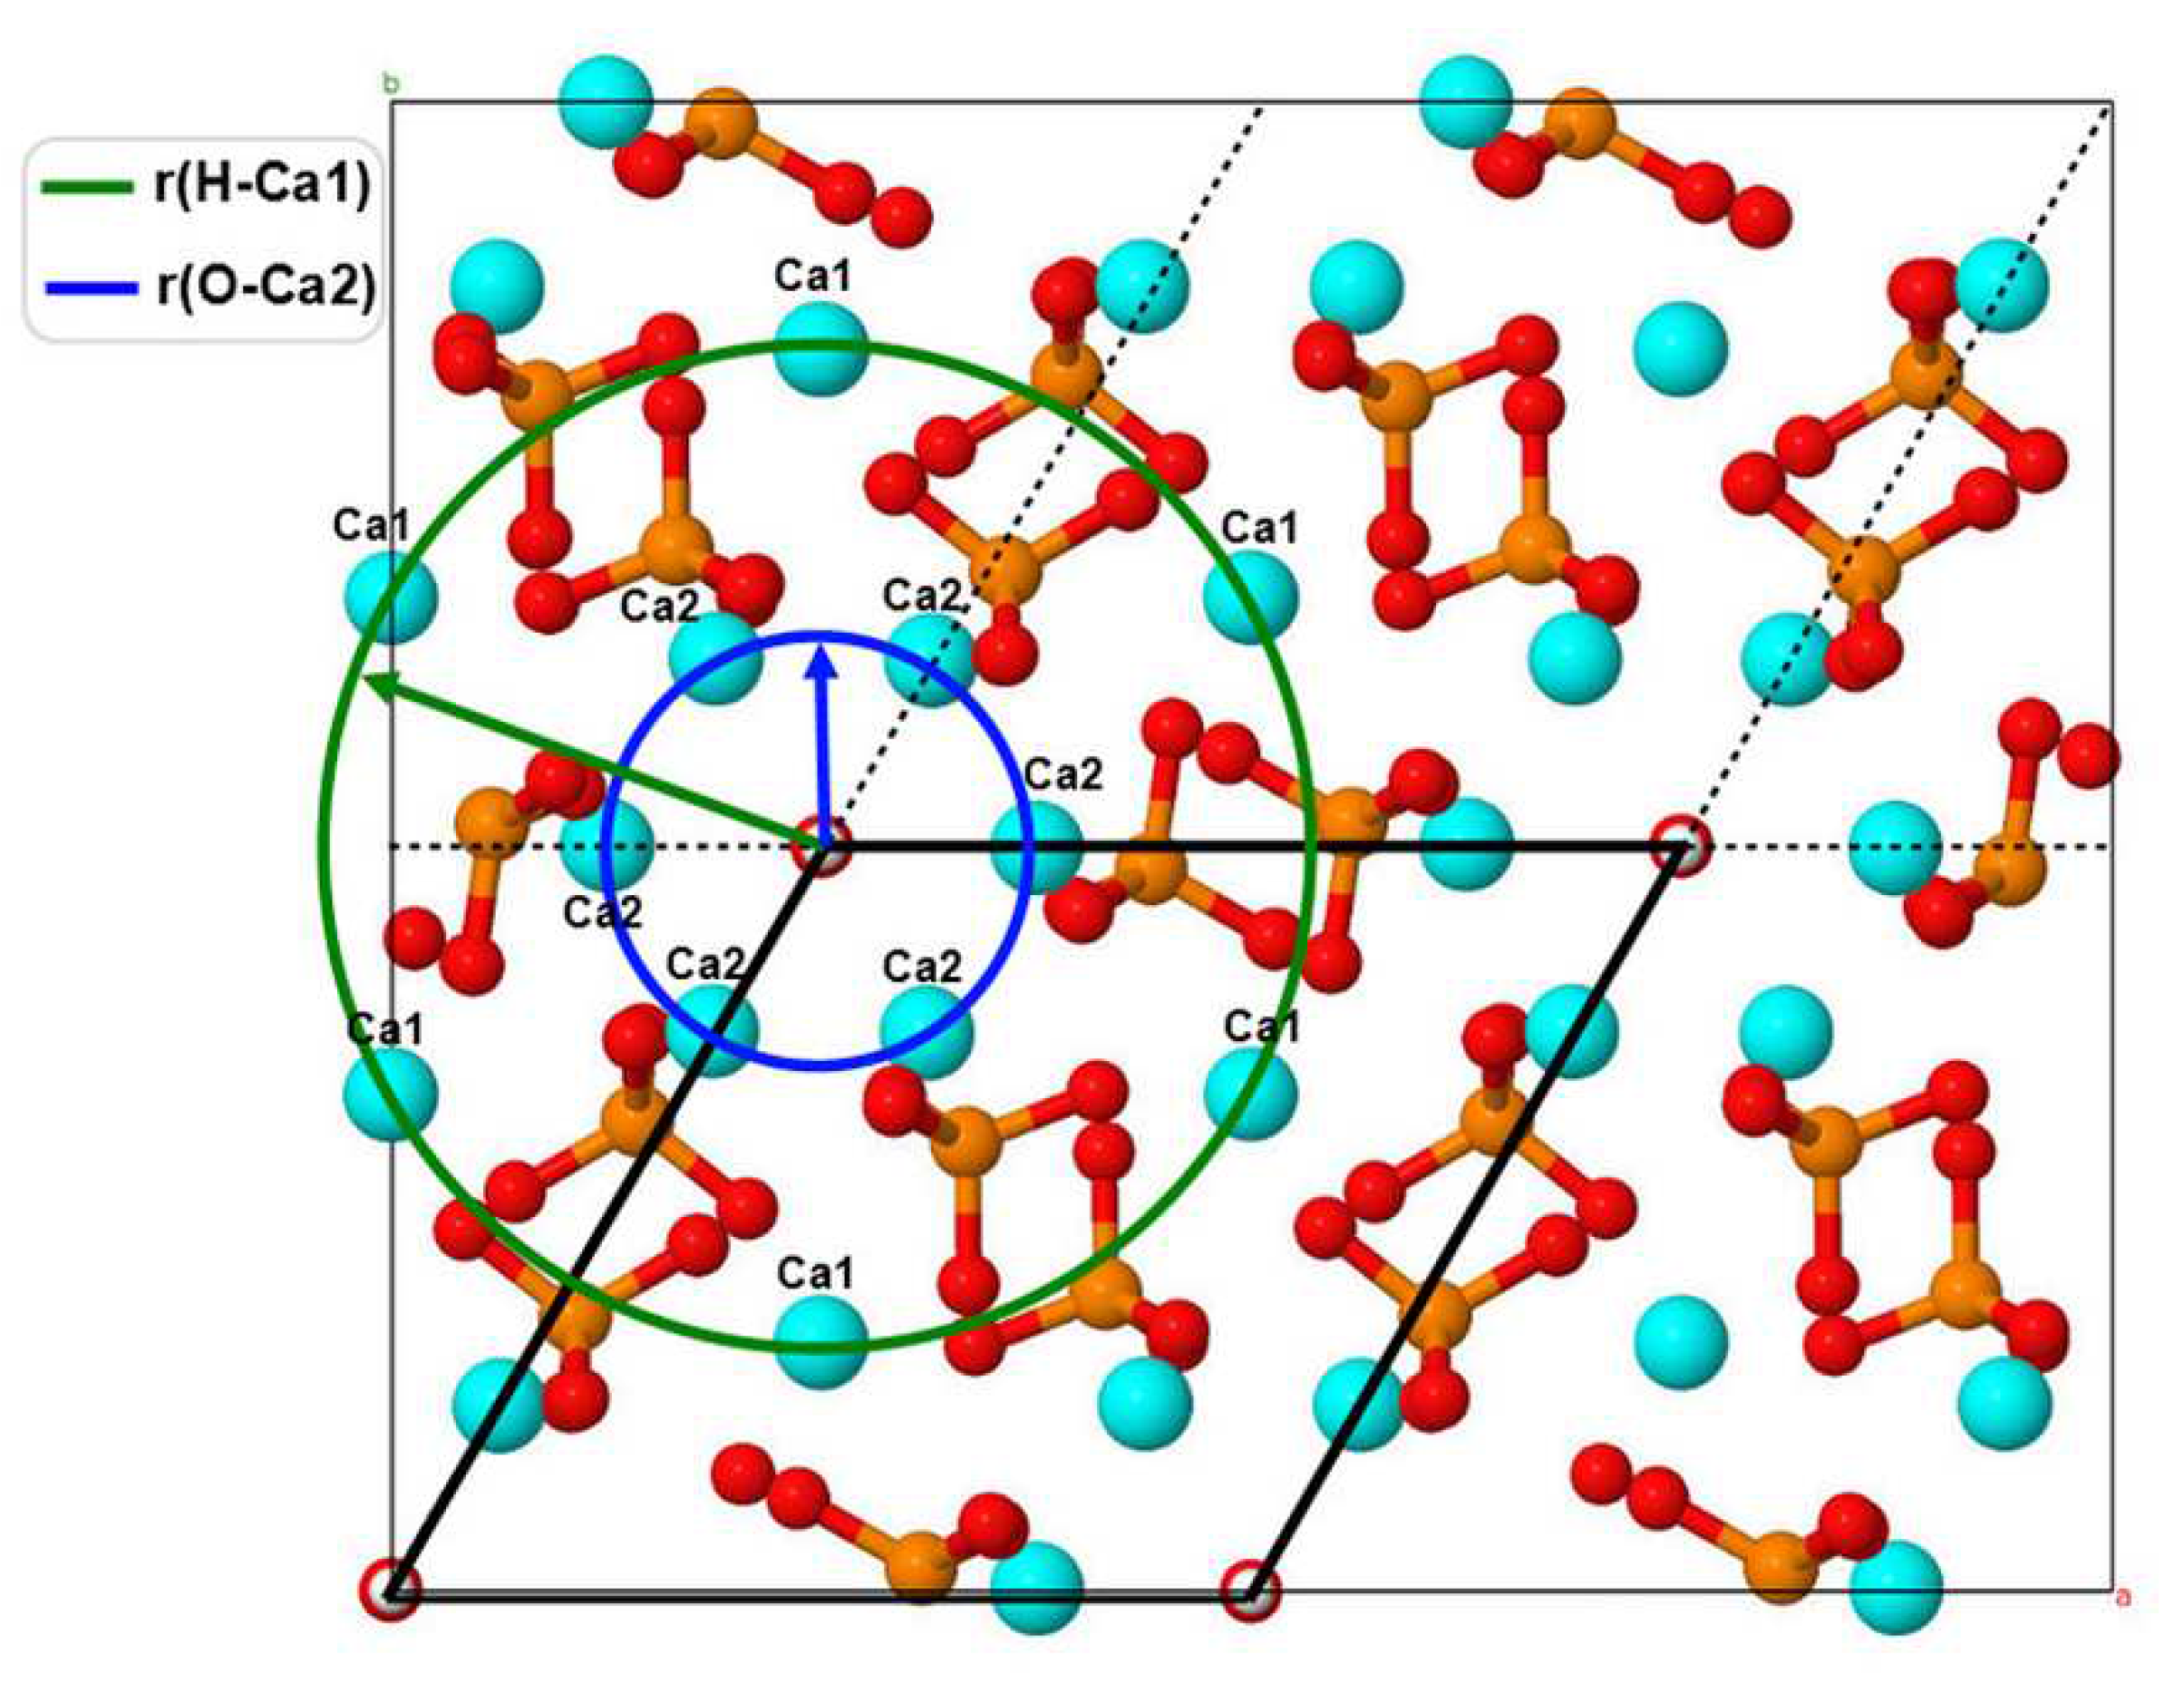
25] (this basic model is shown in
Figure 1, cited from [
25]). In this work, we carry out similar calculations, but for another ion important for cationic substitutions in HAP - for the manganese ion (Mn). And we specifically compare the results of these DFT calculations for the cases of two different cations, obtained by the same methods - to show their difference in results.
2.3. Basic models of calculated HAP-Mn structures
In this work, we consider substitutions associated with manganese ions Mn/Ca. For numerical studies, we used a 2x2x2 orthogonal HAP super-cell containing 8 unit cells (containing 44 atoms), which corresponds totally to 352 atoms. One unit cell of the HAP structure has 10 Ca cations located in two different positions: 4 cations are in the Ca1 position and 6 cations are in the Ca2 position [
9]. The super-cell model contains 80 Ca atoms: 32 Ca cations in the Ca1 position and 48 Ca cations in the Ca2 position (
Figure 1). For clarity, the supercell model is presented in such a way, that two OH-channels are at its center. For the model of unsubstituted HAP, the following parameters of the HAP cell were used (for a super-cell and in terms of one unit cell) [
16,
17]:
a =
b = 18.962 Å/2 = 9.481 Å and
c = 13.717 Å/2 = 6.8585 Å.
The degree of substitution was determined based on the reaction (1) in the unit cell of HAP in the following form: : Ca
10-xMn
x(PO
4)
6(OH)
2 . This means that at x = 1 in the unit cell, only 1 Ca atom out of 10 available atoms is substituted by a Mn atom. For a 2x2x2 super-cell consisting of 8 unit cells, these values should be multiplied by 8, and 8 calcium atoms will be replaced by Mn at x = 1. The substituted structure of HAP-Mn was modeled by replacing Ca atoms with Mn atoms in the Ca1 and Ca2 positions in different quantities in the super-cell: nMn/Ca1, nMn/Ca2, where n = 1, 2, 4, 6, 8. This was done in the same way as in work [
25].
3. Results and discussion
3.1. Experimental results
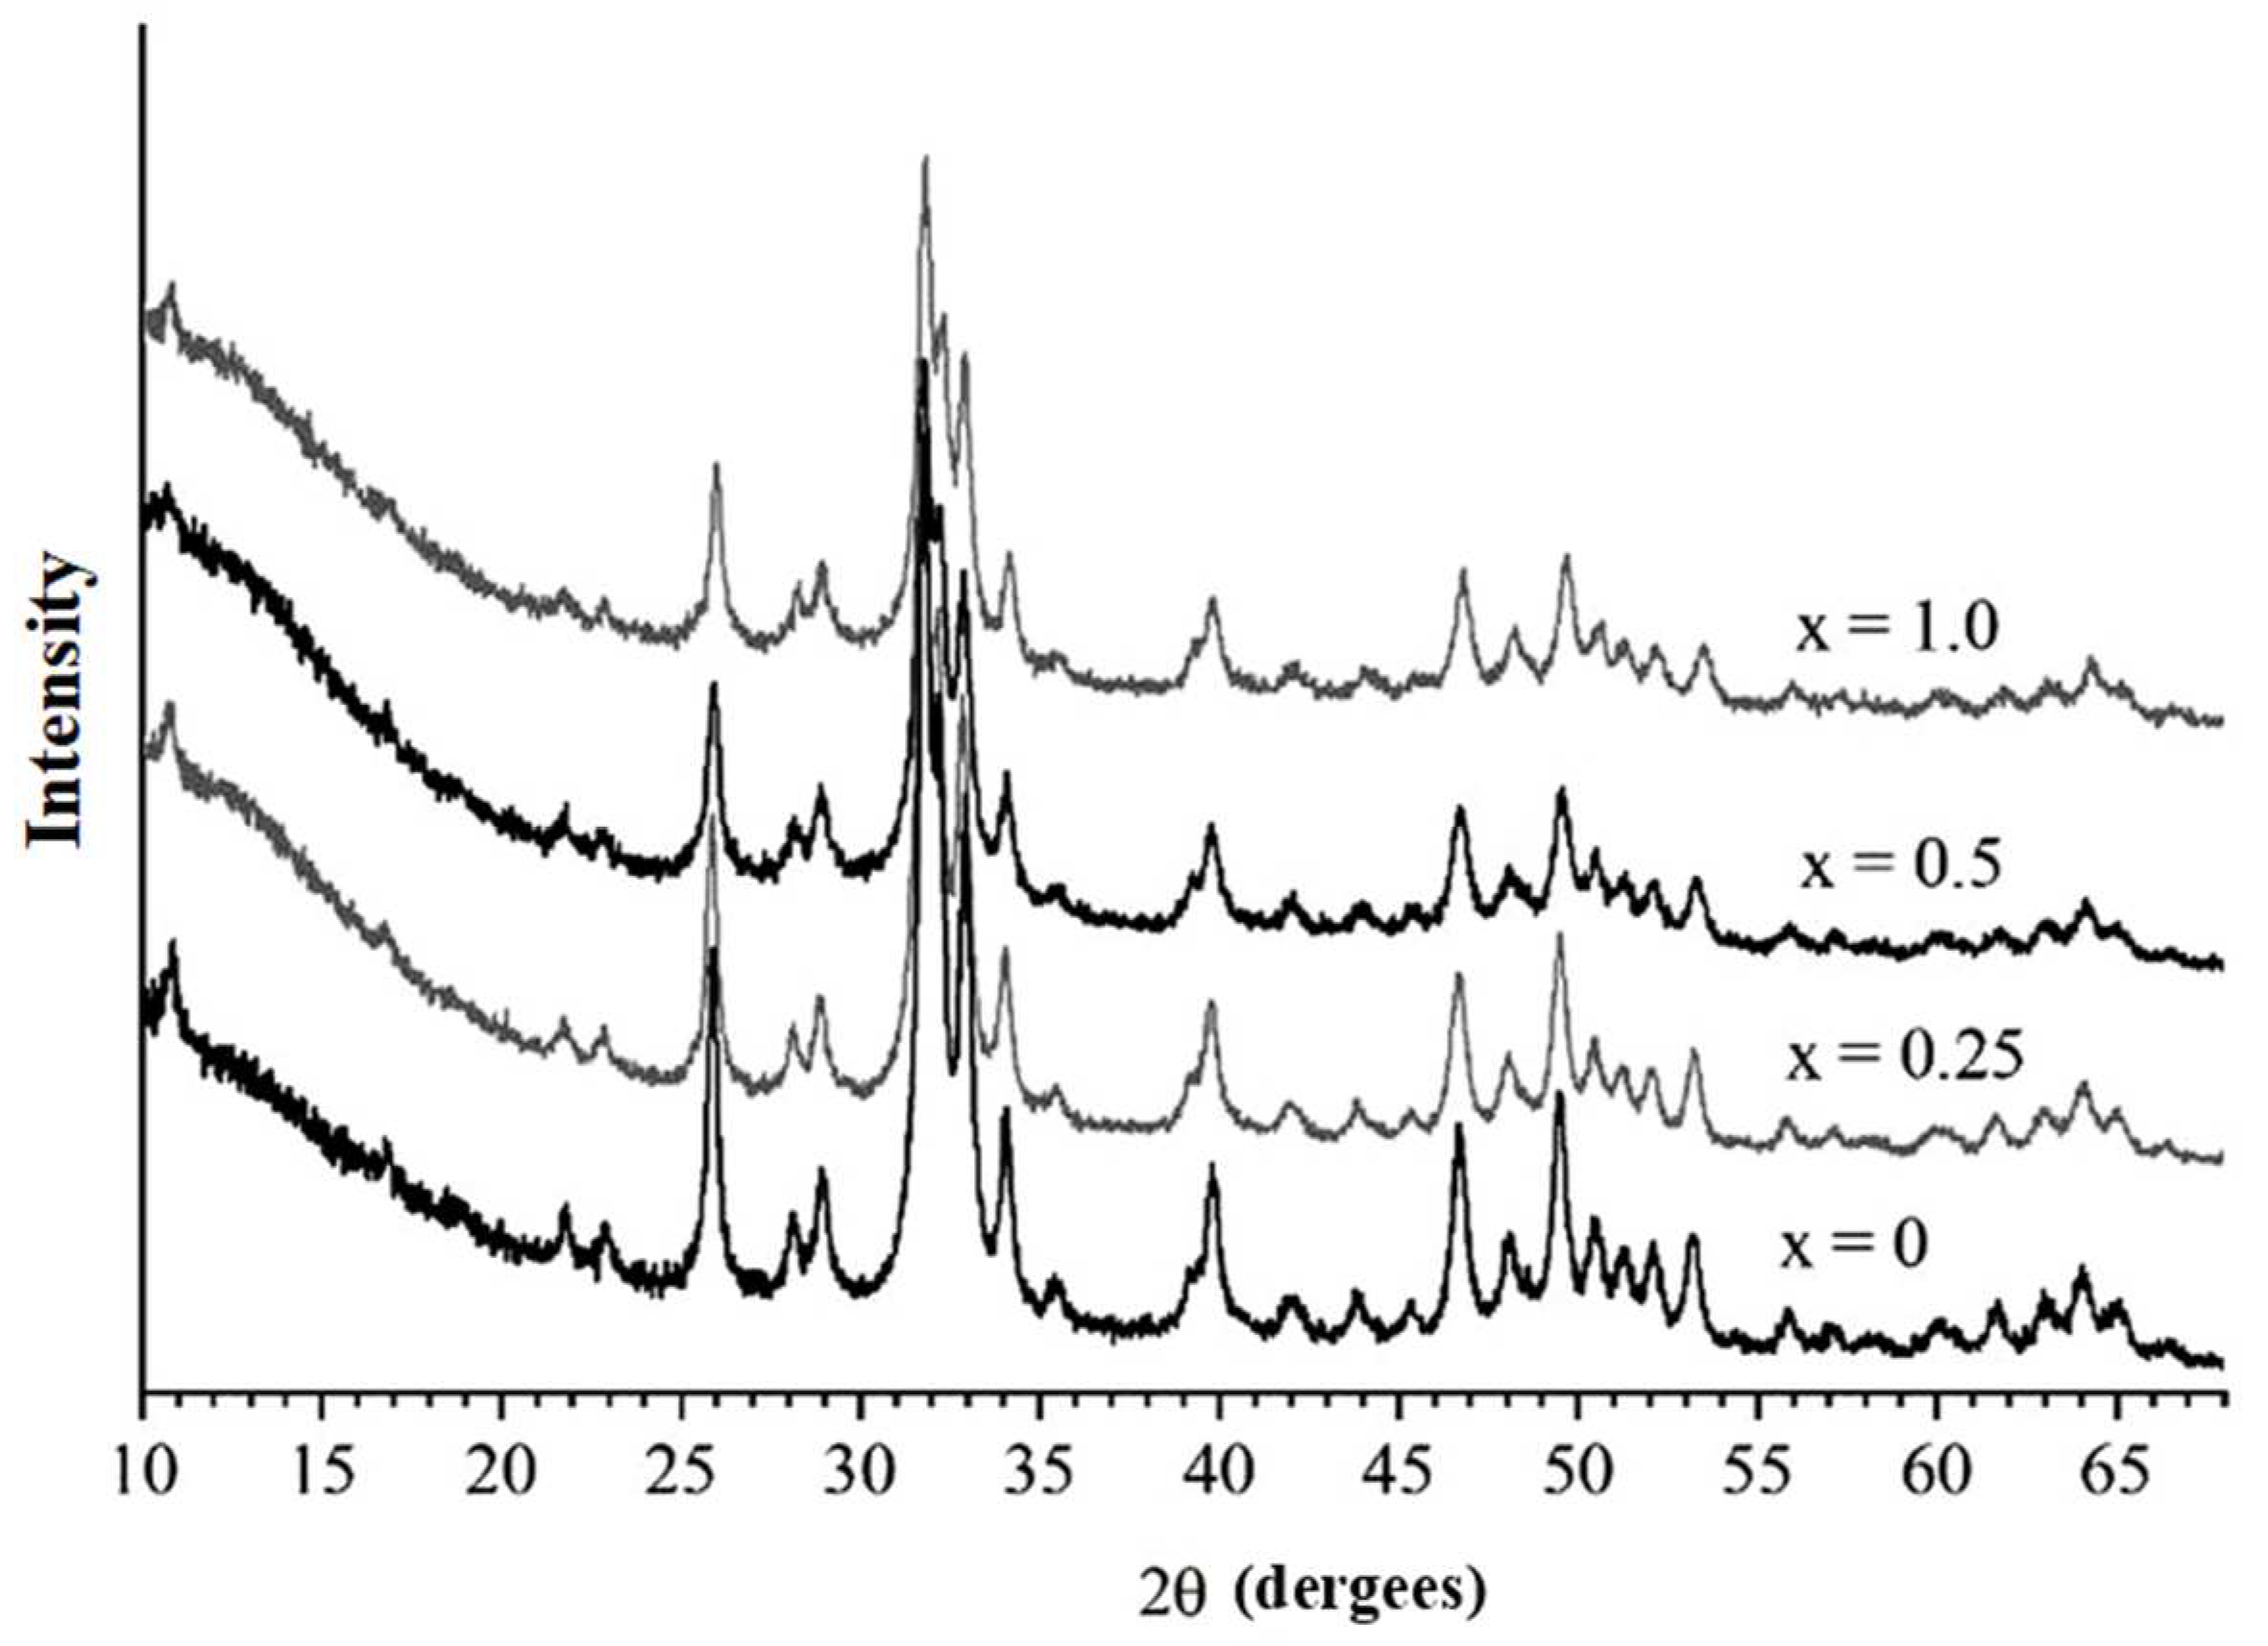
Figure 2 presents XRD patterns of the samples synthesized with the addition of manganese in different concentrations according to reaction (1). The figure shows that all substances have an identical diffraction profile containing reflections characteristic of the HAP phase (PDF 01-76-0694). Consequently, all the initial reagents reacted during mechanical treatment to form the Mn-substituted HAP phase.
The presence of a manganese cation in the structure of HAP is also confirmed by a decrease in the parameters of the unit cell and its volume with an increase in the concentration of manganese introduced into the reaction medium (
Table 1). The observed dynamics are consistent with the change in ionic radii during the substitution under consideration: r(Ca2+) = 1.00 Å, r(Mn2+) = 0.89 Å.
3.2. Results of DFT calculations
3.2.1. Changing unit cell parameters
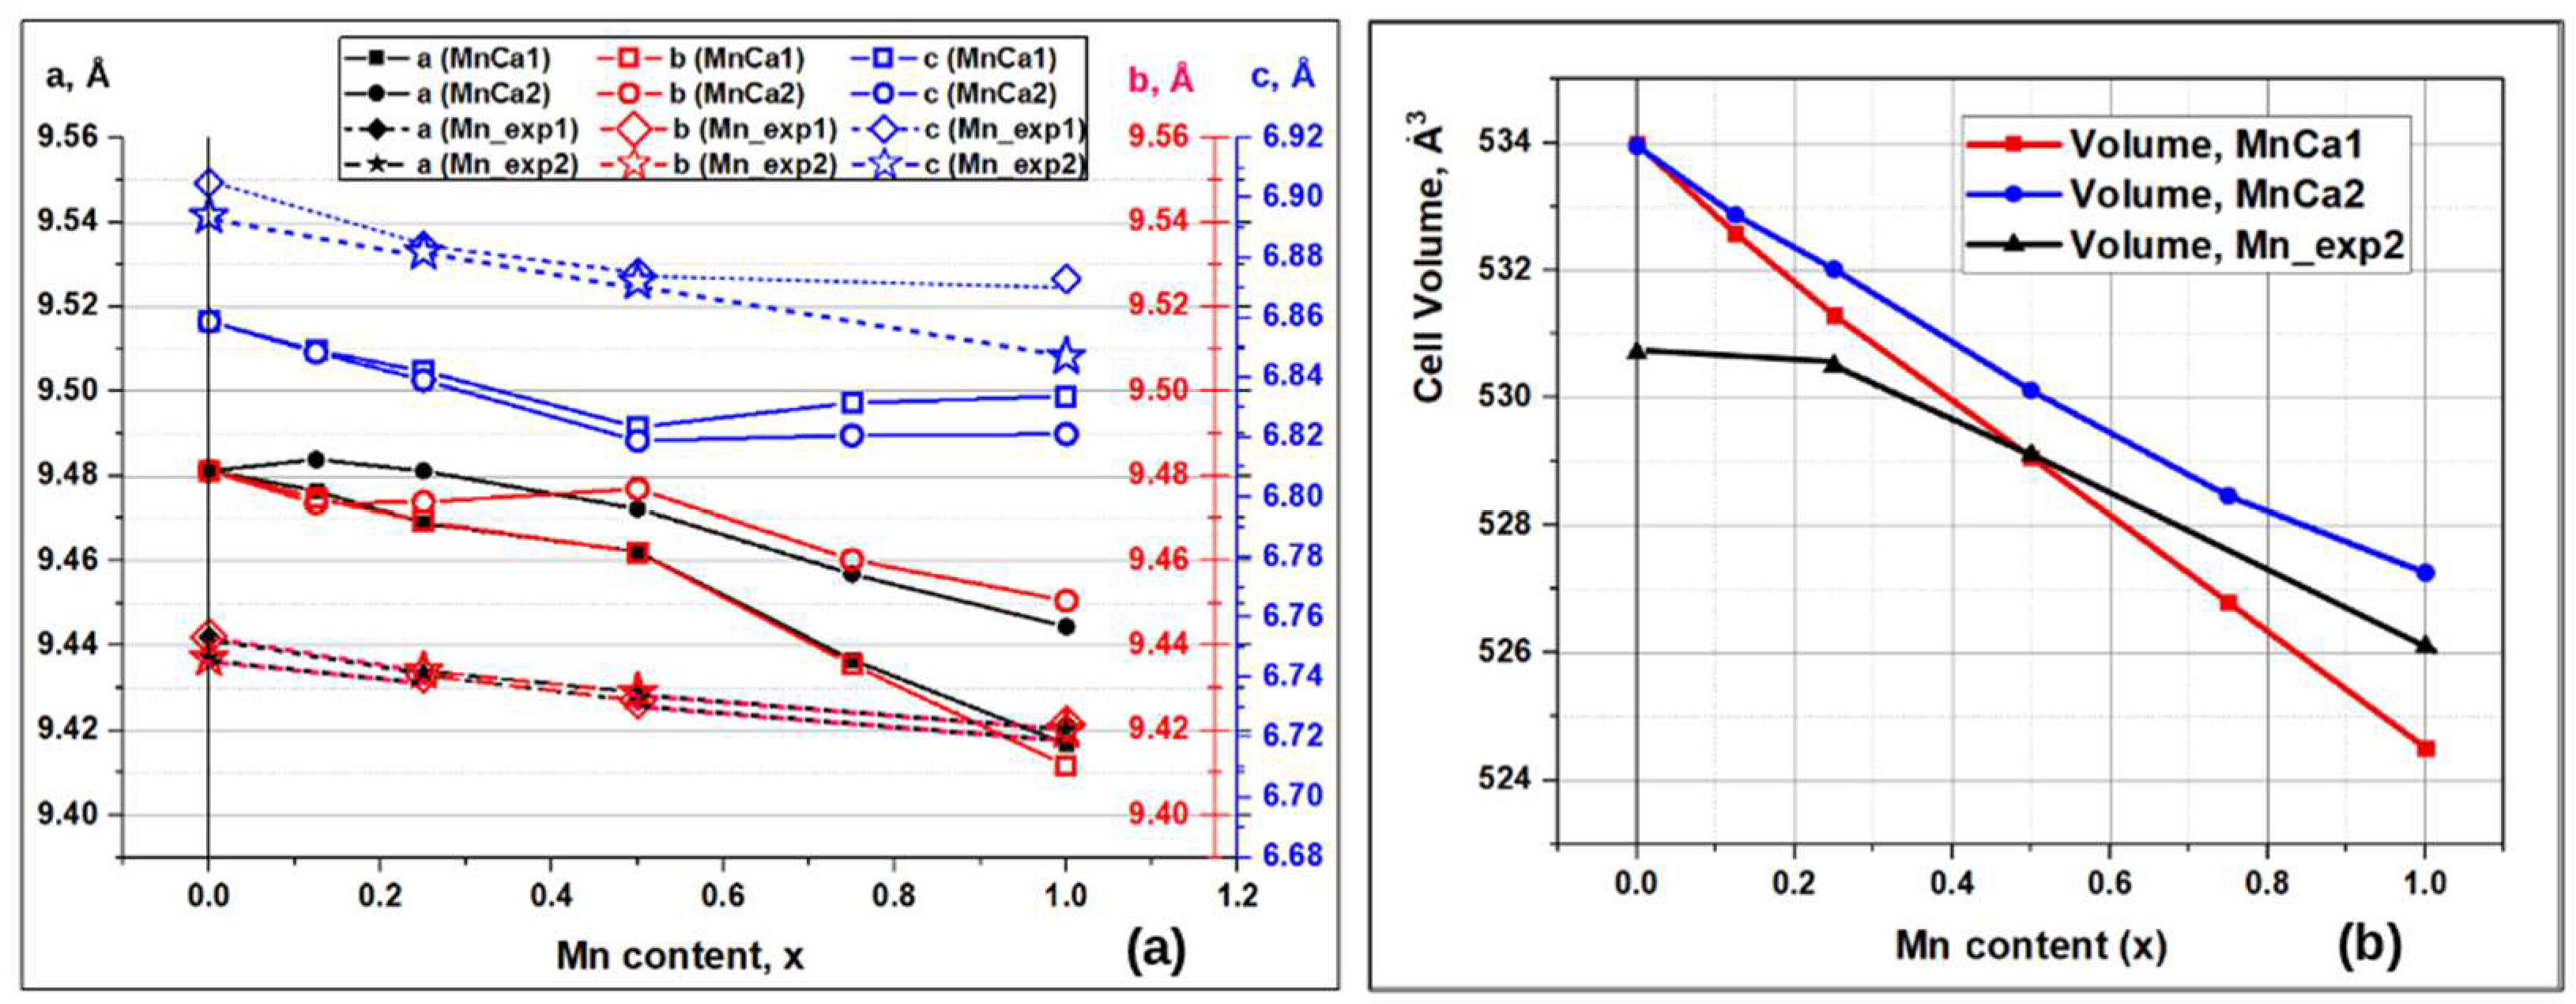
Figure 3 presents the results obained by the DFT calculations of the HAP-Mn unit cell parameters and the volume, in which atoms in the Ca1 and Ca2 positions are replaced by manganese atoms in various concentration x(Mn) after relaxation of the HAP-Mn structure to its equilibrium state during performed DFT optimization. It is clearly seen that the introduction of manganese into the crystal lattice of HAP-Mn leads to a decrease in the unit cell parameters (
Figure 3a) and to the common compression of the unit cell volume (
Figure 3b). These results generally correspond to the known literature data («Mn_exp1» [
45]) and are also confirmed by our own experimental data («Mn_exp2»,
Figure 3a,b). At the same time, DFT calculations show that there is also the occurrence of inequality of cell parameters
a and
b. This results in the loss of the original hexagonal symmetry of the HAP (P6
3 group), where
a =
b. This effect is similar to the Mg/Ca substitutions previously found in [
25]. Note that such an insignificant difference in the unit cell parameters for insufficiently crystallized samples is currently impossible to experimentally detect. Moreover, when magnesium is localized in statistically random positions of the crystal lattice, these effects “blur”, which complicates their identification. In our experimental data presented here, there is a mixed effect of finding Mn/Ca substitutions in both positions Ca1 and Ca2, but in different ratios, which contribute to the overall total measurement result and, therefore, cannot be distinguished.
More noticeable differences between parameters
a and
b are observed here in the region of low concentrations (x < 0.5) for the Mn/Ca1 and Mn/Ca2 substitutions (
Figure 3a). In the concentration range 1.0 > x > 0.5, there is a noticeable change in the behavior of the calculated parameter
c - it increases slightly here. However, in this case, a more noticeable decrease in the calculated parameters
a and
b occurs, so that as a result, the cell volume continues to decrease proportionally (
Figure 3b). At the same time, the difference between the parameters for the Mn/Ca1 and Mn/Ca2 substitutions increases, so that parameters
a and
b for the Mn/Ca1 substitutions decrease more noticeably. As a result, the cell volume for Mn/Ca1 becomes smaller than the cell volume for Mn/Ca2 substitutions (
Figure 3b).
At the same time, experimental data show a smoother behavior - a gradual regular decrease in cell parameters. Although, according to the data of work [
45], for the region x = 1 parameter
c experiences some relative slowdown in such a decrease.
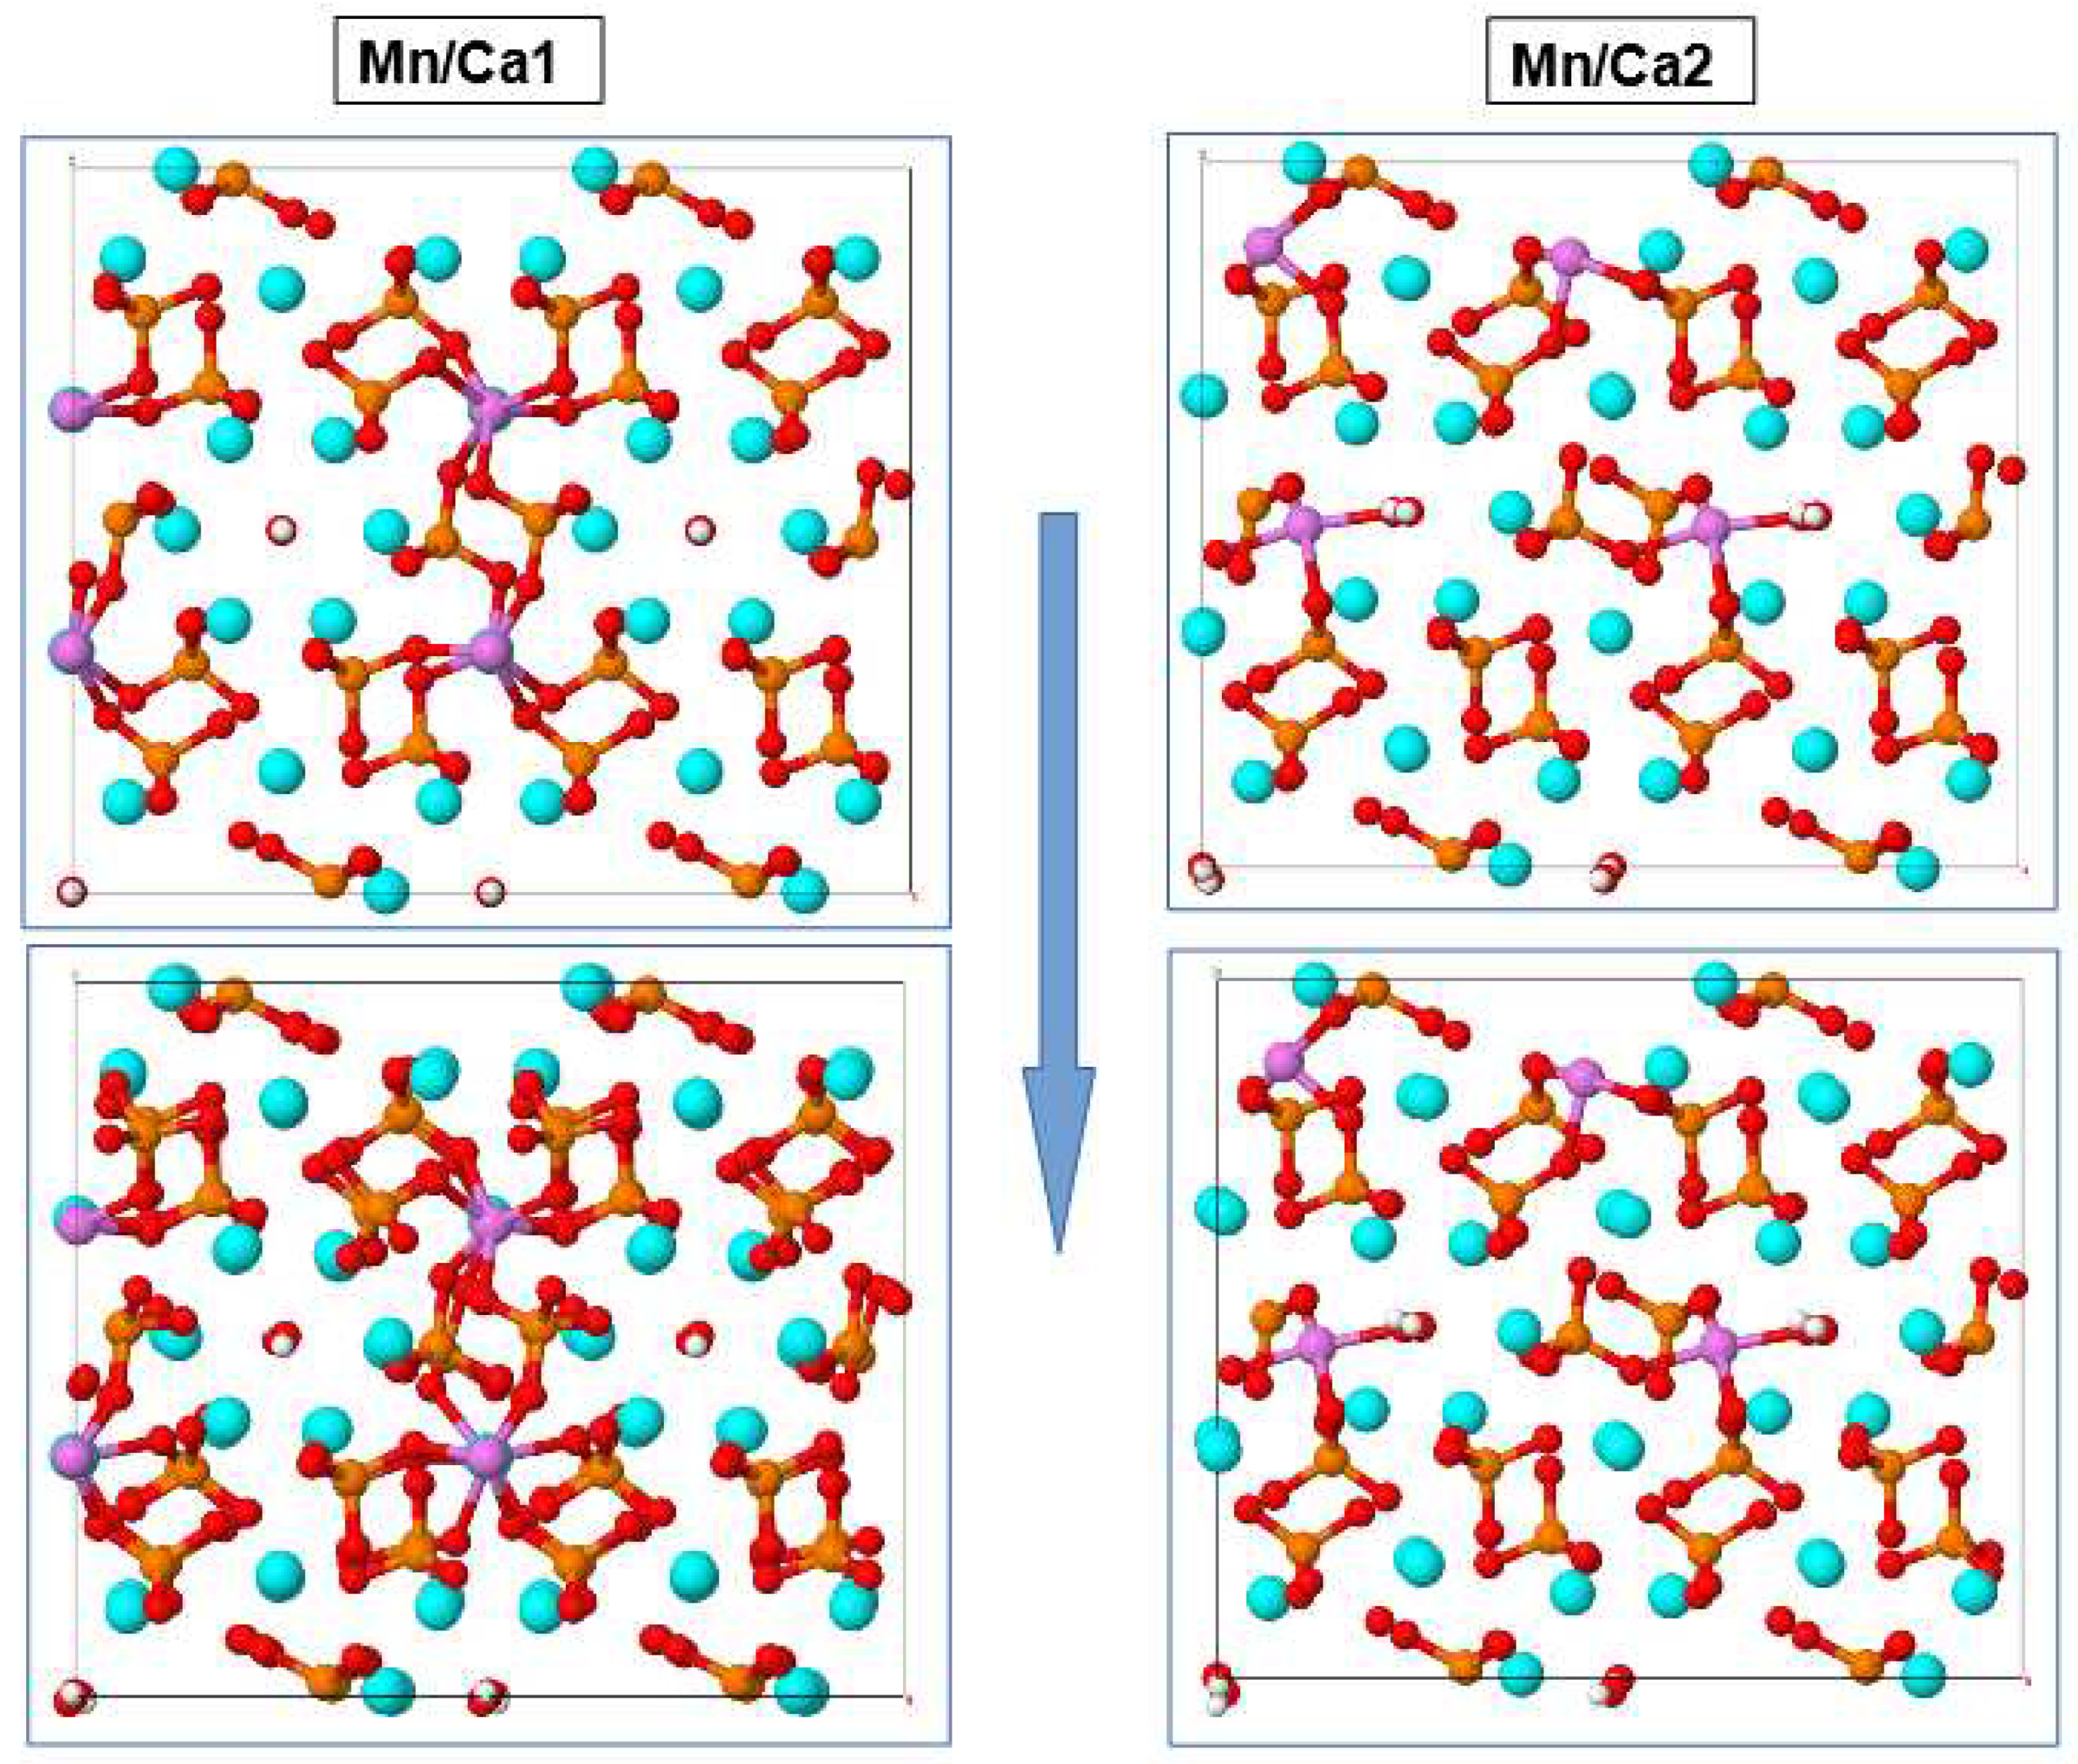
In general, increasingly large differences in the distances between the atoms of the crystal structure of HAP are noticeable for the Mn/Ca1 and Mn/Ca2 substitutions; shifts and symmetry violations appear, especially more pronounced for the case of Mn/Ca2 substitutions (in the Ca2 position) and near the OH channel axis (
Figure 4). The observed distortions are similar to those occurring when calcium is replaced by magnesium Mg/Ca2 in HAP at Ca2 position [
25]. In this case, the case of Mn/Ca1 substitutions is characterized by the development of stronger bonds with oxygen ions of the surrounding PO
4 groups and a corresponding more significant compression in these areas. All these structural characteristic effects were also noted in cases of calcium substitution with magnesium Mg/Ca in HAP [
25].
At the same time, in the case of the replacement of calcium with manganese Mn/Ca in HAP, a significant difference arises compared to the replacement of calcium with magnesium Mg/Ca [
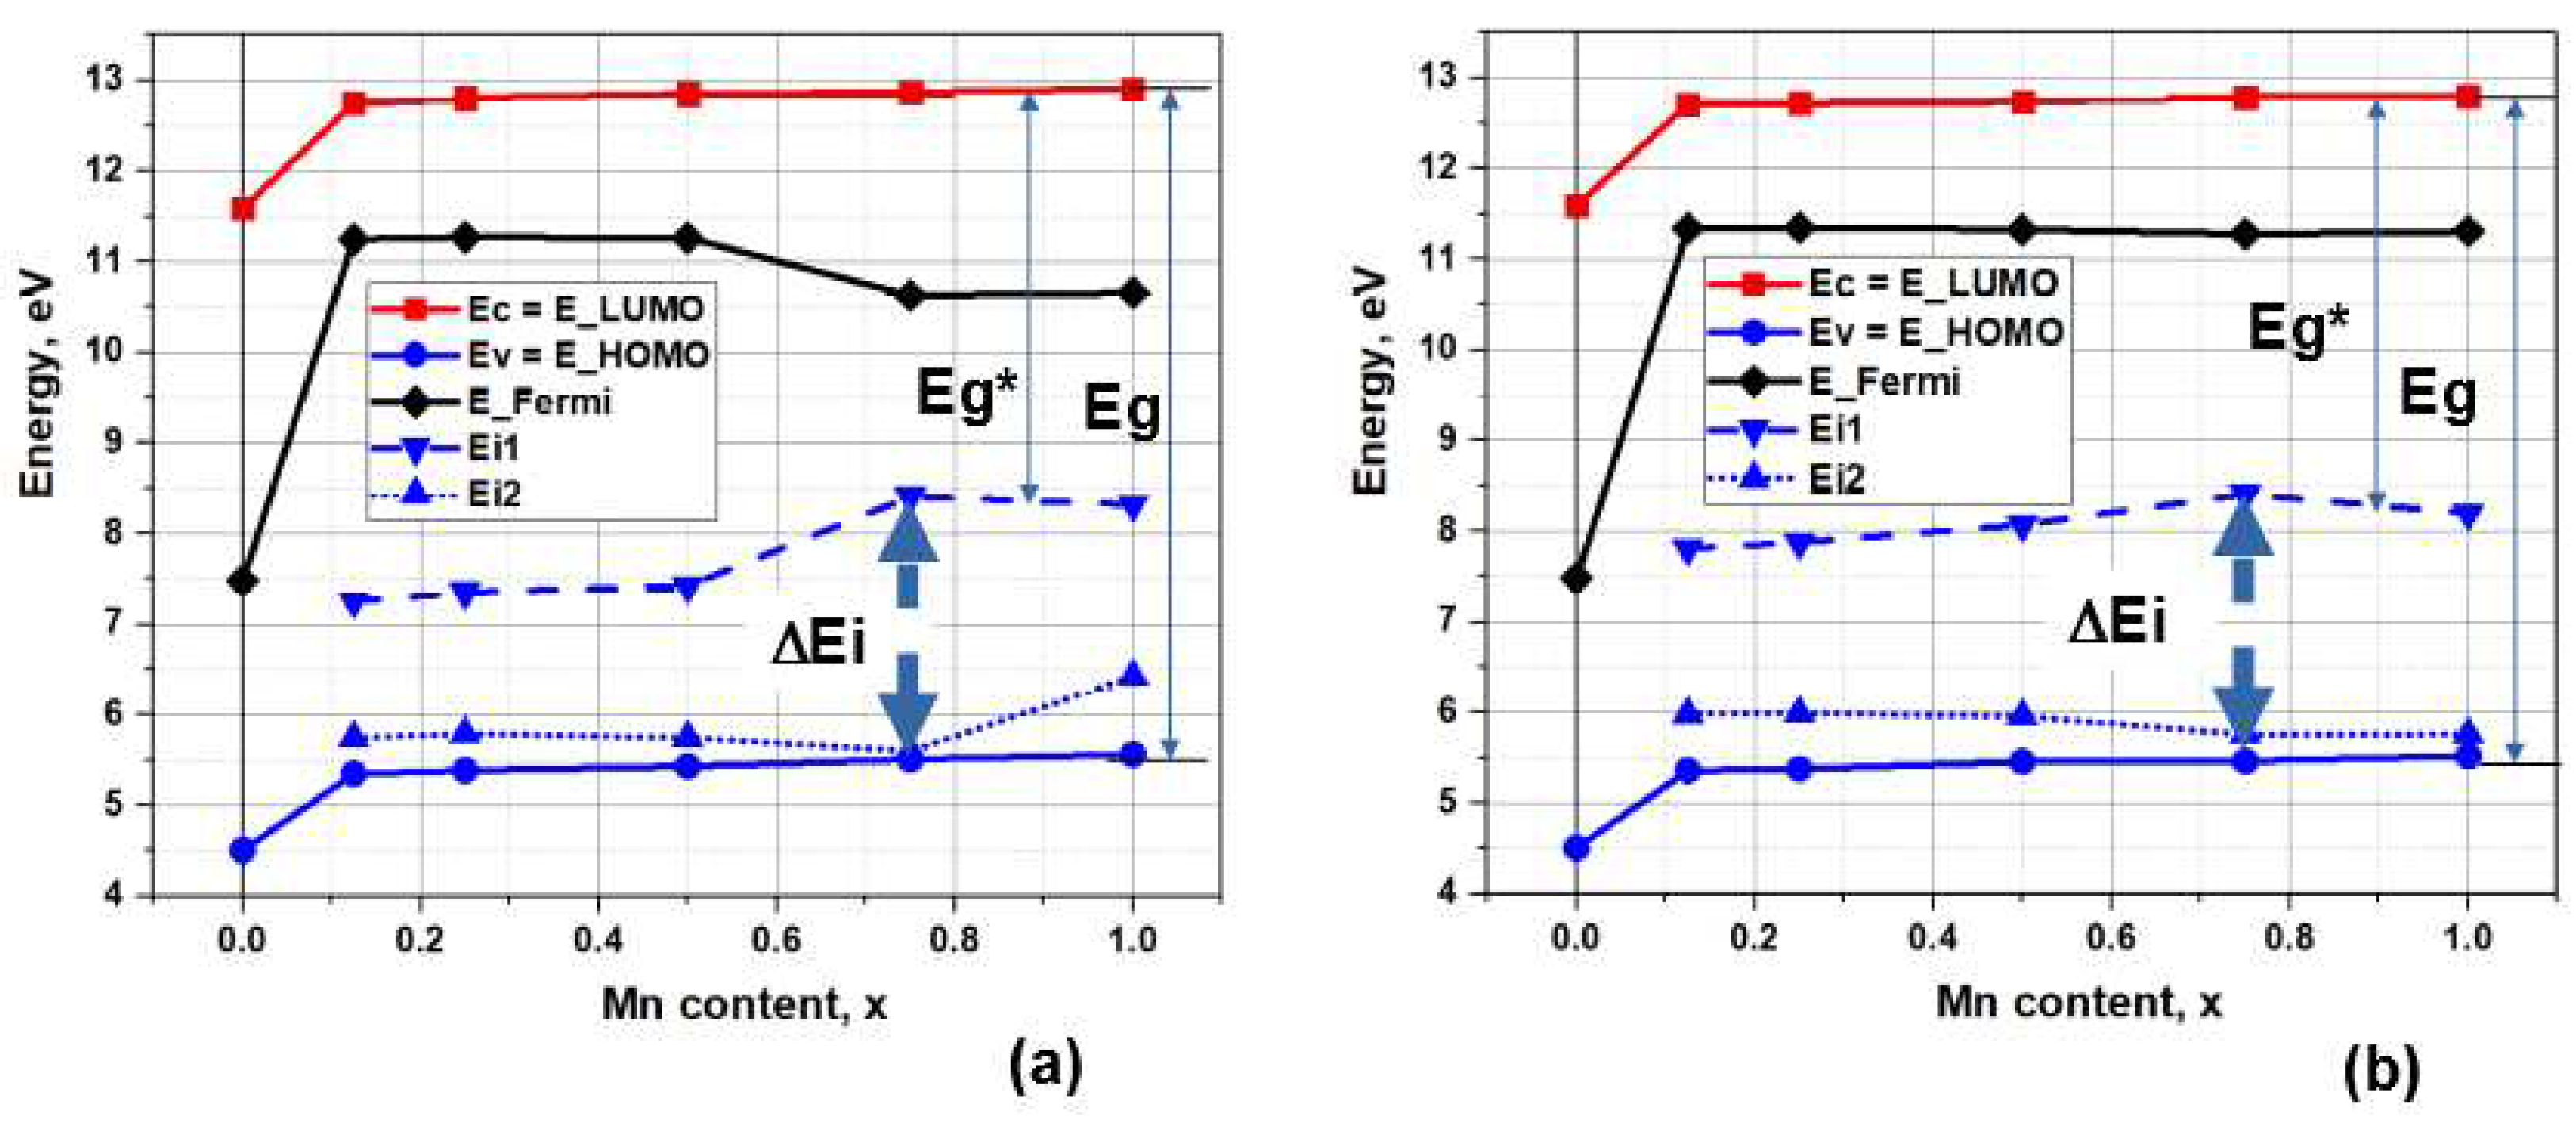
25], associated with the appearance here of additional new energy levels Ei within the original band gap Eg and in the corresponding change in the system of all electronic levels energies of the band structure of HAP. In the case of Mg/Ca substitutions in HAP, there are no such energy levels E
i and only a change in the HAP band gap Eg occurs.
3.2.2. Changes in the energy levels of electronic states of the band structure of HAP
In the case of Mn/Ca substitutions, significant changes occur in the energy band structure of HAP, since additional local energy levels Ei of electronic states appear inside the band gap Eg [
24,
29]. They appear immediately as soon as only one Mn/Ca ion is replaced in the HAP cell. Then, gradually, with an increase in x(Mn) and the number of substituting Mn atoms in the HAP cell, the number of additional energy levels increases, and these changes shift the entire system of electronic energy levels, thereby changing all the optical, electronic and luminescent properties of HAP-Mn.
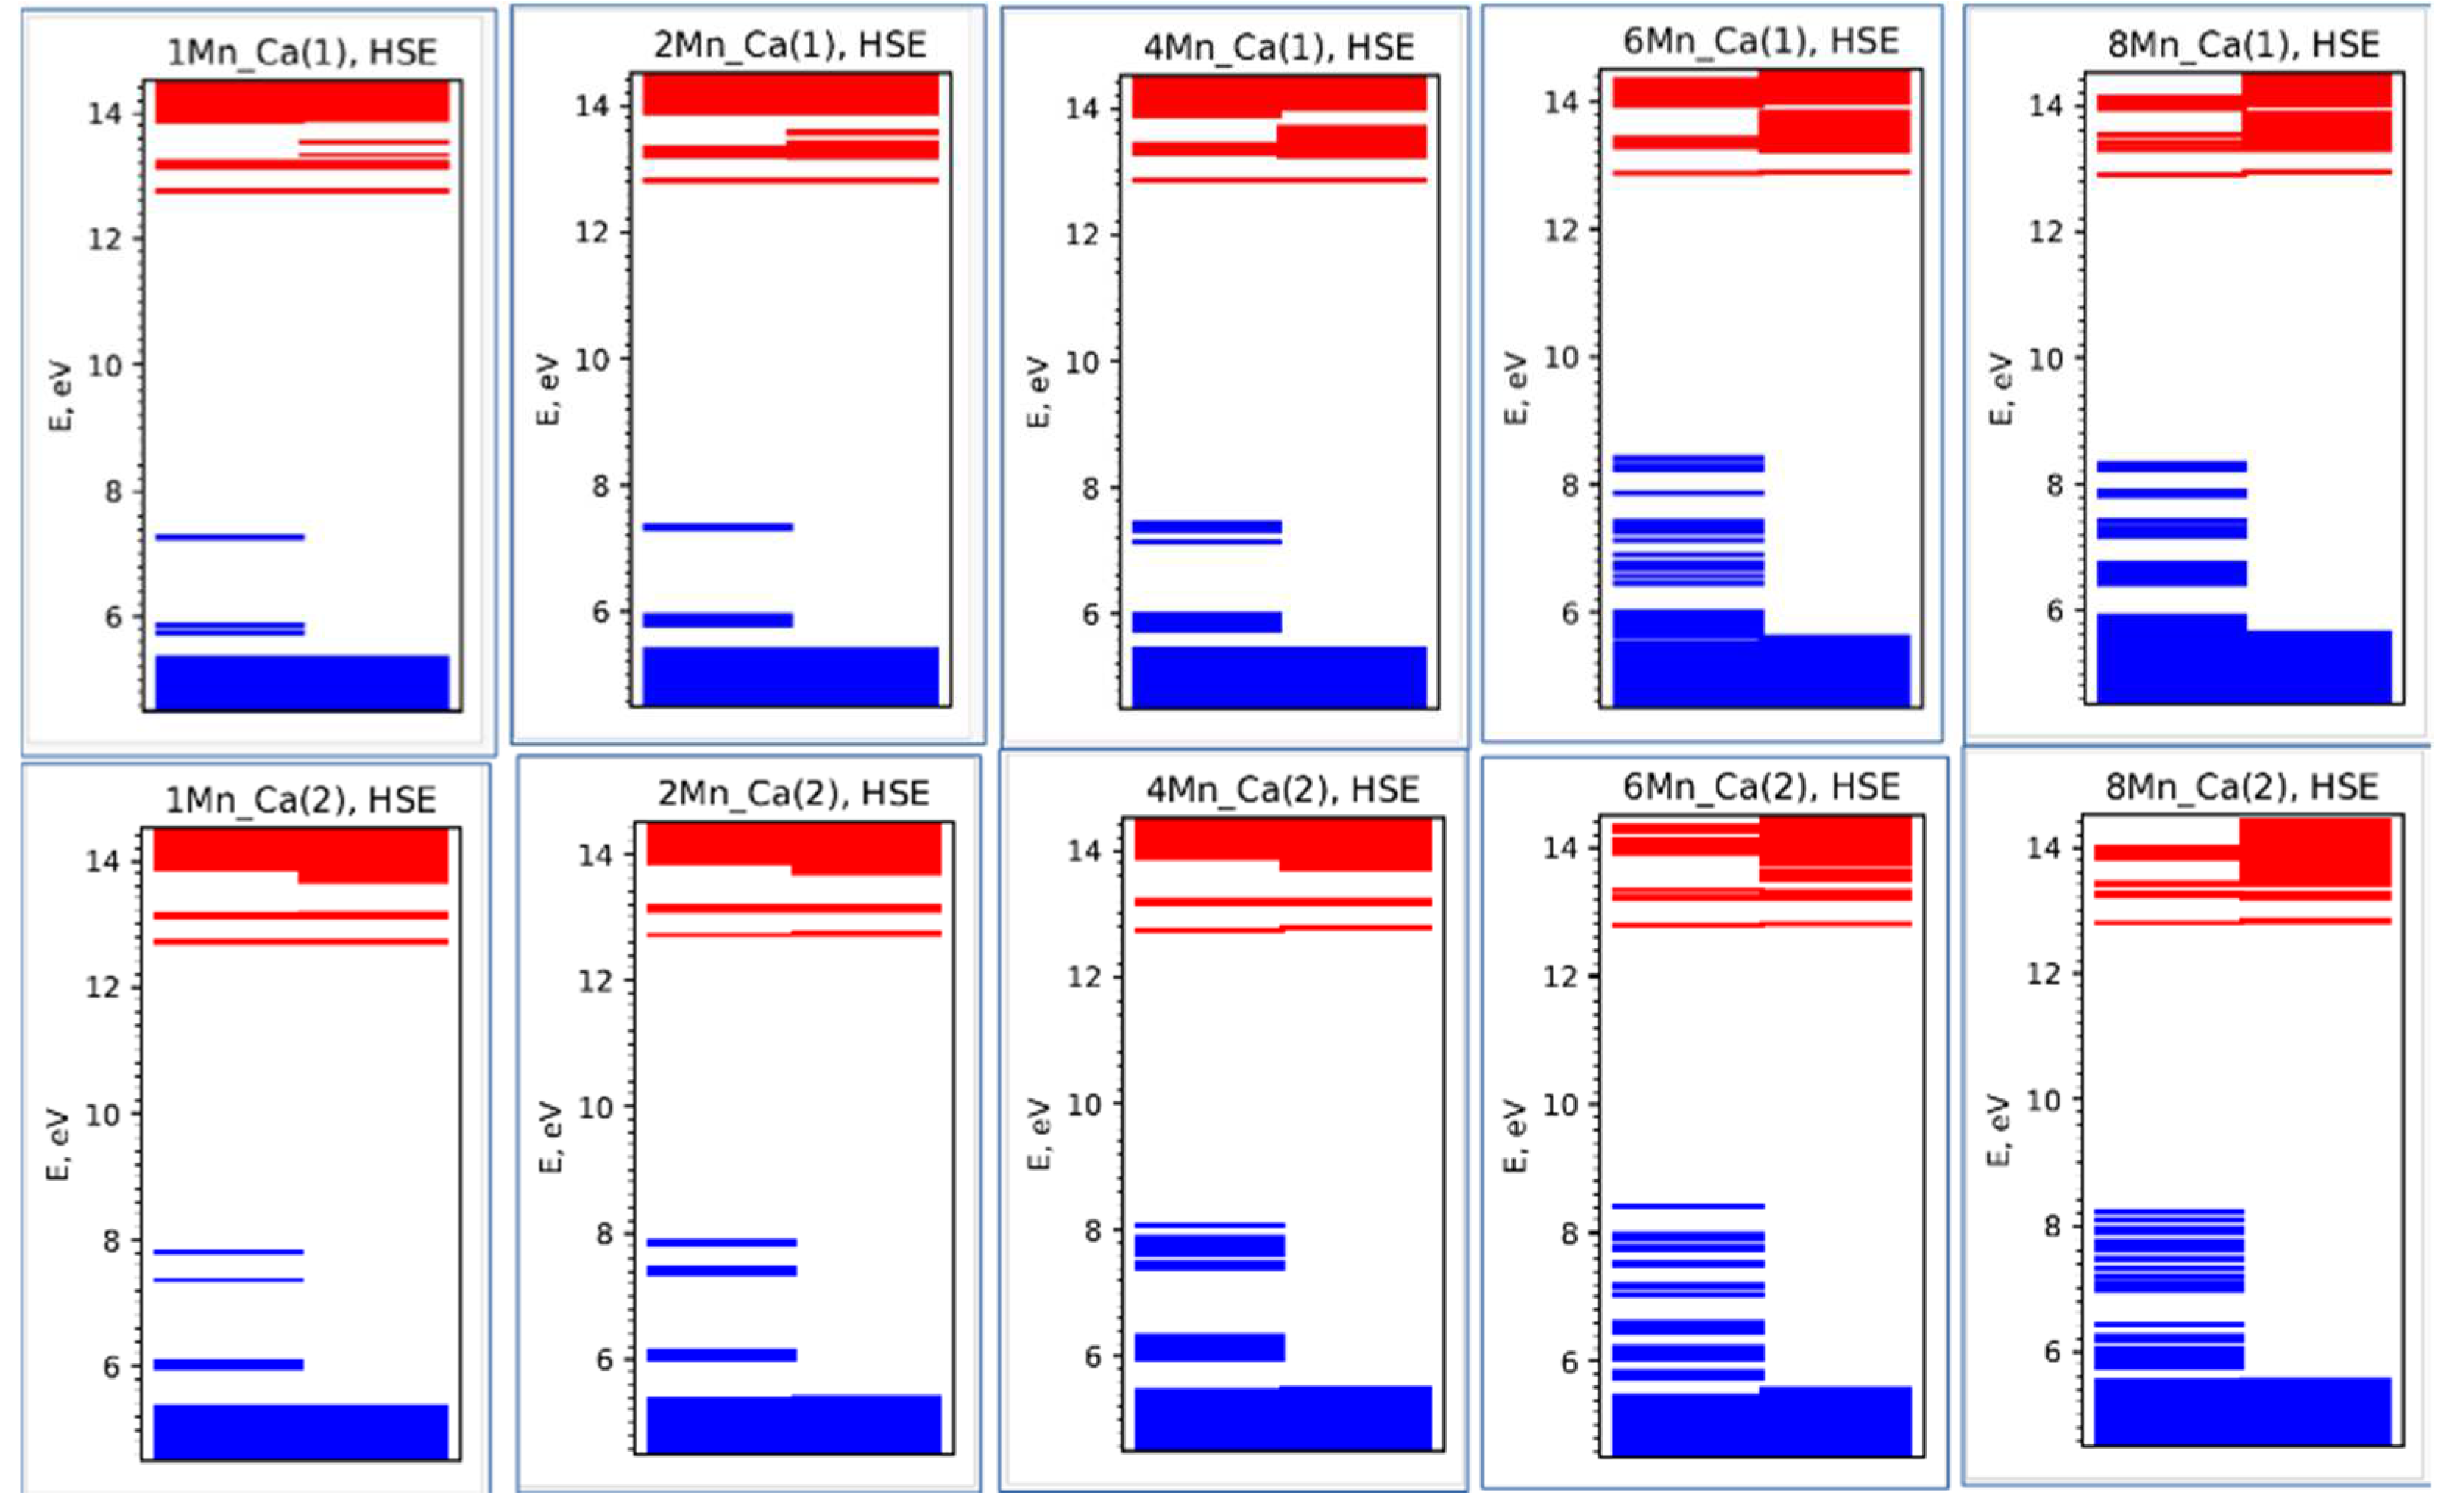
Characteristic changes in electronic energy Ei levels for the case of HSE calculation (at the first step of calculations after PBE optimization) are shown in
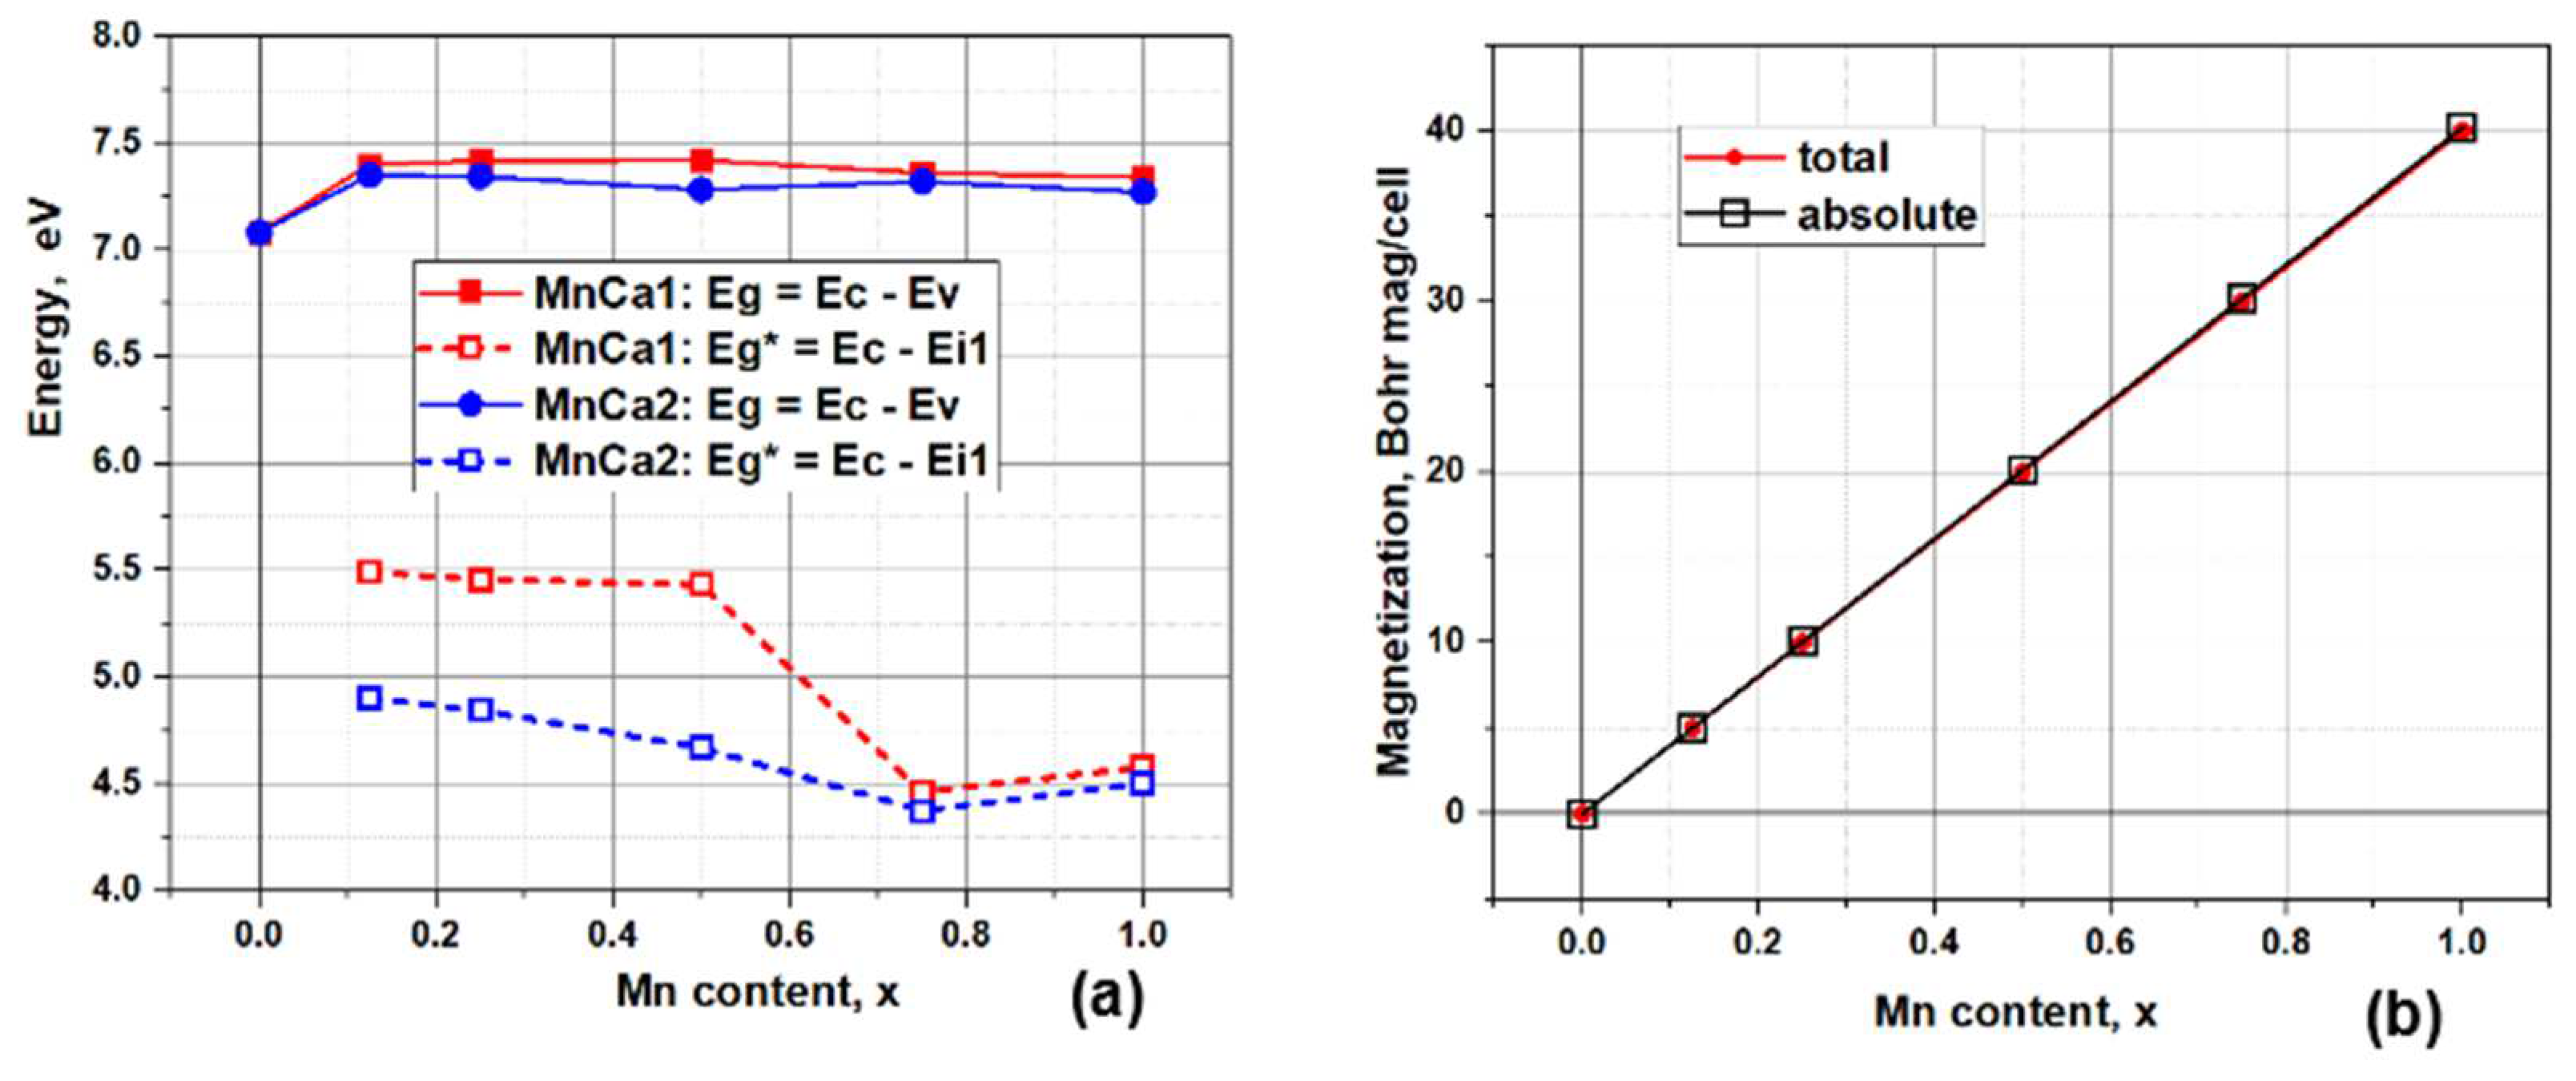
Figure 5. It can be seen that the photoexcitation energy Eg* levels for the case of nMn/Ca2 are lower than for nMn/Ca1. On average, the level of Eg* ~ 4.8 eV (at Eg ~ 7.3 eV) for nMn/Ca2 substitutions, while for nMn/Ca1 we have Eg* ~ 5.4 eV (at Eg ~ 7.4 eV).
Moreover, all energy levels depend on the changes in the concentration of manganese x(Mn): at low concentrations x = 0.1 - 0.5, the width of the ΔEi band changes little and has a value of the order of ΔEi = 1.5 eV for Mn/Ca1 and ΔEi = 2 eV for Mn/Ca2 substitutions; but then at x = 0.75 there is a maximum of ΔEi ~ 3 eV for both types of substitutions (Ca1 and Ca2), and at x = 1 there is a slight decrease in this band to a value of ΔEi ~ 2 eV. As a result, corresponding changes will also occur in the values of the photoionization energy Eg*.
Figure 6a shows characteristic changes in Eg and Eg* for both cases of substitution. Here, at low concentrations x = 0.1 - 0.5, the values of Eg* ~ 5.5 eV for Mn/Ca1 substitutions and Eg* < 5.0 eV for Mn/Ca2 substitutions. Then at x = 0.75 there is a decrease and a minimum of Eg* ~ 4.5 eV is observed with a slight rise at x = 1.0 for almost both types of substitutions.
Also in
Figure 6b shows the change in magnetization with increasing manganese concentration. Magnetization appears in a jump of 5 (Bohr mag)/cell when already 1 Mn ion is introduced into the super-cell (substitution of one Ca ion out of 80 in the super-cell), and then increases linearly in proportion to the number of substituting ions nMn/Ca in both calcium positions.
In both cases, when each Ca ion is replaced by a Mn ion, 5 new additional energy levels Ei appear in the super-cell, so that for the calculated (using the HSE functional) substitutions at n = 8, each super-cell already contains 40 energy levels Ei in the ΔEi bands (
Figure 5a,b). Each substituted Mn atom gives 5 (Bohr mag)/cell. At the considered values of substitution concentrations x(Mn), magnetization does not saturate and its value reaches 40 (Bohr mag)/cell for both types of substitutions (
Figure 6b).
In this case, there is also a proportional increase in the number of energy levels in the energy band ΔΕi = Ei1 – Ei2 for both types of substitutions, but with different values of these energy levels, which is clearly visible in
Figure 7.
Note that these above magnetization values introduced by Mn atoms into the structure of HAP-Mn refer only to the case of neutral charge Q = 0 of the Mn atom. In the case of Mn ions with other charges Q = +1, +2 (Mn
+1, Mn
+2), magnetization values change. The DFT calculations performed showed the dependence of the magnetization of the HAP-Mn structure on the charge Q (when replacing one calcium atom with one manganese atom, in different positions of Ca1 and Ca2).
Table 2 shows these magnetization values.
The highest expected value of magnetization is 5 Bohr mag/cell in the case of a neutral cell, that is, replacing the Ca2+ ion with Mn2+. With an increase in the charge of the ions (Mn3+, Mn4+), the magnetization decreases to 4 or 3 Bohr mag/cell, and the latter value is observed only in the case of replacement of Mn4+ in the Ca1 position.
3.2.3. Energy of formation of Mn/Ca substitutions
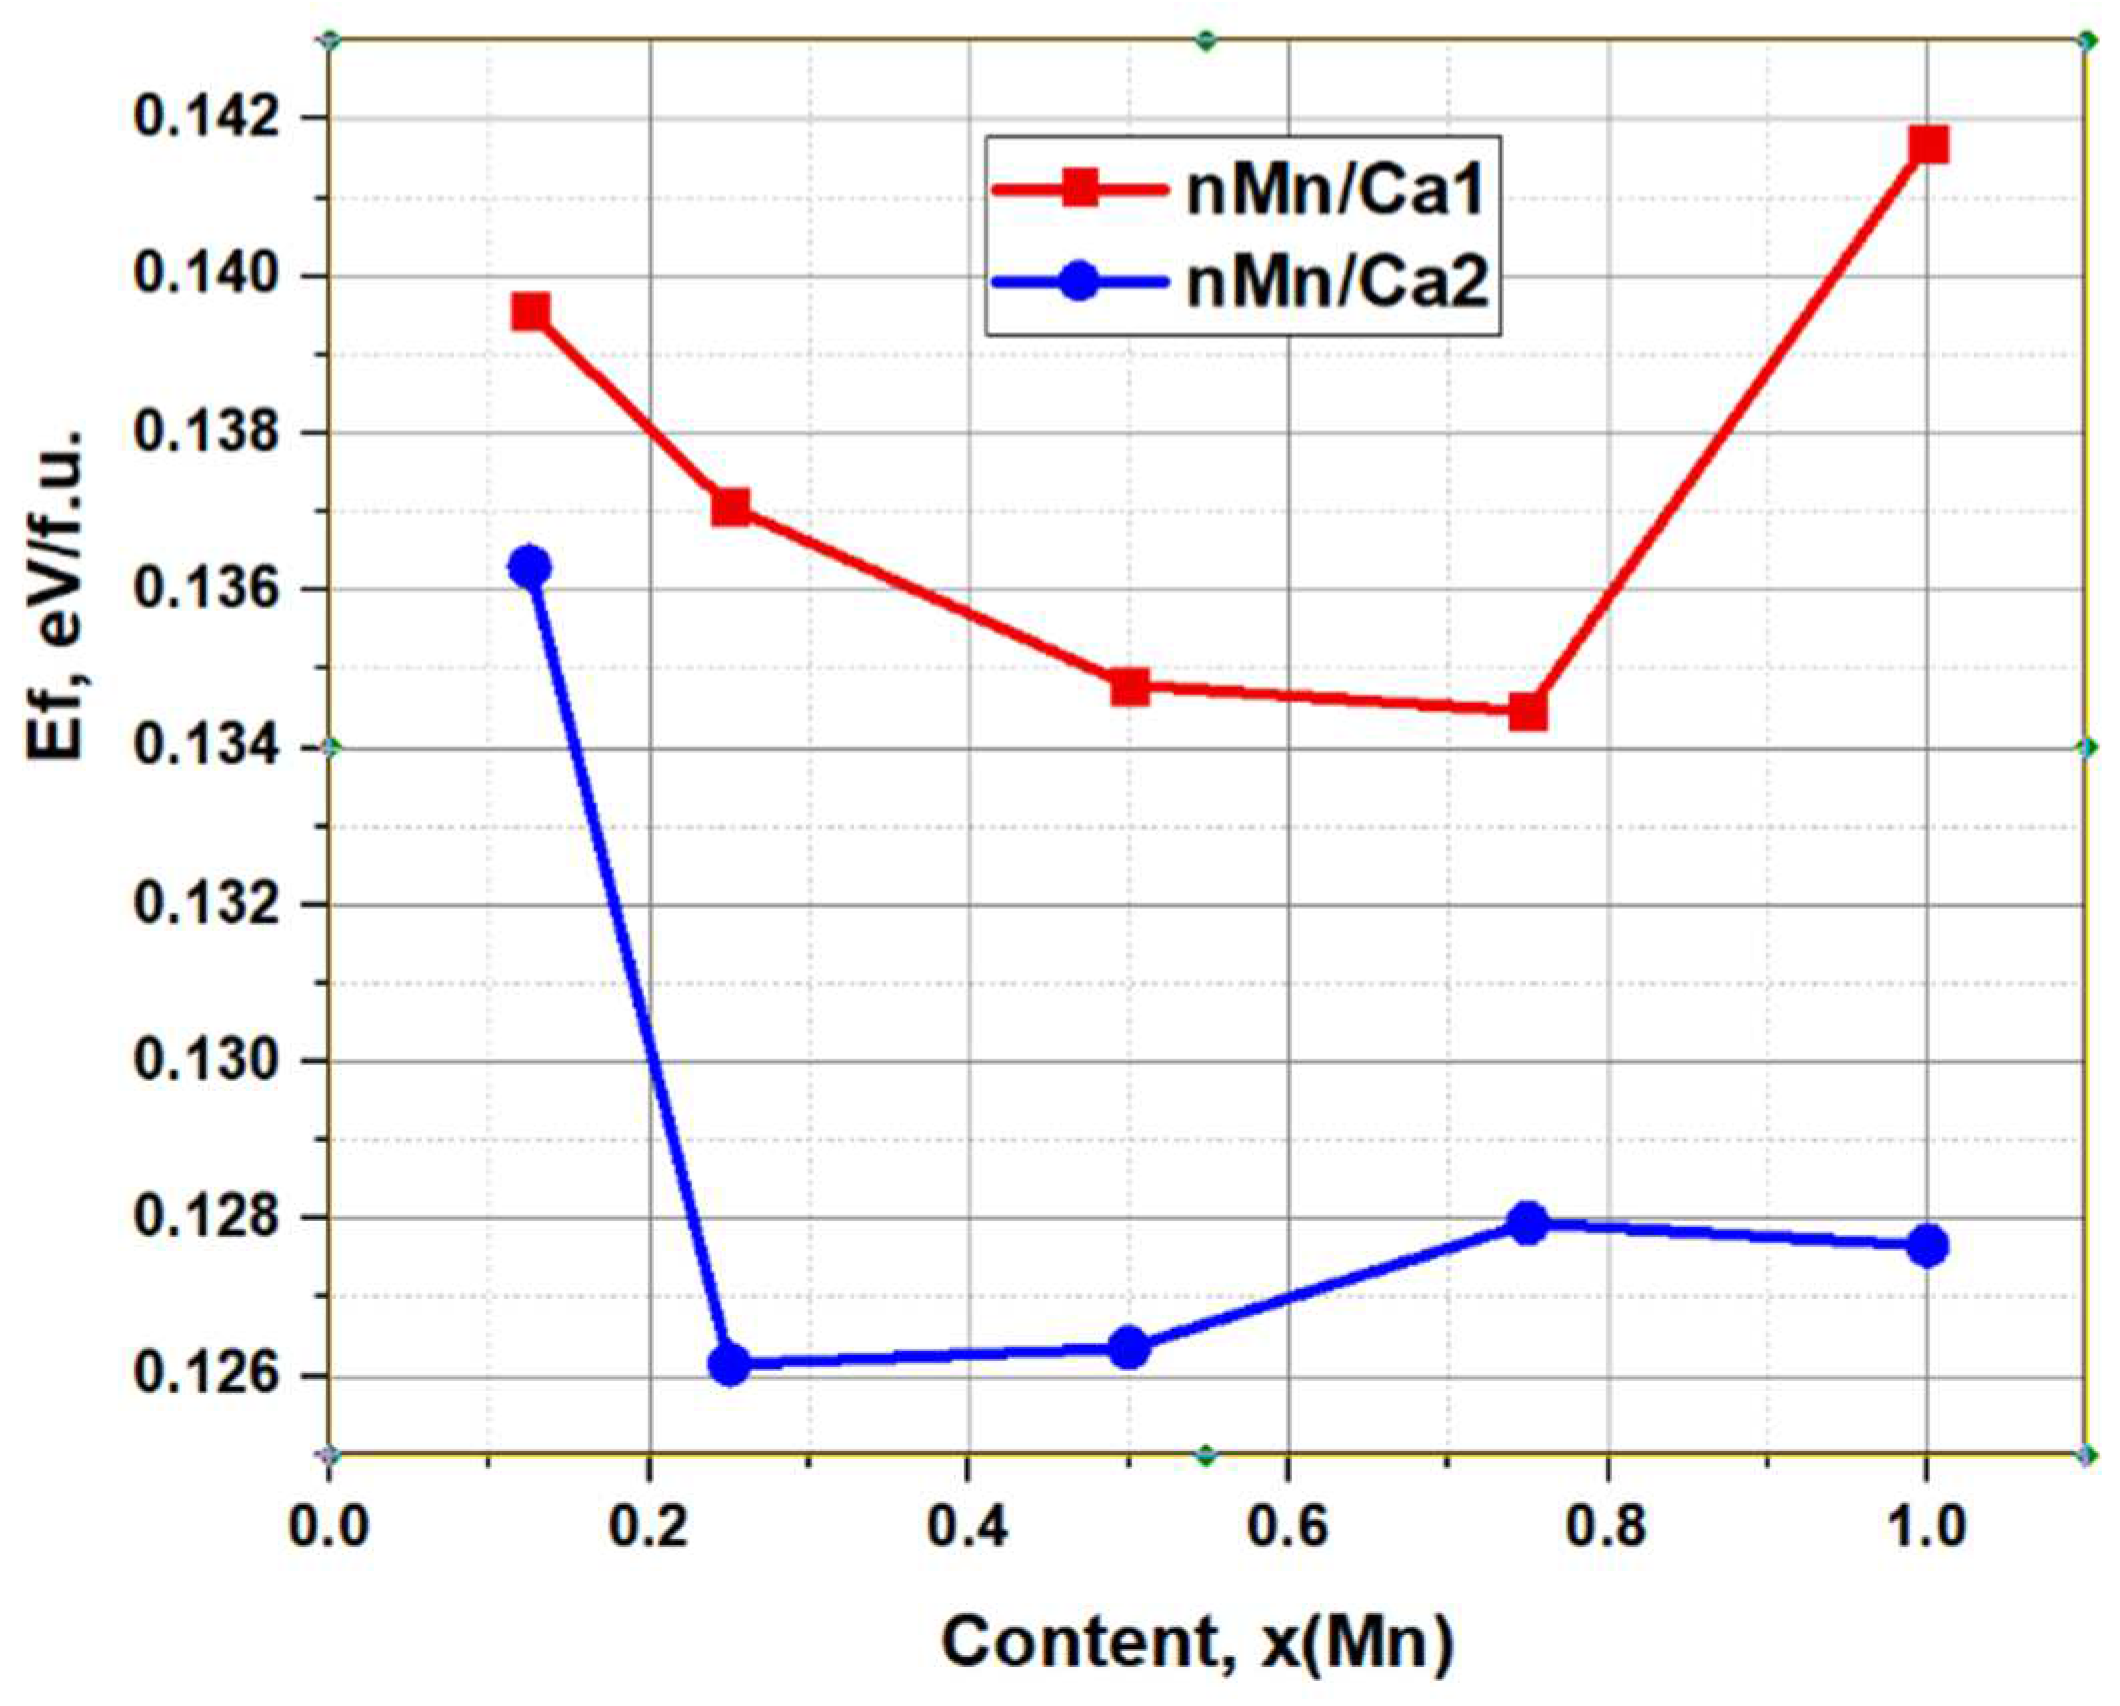
An important result of the high-precision DFT calculations is the determination of the dependence of the formation energy of substitutions in the Ca1 and Ca2 positions on the concentration x(Mn), which is shown below in
Figure 8.
This result is not only of theoretical significance, but also important for practical applications in the synthesis of HAP-Mn with the required and desired concentration of manganese samples for the preparation of coatings for bone implants.
The formation energy Ef of the substitution nMn/Ca at different values n of the amount of the introduced Mn and at the different positions of calcium atoms (Ca1 and Ca2) is determined by the following dependence, similar to work [
25]:
where E
HAP is the total energy of the initial HAP, taken for the super-cell 2x2x2 = 8, which after the HSE calculation has the value E
HAP = -180083.638 eV [
25]; E
tot is the total energy of HAP-Mn, obtained after full DFT relaxation of the optimized super-cell model with a number of replacements
n of Ca atoms with Mn atoms (for different selected positions of Ca atoms, nMn/Ca1 and nMn/Ca2); μ(Mn) and μ(Ca) are the chemical potentials of Mn and Ca ions calculated, similarly as in [
25]. Their values are follows: μ(Mn) = -2706.004 eV and μ(Ca) = -1003.756 eV; and their final difference: [μ(Mn) - μ(Ca)] = -1702.247 eV.
Values of the formation energy Ef is reduced to one formula unit (f.u.) of HAP-Mn, to compare with related known data. The 2x2x2 super-cell model used contains 8 HAP unit cells, each of which includes2 f.u. Therefore, the final energy values presented must be divided by the number of all f.u., which is 16.
Figure 8 and in
Table 3 shows the calculated behavior of E
f depending on the Mn concentration at different substitution positions of Ca1 and Ca2. This dependence demonstrates an ambiguous change in E
f at different positions of substitutions. However, almost everywhere and especially in the region of low concentrations x(Mn) = 0.1 – 0.5 the values are E
f(Ca1) > E
f(Ca2). That is, replacing Mn in the Ca1 position requires more energy than replacing Mn in the Ca2 position. Thus, substitution with Mn should occur predominantly at the Ca2 position. Note that this result also corresponds to the experimental results obtained from recent EPR data [
20,
21].
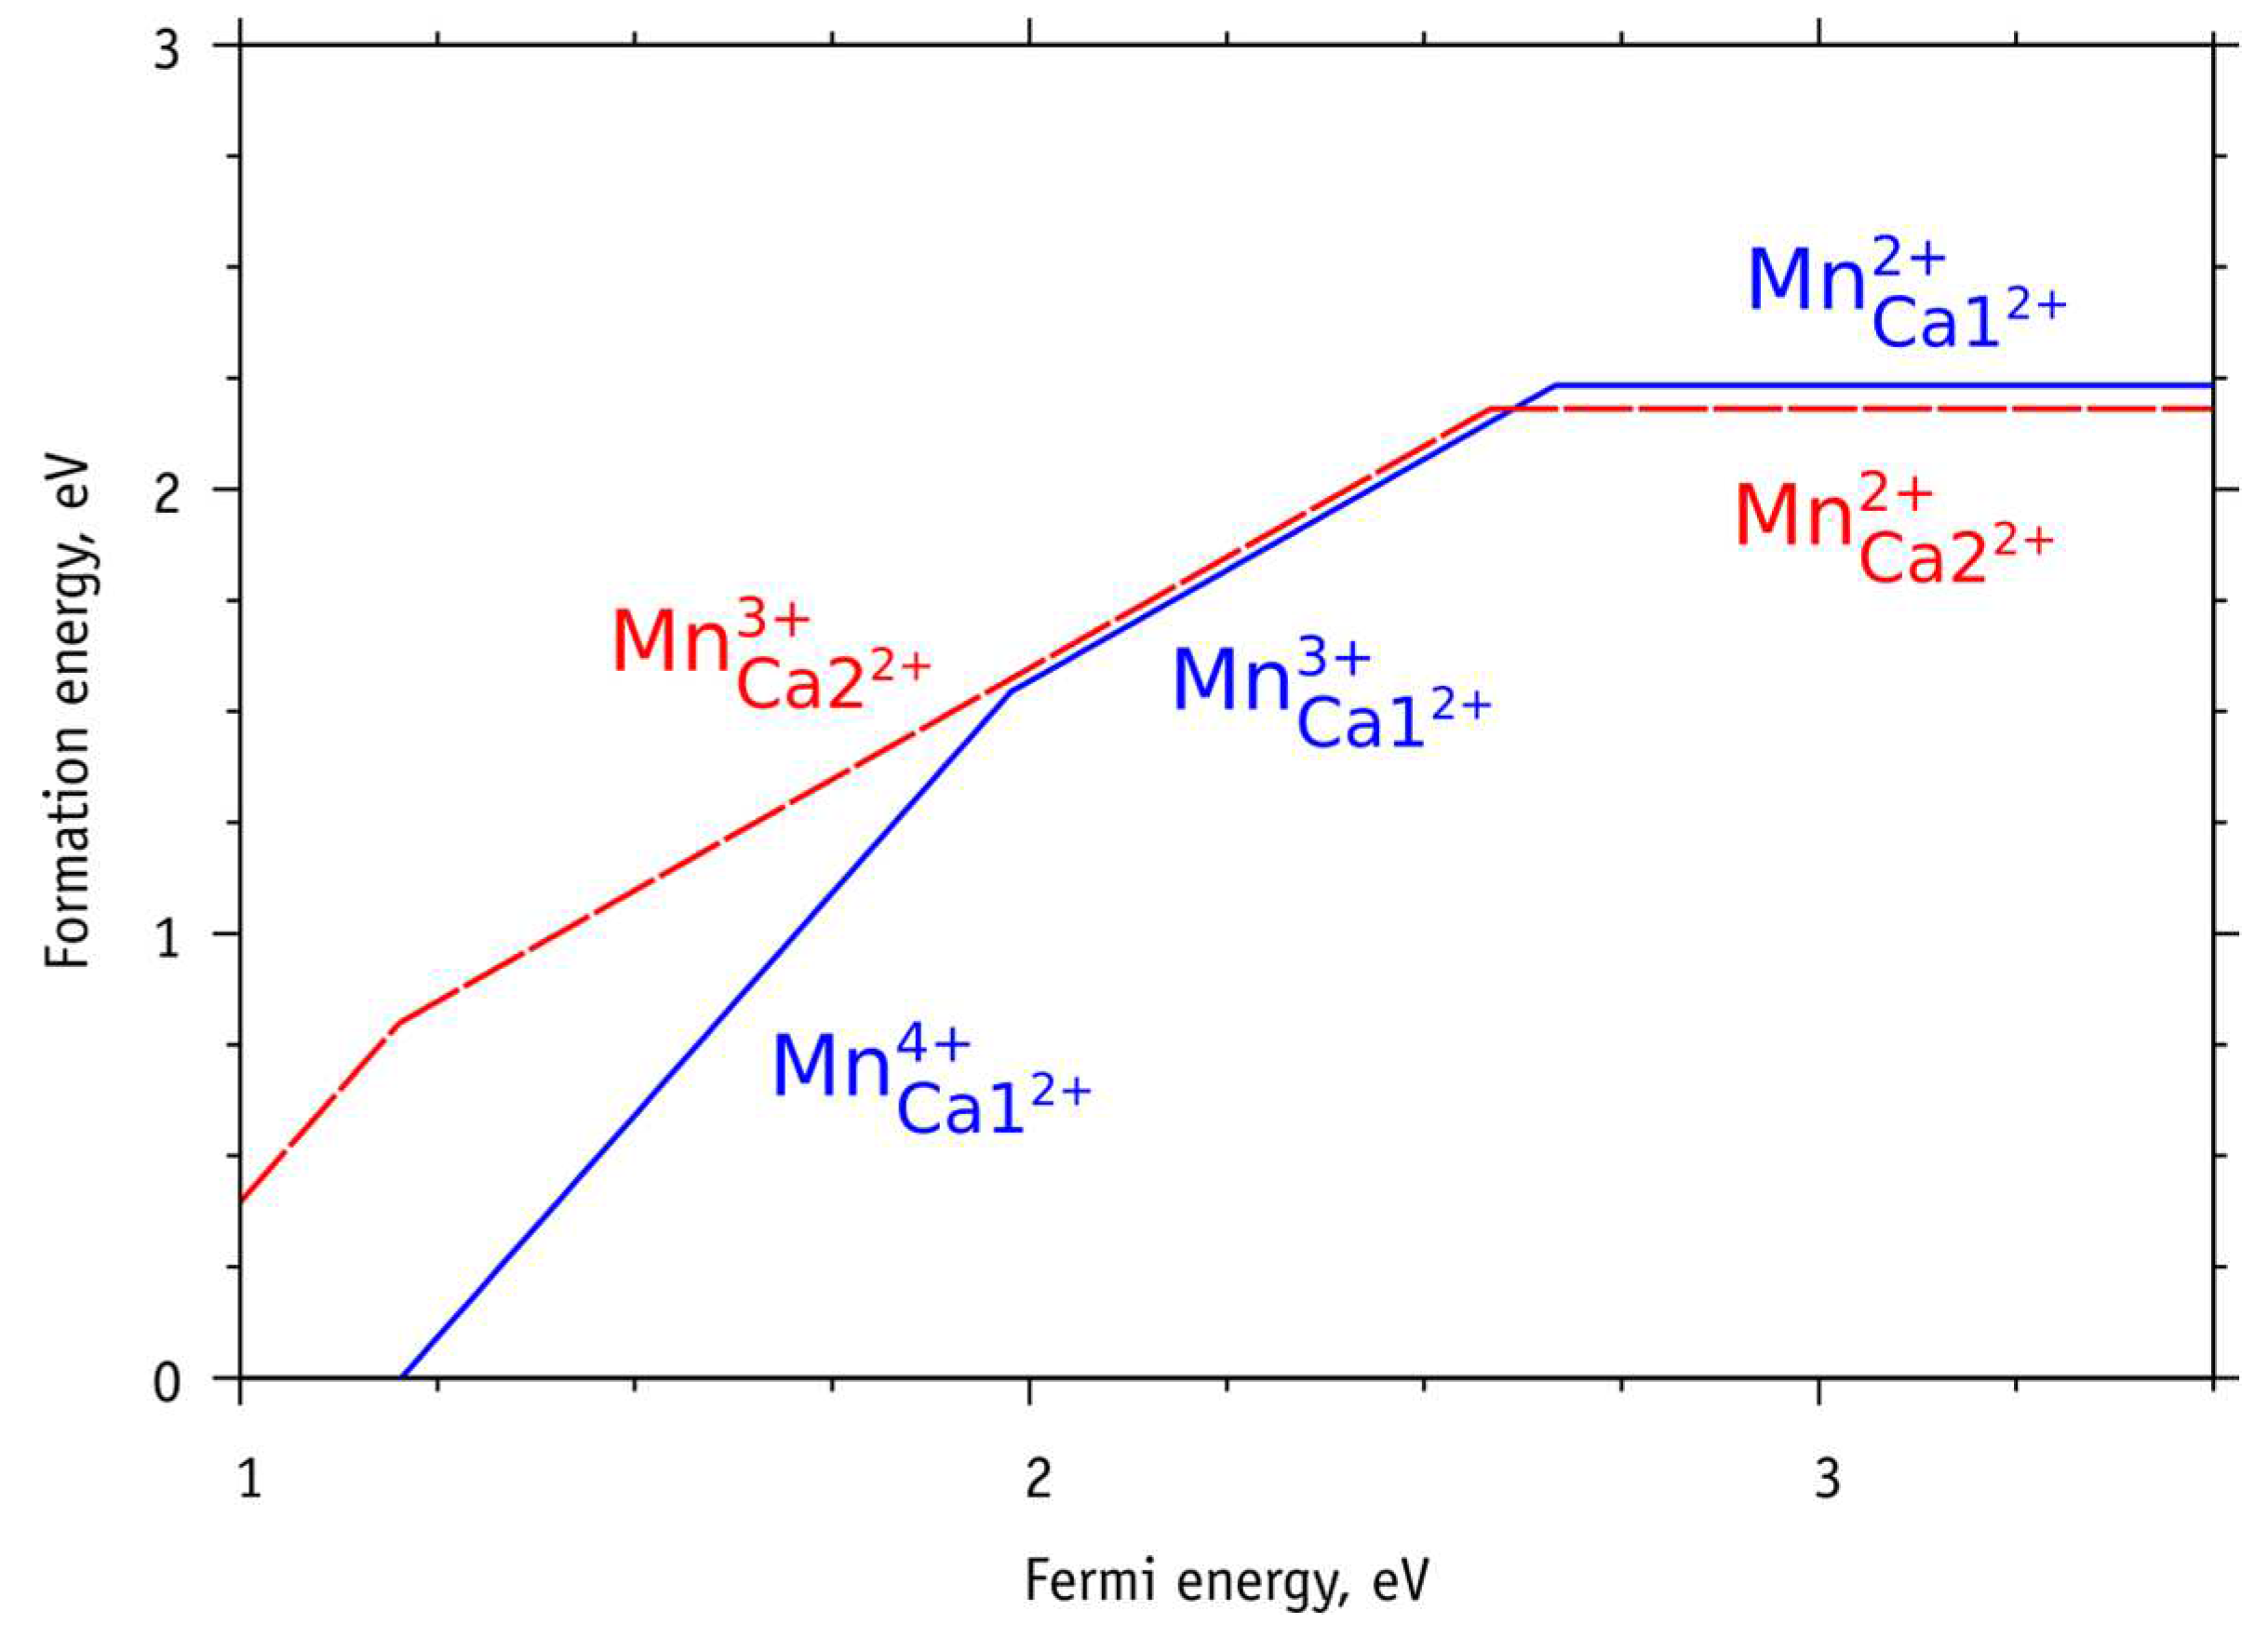
In the case of charged ions Mn
2+, Mn
3+ and Mn
4+, which also replace charged ions Ca
2+ - but located in different positions Ca1
2+ and Ca2
2+, the energy of formation of such substitutions can be calculated using formula (11) from [
30] or a similar formula (1) from work [
31].
The results of these calculations, taking into account the chemical potentials of charged ions, are presented in
Figure 9.
From the results of these calculations, shown in
Figure 9, it is clear that the replacement of the charged Mn
2+ ion in the calcium position Ca2 (or Ca2
2+) has a formation energy that is ~ 0.05 eV less than in the Ca1 (Ca1
2+) position. Whereas substitutions of Mn
3+ and, especially, Mn
4+ ions in the Ca2 (Ca2
2+) position lead here formation energies greater than in the Ca1 (Ca1
2+) position.
Thus, calcium substitutions with Mn3+ and Mn4+ ions are more likely in the Ca1 position, and substitutions with Mn2+ ions are more preferable at the Ca2 position.
4. Conclusions
High-precision hybrid DFT calculations using the super-cell model, performed in combination with experimental studies of Mn/Ca substitutions in the HAP lattice, showed that the HAP-Mn unit cell parameters and volume gradually decrease with an increase in the amount of the introduced substitutions, that is in line with literature data [
45] and similarly to Mg/Ca substitutions in HAP [
25]. It has been established that the behaviour of the formation energies of substitutions have an ambiguous character , which depends on the position of the replaced Ca atom: Ca1 or Ca2. The benefits of Mn/Ca substitution at different positions of Ca1 and Ca2 are different and depend on the manganese concentration. In general, this work shows that the replacement of calcium cations with manganese in HAP should occur predominantly in the Ca2 position, and here there is a minimum energy E
f/(nMn/Ca2) for the formation of substitutions at the concentration x(Mn) ~ 0.25. When the manganese concentration increases to x(Mn) ~ 0.75, a minimum formation energy E
f/(nMn/Ca1) is observed for Mn substitution at the Ca1 position. But, this minimum is still higher than E
f/(nMn/Ca2), that is, the advantage of substitution in the Ca2 position remains. These data were also confirmed by recent studies using EPR methods [
20,
21]. These results should be taken into account when synthesizing HAP-Mn samples, since it affects the properties of the HAP-Mn material used in the manufacture of bone implants.
Another important result is also the presence of a dependence of additional electronic energy levels that appear in the band gap of HAP upon the introduction of Mn ions on its substituent concentration. This gradually changes all the optical and photoelectronic properties of HAP. It is shown that new electronic energy levels appear inside the band gap Eg of HAP-Mn, immediately upon introduction of just one Mn atom, while in HAP-Mg not any energy levels inside band gap, only Eg change width was observed [
25]. Moreover, depending on the Mn concentration and change the photo-excitation energy of HAP, making its effective value Eg* less than the band gap Eg in the initial pure HAP, and generally changing the photo-electronic properties of HAP.
This also changes the work function of the electron ϕ (since in HAP ϕ ~ Eg* in this case [
23,
24]), which in turn changes the surface electrical potential of the HAP material [
29]. And this is important for the biocompatibility of an implant made of such a HAP-Mn material with bone tissue, which here depends on the concentration of the introduced substituent. All this is also important and promising for the development of further applications of HAP-Mn in other areas, such as photocatalysis [
31,
32] and photoluminescence [
5].
Also important is the new information obtained in this work regarding the magnetic properties introduced by manganese into HAP when it is introduced into HAP-Mn, that also differs sharply in physical properties from the introduced Mg [
25], which itself does not have and does not create such magnetic properties in HAP. Each substituted Mn atom gives 5 (Bohr mag)/cell magnetization. At the considered values of substitution concentrations up to x(Mn) = 1.0, that correspond to amount n = 8 of Mn atoms, magnetization does not saturate and its value reaches 40 (Bohr mag)/cell for both types of substitutions. These questions still require further study. But it is possible that HAP-Mn may be a promising material for potential applications as agents in magnetic resonance imaging [
46], thermal centers for magnetic hyperthermia [
47] and in targeted drug delivery systems [
48], similar to iron-doped HAP materials (Fe-HAp), which also has magnetic properties [
33,
49].
The information obtained on the structural and energetic properties is important for understanding the mechanisms of interaction of the HAP-Mn material with living bone tissue when used as a coating for a bone implant and in other bone engineering methods in surgery and dentistry.
Author Contributions
Conceptualization, V.S.B.; methodology, V.S.B.; software, V.S.B. and L.A.A.; validation, V.S.B., L.A.A. and N.V.B.; investigation, E.V.P. and S.V.M.; resources, V.S.B. and N.V.B.; data duration, V.S.B.; writing—original draft preparation, V.S.B., E.V.P. and N.V.B.; writing—review and editing, V.S.B., L.A.A. and N.V.B.; project administration, V.S.B.; funding acquisition, V.S.B. All authors have read and agreed to the published version of the manuscript.
Funding
This research was funded by the Russian Science Foundation (RSF), grant No. 21-12-00251.
Institutional Review Board Statement
Not applicable.
Informed Consent Statement
Not applicable.
Data Availability Statement
The data presented in this study are available on request from the corresponding author.
Acknowledgments
The authors are grateful for the opportunity to perform calculations using the computing and information resources of the IMPB RAS. The authors are greatly thankful for the support to the Russian Science Foundation (RSF), grant No. 21-12-00251.
Conflicts of Interest
We declare no potential conflict of interest in this article.
References
- Epple, M.; Ganesan, K.; Heumann, R.; Klesing, J.; Kovtun, A.; Neumann, S.; Sokolova, V. Application of calcium phosphate nanoparticles in biomedicine. J. Mater. Chem. 2010, 20, 18–23. [Google Scholar] [CrossRef]
- Ducheyne, P.; Healy, K.; Hutmacher, D.E.; et al. (Eds.); Comprehensive Biomaterials II, 2nd ed.; Seven-Volume Set; Elsevier: Amsterdam, 2017. [Google Scholar]
- Ratner, B.D.; Hoffman, A.S.; Schoen, F.J.; Lemons, J.E. Biomaterials Science, 3rd ed.; Academic Press: Oxford, UK, 2013. [Google Scholar]
- Barinov, S.M.; Komlev, V.S. Approaches to the Fabrication of Calcium Phosphate-Based Porous Materials for Bone Tissue Regeneration. Inorg. Mater. 2016, 52, 339–346. [Google Scholar] [CrossRef]
- Figueroa-Rosales, E.X.; Martínez-Juárez, J.; García-Díaz, E.; Hernández-Cruz, D.; Sabinas-Hernández, S.A.; Robles-Águila, M.J. Photoluminescent Properties of Hydroxyapatite and Hydroxyapatite/Multi-Walled Carbon Nanotube Composites. Crystals 2021, 11, 832. [Google Scholar] [CrossRef]
- Dorozhkin, S.V. Calcium orthophosphate deposits: Preparation, properties and biomedical applications. Mater. Sci. Eng. C Mater. Biol. Appl. 2015, 55, 272–326. [Google Scholar] [CrossRef]
- Baltacis, K.; Bystrov, V.; Bystrova, A.; Dekhtyar, Y.; Freivalds, T.; Raines, J.; Rozenberga, K.; Sorokins, H.; Zeidaks, M. Physical fundamentals of biomaterials surface electrical functionalization. Materials 2020, 13, 4575. [Google Scholar] [CrossRef] [PubMed]
- Leon, B.; Janson, J.A. Thin Calcium Phosphate Coatings for Medical Implants; Springer: Berlin, Germany, 2009. [Google Scholar]
- Elliott, J.C. Structure and Chemistry of the Apatites and Other Calcium Orthophosphates. In Studies in Inorganic Chemistry; Elsevier: Amsterdam, The Netherlands, 1994; pp. 1–404. [Google Scholar]
- Kay, M.I.; Young, R.A.; Posner, A.S. Crystal structure of hydroxyapatite. Nature 1964, 204, 1050. [Google Scholar] [CrossRef] [PubMed]
- Hughes, J.M.; Cameron, M.; Crowley, K.D. Structural variations in natural F, OH, and Cl apatites. Am. Mineral. 1989, 74, 870–876. Available online: http://rruff.geo.arizona.edu/AMS/result.php (accessed on 1 June 2022).
- Šupova, M. Substituted hydroxyapatites for biomedical applications: A review. Ceram. Int. 2015, 41, 9203–9231. [Google Scholar] [CrossRef]
- Tite, T.; Popa, A.-C.; Balescu, L.M.; Bogdan, I.M.; Pasuk, I.; Ferreira, J.M.F.; Stan, G.E. Cationic Substitutions in Hydroxyapatite: Current Status of the Derived Biofunctional Effects and Their In Vitro Interrogation Methods. Materials 2018, 11, 2081. [Google Scholar] [CrossRef]
- Silva, L.M.D.; Tavares, D.D.S.; Santos, E.A.D. Isolating the Effects of Mg2+, Mn2+ and Sr2+ Ions on Osteoblast Behavior from those Caused by Hydroxyapatite Transformation. Mater. Res. 2020, 23, e20200083. [Google Scholar] [CrossRef]
- Li, Y.; Widodo, J.; Lim, S.; Ooi, C.P. Synthesis and cytocompatibility of manganese (II) and iron (III) substituted hydroxyapatite nanoparticles. J. Mater. Sci. 2012, 47, 754–763. [Google Scholar] [CrossRef]
- Rau, J.V.; Fadeeva, I.V.; Fomin, A.S.; Barbaro, K.; Galvano, E.; Ryzhov, A.P.; Murzakhanov, F.; Gafurov, M.; Orlinskii, S.; Antoniac, I.V.; et al. Sic Parvis Magna: Manganese-Substituted Tricalcium Phosphate and Its Biophysical Properties. ACS Biomater. Sci. Eng. 2019, 5, 6632–6644. [Google Scholar] [CrossRef]
- Fadeeva, I.; Kalita, V.; Komlev, D.; Radiuk, A.; Fomin, A.; Davidova, G.; Fursova, N.; Murzakhanov, F.; Gafurov, M.; Fosca, M.; et al. In Vitro Properties of Manganese-Substituted Tricalcium Phosphate Coatings for Titanium Biomedical Implants Deposited by Arc Plasma. Materials 2020, 13, 4411. [Google Scholar] [CrossRef] [PubMed]
- Fadeeva, I. V.; Fomin, A. S.; Barinov, S. M.; Davydova, G. A.; Selezneva, I. I.; Preobrazhenskii, I. I.; Rusakov, M.K.; Fomina, A.A.; Volchenkova, V. A. Synthesis and Properties of Manganese-Containing Calcium Phosphate Materials. Inorganic Materials 2020, 56, 700–706. [Google Scholar] [CrossRef]
- Liu, H.; Cui, X.; Lu, X.; Liu, X.; Zhang, L.; Chan, T.-S. Mechanism of Mn incorporation into hydroxyapatite: Insights from SR-XRD, Raman, XAS, and DFT calculation. Chem. Geol. 2021, 579, 120354. [Google Scholar] [CrossRef]
- Shurtakova, D.V.; Grishin, P.O.; Gafurov, M.R.; Mamin, G.V. Using DFT to Calculate the Parameters of the Crystal Field in Mn2+ Doped Hydroxyapatite Crystals. Crystals 2021, 11, 1050. [Google Scholar] [CrossRef]
- Murzakhanov, F.; Gabbasov, B.; Iskhakova, K.; Voloshin, A.; Mamin, G.; Biktagirov, T.; Orlinskii, S.; Gafurov, M.; Putlyaev, V.; Klimashina, E.; Fadeeva, I.; Fomin, A.; and Barinov, S. Conventional electron paramagnetic resonance for studying synthetic calcium phosphates with metal impurities (Mn2+, Cu2+, Fe3+). Magn. Reson. Solids 2017, 19, 17207. [Google Scholar]
- Torres, P. M. C.; Vieira, S. I.; Cerqueira, A. R.; et al. Effects of Mn-doping on the structure and biological properties of β-tricalcium phosphate. J. Inorg. Biochem. 2014, 136, 57–66. [Google Scholar] [CrossRef]
- Bystrov, V.S. Computational Studies of the Hydroxyapatite Nanostructures, Peculiarities and Properties. Math. Biol. Bioinform. 2017, 12, 14–54. [Google Scholar] [CrossRef]
- Bystrov, V.; Paramonova, E.; Avakyan, L.; Coutinho, J.; Bulina, N. Simulation and Computer Study of Structures and Physical Properties of Hydroxyapatite with Various Defects. Nanomaterials 2021, 11, 2752. [Google Scholar] [CrossRef]
- Bystrov, V.S.; Paramonova, E.V.; Avakyan, L.A.; Eremina, N.V.; Makarova, S.V.; Bulina, N.V. Effect of Magnesium Substitution on Structural Features and Properties of Hydroxyapatite. Materials 2023, 16, 5945. [Google Scholar] [CrossRef] [PubMed]
- Matsunaga, K.; Kuwabara, A. First-principles study of vacancy formation in hydroxyapatite. Phys. Rev. B 2007, 75, 014102. [Google Scholar] [CrossRef]
- Slepko, A.; Demkov, A.A. First-principles study of the biomineral hydroxyapatite. Phys. Rev. B Condens. Matter Mater. Phys. 2011, 84, 134108. [Google Scholar] [CrossRef]
- Sadetskaya, A.V.; Bobrysheva, N.P.; Osmolowsky, M.G.; Osmolovskaya, O.M.; Voznesenskiy, M.A. Correlative experimental and theoretical characterization of transition metal doped hydroxyapatite nanoparticles fabricated by hydrothermal method. Mater. Charact. 2021, 173, 110911. [Google Scholar] [CrossRef]
- Bystrov, V.S.; Coutinho, J.; Bystrova, A.V.; Dekhtyar, Y.D.; Pullar, R.C.; Poronin, A.; Palcevskis, E.; Dindune, A.; Alkan, B.; Durucan, C. Computational study of the hydroxyapatite structures, properties and defects. J. Phys. D Appl. Phys. 2015, 48, 195302. Available online: https://iopscience.iop.org/article/10.1088/0022-3727/48/19/195302 (accessed on 27 August 2023). [CrossRef]
- Avakyan, L.A.; Paramonova, E.V.; Coutinho, J.; Öberg, S.; Bystrov, V.S.; Bugaev, L.A. Optoelectronics and defect levels in hydroxyapatite by first-principles. J. Chem. Phys. 2018, 148, 154706. [Google Scholar] [CrossRef] [PubMed]
- Bystrov, V.S.; Avakyan, L.A.; Paramonova, E.V.; Coutinho, J. Sub-Band Gap Absorption Mechanisms Involving Oxygen Vacancies in Hydroxyapatite. J. Chem. Phys. C 2019, 123, 4856–4865. [Google Scholar] [CrossRef]
- Bystrov, V.S.; Piccirillo, C.; Tobaldi, D.M.; Castro, P.M.L.; Coutinho, J.; Kopyl, S.; Pullar, R.C. Oxygen vacancies, the optical band gap (Eg) and photocatalysis of hydroxyapatite: Comparing modelling with measured data. Appl. Catal. B Environ. 2016, 196, 100–107. [Google Scholar] [CrossRef]
- Avakyan, L.; Paramonova, E.; Bystrov, V.; Coutinho, J.; Gomes, S.; Renaudin, G. Iron in Hydroxyapatite: Interstitial or Substitution Sites? Nanomaterials 2021, 11, 2978. [Google Scholar] [CrossRef]
- Bystrov, V.S.; Paramonova, E.V.; Bystrova, A.V.; Avakyan, L.A.; Bulina, N.V. Structural and physical properties of Sr/Ca and Mg/Ca substituted hydroxyapatite: Modeling and experiments. Ferroelectrics 2022, 590, 41–48. [Google Scholar] [CrossRef]
- Bulina, N.V.; Chaikina, M.V.; Andreev, A.S.; Lapina, O.B.; Ishchenko, A.V.; Prosanov, I.Y.; Gerasimov, K.B.; Solovyov, L.A. Mechanochemical Synthesis of SiO44 -—Substituted Hydroxyapatite, Part II—Reaction Mechanism, Structure, and Substitution Limit. Eur. J. Inorg. Chem. 2014, 2014, 4810–4825. [Google Scholar] [CrossRef]
- Bulina, N.V.; Chaikina, M.V.; Prosanov, I.Y. Mechanochemical Synthesis of Sr-Substituted Hydroxyapatite. Inorg. Mater. 2018, 54, 820–825. [Google Scholar] [CrossRef]
- Bulina, N.V.; Makarova, S.V.; Prosanov, I.Y.; Vinokurova, O.B.; Lyakhov, N.Z. Structure and thermal stability of fluorhydroxyapatite and fluorapatite obtained by mechanochemical method. J. Solid State Chem. 2020, 282, 121076. [Google Scholar] [CrossRef]
- Bulina, N.V.; Avakyan, L.A.; Makarova, S.V.; Orehov, I.B.; Bystrov, V.S. Structural Features of Oxyapatite. Minerals 2023, 13, 102. [Google Scholar] [CrossRef]
- Perdew, J.P.; Burke, K.; Ernzerhof, M. Generalized Gradient Approximation Made Simple. Phys. Rev. Lett. 1996, 77, 3865–3868. [Google Scholar] [CrossRef]
- Heyd, J.; Scuseria, G.E.; Ernzerhof, M. Hybrid functionals based on a screened Coulomb potential. J. Chem. Phys. 2003, 118, 8207–8215. [Google Scholar] [CrossRef]
- Krukau, A.V.; Vydrov, O.A.; Izmaylov, A.F.; Scuseria, G.E. Influence of the exchange screening parameter on the performance of screened hybrid functionals. J. Chem. Phys. 2006, 125, 224106. [Google Scholar] [CrossRef] [PubMed]
- Quantum ESPRESSO. Available online: https://www.quantum-espresso.org/ (accessed on 1 July 2023).
- Schlipf, M.; Gygi, F. Optimization algorithm for the generation of ONCV pseudopotentials. Comput. Phys. Commun. 2015, 196, 36–44. [Google Scholar] [CrossRef]
- Hamann, D.R. Optimized norm-conserving Vanderbilt pseudopotentials. Phys. Rev. 2013, B88, 085117. [Google Scholar] [CrossRef]
- Lala, S. , Ghosh M., Das P.K., Kar T., Pradhan. Mechanical preparation of nanocrystalline biocompatible single-phase Mn-doped A-type carbonated hydroxyapatite (A-cHAp): effect of Mn doping on microstructure. Dalton Trans., 2015, 44, 20087. [Google Scholar] [CrossRef]
- Laranjeira, M.S.; Moço, A.; Ferreira, J.; Coimbra, S.; Costa, E.; Santos-Silva, A.; Ferreira, P.J.; Monteiro, F.J. Different hydroxyapatite magnetic nanoparticles for medical imaging: Its effects on hemostatic, hemolytic activity and cellular cytotoxicity. Colloids Surfaces B Biointerfaces 2016, 146, 363–374. [Google Scholar] [CrossRef] [PubMed]
- Tampieri, A.; D’Alessandro, T.; Sandri, M.; Sprio, S.; Landi, E.; Bertinetti, L.; Panseri, S.; Pepponi, G.; Goettlicher, J.; Bañobre- López, M.; et al. Intrinsic magnetism and hyperthermia in bioactive Fe-doped hydroxyapatite. Acta Biomater. 2012, 8, 843–851. [Google Scholar] [CrossRef] [PubMed]
- Gu, L.; He, X.; Wu, Z. Mesoporous Fe3O4 /hydroxyapatite composite for targeted drug delivery. Mater. Res. Bull. 2014, 59, 65–68. [Google Scholar] [CrossRef]
- Mondal, S.; Manivasagan, P.; Bharathiraja, S.; Santha Moorthy, M.; Kim, H.H.; Seo, H.; Lee, K.D.; Oh, J. Magnetic hydroxyapatite: A promising multifunctional platform for nanomedicine application. Int. J. Nanomed. 2017, 12, 8389–8410. [Google Scholar] [CrossRef]
|
Disclaimer/Publisher’s Note: The statements, opinions and data contained in all publications are solely those of the individual author(s) and contributor(s) and not of MDPI and/or the editor(s). MDPI and/or the editor(s) disclaim responsibility for any injury to people or property resulting from any ideas, methods, instructions or products referred to in the content. |
© 2024 by the authors. Licensee MDPI, Basel, Switzerland. This article is an open access article distributed under the terms and conditions of the Creative Commons Attribution (CC BY) license (https://creativecommons.org/licenses/by/4.0/).
