1. Introduction
Information geometry (IG) is a field that applies differential geometry techniques to statistics. It aims to use non-Euclidean geometry methods to analyze probability distributions and stochastic processes. IG is a cutting-edge geometric methodology that analyses models and visualizes geometry from an IG perspective. IG has wide applicability in various domains, including machine learning. This approach offers new insights and tools for understanding complex data and improving modeling techniques[
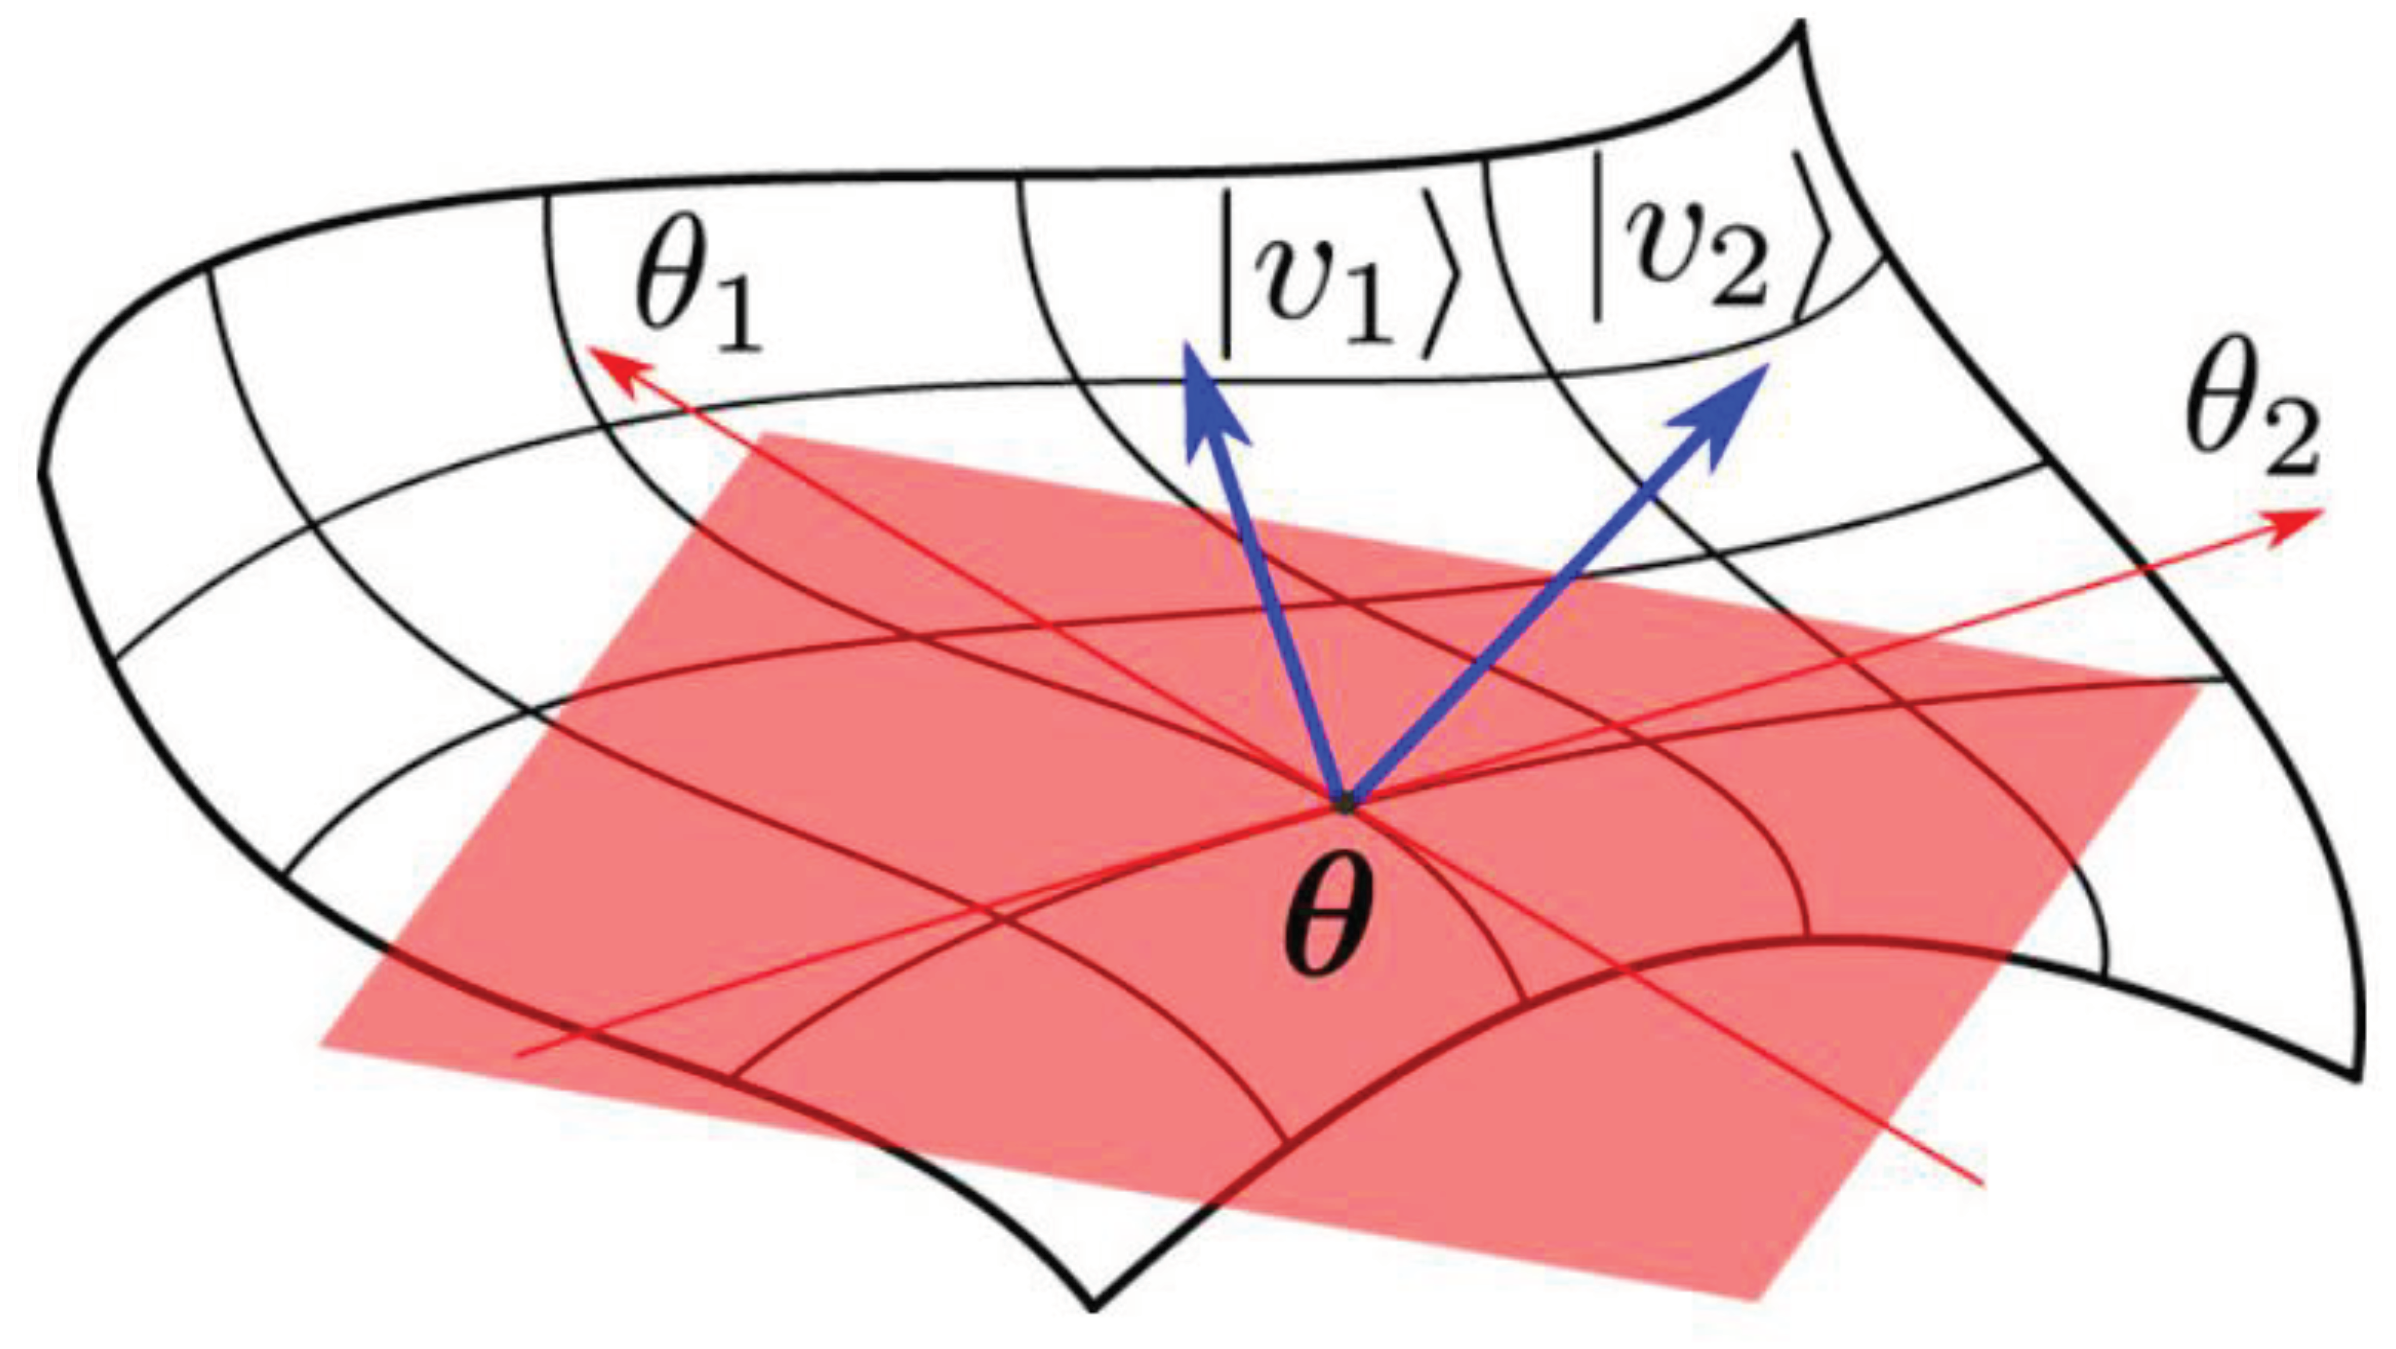
1]. What's more interesting is that statistical manifolds (SMs) were studied with IG. In
Figure 1, the probability
is coined each point in
(
),
A smooth statistical manifold is described mathematically by FIM from an info-geometric perspective. By quantifying the informative gap between measurements, FIM makes statistical data analysis and comparison possible.
Amari and Dodson investigated a few exponential distributions and provided geometric structures [
3]. An analogue of the regular exponential function for square matrices is the matrix exponential. Systems of linear differential equations are solved with it. Furthermore, Lie groups are matrix exponential-based [
4].
The geometry of queues has only been the subject of one research work was a motivation behind starting this new to the knowledge analysis of queues, which connects information and matrix theories with differential geometry.
Following Euclidean space, geodesics are straight lines' analogues and share many of their characteristics, see
Figure 2. Objects move on a geodesic in curved space-time according to General Relativity (GR), extremizing exact timing within locations. Thus, both space-time and curved spaces geometries are described by the same mathematics. Developing GR presented Einstein with its greatest mathematical challenge. In addition, a geodesic is a "straight line on a curved surface" that reduces the separation between two points.
In addition to measuring two distribution functions’ shape similarity, FIM also relates to how much information each distribution function has regarding the parameter of the statistical manifold's probability density function.
This paper contributes to i) Obtaining the stable queue manifold FIM and its inverse. ii) is shown to solve = Ax.
This is how the remainder of the paper is structured: A preliminary set of definitions related to information geometry is presented in
Section 2.
Section 3 introduces FIM, its inverse for a stable
QM. In
Section 4, one can derive
. Some S
applications to E-health are overviewed in section 5. Finally,
Section 6 includes conclusions, some proposed open problems, and recommendations for further study.
2. IG Main Definitions
Definition 2.1
1.We call an SM and is the probability density function.
2. The potential function
is given by
an n-dimensional distribution manifold, with a coordinate system, namely
.
Definition 2.2 [
7,
8]
. of (2.1) is the coordinates only part of (
)
Definition 2.3 [
7,
8]
. FIM, namely for
[
], reads as:
Definition 2.4 [
7,
8]
. For FIM, the inverse matrix of [
] reads as
The FIM’s arc length representation reads as
Assuming that
of (2.17) are referred to eigen values that correspond to
, such that:
Another way to represent
will be:
defines
matrix diagonalization and
T is matrix with only the obtained
as columns.
3.
By [17], the stable
queue’s Shannonian optimization reads
, and
(Mean queue length of
queue,
defines SU and
denotes ST’s squared coefficient of variation
(c.f., (3.1)) will re-write to:
where
The reader should note that the case in (3.2), reduces to the special case of QM [18].
Theorem 3.1.
QM satisfies:
(i)
is
with
where
are as defined above and
(3.10)
Proof
(i) By (3.2), one gets
(I)
. Thus,
Hence,
Therefore, FIM reads:
IFIM is:
Case II: when
, it follows that:
Therefore,
Hence, (i) follows.
As we have
, , .
(ii) The FIM’s determinant reads
det. Hence, IFIM exists.
The corresponding IFIM reads as
where
are given above. This proves (ii).
4.
The solution of the cubic equation
is characterized arbitrarily by
is called the
discriminant of the cubic equation.
Theorem 4.2.
solves =Ax.
Proof
Recall that FIM of the stable
QM
is given by
where
Now, we have
. Hence, it holds that:
(4.15). Thus, it holds that
We have
By the preliminary theorem (4.1), it is implied that
,
,
,
We have
implies that we can obtain the required values eigen values
for (4.16). Therefore, the diagonal matrix
is given by
The eigen vector
=
corresponding to
satisfies
This implies
By (4.24),
(4.26). Consequently, by (4.25) and (4.23), it is implied that:
= 0 (4.27). Therefore,
(4.28). Similarly, we have
Hence, it is implied that
Also,
corresponding to
reads
Hence, the matrix
T is determined by
After some manipulation, it is implied that:
As a necessity that should exist.
After some mathematical manipulation:
Therefore,
reads
The achieved result in (4.37) presents a novel contribution , that is
is a solution to
= A
x.
5. How can queue advance E-health.
The advancementsin e-health applications bring about new challenges for designers and maintainers. These challenges include ensuring timely transmission of health information, addressing limitations in model building and training, navigating regulatory issues related to data sharing, and safeguarding the privacy and security of medical data. Additionally, the current COVID pandemic emphasizes the need for safety in both virtual and physical environments. In [
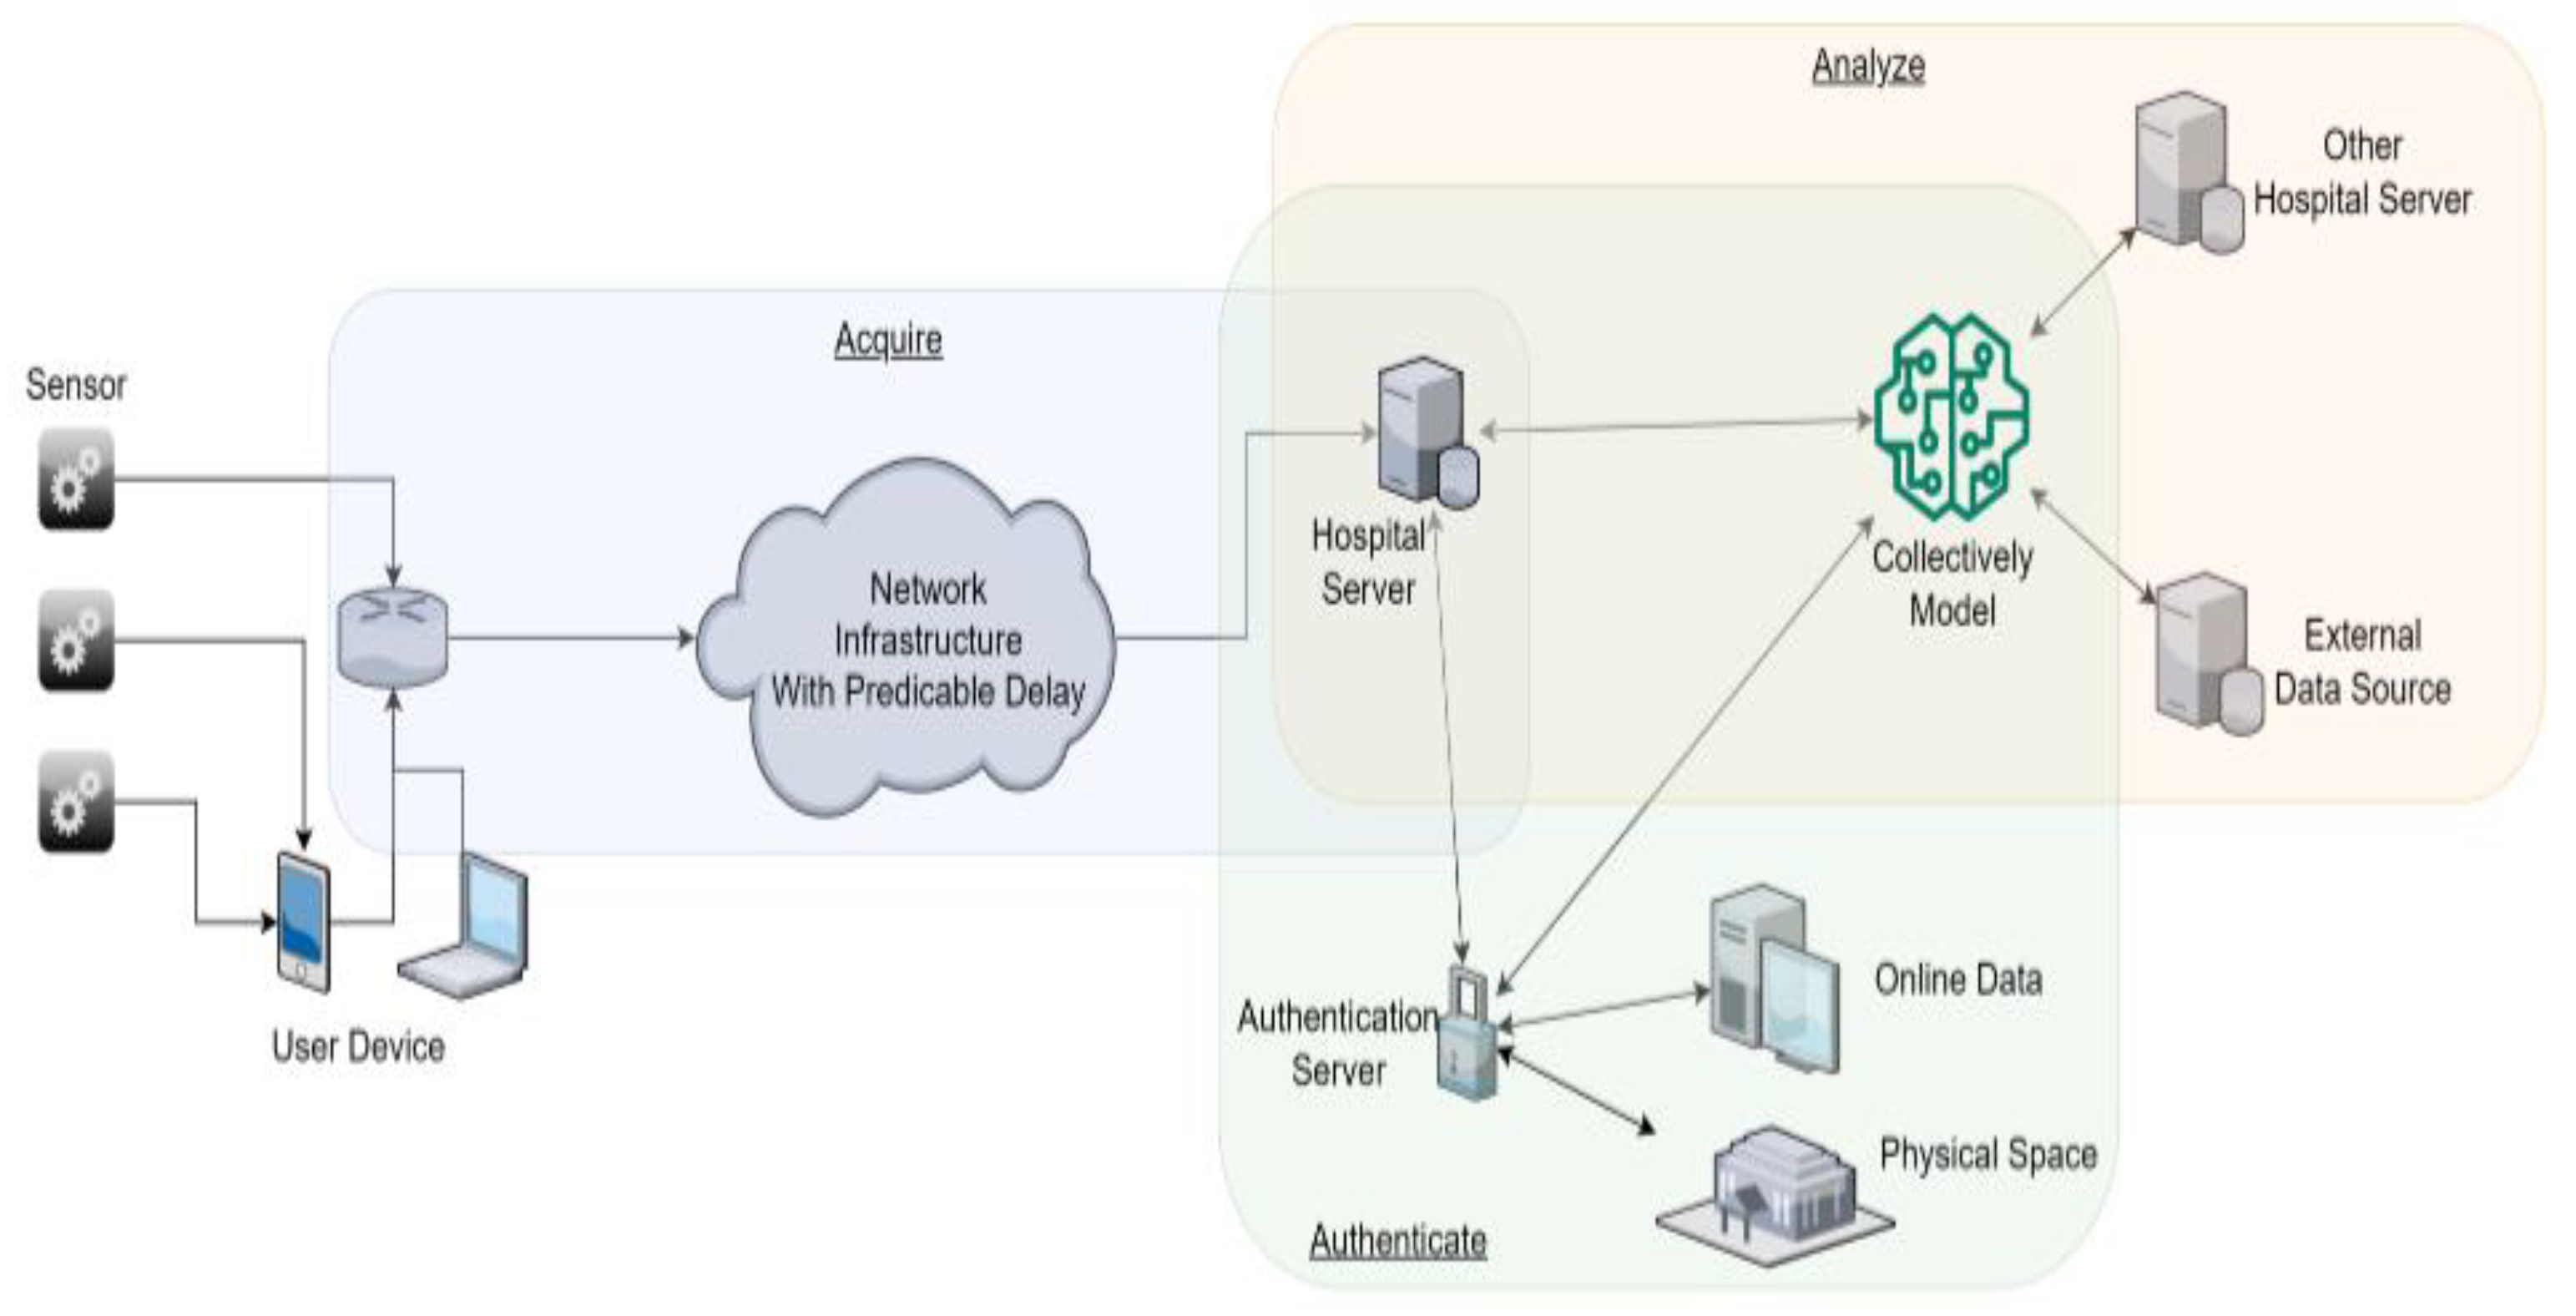
11], the authors have developed a framework for creating secure, responsive, and intelligent e-health applications. The framework focuses on three main components: Analyze, Acquire, and Authenticate, which cover the entire data lifecycle in e-health applications. The goal is to address the challenges related to data security, privacy, and the need for reliable medical decision support in the context of e-health. This can be visualized by
Figure 4 (c.f., [
11]).
Regarding unrelated topics, discussed the traffic patterns of an IP network with multiple services, each of which has its distribution law. Specifically, it mentions the analysis system, which is a mathematical model used to analyze single-server systems with arbitrary inter-arrival times and unspecified service time distributions. The analysis of such systems is considered complex due to the incomplete understanding of the process dispersion. However, the standard model does not provide such solutions, except for certain distributions like the exponential distribution. The authors have also noted the necessity for additional study to look into effective systems that may be utilized to take this research a step ahead.
Systems service’s arrival process descriptions are usually constrained to a small number of significant moments that define their distributions. Statistical metrics such as the coefficient of random variation or the root-mean-square deviation are used to express these moments, which are often the first two. Nonetheless, the irregular flow of incoming requests alters the working characteristics and makes it difficult to determine the precise result of the system's performance. Although the influence of higher-order moments decreases with increasing order number, the average delay is still dependent on the first two moments.The variabilityof the request service duration and the variability of the intervals between requests are represented by the squared coefficient of variation (CV). In these computations, the average values of the service rate, service time distribution mean, and request flow intensity (arrival rate) are used.
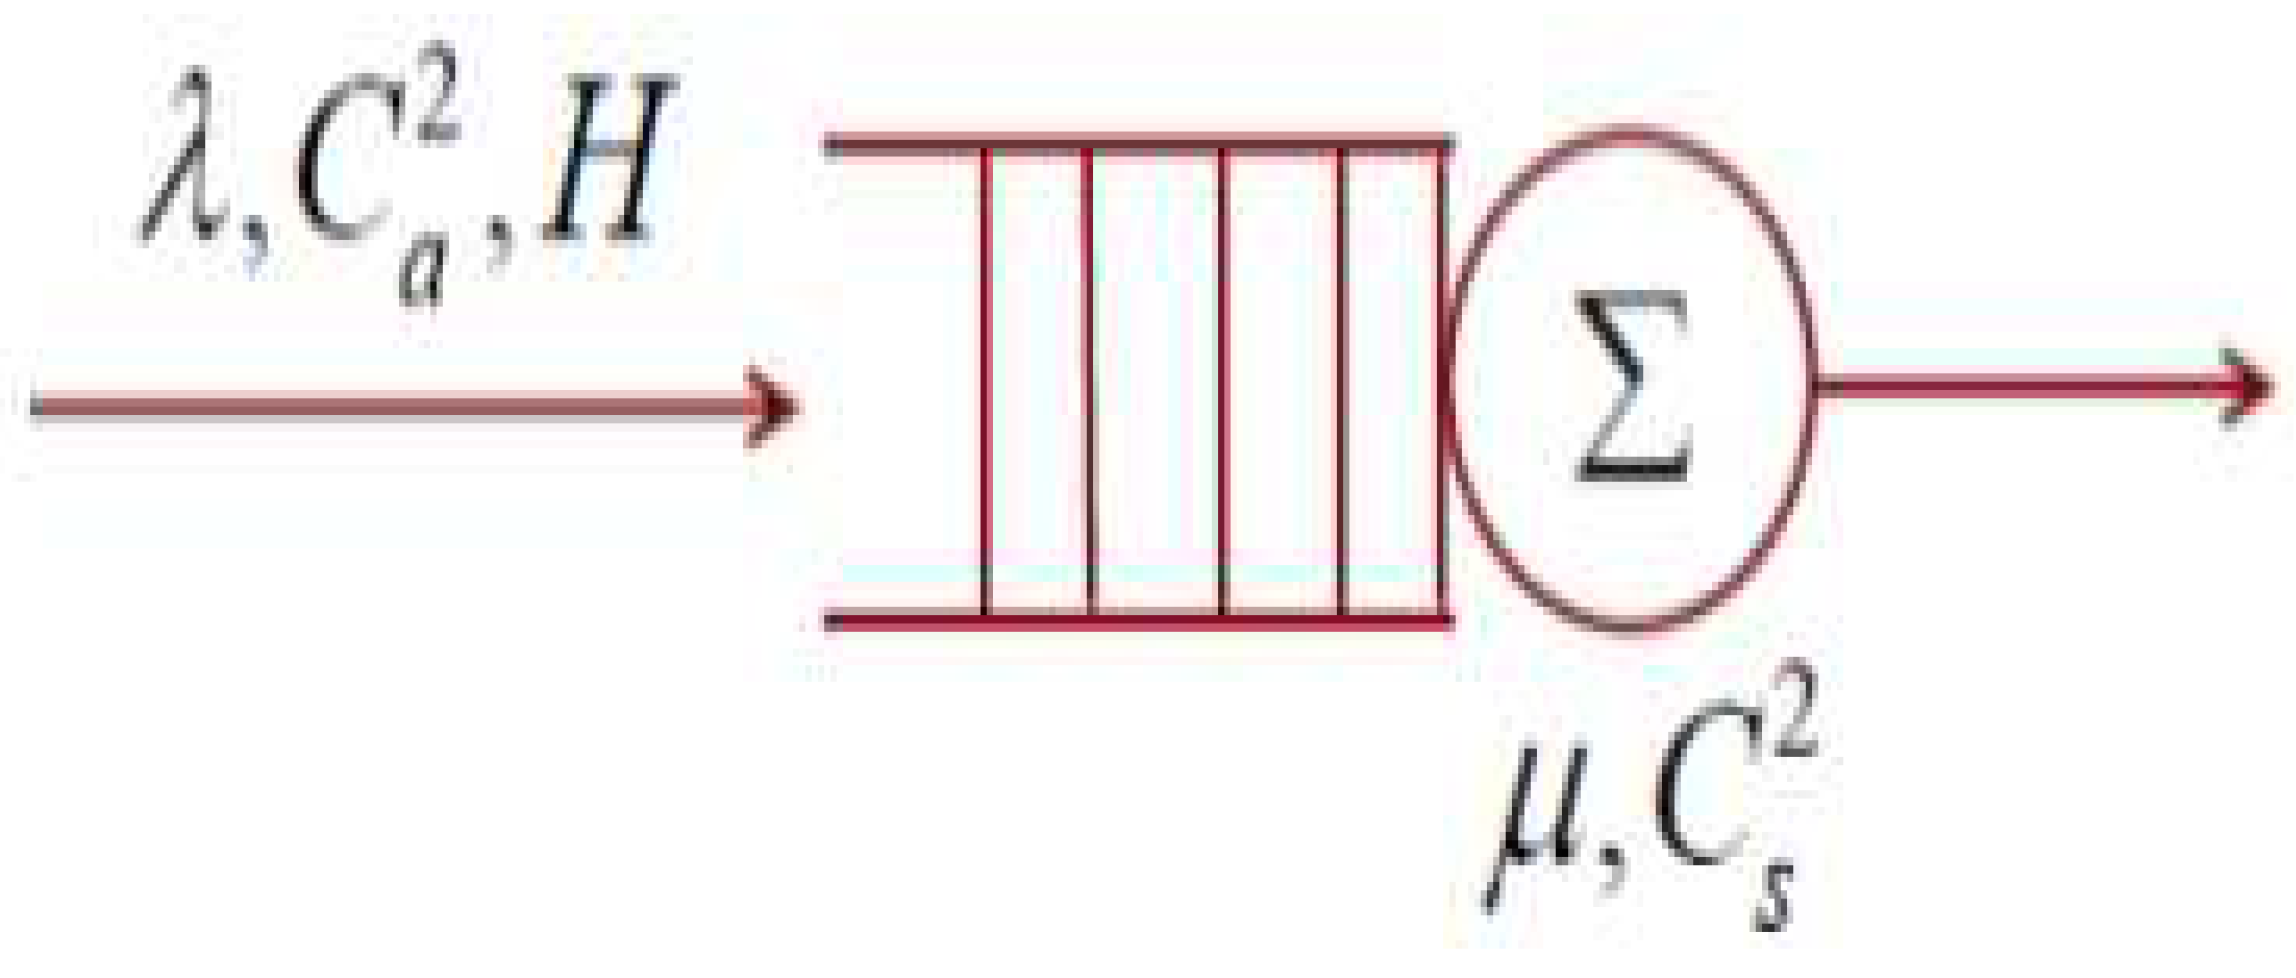
Figure 3 provides a visual representation of the relationships involved in estimating the quality and time parameters of network traffic service units. As demonstrated in [
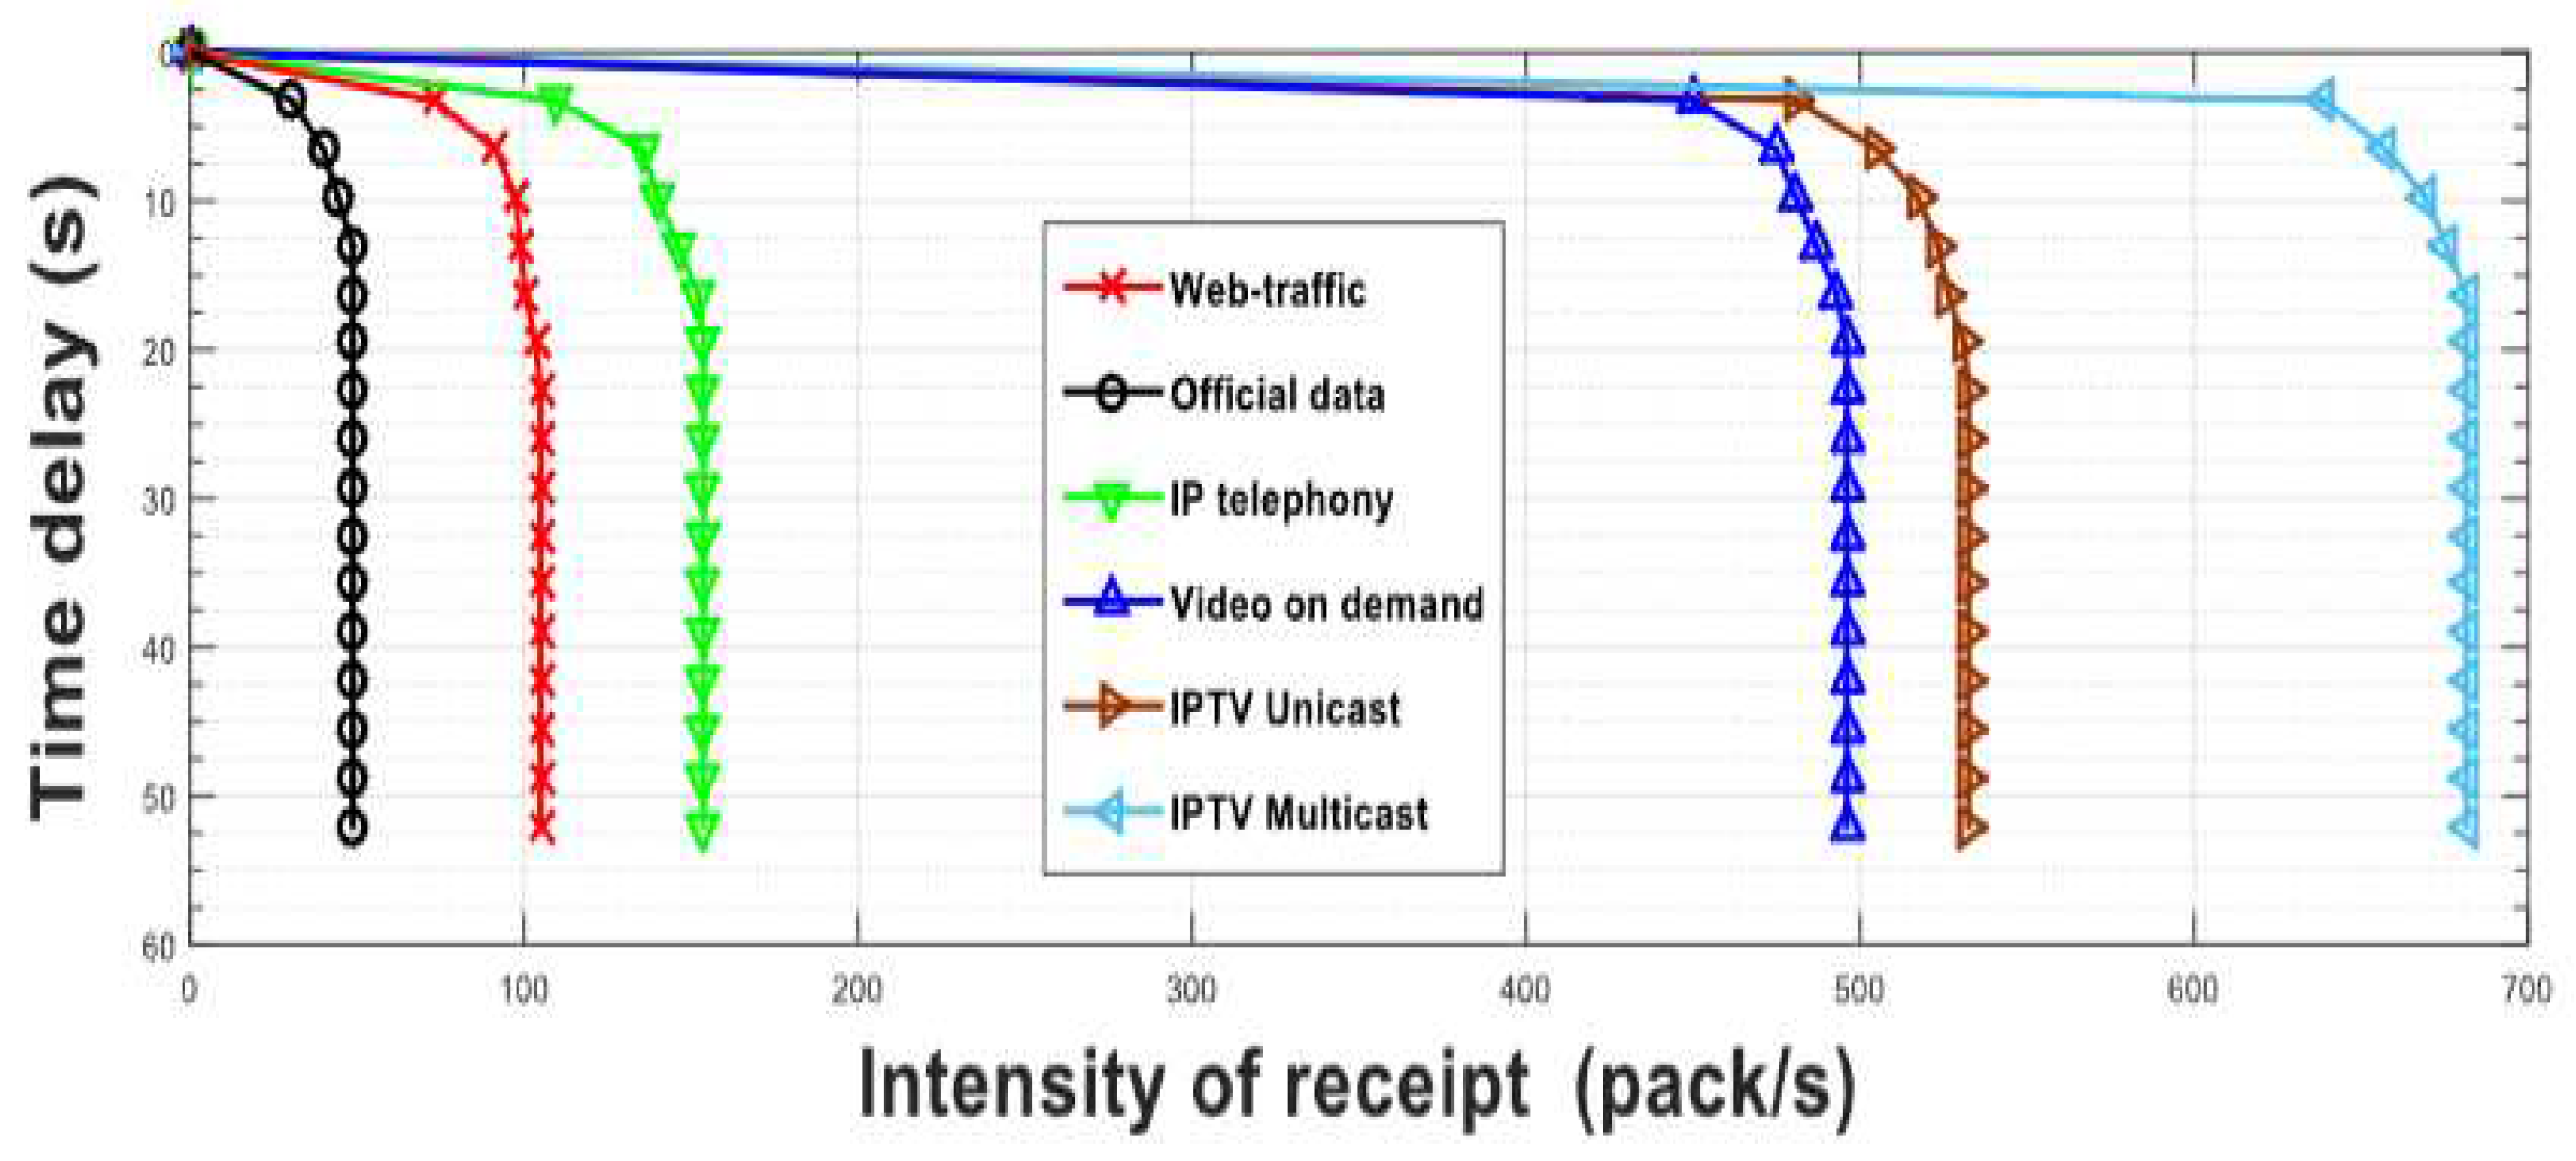
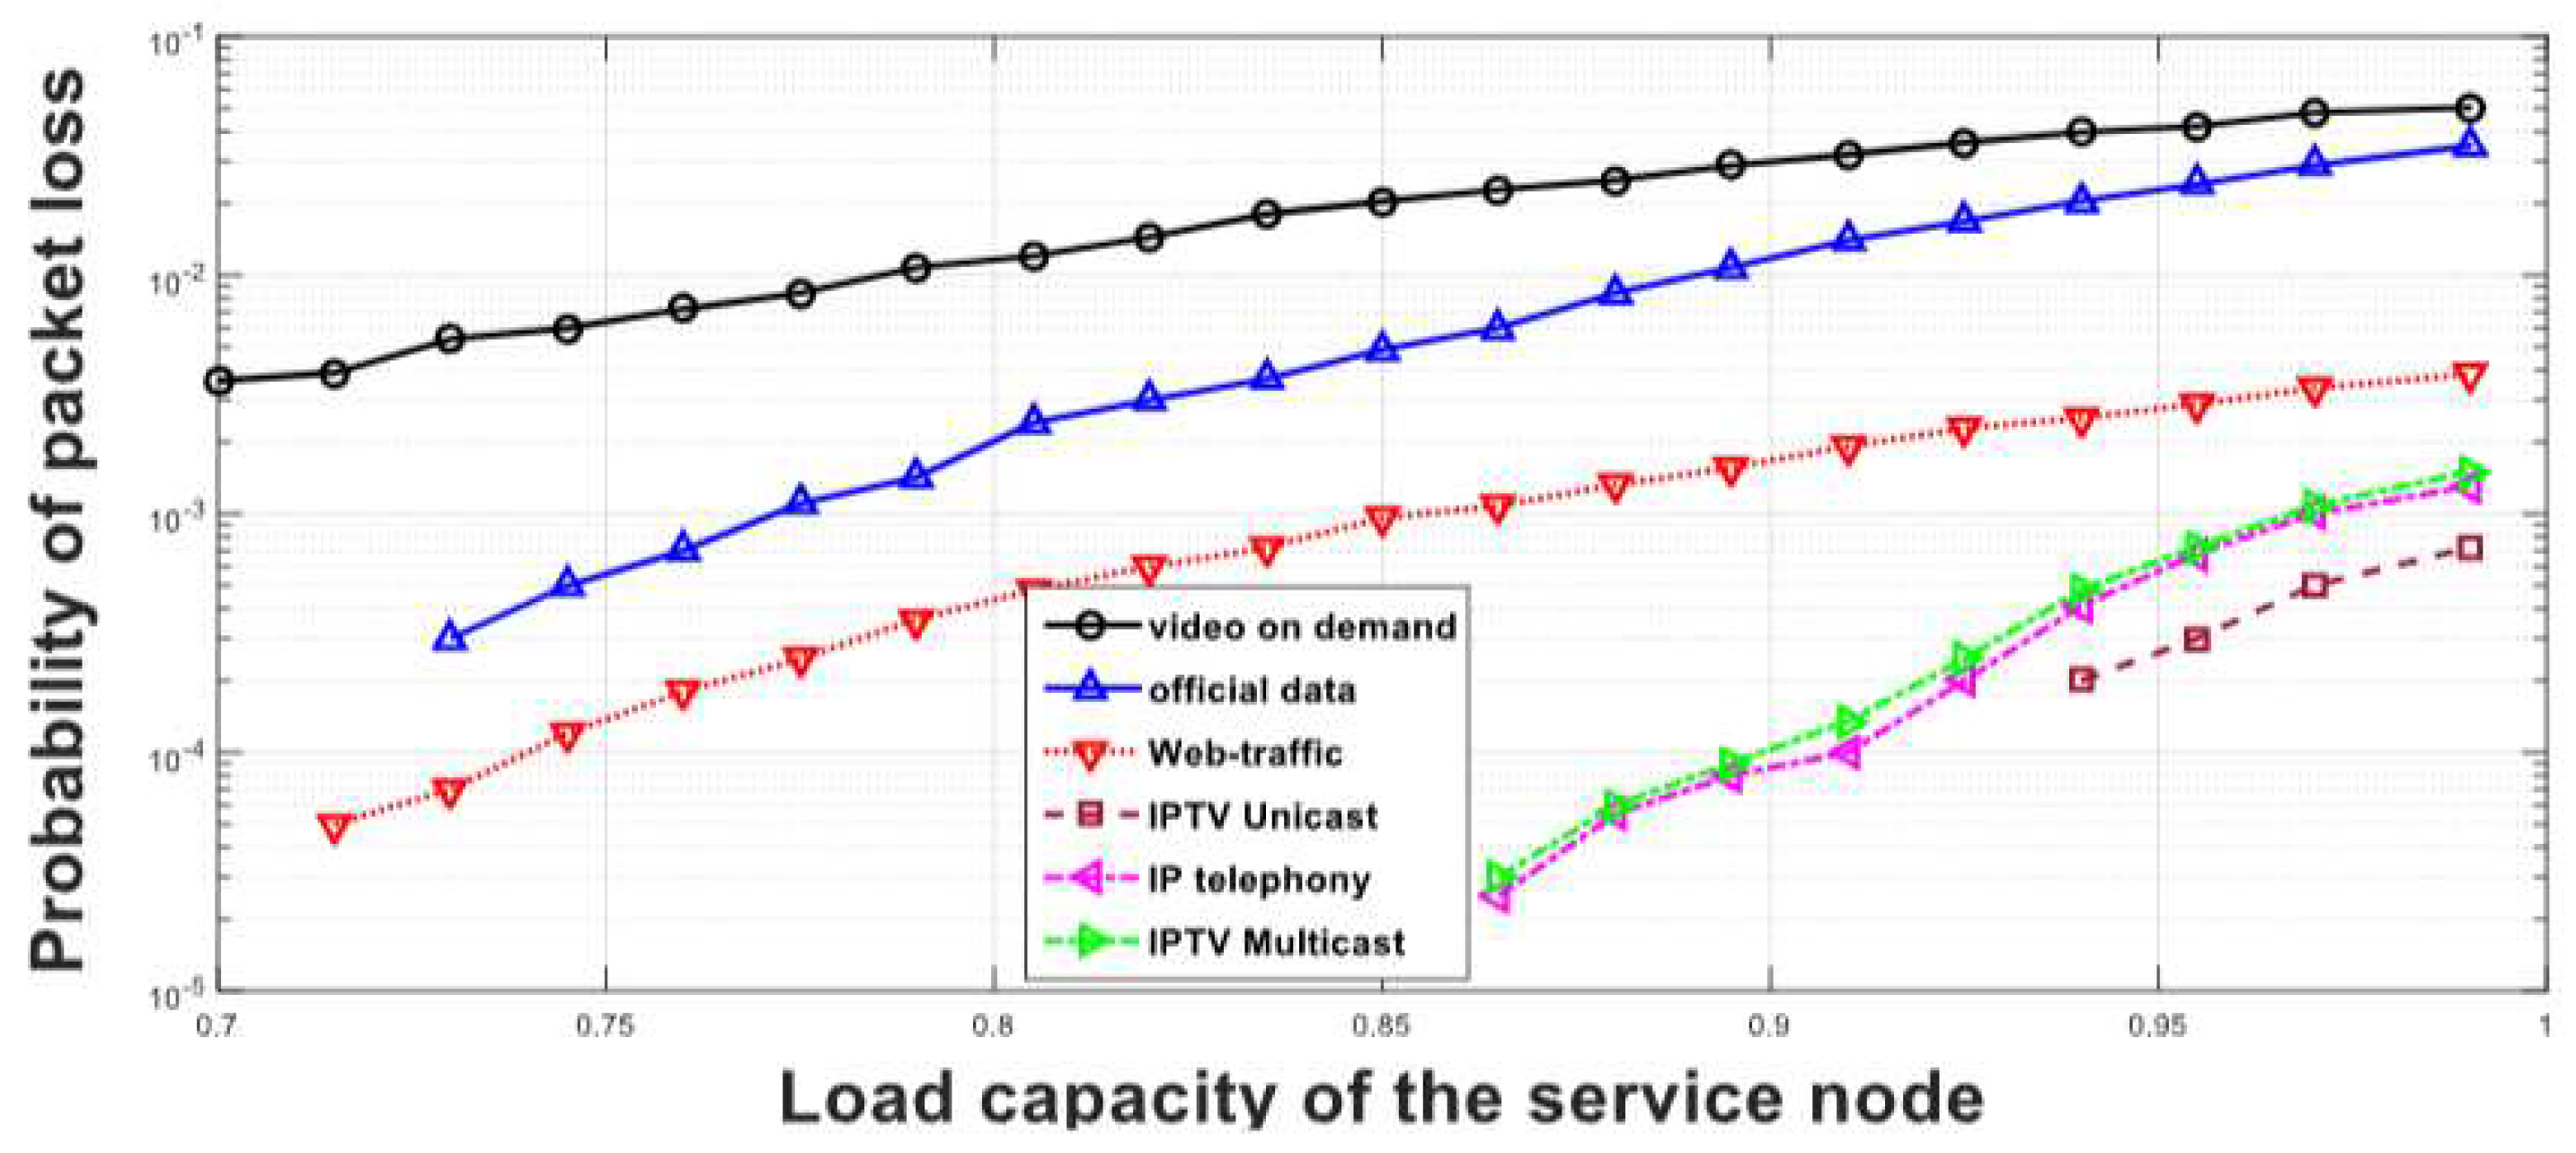
12], the variation coefficient—which is established by the root-mean-square deviation—determines the system’s perceived time delay. This suggests that online traffic, like video-on-demand and Internet Protocol Television (IPTV), which have high variation coefficients, should be buffered to mitigate delays. During the transfer of data in communication networks for E-health applications, small packet losses are considered acceptable. Packet losses due to errors in communication channels with FOCL (Fibre Optic Cable Lines) deployment are possible, however they are not very significant.
Figure 5's results demonstrate that the communication network data's properties are thought to be appropriate for use in e-health applications.
Figure 6 (c.f., [
12]) illustrates the relationship between CPU overloading and packet loss likelihood. In E-health applications, where load capacity is usually not substantial and seldom reaches its maximum, the figure shows that lowering the load capacity improves packet loss performance.
The proposed work of conducted a comprehensive analysis of the MSSN (Multi-Service Switched Network) for its application in E-health. The analysis focuses on using the mathematical model to evaluate the system's capacity, considering a single-channel system with general flow and request characteristics. The goal is to understand the system's performance and suitability for E-health applications based on factors like service duration and distribution.
The authors address the likelihood of packet loss (Ploss) in a network in the context of [
12], which is based on the quantity of dropped packets over a particular amount of time. The total of the waiting time in the buffer, packet processing time, and other variables is known as the packet service delay. Using the
mathematical model, the authors hope to analyse a multi-service network for E-health applications while taking into account variables such as packet loss probability, latency, and jitter. In this instance, the authorsmeasured the network development qualitatively for their suggested model and contrasted it with methods that are frequently employed in E-health applications. In accordance with the Norros methodology, they also assessed the buffer space size to provide adequate service quality[
13]. Additionally, they formulated a service quality algorithm for multi-service telecommunication networks, considering various mechanisms for queue formation and overloading control.
6. Conclusions and Future Work
In summary, this study reveals both FIM and IFIM for theQM. Finally, it has been proven that solves
= A
x. Notably, the strength of
queue to advance E-health is highlighted. Next phase of research includes the determination of the IG structure of the Service Model manifold (c.f., [
14]), the derivation of the information geometric structure of the Generalized Feller Pareto manifold(c.f., [
15]), and IG powerful tools to geometrically interpret photon statistics and other unexplored phenomena in physics.
References
- Mageed, I. A., & Zhang, K. Q. (2022). Information Geometry? Exercises de Styles. electronic Journal of Computer Science and Information Technology, 8(1), 9-14.
- I.A. Mageed.(2023). Info-Geometric Analysis of Gamma Distribution Manifold with Gamma Distribution Impact to Advance Satellite Earth Observations. The 2nd International Conference on Applied Mathematics, Informatics, and Computing Sciences (AMICS 2023).
- Mageed, I. A., & Kouvatsos, D. D. (2021, February). The Impact of Information Geometry on the Analysis of the Stable M/G/1 Queue Manifold. In ICORES (pp. 153-160).
- B.C. Hall, The Matrix Exponential. In: Lie Groups, Lie Algebras, and Representations. Graduate Texts in Mathematics, vol 222. Springer, Cham, 2014.
- K.Nakagawa, The geometry of M/D/1 queues and Large Deviation, International Transactions of Operational Research, Volume 9, Issue 2, 2002. [CrossRef]
- [6]R.Kondor, S.Trivedi, On the Generalization of Equivariance and Convolution in Neural Networks to the action of Compact Groups, Proceedings of the 35th International Conference on Machine Learning, Stockholm, Sweden, PMLR 80, 2018.
- Mageed, I. A., Zhou, Y., Liu, Y., & Zhang, Q. (2023, August). Towards a Revolutionary Info-Geometric Control Theory with Potential Applications of Fokker Planck Kolmogorov (FPK) Equation to System Control, Modelling and Simulation. In 2023 28th International Conference on Automation and Computing (ICAC) (pp. 1-6). IEEE.
- Mageed, I. A., Yin, X., Liu, Y., & Zhang, Q. (2023, August). Z(a,b) of the Stable Five-Dimensional $ M/G/1$ Queue Manifold Formalism's Info-Geometric Structure with Potential Info-Geometric Applications to Human Computer Collaborations and Digital Twins. In 2023 28th International Conference on Automation and Computing (ICAC) (pp. 1-6). IEEE.
- I.A. Mageed , D.D.Kouvatsos, Information Geometric Structure of Stable M/G/1 Queue Manifold and its Matrix Exponential, Proceedings of the 35th UK Performance Engineering Workshop, School of Computing, University of Leeds, Edited by Karim Djemame, p.123-135,16 December 2019.
- J.T.Smith, Cubic and Quartic Formulas, San Francisco State University, 25 Aug 2013. [Online] Available on http://Cubic&Quartic.pdf.
- Lu, Z. (2022). Towards a Progressive E-health Application Framework (Doctoral dissertation).
- Attar, H., Khosravi, M. R., Igorovich, S. S., Georgievan, K. N., & Alhihi, M. (2021). E-health communication system with multiservice data traffic evaluation based on a G/G/1 analysis method. Current Signal Transduction Therapy, 16(2), 115-121. [CrossRef]
- Mageed, I. A. (2023, July). Rényi’s Maximum Entropy Formalism of Heavy-Tailed Queues with Hurst Exponent Heuristic Mean Queue Length Combined With Potential Applications of Hurst Exponent to Engineering. In 39 th Annual UK Performance Engineering Workshop (p. 21).
- S.M. Prado1, F. Louzada,J.G. S. Rinaldi and B.G. Benze,A Distribution for The Service Model, esquisa Operacional (2015) 35(3): 555-576© 2015 Brazilian Operations Research Society, 2014.
- M.R.Mahmoud, A.S. Abd El Ghafour, Shannon Entropy for the Generalized Feller Pareto (GFP) Family and Order Statistics of (GFP) Family and Order Statistics of (GFP) Subfamilies, Applied Mathematical Sciences, Vol. 7, 2013, no. 65, 3247-3253.
|
Disclaimer/Publisher’s Note: The statements, opinions and data contained in all publications are solely those of the individual author(s) and contributor(s) and not of MDPI and/or the editor(s). MDPI and/or the editor(s) disclaim responsibility for any injury to people or property resulting from any ideas, methods, instructions or products referred to in the content. |
© 2024 by the authors. Licensee MDPI, Basel, Switzerland. This article is an open access article distributed under the terms and conditions of the Creative Commons Attribution (CC BY) license (http://creativecommons.org/licenses/by/4.0/).
