Submitted:
25 January 2024
Posted:
25 January 2024
You are already at the latest version
Abstract
Keywords:
1. Introduction
2. Materials and Methods
2.1. Materials
2.2. Methods
3. Results
3.1. Microstructure Studies of the As-Cast Materials
3.2. Microstructure Studies of CGP Materials
3.3. Solution Treatment and Aging
4. Discussion
5. Conclusions
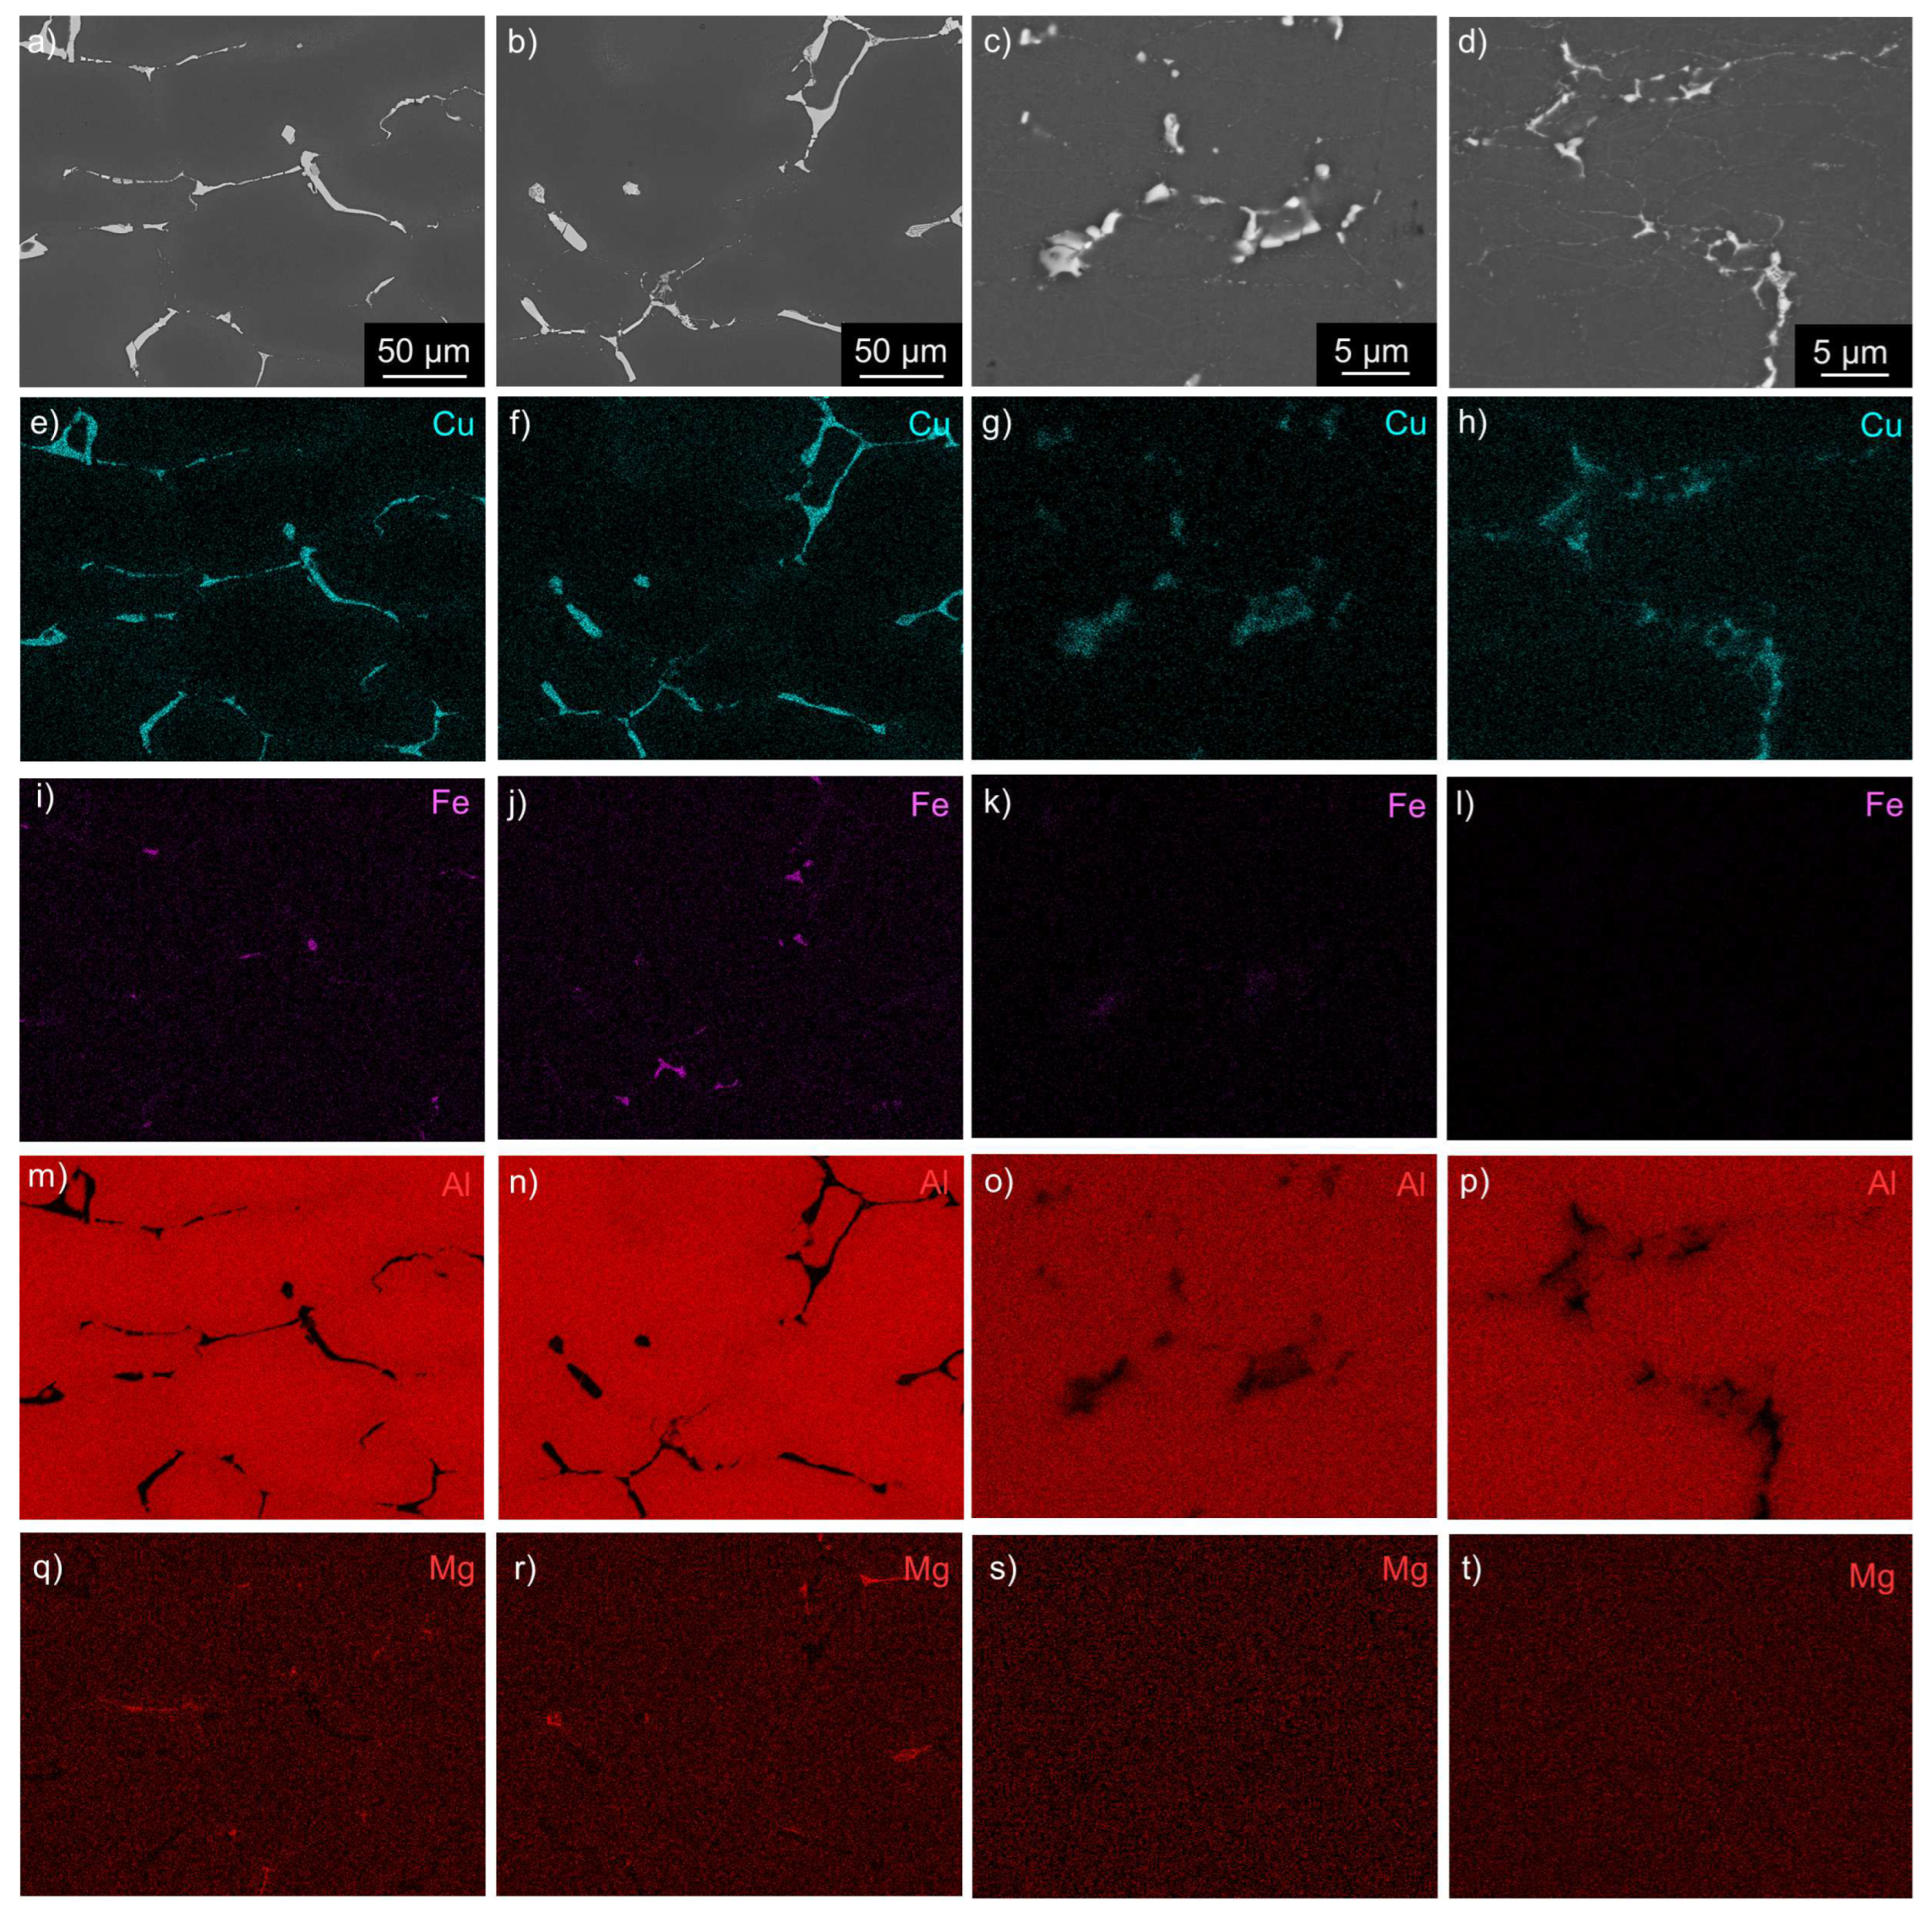
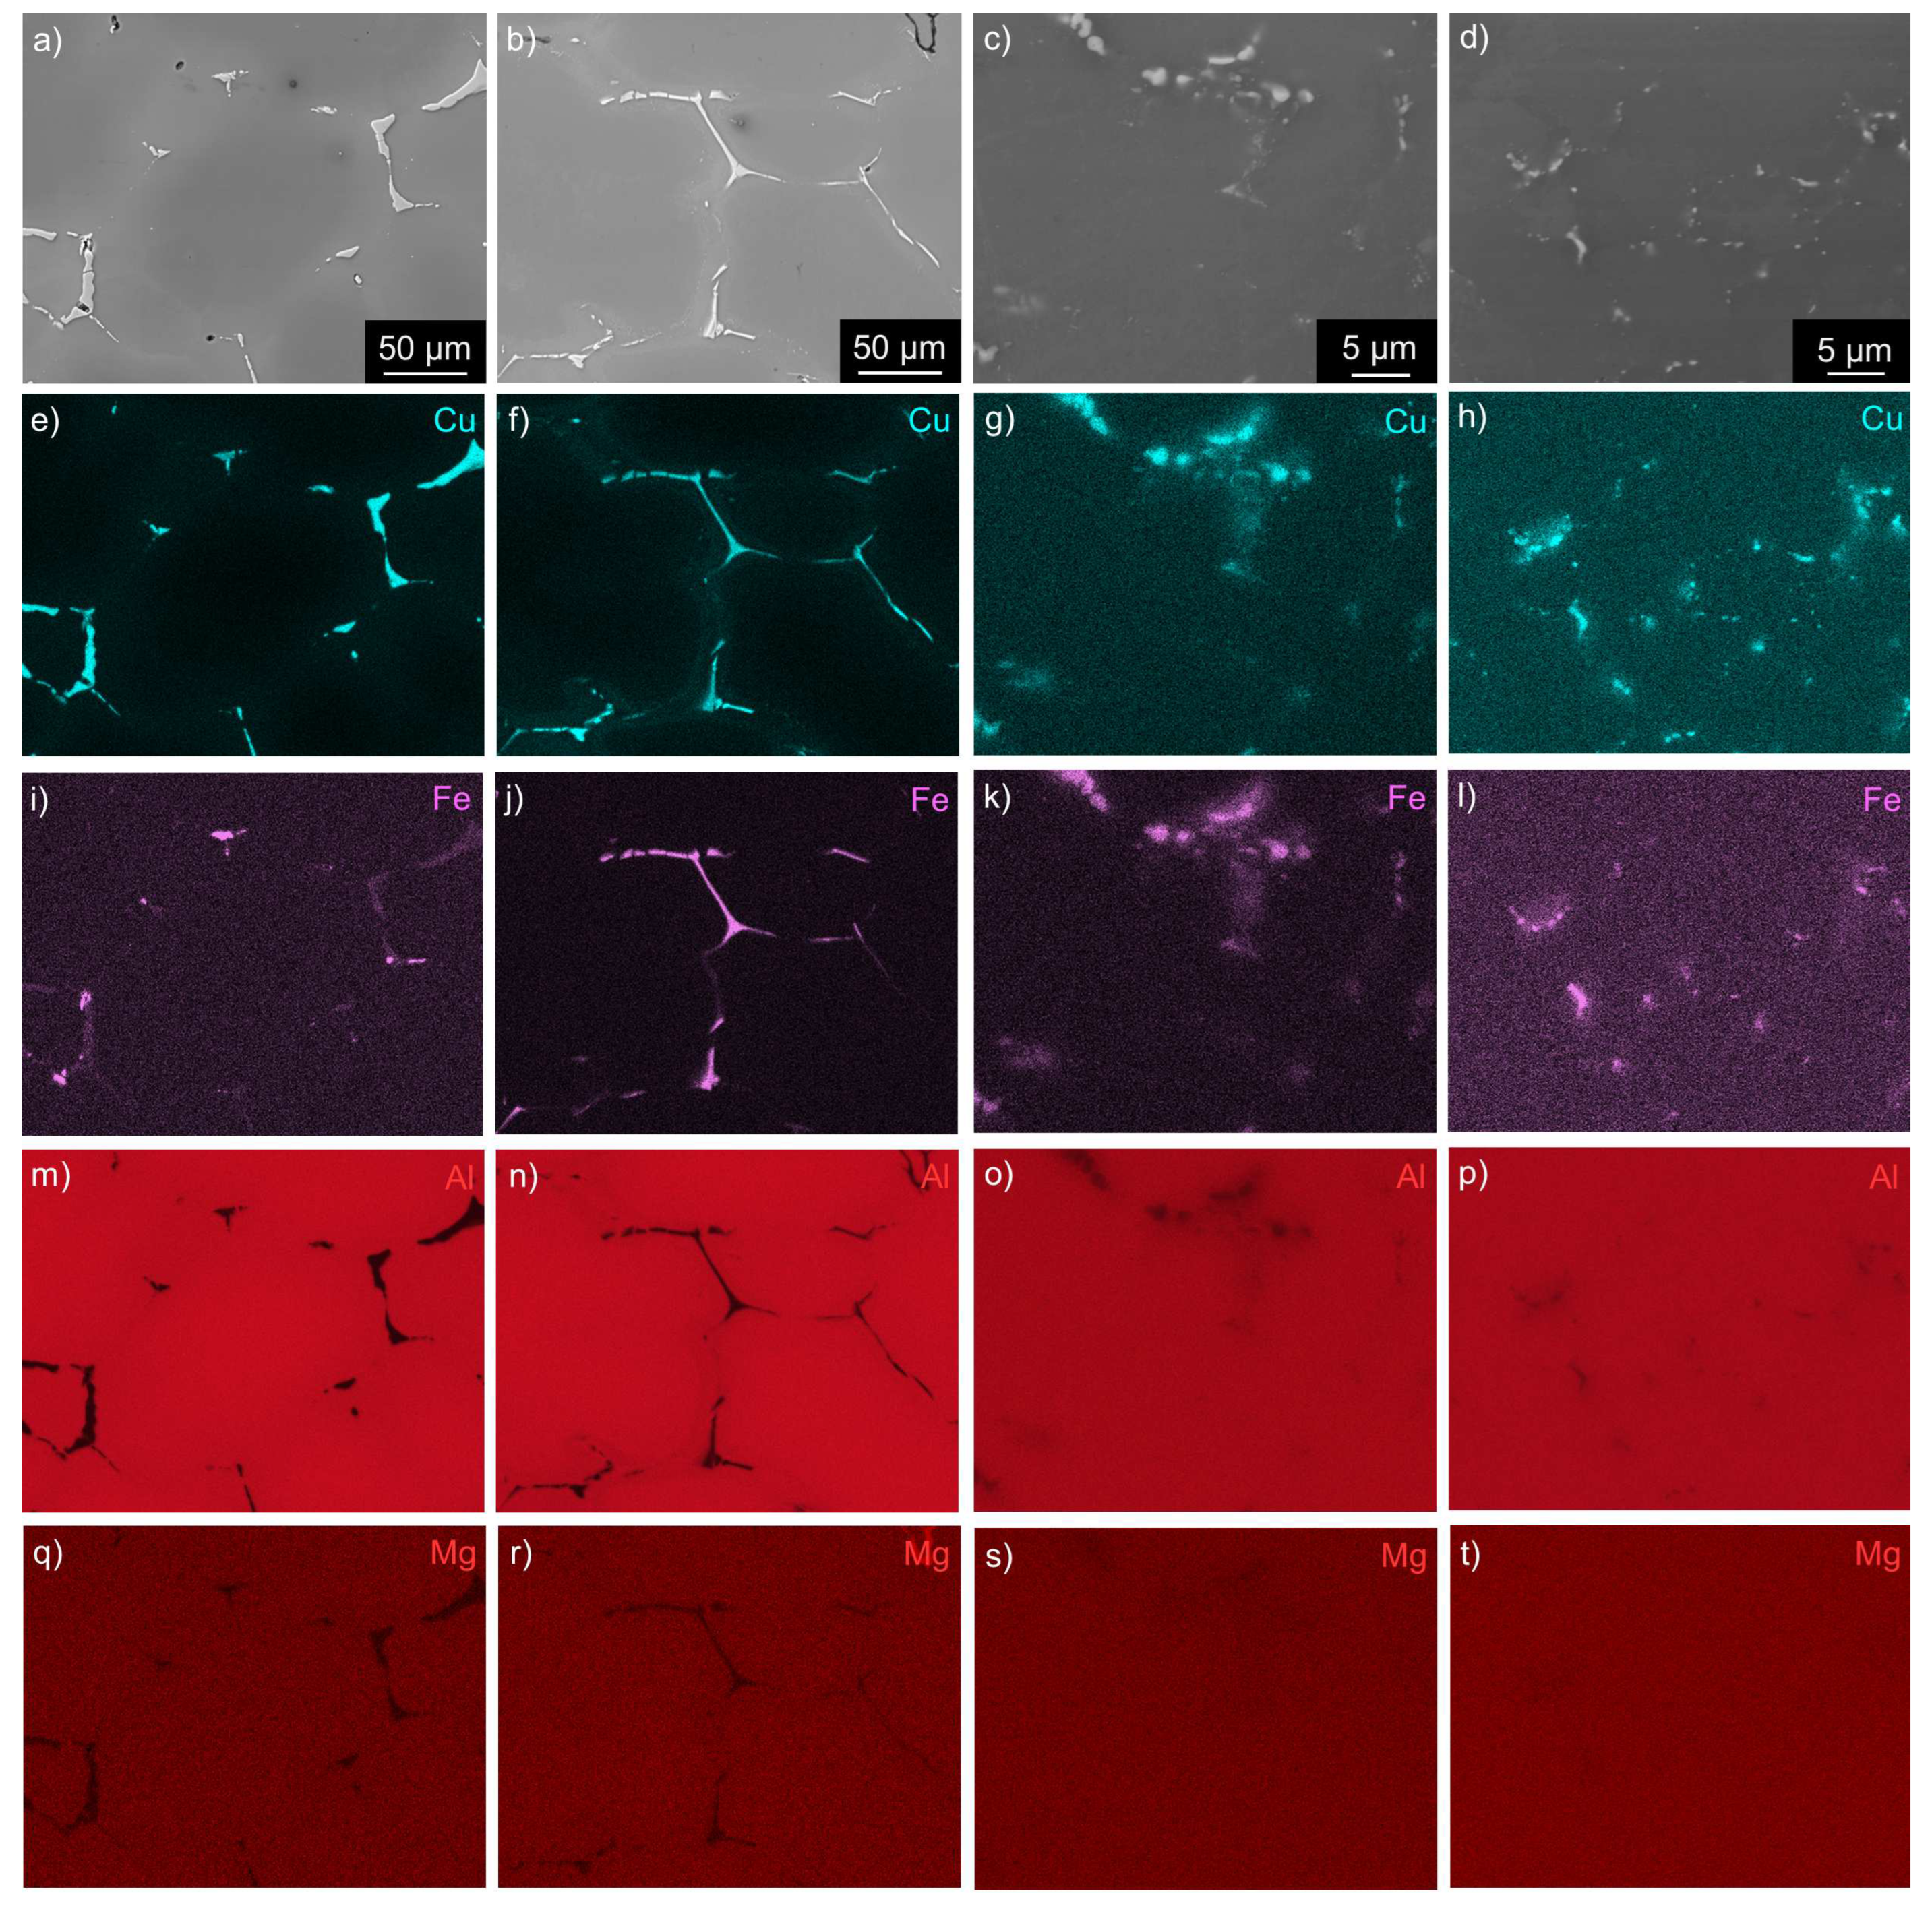
- Combining twin-roll casting of Al-Cu-Li-Mg-Zr and microalloying with a small amount of Sc has an essential impact on the size and distribution of primary intermetallic particles. The size of eutectic cells characterized by the interdendritic spacing is significantly reduced and, on average, does not exceed 10-15 m.
- Small dimensions of eutectic cells allow the omission of energy-demanding long-term homogenization, generally coupled with a massive depletion of surface layers from Li atoms. Instead, a short multistep solution/homogenization treatment combined with a pre-deformation by the constrained groove pressing (300 °C / 30 min, 450 °C / 30 min, CGP, and 530 °C / 30 min) could be used. A suitable distribution of small core-shell dispersoids stabilizing the fine-grained structure is achieved during this step.
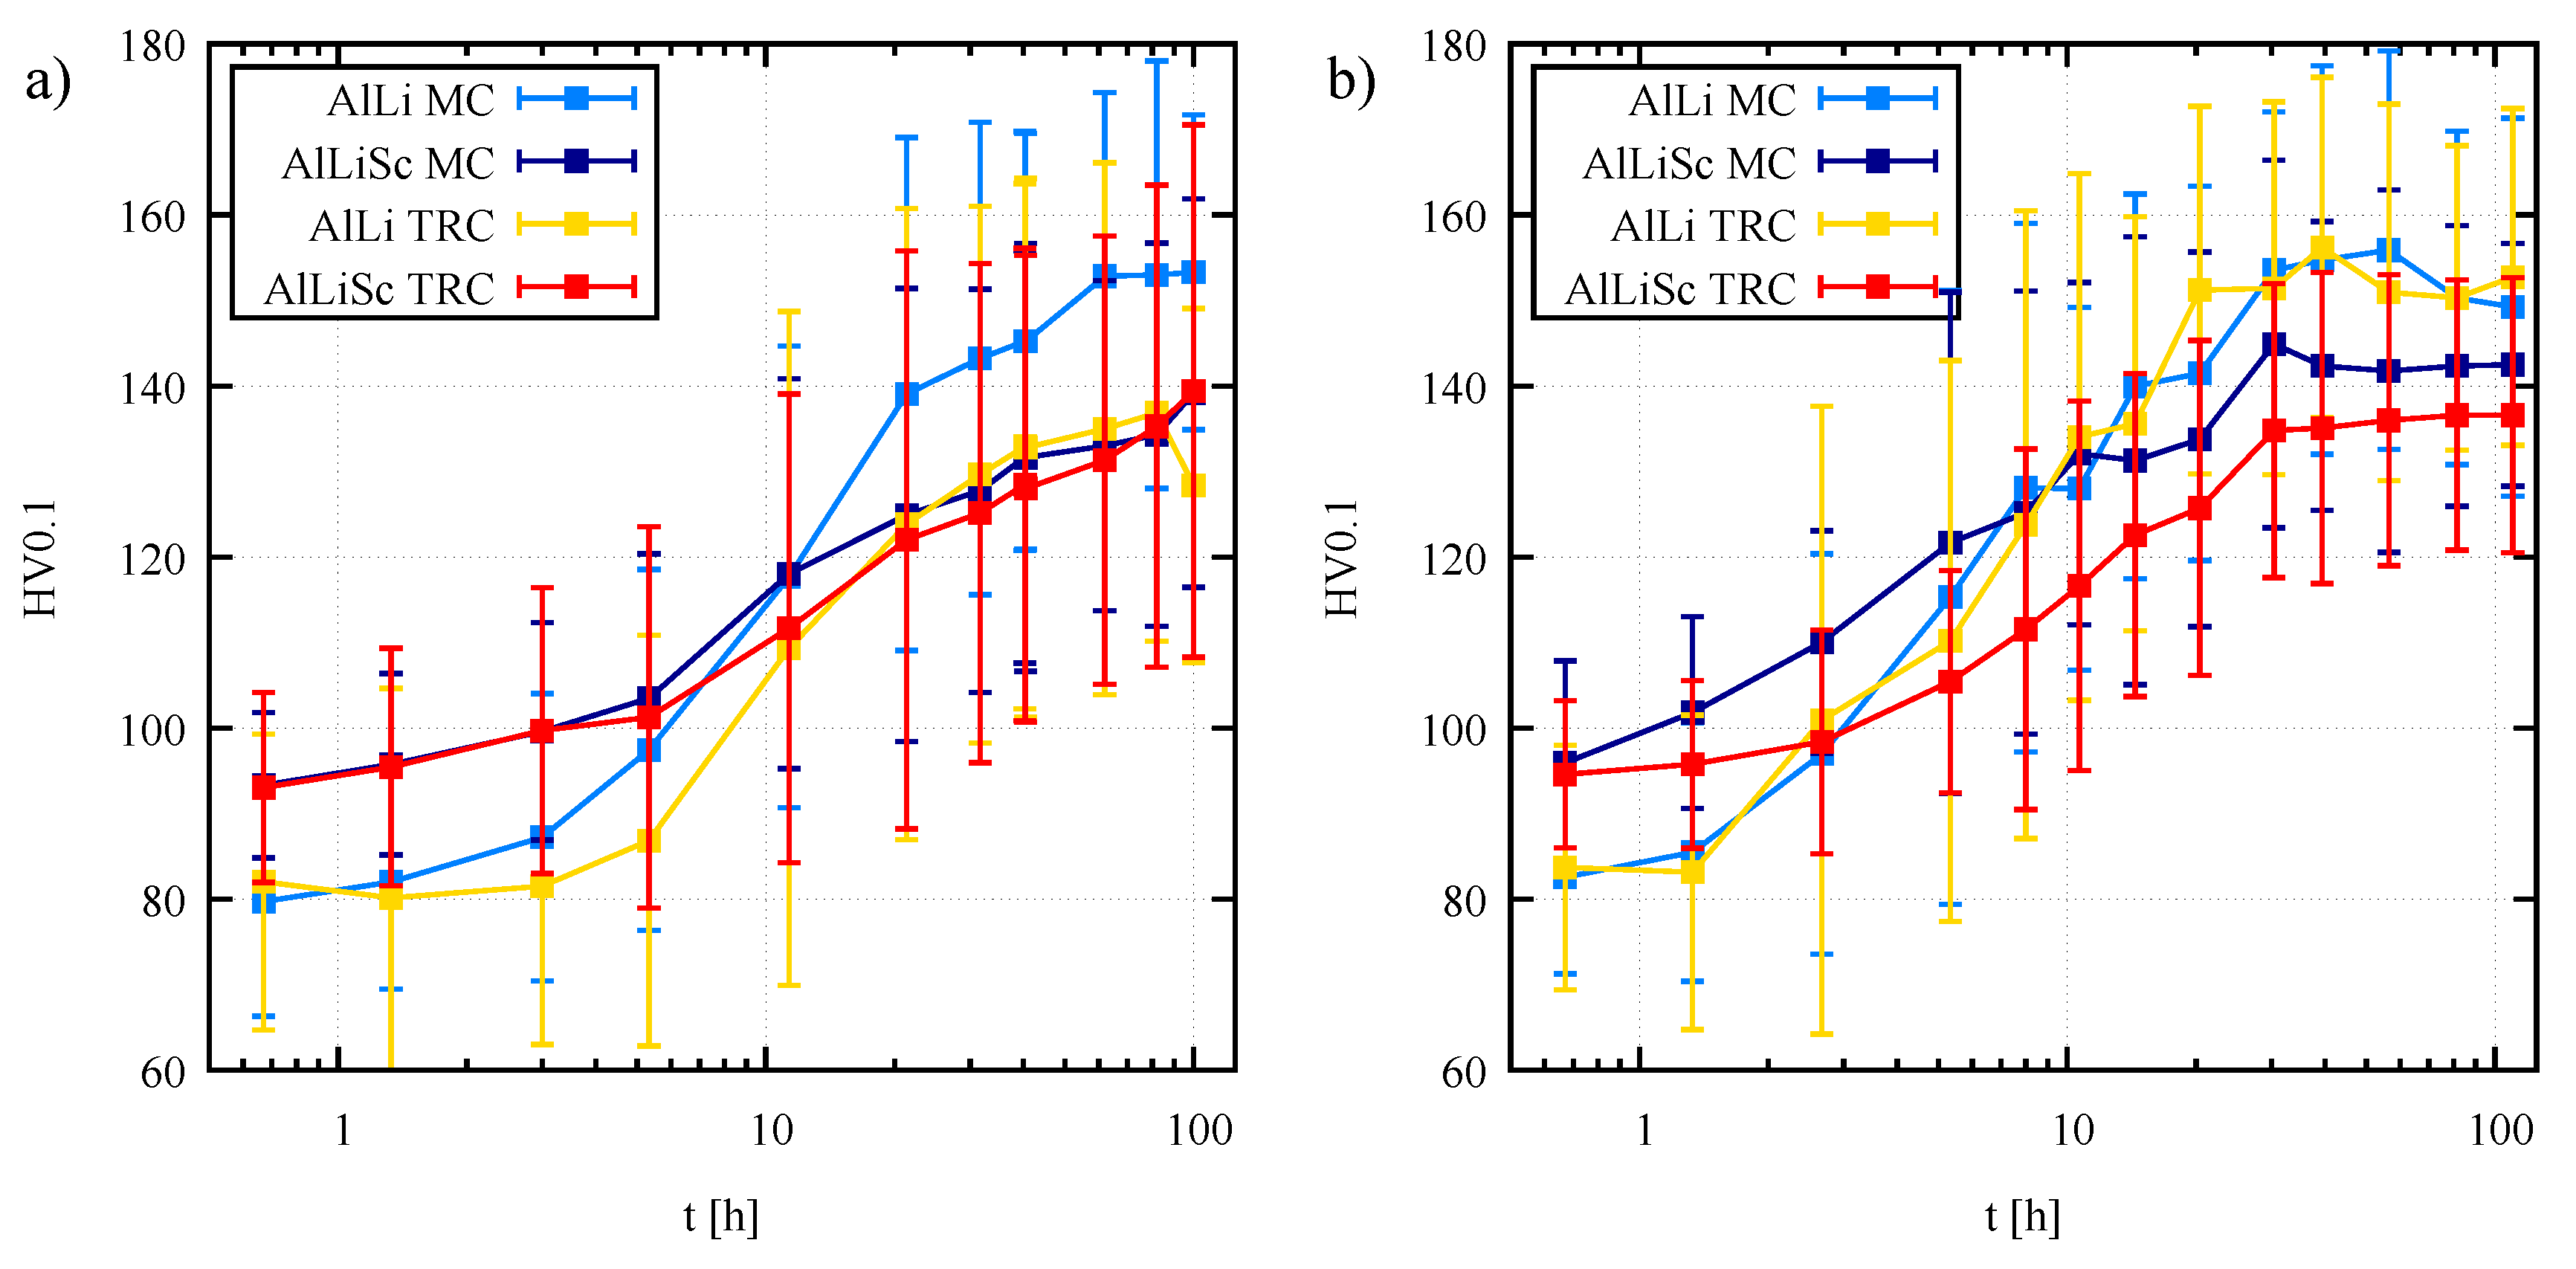
- Calibration pre-straining by 3 % and final artificial aging 180 °C / 30 min assuring heterogeneous precipitation of a fine dispersion of reinforcing particles simulate the T8 temper typical for age-hardenable aluminum wrought alloys leading to optimal near peak-aged strengthening of the alloy.
- The near net shape thickness of the strip allows skip rolling or extruding, which are indispensable steps in conventionally cast materials. Both processes always produce strongly directional and anisotropic structures with flat and elongated (sub)grains prone to intergranular segregation, anisotropic corrosion, and intergranular delamination. The proposed procedure thus represents an optimal method for preparing lightweight, high-strength materials from Al-Cu-Li-Mg-Zr alloy suitable for cryogenic applications in aeronautics.
Author Contributions
Funding
Institutional Review Board Statement
Data Availability Statement
Conflicts of Interest
References
- Prasad, N.; Gokhale, A.; Wanhill, R. Aluminum-lithium Alloys: Processing, Properties, and Applications; Butterworth-Heinemann, 2013; pp. 4–26. [Google Scholar]
- Starke, E.; Staley, J. Application of modern aluminum alloys to aircraft. Progress in Aerospace Sciences 1996, 32, 131–172. [Google Scholar] [CrossRef]
- Rioja, R.J. Fabrication methods to manufacture isotropic Al-Li alloys and products for space and aerospace applications. Materials Science and Engineering: A 1998, 257, 100–107. [Google Scholar] [CrossRef]
- Singh, G.; Nayan, N.; Narayana Murty, S.; Yadava, M.; Bajargan, G.; Mohan, M. Hot deformation behavior of Sc/Nb modified AA2195 Al–Li–Cu alloys. Materials Science and Engineering: A 2022, 844, 143169. [Google Scholar] [CrossRef]
- Lavernia, E.J.; Srivatsan, S.T.; Mohamed, F.A. Strength, deformation, fracture behaviour and ductility of aluminium-lithium alloys. Journal of Materials Science 1990, 25, 1137–1158. [Google Scholar] [CrossRef]
- Goswami, R.; Bernstein, N. Effect of interfaces of grain boundary Al2CuLi plates on fracture behavior of Al–3Cu–2Li. Acta Materialia 2015, 87, 399–410. [Google Scholar] [CrossRef]
- Csontos, A.A.; Starke, E.A. The effect of inhomogeneous plastic deformation on the ductility and fracture behavior of age hardenable aluminum alloys. International Journal of Plasticity 2005, 21, 1097–1118, Plasticity of Multiphase Materials. [Google Scholar] [CrossRef]
- Pan, Z.; Zheng, Z.; Liao, Z.; Li, S. New cubic precipitate in Al–3.5Cu–1.0Li–0.5In (wt.%) alloy. Materials Letters 2010, 64, 942–944. [Google Scholar] [CrossRef]
- Gao, Z.; Chen, J.H.; Duan, S.Y.; Yang, X.B.; Wu, C.L. Complex Precipitation Sequences of Al-Cu-Li-(Mg) Alloys Characterized in Relation to Thermal Ageing Processes. Acta Metallurgica Sinica (English Letters) 1992, 29, 94–103. [Google Scholar] [CrossRef]
- Liu, S.; Wróbel, J.; LLorca, J. First-principles analysis of the Al-rich corner of Al-Li-Cu phase diagram. Acta Materialia 2022, 236, 118129. [Google Scholar] [CrossRef]
- Polmear, I.; Miller, W.; Lloyd, D.; Bull, M. Effect of grain structure and texture on mechanical properties of Al-Li alloys, Aluminuim-Lithium Alloys III.; The Institute of Metals, 1986; pp. 565–575. [Google Scholar]
- Deschamps, A.; De Geuser, F.; Horita, Z.; Lee, S.; Renou, G. Precipitation kinetics in a severely plastically deformed 7075 aluminium alloy. Acta Materialia 2014, 66, 105–117. [Google Scholar] [CrossRef]
- Cabibbo, M. Partial dissolution of strengthening particles induced by equal channel angular pressing in an Al–Li–Cu alloy. Materials Characterization 2012, 68, 7–13. [Google Scholar] [CrossRef]
- Cepeda-Jiménez, C.; García-Infanta, J.; Zhilyaev, A.; Ruano, O.; Carreño, F. Influence of the thermal treatment on the deformation-induced precipitation of a hypoeutectic Al–7wt% Si casting alloy deformed by high-pressure torsion. Journal of Alloys and Compounds 2011, 509, 636–643. [Google Scholar] [CrossRef]
- Huang, W.; Liu, Z.; Lin, M.; Zhou, X.; Zhao, L.; Ning, A.; Zeng, S. Reprecipitation behavior in Al–Cu binary alloy after severe plastic deformation-induced dissolution of θ´ particles. Materials Science and Engineering: A 2012, 546, 26–33. [Google Scholar] [CrossRef]
- Liu, Z.; Bai, S.; Zhou, X.; Gu, Y. On strain-induced dissolution of θ´ and θ particles in Al–Cu binary alloy during equal channel angular pressing. Materials Science and Engineering: A 2011, 528, 2217–2222. [Google Scholar] [CrossRef]
- Murayama, M.; Horita, Z.; Hono, K. Microstructure of two-phase Al–1.7 at% Cu alloy deformed by equal-channel angular pressing. Acta Materialia 2001, 49, 21–29. [Google Scholar] [CrossRef]
- Zhao, Y.; Liao, X.; Jin, Z.; Valiev, R.; Zhu, Y. Microstructures and mechanical properties of ultrafine grained 7075 Al alloy processed by ECAP and their evolutions during annealing. Acta Materialia 2004, 52, 4589–4599. [Google Scholar] [CrossRef]
- Valiev, R.Z.; Langdon, T.G. Principles of equal-channel angular pressing as a processing tool for grain refinement. Progress in Materials Science 2006, 51, 881–981. [Google Scholar] [CrossRef]
- Šlapáková Poková, M.; Zimina, M.; Cieslar, M. Effect of pre-annealing on microstructure evolution of TRC AA3003 aluminum alloy subjected to ECAP. Transactions of Nonferrous Metals Society of China 2016, 26, 627–633. [Google Scholar] [CrossRef]
- Zhilyaev, A.P.; Langdon, T.G. Using high-pressure torsion for metal processing: Fundamentals and applications. Progress in Materials Science 2008, 53, 893–979. [Google Scholar] [CrossRef]
- Saito, Y.; Utsunomiya, H.; Tsuji, N.; Sakai, T. Novel ultra-high straining process for bulk materials—development of the accumulative roll-bonding (ARB) process. Acta Materialia 1999, 47, 579–583. [Google Scholar] [CrossRef]
- Cieslar, M.; Poková, M. Annealing Effects in Twin-Roll Cast AA8006 Aluminium Sheets Processed by Accumulative Roll-Bonding. Materials 2014, 7, 8058–8069. [Google Scholar] [CrossRef] [PubMed]
- Zhu, Y.; Alamos, L.; Lowe, T.; Fe, S.; H. Jiang, J.H. Repetitive corrugation and strengthening. United States Patent US 6197129 B1, 2001. [Google Scholar]
- Shin, D.H.; Park, J.J.; Kim, Y.S.; Park, K.T. Constrained groove pressing and its application to grain refinement of aluminum. Materials Science and Engineering: A 2002, 328, 98–103. [Google Scholar] [CrossRef]
- Jiang, J.; Yuan, T.; Zhang, W.; Ma, A.; Song, D.; Wu, Y. Effect of equal-channel angular pressing and post-aging on impact toughness of Al-Li alloys. Materials Science and Engineering: A 2018, 733, 385–392. [Google Scholar] [CrossRef]
- Yuan, T.; Jiang, J.; Ma, A.; Wu, Y.; Yuan, Y.; Li, C. Simultaneously improving the strength and ductility of an Al-5.5Mg-1.6Li-0.1Zr alloy via warm multi-pass ECAP. Materials Characterization 2019, 151, 530–541. [Google Scholar] [CrossRef]
- Liu, S.; Wang, Z. Fatigue properties of 8090 Al–Li alloy processed by equal-channel angular pressing. Scripta Materialia 2003, 48, 1421–1426. [Google Scholar] [CrossRef]
- Mogucheva, A.; Kaibyshev, R. Microstructure and Mechanical Properties of an Al-Li-Mg-Sc-Zr Alloy Subjected to ECAP. Metals 2016, 6. [Google Scholar] [CrossRef]
- Muñoz-Morris, M.; Morris, D. Microstructure control during severe plastic deformation of Al–Cu–Li and the influence on strength and ductility. Materials Science and Engineering: A 2011, 528, 3445–3454. [Google Scholar] [CrossRef]
- John Xavier Raj, J.R.; Shanmugavel, B.P. Thermal stability of ultrafine grained AA8090 Al–Li alloy processed by repetitive corrugation and straightening. Journal of Materials Research and Technology 2019, 8, 3251–3260. [Google Scholar] [CrossRef]
- Jenix Rino, J.; Jayaram Krishnan, I.; Balasivanandha Prabu, S.; Padmanabhan, K. Influence of velocity of pressing in RCS processed AA8090 Al-Li alloy. Materials Characterization 2018, 140, 55–63. [Google Scholar] [CrossRef]
- Røyset, J.; Ryum, N. Scandium in aluminium alloys. International Materials Reviews 2005, 50, 19–44. [Google Scholar] [CrossRef]
- Li, X.; Lei, K.; Song, P.; Liu, X.; Zhang, F.; Li, J.; Chen, J. Strengthening of Aluminum Alloy 2219 by Thermo-mechanical Treatment. Journal of Materials Engineering and Performance 2015, 24. [Google Scholar] [CrossRef]
- Wang, H.m.; Xia, C.q.; Lei, P.; Wang, Z.w. Influence of thermomechanical aging on microstructure and mechanical properties of 2519A aluminum alloy. Journal of Central South University of Technology 2011, 18, 1349–1353. [Google Scholar] [CrossRef]
- Li, J.f.; Ye, Z.H.; Liu, D.; Chen, Y.L.; Zhang, X.H.; Xu, X.Z.; Zheng, Z.Q. Influence of Pre-deformation on Aging Precipitation Behavior of Three Al–Cu–Li Alloys. Acta Metallurgica Sinica (English Letters) 2016, 30. [Google Scholar] [CrossRef]
- Cassada, W.; Shiflet, G.; Starke, E. The effect of plastic deformation on Al 2 CuLi ( T 1 ) precipitation. Metallurgical and Materials Transactions A-physical Metallurgy and Materials Science - METALL MATER TRANS A 1991, 22, 299–306. [Google Scholar] [CrossRef]
- Ringer, S.; Muddle, B.; Polmear, I. Effects of cold work on precipitation in Al-Cu-Mg-(Ag) and Al-Cu-Li-(Mg-Ag) alloys. Metall Mater Trans A Phys Metall Mater Sci 1995, 26, 1659–1671. [Google Scholar] [CrossRef]
- Gao, C.; Luan, Y.; Yu, J.C.; Ma, Y. Effect of thermo-mechanical treatment process on microstructure and mechanical properties of 2A97 Al-Li alloy. Transactions of Nonferrous Metals Society of China 2014, 24, 2196–2202. [Google Scholar] [CrossRef]
- Rodgers, B.; Prangnell, P. Quantification of the influence of increased pre-stretching on microstructure-strength relationships in the Al–Cu–Li alloy AA2195. Acta Materialia 2016, 108, 55–67. [Google Scholar] [CrossRef]
- Nayan, N.; Murty, S.N.; Jha, A.K.; Pant, B.; Sharma, S.; George, K.M.; Sastry, G. Processing and characterization of Al–Cu–Li alloy AA2195 undergoing scale up production through the vacuum induction melting technique. Materials Science and Engineering: A 2013, 576, 21–28. [Google Scholar] [CrossRef]
- Jia, M.; Zheng, Z.; Gong, Z. Microstructure evolution of the 1469 Al–Cu–Li–Sc alloy during homogenization. Journal of Alloys and Compounds 2014, 614, 131–139. [Google Scholar] [CrossRef]
- Huang, L.; Huang, J.; Liu, W.; Cao, L.; Li, S. Effect of minor Sc additions on precipitation and mechanical properties of a new Al-Cu-Li alloy under T8 temper. Journal of Alloys and Compounds 2022, 927, 166860. [Google Scholar] [CrossRef]
- Yan, K.; Chen, Z.; Lu, W.; Zhao, Y.; Le, W.; Naseem, S. Nucleation and growth of Al3Sc precipitates during isothermal aging of Al-0.55 wt% Sc alloy. Materials Characterization 2021, 179, 111331. [Google Scholar] [CrossRef]
- Wang, Y.; Xiong, B.; li, Z.; Zhang, Y.; Teng, H. Precipitation Behavior of Al3(Sc,Zr) Particles in High-Alloyed Al–Zn–Mg–Cu–Zr–Sc Alloy During Homogenization. Arabian Journal for Science and Engineering 2021, 46, 6027–6037. [Google Scholar] [CrossRef]
- Riddle, Y.; Sanders, T. A Study of Coarsening, Recrystallization, and Morphology of Microstructure in Al-Sc-(Zr)-(Mg) Alloys. Metallurgical and Materials Transactions A: Physical Metallurgy and Materials Science 2004, 35, 341–350. [Google Scholar] [CrossRef]
- Sahoo, S.; Ghosh, S. Microstructure evolution of eutectic Al–Cu strips by high-speed twin-roll strip casting process. Applied Physics A 2015, 121, 45–50. [Google Scholar] [CrossRef]
- Grydin, O.; Stolbchenko, M.; Schaper, M.; Belejová, S.; Králík, R.; Bajtošová, L.; Křivská, B.; Hájek, M.; Cieslar, M. New Twin-Roll Cast Al-Li Based Alloys for High-Strength Applications. Metals 2020, 10. [Google Scholar] [CrossRef]
- Iwamura, S.; Miura, Y. Loss in Coherency and Coarsening Behavior of Al3Sc precipitates. Acta Materialia 2004, 52. [Google Scholar] [CrossRef]
- Kishchik, A.; Mikhaylovskaya, A.; Kotov, A.; Portnoy, V. Effect of Homogenization Treatment on Superplastic Properties of Aluminum Based Alloy with Minor Zr and Sc Additions. Defect and Diffusion Forum 2018, 385, 84–90. [Google Scholar] [CrossRef]
- Gupta, A.K.; Maddukuri, T.S.; Singh, S.K. Constrained groove pressing for sheet metal processing. Progress in Materials Science 2016, 84, 403–462. [Google Scholar] [CrossRef]
- Willis, D.; Lake, J. Measurement of grain size using the circle intercept method. Scripta Metallurgica 1987, 21, 1733–1736. [Google Scholar] [CrossRef]
- Mendelson, M. Average Grain Size in Polycrystalline Ceramics. J. Am. Ceram. 1969, 52, 443–446. [Google Scholar] [CrossRef]
- Fullman, R.L. Measurement of Particle Sizes in Opaque Bodies. JOM 1953, 5, 447–452. [Google Scholar] [CrossRef]
- Bajtošová, L.; Cieslar, M.; Králík, R.; Křivská, B.; Šlapáková, M.; Grydin, O.; Stolbchenko, M.; Schaper, M. Phase identification in twin-roll cast Al-Li alloys. Proceedings 31st International Conference on Metallurgy and Materials; 2022; pp. 587–592. [Google Scholar] [CrossRef]
- Cieslar, M.; Bajtošová, L.; Králík, R.; Křivská, B.; Grydin, O.; Stolbchenko, M.; Schaper, M. Homogenization of twin-roll cast Al-Li-based alloy studied by in-situ electron microscopy. Proceedings 31st International Conference on Metallurgy and Materials; 2022; pp. 593–598. [Google Scholar] [CrossRef]
- Jiang, L.; Zhang, Z.; Bai, Y.; Li, S.; Mao, W. Study on Sc Microalloying and Strengthening Mechanism of Al-Mg Alloy. Crystals 2022, 12. [Google Scholar] [CrossRef]
- Kaiser, M.; Datta, S.; Roychowdhury, A.; Banerjee, M. Effect of scandium on the microstructure and ageing behaviour of cast Al–6Mg alloy. Materials Characterization 2008, 59, 1661–1666. [Google Scholar] [CrossRef]
- Li, Q.; Liu, X.; Wang, J.; Xue, C.; Wang, S. Boosting the grain refinement of commercial Al alloys by compound addition of Sc. Journal of Materials Research and Technology 2024, 28, 1774–1783. [Google Scholar] [CrossRef]
- Slámová, M.; Karlík, M.; Robaut, F.; Sláma, P.; Véron, M. Differences in microstructure and texture of Al–Mg sheets produced by twin-roll continuous casting and by direct-chill casting. Materials Characterization 2002, 49, 231–240. [Google Scholar] [CrossRef]
- Zhang, F.; Shen, J.; Yan, X.D.; Sun, J.L.; Sun, X.L.; Yang, Y. Homogenization heat treatment of 2099 Al–Li alloy. Rare Metals 2013, 33, 28–36. [Google Scholar] [CrossRef]
- Li, S.; Wei, B.; Yu, C.; Li, Y.; Xu, G.; Li, Y. Evolution of microstructure and properties during homogenization of the novel Al–Li alloy fabricated by electromagnetic oscillation twin-roll casting. Journal of Materials Research and Technology 2020, 9, 3304–3317. [Google Scholar] [CrossRef]
- Partridge, P.G. Oxidation of aluminium-lithium alloys in the solid and liquid states. International Materials Reviews 1990, 35, 37–58. [Google Scholar] [CrossRef]
- Soni, K.; Williams, D.; Newbury, D.; Gillen, G.; Chi, P.; Bright, D. Compositional Changes in Aluminum-Lithium-Base Alloys Caused by Oxidation. Metall Trans A 1993, 24, 2279–2288. [Google Scholar] [CrossRef]
- Holdway, P.; Bowen, A.W. The measurement of lithium depletion in aluminium-lithium alloys using X-ray diffraction. Journal of Materials Science 1989, 24, 3841–3849. [Google Scholar] [CrossRef]
- del Campo, A.C.; de Damborenea, J. Effect of surface depletion of lithium on corrosion behaviour of aluminium alloy 8090 in a marine atmosphere. Journal of Materials Science 1996, 31, 4921–4926. [Google Scholar] [CrossRef]
- Clouet, E.; Laé, L.; Epicier, T.; Lefebvre, W.; Nastar, M.; Deschamps, A. Complex Precipitation Pathways in Multi-Component Alloys. Nature materials 2006, 5, 482–8. [Google Scholar] [CrossRef] [PubMed]
- Harada, Y.; Dunand, D. Microstructure of Al3Sc with ternary transition-metal additions. Materials Science and Engineering: A 2002, 329, 686–695. [Google Scholar] [CrossRef]
- Zhang, J.; Wu, G.; Zhang, L.; Zhang, X.; Shi, C.; Sun, J. Effect of Zn on precipitation evolution and mechanical properties of a high strength cast Al-Li-Cu alloy. Materials Characterization 2020, 160, 110089. [Google Scholar] [CrossRef]
- Gable, B.; Zhu, A.; Csontos, A.; Starke, E. The role of plastic deformation on the competitive microstructural evolution and mechanical properties of a novel Al–Li–Cu–X alloy. Journal of Light Metals 2001, 1, 1–14. [Google Scholar] [CrossRef]
- Duan, S.; Guo, F.; Zhang, Y.; Chong, K.; Lee, S.; Matsuda, K.; Zou, Y. Effects of texture and precipitates characteristics on anisotropic hardness evolution during artificial aging for an Al–Cu–Li alloy. Materials and Design 2021, 212, 110216. [Google Scholar] [CrossRef]
- Ma, P.; Zhan, L.; Liu, C.; Wang, Q.; Li, H.; Liu, D.; Hu, Z. Pre-strain-dependent natural ageing and its effect on subsequent artificial ageing of an Al-Cu-Li alloy. Journal of Alloys and Compounds 2019, 790, 8–19. [Google Scholar] [CrossRef]
- Králík, R.; Křivská, B.; Bajtošová, L.; Stolbchenko, M.; Schaper, M.; Grydin, O.; Cieslar, M. The effect of Sc addition on downstream processing of twin-roll cast Al-Cu-Li-Mg-Zr-based alloys. Transactions of Nonferrous Metals Society of China, 2024; Accepted. [Google Scholar]
- Dorin, T.; Deschamps, A.; Geuser, F.D.; Lefebvre, W.; Sigli, C. Quantitative description of the T1 formation kinetics in an Al–Cu–Li alloy using differential scanning calorimetry, small-angle X-ray scattering and transmission electron microscopy. Philosophical Magazine 2014, 94, 1012–1030. [Google Scholar] [CrossRef]
- Bharti, P.; Singh, R.; Sahoo, J.R.; Tripathi, A.; Mishra, S. Yield strength modeling of an Al-Cu-Li alloy through circle rolling and flow stress superposition approach. Journal of Alloys and Compounds 2023, 964, 171343. [Google Scholar] [CrossRef]


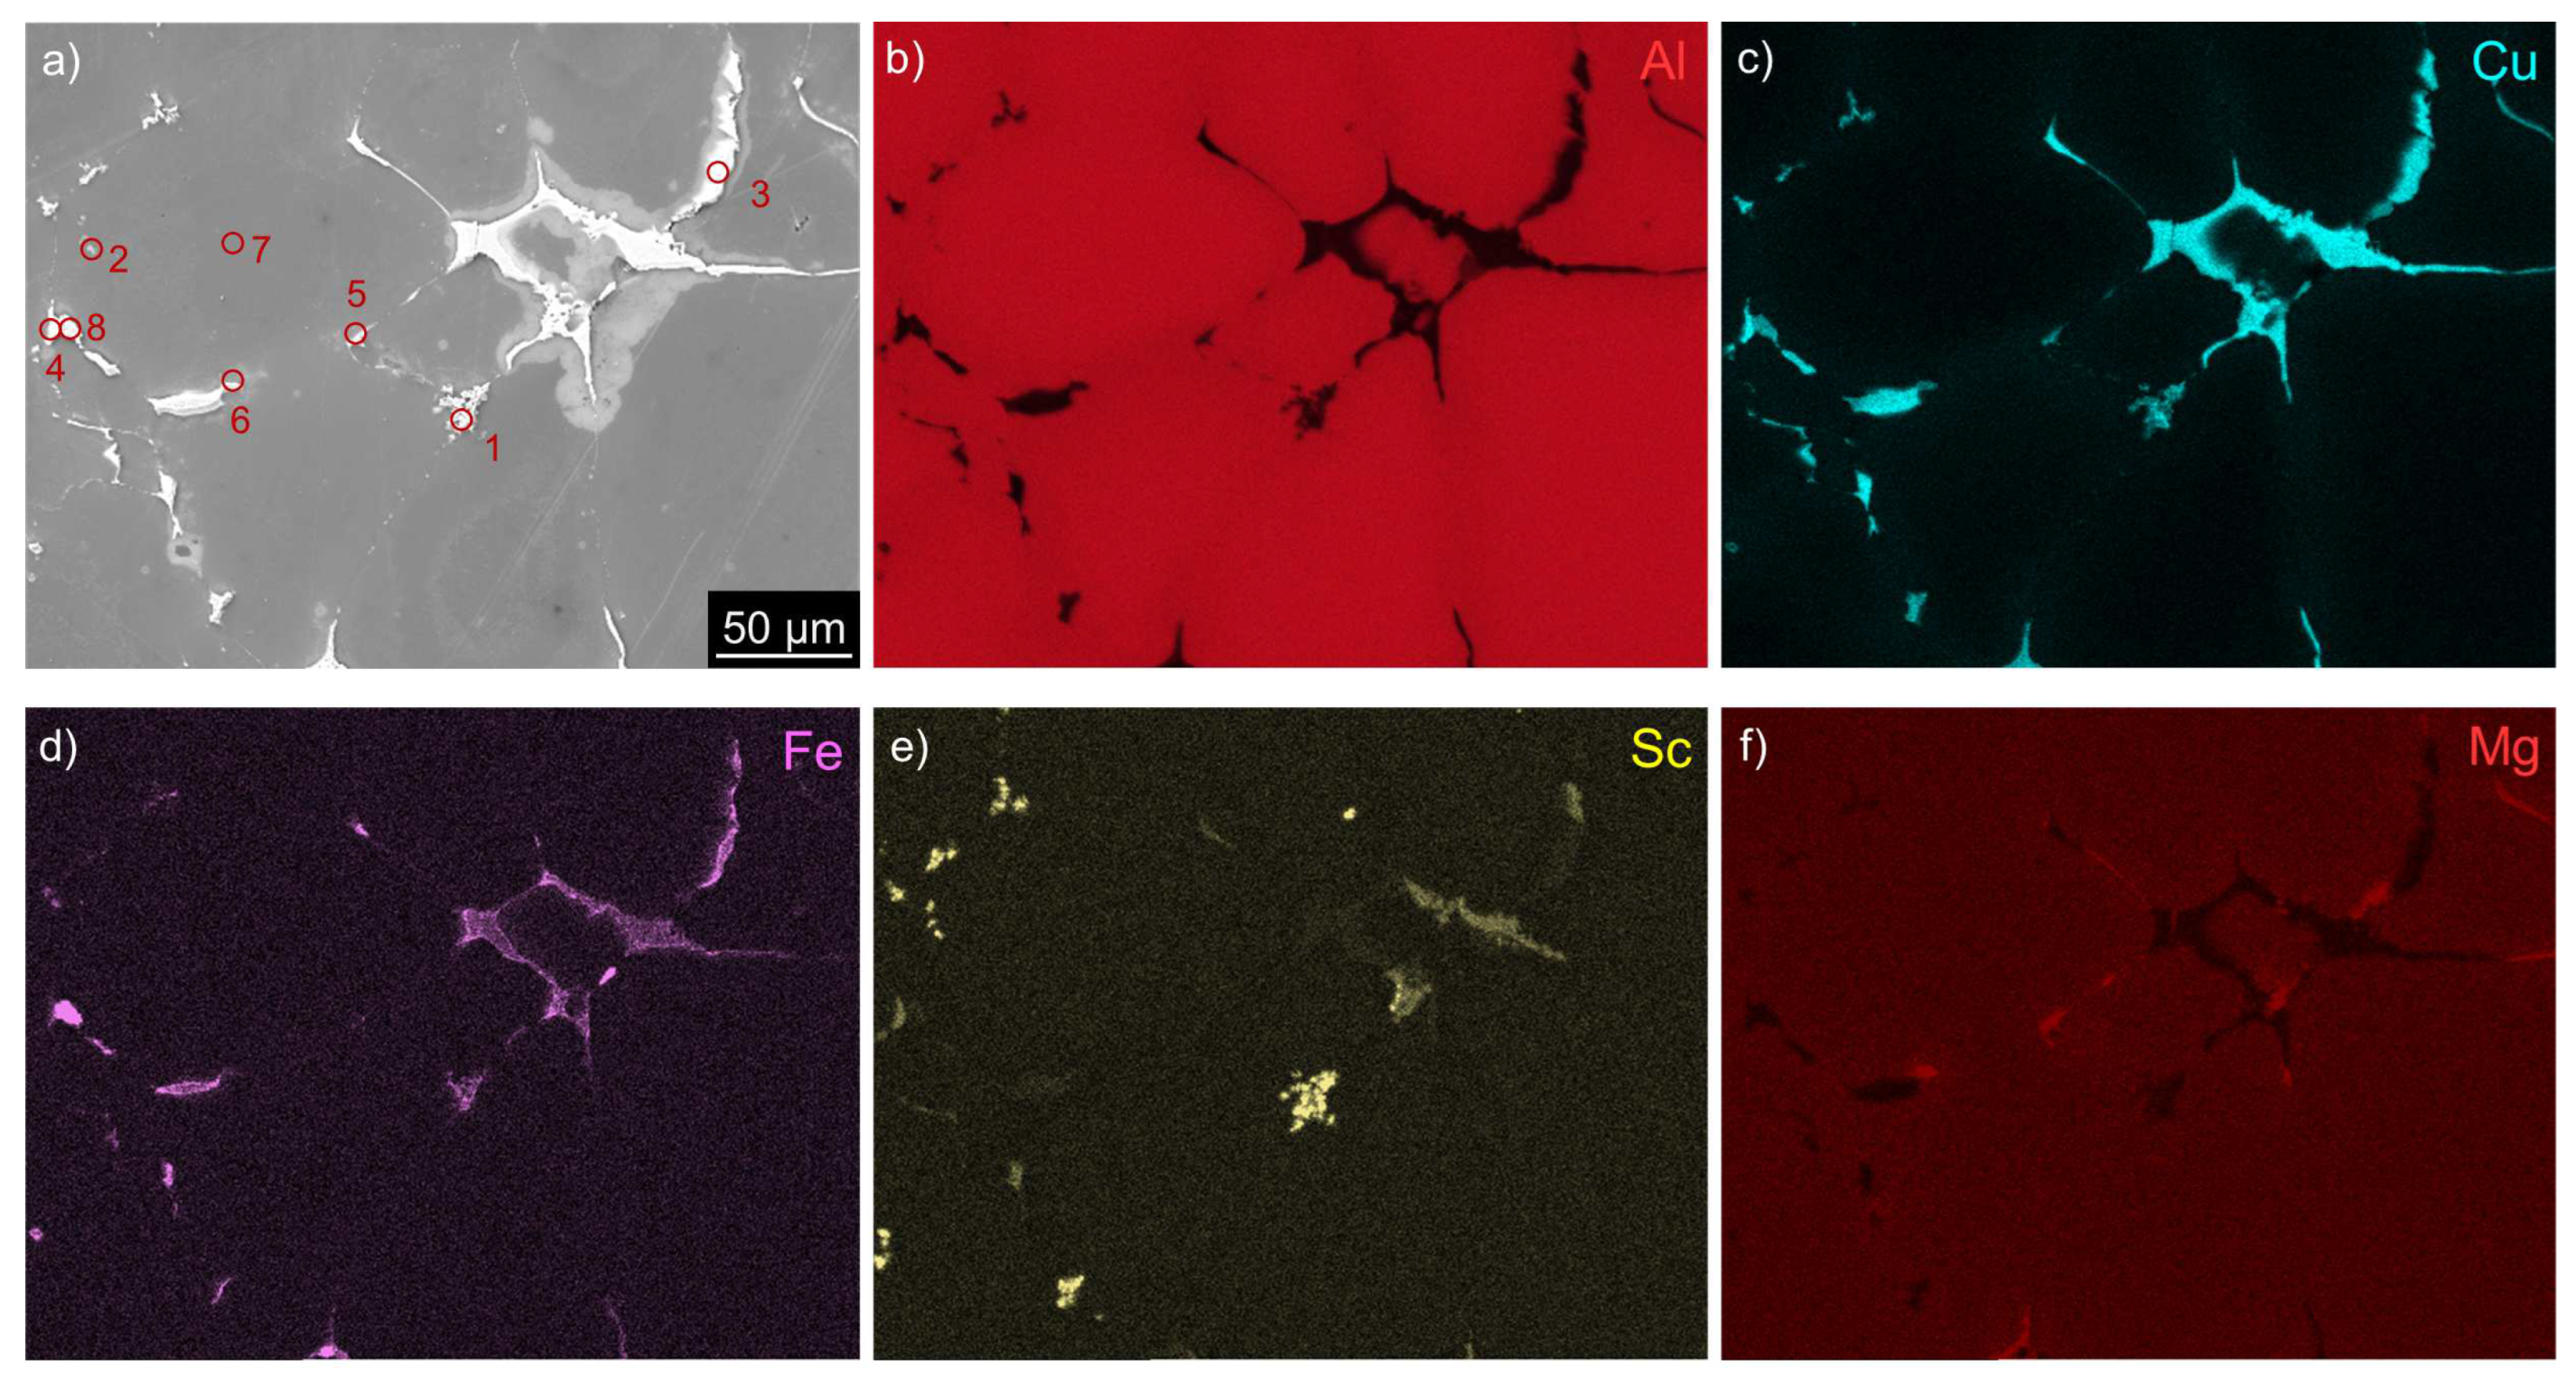








| Al | Cu | Li | Mg | Zr | Sc | Ag | Fe | Ti | V | other | |
|---|---|---|---|---|---|---|---|---|---|---|---|
| AlLi | 95.98(9) | 0.73(6) | 0.28(2) | 0.12(6) | 0.03(4) | 0.24(8) | 0.09(6) | 0.01(1) | 0.01(1) | <0.01 | |
| AlLiSc | 95.79(9) | 0.71(8) | 0.27(2) | 0.11(7) | 0.16(4) | 0.24(7) | 0.10(6) | 0.01(1) | 0.01(1) | <0.01 |
| AlLi MC | AlLiSc MC | AlLi TRC | AlLiSc TRC | |
|---|---|---|---|---|
| L [m] | [135 ± 24] | [111 ± 22] | [12 ± 2] | [13 ± 3] |
| Spot | note | Al | Cu | Mg | Fe | Sc |
|---|---|---|---|---|---|---|
| 1 | Sc-rich | (78 ± 5) | (14.7 ± 0.6) | (1.4 ± 0.2) | (0.9 ± 0.2) | (5.0 ± 0.3) |
| 2 | Sc-rich | (93 ± 5) | (1.1 ± 0.8) | (1.2 ± 0.5) | (0.5 ± 0.4) | (4.2 ± 0.8) |
| 3 | Cu-rich | (75 ± 5) | (22.1 ± 0.6) | (2.0 ± 0.3) | (0.8 ± 0.1) | (0.1 ± 0.1) |
| 4 | Cu-rich | (75 ± 5) | (20.8 ± 0.8) | (2.0 ± 0.3) | (1.1 ± 0.2) | (1.1 ± 0.2) |
| 5 | Mg-rich | (92 ± 4) | (4.0 ± 0.3) | (3.6 ± 0.3) | (0.2 ± 0.1) | (0.2 ± 0.1) |
| 6 | Mg-rich | (85 ± 5) | (8.1 ± 0.5) | (6.3 ± 0.6) | (0.4 ± 0.2) | (0.2 ± 0.1) |
| 7 | matrix | (98 ± 3) | (0.6 ± 0.0) | (1.1 ± 0.1) | (0.0 ± 0.0) | (0.3 ± 0.1) |
| 8 | Fe-Cu-rich | (74 ± 5) | (15.5 ± 0.7) | (1.3 ± 0.3) | (9.0 ± 0.4) | (0.2 ± 0.1) |
| AlLi MC | AlLiSc MC | AlLi TRC | AlLiSc TRC | |
|---|---|---|---|---|
| [m] | [98 ± 3] | [54 ± 5] | [92 ± 15] | [24 ± 3] |
Disclaimer/Publisher’s Note: The statements, opinions and data contained in all publications are solely those of the individual author(s) and contributor(s) and not of MDPI and/or the editor(s). MDPI and/or the editor(s) disclaim responsibility for any injury to people or property resulting from any ideas, methods, instructions or products referred to in the content. |
© 2024 by the authors. Licensee MDPI, Basel, Switzerland. This article is an open access article distributed under the terms and conditions of the Creative Commons Attribution (CC BY) license (http://creativecommons.org/licenses/by/4.0/).


