Preprint
Article

Solid Waste Management Practice and Landfill Suitability the Case of Sendafa Town, Ethiopia

Altmetrics

Downloads

268

Views

120

Comments

0

This version is not peer-reviewed

Submitted:

31 January 2024

Posted:

01 February 2024

You are already at the latest version

Alerts
Abstract
The purpose of this study is to assess the solid waste management status and practice in Sendafa town, Oromia regional state residents. In order to achieve this goal, the researcher intends to employ both primary and secondary data from the Sendafa town municipality. With the aid of multi-cluster sampling and a purposive sampling method, the researchers chose a sample size of 398 people and 10 interview responders. To utilize a systematic sampling technique at intervals of residences, individual samples were chosen. Quantitative data was cleaned and analysed using STATA software. A multiple linear regression model and logistic regression other descriptive statistics methods were then used to change the results. The qualitative data were imported, coded, and thematised using ATLAS.ti.9 in order to prepare respondents' interviews for analysis. The findings indicate that residents' poor solid waste management practices are a result of a lack of awareness, low family income transportation issues, issues with waste collectors, a lack of a sense of responsibility and belonging, and a failure to enforce current solid waste management laws. Solid waste accumulates near roads, bridges, and residential areas that are close to landfills, contaminating the area and leading to diseases like TB and Asthma (and other related health issues in children and adults who live there). Thus, researcher recommends that to have sustainable solid waste management the town administrators should have plan to develop awareness creation symposium or panel of discussion, resolve transportation issues, monitor and guide the routine activities of waste collectors, develop sense of belongingness for themselves and for the community, develop integrated solid waste land fill projects and working with all stakeholders like NGO and health institution will minimize the adverse effect of improper solid waste management. Keywords: Solid Waste, Status of Solid Waste Management, Land fill site suitability
Keywords: 
Subject: Business, Economics and Management  -   Other

1. Introduction

1.1. General Background of the Study

Solid waste management (SWM) is a serious environmental issue that has an immediate impact on both the environment and public health [11]. The global rise in trash production has made effective waste management much more difficult. Municipal solid waste (MSW) generation worldwide is estimated to be 1.3 billion tons per year, with a potential increase to 2.2 billion tons per year by 2025, according to a 2012 World Bank report [9]. The prevailing data demonstrates how dangerous the issue is, which would have consequences related to it that could result from inadequate waste disposal management, such as contamination of surface and groundwater, soil, air, and landscape, transmission of diseases, production of biogas, burning of waste, obstruction of drainage systems, etc [9].
This is a result of the high expenses associated with trash transportation, the complexity of the duties that public employees must do the ambiguous and unfair price structure, and the municipality's limited control over the municipal waste collection service [6].
The main problems and environmental impacts regarding waste management in rural and urban areas arise from administrative and logistical inefficiency. This is due to high waste transportation costs, the multiplicity of tasks of the public officers, unclear and unfair pricing formation, and the municipality's low control over the municipal waste collection service [6].
The financial and technological load on what appear to be weak solid waste systems has increased due to public demand for sustainable SWM, particularly in emerging nations. So, according to [8], the main goal of a solid waste management (SWM) system is to mitigate the negative effects solid waste has on the environment and public health. A challenge encompassing political, social, institutional, and environmental dimensions is known as solid SWM. It has grown to be one of the biggest challenges facing urban areas in developing nations due to exponential urban growth. The disparity in environmental awareness between young and old. Solid waste (SW) is any non-liquid waste produced by individuals, homes, small enterprises, or organizations outside of the trash generated in cities, and the unregulated disposal of SW may have an impact on public health and the environment [6].
Metropolitan SWM, which comprises the collection, transportation, recycling, resource recovery, and disposal of solid waste produced in metropolitan areas, is a complicated process. Different household wastes and wastes produced by various public and commercial institutions, including schools, hospitals, slaughterhouses, and public restrooms, made up municipal solid trash [7].
One of the low-income nations dealing with the effects of poor solid waste management is Ethiopia. About 20 to 30 percent of the rubbish produced in Addis Ababa, the country's capital, often goes uncollected. The town municipality must commit to proper solid waste management, and all stakeholders must be actively involved. Ethiopia is undertaking numerous projects to enhance the sustainability of the environment, especially in the capital city. In Addis Ababa, the community's awareness of solid waste management has increased, and more than seventy percent of citizens are prepared to pay for a door-to-door solid waste collection service, one of the government's initiatives [7].
Although the study area is located closest to Addis Ababa geographically, Sendafa Bake city administration in Oromia regional state does not pay attention as there is no such initiative to popularize the issue of solid waste management practice, and some groups are organized at the town level, organized groups also have no willingness to collect waste by moving here and there to give service because of logistical and financial problems as well. The Sendafa Bake City Administration is the subject of the researcher's investigation into the practice and difficulties of managing residential solid waste.
Statement of the problem
Studding the management of solid waste is crucial for the environment and general welfare. In order to lessen the negative effects of solid waste management, non-liquid waste management is receiving the proper attention with a focus on legislative frameworks. One of the low-income nations dealing with the effects of poor solid waste management is Ethiopia. About 20% to 30% of the waste produced in Addis Ababa alone, the nation's capital, is still uncollected, according to the Addis Ababa report. In order to safeguard the environment and preserve public health, the city established a detective policy [7].
Due to a lack of door-to-door solid waste collection and a lack of awareness about the practice, previous research findings on the state of improper solid waste management reveal that 82.8% of participants have been forced to engage in the practice. Those who practice inappropriate waste management are three times more common than those who have access [7].
However, Sendafa suffers the issue of poor solid waste management techniques, just like many other developing countries town. A large amount of solid trash is produced in Sendafa Bake Town's public and private hospitals, health facilities, businesses, hotels, and small-scale businesses. It also has many higher education institutions, including the Ethiopian Police University. Since no private entity is involved in such duties, the municipality of the town is primarily in charge of managing the town's solid waste. There isn't a designated location for a permanent dump to receive solid trash. As a result, the resident household was compelled to dispose of it in locations near water flow bridges, public walk-street roadways, and degraded landfills, which complicate transportation, and cause pollution. Although inappropriate solid waste management is thought to be the most important Problem in the area, neither a published study nor an empirical one exists that demonstrates the scope of the issue or the causes of wrong solid waste management.
Thus, from previous research we understand that, improper management of solid waste occurs for a variety of reasons, some of which include: first, a lack of commitment by the municipality and active engagement of community members; inappropriate institutional mechanisms or systems; rapid urbanization; and extreme poverty. Low-priority zones include unplanned communities. Second, households' understanding of solid waste management and lack of access to door-to-door solid trash collection, which may have contributed to the reported incorrect solid waste practice [7]. Thirdly, economic activity (socioeconomic situation), family income and spending habits, geographical location, and rigidity of governance for SWM. On the other hand lack of appropriate technology, insufficient financial resources, and a lack of available land, mixed land uses, and the absence of efficient legal tools were indicated [5,6,7].
Even though the previous studies investigates factors affecting solid waste management practice in different region at different time as indicated in other previous research the researcher interested to see causes as they are integrated, and identifies causes relating to improper solid waste management as: i) Household (HHS)-related factors (knowledge about solid waste management, socio-economic activities, active engagement of community members, household income level, and consumption pattern), ii) Institutional-related factors (IF) such as commitment of the municipality, inappropriate institutional mechanisms or systems, rigidity or absence of effective legal instruments (rule, regulation, environmental-related policies), access to service, technology, and inadequate financial resources. iii) Geographically related factors (land scarcity, mixed land users, low-priority areas like unplanned settlement) are identified as contributing factors for improper solid waste management in the study area, particularly Sendafa, Ethiopia.
Previous research studies such as Gorfnesh use descriptive, chi_square, and binary regression f or analysis to identify potential SWM factors using SPSS, and the researchers only focus on factors r elated to households rather than assessing reasons for improper solid waste management.Based on this gap, the current study used Statistical software to examine the relationship between dependent and explanatory variable.For this study's cross_sectional study design, the researcher employs both descript ve(mean test, chi2, and frequency) and econometric multiple regression models sequentially [7].

1.2. Objective of the Study

General objective
To examine the status and practice of improper solid waste management and existing landfill suitability in Sendafa Bake town.
Specific objectives
  • To evaluate existing landfill suitability of practicing proper solid waste management.
  • To assess well known solid waste types which are taken for final disposal by households to landfill site.
  • To investigate the current status and practice of solid waste management.

1.3. Research Questions

To what extent was the exiting landfill suitable to practice proper solid waste management?
What are major solid waste types which were taken for final disposal to landfill site?
What were the current status and practice of solid waste management?

1.4. Significance of the Study

Even though there were published empirical study has been presented on the topic, studies indicated miss the integration of causes of in depth way regarding the long-term impacts of improper solid waste management on the environment and public health. Based on the results of the findings presented by the researcher this study fills knowledge gaps for environmental managers and planners, as well as other related public and private stockholders. If the municipality and other stakeholders who are have willing to support the researcher financially, this should ultimately come up with such a society project design.

1.5. Scope of the Study

Different levels of management would have been involved in the study, including lower-level community leaders, household heads who reside in the city, specialists from environmental protection planners and managers, and private and public institutions (such as health centre and academic institutions) that are affected by improper solid waste management. The study aims to evaluate the prevalence and usage of incorrect solid waste management, as well as the driving forces behind such practices in HHS and other private and public entities. This study was carried out 39 kilometres east of Addis Ababa in a tiny city with a dense population. The Sendafa Bareh district city administration, which was chosen for this study, is located in the North Shewa zone, which includes this municipality.

2. Review of Literature

2.1. Theoretical and conceptual definition of solid waste Management

Solid waste management is the process of removing waste products from the environment in order to make the environment clean, secure, and appealing. SWM is described as the full cycle of waste generation, collection, transportation, storage at transfer stations, street sweeping, disposal, waste recovery, and reuse [10].
Almost all municipalities on all continents now face a severe difficulty with solid waste management. The most obvious types of environmental contamination are solid wastes [13]. Solid waste (SW) is any non-liquid waste produced by individuals, homes, small enterprises, or organizations outside of the trash produced in cities, and the unregulated disposal of SW may have an impact on public health and the environment [6].

2.2. Theoretical Review

There is a distinct difference between using the word "theory" in the scientific arena and in ordinary life. In common parlance, 'theory' is opposed to 'practice.' The word "theory" connotes a state of uncertainty. Because their truth is not definite, propositions are often referred to as theories. The philosophical link between theory and practice is quite different. To observe or contemplate was the original meaning of the word "theory."
Scientific study yields scientific laws and theories, whereas engineering design yields buildings, machines, systems, and so on are supposed to perform in accordance with the goals for which they were created. According to Niiniluoto, current scientific research has progressed in such a way that the number of technical applications of science has expanded but theories themselves have become increasingly abstract, reaching beyond everyday experiences. The majority of those who have written and continue to write about theories and cognitive reasoning come from the empirical sciences or philosophy of science. However, new scientific specialties arose from formerly practical fields— consider the middle Ages, when the procedures that distinguished the expert from the novice in the crafts trades became guild secret [15].
According to Hiriya, the functional aspects of municipal solid waste are as follows:
1)
Waste generation: Waste generation refers to activities in which resources are identified as no longer valuable and are either discarded or gathered for disposal.
2)
Waste handling and separation, storage, and processing at the source: Waste handling and separation are the operations related with the management of waste until it is placed in a storage container for collection. Handling also includes transporting loaded containers to the place of pickup. Waste component separation is a key stage in the treatment and storage of solid waste at the source.
3)
Collection: The functional part of collection involves not only the collection of solid waste and recyclable products, but also the conveyance of these materials to the area where the collection vehicle is emptied after collection. This site could be a material processing facility, a transfer station, or a landfill.
4)
Solid waste separation, processing, and transformation: New methods and facilities for recovering waste materials separated at the source include curbside pickup, drop-off, and buy-back centers. Separation and processing of wastes segregated at the source, as well as separation of commingled wastes, typically take place in materials recovery facilities, transfer stations, combustion facilities, and disposal sites.
5)
Transfer and transportation: This aspect consists of two steps: 1) moving garbage from the smaller collection vehicle to the larger transport equipment 2) the following transportation of wastes, typically across large distances, to a processing or disposal facility.
6)
Disposal: Today, the ultimate fate of all solid wastes is landfilling or land spreading, whether they are residential wastes collected and transported directly to a landfill site, residual materials from materials recovery facilities (MRFs), residue from solid waste combustion, compost, or other substances [17].

2.2.1. Significance of definition of Evolving Theory

When the efficiency of such principles is verified by scientific methods and explained by scientific ideas, a new science is established. Constructing Waste Management Theory (WMT) is an endeavor to scientific waste management. WMT is a conceptual explanation of waste management that includes definitions of all waste-related terms and a waste management methodology. It is an attempt to arrange the various factors of the current waste management system. WMT is founded on the concept that how we characterize an objective prescribes how we act on it, so that sustainable waste management is heavily dependent on how waste is defined. Every term in a scientific theory or discipline of science should be thoroughly defined. The most obvious and appropriate approach of characterizing a scientific topic is definition. Definitions are provided to state or describe the established meaning(s) of a term that is already in use. Descriptive definitions are what they are called: Definiendum has the same meaning as definiens in descriptive definition [15].

2.2.2. Moving toward the waste management Theory

As with any new theory, one should begin by defining the breadth of the theory and the core of its principles. Waste management must be planned under specific parameters, with the possibilities often pre-specified. It is envisaged that the knowledge provided by waste management theory will significantly contribute to accomplishing the waste management goals of resource conservation and environmental preservation. Thus, the practical values of Waste Management Theory include [15]:
Giving conceptual responses by describing waste and concepts.
Providing guidance for selecting garbage disposal choices.
Providing a foundation for selecting and integrating waste management strategies.
Forecasting the results of waste management actions.
Aiding legislation in prescribing waste-related action.

2.3. Approaches of Solid Waste Management

2.3.1. Convectional Approaches to Planning for Solid Waste Management of Urban Environment

This method places all responsibility for handling solid waste on the municipal council. They transport the garbage to the disposal locations after collecting it from sources in the communities, the Central Business District (CBD), industries, and institutions [10]. According to this study, a conventional Method can serve as a guide for the majority of urban planning and management activities. According to Halla, developed countries' processes of conventional ways have successfully handled these issues, and many instances of such triumphs are noteworthy in the United States of America, the United Kingdom, Germany, and the rest of Europe. In many sub-Saharan African nations, SWM has challenges due to the customary approach. For instance, poor solid waste management results in land, water, and air pollution, which not only environmental Degradation but also public health [10].

2.3.2. Alternative Approaches to Planning of SWM of the Urban Environment

In order to overcome challenges with solid waste management systems, many countries encourage public or private partnerships. It is suggested that community groups form organizations to deal with issues like solid waste management. Independent contractors may also be participants. Local governments or the relevant municipal agencies are primarily in charge of providing solid waste management as it is a public service.
To develop a comprehensive, uniform SWM system at the municipal and regional levels, it is crucial that local authorities continue to be in charge of this work [10].

2.4. Empirical Review

Because of family income greatly influences peoples' consumption behaviours, solid waste creation has a strong and positive link with the family income level [13]. Another way to put it is that effective solid waste management and collection require the municipality's commitment and the participation of the community, [7,8,9,10]
The significance of solid waste management in each community can be influenced by a variety of economic activities and physical geographies [5]. They provide a significant challenge in guaranteeing sustainability with regard to solid waste management due to their small size, geographic remoteness, and tourism-based economy. Addressing these, they also cite the rigidity of solid waste management governance as a problem.
The absence of appropriate institutional procedures to fully handle the issue is one of the reasons why solid waste management is so poorly done in the majority of developing nations. This is due to the fact that urban areas have been unable to offer basic collection and disposal services, which has led to a variety of environmental and social issues. This is also related to rapid urbanization, extreme poverty, and limited managerial capability at the municipal level. Uncollected solid trash is a challenge that has led to inadequate sanitation and a poor quality of life, especially in low-priority regions like unplanned communities [10].

2.4.1. The Global Solid Waste Management Perspective

Lower-income, lower-middle-income, higher-middle-income, and high-income income earning groups collectively generate over 1.3 billion tons of solid garbage annually, or roughly 1.2 kilograms per person per day, in the world's cities. By the year 2025, it is anticipated that garbage generation will reach 2.2 billion tons annually. These studies demonstrate that Organization for Economic Cooperation and Development (OECD) countries and North America produce the majority of the world's waste. As money significantly impacts people's spending patterns, it is hypothesized that solid waste creation has a strong and positive link with family income level. Additional factors that make managing solid waste challenging include a lack of suitable technologies, inadequate financial resources, scarcity of land, mixed land uses, and the absence of effective legal instruments. Based on this understanding, the generation of solid waste by different income-earning countries (i.e., high- income, upper-middle-income, lower-middle-income, and lower-income-earning countries) has also been part of the investigation. As a result, industrialized and higher-income nations have high garbage collection efficiency, while the majority of low- and lower-middle-income nations have lesser efficiency. Data from the literature indicates that the efficiency of garbage collection varies from 46% in the African region (AFR) to 98% in OECD countries. Everyone can understand from these that solid waste management techniques require the attention of the international community [9,10,11,12,13].

2.4.2. Status of Solid Waste Management in Ethiopia

The improvement of human health, the preservation of the environment, and sustainable development all depend on the general public having access to dependable solid waste services [1]. Ethiopia is one of the low-income nations now suffering from improper solid waste management. According to reports, between 20 and 30 percent of the waste produced in Addis Ababa, the country's capital goes uncollected. The dedication of the town municipality and the active participation of the community are necessary for proper solid waste management. In Ethiopia, there are numerous projects being undertaken to enhance environmental health, particularly in the capital city. More than 70% of community members in Addis Ababa were willing to pay for a door-to-door solid waste collection service, which is one of the government's initiatives, indicating that the community's understanding of solid waste management has increased [7].
In developing nations like Ethiopia, a considerable proportion of solid waste is still being handled, thereby harming both human health and the environment. It has been established that the SWM equivalent dilemma is also a concern in higher education in Ethiopia [3]
The appropriateness of existing landfills is a problem for solid waste management because of various considerations. If a site satisfies all the standards or criteria, such as being 488 meters from streams, 794 meters from a dwelling, and 499 meters from road networks, it is deemed suitable for the location of solid waste disposal. Moreover, the geography and soil type of the site must be acceptable. If a site satisfies the aforementioned specifications but has a slope of more than 32%, it is deemed unacceptable.
Bea asserts that the soil's permeability and porosity regulate both the vertical and horizontal transport of contaminants. Leachate from the location should be greatly slowed down by the soil's limited permeability. Sites in clay-rich settings are therefore preferred [2].

2.5. Summary Implication of Reviews

According to the literature, there are a number of factors that contribute to improper solid waste management, including: first, a lack of commitment on the part of the municipality and community members; second, unsuitable institutional mechanisms or systems; third, rapid urbanization; and fourth, extreme poverty. Mtey and Gorfnesh both identify low-priority locations, such as unauthorized settlements [7,8,9,10]. Second, homes' understanding of solid waste management and lack of access to door-to-door solid trash collection are other causes mentioned by Gorfnesh and her pals that may have contributed to the reported incorrect solid waste practice. Third, economic activity (socioeconomic condition), family income and consumption pattern, geographic location, and rigidity of governance for SWM. Lack of appropriate technology, insufficient financial resources, lack of available land, mixed land uses, and the absence of efficient legal tools are causes for improper solid waste management [5,6,7,8,9,10,11,12,13]. For the purposes of this study, the researcher categorizes causes into two groups: institutional factors (IF) and household factors (HHS) (commitment of the municipality, inappropriate institutional mechanisms or systems rigidity or absence of effective legal instrument (rule, regulation,
Based on the aforementioned evaluations, the researcher created a conceptual framework and a graphic to display the contributing factors for inappropriate solidification.

2.6. Conceptual Framework of the Study
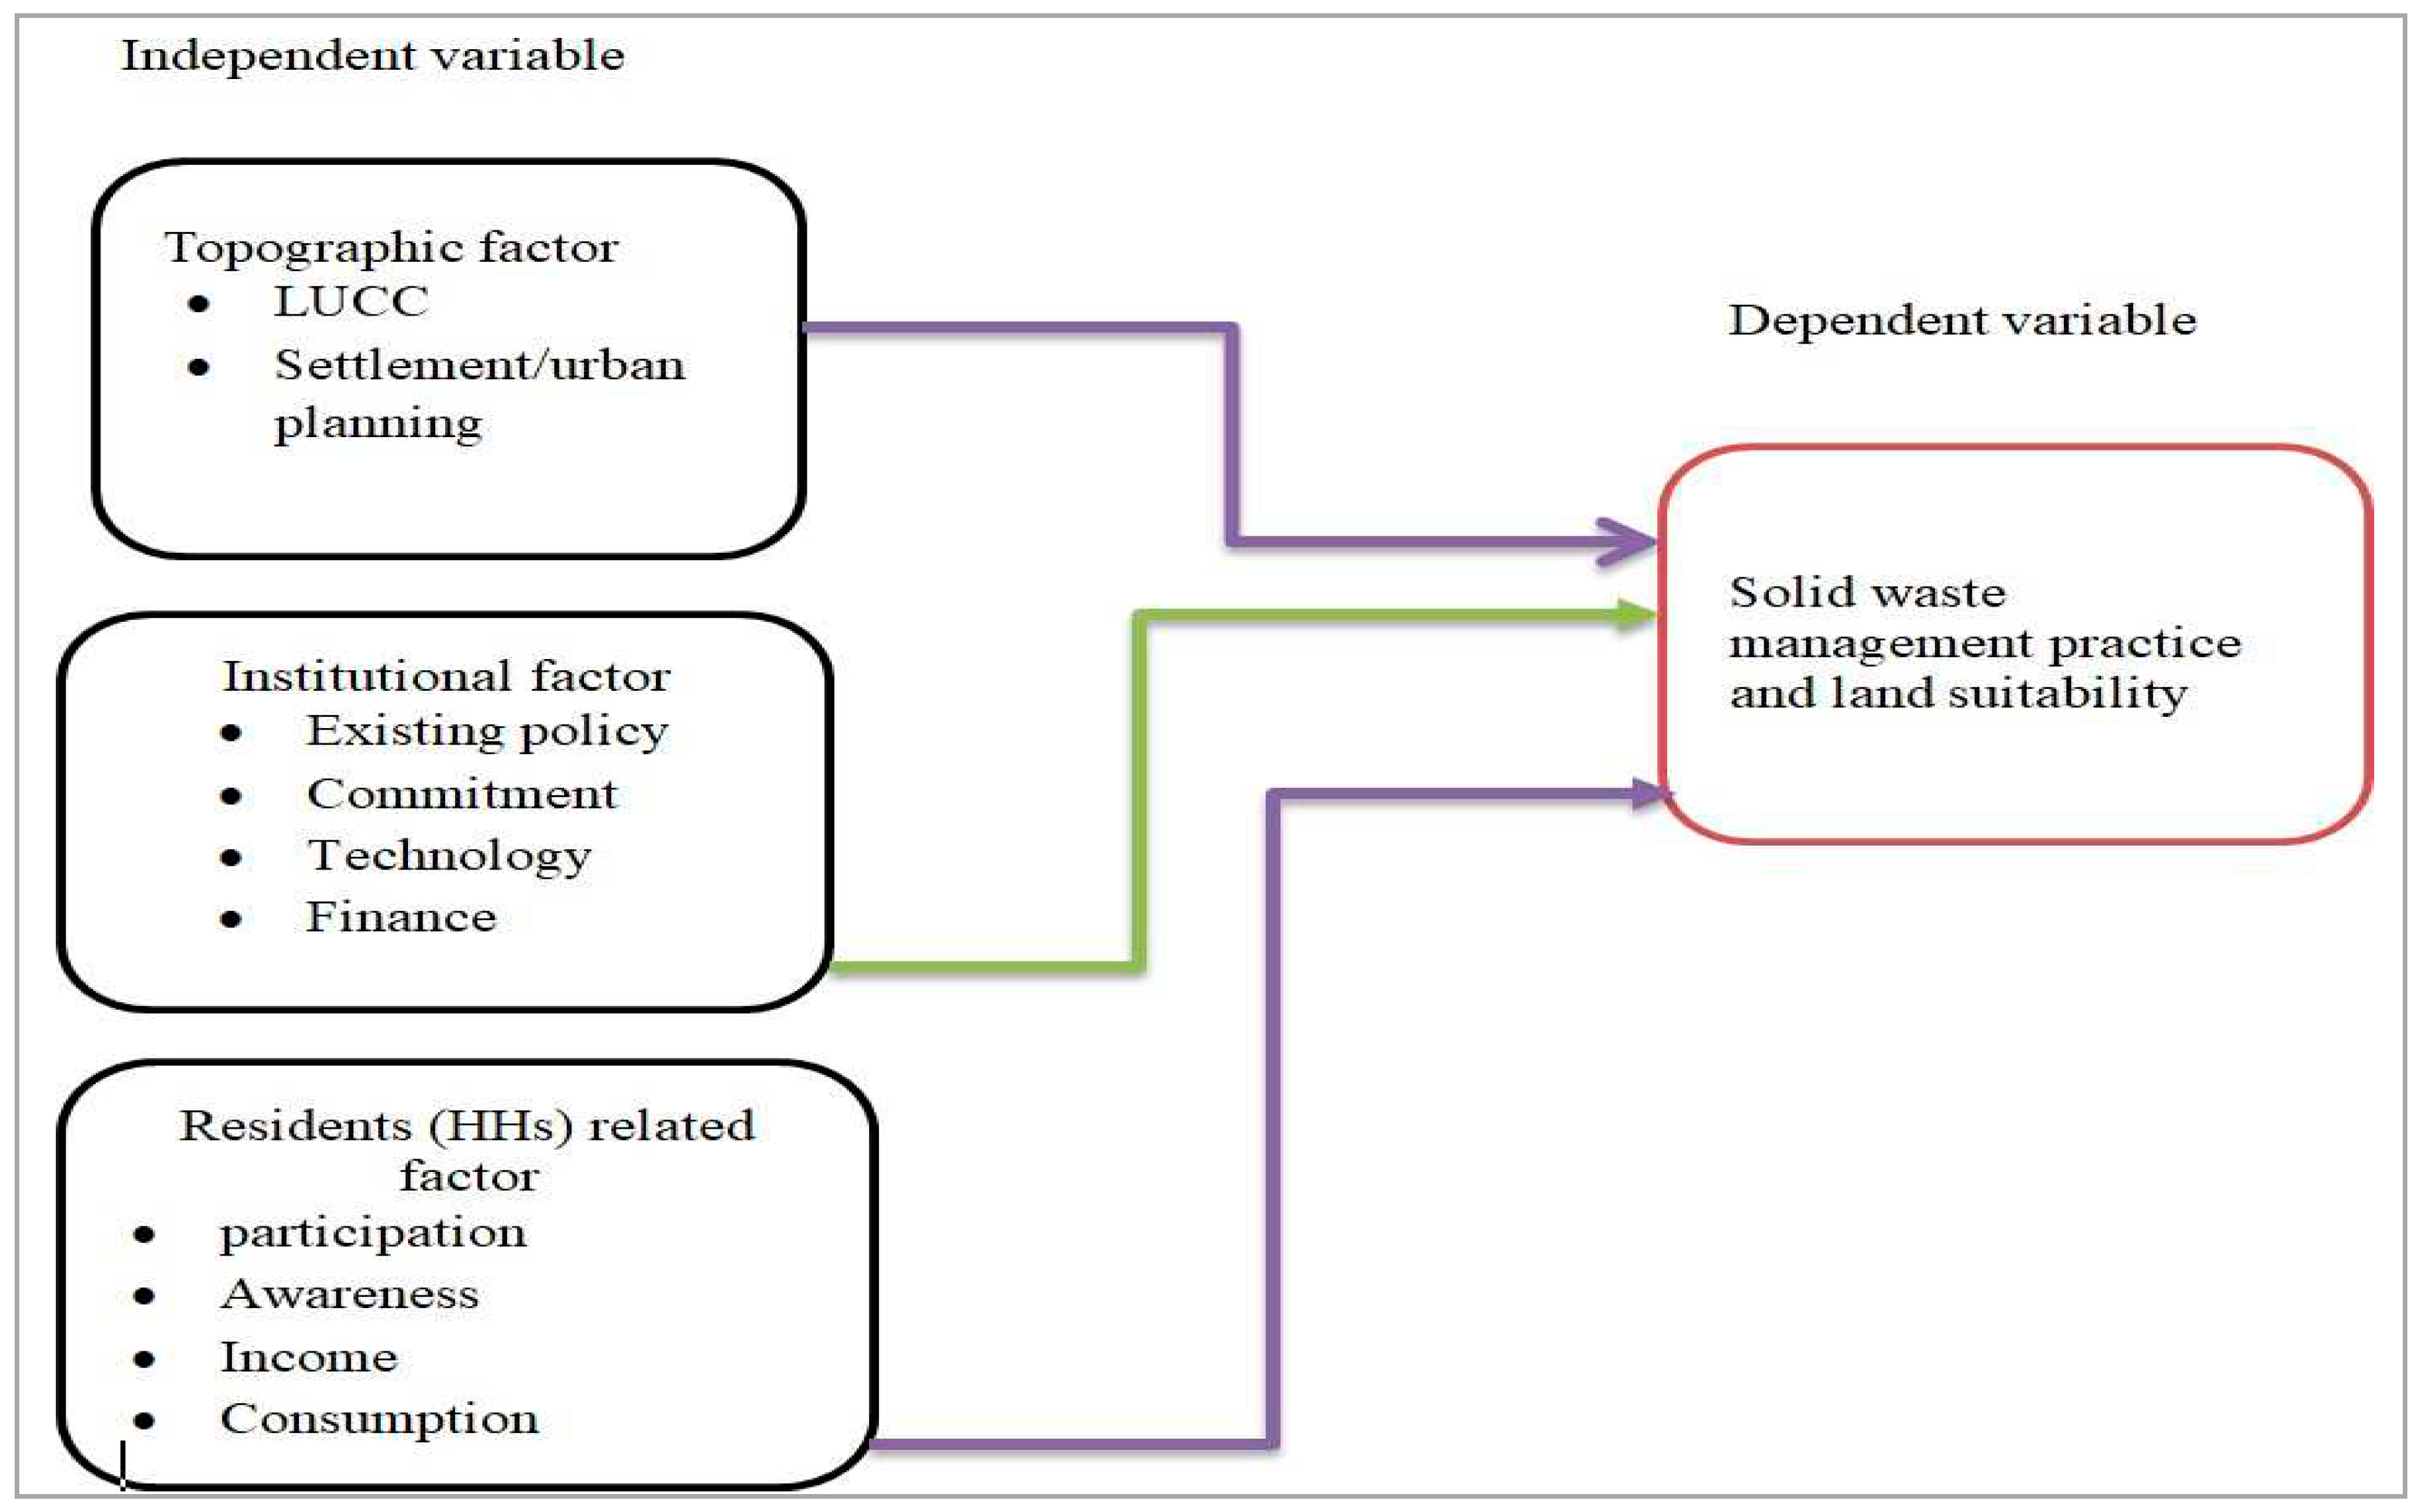
Figure 1. Conceptual frame work developed by researcher. Source: Researcher own sketch (2023).
Preprints 97832 g001

3. Research Methodology

3.1. Study Area Description
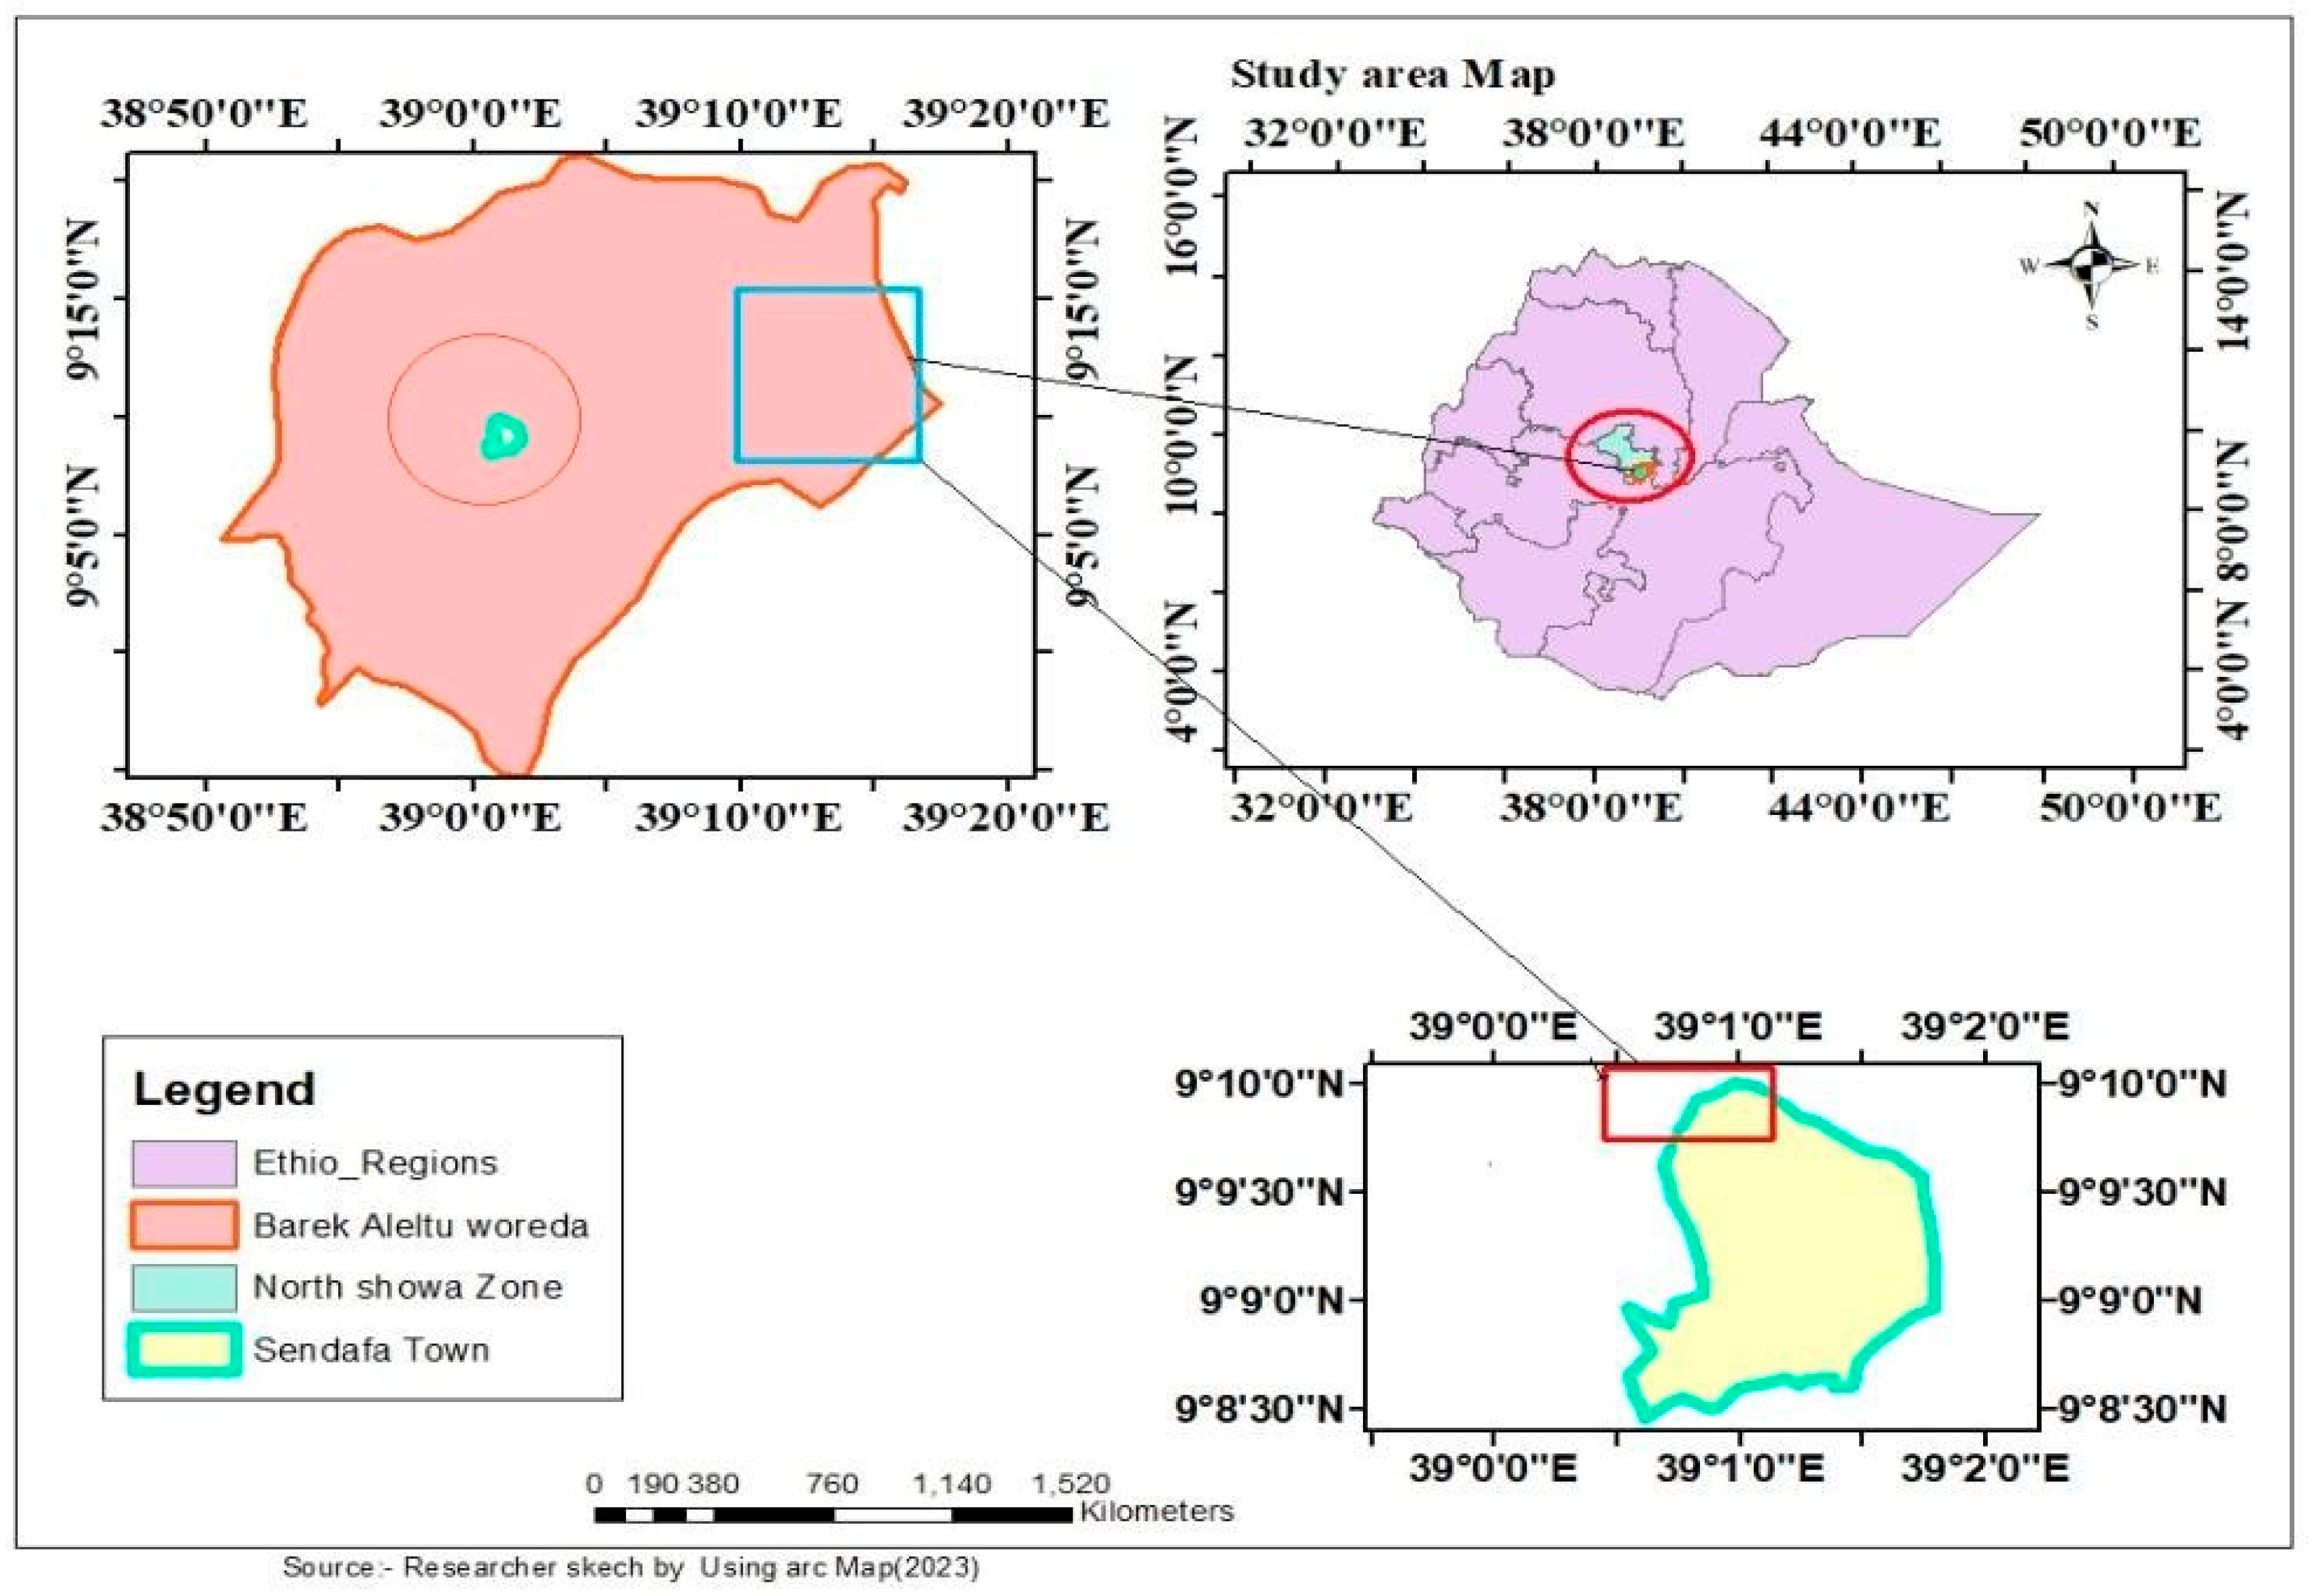
According to the Sendafa city administration report (2022), the city was founded in 1945 and lies 39 kilometers to the east of Addis Ababa. The Afaan Oromo word for grass, “Sandafee”, is the source of the name Sendafa. The study area is roughly located in North Shewa, Oromia, Ethiopia. Its latitude and longitude are 90 9' 0'' N and 390 2' 00'' This location, which is between 2500 and 3000 meters above sea level, is covered with a flat ground surface. The Degas (cool to humid) climatic type is characteristic of the district's agro-ecological zone. In this part of the country, the daily high and low temperatures range from 25 degrees Celsius. 8,471.54 hectares are included in the District Landscape.
Figure 2. Study area Map.
Preprints 97832 g002

3.2. Research Design

For the success of this research, the researcher selected an explanatory research design by using quantitative and qualitative data because of its appropriateness and freedom from bias. The researcher collects quantitative data primarily to measure quantitatively expressed values and identifies gaps to support them with qualitative data. Qualitative data is used when researchers need a better understanding of the problem.

3.3. Research Approach

The researcher uses a mixed research approach, which has been sequential, such that Quantitative and qualitative research approaches are used. The quantitative research approach is the numerical method of quantifying and describing observations of materials or characteristics, while the qualitative approach used to explore the attitude, behavior, and experiences of individuals or groups by using interviews.

3.4. Population of the Study Area

A population is a group of individuals, objects, or items from which samples are taken for measurement [12]. According to 2023 city administration report shows, the population condition of this area is slightly densely populated; this means that for every km2, 16 households are occupied. The total number of residents is male at 48,502 and female 52,172, for a total of 10, 0674 populations found in the Sendafa Bake Town City Administration based on recent clusters. Among these, 43,000 residents were Households. Based on this information, the researcher selected the target population of this study from government employees who are directly or indirectly responsible for illegal solid waste management and are currently working in higher layers of city administration and management, lower-level community leaders, and experts from environmental protection planners and managers, private and public institutions (health and academic institutions), and from the community’s resident Household heads who are exposed to improper solid waste management.

3.5. Sampling Methods and Sampling Frame Work
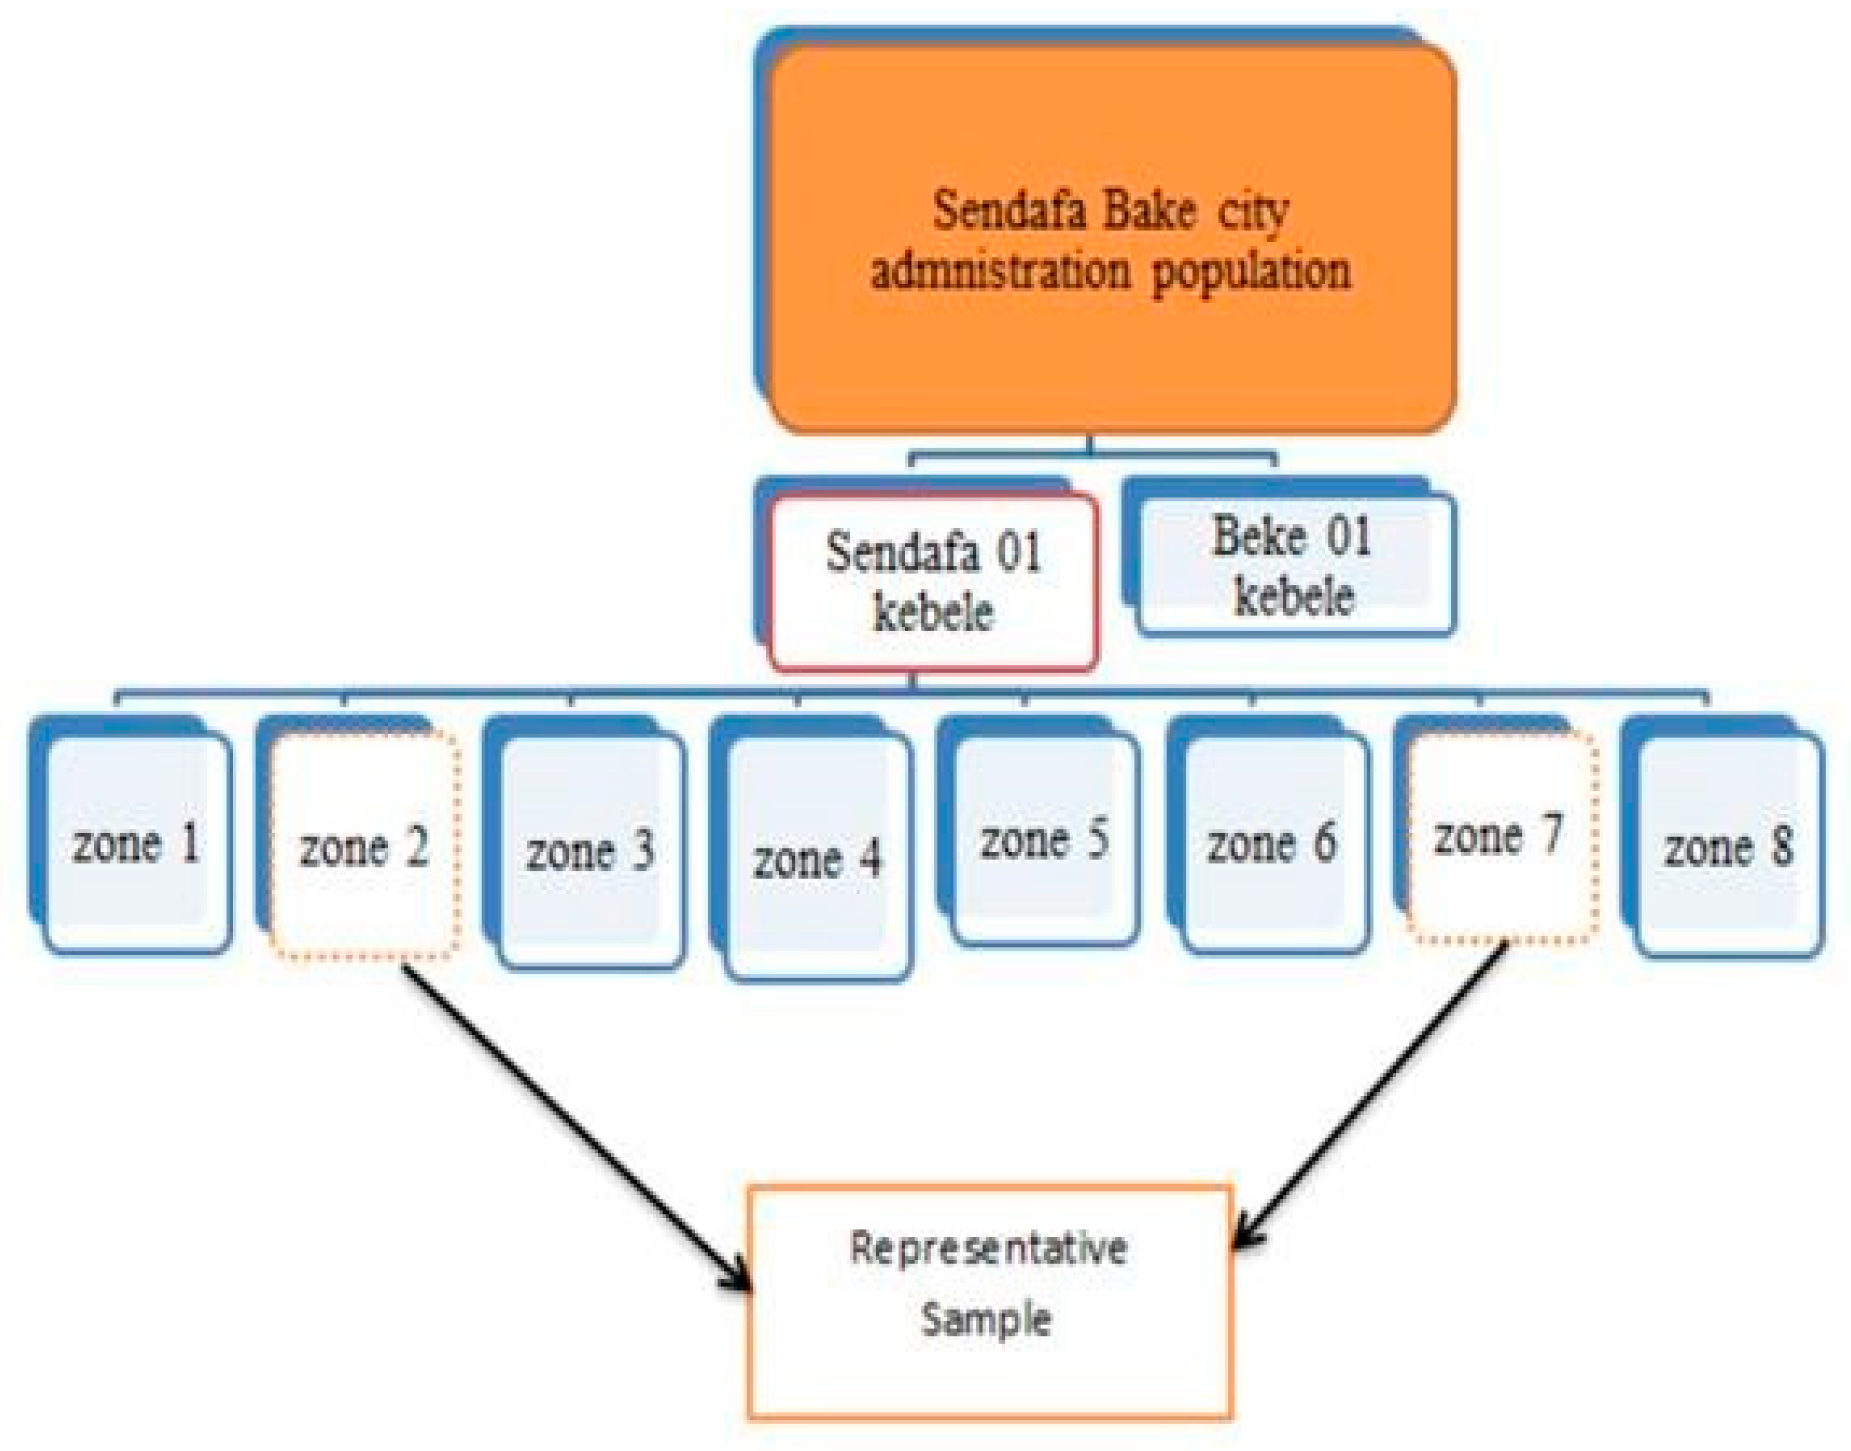
In order to enhance the validity and reliability of the findings of the study, taking the optimum level of sample size and designing an appropriate sampling technique needed spatial consideration. In order to obtain more accurate information and reduce bias, both probability and non-probability sample techniques will be selected.
Thus, researchers using purposive and multi-cluster sampling would divide the total population into clusters by using woreda, kebele, and zone, representing it as the local name "gooxii" used as per of blocks. Systematic sampling is also used by dividing the population size (N) by the sample size (n) to obtain the range (k), where the steps will be:
Step 1: Obtain a range value based on the sample needed.
Step 2. Select a random number to select the first participant's HHS. Step 3. Take a sample based on the range obtained.
Figure 3. Representative sample selection flow diagram.
Preprints 97832 g003
The population's active list, from which the researchers are going to select a sample, is referred to as the sampling frame. Thus, in order to draw a sample, you must be aware of the population's size as well as how many of those individuals belong to any potential interest subgroups. The names of the households residing in Sendafa Bake Kebele were used as a sample frame in this study.
Sample size Determination:
The sample size can be calculated in a variety of ways. Small populations can be counted via a census, sample sizes from related research can be imitated, available tables can be used, and sample size can be calculated using formulas. These factors have made Taro Yamane's formula, a simpler formula for proportion, famous among academics. In order to calculate the necessary sample size at the 95% confidence level and the acceptable margin of error at 0.05% for this study, Yamane presented a simplified formula. From the entire population of each sector, the precise data for the chosen sample size were derived [18].
Where N =population size
e =margin of Error
n= sample size
Given N=10, 0674
n = 10 , 0674 / 1 + 10 , 0674 ( 0.05 ) 2 = 398

3.6. Sources of Data and Data Collection Method

3.6.1. Sources of Data

To reach valuable findings and ensure the soundness and strength of the research, this study employed both primary and secondary data sources. Primary data were used from open and close ended questioner prepared by researcher. Secondary data sources such as written document reports were taken from districts administration office.

3.6.2. Data Collection Methods

This research uses the following types of data collection methods: field observation, structured, and semi-structured questionnaires. The researcher would select households, private and public institution workers, and semi-structured interviews [for municipality administrators, local area leaders, environmental planners, key informants, waste collectors, and manager experts] that are purposefully selected. Questioners will consider the previous literature and related studies.

3.7. Methods of Data Analysis

The data collected in the field will be cleaned and prepared for analysis. The data collected through questionnaires and interviews will be processed through computer-based software for editing, coding, coding, and coding, then categorized and organized by theme according to their conceptual similarity. Both the quantitative and qualitative data were analyzed and then described or narrated based on the methods best suited to their nature. Quantitative data generated from the questionnaire were analyzed. Researchers will use descriptive statistics (family size, family income, access to solid waste collection services and communal bins (shared containers), willingness to pay for improved solid waste service, collection frequency, and the household’s solid waste disposal methods) and chi2 (status of solid waste management with other variables) and regression analyses using an econometric model, i.e., a multiple linear regression model (to measure land suitability as a dependent variable and another as an explanatory variable).
Landfill suitability is analyzed by using GIS software to decide on buffering from the main road, residents' homes, etc.
For this purpose, researchers use STATA software for quantitative data, GIS (Arc Map) to build geo-referenced data with Google Earth, and ATLAS. TI.9 was used for qualitative data processing. The results of the findings were presented using tables, figures, graphs, percentages, and pie charts.

3.7.1. Landfills Suitability Analysis by Using GIS

In order to manage the massive spatial data sets that come from primary and secondary sources, GIS technology was used to conduct the suitable site selection study, according to Parvathi Nathan. In the search for the ideal location for trash disposal, numerous strategies were used. The majority of these methods mainly rely on mathematical concepts and optimization methods. Site selection combines all pertinent elements of the issue because it is a potential solution.
The broad structure [2], in order to evaluate the viability of existing dumpsites and choose appropriate landfill sites, these considerations include slope, soil type, distance from major roads, distance from residence, and streams or rivers.

3.7.2. Model Specification

Econometric analysis: The researcher uses one of the econometric analysis tools, such as multiple linear regression models, when the dependent variable is continuous and has more than two values. Logistic regression and multiple linear regression (MLR) models would have been used consecutively to see the relationship of an independent and dependent variable. The formula used is stated as:
Multiple linear regression (MLR)
ŷi=β01xi12 xi2+…+βp xip+ϵ.
Where, for i=n observations:
ŷi = dependent variable
Xi = explanatory variables
β0 = y-intercept (constant term)
βp = slope coefficients for each explanatory variable
ϵ = the model’s error term (also known as the residuals) [16]
Logistic regression equation:
ŷi=β01xi12xi2+…+βpxip
Where y-hat, or ŷi is the total of the regression terms. The linear predictor, or xb, is the sum of the regression terms. Each x is a word that represents the value of a predictor, x, and its coefficient, β. ŷi is the predicted value of the regression model as well as the linear predictor in linear regression, which is based in matrix form on the Gaussian or normal probability distribution? The number i denote the number of predictors in a model. The anticipated or fitted values of the model have a linear connection with the terms on the right-hand side of Equation 2 — the linear predictor ŷ= xb. In the case of logistic regression, this is not the case [14].
Descriptive analysis: The researcher uses descriptive analysis to summarize and see correlations among variables. Chi2 and tabulation (mean test) will be used to put data values in percentage and frequency by using tables, graphs, and pie charts.

3.8. Variable Description

Dependent or explained variables:
These variables are those that are impacted by independent variables. Thus, the researcher selects the following variable as a dependent variable based on the level of interest household heads have in participating in solid waste management:
Landfill suitability for practicing proper solid waste management: This variable is selected because of researcher’s interest to see whether landfill site is suitable or not for households to have proper solid waste management.
Status of solid waste types: These are to asses’ type of solid waste will be used by household heads which helps the researcher to know whether solid types will be Biodegradable, un-degradable and non-recyclable, and recyclable.
Households practicing improper solid waste management: This is to see the reasons why household heads will practice improper solid waste management. (Solid waste taken to land fill site, around bride, on space and around road).
Household income (HhI): income has significant and positive influence on willingness to pay for improved sanitation service. This concept is also works for improved solid waste management [1]. Therefore, researcher will have interested to see the concurrent effect of income on willingness of payment for solid waste management service in Sendafa Bake Town. This variable is continuous variable representing monthly income of household heads in Ethiopian birr.
Explanatory variable: Researcher give due consideration for explanatory (demographic) variable to evaluate their impacts on dependent variable.
The following variables have been considered for analysis:
Age of Household (AHhs): According to [1], younger peoples are much more concerned about and have more interest to support the conservation of natural resource and environment than older one. On the other hand, willingness to pay for improvement of solid waste is strongly and negatively influenced by age of household head.
Household size (HhFs): it is expected that Number of family size, measured by number of person in family, directly associated with willingness to pay for improvement of solid waste management service.
Gender of household head: Gender of household heads is often factors considered to consider behavior with regard to conservation of natural resource and environmental quality. As existing studies shows Females are pro-environmental behavior than male [1]. In this case, researcher went to identify existing difference between male and female household head have more interest to pay for improved solid waste management.
Education of household head (EDUC): Education is an instrument through which citizens gain knowledge about their socioeconomic and environmental impacts of their daily decision. Economic theory state that education plays role to enable economic agent to make better decision. Education promotes pro-environmental decision and contributes investment on environmental quality [1]. For this fact researcher want to see the relation between years of schooling and willingness to pay for proper and improved solid waste management.
Ownership of refrigerator (Wealth condition): As previous study shows it is expected that wealth is important to give care for environment. Refrigerator, it is an indicator of wealth and has positive influence on household head willingness to pay for waste. This variable is dummy variable for value if HHs has refrigerator 1 and 0 other wise.
Animal farming (AF): whether households rears cattle initiate to influence farmers to willingly pay for waste or not. This variable will be assigned by two values, 1 if households involved in animal husbandry and 0 otherwise.
Household tenure (HhT): according to lall, households who will own dwelling units are more likely to participate in community based urban service provision program than those who does not have [1]. As they notes house owners are reduced risk and they capitalize initiation by neighbors. Using this, researcher will be anticipated to see the relationship between house owners and willingness to pay for improvement of solid waste management.
Duration of stay in house (DsHuose): it will expected that duration or number of years /months/days of stay at house has positive influence in willingness to pay for solid waste management.
Road distance (RD): as study indicates that poor road which are inaccessible for collection of waste are major reasons for waste collectors. This means the amount of waste is high in areas of poor quality of road. This may associated with the settlement condition of Sendafa bake town. This variable is measured in terms of walking distance per minute to main road and also supported by GIS data by using computer based software. Landfill suitability measurement in relation to road, soil and settlement will be used values like suitable, less suitable, moderately suitable, very suitable and not suitable.
Institutional frame works: as researcher has identified from literatures, challenges for solid waste management is related to implementation of existing environmental protection policies, managers commitment and source of Finance. This variable used to test reasons for improper waste management by households by interrelating existing Landfill.

3.9. Validity and Reliability

A complete measurement must fulfil the tests of validity and reliability; validity is the most important that suggests the degree to which an instrument measures what it is has supposed to measure [4]. To ensure this, the study’s researchers have to test validity of the instrument’s content appropriateness and the measurement’s scale. For this Cronbach’s alpha will be used to test the validity of the questioner by taking 30 respondents from the existing population randomly for the pilot test to ensure data reliability level.
Cronbach’s alpha reliability coefficient normally ranges between 0 and 1. George and Mallery, verify that Cronbach’s alpha i.e. α > 0.9 – Excellent, α > 0.8 – Good, α > 0.7 – Acceptable, α > 0.6 – Questionable, α > 0.5 – Poor, and α < 0.5 – Unacceptable. The closer Cronbach’s alpha is to one/1, the greater the internal consistency of the items in the scale [18].

3.10. Ethical Consideration

The research provided chances for voluntary participation by respondents and full description of the study has been given for those who have willingness to participate before they decide to participate. The questioner survey will give anonymous power to carefully analyses each question thus research participants will not be ordered to write their names information they has to provide to managed with full of security during recording it for data process if the doubt. Personal information will be managed in secret since, the information provided is as per of organizations mission, vision and goal. The study was conducted in a straight forward manner and all the data that is analyzed is reported in the study.

4. Results and Discussion

To prepare data for interpretation researcher use Cronbach’s alpha coefficient reliability test to check the internal data before of using each data variable for this research study. Thus, the Cronbach’s alpha value shows that most of the data label used had score α > 0.7 – which is Acceptable, and shows better to proceed to collect data as prepared questioner for this research. During data collection researcher use primary data gathered from respondent’s response for questioner and interview made with respective leaders, HHs and related experts. The total amount of respondents participated to provide information on prepared research question was 398 and 10 persons at woreda administration level; kebele level leaders have been participated for interview on status and practice of solid waste management.

4.1. Response Rate

The response rate is the percentage of the number of responses received divided by the number of surveys sent out multiplied by one hundred. The total number of participants for whom the survey was sent was 398, and those who returned the response were likewise the same. As a result, the response rate for this study was 100%, with no missing data. Descriptive findings were reported in the form of frequency and percentage, and regression results were interpreted in the form of explanatory variable coefficient interpretation pertaining to response outcome.

4.2. Demographic Information of Respondents
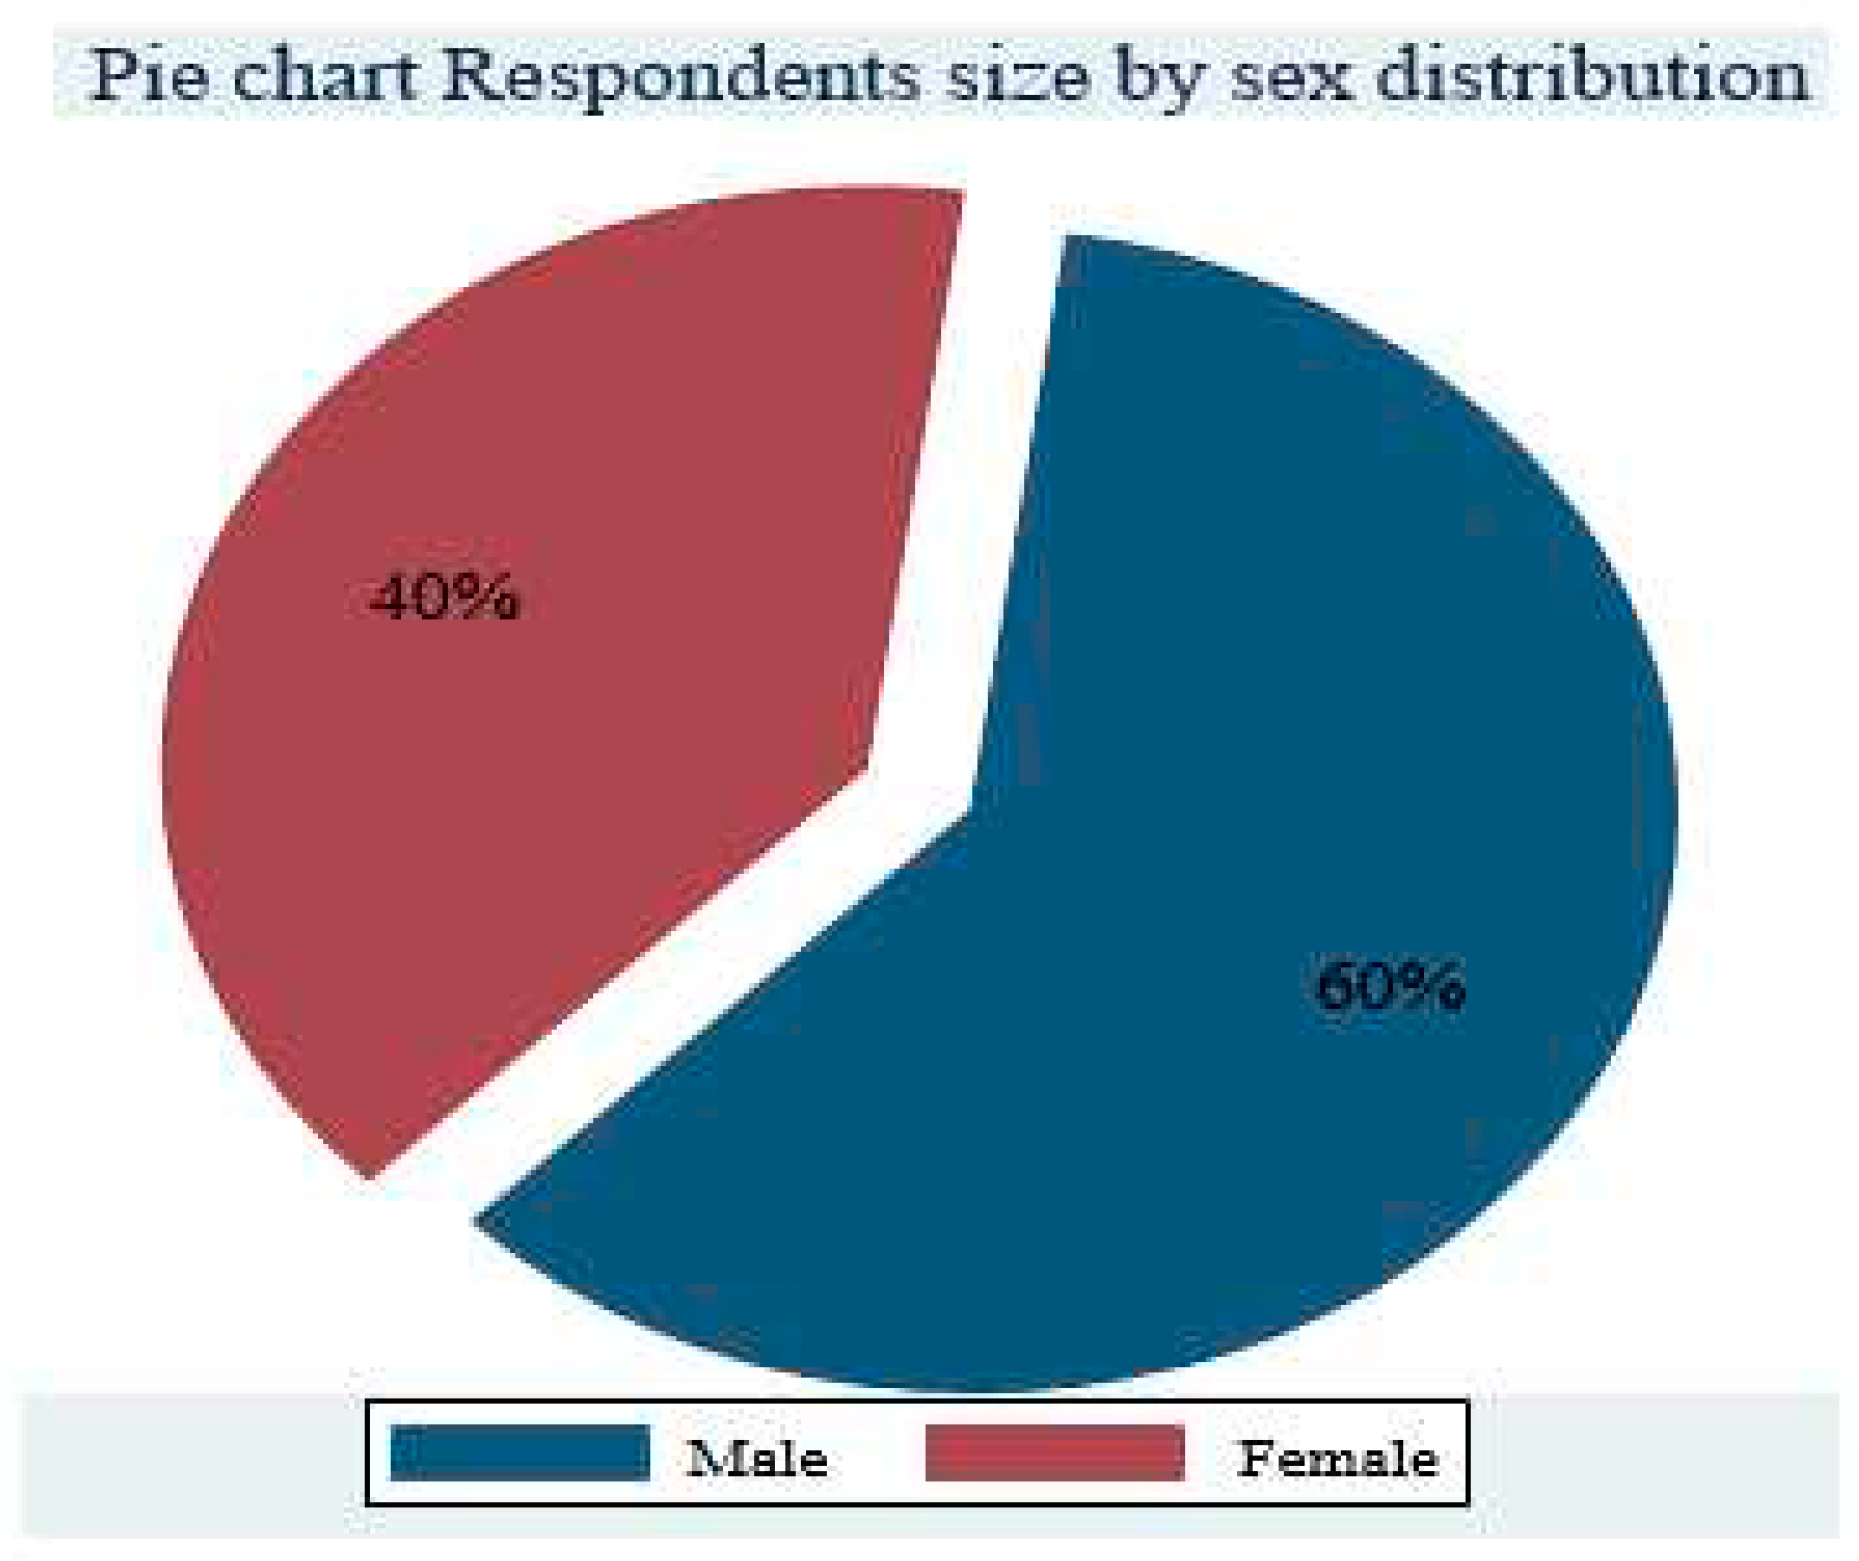
The above table shows that among the total amount of respondents who participate in questioner male 60% (240) and female 40% (158) have been participated to provide information on status and practice of solid waste management (SWM) in Sendafa town.
Figure 4. Pie chart result on Respondents response on sex distribution. Source: survey (2023) own computation.
Preprints 97832 g004

4.2.1. Respondents Family Size

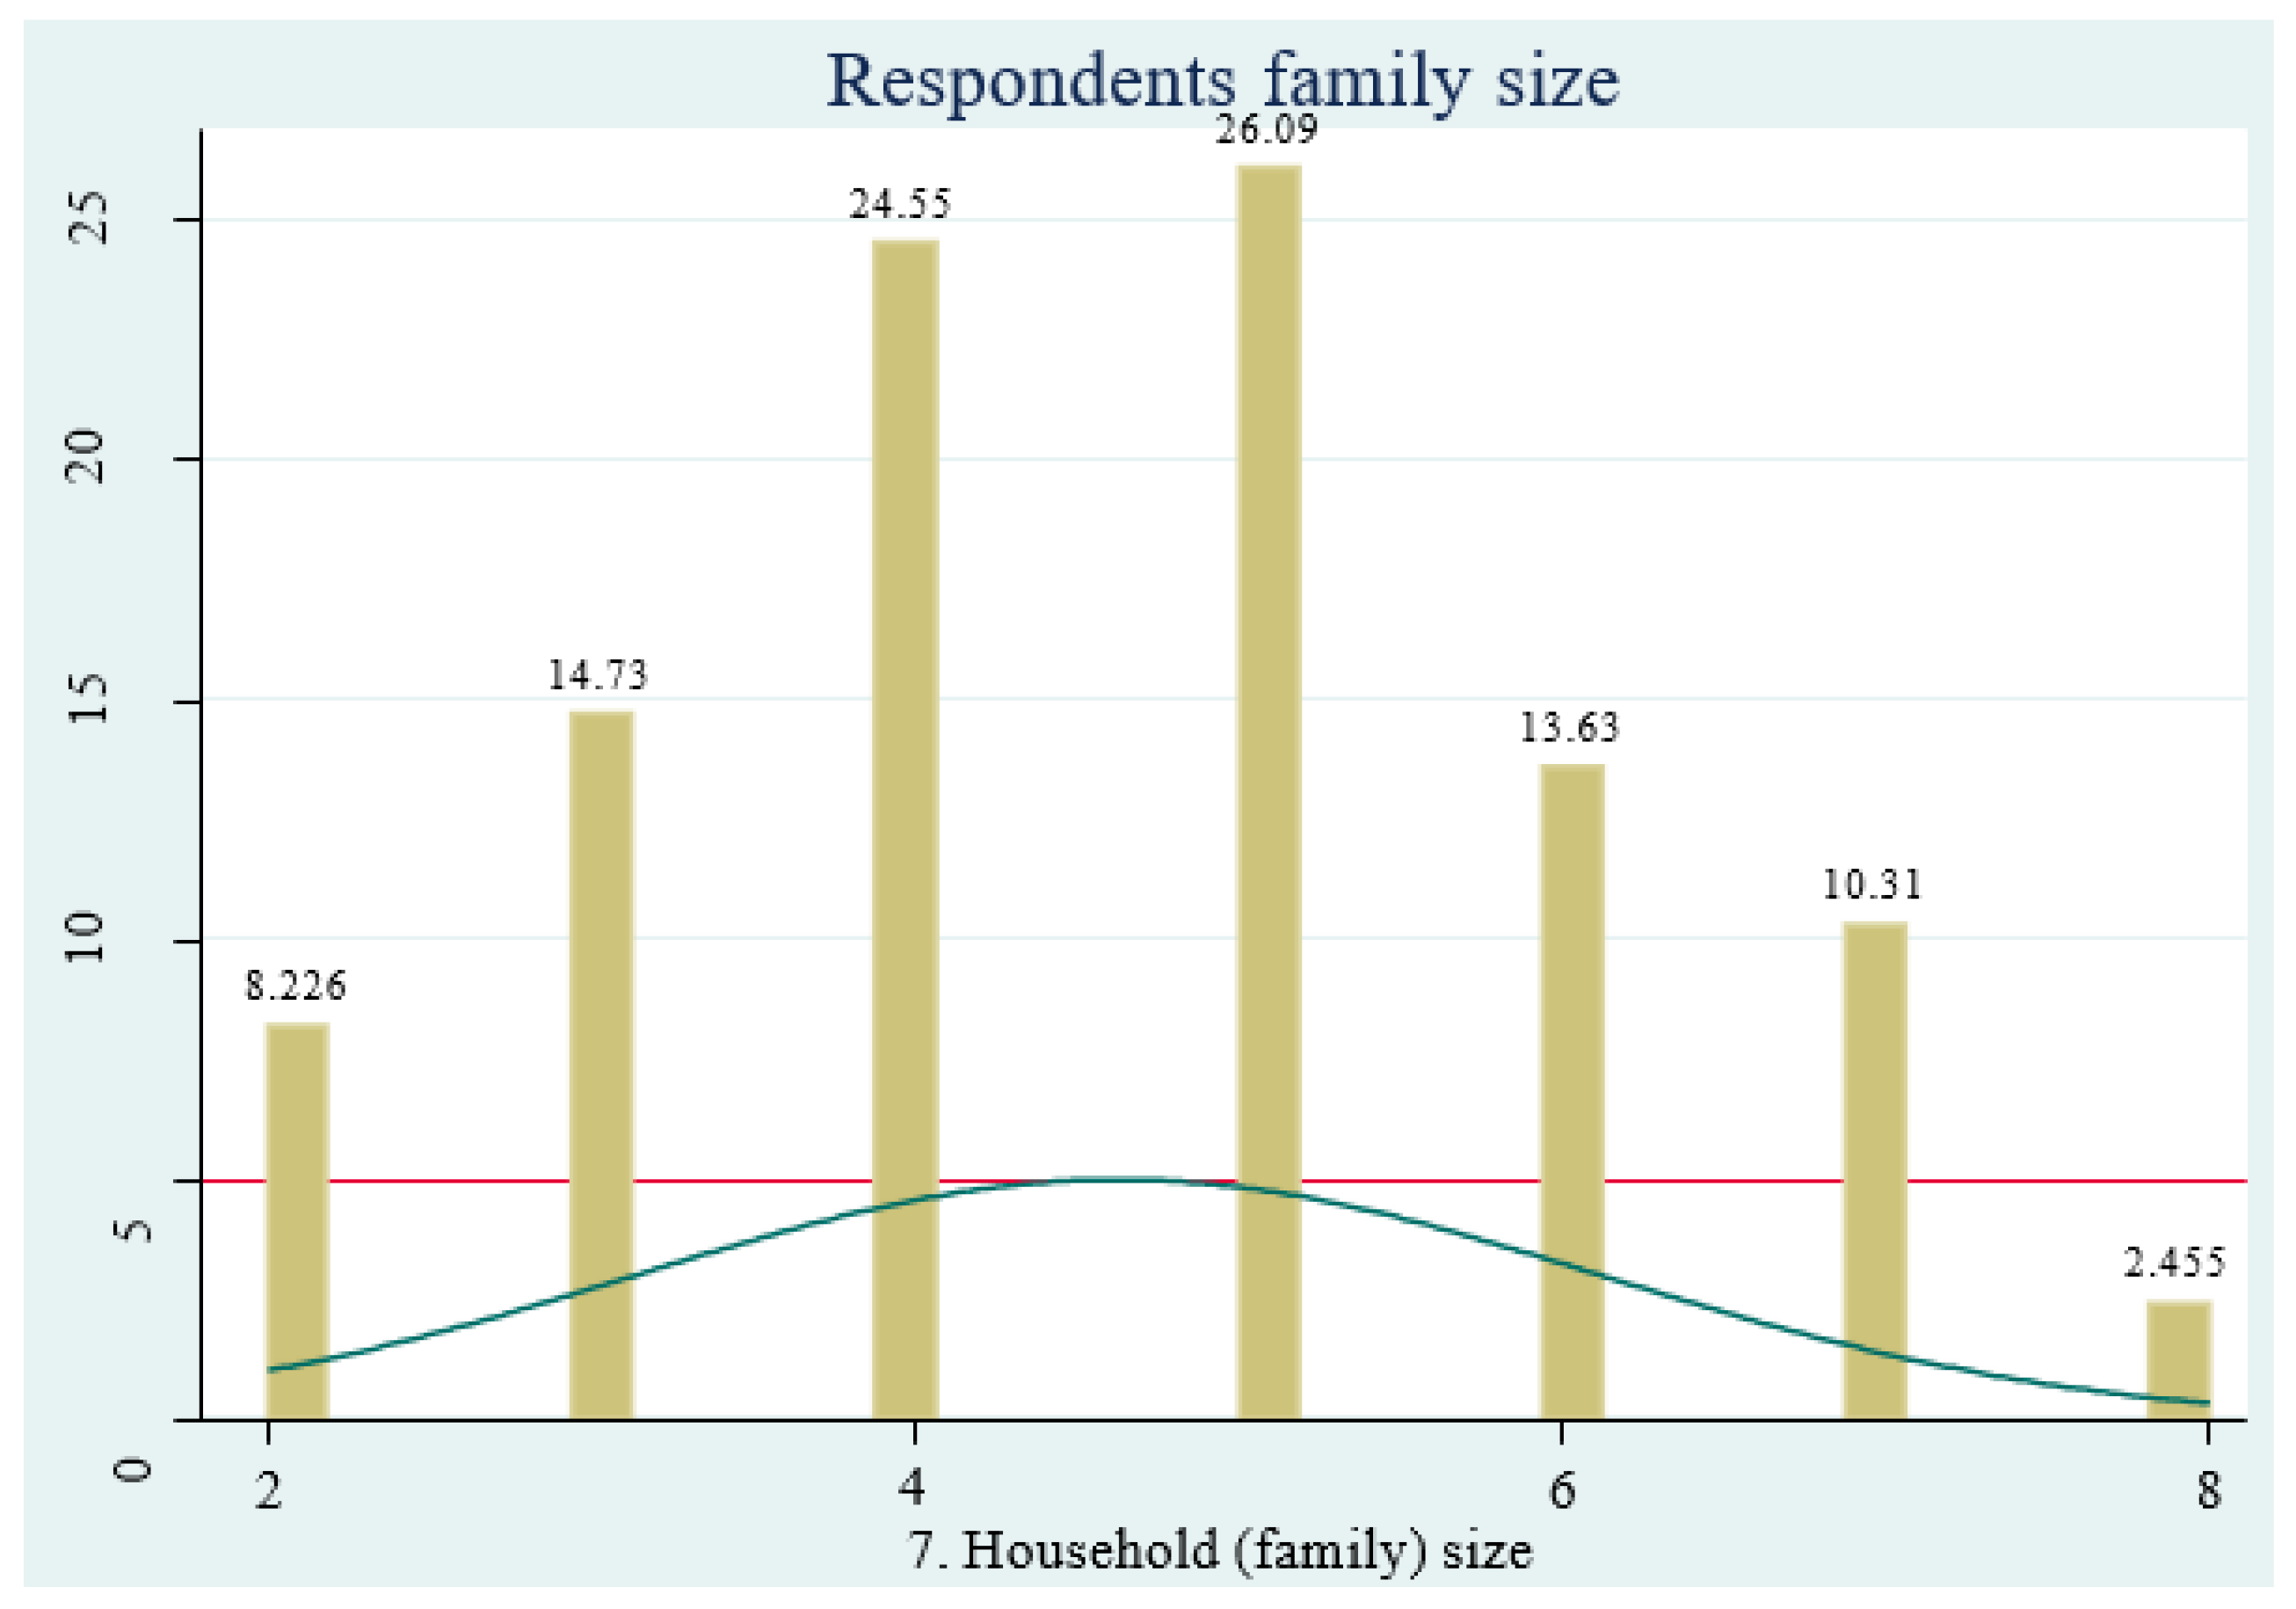
The above graph shows that the largest family size of respondent response shows majority of them has above five families which accounts 26% and the smallest number of respondents who stated their family size number Eight (8) shares 2.45% of total respondents. From above figure we understand that high family size indicate high consumption level.
Figure 5. Respondents family size by graph. Source: - survey (2023) own computation.
Preprints 97832 g005

4.2.2. Respondents Response on HHs Solid Waste Service Payment Has Relation with Income

Table 1. Respondents Response on solid waste payment relation with income.
solid waste payment and
Income

Freq.

Percent

Cum.
yes 154 38.69 38.69
No 244 61.31 100.00
Total 398 100.00
Source: Survey (2023) own computation.
The above table shows that 38.69 % (154) of respondents response shows the payment they made for solid waste collector can much with their monthly income they incur. The others 62.31% (244) respondents response shows that the payment the pay for solid waste collector was not much with their income. Thus, it indicates how monthly income had an impact on household’s solid waste management.

4.2.3. Status of Solid Waste Management and Housing Ownership
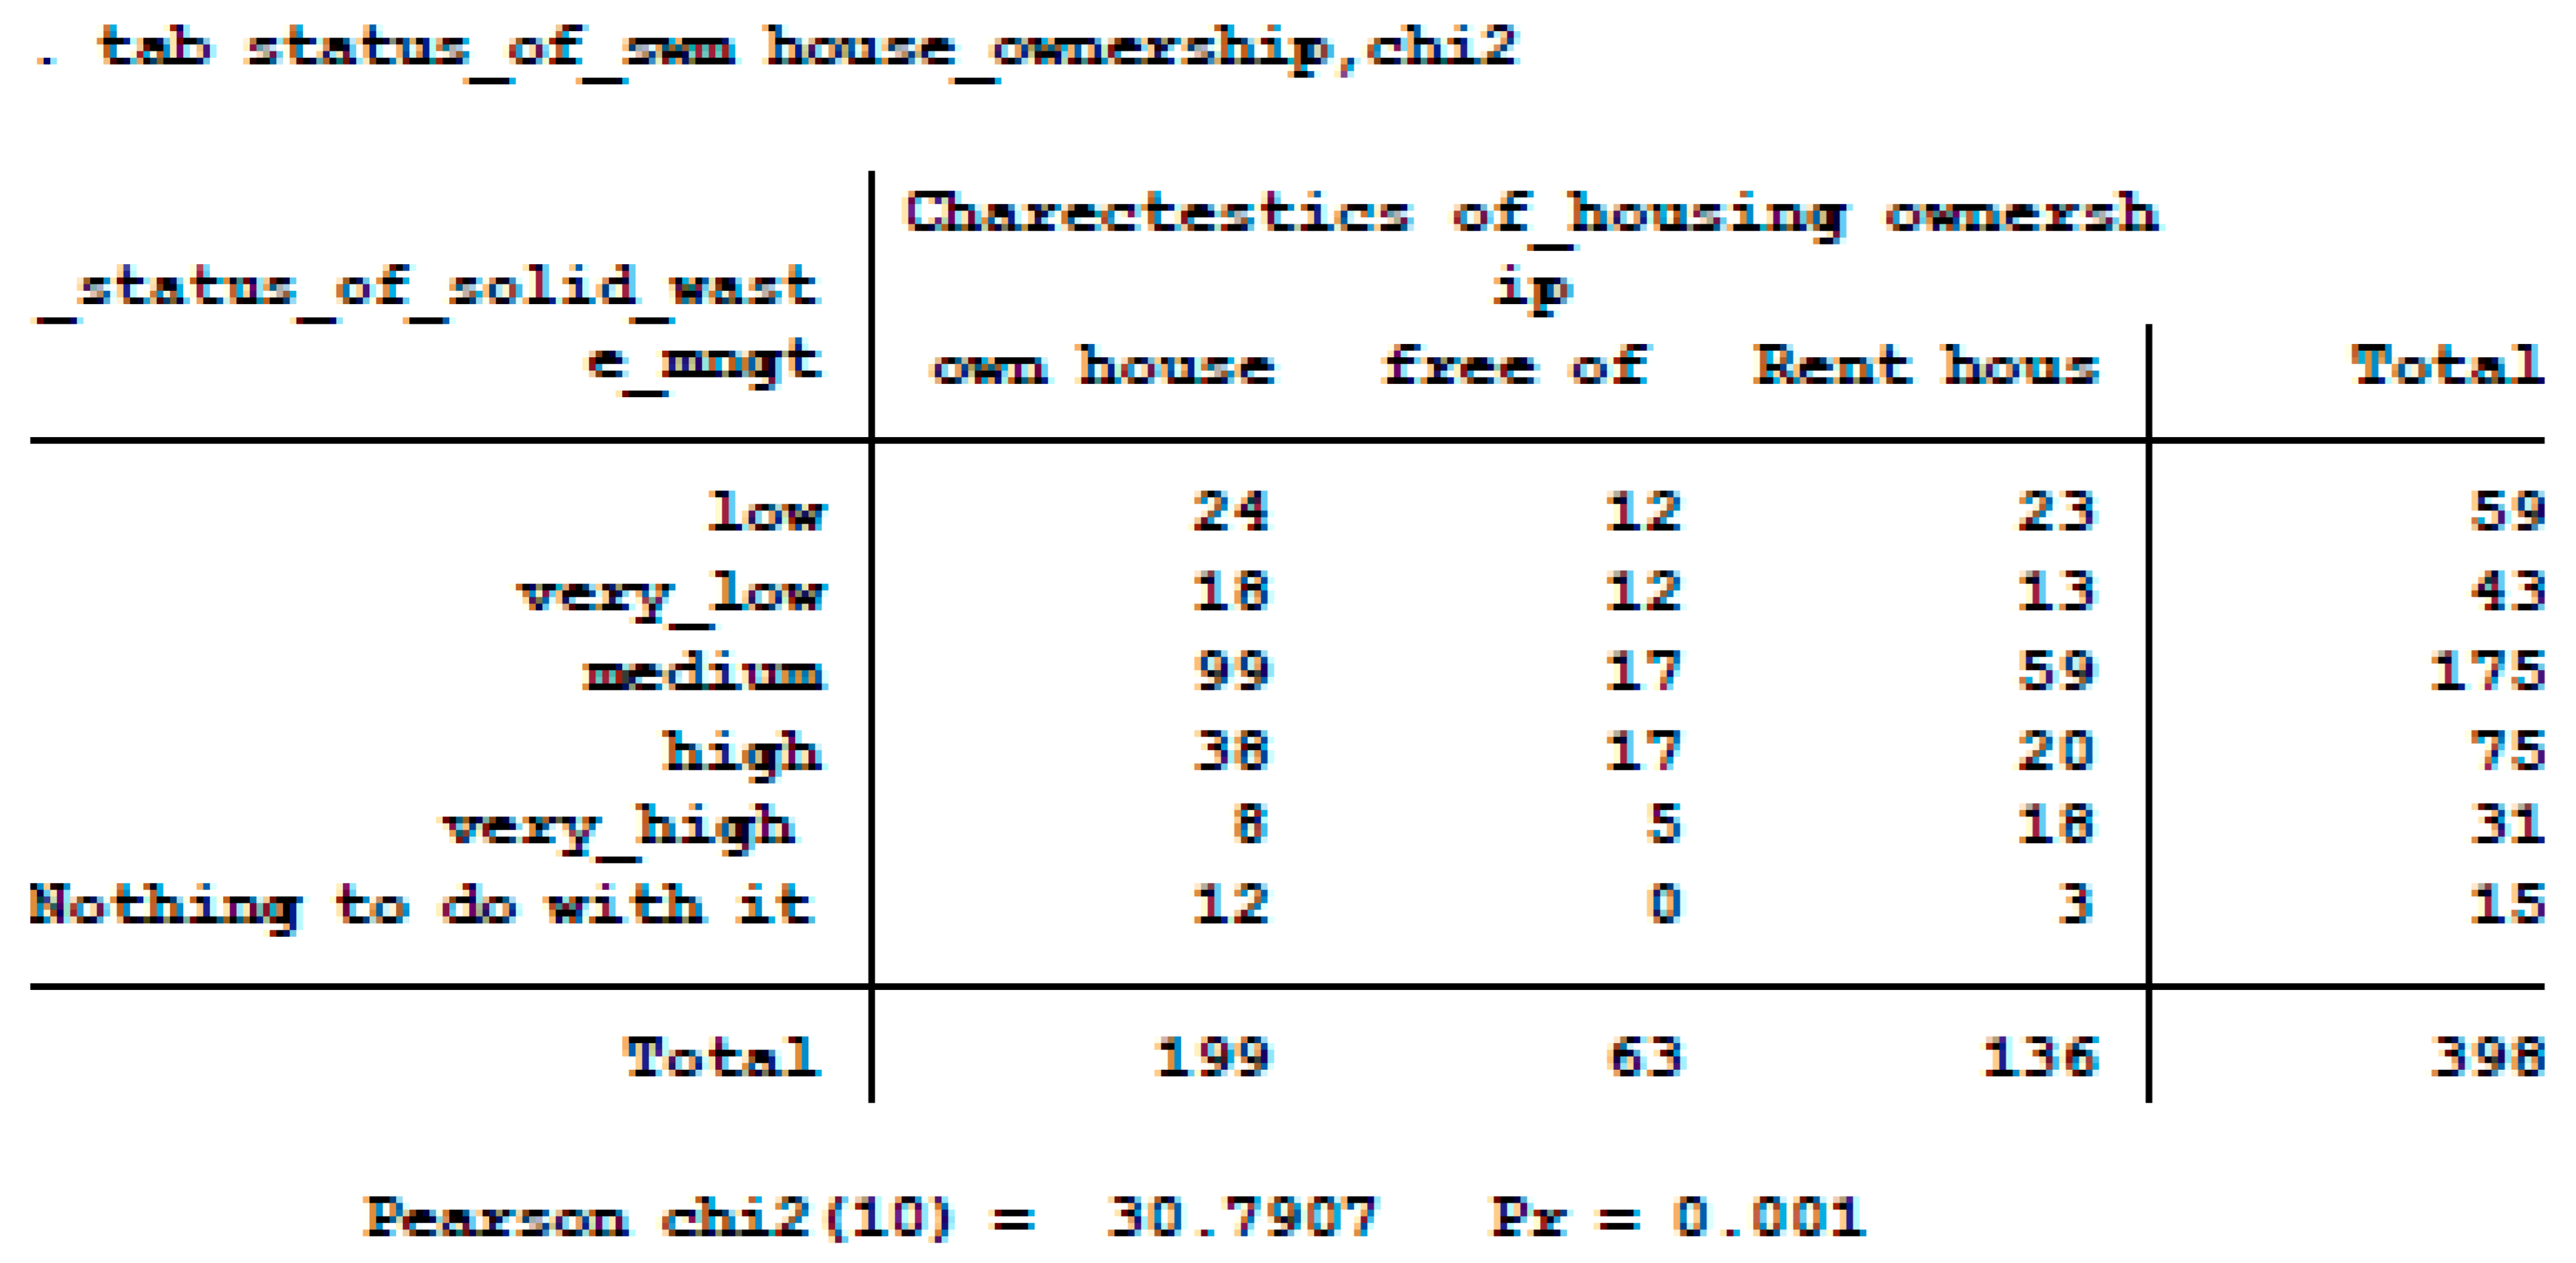
Table 2. Status of solid waste management response.
Preprints 97832 i001
Source: - survey (2023) own computation.
The cross tabulation result shows that, at 10% significant level, we can conclude that there is a significant relationship between status of solid waste management of households and their housing ownership. The result indicates that those who had their own living house have better solid waste management than those who live in rent house and those who live free of payment for house they live in throughout life time.

4.2.4. Respondent’s Response on Landfills Site Suitability
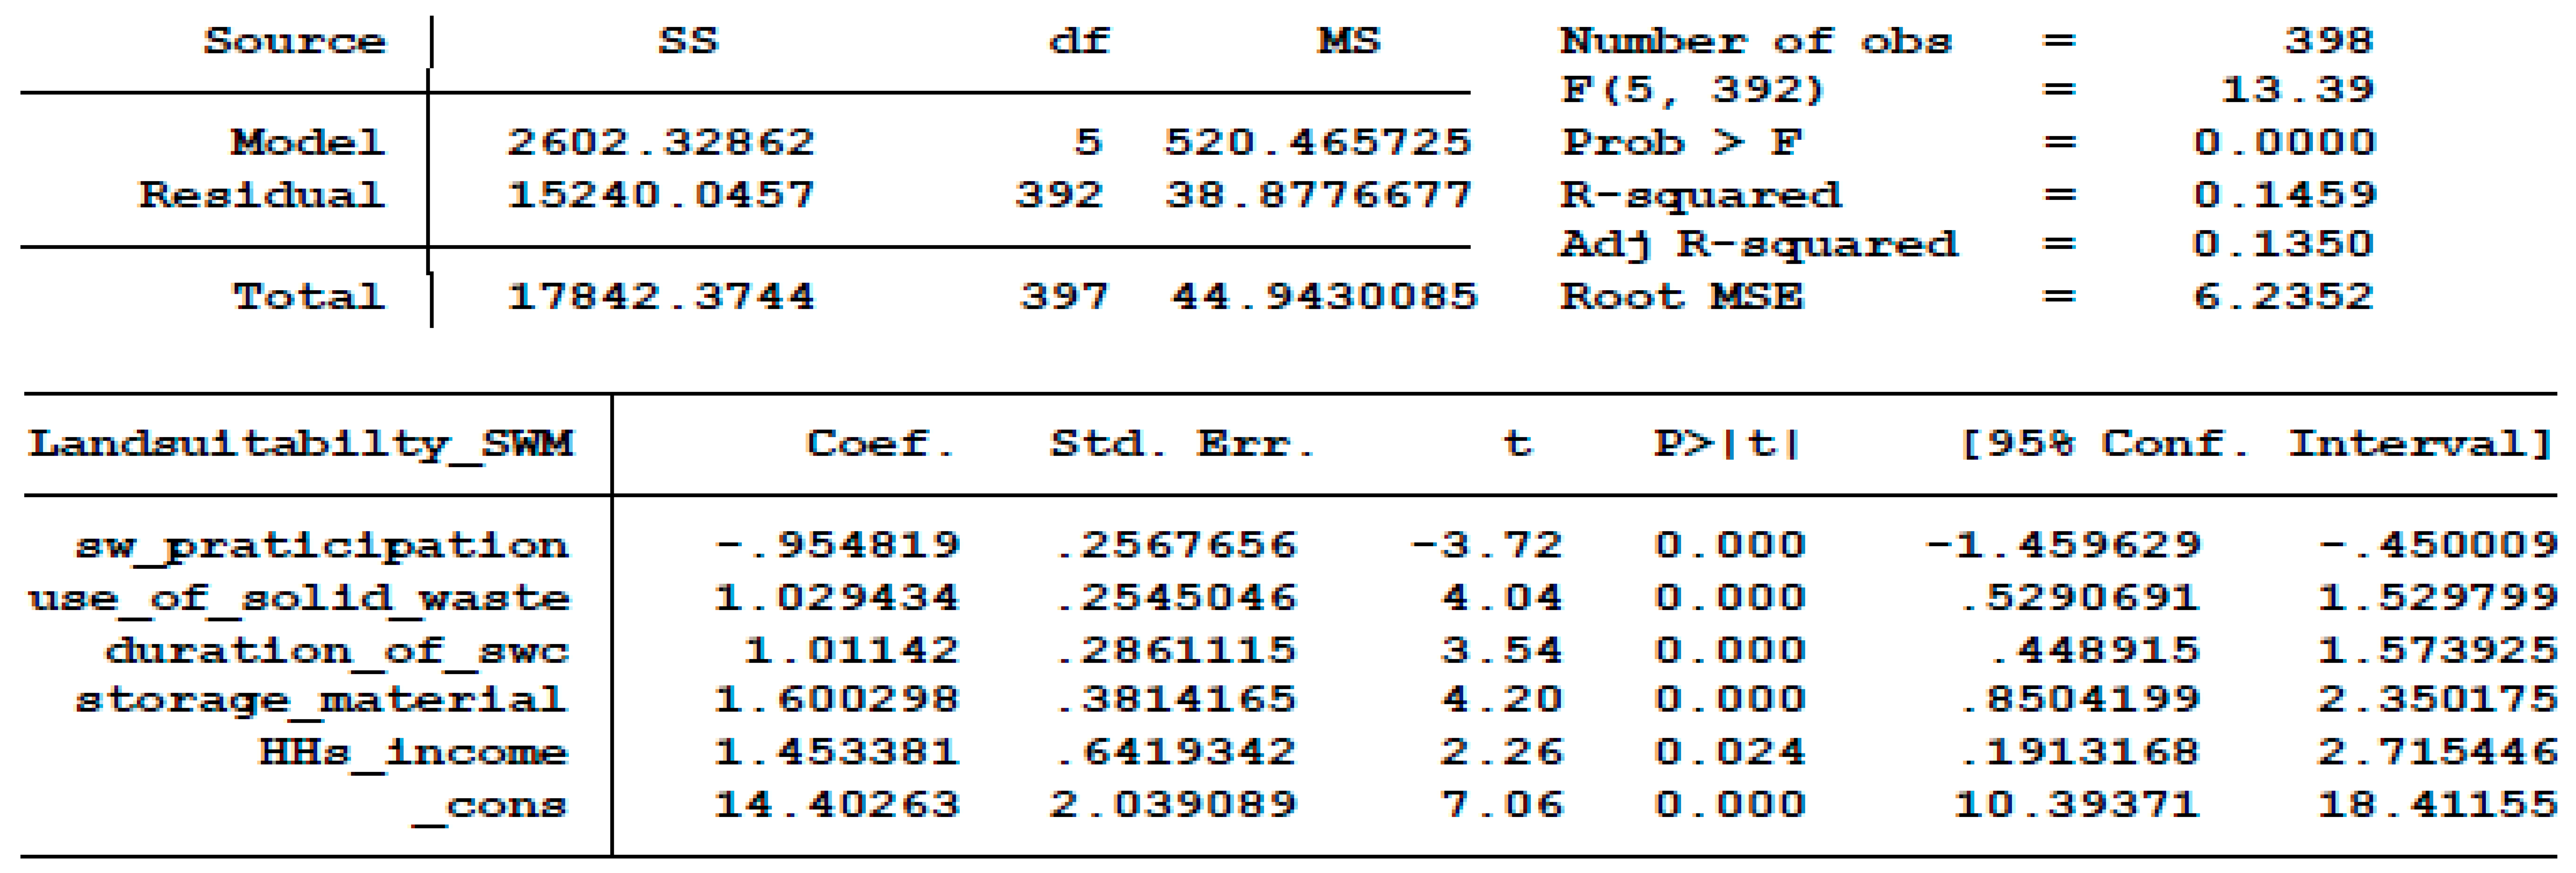
Coefcient interpretation:
In the above table, the dependent variable land suitability is derived from the sum of the Likert scale measurement of the explanatory variable using 10 items. From the above multiple regression model table, we understand that Prob >F and p> t = 0.0000 show that all independent variables are significant, and from adjusted R2, we understand that the dependent variable land suitability can be explained by the variations in the independent variables by 13.5% and all dependent variables are significant. From the perspective of individual independent variables, i.e., household’s solid waste management participation, use of solid waste management, Duration of solid waste collection, and storage material are all significant and changes in one value would increase land suitability by 14.4%. Thus, the coefficient of the predictor variable's relationship with the dependent variable (land suitability for SWM) is explained as follows:
Household’s solid waste management participation: For every decrease of one house hold member participation in solid waste management practice, landfill suitability decreases on average by 0.95 holding other things constant.
Use of solid waste: For every increase one kilogram use of solid waste (not use to not use), landfill suitability increases on average by 1.03, holding other things included in the model constant.
Duration of solid waste collection: For every increase one day of solid waste collection, land suitability increases on average by 1.01 holding other thing included in the model constant.
Storage material: For every increase in one unit of solid waste storage material by Households, landfill suitability increases on average by 1.6, holding other things constant.
Financial requirement (income): For every additional one birr in financial budget allocation, landfill suitability increases on average by 1.45, holding other things included in the model constant.
Table 3. Land suitability for solid waste management.
Preprints 97832 i002
Source: Survey(2023) own computation.

4.2.5. Respondents Response on Status of Solid Waste Management
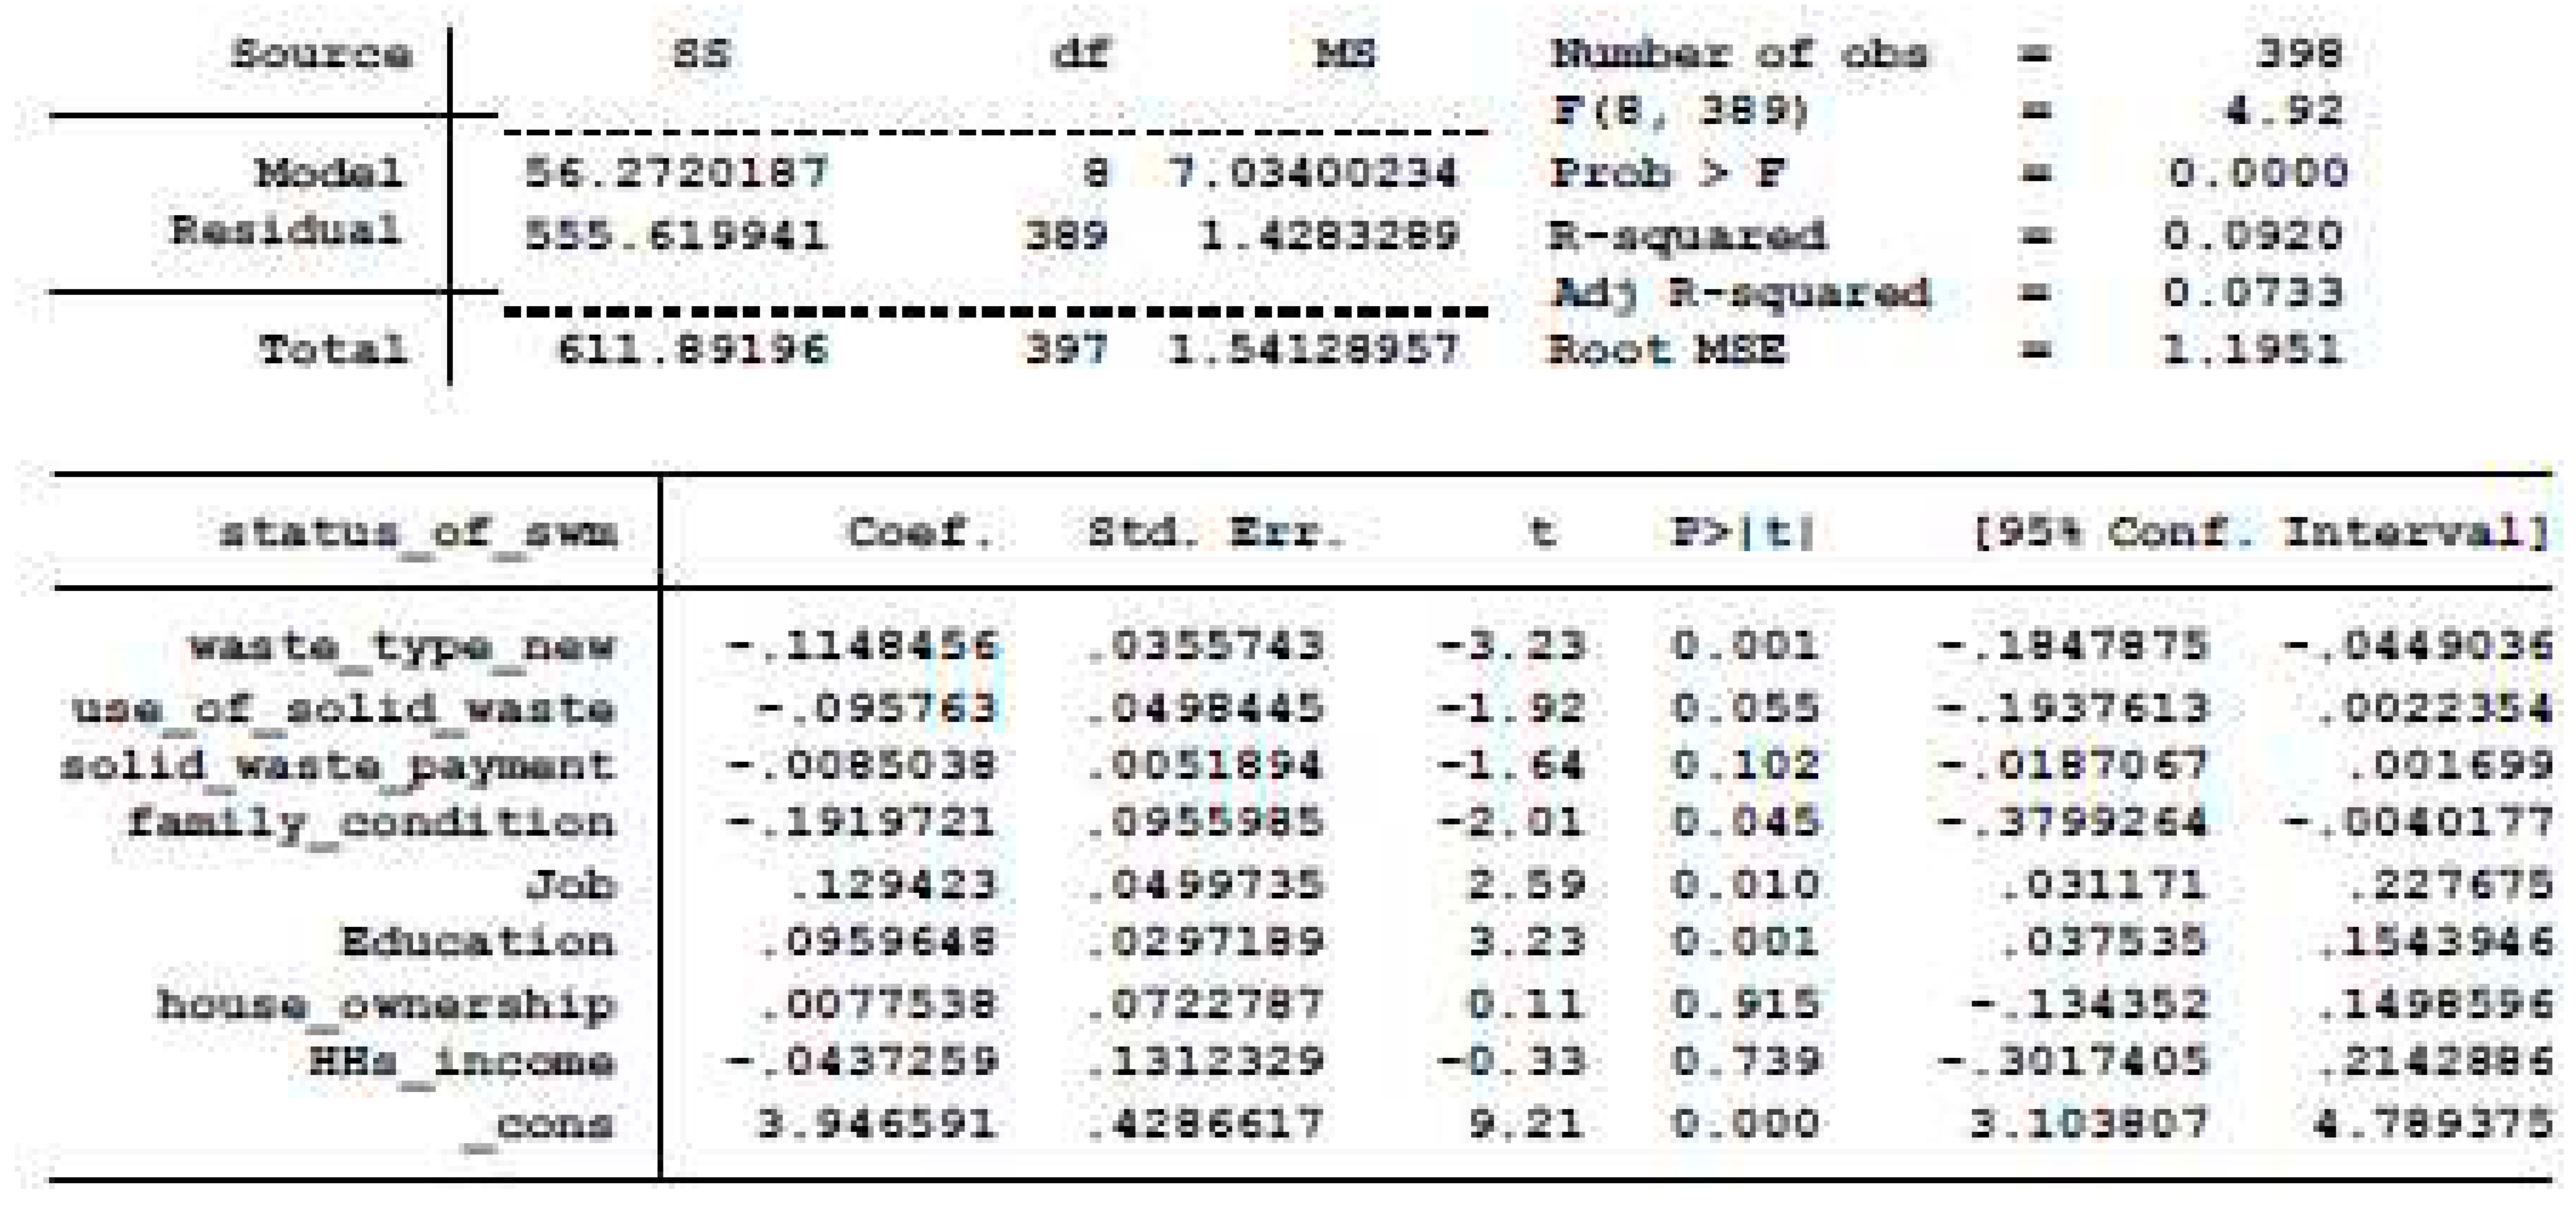
Coefcient interpretation:
In the above table, the dependent variable land suitability is derived from five categories with Likert scale measurement (low to very high) and Explanatory categorical. From the above multiple regression model table, we understand that Prob >F and p> t = 0.0000 show that all independent variables are significant, and from adjusted R2, we understand that the dependent variable land suitability can be explained by the variations in the independent variables by 7% and all dependent variables are significant. From the perspective of individual independent variables, waste type, family condition, job, and Education has significant relation with status of solid waste practice. Solid waste payment, house ownership and HHs income are insignificant.
Table 4. Respondents Response on status and practice of solid waste management.
Preprints 97832 i003
Source: Survey(2023) own computation.
Coefficient interpretation:
Type of waste: For every decrease in one kilogram of solid waste type, the status of solid management practise decrease on average by 0.11 holding all variable in the model constant.
Use of solid waste: For every decrease to use or not to use solid waste for different purpose status of solid management practice decreases on average by 0.095 holding all other variable in the model constant.
Family condition: For every decrease of family group (being married to not married), status of solid waste management decreases on average by 0.19 holding other variable included in a model constant.
Job: For every increase of one household members job (Unemployed to employed), the status of solid waste management increases on average by 0.129 holding all other variable included in the model constant.
Education: For every increase of Households Education (educated to not educated) status of solid waste management practice increases on average by 0.095 holding all other variable included in the model constant.

4.2.6. Respondents Response on Household’s Income and Determinant Factors
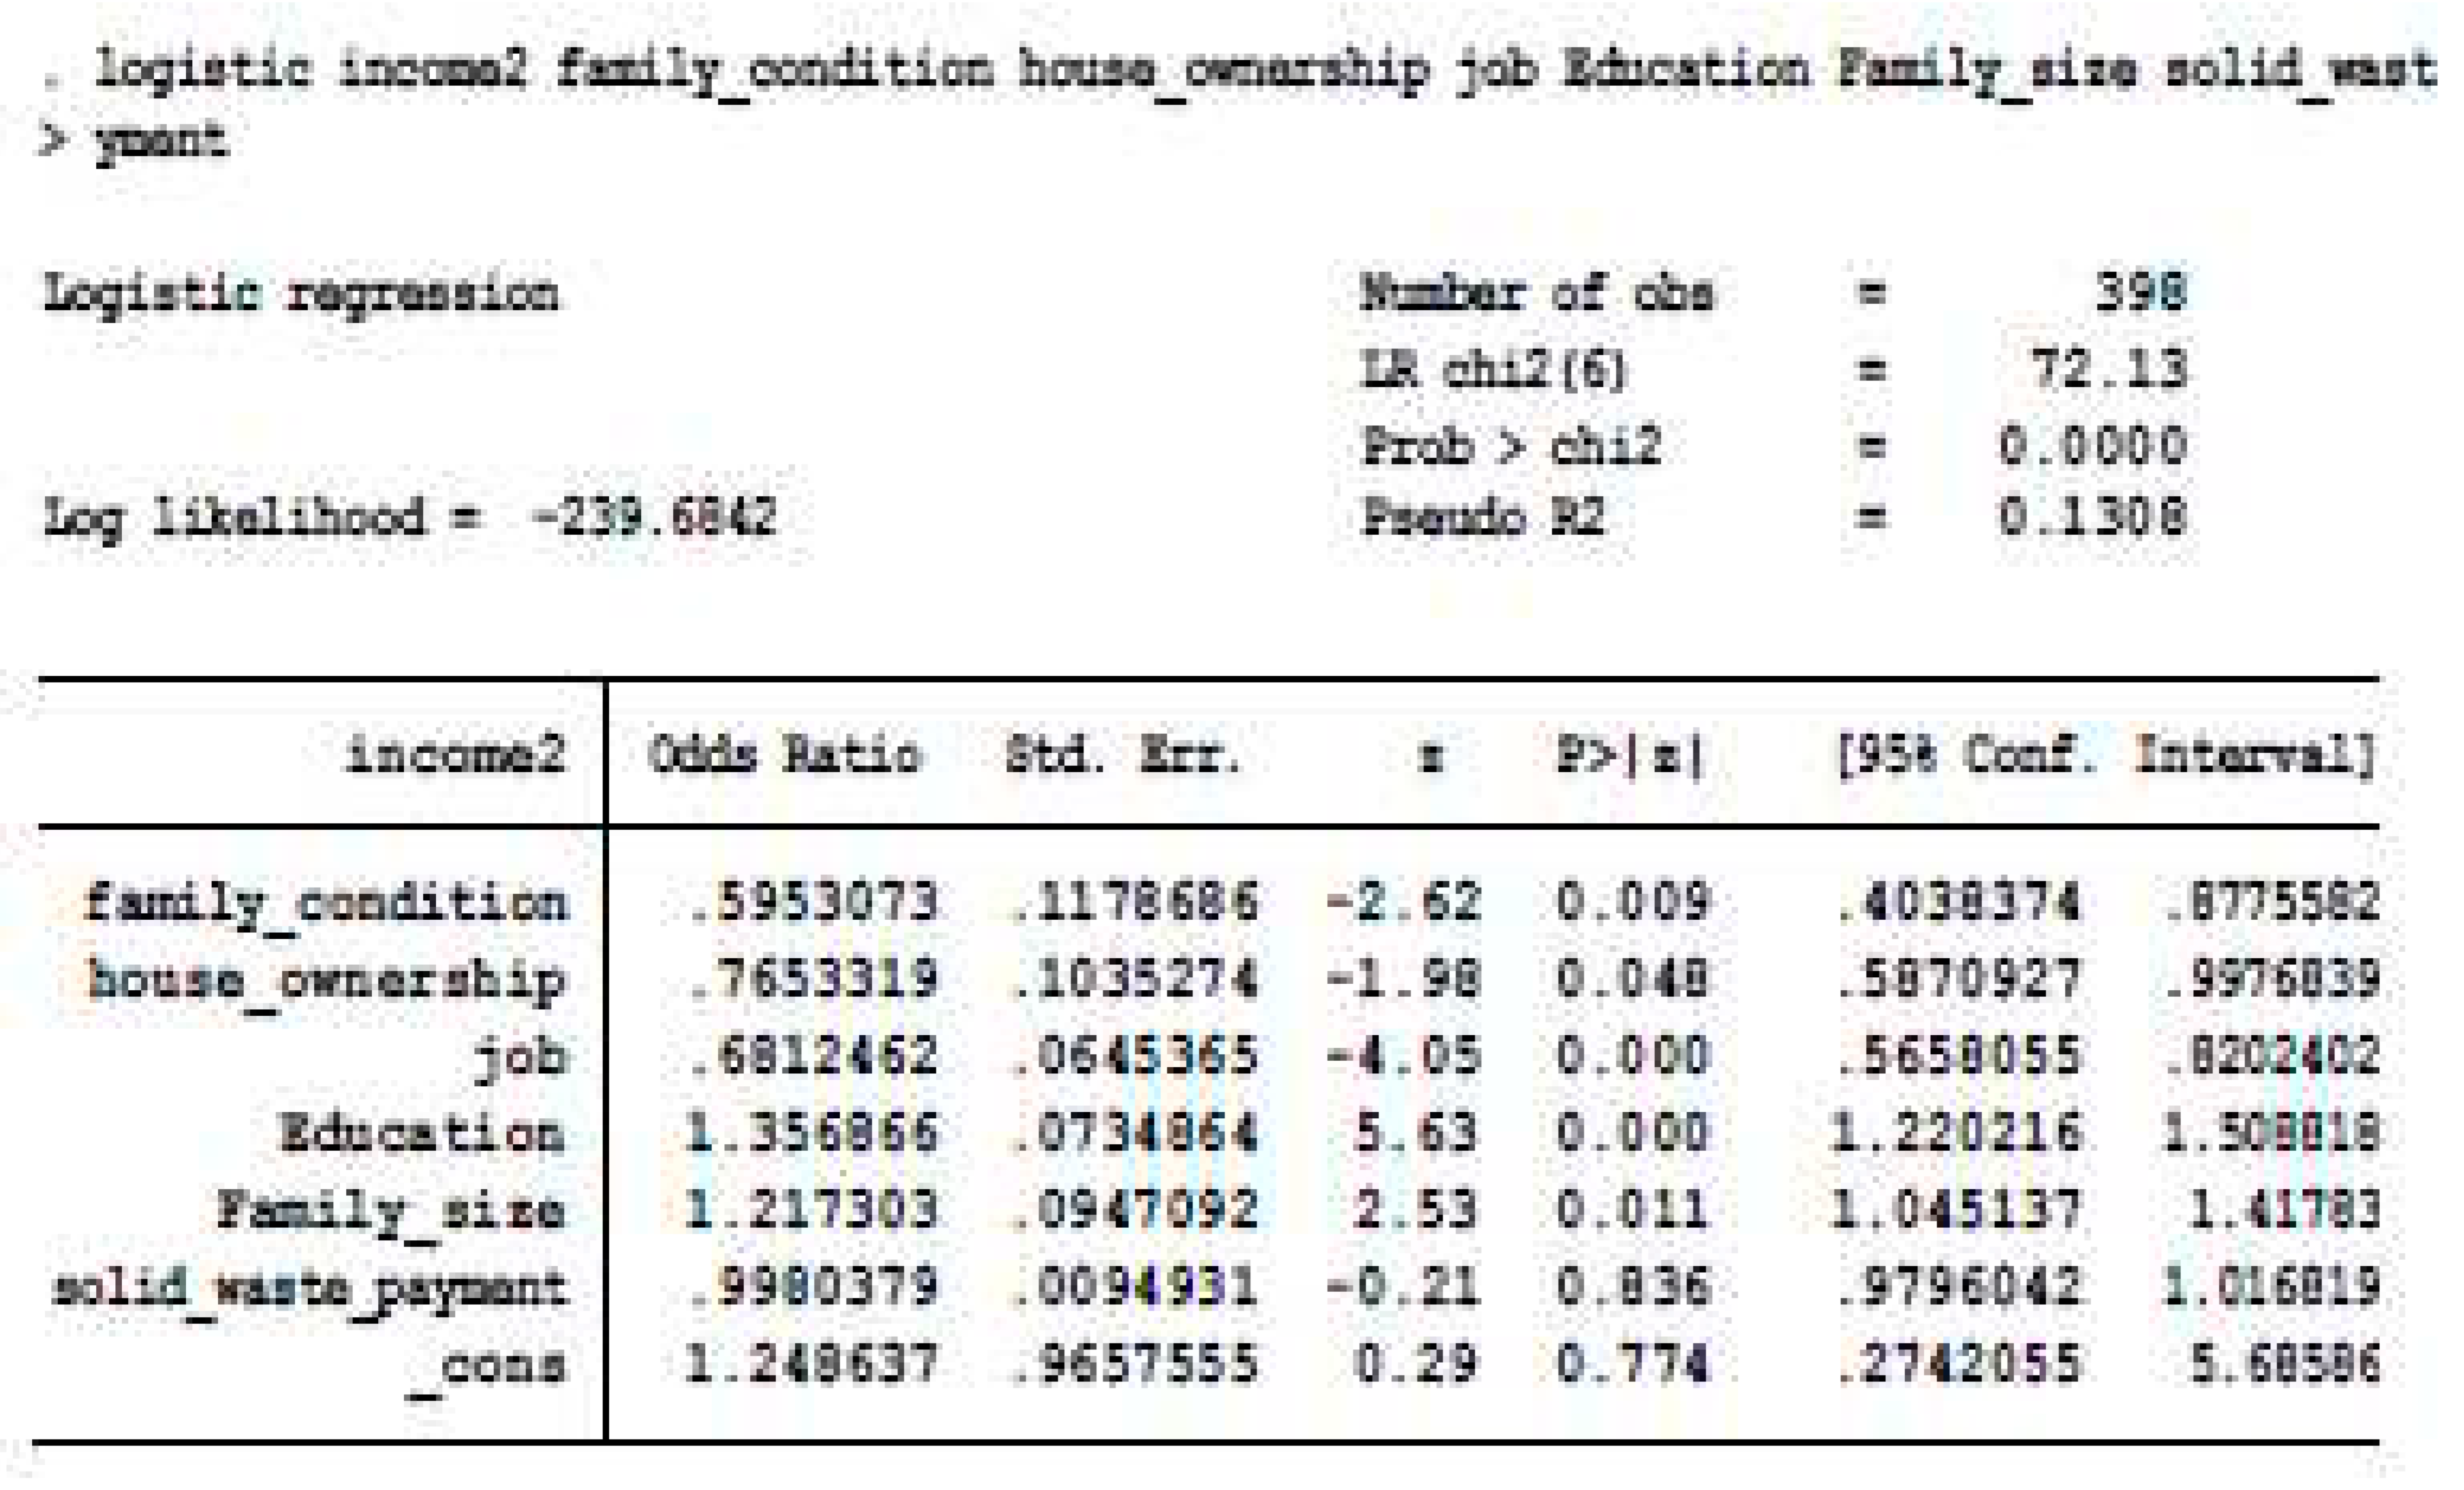
Since income is a dummy variable in this situation, the study utilizes the logit model instead of the probit model since it has two advantages over the latter. First, Green (1998) found that the odds' ratio interpretation of the logit model is more compelling than the probit model. Second, while our dependent variable is not by definition a latent variable, the probit model is better suited for latent variables. The Pesudo R2 measure is around 13%, which is less than the standard value of 50%, and it implies that the model predicts the dependent variable perfectly and that independent variables have the power to explain the dependent variable. Thus, for this study, the researcher uses family condition, house ownership, job, Education, family size, and solid waste payment as explanatory variables.
Table 5. Odds ratio of income of house hold in relation with other explanatory variable.
Preprints 97832 i004
Source: Survey (2023) own computation.
As we can see from the above regression table, all independent variables together are significantly affects the dependent variable which is represented by Prob> chi2 which is less than 5% and concluded that all independent variables together are determinant factors.
Regarding to individual significant level, except solid waste payment all others is significant. Discussion and interpretation of coefficients:
Family condition: it is positively related to the household’s income and is significant at 1%. The interpretation for the log odds ratio is that with an increase in having better family groups (married vs. not married), the log odds of income (High vs. low) increase by 59%.
House ownership: It has a positive relationship to income and is significant at 40%. The interpretation for the log odds ratio is that with an increase in house ownership (own house vs. rent), the log odds of income (High vs. low) increase by 76%.
Job: It has a positive relationship to income and is significant at 1%. The interpretation for the log odds ratio is that with an increase in having a better job (having a job vs. being jobless), the log odds of income (High vs. low) increase by 68%.
Education: It has a positive relationship to income and is significant at 1%. The interpretation for the log odds ratio is that, with an increase in education level (primary school completed vs. 2nd degree), the log odds of income (High vs. low) increase by 35%.
Family size: It has a positive relationship to income and is significant at 1%. The interpretation for the log odds ratio is that with an increase in family size (from small to large), the log odds of income (High vs. low) increase by 35%.

4.2.7. Respondents Response on Types of Solid Waste and Solid Waste Storage Material

The respondent’s response from the above table shows that most households collect different types of solid waste, among which recyclable waste accounts for 16%, biodegradable waste accounts for 66%, and non-degradable waste accounts for 18%. From this, we understand that most solid waste comes from biodegradable waste types.
Table 6. Solid type by their nature.
solid waste type by nature
Freq.

Percent

Cum.
recyclable Biodegradable Nondegradable 66
261
71
16.58
65.58
17.84
16.58
82.16
100.00
Total 398 100.00
Source: - survey (2023) own computation.
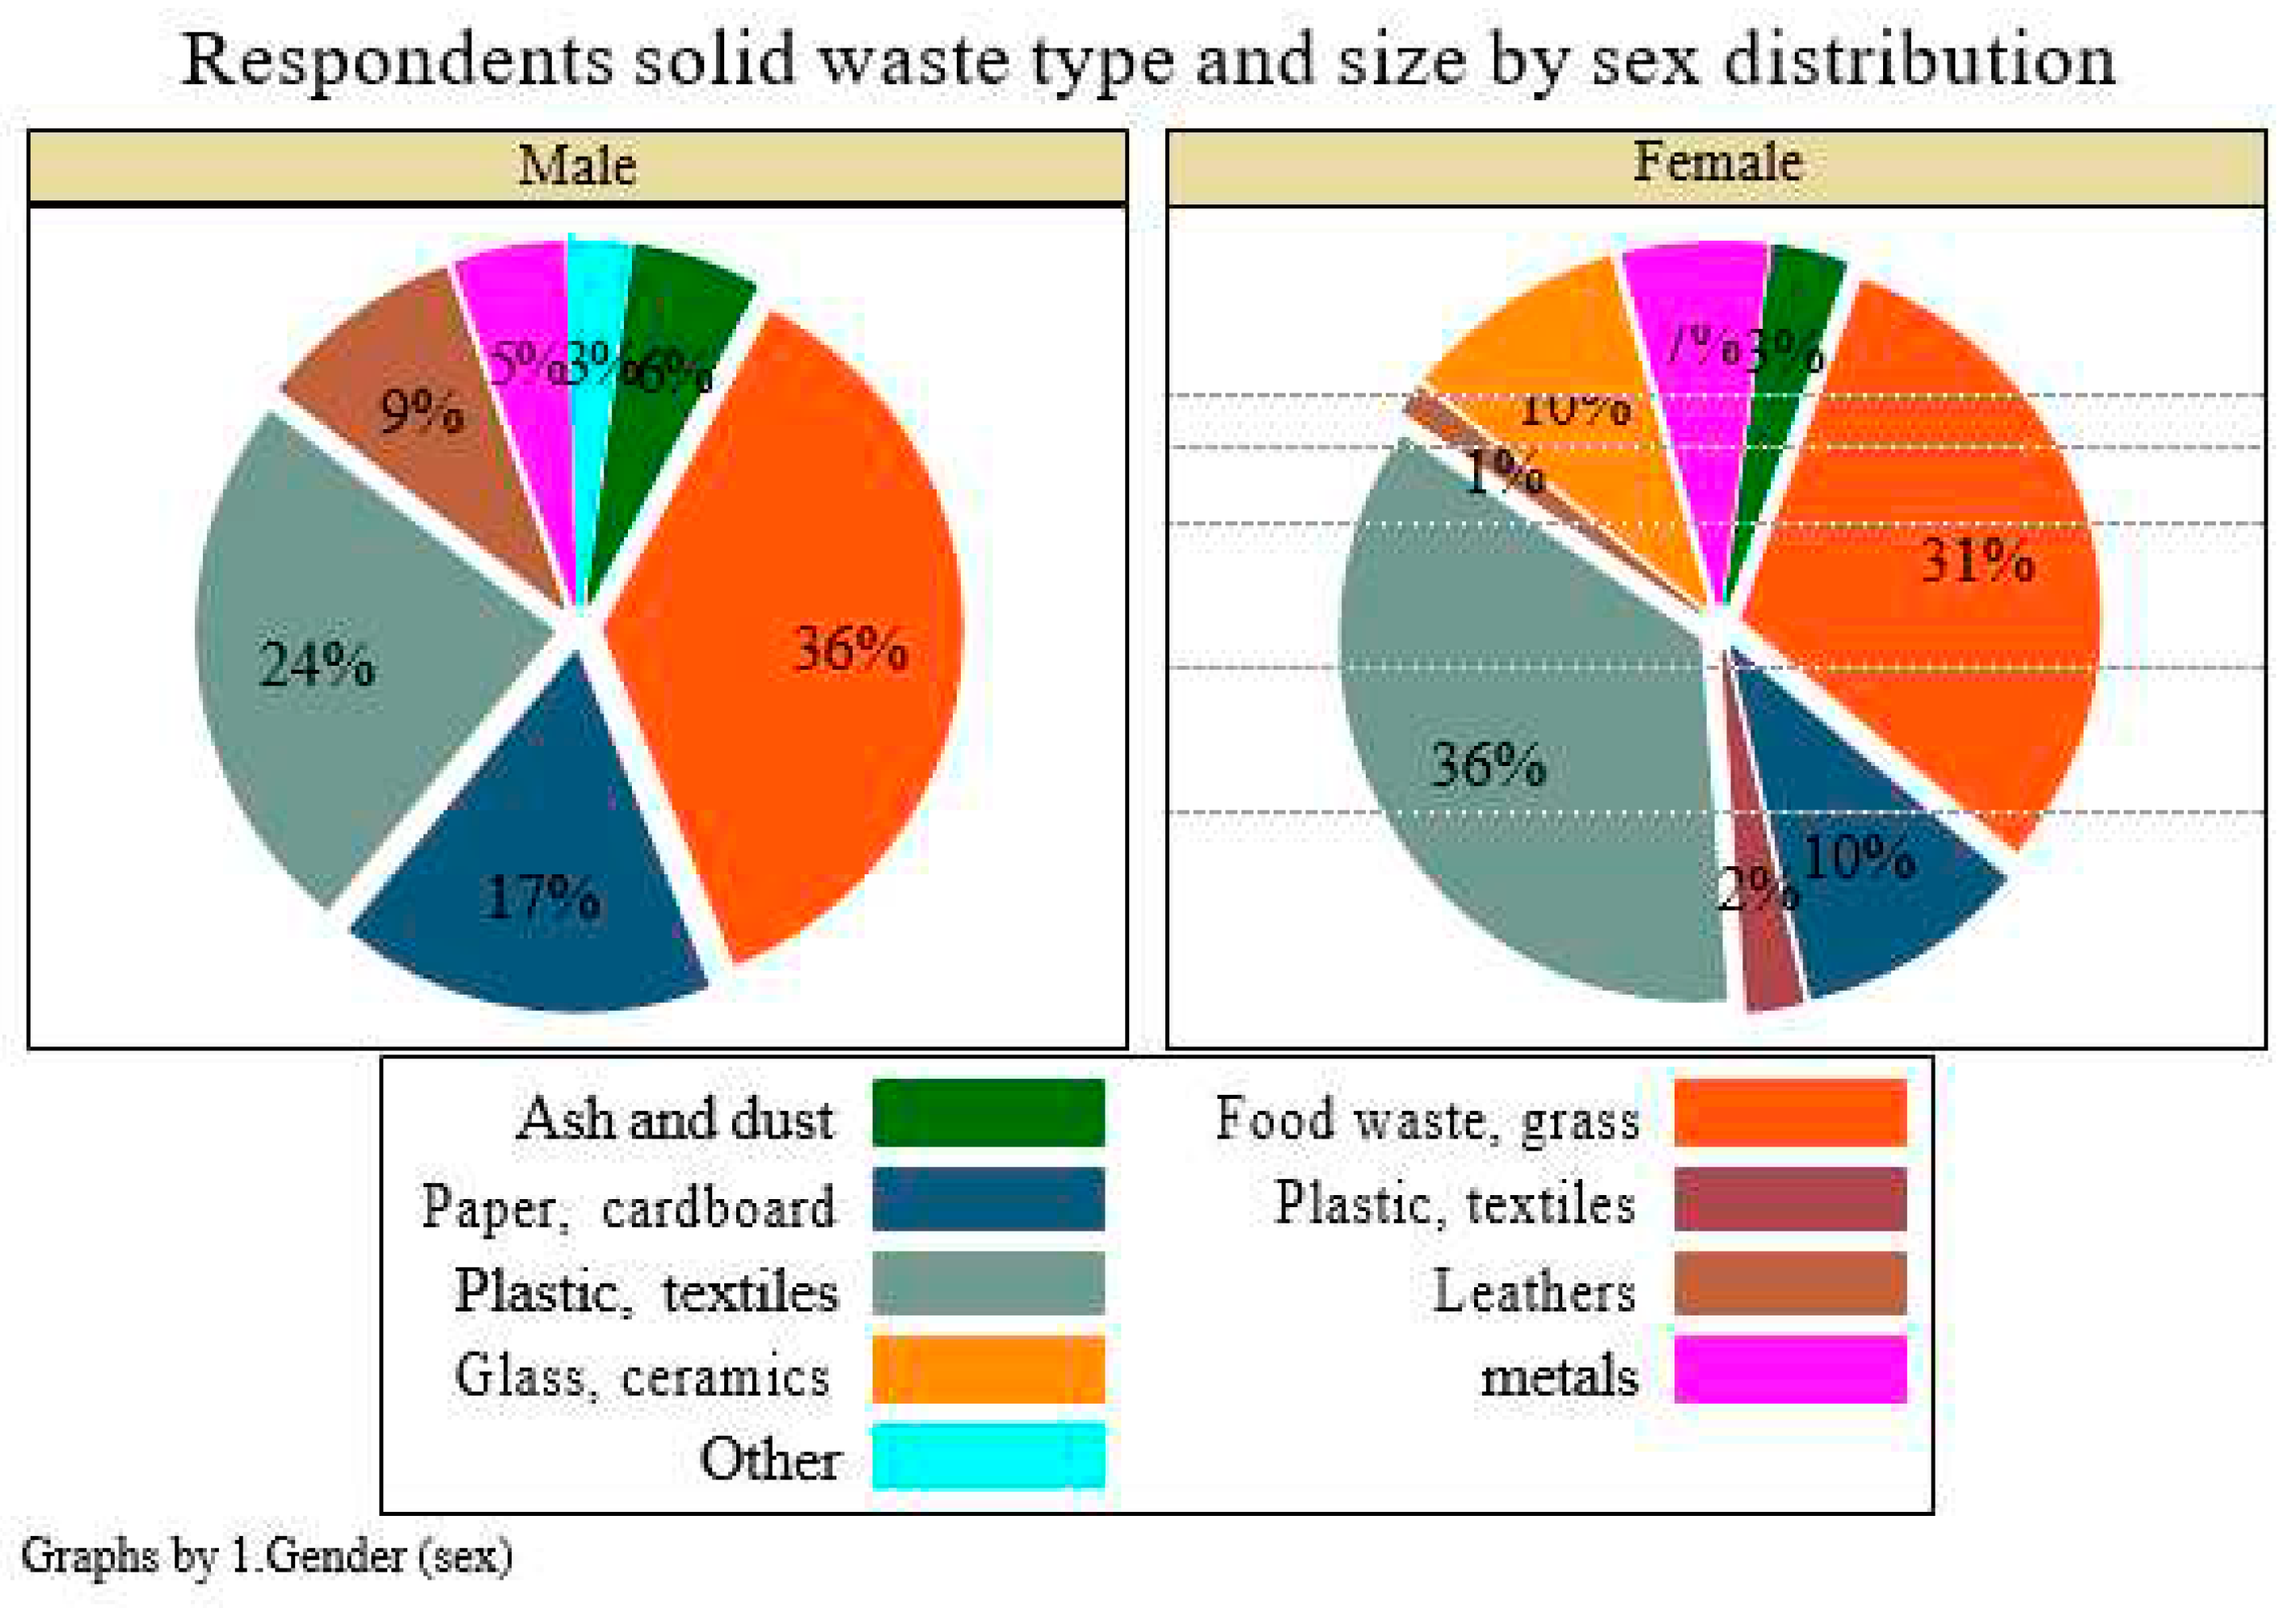
Figure 6. Respondent’s response on solid waste type by sex. Source: - survey (2023) own computation.
Preprints 97832 g006
From the above figure, we understand that the majority of waste collected from male and female households is food waste, and grass accounts for 36 and 31%, respectively. In this case, male respondents' food waste is greater than female respondents. In reverse, these plastics and textiles collected from both respondents account for 24% and 36%, respectively. Thus, the plastic and related textile wastes collected from female respondents are larger than those collected from male respondents.
Table 7. Average solid waste type in kg.
Variable Obs Mean Std. Dev. Min Max
solid_wast~t 398 25.42462 23.58709 1 100
Source: - survey (2023) own computation.
From above table we understand that the average value of solid waste monthly collected from each house hold is 25kg. Std. Dev. Value shows that within each respondent 23.58 kg of solid waste distributed variation exist in each 398 respondents.
Table 8. Solid waste storage material.
Storage_material Freq. Percent Cum.
Use Bin Use carton
Use plastic container Use plastic bag
Use old tin oppen space
other
1
19
54
284
22
8
10
0.25
4.77
13.57
71.36
5.53
2.01
2.51
0.25
5.03
18.59
89.95
95.48
97.49
100.00
Total 398 100.00
Source: - survey (2023) own computation.
From above table, Respondents response shows that majority 71% of residents use plastic bag which is locally known as ‘’medaberia” to store solid waste and 13.5% of the residents use plastic kits.

4.2.8. Respondents Response on Why Households Are Practicing Improper Solid Waste Management

From respondents response of below table (Table 9) we understand that, households reasons for practicing improper solid waste management was due to Distance from main road, insufficient income, program of waste collectors, lack of transportation, lack of awareness and other related reasons are responsible for practicing improper solid waste management in town. Thus, 34.67% of participant indicate that low level of public awareness as reason for improper solid waste management which is followed by lack of transportation (23.37%), insufficient income (16.33), un scheduled solid waste collector program (13.32%), road distance from main road to solid waste dump site and other related factors (4.52) had been identified as contributing reasons for improper solid waste management in the town.
Table 9. Reasons for improper solid waste Management.
Reasons_for_improper_solid
_waste_management

Freq.

Percent

Cum.
Distance of Road Low level of Income
waste collectors schedule Transportation problem Low level of Awerness
Other related factors
31
65
53
93
138
18
7.79
16.33
13.32
23.37
34.67
4.52
7.79
24.12
37.44
60.80
95.48
100.00
Total 398 100.00
Source: - survey (2023) own computation.

4.3. Qualitative Data Analysis

The data collected from the respondent was used by the researcher by following such types of steps that have been used to thematically arrange statements according to their pattern. The interview questions done with respective leaders who participated in providing responses related to improper solid waste management’s questions and secondary documents were analyzed by using ATLAs.ti.9, through which data was imported and prepared for analysis by thematic analysis made by adding codes using in vivo code segments, merging codes, and splitting codes into themes, and later prepared for inquiry as per related themes. Finally, reports were analyzed as per query quotations.

4.3.1. Respondent’s Response on Attitude of Communities towards on Proper Solid Waste

Management Practice
For proper solid waste management communities means to understand how to manage it was one of the challenges in this study area. As most of the respondent’s response stated as;
“I think that as population increase from time to time the improper solid waste management is increasing from time to time. Everyone must develop knowledge and understanding related to how to manage solid waste. solid waste management had to be enhanced by knowledge through public awareness creation priorities by officials and other supportive institutions”. Other person also states, due to lack of knowhow, improper solid waste Management still not gets attention by city administration. For those who do not have understanding on solid waste management training needed. Additional service is needed to protect improper solid waste management”.
From above statement we understand that the larger community has little knowledge about proper solid waste management. In this regard, community based awareness, and government based focus will be needed to overcome the problem.

4.3.2. Respondent’s Response on Existing Landfill Suitability for Collection of Solid Waste
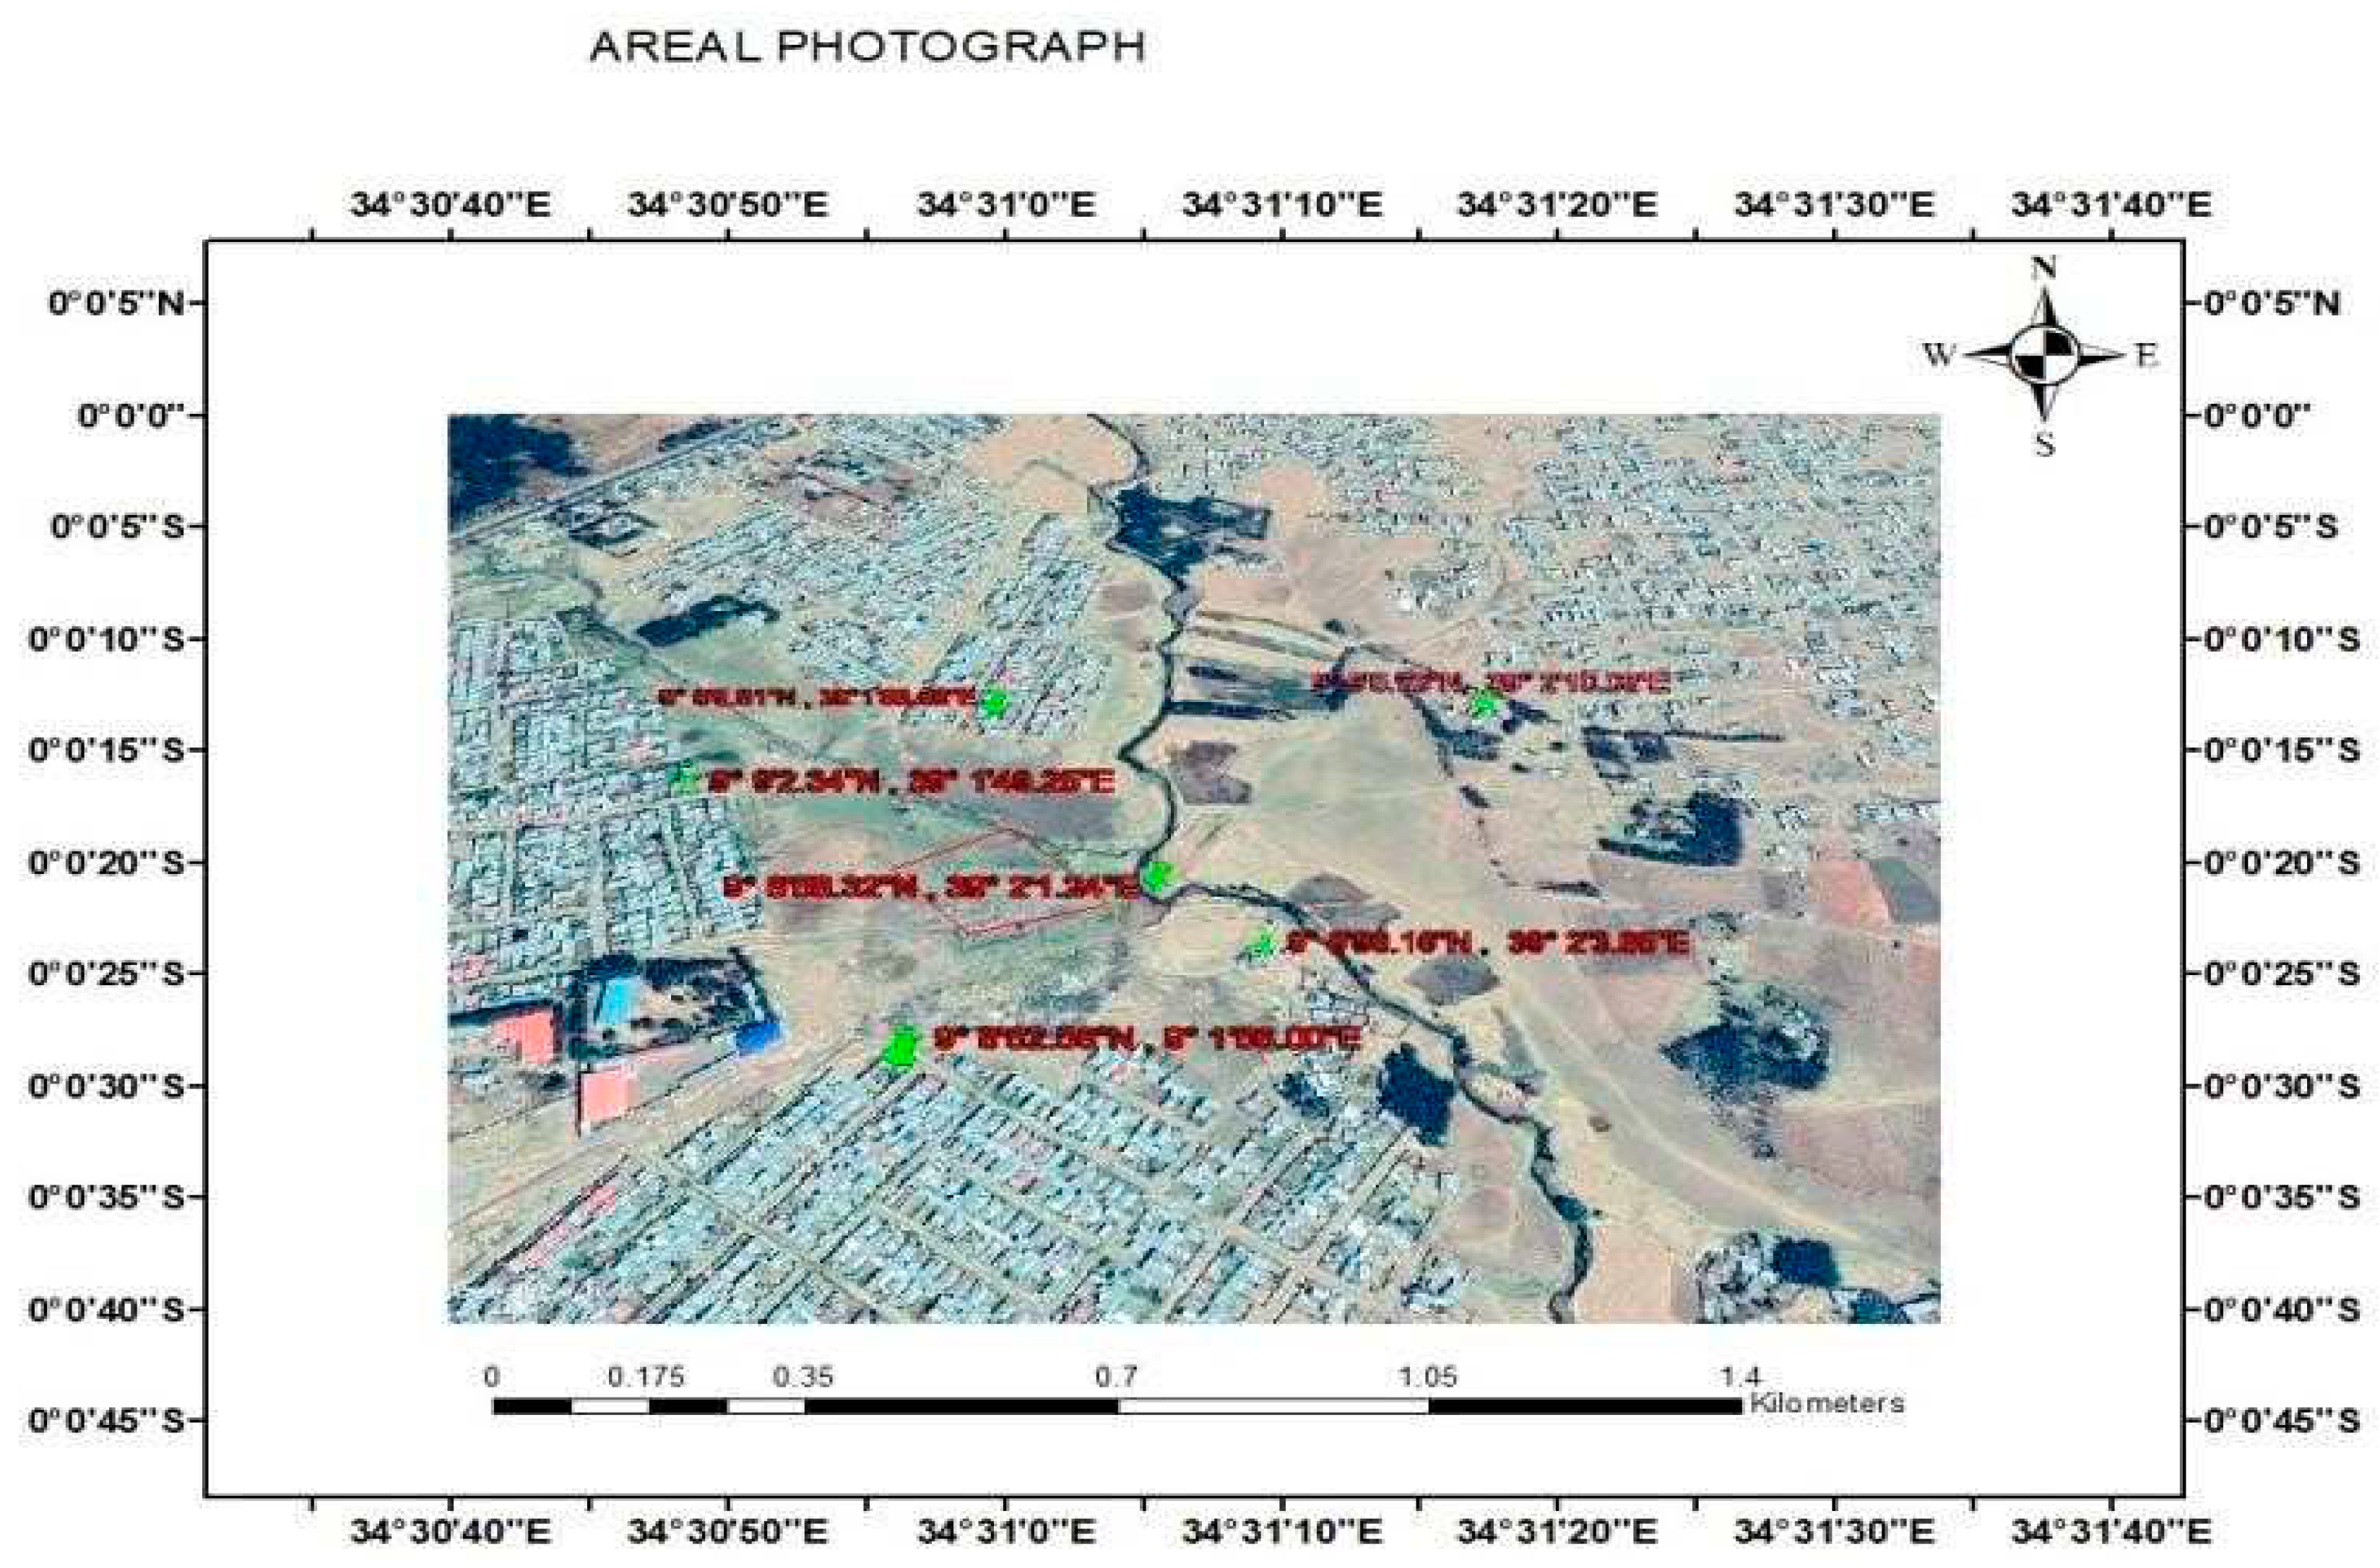
As stated in literature land site is considered suitable for the location of solid waste disposal if it fulfils all the requirements or criteria, such as 488 m from streams, 794 m from the residence and 499 m away from road networks. The suitable site must also satisfy the soil type and topography. A site is considered unsuitable if the above requirements and if the slope is >32%.
Landfill site where this study conducted shown as below Figure 7, located from residents house us measured by using google earth tool (2023) the place is found in measurement distance of west from main road 727m or 73 km (136 degree) and from near resident side road 151m, from residents house 202m (175 degree) in NW, 145 m (138 degree) in NE and 397m (57.7 degree) in North, 113m (80 degree) in south East, 175m (97.87 degree) in East. Distance of stream from dump site is 85m. The slope of the place is less than the above requirement which is 2.75%. Based on this the present place of dumping site cannot fulfill expected requirement and need the place to change. As researcher tries to identify indicated problem respondents response through interview have been highly associated with this fact.
Most of respondents states that the present solid waste landfill site “problem of well-known solid waste dumping site which difficult and problematic as I troubling. Land fill site will be free from human displacement area. Hence, the City/ town have been too large in size and therefore, as my opinion if possible the town should have distance solid waste management landfill site which will be enclosed outside the town in suitable and equivalent distance place from the center with possible service.”
From the perspective of waste collectors the present land fill site still challenging them due to difficulty of the place as it exist at residents settlement area and shortage of machinery they have to give transportation service to this landfill site as the need of the community. We conclude from this statement that, the present land fill site fund in area which resident’s house found and its location as other respondents states it is contaminating the environment and know it is the creating health problem for most of children’s of families who live around waste dumping area.
Figure 7. Landfill site Aerial photograph taken from google Earth. Source: Google Earth sketch taken by Researcher own computation.
Preprints 97832 g007

4.3.3. Respondent’s Response on Types of Waste Particle That Most of the Time Used to Landfill Site

As what was stated by research questioner Interviewed respondents also argued that most of solid wastes taken to dump site include wastes from food related garbage, Diaper, metals Ash dust, remains of livestock which have mostly practiced by some peoples by adding such wastes into waster dish previously it was the serious problem in the town as they reported. Recruited town cleaner also said that, most wastes people drops around road and bridge area are highly related with this which includes wastes like plastic material. They state additionally that the working labor force to cover in all towns corner is difficult so as to get clean environment.
Solid waste management or dump area place should be out of the town. At Least it will have distance 3 to 5 km far from residents home. Other participant also states this solid waste disposal site is found from city administer office at 0.5km and from resident’s house at 0.2km. Control and supervision will be needed. If possible the place must be out of the town. They said “we are eating with fly” which show the seriousness of the problem. Other says to mitigate problem related to improper solid waste management practice “if possible waste disposal site must be built in equivalent area which will be suitable for all residents”. The expectation they have on municipality as researcher asked them most respondents have been recycled on as there is no solution which is not “pass from speech”
Due to problem related to waste dumping site, “still peoples are putting solid wastes on street road which need attention by city municipality”. Furthermore, the interviewed participates from waste collector state that they are challenged during waste collection as residents do not separate solid wastes which can easily biodegradable and not. To this, extent solid waste collection has been too difficult for us they said during interview. Thus, the concern given for solid waste management and style of identifying solid in kind and type must need attention by all concerned body.

4.3.4. Respondents response on whether urban community has their own solid waste container or bin around their home

Most respondents state that they do not have a collective solid waste disposal container and that “Solid waste containers must be provided by the city Administration for each Keble’s residents according to their blocks”. Other respondents say, “In a town, there is no waste collection bin or container, which must need the attention of town administration if possible within each cluster. A solid waste disposal container is needed to solve the improper solid waste we see everywhere around roadsides and bridges, as well as protected green areas around respective religious grave areas where human souls rest in a town”.

4.3.5. Respondents Response on Household’s Method of Solid Waste Management Practice

Those who participated in response stated that, for solid waste management practice, solid wastes like plastic highlands and other which can be easily fired used for domestic home purpose and other which are degradable could be used for plant growth after its destruction. Some respondents stated as they are nothing to do with it and some other who had small business center like shop could collect and change it as means to regenerate money for their lovely hood. Even though most of them do this, some other does not have some knowhow whether solid wastes could be means to generate income and some other intentionally drops at improper place on road side and peoples recreational area.
Respondents states that “as population increase the improper solid waste management is increasing from time to time. Everyone must develop knowledge related to how to manage solid waste. Other person said that “the opinions that I have is the respective body should provide training through existing “Goxi” or community based groups to have clean environment for all”. Thus, the researcher prove that, there are little community members who knows the importance of solid wastes for home purpose and means to generate income for their lovely hood.

4.3.6. GIS Arc Map Generated Study Are Watershed and Soil Type.
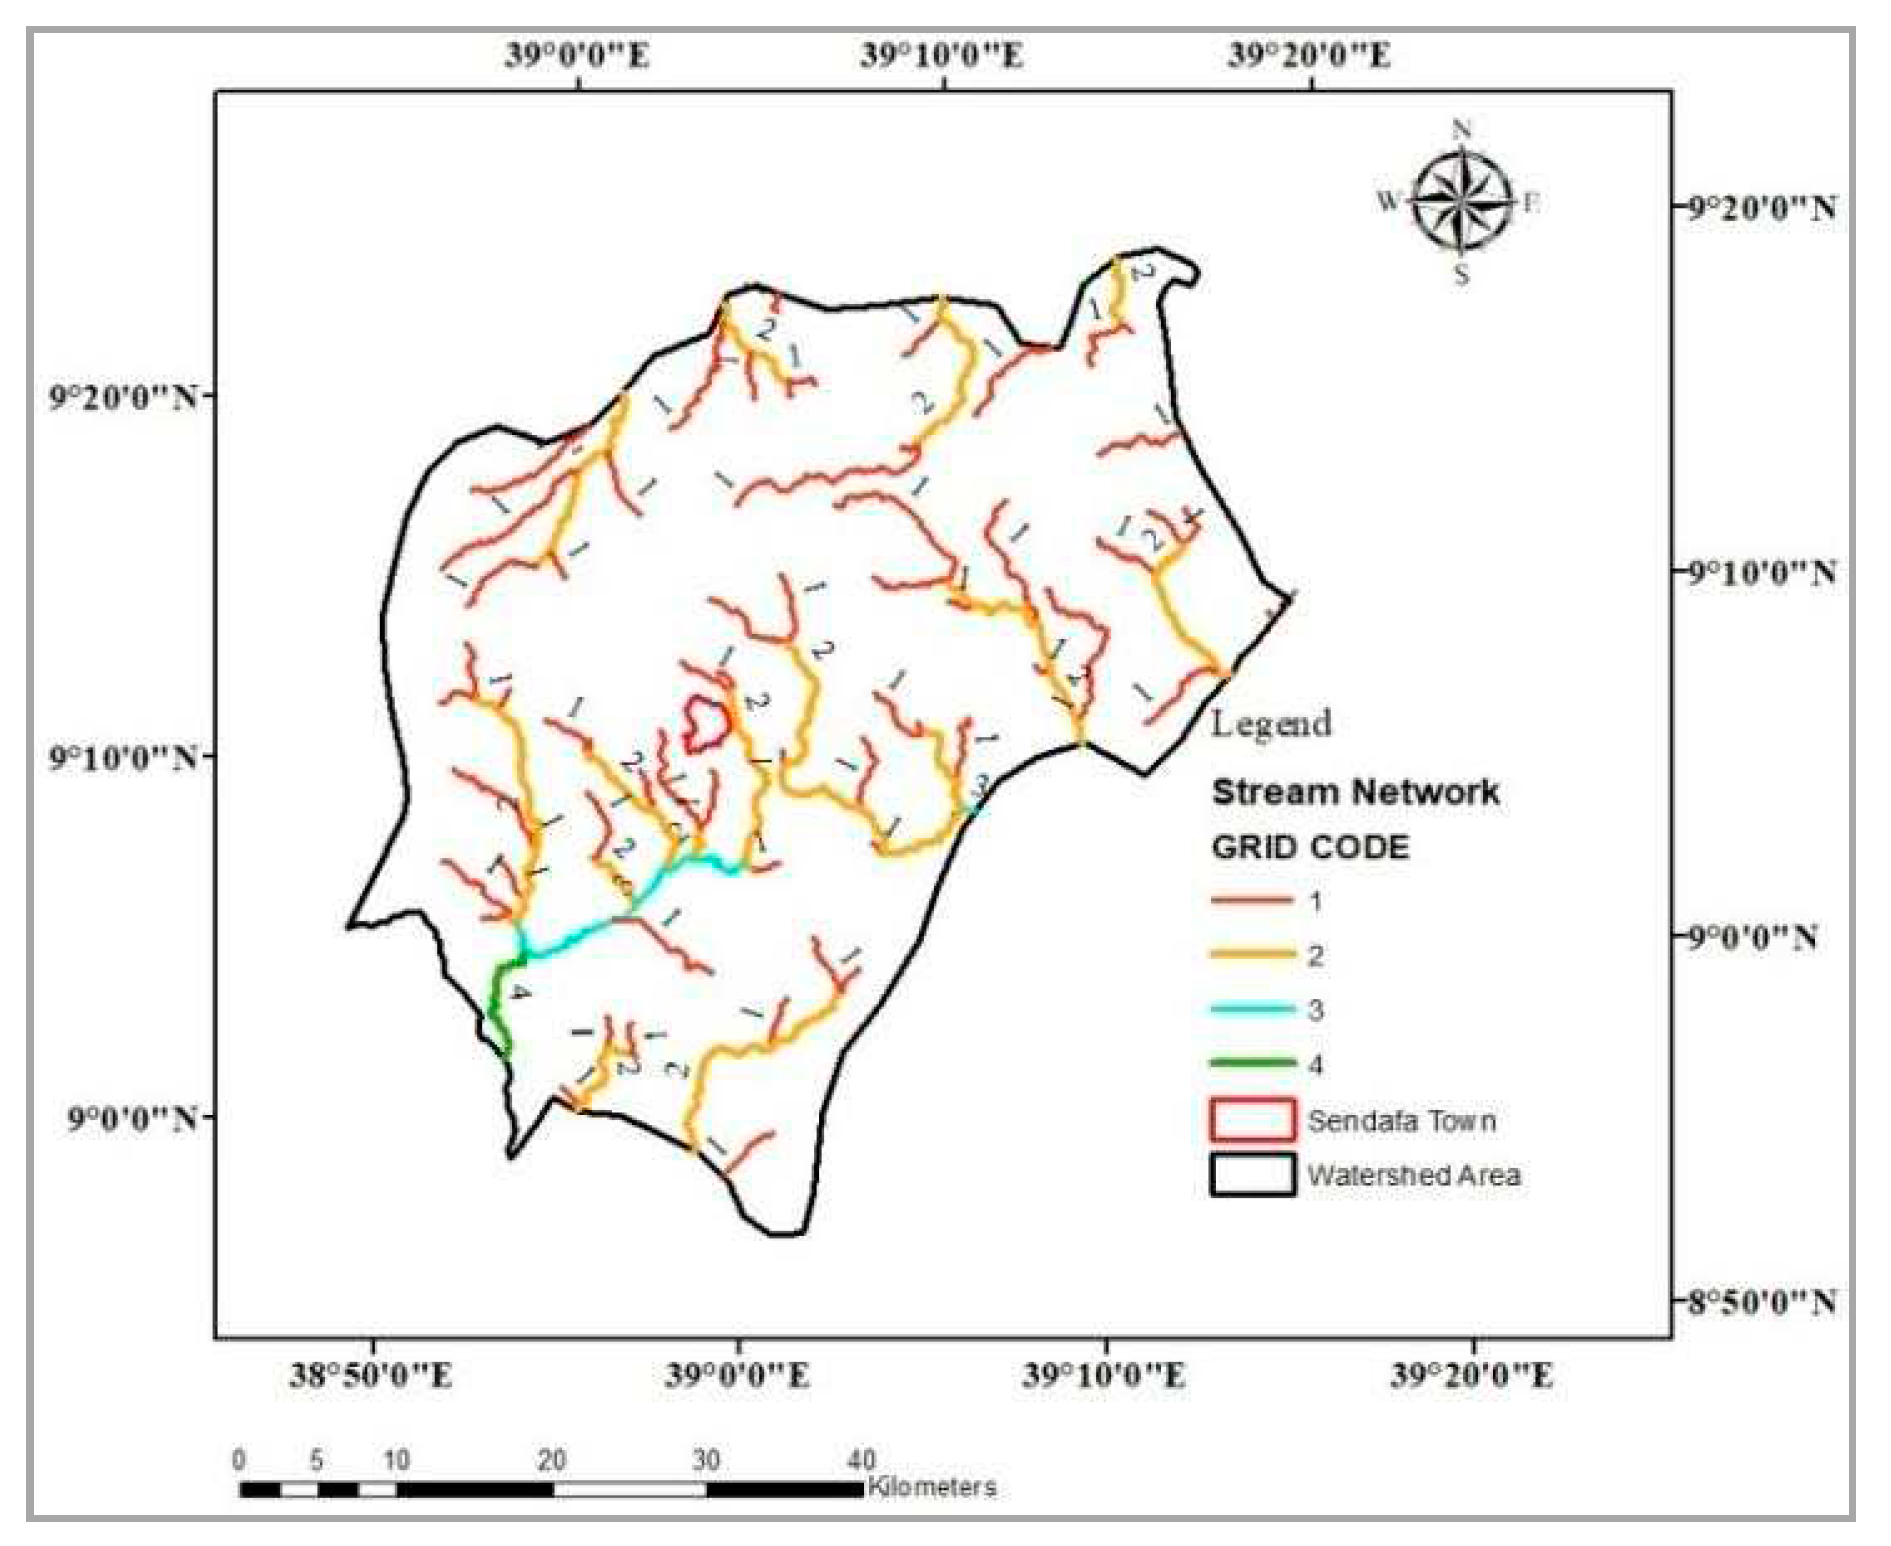
The above study area arc map is prepared on district level water shed as since there no high level resolution image (30x30) shows stream line in Sendafa town as shown on image for these reason Reacher decided to process raster image by Bereha Aleltu district in since the problem of solid waste around stream side have been affecting other neighbouring regions of Sendafa town.
Figure 8. Study area watershed Map. Source: Study area watershed generated by Researcher using arc map GIS tool (Own computation, 2023).
Preprints 97832 g008

4.3.7. Soil Type of Study Area by Arc Map GIS
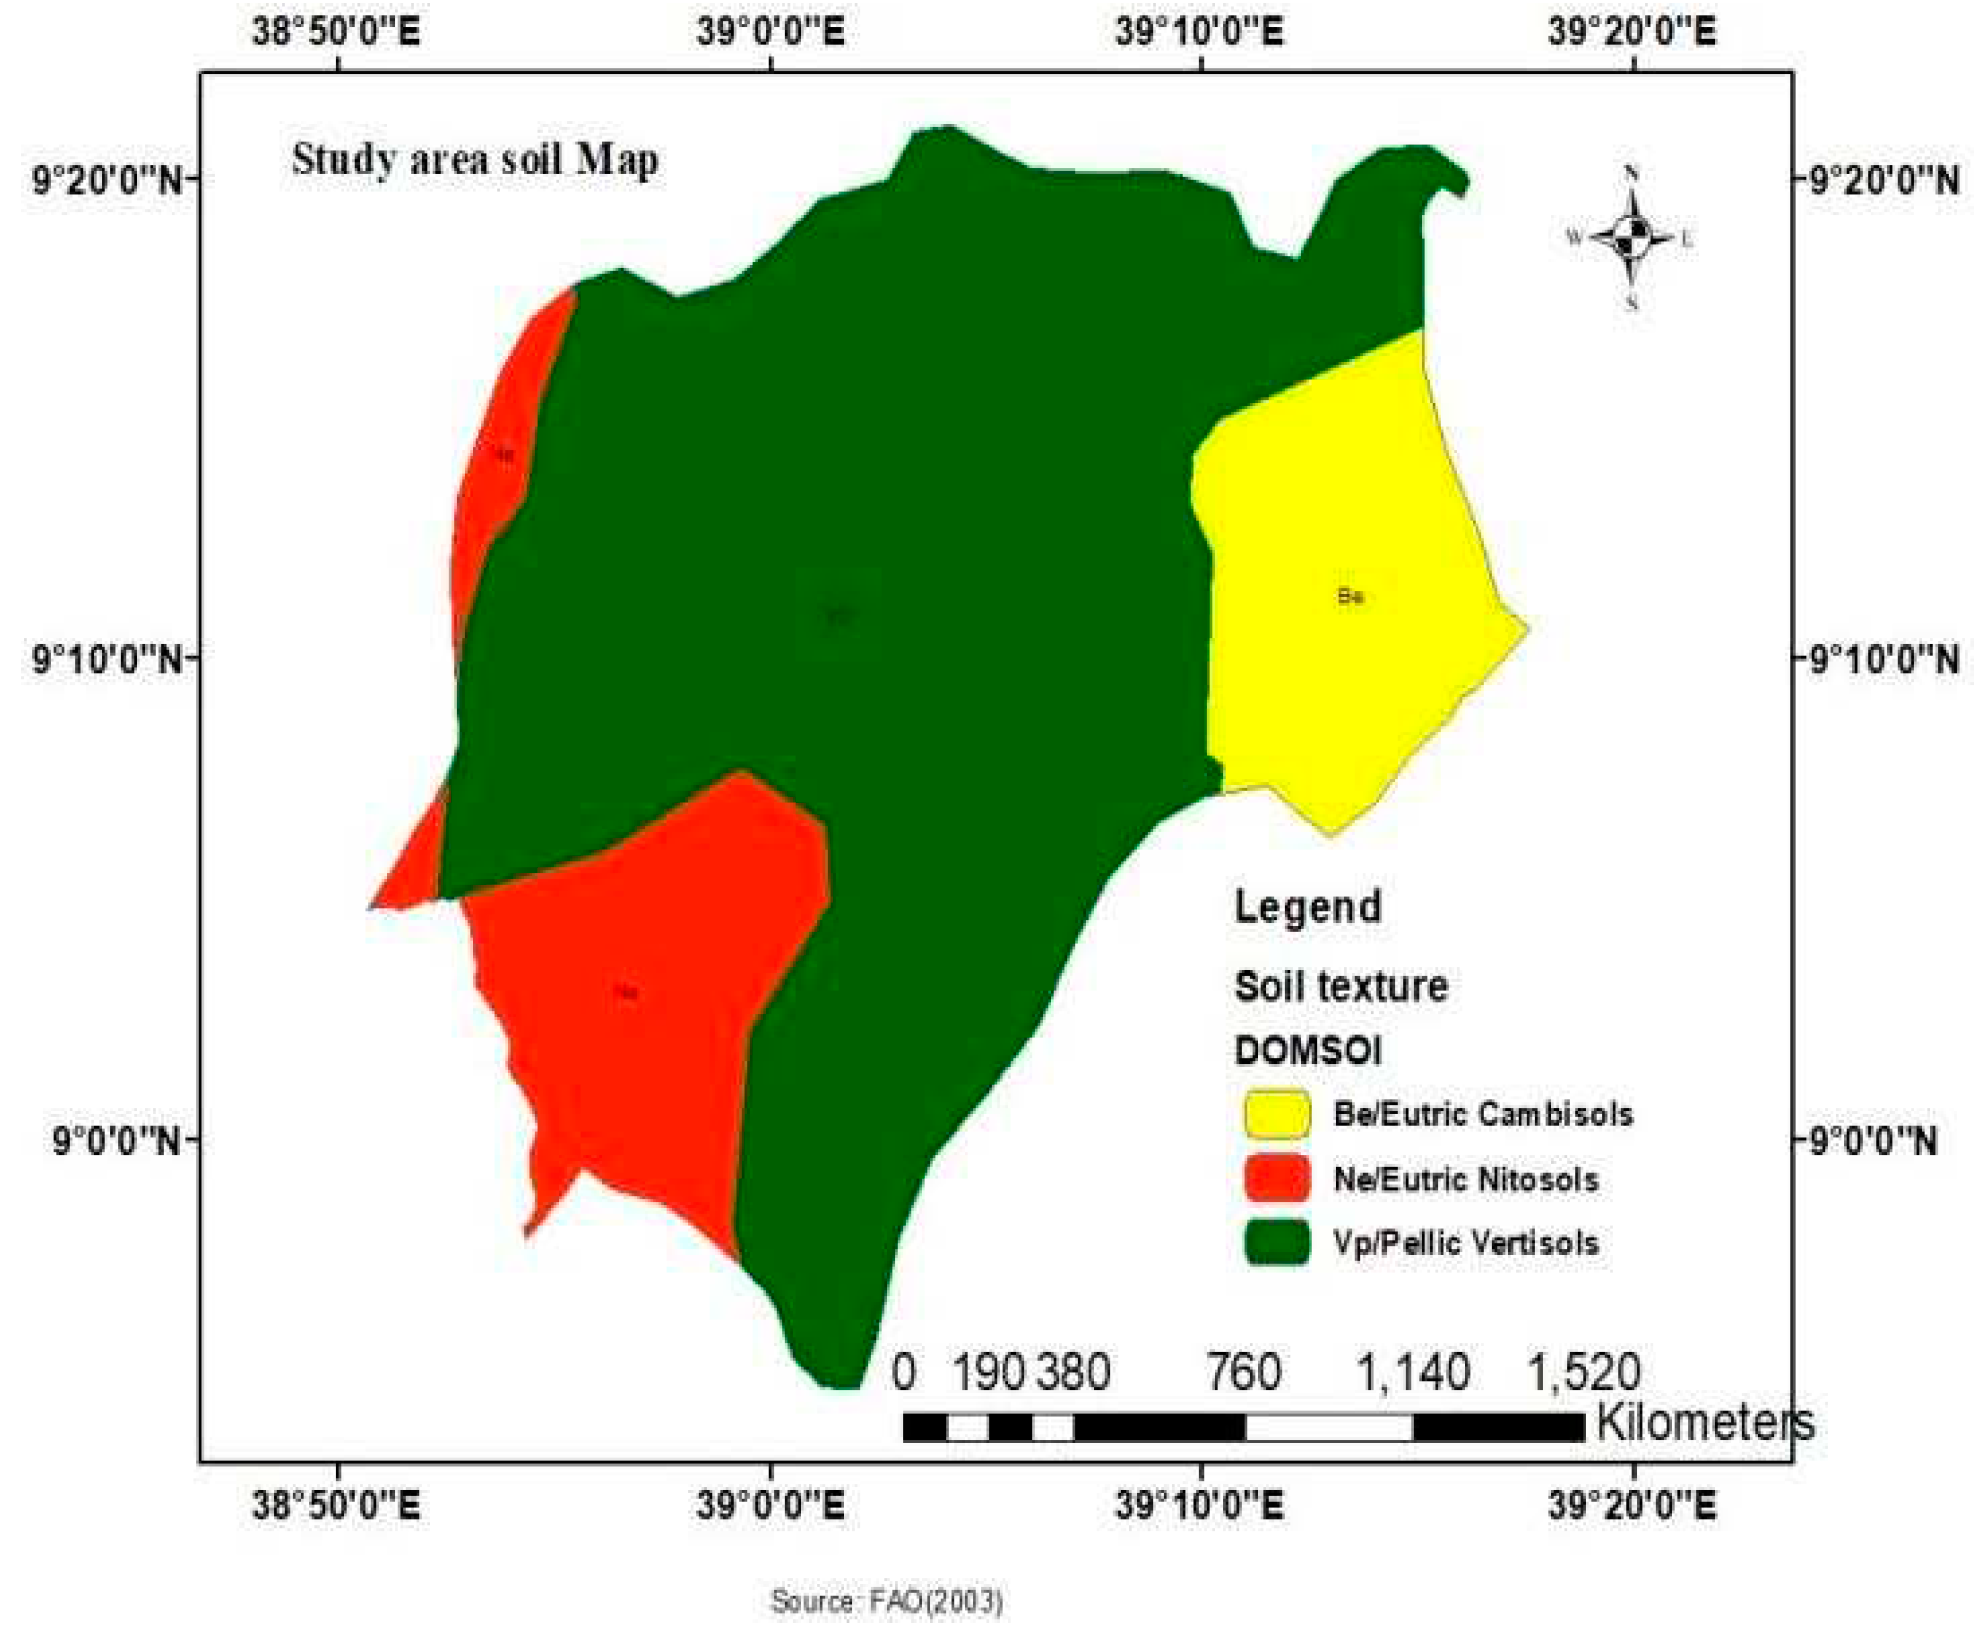
According to Bea, the permeability and porosity of a given soil control the vertical as well as horizontal movement of contamination. Soils should be of sufficiently low permeability to significantly slow the passage of leachate from the site. Thus, sites in clay-rich environments are preferable (Birkie et al., 2020). The area of study has characterized by specifically Bareh Aleltu woreda among which sendafa town is found. In these woreda, there are 3 soil type has exist. These Eutric cumbisols, Eutric Nitosol, and pellic vertisols are found in this region as of FAO (2003) soil classification shows. The most soil which is found in sendafa towns and surrounding among listed soil type the widest areal coverage is by pellic vertisols which covers 8574 km2. The other type Eutric cumbisols and Eutric Nitosol covers 942km2 and 1103 km2 respectively. The stated soil type can allow water to easily penetrate into the ground and it might have the chance for ground waste contaminations. Especially vertisols soil texture has such type of limitation.
Figure 9. Existing soil Type in the region. Source: FAO soil map generated by researcher by using arc map 10.1.
Preprints 97832 g009

4.4. LUCC of Study Area

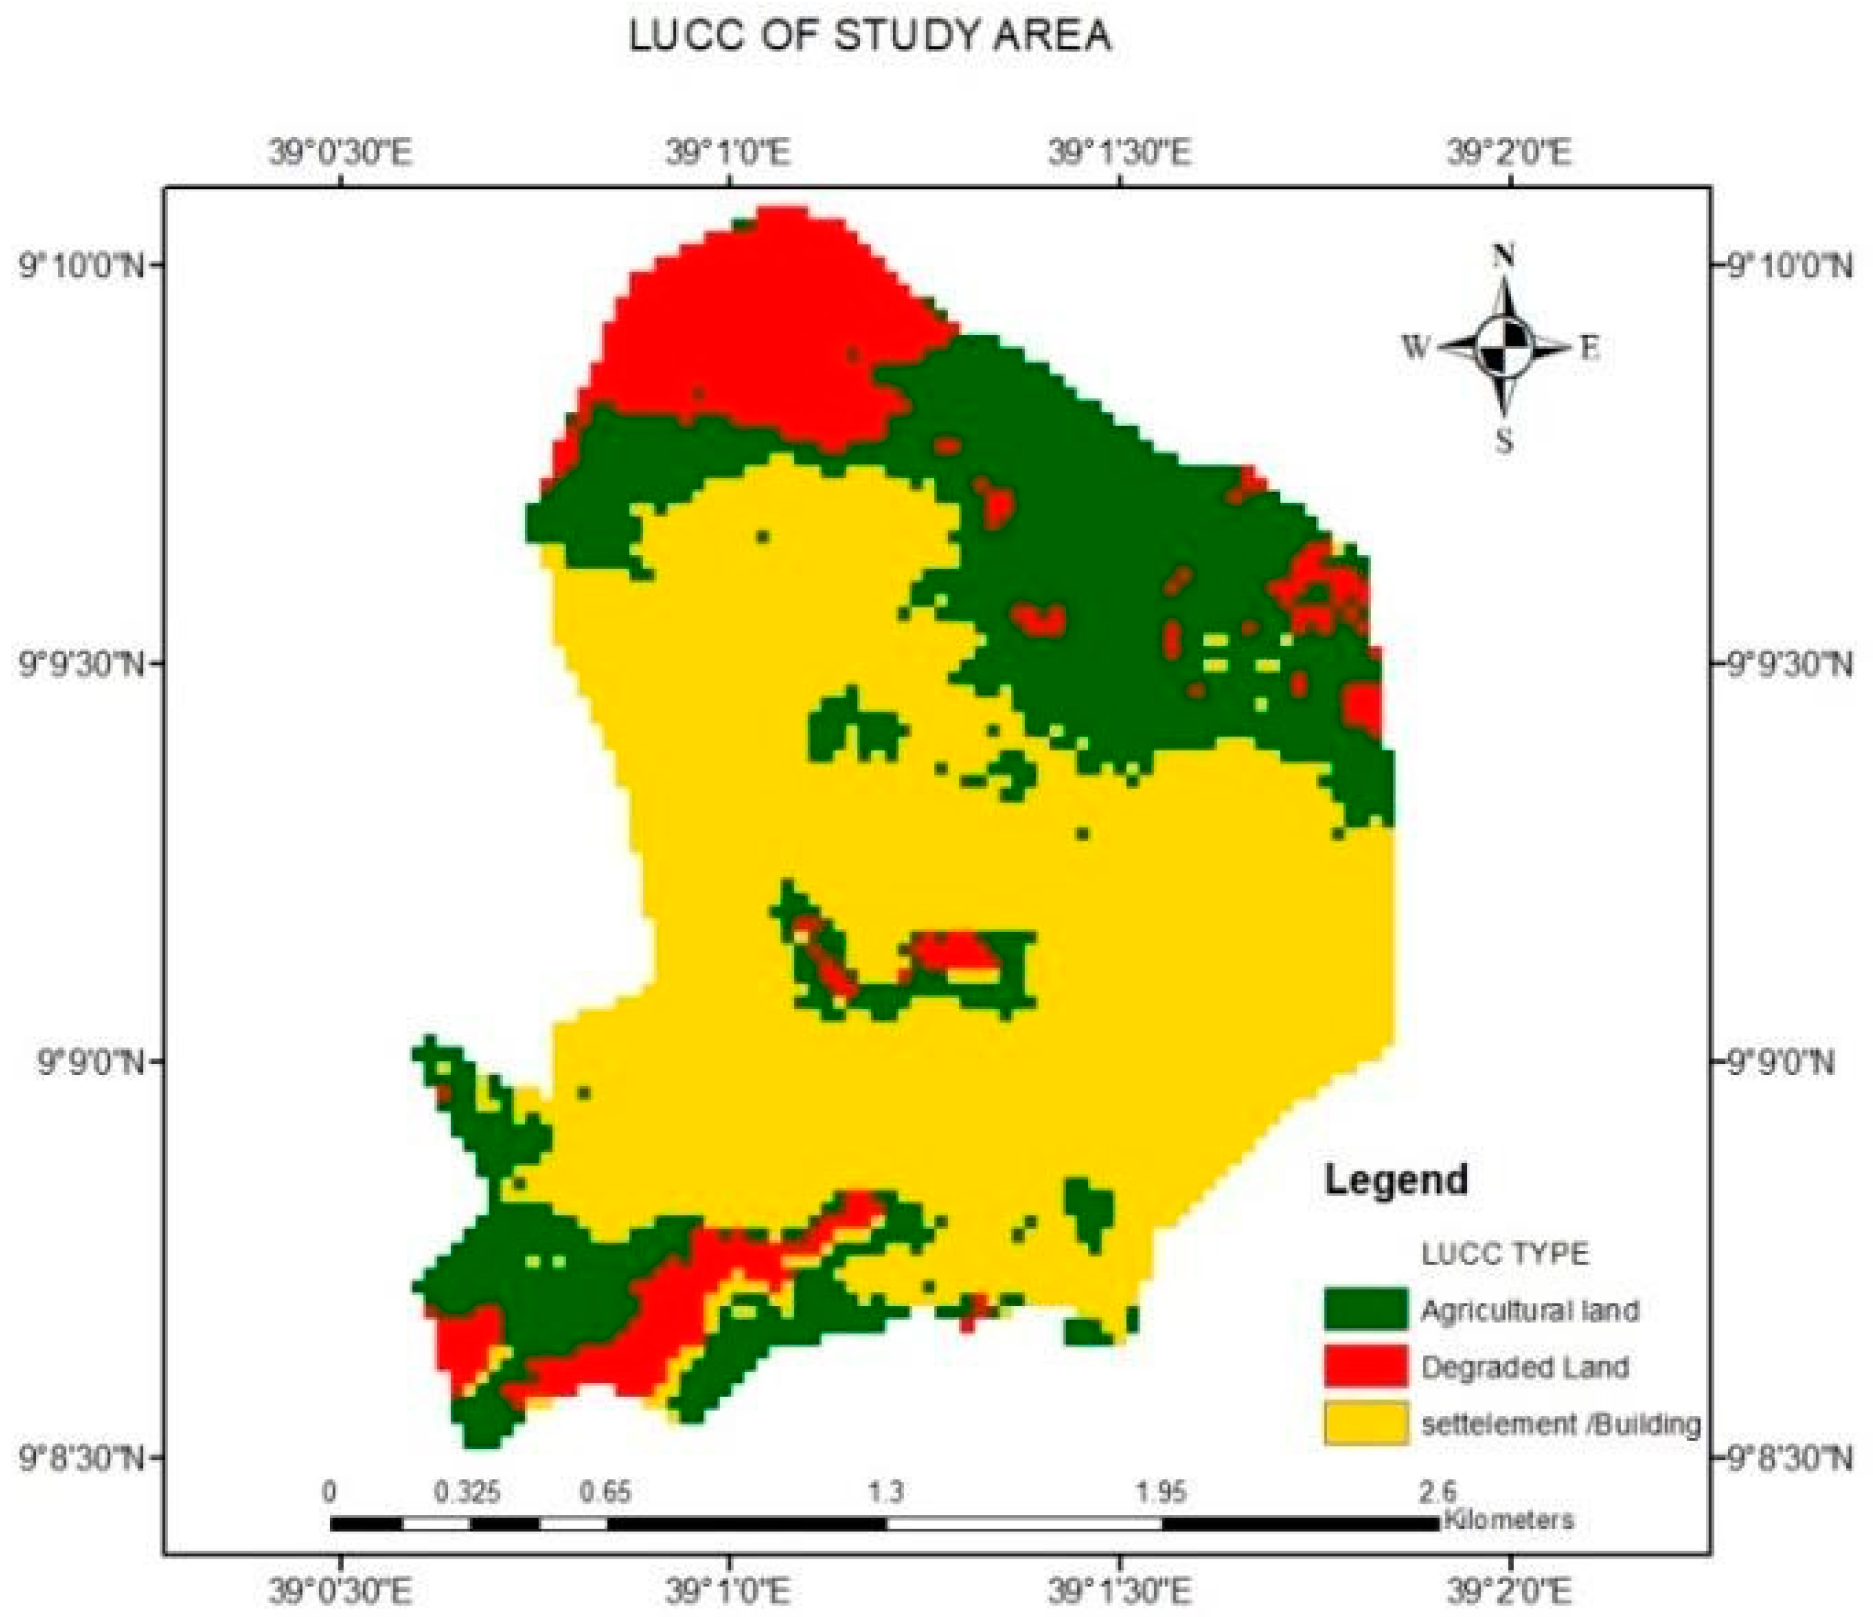
The study area for this study purpose classified as degraded land, Agricultural Land, settlement/building Area. The land use classification was done by using ERDAs software through supervised classification method by takin signature.
Table 10. Land use cover change of study area.
No Land use type Areal coverage sq. mile
1 Agricultural Land 0.503516
2 Degraded Land 0.200503
3 Settlement 0.960468
Source: Researcher own computation (2023).
From the table, we understand that in Sendafa town, 96% of the land is occupied by settlement, 50% by Agricultural land, and 20% by degraded land due to different factors like the installation of rock crushers and erosion that happen in the area. This is also one of the challenges that change the land surface and open the door for people to put solid waste in improper places.
Figure 10. LUCC of study Area. Source: Arc Map (2023) own computation.
Preprints 97832 g010

5. Conclusion and Recommendation

5.1. Conclusion

The result of this research identifies the district has an opportunity by mobilizing the larger community to encourage solid wastes management practice. Most gaps discussed under result phase shows there problems are related to transportation service, waste collectors related problems, land fill site related problems, municipalities low level of attention, low level of community awareness, and problem related with accessibility of road
Thus, 34.67% of participant indicate that, low level of public awareness as reason for improper solid waste management which is followed by lack of transportation (23.37%), insufficient income (16.33), unscheduled solid waste collector program (13.32%), road distance from main road to solid waste dump site and other related factors (4.52) had been identified as contributing reasons for improper solid waste management in the town. Results related to land fill site suitability shows that changes over such requirement will be needed. Problems related roads related, landfill site, public health related, towns topographic set up, financial access, awareness creation on land disposal site, mitigation of land shortage and installation of technology in solid waste dumping area aggravate landfill suitability problem by 37.7%.
Respondent’s interview result shows also the existence of related problem which need attention to implement sustainable solid waste management. To do these all expected stakeholder should take part in providing solution as public problem wide in scope. Problem related to solid waste management also one of the problem for public health since respective stake holders are not working collaboratively as results from interview shows. The collaborative plan of action plan between districts health office, districts Environmental control and solid waste control departments, and all other respective NGO like humanitarian institution would work with district to resolve problem.
As for community members not directly active in the solid waste management program, they need to participate in waste management by separating their wastes at source so that contamination will be prevented and district solid waste departments and waste pickers are facilitated. This study demonstrates that, designing project based solid waste management is needed by mobilization of over all residents of the town including those who live in their own house and rent house.

5.2. Recommendation Based on Research Findings

Even though we have in country level standardized laws, no more attention have been given to implement solid waste laws at districts department level, so as to have clean environment. The future change to have clean environment is not only depends on the implementation of state laws, but also it need the collaborative effort of all stakeholder such as NGO’s, towns administrators and groups of individuals who take part in collecting (waste collectors) as well as larger community themselves. The future of municipal solid waste management is not succeeded only by governmental institution, NGO’s and citizens participation, but also working up on citizens attitude and creating citizens who fell responsible for themselves and working on organized solid waste collector also need attention in realization of solid waste management practice.
Thus, to have proper solid waste management practice, researcher recommends that;
In order to have citizen’s positive attitude towards proper solid waste management practice town administrator should facilitate campaign and work shop or seminars to create awareness and initiating community on solid waste management program. This must include all mobile and permanent resident participation.
Facilitate transportation service from one corner to the other by creating land fill site at equitable place by designing project as per of needed requirement.
Resource mobilization and searching for donors during project implementation also needed to have sustainable solid waste management. This done by creating initiative campaign.
Identifying proper landfill site is also need attention, so the respective town and district administrator should have to work upon this issue.
Installing technology would also other alternative to minimize improper solid waste management, so the respective should have to work up on this through designing projects into phase.
Implementation of existing laws to safeguard environmental sustainability. This helps those who work on solid waste to take action on those who put solid wastes at improper place.

Acknowledgments

My praise is primarily directed toward the all-powerful God, who sustains me in every aspect of life and keeps me strong enough to do all of my tasks. I must admit that without creative thinking and the ethical and academic advice of my advisor, Dr. Abdulaziz Abdulsemed Mosa, this project would not have materialized. He pays attention to me and completes my task by giving me all of his time. Actually grateful. Special thanks should also go to my wife Weynishet Habte, my father Legesse Bedane, and my mother Tayitu Tolcha for helping me out with ideas and money while still taking care of my family. Because of your encouragement to raise the caliber of my work, I shall remember the scarification you all made throughout the rest of my life. Finally, I would want to express my sincere gratitude to the Sendafa town administrators and all affected residents, according to their status. I take this opportunity to thank each of you for supporting me by informing me know about any research gaps that exist, without which it would be difficult for me to finish this project.

Conflicts of Interest

Researcher has no conflicts of interest to disclose.

List of Abbreviations

ATLAS.ti.: Computer Based Qualitative Data Analysis Software BMP: Business Process Management
EPM: Environmental Planning Management GIS: Geographic Information System
Hhs: House Holds (residents of municipality) IF: Institutional Factors
ISWM: Improper Solid Waste Management
OECD: Organization for Economic Co-operation and Development
SAS: Analytics, Artificial Intelligence and Data Management SLM: Solid Waste Management
SPSS: statistical Package for Social Science STATA: Statistical Software

References

  1. Abebaw and ayenew. (2005). Demand for improved solid waste service in Jimma Town, Ethiopia : Evidence From Household survey Data.
  2. Birkie, A., Addisu, S., & Mekuriaw, A. (2020). Solid waste management practice and dumpsite suitability analysis using GIS technology in Debre Markos town, Ethiopia. Ethiopian Journal of Science and Technology, 13(2), 115–130. [CrossRef]
  3. Helelo, Ab; Senbeta, Af; Anshebo, S. (2019). Assessment of Solid Waste Management ( SWM ) Practices in Hawassa University.
  4. C. R. kothari. (2004). Research Methodology : Methods and techniques(second revision). New age international publisher.
  5. Ching, K., Wang, M., Lee, K. E., & Mokhtar, M. (2021). Solid Waste Management in Small Tourism Islands : An Evolutionary Governance Approach.
  6. Debrah, V. and D. (2021). Raising Awareness on Solid Waste Management through Formal Education for Sustainability : A Developing Countries.
  7. Gorfnesh, Million, & Amade and Gizachew. (2019). Assessment of status of solid waste management in Asella town, Ethiopia.
  8. Massoud, M. A., Mokbel, M., Alawieh, S., & Yassin, N. (2020). Towards improved governance for sustainable solid waste management in Lebanon : Centralised vs decentralised approaches. [CrossRef]
  9. Medina-salas, L. De, Castillo-gonzález, E., Giraldi-díaz, M. R., & Jamed-boza, L. O. (2019). Valorisation of the organic fraction of municipal solid waste. [CrossRef]
  10. Mtey, J. K. (2005). Project proposal for solid waste collection : Kawe Community Development Trust.
  11. Põldnurk, J. (2015). Optimization of the economic, environmental and administrative efficiency of the municipal waste management model in rural areas. Resources, Conservation and Recycling, 97, 55–65. [CrossRef]
  12. Singh, A. (2021). Basic Steps of Doing Research. September. [CrossRef]
  13. Sultan, S. (2017). Solid Waste Management in Urban India : An Overview. 5(4), 61–69. [CrossRef]
  14. Grömping, U. (2016). Practical Guide to Logistic Regression. In Journal of Statistical Software (Vol. 71, Issue Book Review 3).
  15. Pongrácz, E., Phillips, P. S., & Keiski, R. L. (2004). Evolving the theory of waste management: Defining key concepts. Waste Management and the Environment II, 471–480.
  16. Ross, S. M. (2017). Linear Regression. Introductory Statistics, 519–584. [CrossRef]
  17. Girly Lagbas -Aranas, A. U. (2015). The Theoritical Underpinnings of The Solid Waste Management Practices: A Proposed Blueprint Towards Government Action. European Scientific Journal, 11(23),1857–7881.
  18. Esayas (2019). The effect of selected human resource management practices on employee’s turnover intention: the case of civil employees of Ethiopian federal police commission: A Thesis Submitted to Addis Ababa University School of Commerce Graduate Studies Program.
Disclaimer/Publisher’s Note: The statements, opinions and data contained in all publications are solely those of the individual author(s) and contributor(s) and not of MDPI and/or the editor(s). MDPI and/or the editor(s) disclaim responsibility for any injury to people or property resulting from any ideas, methods, instructions or products referred to in the content.
Copyright: This open access article is published under a Creative Commons CC BY 4.0 license, which permit the free download, distribution, and reuse, provided that the author and preprint are cited in any reuse.
Prerpints.org logo

Preprints.org is a free preprint server supported by MDPI in Basel, Switzerland.

Subscribe

© 2024 MDPI (Basel, Switzerland) unless otherwise stated