Preprint
Article

The Potential of Regional Food Product Quince in Powdered Form as a Good Source of Bioactive Compounds

Altmetrics

Downloads

95

Views

43

Comments

0

Submitted:

25 January 2024

Posted:

26 January 2024

You are already at the latest version

Alerts
Abstract
(1) Background: The research on the potential of regional food products, known for their rich bio-active compound content, could enhance human health in local populations. This is especially pertinent amid the Covid-19 pandemic and global trade disruptions; (2) Methods: The current study evaluated the physico-chemical composition using standard methods, antioxidant activity via DPPH, ABTS, FRAP, and CUPRAC methods, sorption capacity (at 10°C, 25°C, and 40°C with water activity ranging from 0.1 to 0.9) through the static-gravimetric method, and monolayer moisture content (MMC) calculated using the BET model; (3) Results: The approximate physi-co-chemical composition of laboratory-produced quince powder is as follows: proteins - 1.27g, carbohydrates - 75.80g, fats - 0.49g, fibers - 21.50g, ash – 2.31g, and nutritional value – 355.65kcal. Antioxidant activity is confirmed by all methods. The Modified Halsey model is recommended to describe the sorption isotherms with an S-shaped form. The MMC for the adsorption process ranges from 14.41% d.b. to 7.09% d.b., and for the desorption process, it ranges from 13.11% d.b. to 7.80% d.b.; (4) Conclusions: Seasonal and regional foods boast the best nutritional profiles, as they are cultivated and harvested at optimal ripeness in natural sunlight, preserving the essential vitamins and minerals in the food.
Keywords: 
Subject: Chemistry and Materials Science  -   Materials Science and Technology

1. Introduction

Common quince (Cydonia oblonga), a member of the Rosaceae family, boasts bright golden-yellow seeded fruits renowned for their astringency and captivating aroma. Originating from Iran, this distinctive fruit has found its way to various corners of the world, including New Zealand, Greece, France, Argentina, and our Balkan region [1,2]. In terms of appearance, quince fruits share similarities with apples and pears but stand out with their shapelessness and larger size. The yellow-gold surface, sometimes adorned with a mossy covering, contributes to their unique astringent taste, a quality attributed to the presence of antiseptic tannins. Beyond its culinary appeal, quince proves to be a valuable natural health product, combating infections across various body systems [2,3,4].
Abundant in pectin, cellulose, and essential vitamins (C and B3), as well as vital minerals like phosphorus, calcium, magnesium, and sodium, quince also contains trace amounts of copper, manganese, cobalt, vitamin A, and iron. Notably, the quince bark, enriched with hydroxycinnamic acids and flavonols, exhibits antioxidant properties, including antihemolytic effects [5,6]. Furthermore, quince seeds contain vitamin B17 (laetrile or amygdalin), renowned for its unique anticancer properties. Despite various claims, quince remains most beneficial in its raw, natural form. A decoction of dried quince leaves has been proven to alleviate coughs and respiratory problems and soothe asthma attacks. [7,8].
In the context of the COVID-19 pandemic and global trade disruptions, the significance of regional food sources becomes increasingly apparent. Seasonal and regional foods, cultivated and harvested at peak ripeness under natural sunlight, retain their essential vitamins and minerals without extensive processing. Opting for local products not only ensures a diet rich in nutrients but also promotes a lifestyle free from preservatives and pesticides [9,10].
It is widely believed that individuals derive the most benefits from consuming characteristic regional foods based on their origin. While experimenting with various foods is encouraged, the body often requires a balance that aligns with one's cultural and regional background. Following the "eat the rainbow" principle by incorporating a variety of fruits and vegetables into our diet provides diverse phytonutrients crucial for overall health. Recent studies recommend including over 25 types of fruits and vegetables weekly to support a diverse microbiome [11,12].
These insights underscore the bioactive potential of regional fruits and vegetables, with specific emphasis on the Bulgarian quince, even if not explicitly highlighted in the existing literature.

2. Materials and Methods

2.1. Material

Quince (Cydonia oblonga Mill.), sourced locally from the village of Smilets near Pazardzhik city, Bulgaria, undergoes a meticulous preparation process. The procedure involves washing, peeling, and drying the fruits. These fruits are sliced into small pieces, approximately 3.0mm to 5.0mm in thickness, with the removal of seeds. The freshly sliced quince is then arranged in a single layer on a Food Dehydrator (Dryer) Machine and subjected to a 10-hour drying period at 45°C, or until the moisture content falls within the range of 9% to 13%, ensuring they attain complete dryness and brittleness. Following the drying phase, the quince slices are finely milled using a Nutri-bullet blender into a powdered form. This entire preparation process takes place at the Technical University of Sofia, branch Plovdiv, Bulgaria.

2.2. Methods

The analysis of quince powder involved the assessment of moisture, protein, fat, ash, and dietary fiber content in accordance with established food analysis methods [13]. Specifically, protein content was determined by multiplying the quantified nitrogen using the conversion factor 6.25 (AOAC 920.152). The fat, obtained through Soxhlet, was determined gravimetrically after solvent removal (AOAC 920.85). Ash content was acquired by burning at approximately 550 °C (AOAC 940.26), and dietary fiber was obtained through the enzyme-gravimetric method (AOAC 985.29). Carbohydrates were calculated as the residual fraction. Results are expressed as g/100 g dry weight (dw). The nutritional energy value (kcal/100 g fw and dw) was computed using the following conversion factors: 9 kcal/g for fat, 4 kcal/g for protein and carbohydrates, and 2 kcal/g for fiber.
Color measurements were conducted employing a colorimeter (model PCE-CSM, Germany) with a viewing angle of 0° and a pulsed xenon lamp as the light source. The instrument provides readings in terms of color coordinates, where L* represents whiteness to darkness, a* denotes redness to greenness, and b* signifies yellowness to blue. Instrument calibration was executed using a standard white plate, and samples were positioned on a petri dish for each measurement.
The hue angle (H°) and chromaticity (C) were calculated using the following equations [Eq. 1 and Eq. 2]:
[Eq. 1] H ° = 360 + t a n 1 b * a * , w h e r e   b * < 0 [Eq. 2] C = a * 2 + b * 2
The antioxidant activity of quince powder assessed through DPPH (1,1-diphenyl-2-picrylhydrazyl rad-ical), ABTS (2,2′-azino-bis(3-ethylbenzothiazoline-6-sulfonic acid)), FRAP (Ferric Re-ducing Antioxidant Power Assay), and CUPRAC (CUPric Reducing Antioxidant Ca-pacity), was conducted through a two-step triple extraction. Approximately 1g of the sample was mixed with 10 ml of 70% ethanol and conducted in a water bath at 80 °C. Additionally, using an ultrasonic bath, ultrasonic extraction was carried out at a temperature of 50 °C, repeated three times in 20-minute intervals. After the extraction process, the sample was centrifuged at 6000 rpm for 15 min. The supernatant was transferred to a new tube, and another 10 ml of ethanol was added to the precipitate for the second extraction. After the third extraction, the supernatants were mixed and stored in a refrigerator. The protocol for the methods adhered to the description comprehensively detailed in two articles by Ivanov et al. (2014) and Bogoeva et al. (2017) [14,15].
The characteristics of sorption of Bulgarian quince powder (equilibrium moisture content and monolayer moisture content) are conducted following the specification of the static-gravimetric method (at 10°C, 25°C and 40°C and water activity of 0.1 to 0.9) and the detailed steps describe in the article of Bogoeva, 2020 [16]. For the analysis, the sample undergoes preparation by placing a portion in a desiccator over distilled water for desorption, while another portion is placed in a desiccator over CaCl2 for adsorption. Following 20 days of hydration of one part and dehydration of the other part, the resulting powder is transferred to aluminum weighing plates and measured (1.0000g ± 0.0050g) using the analytical balance. Hygrostats, consisting of borosilicate glass jars with acrylic plastic lids featuring silicone rings, are prepared for use with saturated salt solutions derived from LiCl, CH3COOK, MgCl2, K2CO3, MgNO3, NaBr, NaCl, KCl, creating conditions for water activity (aw) ranging from 0.1 to 0.9. Thymol crystals are introduced into each hygrostat with a water activity exceeding 0.5 to prevent microbiological growth. The weighed samples are then placed in the prepared jars, positioned in three distinct thermostats set at temperatures of 10°C, 25°C, and 40°C. These samples remain in these environments until they reach equilibrium moisture content, typically around one month [16].
Several mathematical models are available for predicting the equilibrium moisture content. To analyze the obtained equilibrium sorption data, four modified three-parametrical models, namely Oswin [Eq. 3], Henderson [Eq. 4], Ching-Pfost [Eq. 5], and Halsey [Eq. 6], were chosen.
M = ( A + B t ) a w 1 a w C
1 a w = exp A t + B M C
a w = exp A t + B exp C M
a w = exp exp A + B t M C
The equations [Eq. 3, Eq. 4, Eq. 5 and Eq. 6] involve parameters such as moisture content (M in % d.b.), water activity (aw in decimal), and coefficients A, B, and C, with temperature (t in °C) playing a role. The fitting of these modified models was executed using the computer program StatSoft’s STATISTICA 12. Evaluation, estimation, and comparison of the models were performed based on three criteria: mean relative error (P%) [Eq. 7], standard error of moisture (SEM) [Eq. 8], and randomness of residuals [Eq. 9], according to the equations used of Durakova, 2020 [17].
P = 100 N M i M ^ i M i
S E M = M i M ^ i 2 d f
e i = M i M ^ i
The monolayer moisture content represents the maximum amount of moisture that the powder can retain on its surface at given temperatures (10°C, 25°C, and 40°C) and relative air humidity ranging from 11% to 87%. The powder remains dry when the moisture content is below the monolayer level, but it can become sticky, clump together, or spoil when it exceeds this level. Calculation of the monolayer moisture content involves the linearization of the Brunauer-Emmett-Teller equation [Eq. 10], where parameters include monolayer moisture content (M in % d.b.), water activity (aw in decimal), and the coefficient C [16,17].
M = M e C a w ( 1 a w ) ( 1 a w + C a w )

3. Results & Discussion

3.1. Approximate phisico-chemical composition

Quince flour is a versatile product within the food chain, providing a rich source of nutrients and functional compounds. Due to these valuable properties, the nutritional and chemical composition of quince flour has been analyzed.
Table 1 presents the nutritional composition of quince flour, detailing moisture, fat, protein, ash, dietary fiber, carbohydrates, and energy value. Quince flour primarily consists of carbohydrates (75.80 g/100 g) and is notably high in dietary fiber (21.50 g/100 g). Dietary fiber comprises various carbohydrates that resist hydrolysis or absorption in the human small intestine, contributing to health benefits, especially for gastrointestinal function [18].
In accordance with European regulations, a food product can claim to be a "source of fiber" if it contains at least 3 g/100 g and "high in fiber" if it contains 6 g/100 g or more [19]. Quince fruit flour, meeting these criteria, can be labeled as "high in fiber." Additionally, the contents of ash (total minerals), protein, and fat are present in smaller amounts, measuring 2.21 g/100 g, 1.27 g/100 g, and 0.49 g/100 g, respectively. The energy value of quince flour is 355.65 kcal.
Table 1. Approximate physico-chemical composition and nutritional values of quince powder.
Parameters Results,
g per 100 g of sample
Carbohydrates 75.80±0.28
Ash content 2.31±0.13
Fiber 21.50±1.84
Protein 1.27±0.10
Lipids 0.49±0.12
Nutritional values 355.65±1.07

3.2. Color characteristics

Color parameters are crucial indicators of quality, significantly influencing consumers' willingness to purchase a food product. The instrumental color analysis revealed that quince flour exhibits relatively light characteristics, with a high color brightness value, L* = 50.21 (Figure 1).
Higher L* values do not necessarily indicate a decline in product quality; rather, it may be attributed to the dilution effect of the wall materials [20]. Additionally, recorded parameter values a* (red color coordinate) and b* (yellow color coordinate) for quince flour were a* = 11.35 and b* = 27.51. The b* parameter indicates that quince flour particles lean toward the yellow color coordinate. The shade angle (H*) reflects the characteristic color of the powder, where a hue angle of 0°, 90°, 180°, and 270° represents red, yellow, green, and blue colors, respectively [21]. Quince particles, in this case, exhibited values from the yellow coordinate (67.59±0.38). Furthermore, the color saturation (C*) of quince flour (29.76±0.53) serves as a measure of color purity.

3.3. Antioxidant activity of quince powder

As a food source that is both relatively inexpensive and health-promoting Quince's high polyphenol content makes it well known for its antibacterial and antioxidant qualities [22,23,24,25].
In the present study four different methods are used and antioxidant activity of quince powder is detected in all of them. Results are presented in Table 2 as mM Trolox equivalent per gram extract and mM Trolox equivalent per gram dry weight.
The higher result is obtained via DPPH method (65.09±6.80 mMTE/g extract, 45.57±4.76 mMTE/g dry weight). In addition, quince powder was obtained by drying in a food dehydrator, which according to some authors leads to an increase in the content of phenolic compounds and improved antioxidant activity compared to fresh fruit [15,26,27].
Specifically, because quince fruit has higher levels of phenolic components and a larger antioxidant capacity than apple or pear [28,29], using it as an antioxidant source can be beneficial in nutraceuticals and open up new uses for quince fruit [30]. The powdering method makes it simple to incorporate quince fruit into new food recipes as a nutritional supplement.

3.4. Sorption characteristics

3.4.1. Equilibrium moisture content

To delve into the sorption characteristics of the laboratory-produced flour derived from the edible part of Bulgarian quince, the investigation initiated with the determination of the initial moisture content, which was identified as 10.14%. Subsequently, the powdered product underwent a controlled cycle of hydration and dehydration conditions over a span of 10 days. Distilled water was employed for the hydration phase, while CaCl2 was utilized for the dehydration phase.
During the absorption process, meticulous adjustments were made to dehydrate the product, ultimately achieving a moisture content level of 5.52%. In contrast, the desorption process involved a careful hydration regimen, resulting in the attainment of a moisture content level of 26.68%. This specific step is crucial in the overall process as it facilitates the determination of values representing the sorption capacity of the flour.
The outcomes of these processes, elucidating the equilibrium moisture content values, have been meticulously recorded and are presented in detail in Table 3 and Table 4. These tables serve as comprehensive repositories of the data obtained during the hydration and dehydration cycles, providing valuable insights into the sorption characteristics of the laboratory-produced flour from the edible part of the Bulgarian quince.
In both processes, a behavior typical of a significant number of food products is evident: as the temperature rises while maintaining a constant water activity, there is a notable decrease in the equilibrium moisture content [16,17,31,32,33]. This phenomenon is in line with the well-established principle observed in the field.
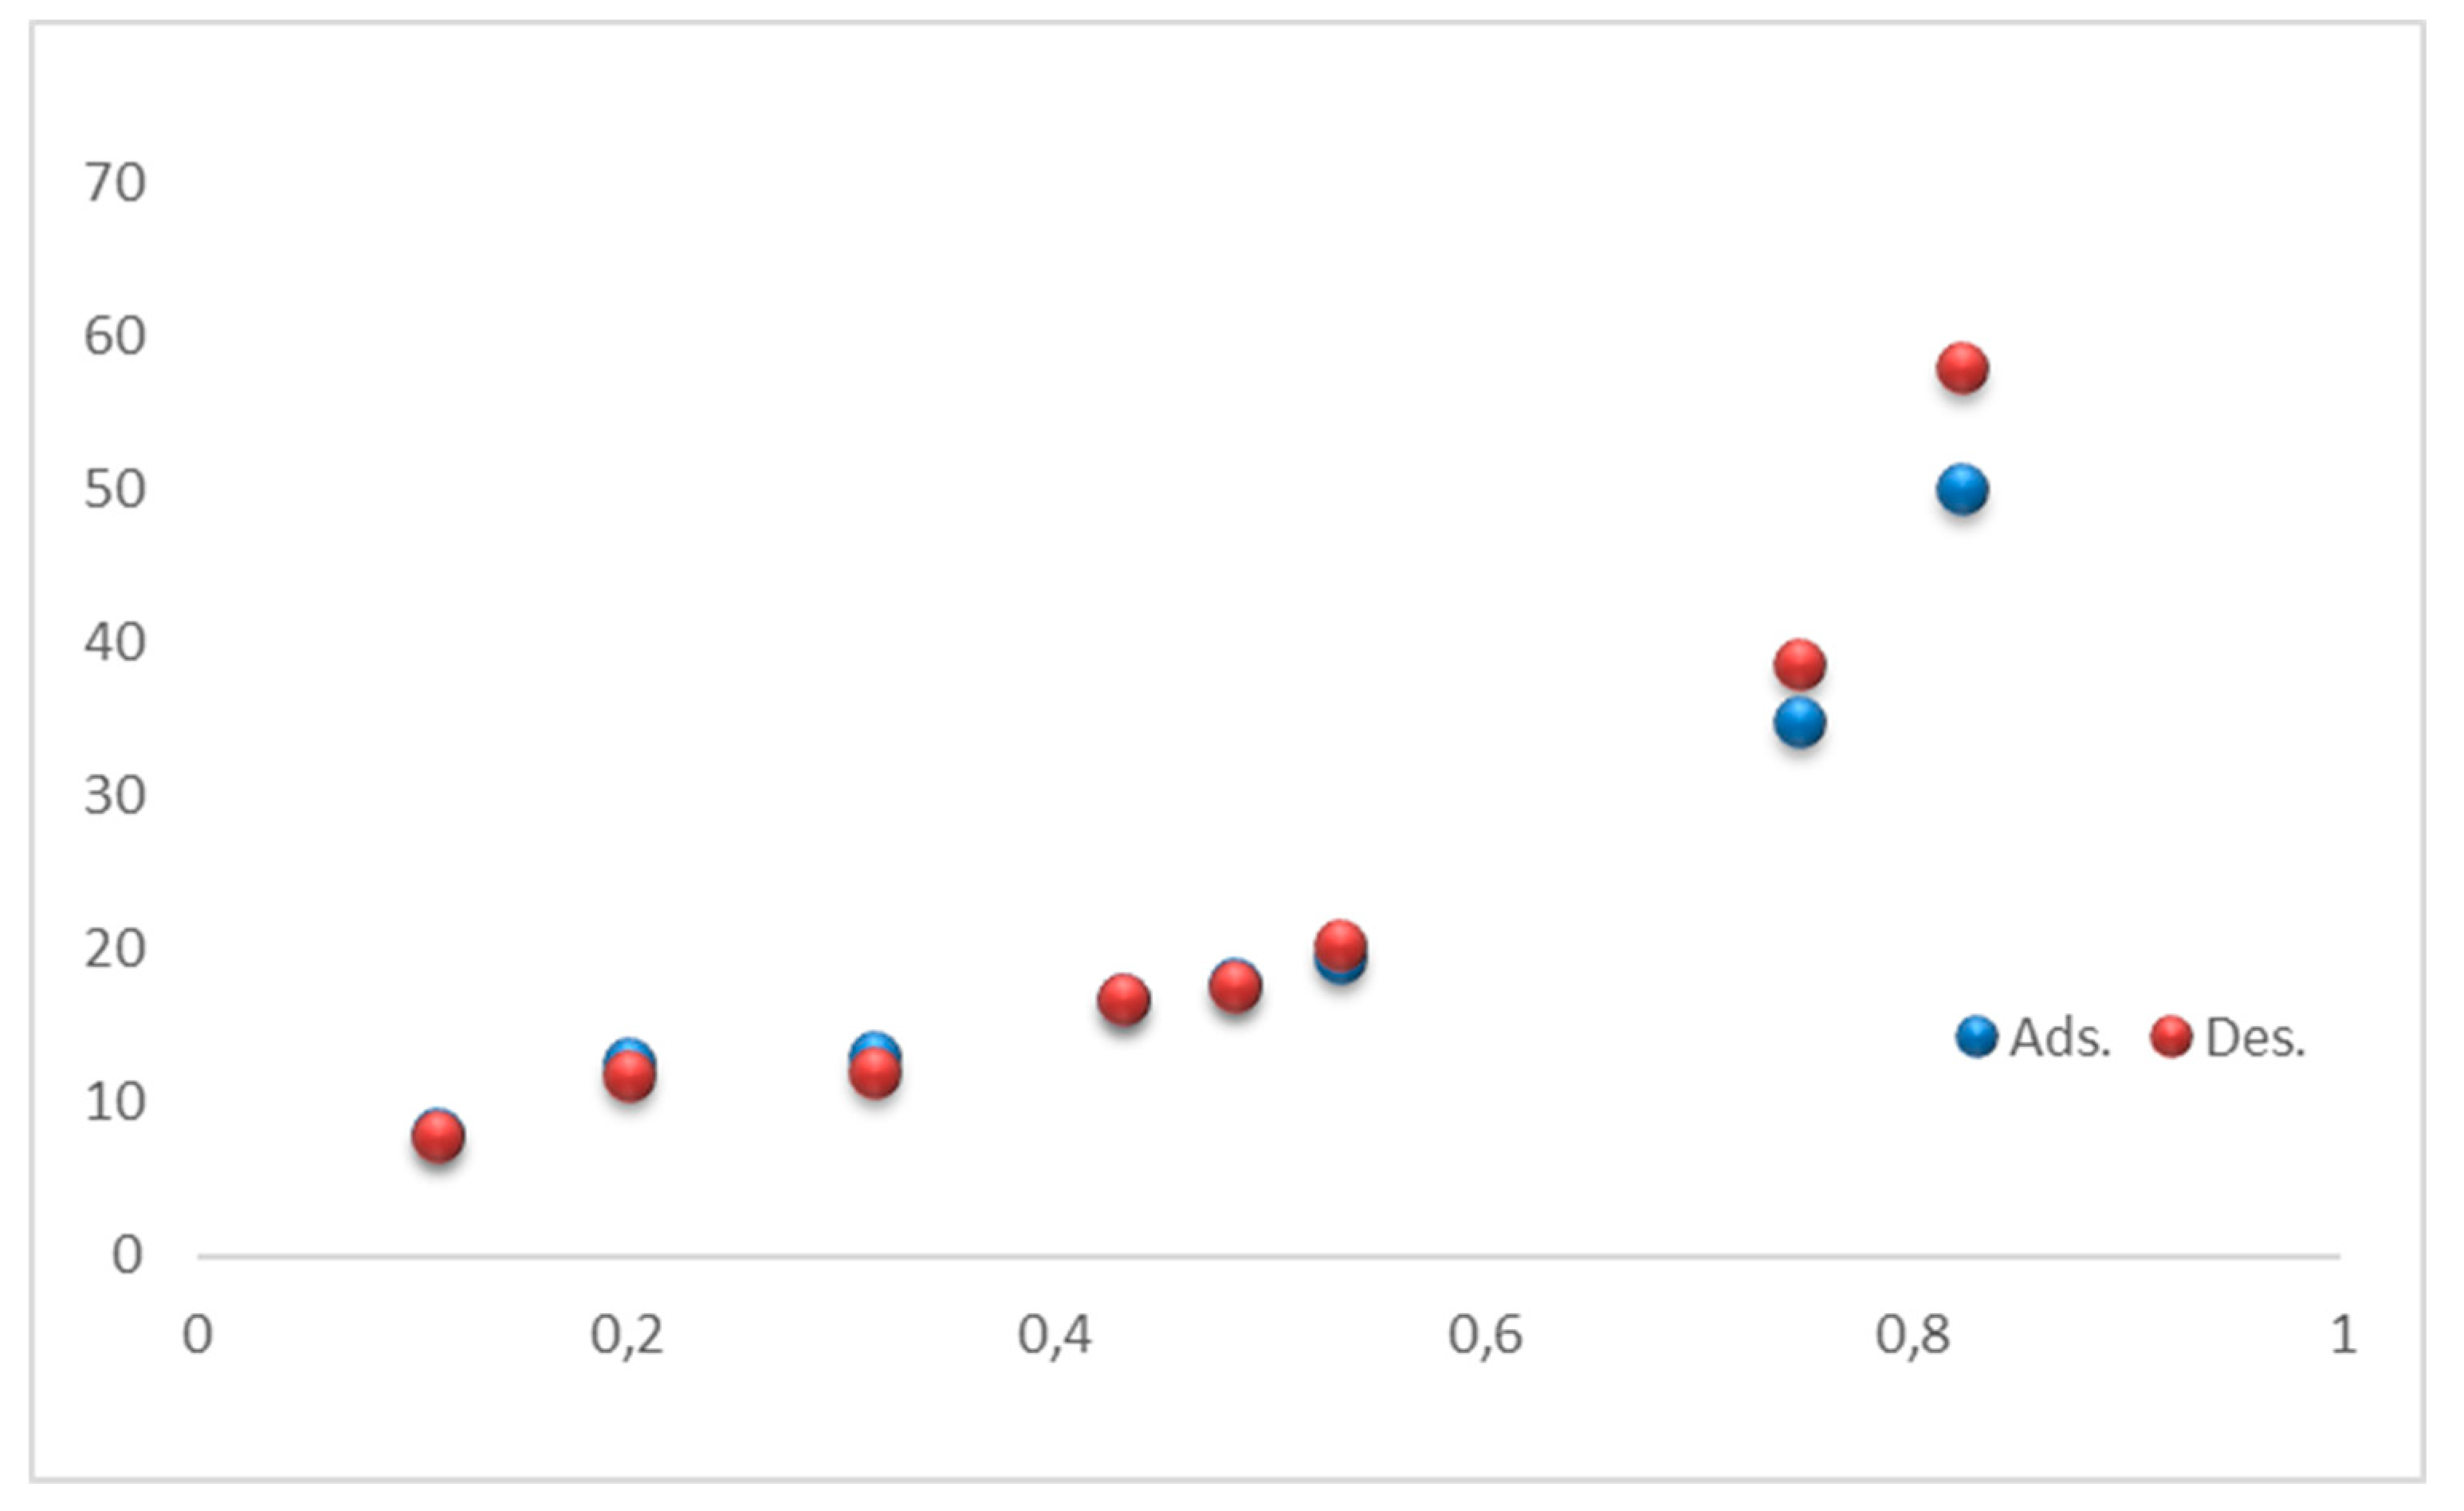
To visually depict and compare the sorption characteristics, Figure 2 has been included, showcasing the sorption isotherms under experimental conditions at a temperature of 40°C. The graphical representation distinctly highlights that the isotherms conform to the characteristics of type II, as per the classification outlined by Brunauer et al. in 1940 [34]. This classification system provides insights into the interaction between moisture content and water activity, further aiding in the understanding of the sorption behavior observed in the laboratory-produced flour from the edible part of the Bulgarian quince.

3.4.2. Modified three-parametrical models

The derived coefficients (A, B, C) for the three-parameter models, namely Oswin, Halsey, Henderson, and Chung-Pfost, are meticulously calculated and outlined in Table 5 for the adsorption process and Table 6 for the desorption process. These coefficients play a crucial role in these models, providing insights into the specific characteristics of the sorption behavior observed during both processes.
Table 5 offers a comprehensive presentation of the calculated coefficients and is complemented by additional parameters such as the mean relative error (P%) and the standard deviation (SEM). These metrics contribute to a more thorough evaluation of the accuracy and reliability of the models employed during the adsorption process.
Similarly, Table 6 provides a detailed breakdown of the coefficients A, B, and C for the selected three-parameter models, offering a comparative analysis with additional insights into mean relative error (P%) and standard deviation (SEM) for the desorption process. This comprehensive data presentation serves as a valuable reference point for further analysis and interpretation of the sorption characteristics of the laboratory-produced flour from the edible part of the Bulgarian quince.
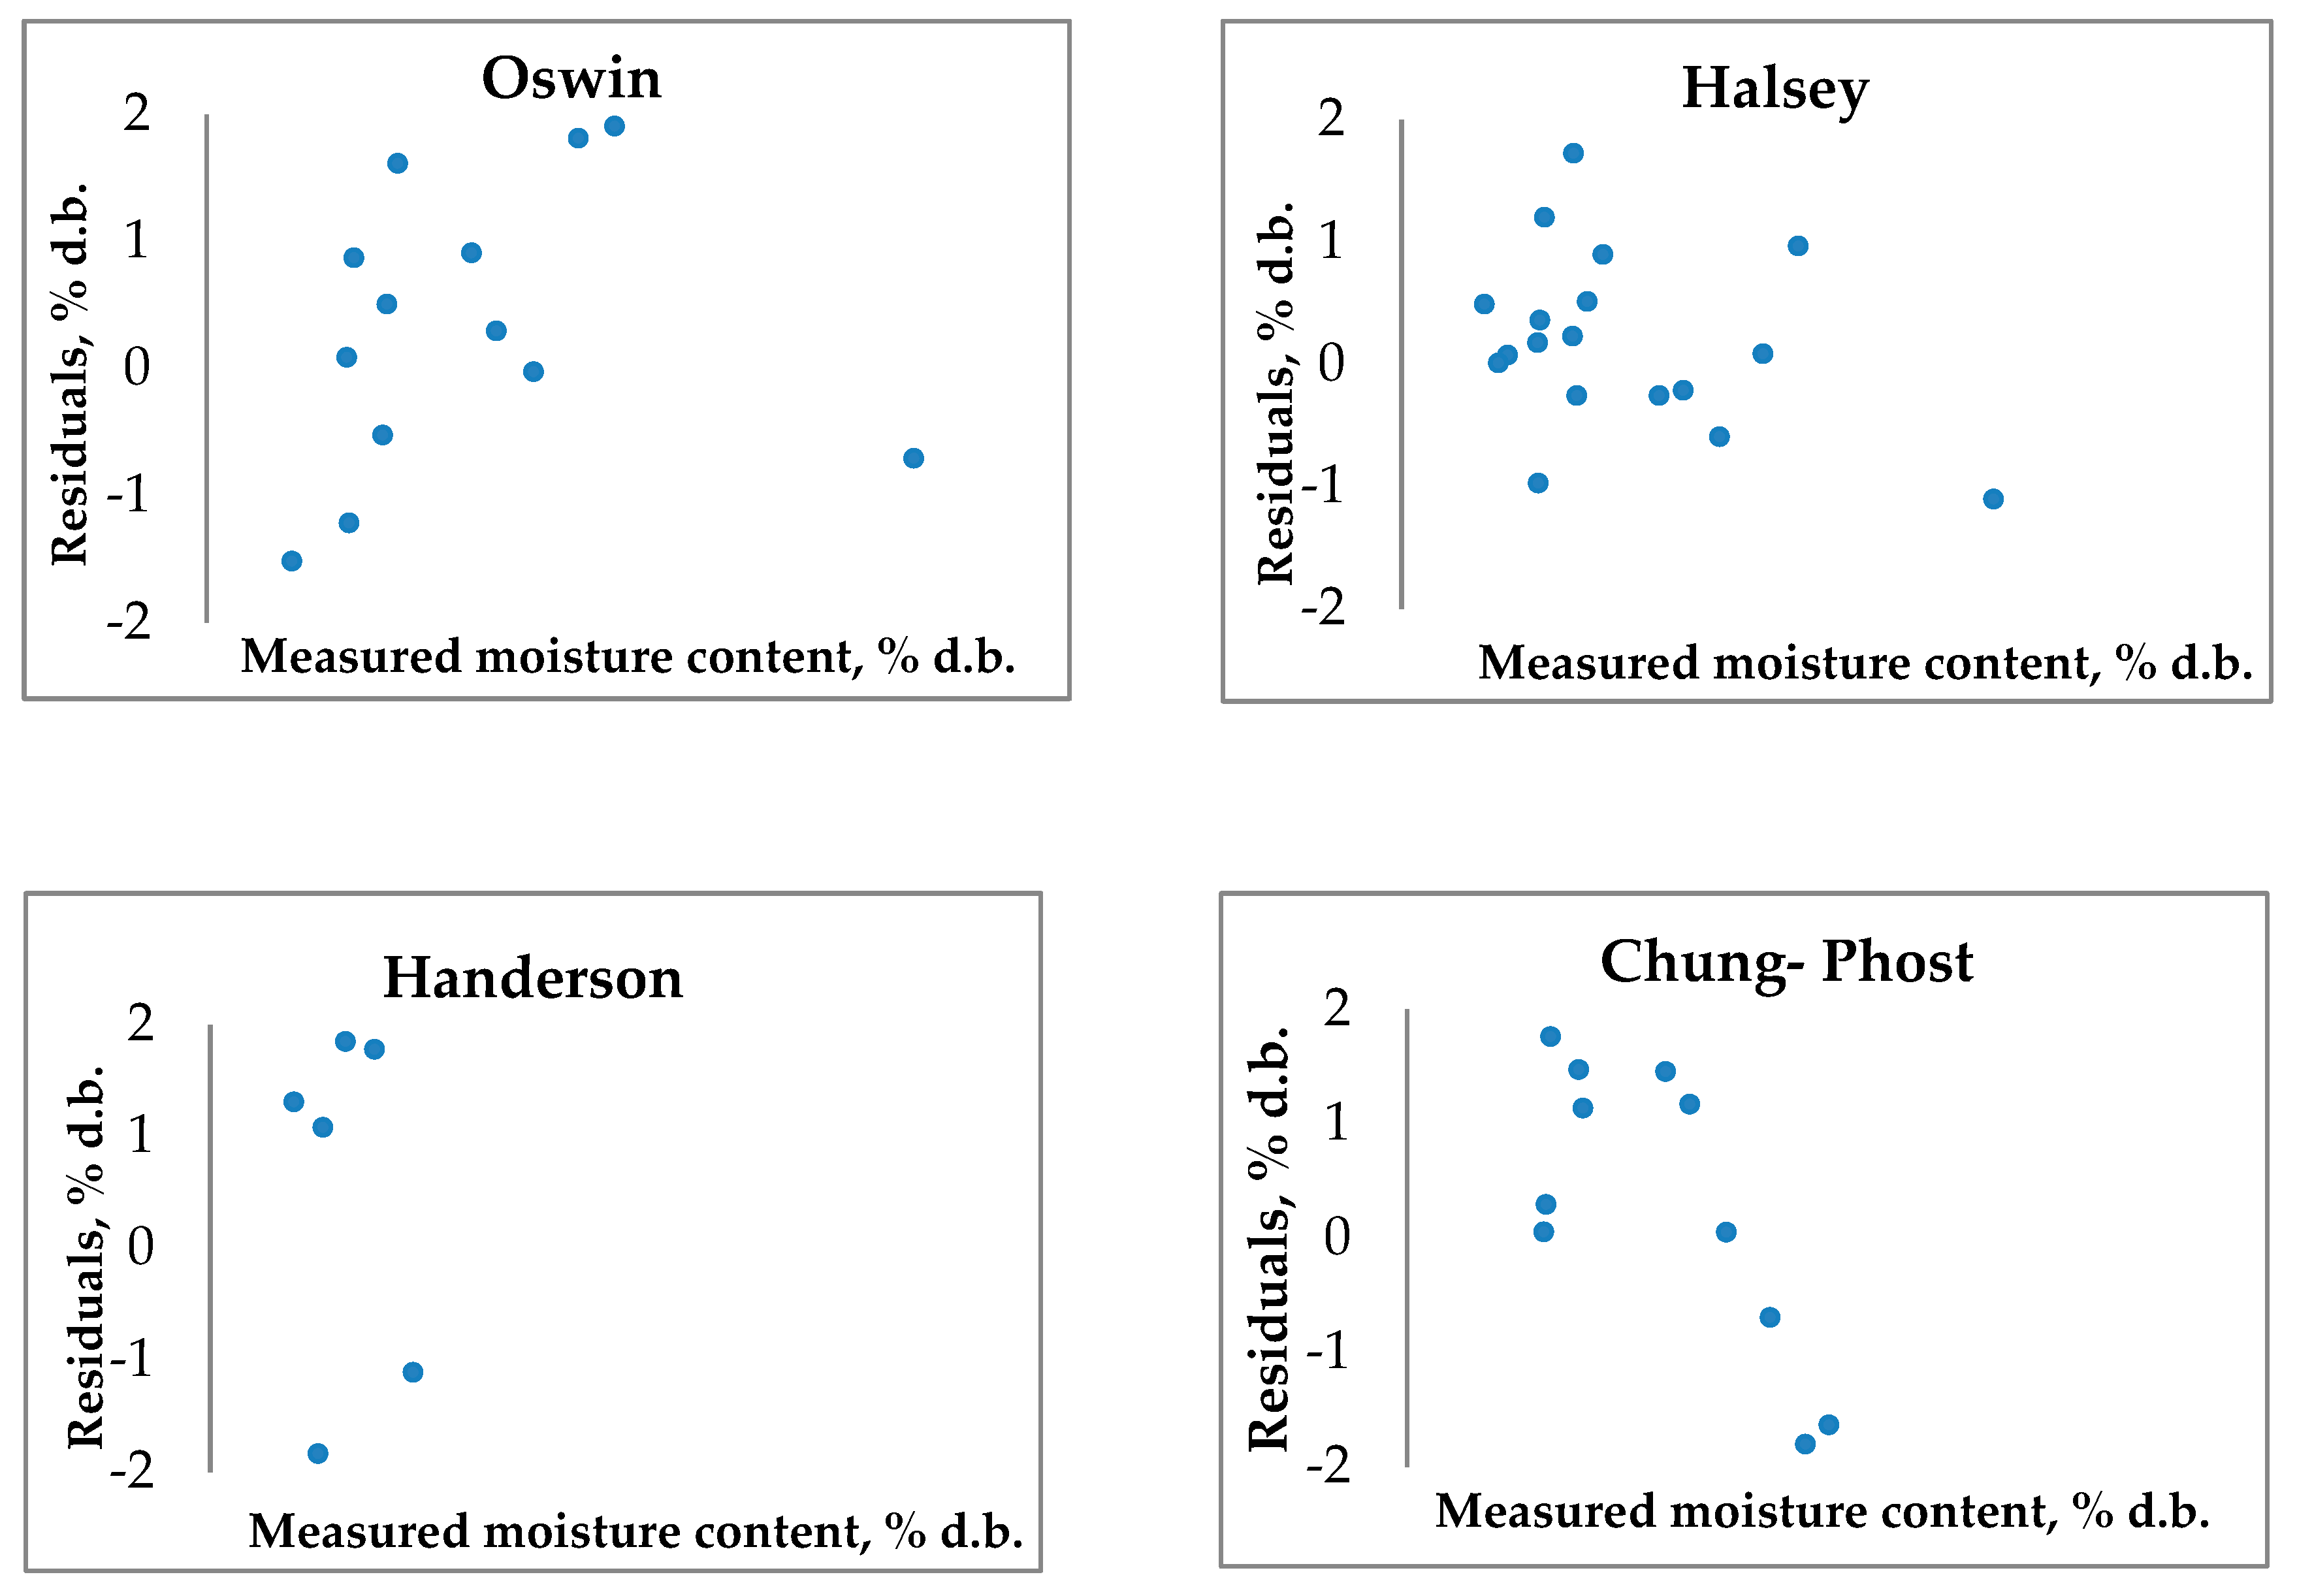
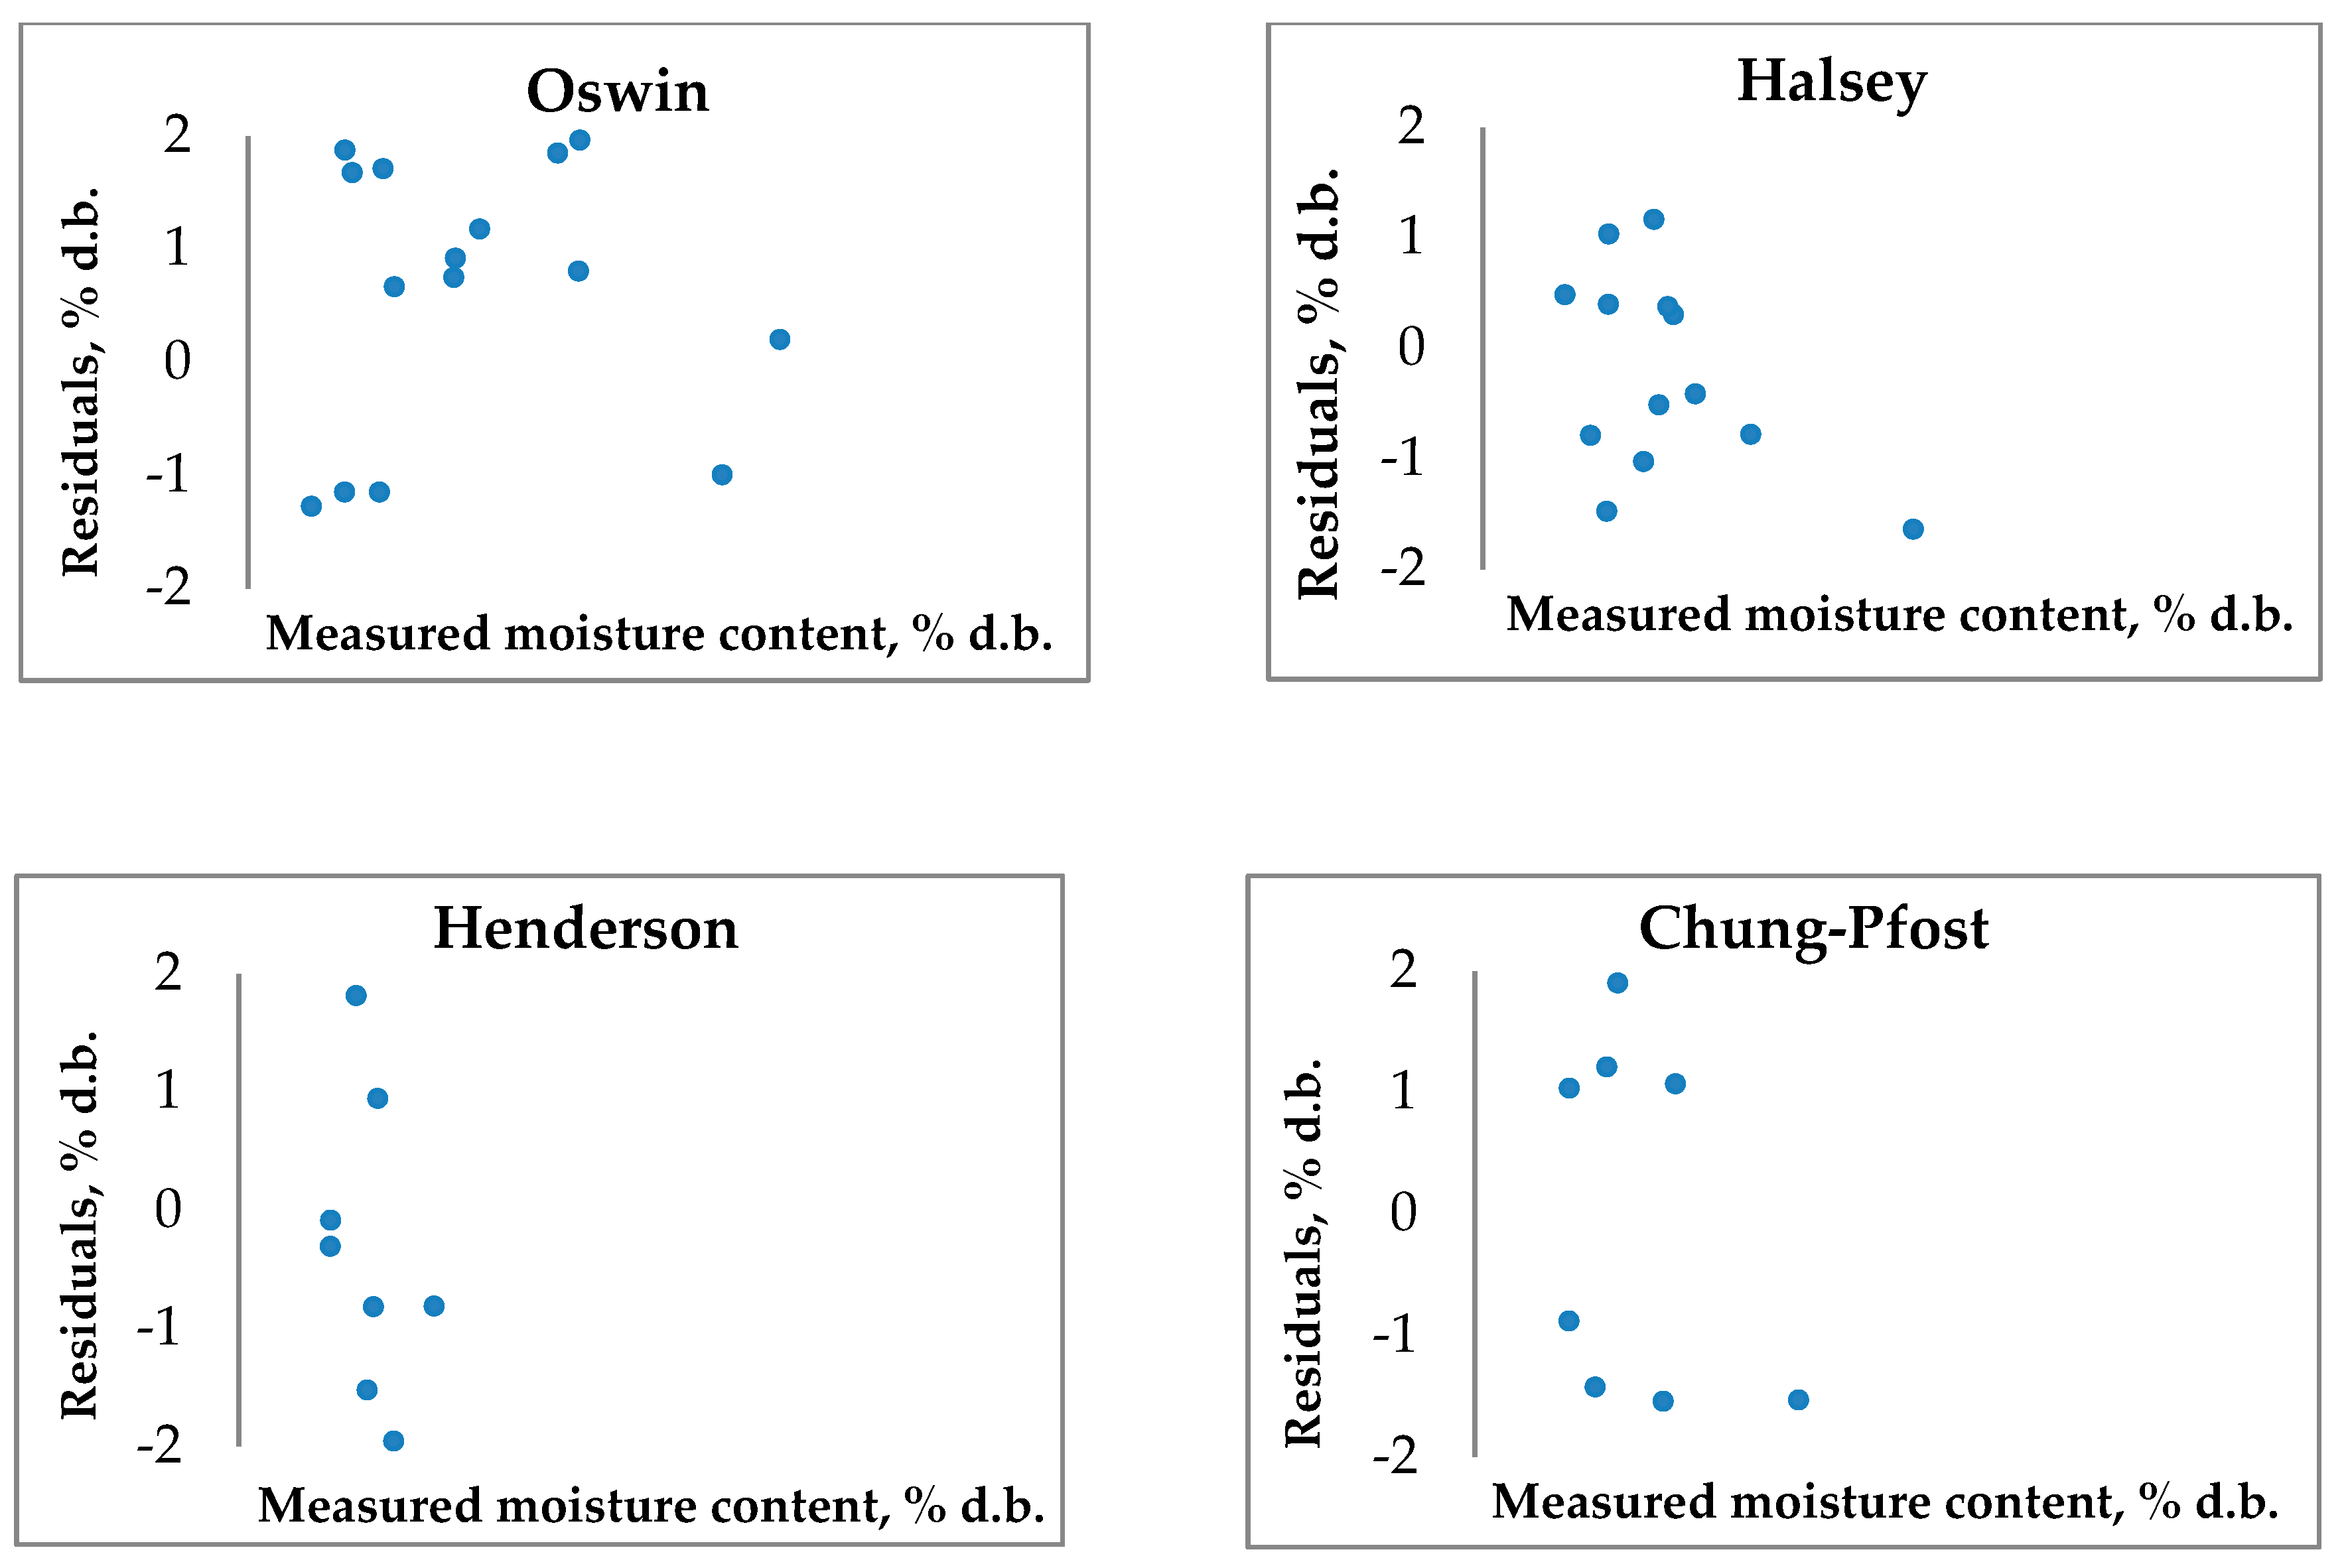
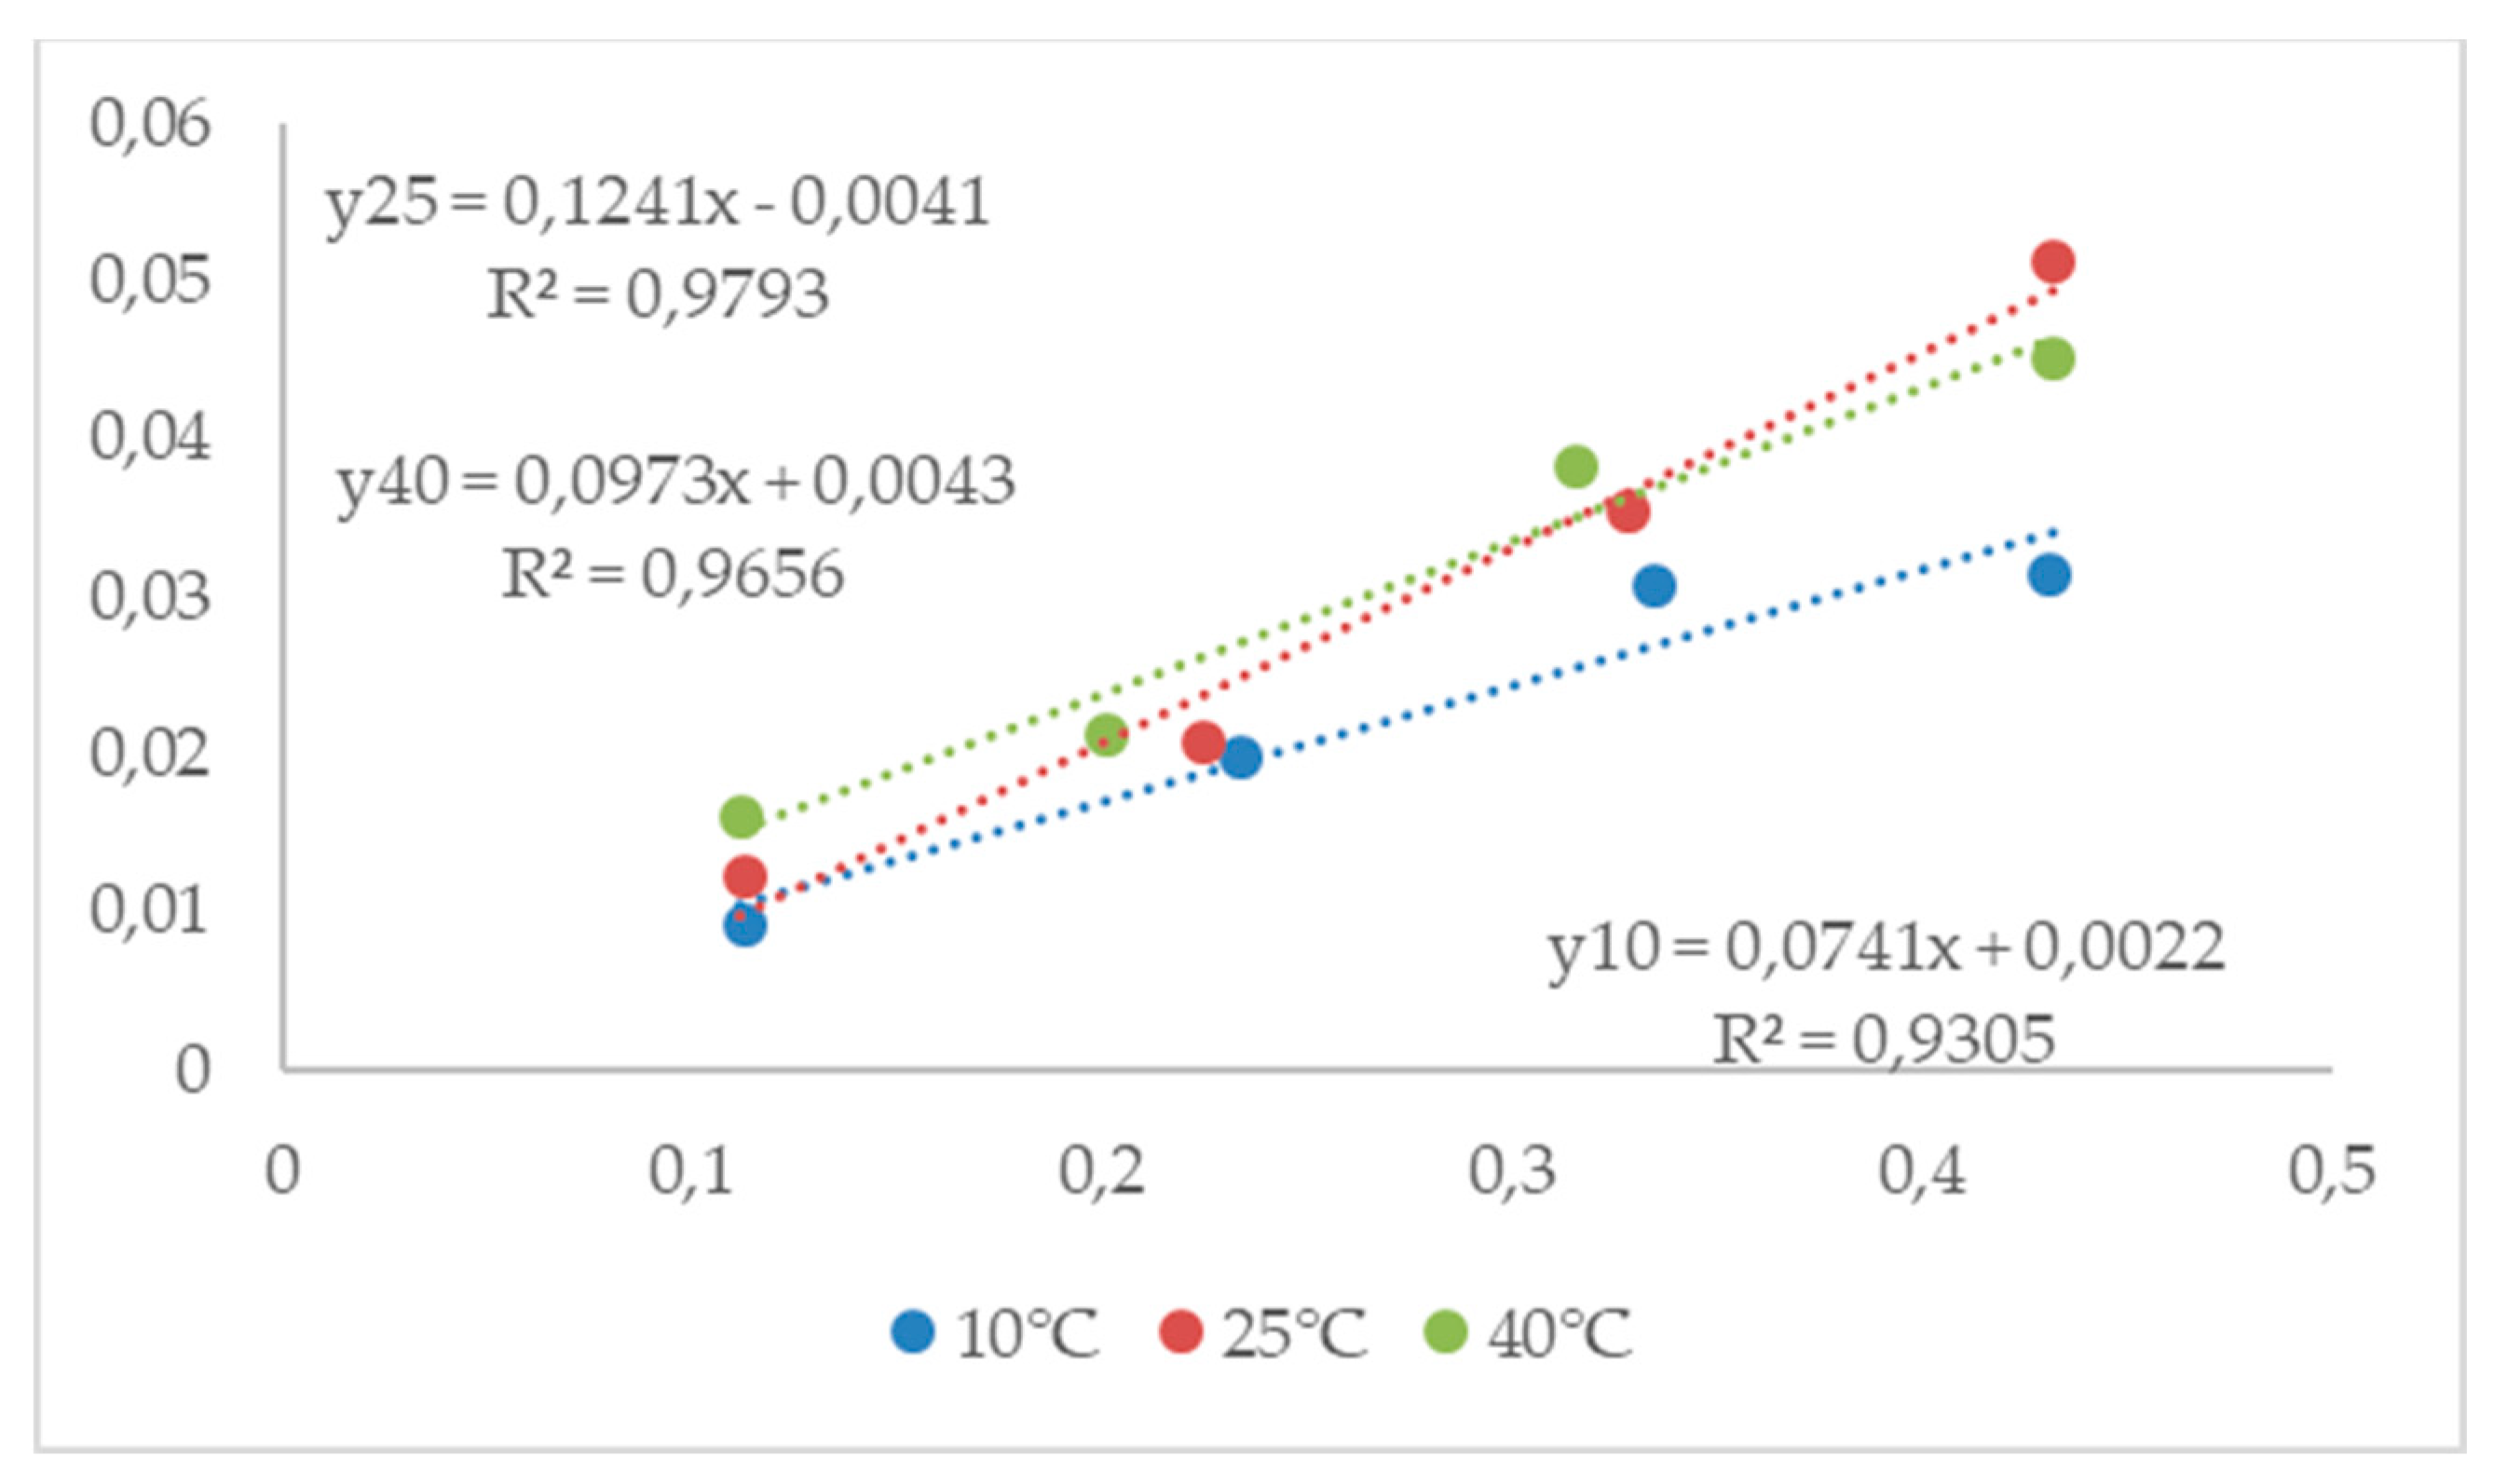
Figure 3 and Figure 4 depict the graphical representation of the residuals distribution obtained from the calculations of the coefficients of the modified models used in the experiment.
Upon thorough examination of the tabular data and graphical dependencies, a discernible pattern emerges, indicating that the modified Halsey model consistently produces the lowest values for both mean relative error (P) and standard deviation (SEM) across both the adsorption and desorption processes. This noteworthy finding underscores the model's superior performance in accurately describing the sorption isotherms of the laboratory-produced flour from the edible part of the Bulgarian quince.
The robustness of the modified Halsey model is further emphasized by its ability to exhibit a random and even distribution of residues in both processes. This characteristic suggests that the model captures the sorption behavior with a high degree of precision, avoiding systematic biases and errors.
Given these compelling observations, it is strongly recommended to leverage the modified Halsey model as the preferred choice for characterizing the sorption isotherms of flour derived from Bulgarian quince. This model not only demonstrates exceptional accuracy in representing the observed data but also showcases a consistent and reliable performance, making it a valuable tool for further research and analysis in the realm of sorption characteristics of quince-derived products.

3.4.3. Monolayer moisture content

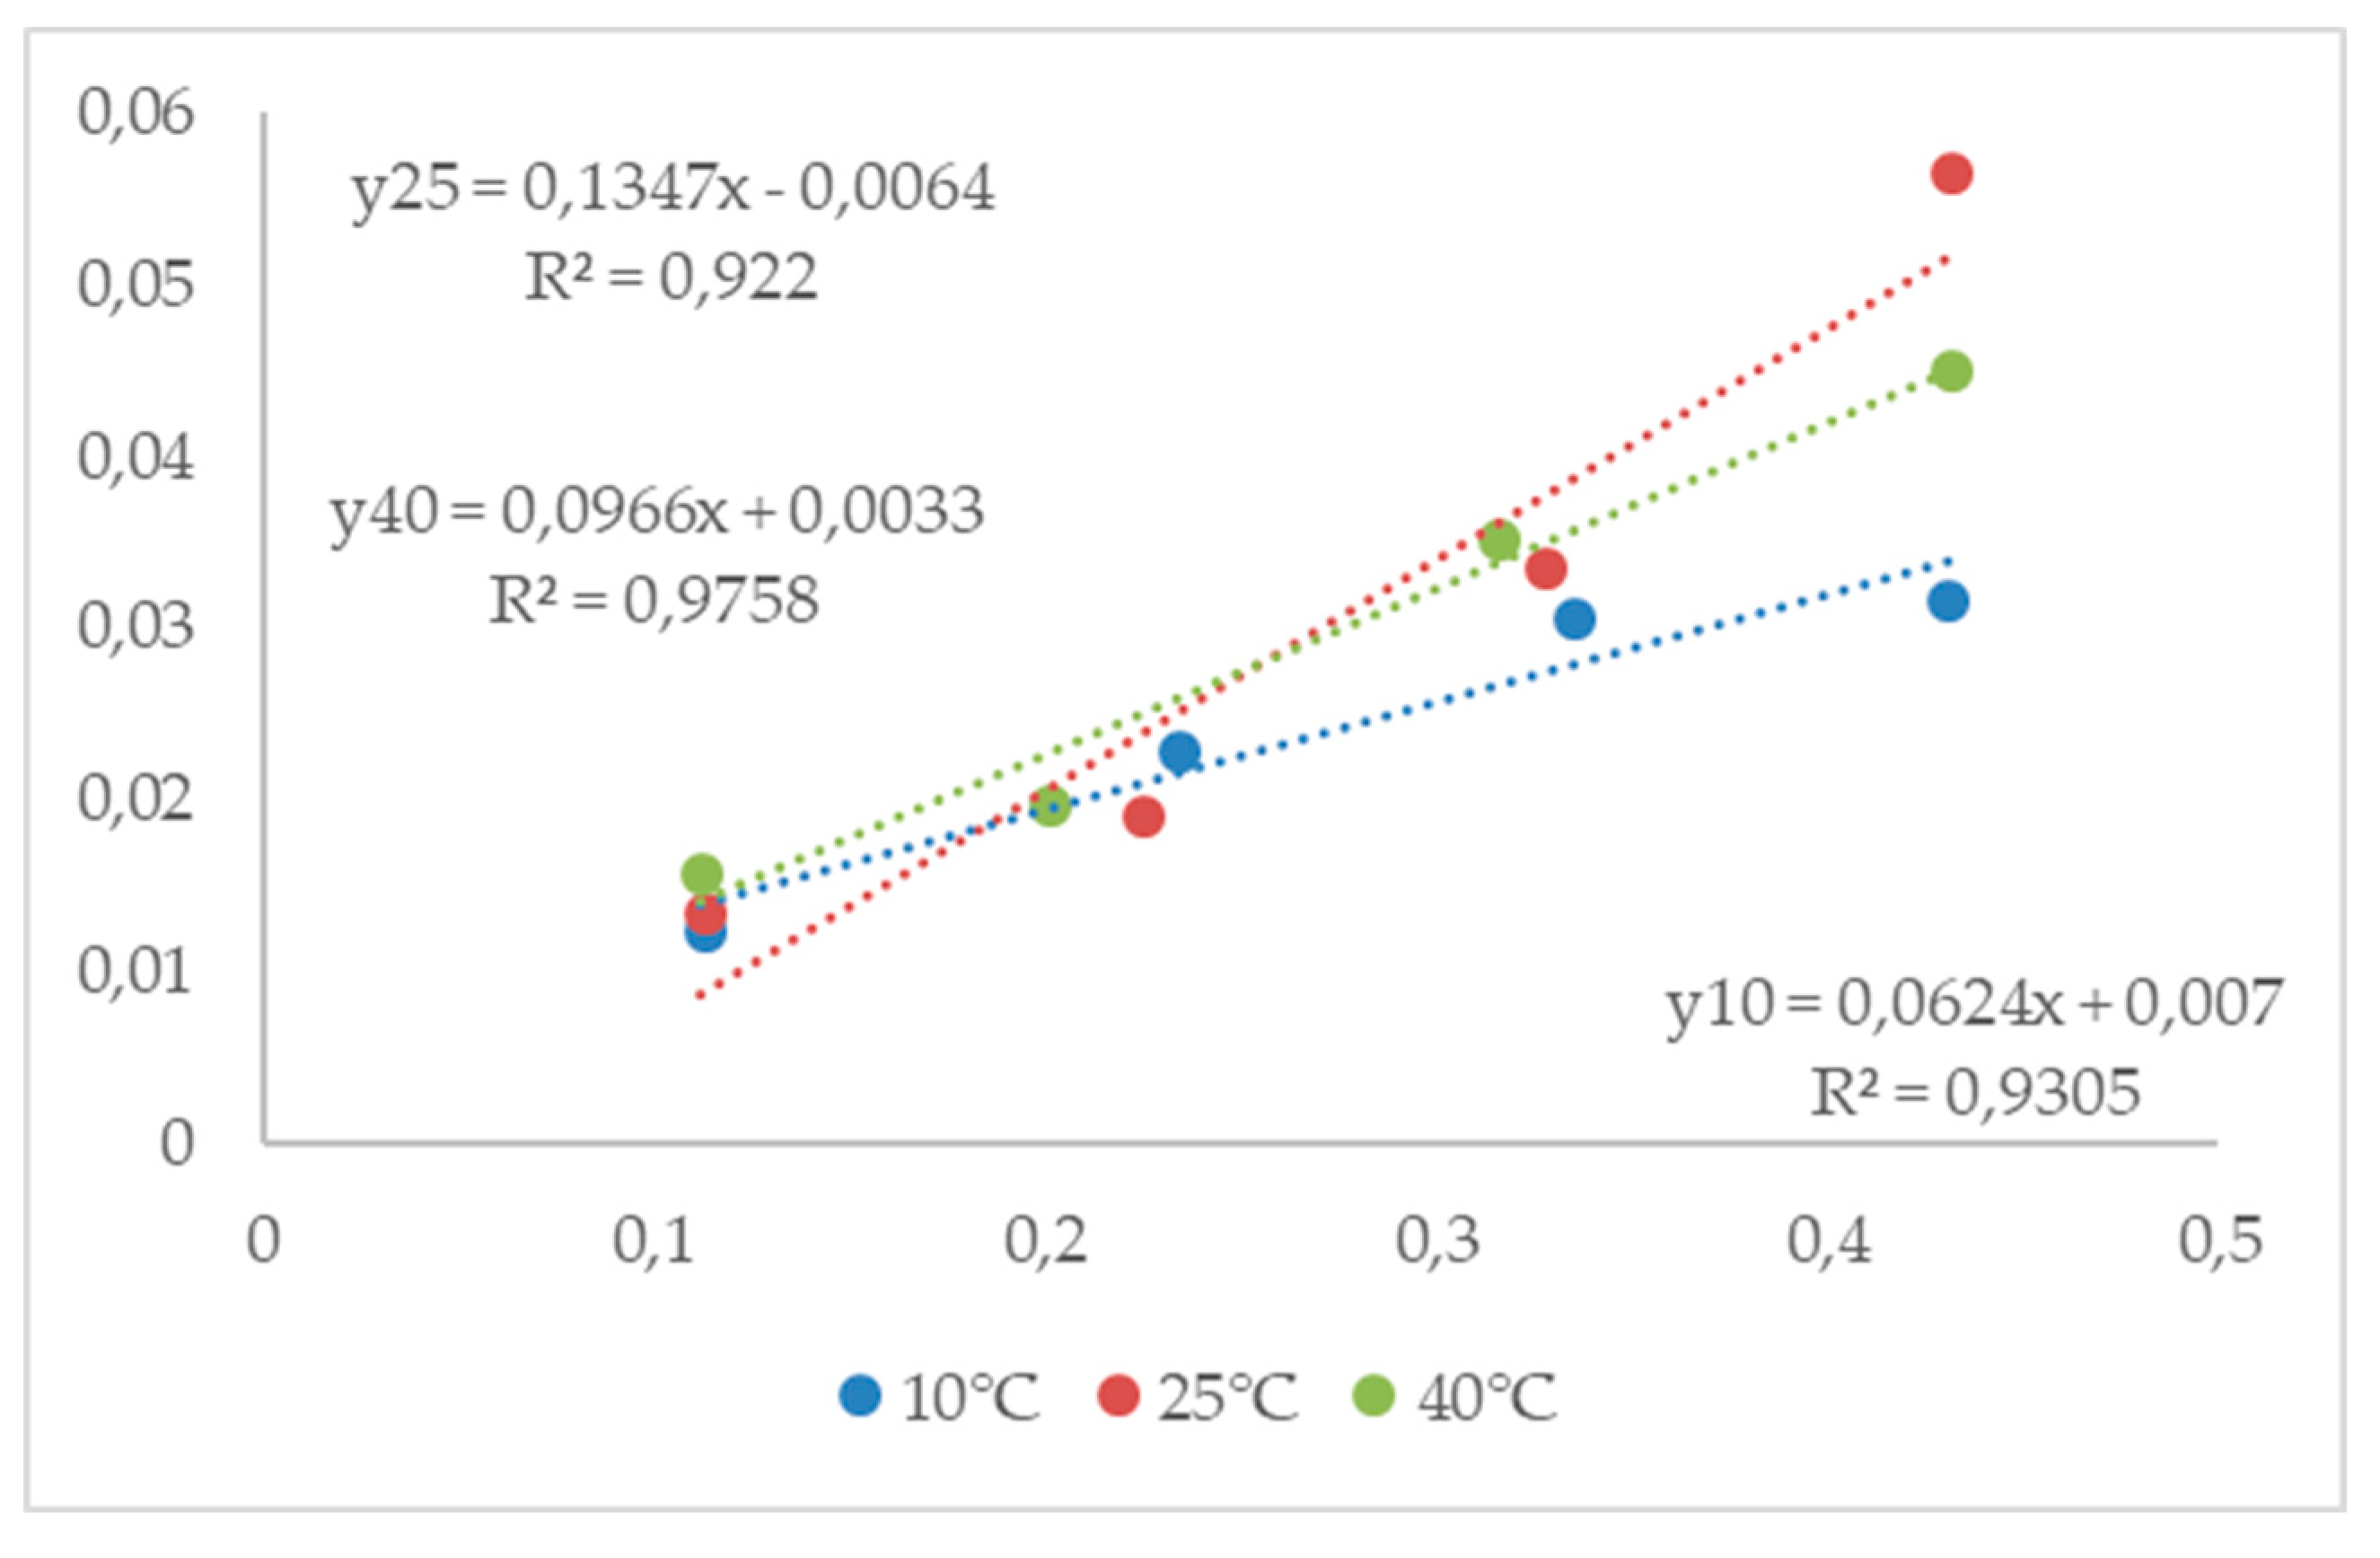
Through the strategic application of linearization techniques, as illustrated in Figure 5 and Figure 6, the Brunauer-Emmett-Teller equation was adeptly utilized to calculate the monolayer moisture content (MMC) [35]. This analytical process involved utilizing experimental data specifically for water activity (aw) values less than 0.5. The powdered product sourced from the edible part of the Bulgarian quince served as the subject of this meticulous examination, with the outcomes of this analysis being succinctly presented in Table 7.
The process of linearization, as depicted in Figure 5 and Figure 6, adds a layer of precision to the calculation of the monolayer moisture content. This technique allows for a more nuanced understanding of how the moisture content of the quince-derived product behaves at lower water activity levels, providing valuable insights into its unique sorption characteristics.
The data encapsulated in Table 7 becomes an invaluable reference point, offering a comprehensive overview of the monolayer moisture content specifically tailored to the conditions of the powdered product from the edible portion of the Bulgarian quince. This analysis enhances our understanding of the product's behavior at low water activity levels, contributing to the broader exploration of its sorption dynamics [35].
The outcomes of the analysis underscore the significant impact of temperature on the monolayer moisture content (MMC) values in the flour derived from the edible part of Bulgarian quince. The observed variations provide valuable insights into how temperature influences the sorption characteristics of the quince-derived product.
At a temperature of 10°C, the MMC values were 14.41% d.b. for the adsorption process and 13.11% d.b. for desorption. This suggests a heightened moisture absorption and release capacity at this lower temperature range. As the temperature increases to 25°C, a noticeable decline in MMC values is evident, with readings settling at 7.09% d.b. for adsorption and 7.80% d.b. for desorption. This temperature shift results in a moderated sorption capacity compared to the lower temperature range.
Interestingly, the MMC values experience a subsequent rise at a temperature of 40°C, reaching 10.01% d.b. for adsorption and 9.84% d.b. for desorption. This indicates a reinvigorated sorption capacity at higher temperatures, showcasing the dynamic influence that temperature exerts on the moisture content behavior of the quince-derived flour.
These nuanced findings highlight the intricate relationship between temperature and sorption characteristics, offering a detailed perspective on how varying temperature levels impact the monolayer moisture content of the powdered product from the edible part of the Bulgarian quince.

4. Conclusions

Equilibrium moisture content for both adsorption and desorption processes of flour from the edible part of Bulgarian quince were determined at temperatures of 10°C, 25°C, and 40°C, with relative air humidity ranging from 0.11 to 0.85.
It was observed that, with constant water activity, equilibrium moisture content decrease as the temperature increases.
The isotherms of the studied product were classified as type II according to Brunauer et al.'s classification.
The modified Halsey model is recommended to describe the adsorption isotherms of the studied product.
Monolayer moisture content (MMC) values for both adsorption and desorption processes were calculated from the linearization of the Brunauer-Emmett-Teller model, using experimental data for aw < 0.5.
The temperature was found to influence the monolayer moisture content (MMC) values of flour from the edible part of Bulgarian quince. The highest MMC value was observed at a temperature of 10°C for both processes, followed by a decrease at 25°C, and an increase again at 40°C.

References

  1. Abdollahi, H. A review on history, domestication and germplasm collections of quince (Cydonia oblonga Mill.) in the world. Genetic Resources and Crop Evolution, 2019, 66(5), 1041–1058. [Google Scholar] [CrossRef]
  2. Rather, G. A., Bhat, M. Y., Sana, S. S., Ali, A., Gul, M. Z., Nanda, A., & Hassan, M. Quince. Antioxidants in fruits: Properties and health benefits, 2020, 397-416. [CrossRef]
  3. Hegedűs, A., Papp, N., & Stefanovits-Bányai, É. Review of nutritional value and putative health-effects of quince (Cydonia oblonga Mill.) fruit. International Journal of Horticultural Science, 2013, 19(3-4), 29-32. [CrossRef]
  4. Hussain, S. Z., Naseer, B., Qadri, T., Fatima, T., & Bhat, T. A. Quince (Cydonia oblonga)—Morphology, Taxonomy, Composition and Health Benefits. In Fruits Grown in Highland Regions of the Himalayas: Nutritional and Health Benefits, 2021, (pp. 49-62). Cham: Springer International Publishing. [CrossRef]
  5. Stojanović, B. T., Mitić, S. S., Stojanović, G. S., Mitić, M. N., Kostić, D. A., Paunović, D. Ɖ., ... & Pavlović, A. N. (2017). Phenolic profiles and metal ions analyses of pulp and peel of fruits and seeds of quince (Cydonia oblonga Mill.). Food Chemistry 2017, 232, 466–475. [CrossRef]
  6. Essafi-Benkhadir, K., Refai, A., Riahi, I., Fattouch, S., Karoui, H., & Essafi, M. Quince (Cydonia oblonga Miller) peel polyphenols modulate LPS-induced inflammation in human THP-1-derived macrophages through NF-κB, p38MAPK and Akt inhibition. Biochemical and biophysical research communications 2012, 418(1), 180–185. [CrossRef] [PubMed]
  7. Owfi, R. E. Natural products and botanical medicines of Iran. 2020, CRC Press.
  8. Razna, K. Cyanogenic glycosides-their role and potential in plant food resources. Journal of microbiology, biotechnology and food sciences, 2021, 11(3), e4771–e4771. [Google Scholar] [CrossRef]
  9. Sato, K., Kobayashi, S., Yamaguchi, M., Sakata, R., Sasaki, Y., Murayama, C., & Kondo, N. Working from home and dietary changes during the COVID-19 pandemic: A longitudinal study of health app (CALO mama) users. Appetite 2021, 165, 105323.
  10. Ayati, N., Saiyarsarai, P., & Nikfar, S. Short and long term impacts of COVID-19 on the pharmaceutical sector. DARU Journal of Pharmaceutical Sciences, 2020, 28, 799–805. [CrossRef] [PubMed]
  11. Minich, D. M. A review of the science of colorful, plant-based food and practical strategies for “eating the rainbow”. Journal of Nutrition and Metabolism, 2019. [Google Scholar]
  12. Blumfield, M., Mayr, H., De Vlieger, N., Abbott, K., Starck, C., Fayet-Moore, F., & Marshall, S. Should We ‘Eat a Rainbow’? An Umbrella Review of the Health Effects of Colorful Bioactive Pigments in Fruits and Vegetables. Molecules, 2022, 27(13), 4061. [CrossRef]
  13. AOAC, C. Official methods of analysis of the Association of Analytical Chemists International. Official Methods: Gaithersburg, 2005, MD, USA.
  14. Ivanov, I., Vrancheva, R., Marchev, A., Petkova, N., Aneva, I., Denev, P., ... & Pavlov, A. Antioxidant activities and phenolic compounds in Bulgarian Fumaria species. International Journal of Current Microbiology and Applied Sciences, 2014, 3(2), 296–306.
  15. Bogoeva, A. L., Durakova, A. G., Pavlov, A. I., Yanakieva, V. B., Vrancheva, R. Z., Bozadzhiev, B. V., & Choroleeva, K. B. Antioxidant activity and storage regime of defatted grape seeds flour. Wine Studies 2017, 6(1). [Google Scholar]
  16. Bogoeva, A. Sorption characteristics of flour mixtures enriched with grape seeds flour of Bulgarian and French raw materials. Journal of Central European Agriculture, 2020, 21(3), 609–617. [Google Scholar] [CrossRef]
  17. Durakova, A. Sorption Characteristics of Bulgarian Penny Buns (Boletus Edulis). In E3S Web of Conferences, 2020, (Vol. 180, p. 03008). EDP Sciences. [CrossRef]
  18. Abboud, K. Y., da Luz, B. B., Dallazen, J. L., de Paula Werner, M. F., Cazarin, C. B. B., Junior, M. R. M., ... & Cordeiro, L. M. Gastroprotective effect of soluble dietary fibres from yellow passion fruit (Passiflora edulis f. flavicarpa) peel against ethanol-induced ulcer in rats. Journal of Functional Foods, 2019, 54, 552-558. [CrossRef]
  19. European Parliament & Council of the European Union, Regulation (EC) No 1924/2006 of the European Parliament and of the Council of 20 December 2006 on nutrition and health claims made on foods. Off. J. Eur. Union, 2006, 304, 18–63.
  20. Murugesan, R., & Orsat, V. Spray drying of elderberry (Sambucus nigra L.) juice to maintain its phenolic content. Drying Technology 2011, 29(14), 1729–1740. [CrossRef]
  21. Santhalakshmy, S., Bosco, S. J. D., Francis, S., & Sabeena, M. Effect of inlet temperature on physicochemical properties of spray-dried jamun fruit juice powder. Powder Technology 2015, 274, 37–43. [CrossRef]
  22. Salehi, F., Kamran, H. R., & Goharpour, K. Production and evaluation of total phenolics, antioxidant activity, viscosity,color, and sensory attributes of quince tea infusion: Effects of drying method, sonication, and brewing process. Ultrasonics Sonochemistry, 2023, 99, 106591. [CrossRef] [PubMed]
  23. Costa, R. M., Magalhães, A. S., Pereira, J. A., Andrade, P. B., Valentão, P., Carvalho, M., & Silva, B. M. Evaluation of free radical-scavenging and antihemolytic activities of quince (Cydonia oblonga) leaf: a comparative study with green tea (Camellia sinensis). Food and Chemical toxicology, 2009, 47(4), 860–865. [CrossRef]
  24. Fattouch, S., Caboni, P., Coroneo, V., Tuberoso, C. I., Angioni, A., Dessi, S., ... & Cabras, P. Antimicrobial activity of Tunisian quince (Cydonia oblonga Miller) pulp and peel polyphenolic extracts. Journal of Agricultural and Food Chemistry, 2007, 55(3), 963–969. [CrossRef]
  25. Gheisari, H. R., & Abhari, K. H. Drying method effects on the antioxidant activity of quince (Cydonia oblonga Miller) tea. Acta Scientiarum Polonorum Technologia Alimentaria, 2014, 13(2), 129–134. [Google Scholar] [CrossRef]
  26. Mir, S. A., Wani, S. M., Wani, T. A., Ahmad, M., Gani, A., Masoodi, F. A., & Nazir, A. Comparative evaluation of the proximate composition and antioxidant properties of processed products of quince (Cydonia oblonga Miller). International Food Research Journal 2016, 23(2).
  27. Szychowski, P. J., Lech, K., Sendra-Nadal, E., Hernández, F., Figiel, A., Wojdyło, A., & Carbonell-Barrachina, Á. A. Kinetics, biocompounds, antioxidant activity, and sensory attributes of quinces as affected by drying method. Food chemistry 2018, 255, 157–164. [CrossRef]
  28. Al-Zughbi, I., & Krayem, M. Quince fruit Cydonia oblonga Mill nutritional composition, antioxidative properties, health benefits and consumers preferences towards some industrial quince products: A review. Food Chemistry, 2022, 393, 133362. [Google Scholar] [CrossRef]
  29. Benahmed Djilali, A., Mehraz, R., Bouacem, K., Benseddik, A., Moualek, I., Nabiev, M., & Benzara, A. Bioactive substances of Cydonia oblonga fruit: Insecticidal effect of tannins on Tribuliumm confusum. International Journal of Fruit Science, 2021, 21(1), 721–731. [Google Scholar] [CrossRef]
  30. Sut, S., Dall'Acqua, S., Poloniato, G., Maggi, F., & Malagoli, M. Preliminary evaluation of quince (Cydonia oblonga Mill.) fruit as extraction source of antioxidant phytoconstituents for nutraceutical and functional food applications. Journal of the Science of Food and Agriculture 2019, 99(3), 1046–1054. [CrossRef] [PubMed]
  31. Kapsalis, J.G. Influences of hysteresis and temperature on moisture sorption isotherms. In Water activity, 2017, (pp. 173-213). Routledge.
  32. Bell, L. N. Moisture effects on food's chemical stability. Water activity in foods: fundamentals and applications, 2020, 227-253. [CrossRef]
  33. Labuza, T. P., & Altunakar, B. Water activity prediction and moisture sorption isotherms. Water activity in foods: fundamentals and applications, 2020, 161-205. [CrossRef]
  34. Brunauer, S., Deming, L. S., Deming, W. E., & Teller, E. On a theory of the van der Waals adsorption of gases. Journal of the American Chemical society, 1940, 62(7), 1723–1732. [Google Scholar] [CrossRef]
  35. Brunauer, S., Emmett, P. H., & Teller, E. Adsorption of gases in multimolecular layers. Journal of the American chemical society, 1938, 60(2), 309–319. [Google Scholar] [CrossRef]
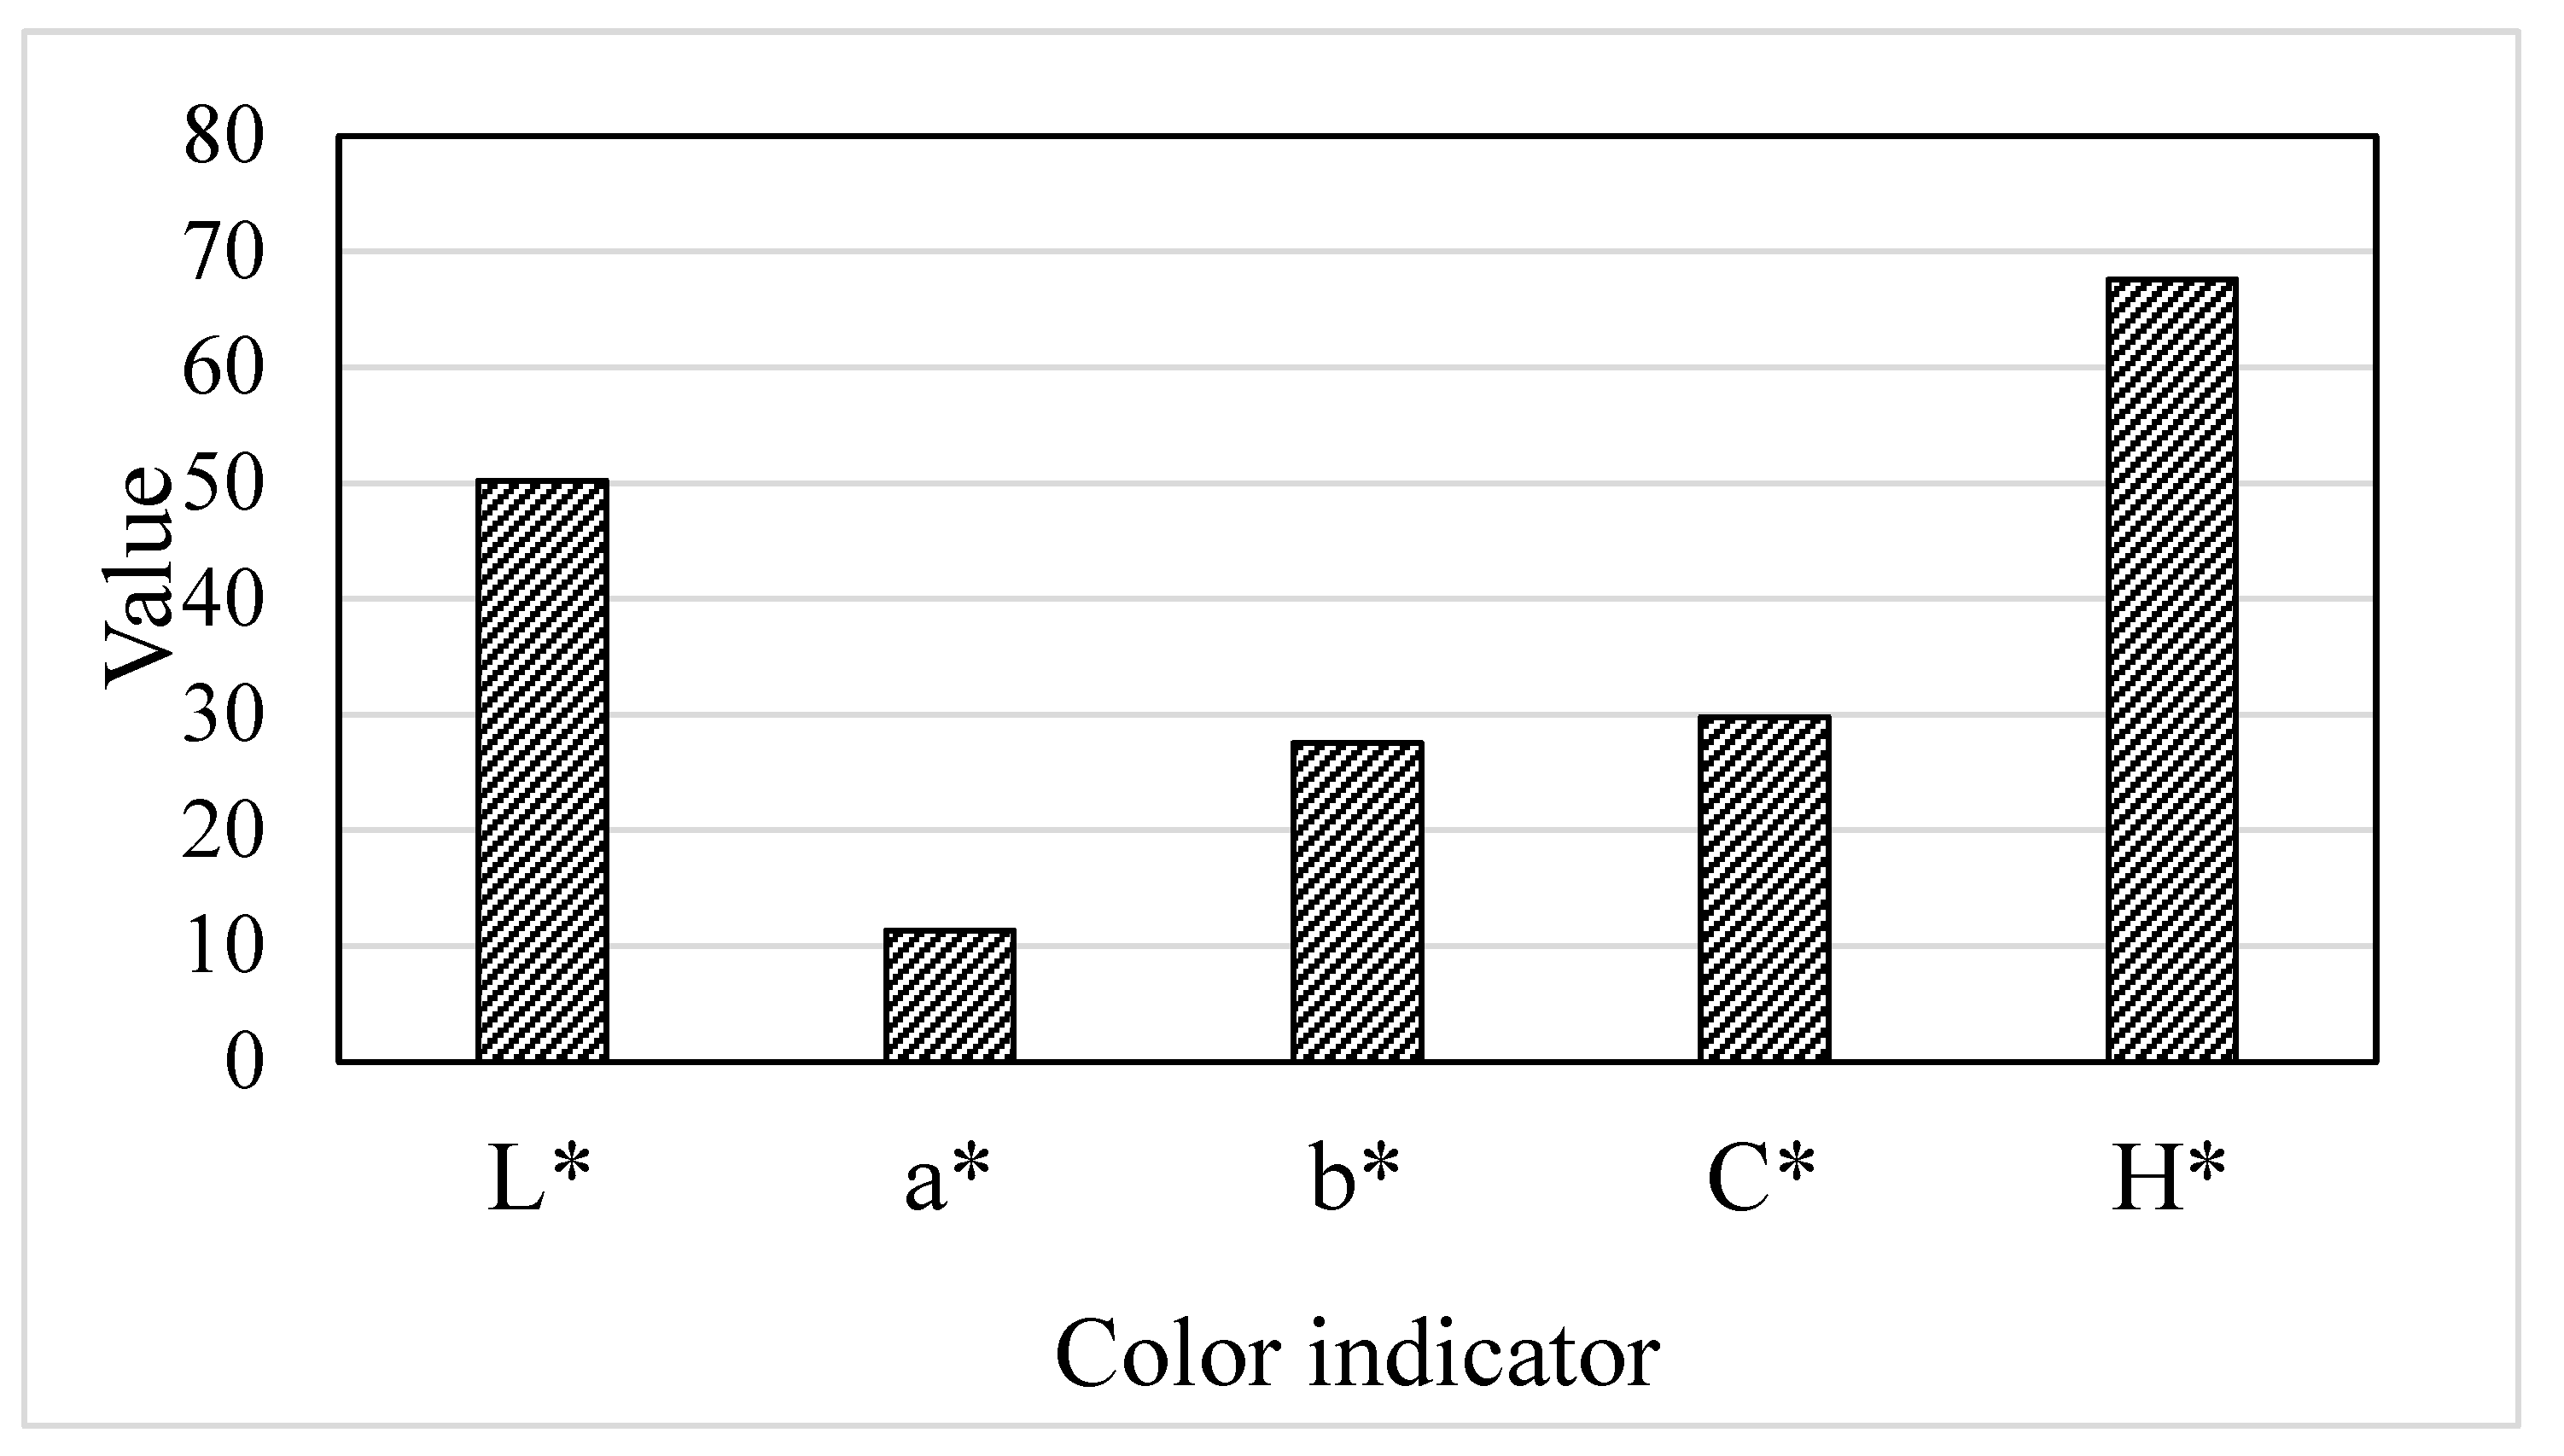
Figure 1. Color indicators of quince powder.
Preprints 97344 g001
Figure 2. Comparison of isotherms at 40°C.
Preprints 97344 g002
Figure 3. Residues distribution for the processes of adsorption.
Preprints 97344 g003
Figure 4. Residues distribution for the processes of desorption.
Preprints 97344 g004
Figure 5. BET model linearization for the adsorption process.
Preprints 97344 g005
Figure 6. BET model linearization for the desorption process.
Preprints 97344 g006
Table 2. Antioxidant activity of the quince powder.
Method mMTE/g extract mMTE/g dry weight
DPPH 65.09±6.80 45.57±4.76
ABTS 8.35±0.07 5.84±0.05
FRAP 4.54±0.33 3.18±0.23
CUPRAC 7.94±1.01 5.56±0.71
Table 3. Equilibrium moisture content (M), % dry basis for adsorption at three temperatures t (°C) and water activity aw.
Sel 10°C 25°C 40°C
aw M* sd** aw M* sd** aw M* sd**
LiCl 0.113 10.25 0.33 0.113 9.37 0.25 0.112 8.00 0.08
CH3COOK 0.234 13.37 0.30 0.225 13.22 0.24 0.201 12.77 0.17
MgCl2 0.335 16.53 0.32 0.328 13.82 0.14 0.316 13.16 0.05
K2CO3 0.431 24.00 0.06 0.432 16.61 0.20 0.432 16.91 0.06
MgNO3 0.574 27.19 0.11 0.529 20.17 0.28 0.484 17.93 0.22
NaBr 0.622 30.70 0.15 0.576 24.87 0.28 0.532 19.45 0.16
NaCl 0.757 40.54 0.08 0.753 38.29 0.33 0.747 34.89 0.13
KCl 0.868 66.38 0.17 0.843 57.16 0.15 0.823 50.15 0.17
* Mean value of triple replications, ** standard deviation.
Table 4. Equilibrium moisture content (M), % dry basis for desorption at three temperatures t (°C) and water activity aw.
Sel 10°C 25°C 40°C
aw M* sd** aw M* sd** aw M* sd**
LiCl 0.113 13.76 0.09 0.113 10.34 0.22 0.112 7.90 0.09
CH3COOK 0.234 15.43 0.45 0.225 12.05 0.27 0.201 11.89 0.29
MgCl2 0.335 16.40 0.48 0.328 13.02 0.13 0.316 12.09 0.20
K2CO3 0.431 24.11 0.44 0.432 18.29 0.08 0.432 16.88 0.37
MgNO3 0.574 25.91 1.09 0.529 19.85 0.21 0.484 17.74 0.11
NaBr 0.622 28.92 0.13 0.576 25.70 0.24 0.532 20.39 0.21
NaCl 0.757 41.46 0.71 0.753 41.28 0.35 0.747 38.68 0.88
KCl 0.868 66.49 1.39 0.843 59.25 0.75 0.823 58.06 1.08
* Mean value of triple replications, ** standard deviation.
Table 5. Coefficient of modified models (А, В, С), the mean relative error (P%) and the standard error of moisture content (SEM) for adsorption.
Model А В С Р SEM
Oswin 24.3597 -0.1028 0,5495 11.13 2.39
Halsey 4.19682 -0.0091 1.4246 5.79 2.03
Henderson 0.00017 2.6988 1.6486 26.03 9.30
Chung-Pfost 356.522 0.0655 90.338 17.89 6.19
Table 6. Coefficient of modified models (А, В, С), the mean relative error (P%) and the standard error of moisture content (SEM) for desorption.
Model А В С Р SEM
Oswin 22.8885 -0.0282 0.5744 14.66 4.27
Halsey 4.31774 -0.0122 1.4329 9.89 3.09
Henderson 0.00014 9.2395 1.6159 21.99 9.71
Chung-Pfost 318.699 0.0637 79.833 21.29 7.29
Table 7. Monolayer moisture content expressed in % dry basis and calculated thought BET model.
t (°C) Adsorption Desorption
10 14.41% d.b. 13.11% d.b.
25 7.09% d.b. 7.80% d.b.
40 10.01% d.b. 9.84% d.b.
Disclaimer/Publisher’s Note: The statements, opinions and data contained in all publications are solely those of the individual author(s) and contributor(s) and not of MDPI and/or the editor(s). MDPI and/or the editor(s) disclaim responsibility for any injury to people or property resulting from any ideas, methods, instructions or products referred to in the content.
Copyright: This open access article is published under a Creative Commons CC BY 4.0 license, which permit the free download, distribution, and reuse, provided that the author and preprint are cited in any reuse.
Prerpints.org logo

Preprints.org is a free preprint server supported by MDPI in Basel, Switzerland.

Subscribe

© 2024 MDPI (Basel, Switzerland) unless otherwise stated