1. Introduction
Glioblastoma multiforme (GBM) is the most common and aggressive form of brain cancer, with an incidence of 2 to 5 cases per 100,000 people in North America and Europe. It is more common in men than women and rare in children. GBM can be primary or secondary [
1,
2]. Secondary GBM often occurs earlier, at around 45 years of age, develops more frequently from a low-grade astrocytoma, and is associated with a better prognosis [
2,
3]. On the other hand, primary GBM is more widespread, aggressive, highly invasive, and more prevalent among the elderly. Both primary and secondary glioblastomas are treated with surgical resection, radiation therapy, and chemotherapy with temozolomide [
3].
The different subtypes of GBM possess a wide range of metabolic phenotypes, affecting the cancer cells' behavior. Research has revealed that glioblastomas can exhibit both oxidative and glycolytic metabolic profiles, each providing advantages to tumor cells [
4,
5,
6]. For instance, glycolytic glioblastoma cells are typically more aggressive and proliferate faster than oxidative glioblastoma cells, leading to varying responses to current therapies targeting the altered metabolism. There is no standard treatment approach for glioblastoma based on its metabolic phenotype. However, the potential of targeting the metabolic reprogramming of cancer to improve treatment outcomes is gaining popularity. The molecular mechanisms responsible for these opposing metabolic phenotypes can be studied in cell models. T98G and U87MG exhibit an oxidative and glycolytic phenotype, respectively. As expected, U87MG cells show a higher proliferation rate and migration than T98G cells [
7].
Mitochondria play a critical role in dictating the metabolic phenotype of cancer cells. It is well known that the main mitochondrial metabolic pathways are regulated at different molecular levels, from transcriptional to translational and posttranslational levels. Protein lysine acetylation has been identified as a posttranslational modification (PTM) that regulates increasing mitochondrial proteins and pathways. To a large extent, acetylation of mitochondrial proteins has been found to have a detrimental effect on their function [
8,
9,
10,
11]. The main mitochondrial deacetylase is SIRT3, a member of the sirtuin family. SIRT3 targets various proteins involved in cell proliferation, cell cycle, ATP production, and metabolic pathways such as the tricarboxylic acid cycle (TCA), fatty acid oxidation, oxidative phosphorylation (OXPHOS), and ketogenesis [
12]. Understanding the interplay between this enzyme, its targets, and mitochondrial and cellular dynamics is crucial for developing more precise treatment strategies targeting specific glioblastoma phenotypes.
In this study, the two above-mentioned metabolically distinct glioblastoma cell lines, oxidative (T98G) and glycolytic (U87MG) were used to assess the role of SIRT3 in regulating acetylation and mitochondrial function. Quantitative proteomics and acetylomics were performed at the cellular and mitochondrial level of both cell lines control and treated with a SIRT3 inhibitor. Our results confirmed the upregulation of the mitochondrial metabolism in the oxidative cell line and provided new insights into the fraction of the proteome regulated by SIRT3. Our findings suggest that SIRT3 plays a crucial role in regulating protein synthesis and transcriptional processes regardless of the metabolic phenotype of the cell. Improving our understanding of this regulation may affect the development of better cancer treatments.
2. Results
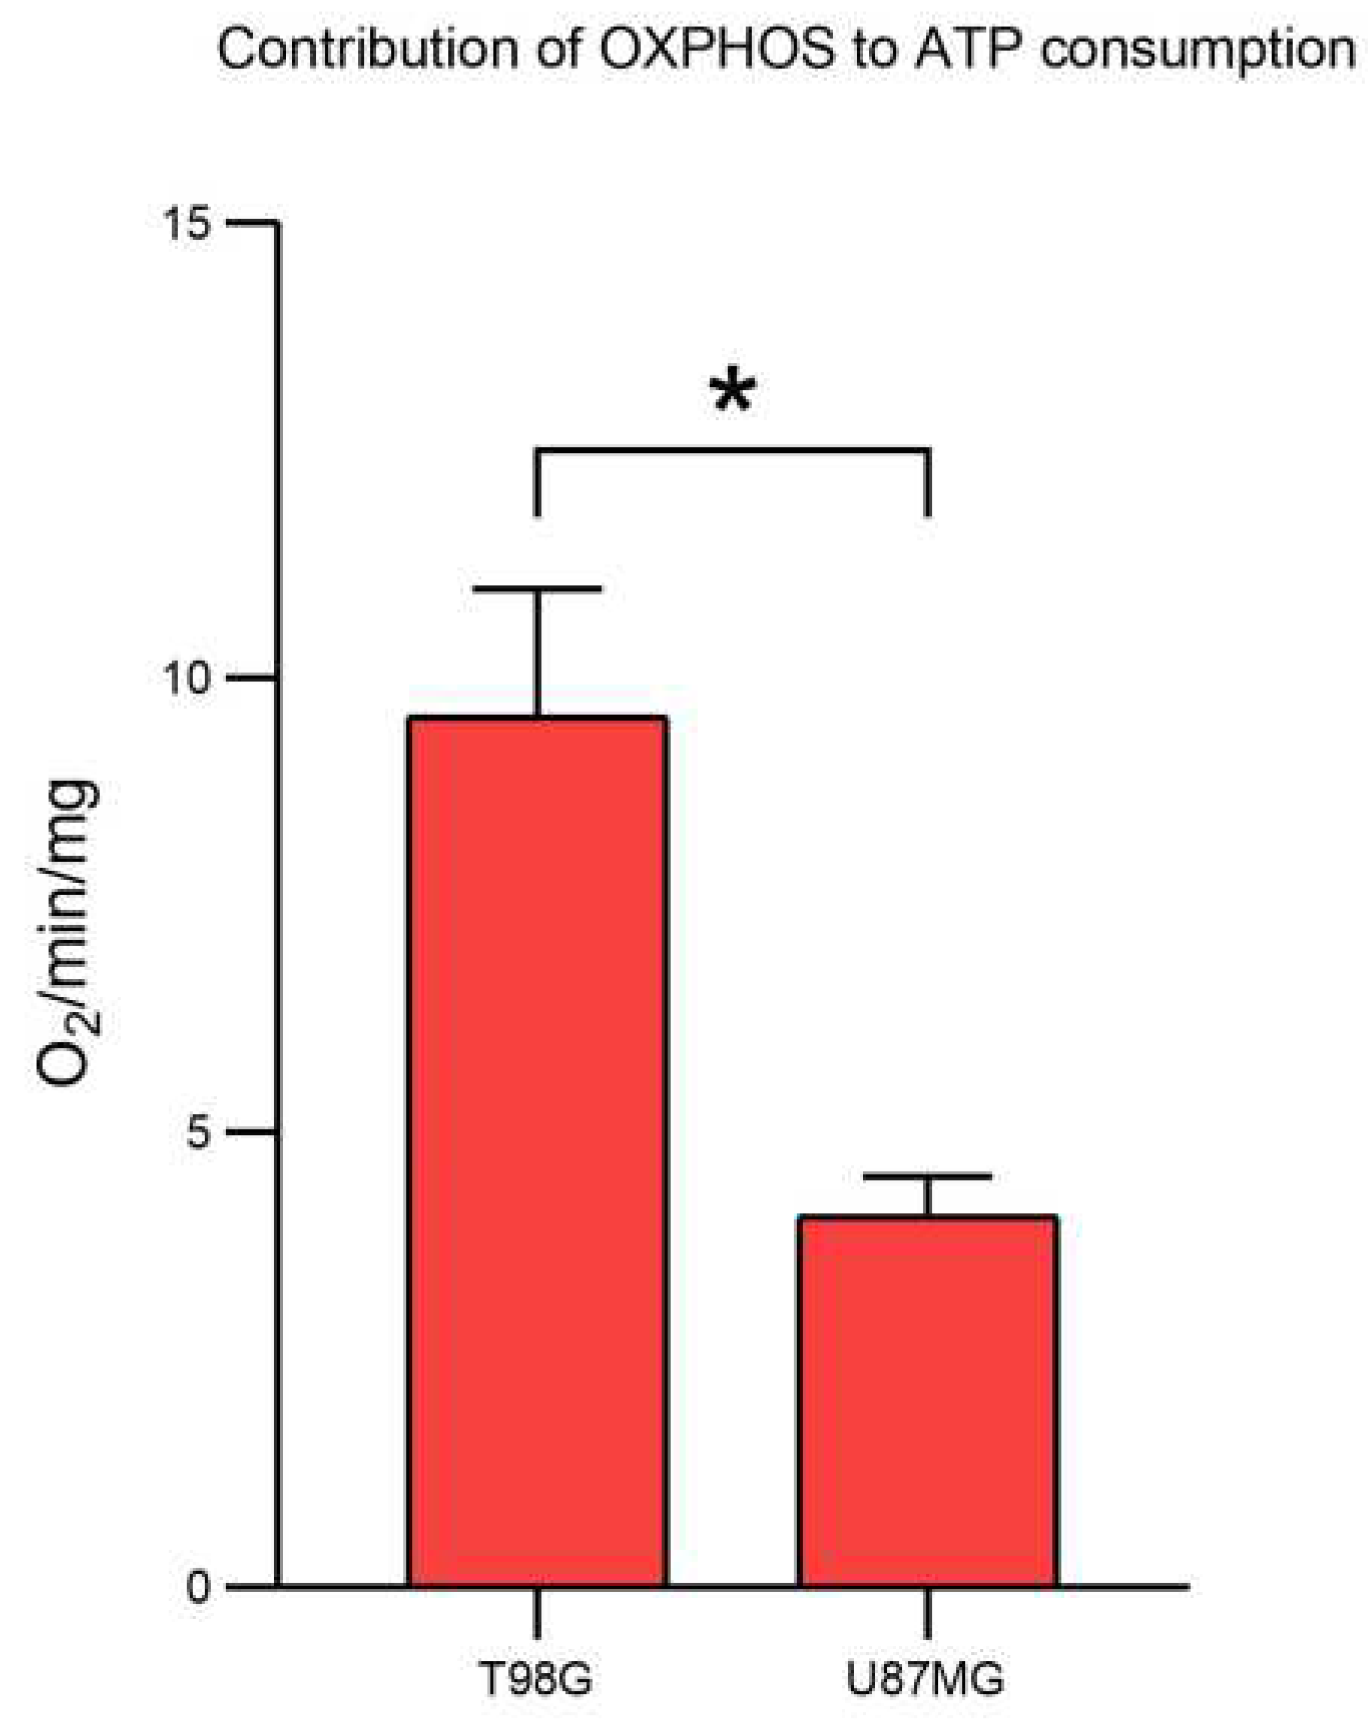
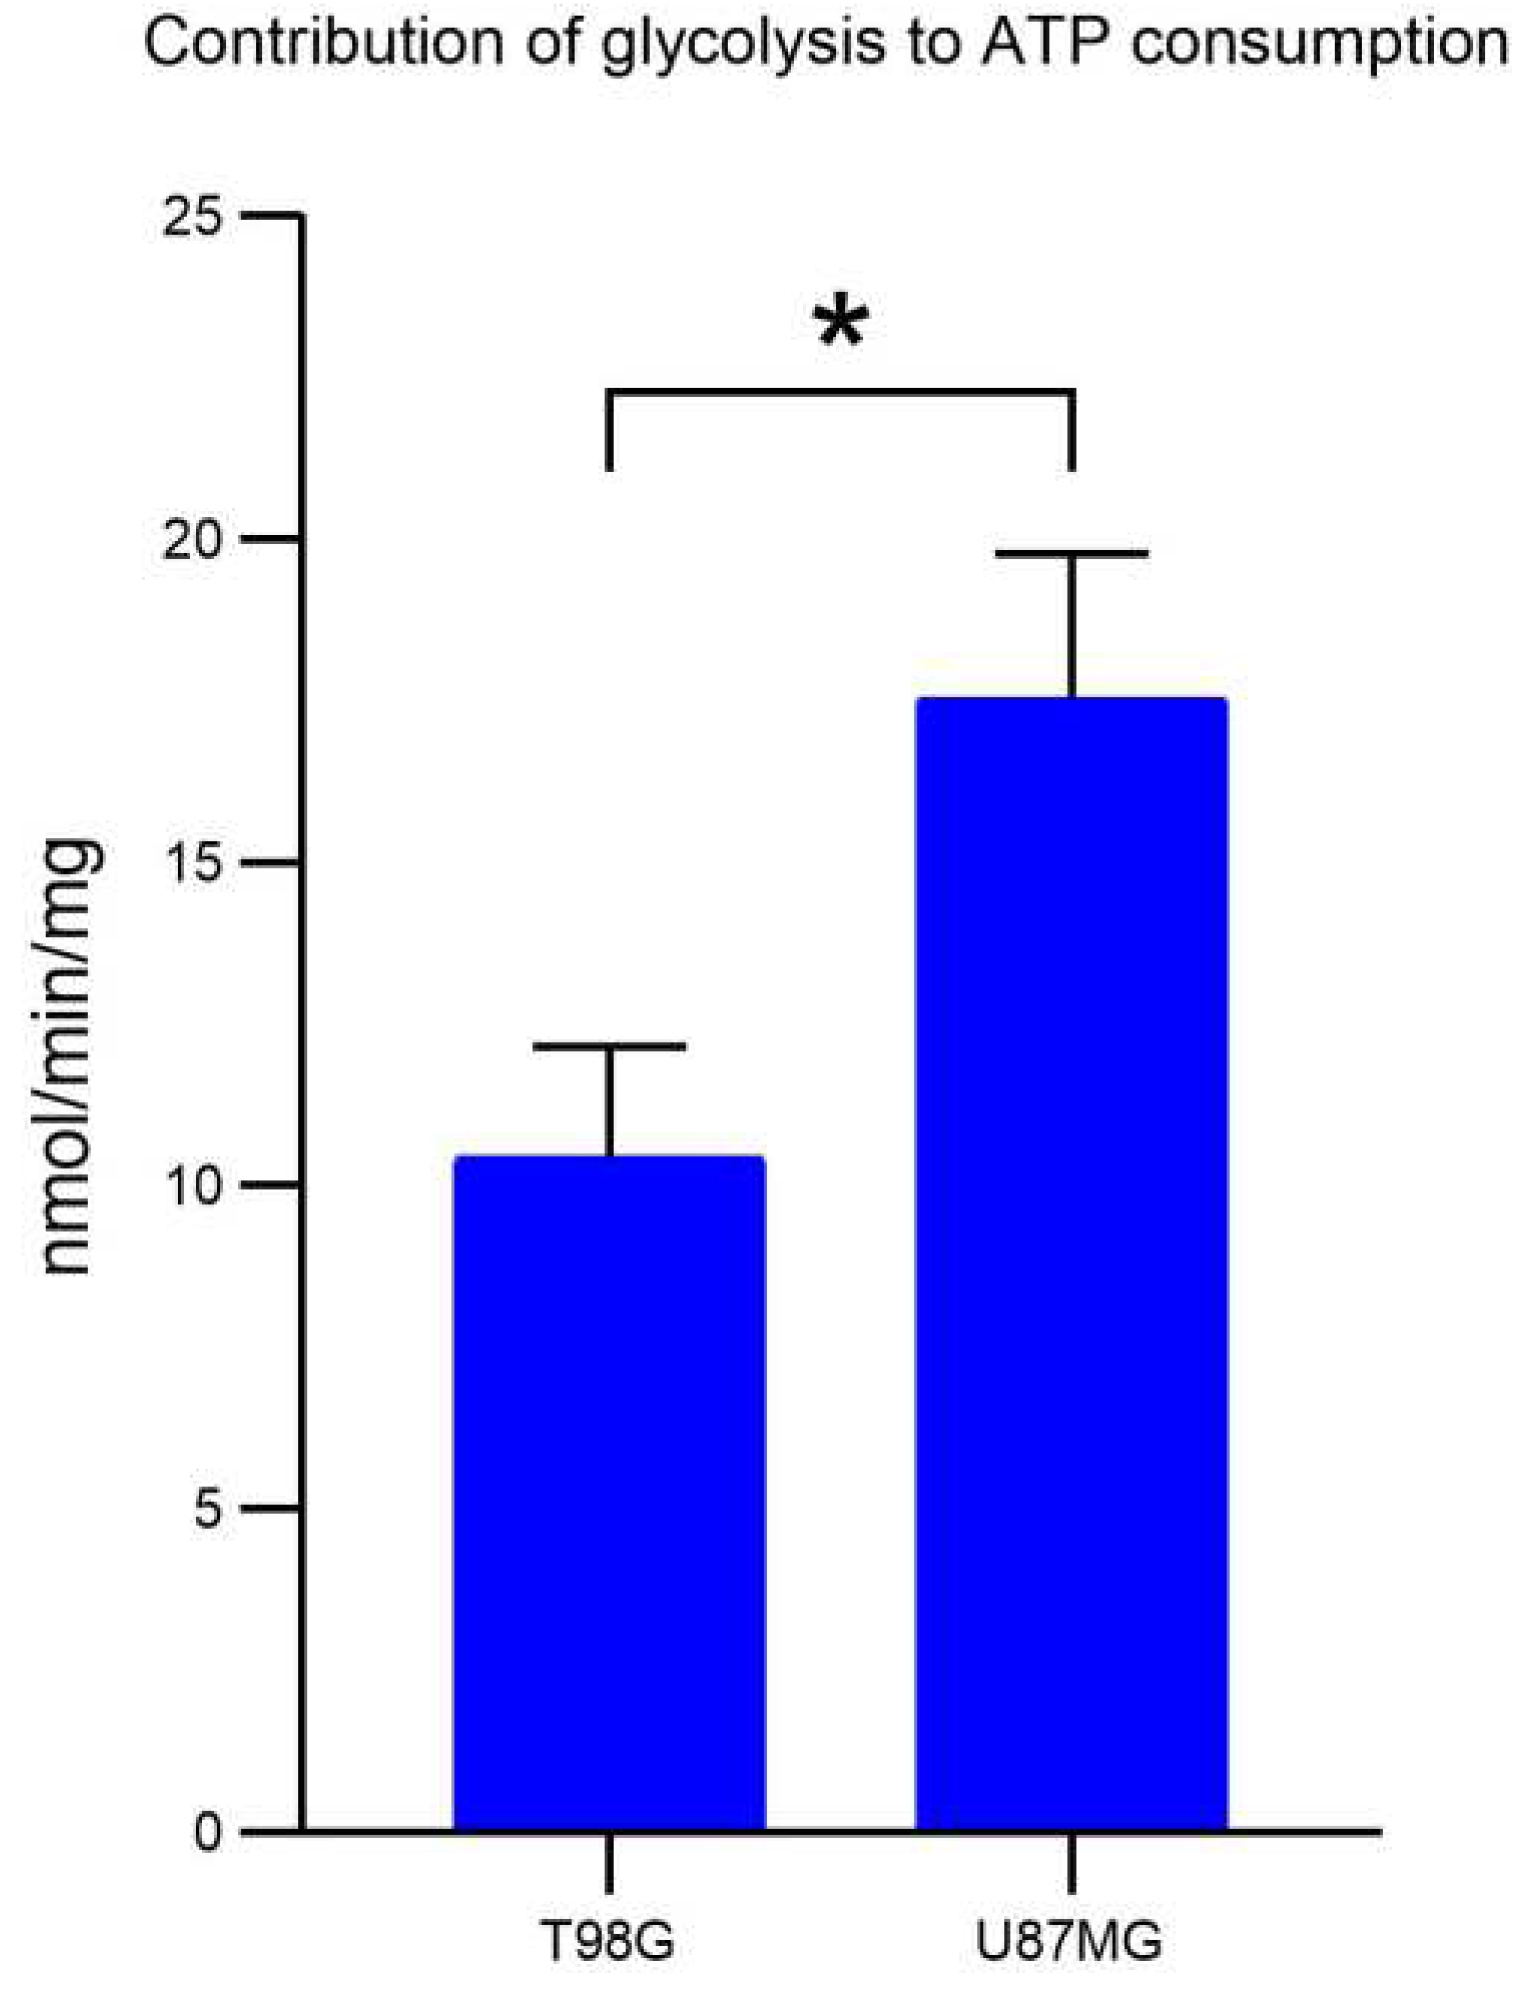
Quantitative proteomics and acetylomics were performed on two distinct glioblastoma cell lines with differing metabolic preferences (U87MG, glycolytic phenotype; T98G, oxidative phenotype) and on isolated mitochondria from these cells. The oxidative metabolic phenotype of the T98G cell line (
Appendix A, Figure A 1) and the glycolytic phenotype of the U87MG cell line (
Appendix A, Figure A 2) were confirmed by measuring oxygen consumption and lactate production (
Appendix A). The cells were treated with either dimethyl sulfoxide (Control) or 3-TYP (Treated), a selective inhibitor for SIRT3. Mass spectrometry-based measurements were performed on three biological replicates for each condition, using a sample processing and analysis approach described in previous studies [
13,
14,
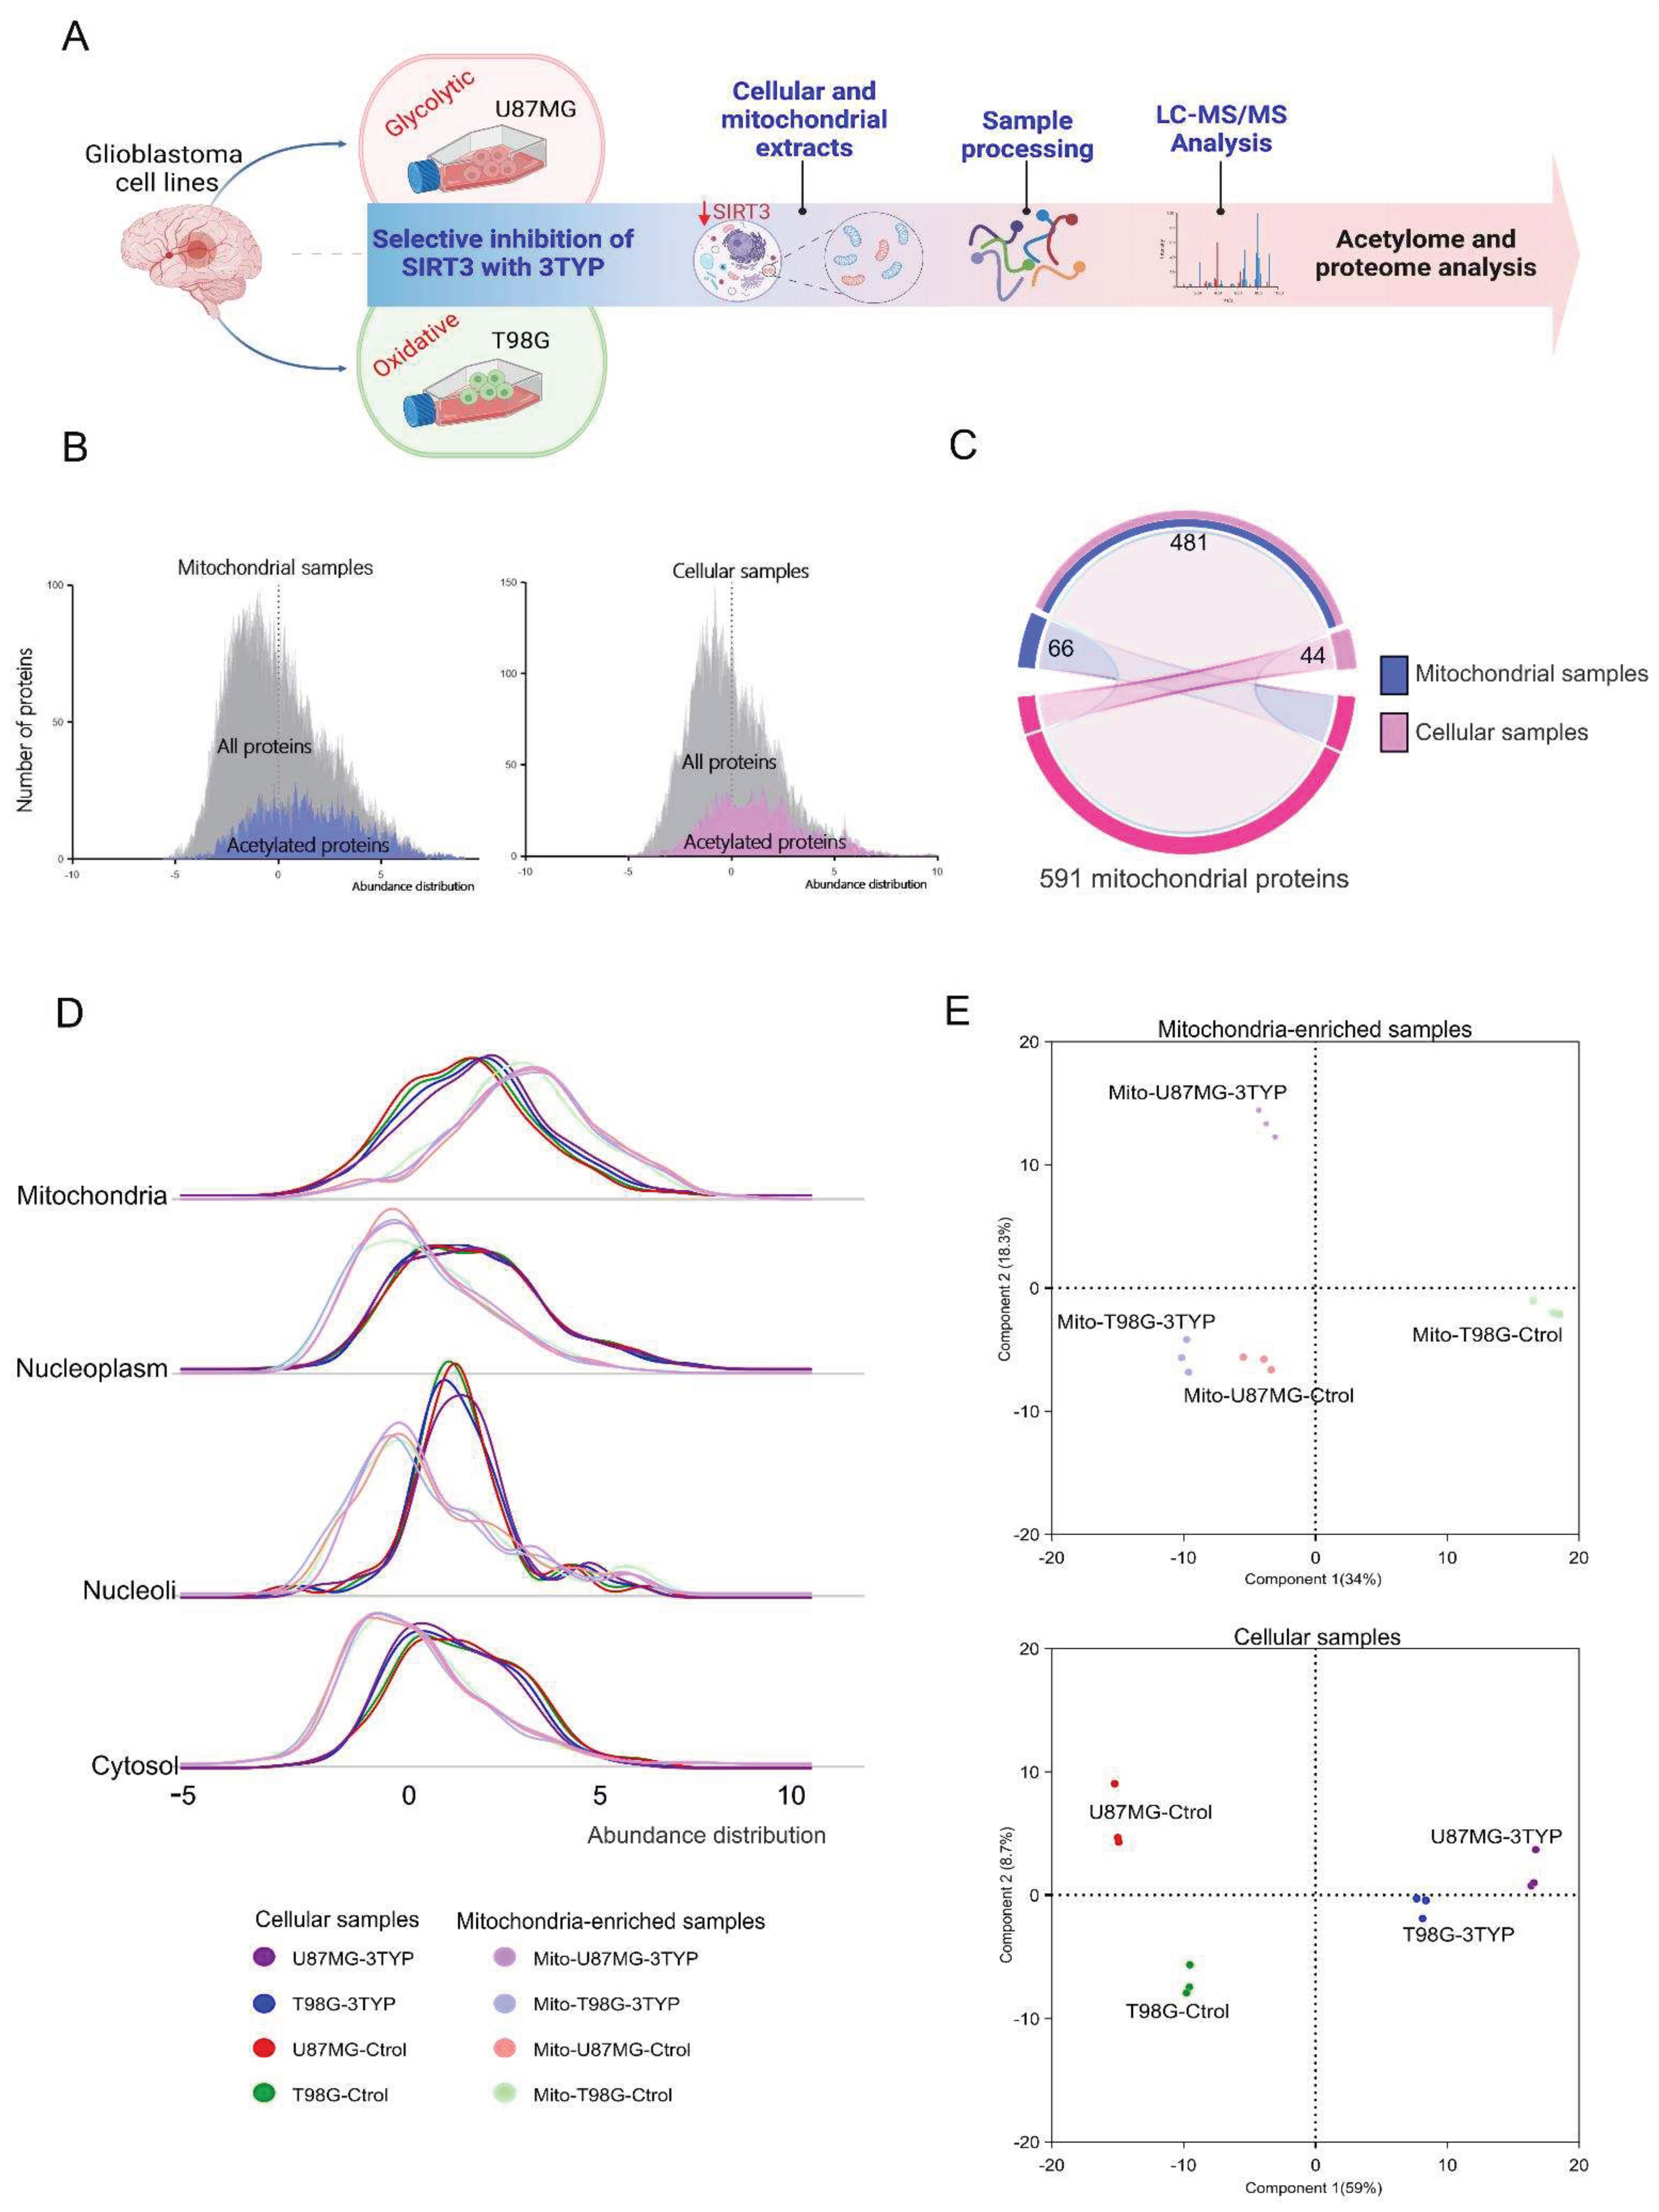
15]. The study outline is illustrated in
Figure 1A.
A total of 5992 proteins were confidently identified, including 1489 acetylated proteins and 2800 acetylation sites. Our results confirmed our previous observation that protein abundance represents a limiting factor for identifying acetylation sites [
16,
17], as illustrated in the abundance distribution histograms for all acetylated identified proteins (
Figure 1B). Based on the annotation of 1119 mitochondrial subcellular location proteins in the Protein Atlas repository[
18,
19], we identified 525 and 547 proteins with a mitochondrial location in the global proteome and mitochondria-enriched samples, respectively (
Figure 1C).
The mitochondrial subcellular enrichment was assessed based on the relative proteome abundance, considering the reported subcellular location for the proteins. As expected, mitochondrial extracts showed higher quantities of mitochondrial proteins while were underrepresented in cellular and nuclear proteins (
Figure 1D). The proteome abundance profiles provided clear discrimination between the two cell lines and treatment conditions. This was evident in both sample types, whole cellular and mitochondrial extracts, as shown by the principal component analyses (
Figure 1E).
In the upcoming sections, we will investigate the differences between two metabolically opposing glioblastoma cell lines and their response to chemical inhibition of the most significant deacetylase in the mitochondria SIRT3, using quantitative proteomics and acetylomics.
2.1. Proteome Dynamics Supporting Phenotypic Features of Glioblastoma Cells.
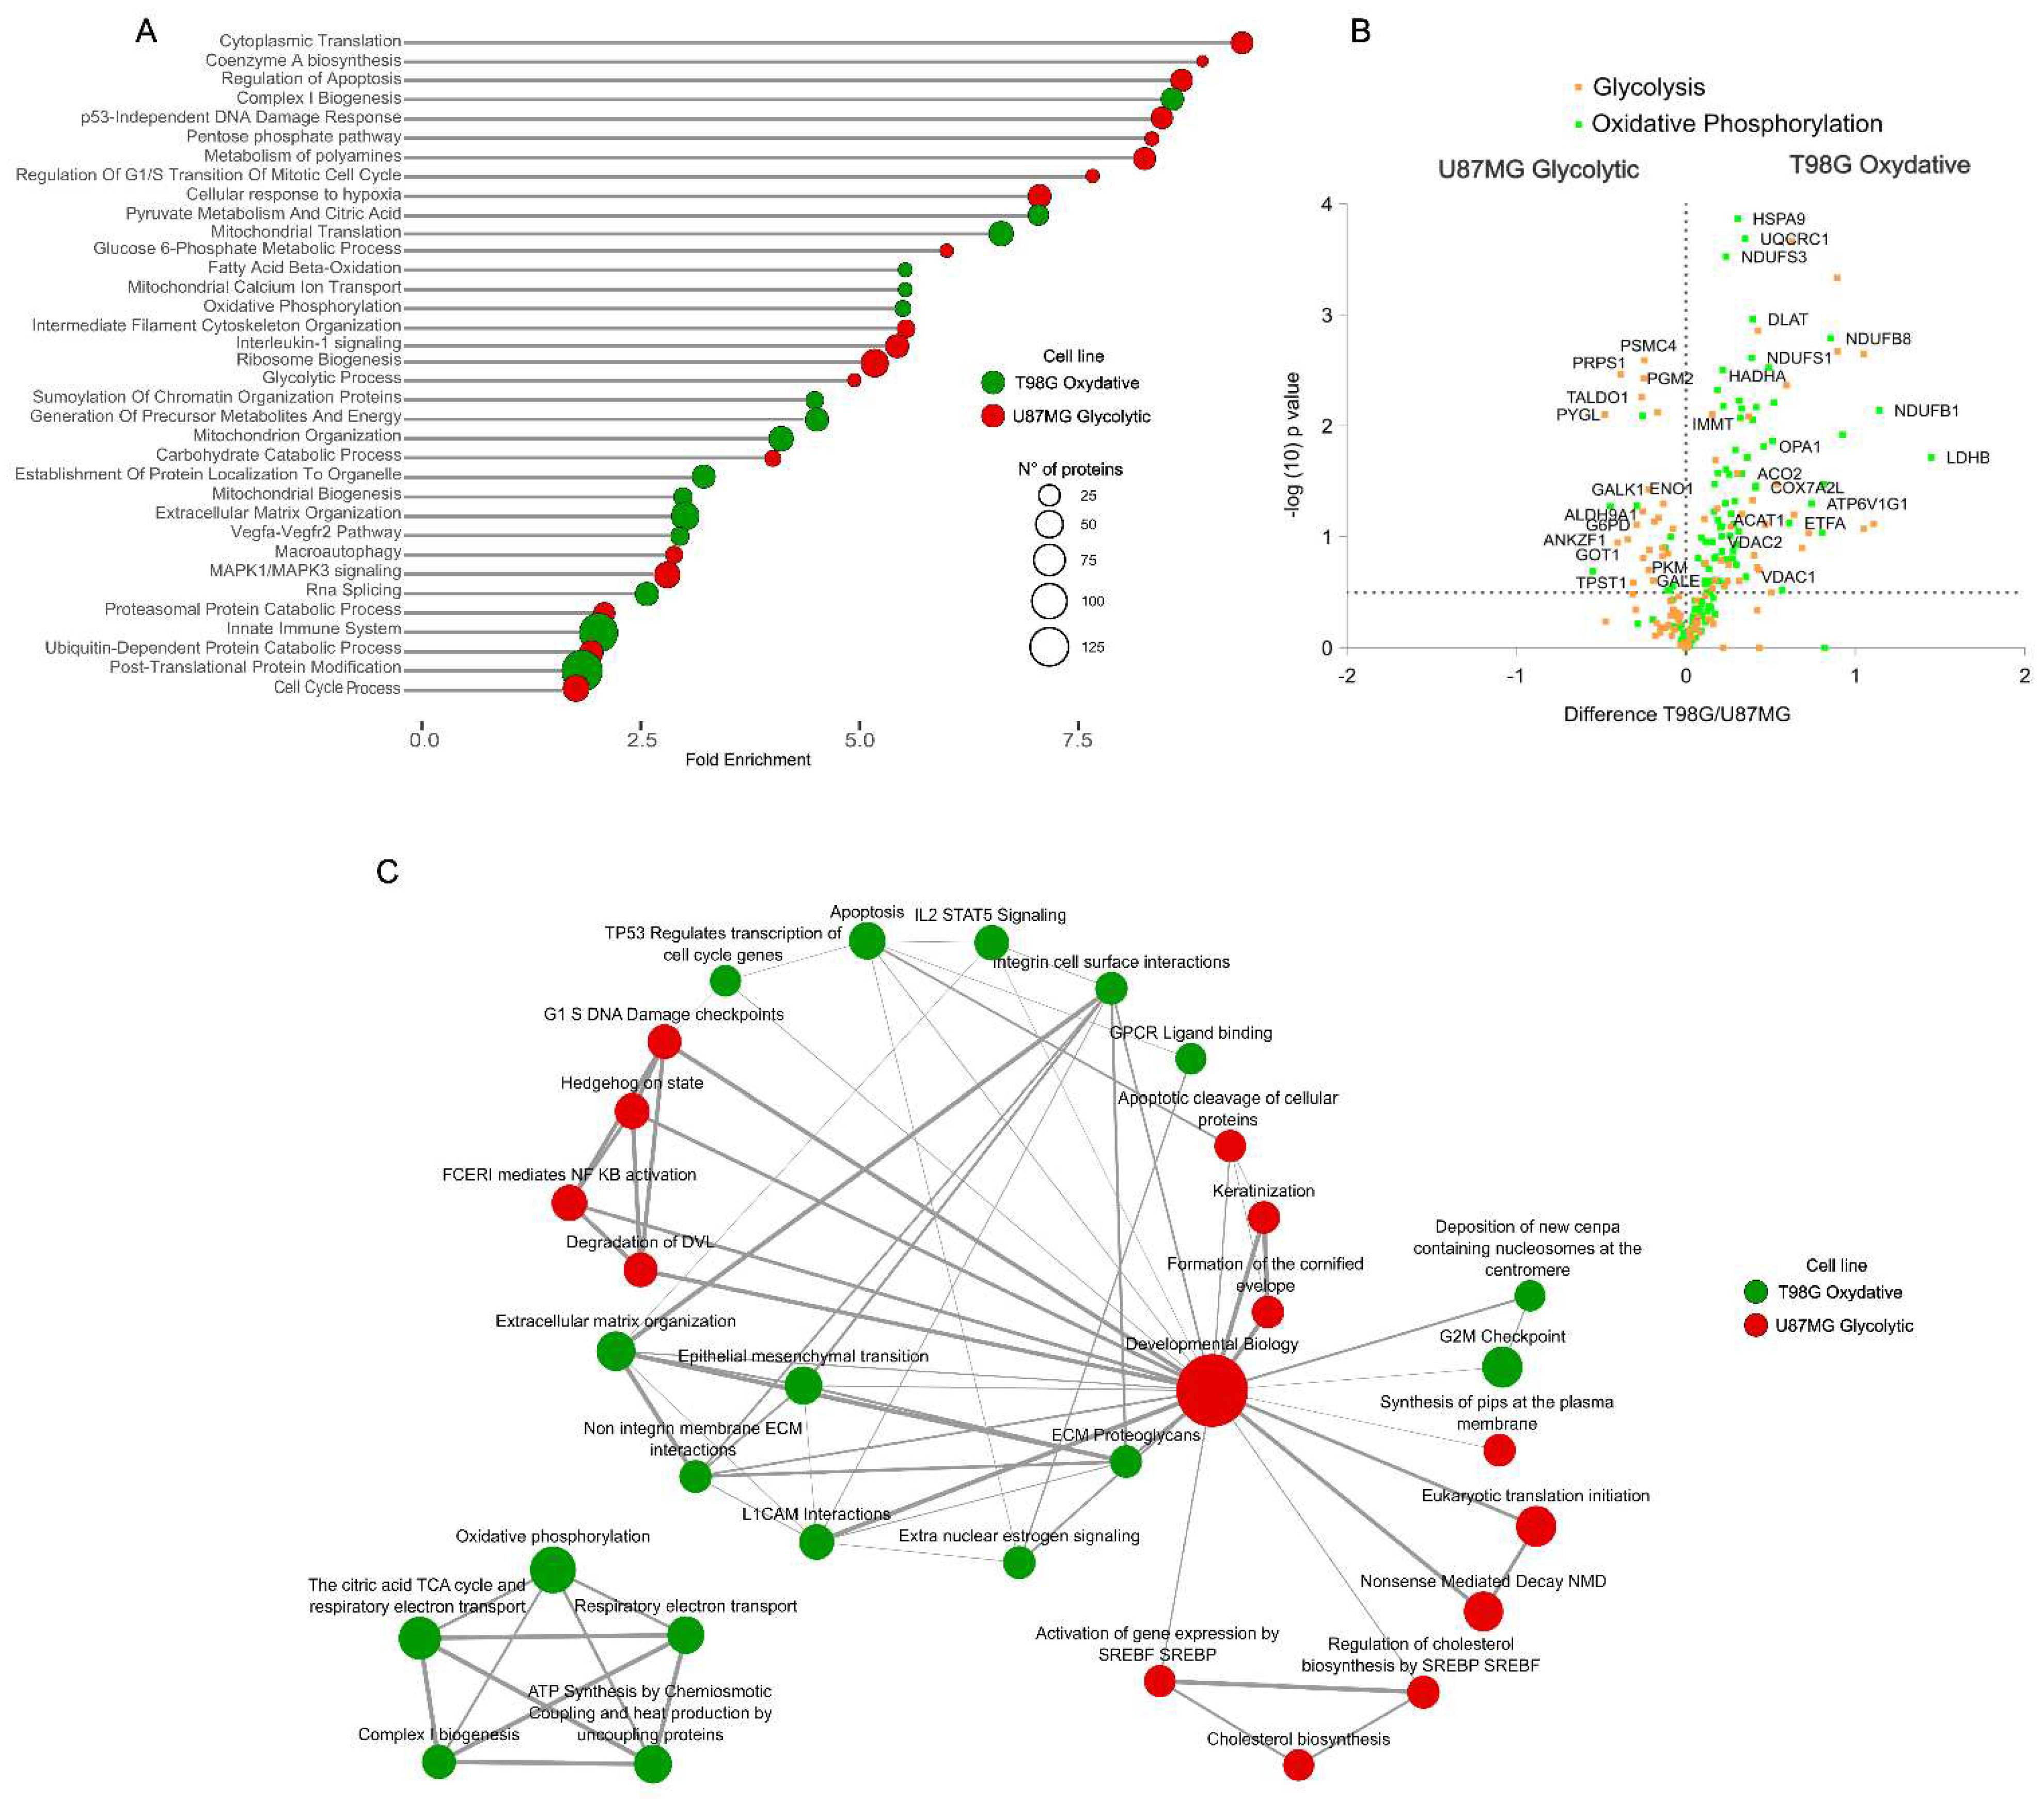
We examined the functional annotation of proteome dynamics to investigate the metabolic phenotypic differences between the glioblastoma cell lines under study. We subjected significantly dysregulated proteins and differential proteome abundance to enrichment analysis. The proteome analysis revealed 2300 proteins significantly differentially expressed between the two cell lines (t-test, FDR 1%). Functional annotation enrichment analysis on these proteins unveiled the molecular signatures supporting the metabolic characteristics of these cell lines (
Figure 2A).
The more aggressive and proliferative glycolytic phenotype of U87MG cells was characterized by the upregulation of pathways related to synthesis, proliferation, cellular translation machinery, ribosome biogenesis, and RNA splicing. These cells also activated the cellular response to hypoxia even under normoxic conditions, supporting their high-energy demands. The relative downregulation of immune system-related processes highlighted the aggressiveness of the glycolytic phenotype in glioblastomas. Conversely, the oxidative phenotype of T98G cells showed significant upregulation of mitochondrial-related functions, including mitochondrial metabolism, organization, biogenesis, transport, and translation. Furthermore, the significantly upregulated proteome in these cells was enriched in extracellular matrix organization and immune system processes. Proteins directly involved in glycolysis and oxidative phosphorylation provided additional validation supporting the described metabolic phenotypes in these cells (
Figure 2B) (
Table S1).
These findings at the functional molecular level provide insights into a better understanding of the differences in disease presentation associated with the metabolism of tumor cells [
18,
20]. The global available proteome dynamics between these cells were subjected to gene set enrichment analysis (GSEA), which largely confirmed our previous observations. The functional molecular signature of cells with an oxidative phenotype was characterized by an enrichment of pathways involved in mitochondrial energy metabolism, extracellular matrix organization, and immune system response signaling. In contrast, cells with a glycolytic phenotype were characterized by upregulation of pathways involved in synthesis processes (
Figure 2C).
2.2. Acetylation Profile in Oxidative and Glycolytic Glioblastoma Cell Lines.
At the proteome level, we investigated the acetylation profile of oxidative and glycolytic glioblastoma cell lines. Our analysis identified 2800 acetylation sites across 1489 proteins, indicating that acetylation is a common post-translational modification across all subcellular components and significantly regulates various cellular functions [
8,
15,
21,
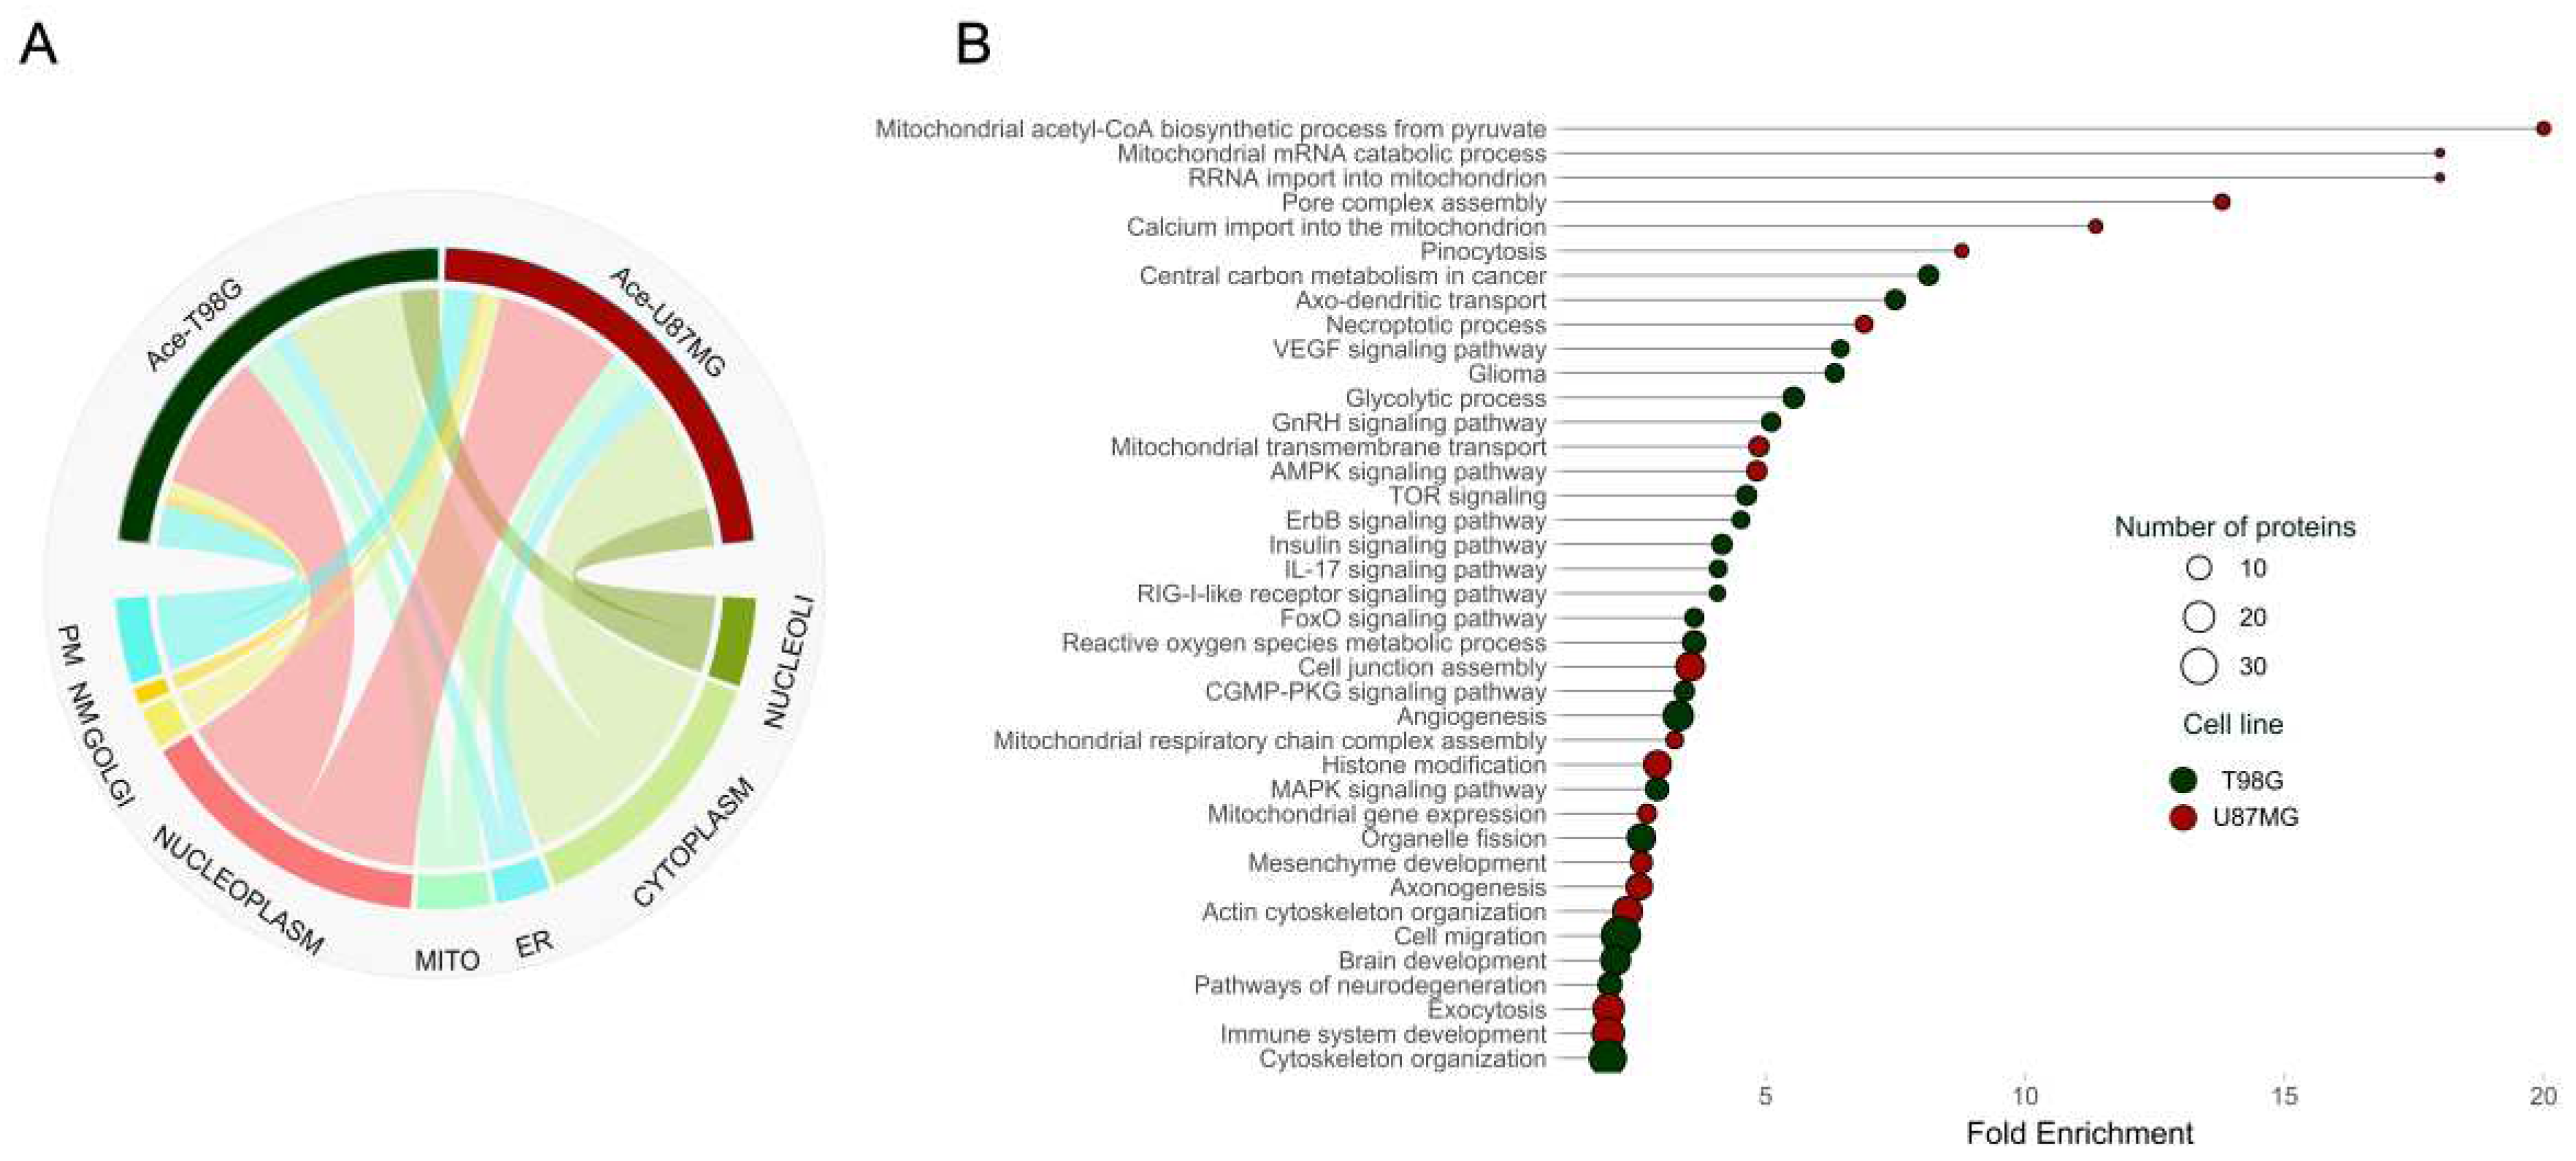
22]. There were no significant differences in the subcellular distribution of acetylated proteins between the two cell lines (
Figure 3A).
Interestingly, in the T98G cell line, we identified 1398 acetylated sites from 1058 proteins, whereas the U87MG cell line had 1380 acetylated sites from 1049 proteins. Upon comparing these acetylation sites, we discovered that 702 were exclusive to the T98G oxidative cell line, while 693 were exclusive to the U87MG glycolytic cell line. Moreover, 356 acetylation sites were common in both cell lines.
The acetylation analysis revealed 266 and 272 peptides with relatively higher acetylation occupancy (> 0.2%) in T98G and U87MG, respectively. The differences in acetylation stoichiometry in proteins between both cell lines play integral roles in diverse metabolic processes. This significance is underscored by the pathway enrichment analysis depicted in
Figure 3B, shedding light on specific processes regulated by lysine acetylation.
The high acetylation of some components of signaling pathways in the oxidative cell line underscores the potential role of acetylation in regulating critical processes and maintaining cellular homeostasis. While most of these signaling pathways are implicated in cancer, information regarding the acetylation of their components is limited, and the regulatory effects of this modification remain unclear. The Epidermal Growth Factor Receptor (EGFR) participates in pathways such as mitogen-activated protein kinase (MAPK) signaling, forkhead box O (FoxO) signaling, and the phosphoinositide 3-kinase (PI3K-Akt) signaling. It induces cell proliferation and has been implicated in glioblastoma's pathogenesis and treatment resistance [
23]. Acetylation of EGFR is necessary for regulating its function, and higher acetylation levels have been linked to enhanced EGFR activity [
24]. Acetylation of certain members of the vascular endothelial-derived growth factor (VEGF) signaling pathway has been linked to angiogenesis, which is the primary function of this signaling pathway[
25].
Interestingly, we have observed acetylated proteins associated with crucial brain processes such as axo-dendritic transport and brain development within the oxidative cell line. Additionally, we have identified acetylation in proteins implicated in gliomas and pathways related to neurodegeneration. Despite the lack of evidence regarding the acetylation state in a glycolytic cell line compared to an oxidative one, our findings indicate that the glycolytic cell line indeed exhibits an acetylation state predominantly associated with mitochondrial-related proteins. Notably, processes such as mRNA catabolic process, calcium import, transmembrane transport, respiratory chain complex assembly, gene expression, and acetyl CoA biosynthetic process from pyruvate, among others, demonstrated acetylation.
Furthermore, the glycolytic cell line exhibited acetylation patterns associated with mitochondrial damage, specifically in necroptotic processes and pore complex assembly. It is worth noting that mitochondria play a crucial role in regulating necroptosis, which is a controlled form of necrosis that relies on the generation of mitochondrial reactive oxygen species (mt ROS) and is dependent on mitochondrial permeability transition[
26].
The glycolytic cell line also presents acetylation in proteins that participate in processes related to cancer development. Members linked to mesenchyme development, actin cytoskeleton organization, and cell junction assembly. During mesenchyme development, epithelial cells can reorganize the cytoskeleton, lose cell–cell contacts, and gain a mesenchymal phenotype to facilitate cell motility, resistance to apoptosis, and epithelial-mesenchymal complex (ECM) production. Current evidence shows that acetylation in some histone and non-histone proteins is implicated in the ECM transition and regulates this process[
27].
Both cell lines showed enrichment in acetylated proteins involved in the spliceosome machinery complex. The regulation of spliceosome-related proteins through PTM is not well understood. However, studies indicate that dysregulation of pre-mRNA splicing leads to the production of aberrant proteins that accelerate tumorigenesis [
28].
2.3. Mitochondrial Pathway Proteins are Overexpressed in Response to SIRT3 Inhibition in Glycolytic and Oxidative Glioblastoma Cell Lines.
The regulation of acetylation modifications by SIRT3 is essential for preserving mitochondrial function. However, the function of SIRT3 seems to be dependent on the context. While it can promote the growth of certain cancers that depend on OXPHOS, it can also act as a tumor suppressor in cancers that rely on glycolysis [
29]. Our primary focus in this section was to explore how SIRT3 inhibition affects protein expression in our two cell lines with different metabolism dependencies. To selectively inhibit SIRT3, we used 3-TYP reactive, a specific inhibitor to SIRT3 over SIRT2 and SIRT1. Although 3-TYP did not affect SIRT3 expression, it effectively inhibited its activity [
30].
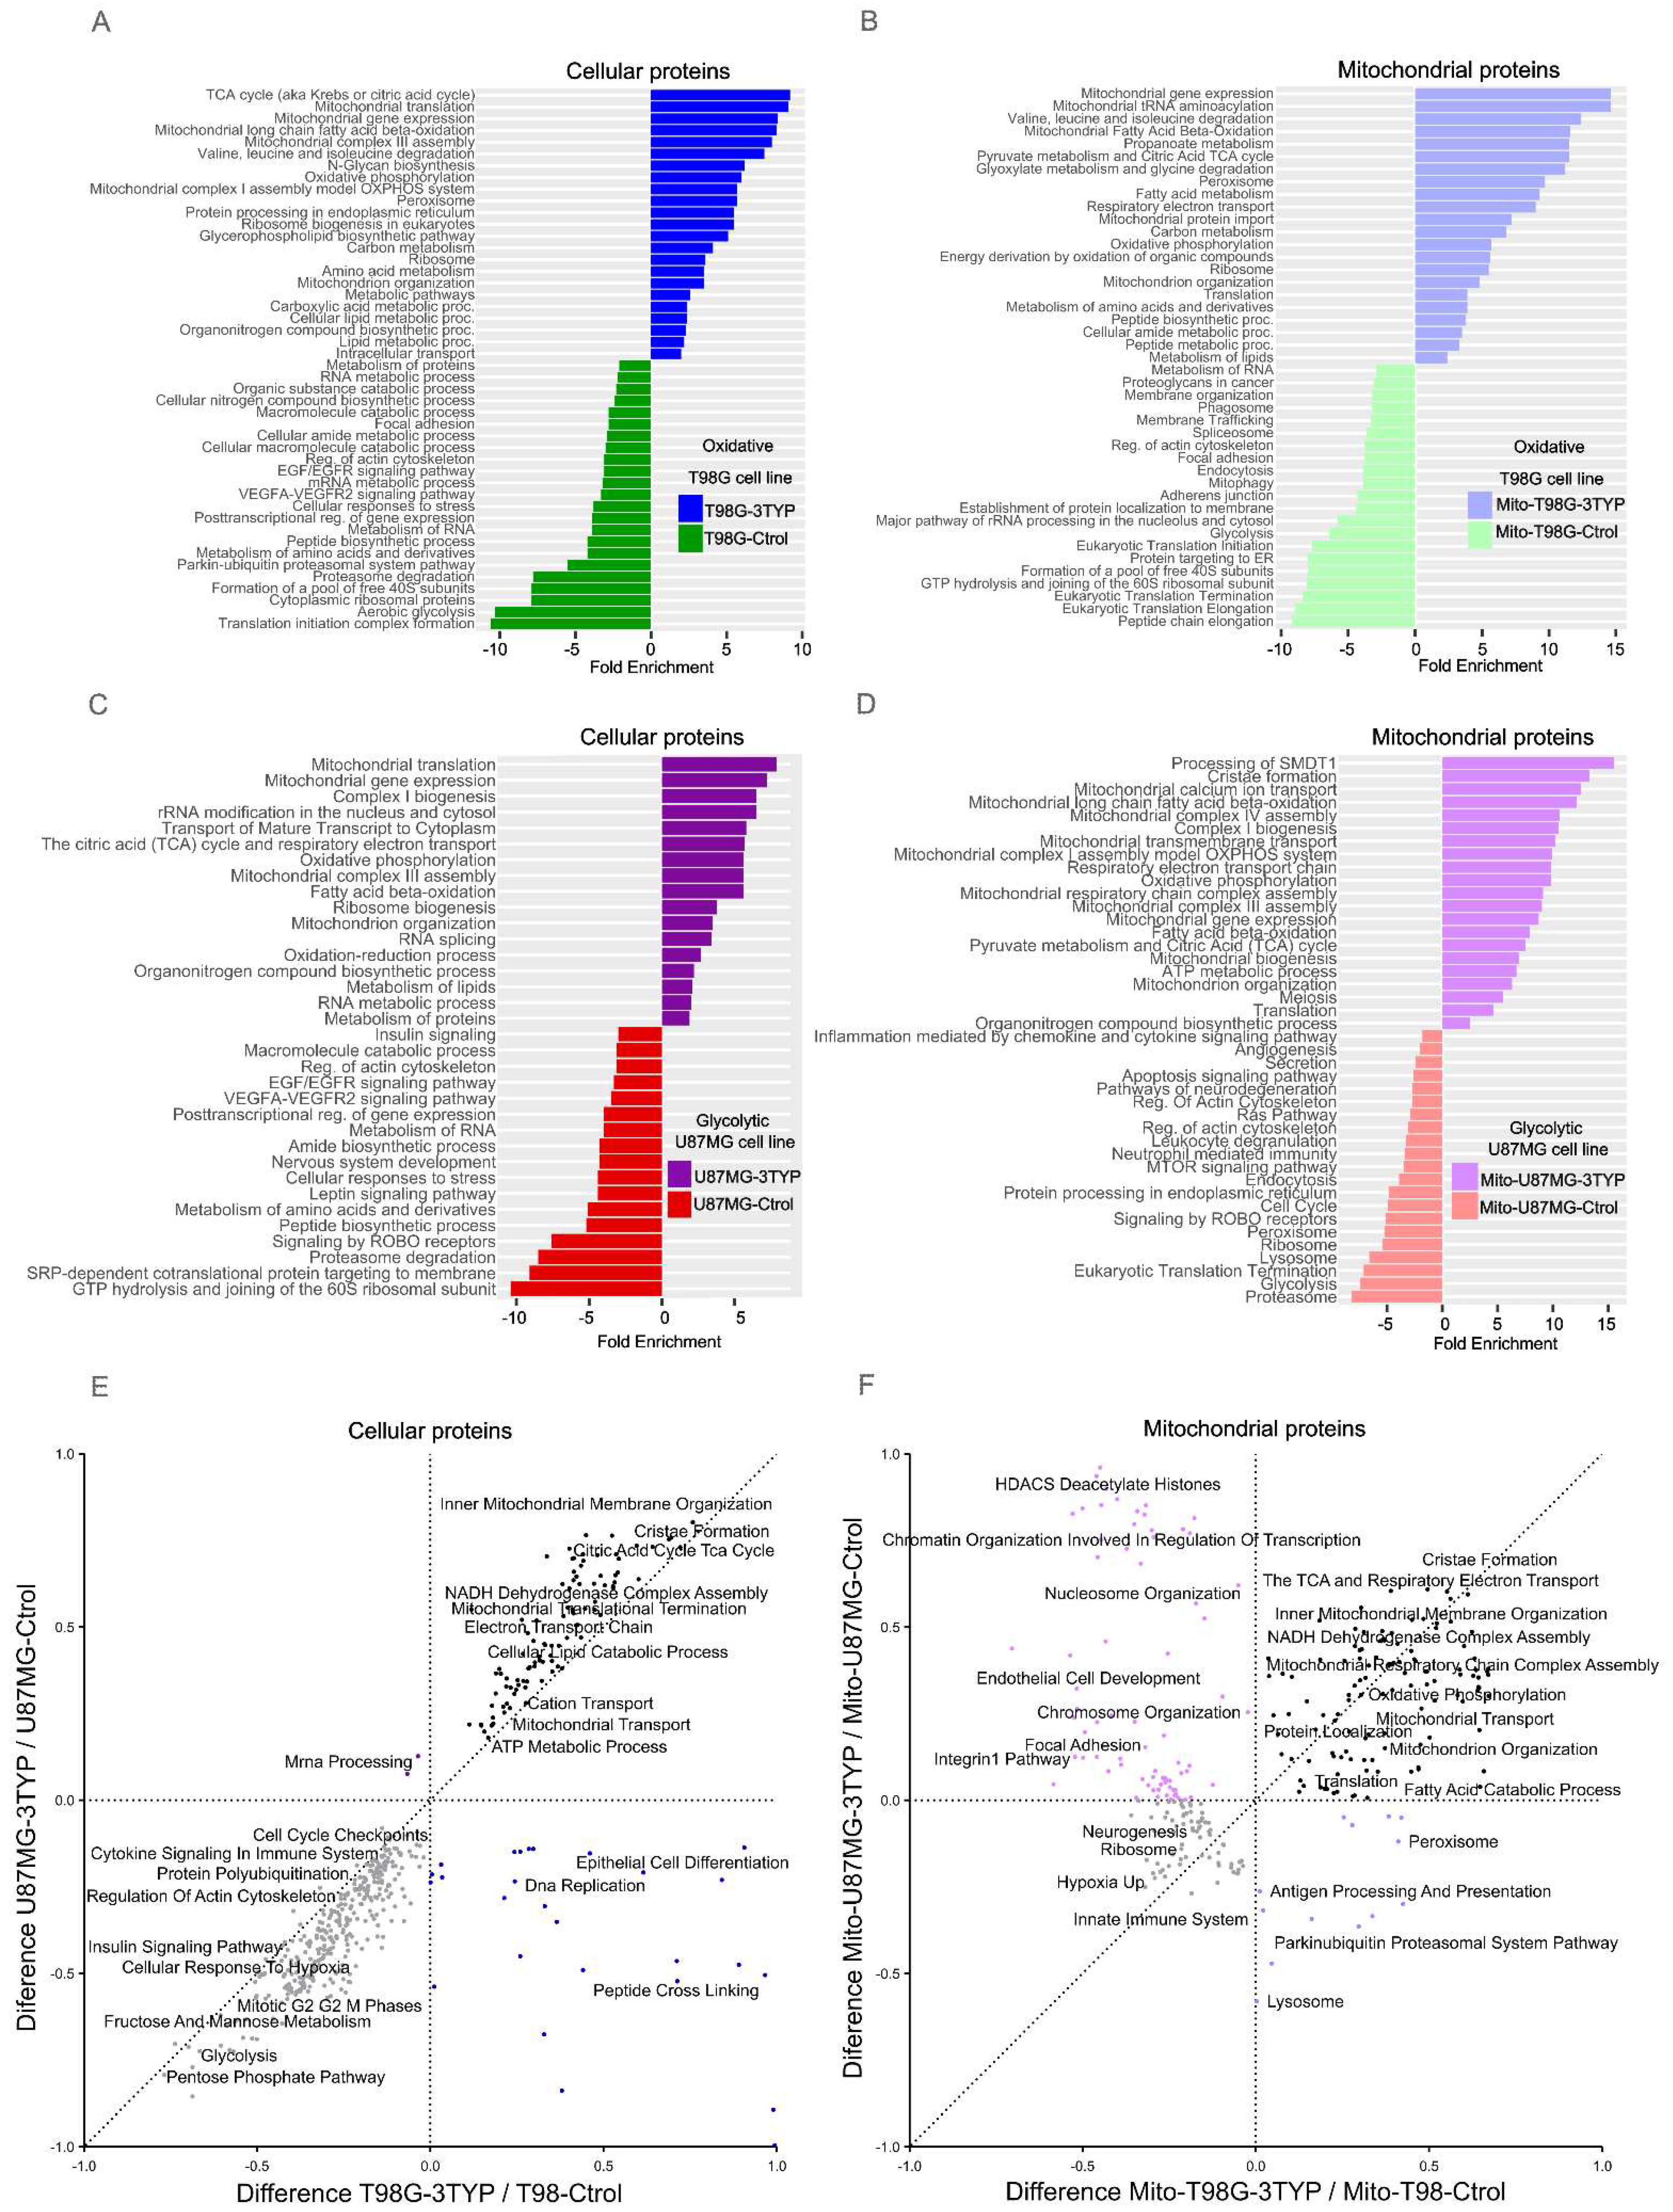
In the cellular samples, 1554 proteins were significantly upregulated in the T98G-3TYP cell line compared to the control (T98G-Ctrol). The pathways enriched in T98G-3TYP included fatty acid metabolism and degradation, TCA cycle, oxidative phosphorylation, and proteins from ribosome and peroxisome. The down-regulated proteins after treatment were associated with glycolysis, the HIF-1 signaling pathway, biosynthesis of amino acids and nucleotide sugars, and proteins of the spliceosome and proteasome (
Figure 4A).
In the mitochondrial enriched samples, 1182 proteins were significantly upregulated in the oxidative T98G cell line after treatment. The pathways enriched in these proteins included the TCA cycle, oxidative phosphorylation, fatty acid beta-oxidation, peroxisome, and ribosome biogenesis. The downregulated proteins were associated with other pathways, such as the phagosome, spliceosome, endocytosis, focal adhesion, glycolysis, and mitophagy (
Figure 4B).
One thousand nine hundred ninety-seven proteins were significantly upregulated in the U87MG cell line after treatment with 3TYP. The functional enrichment analysis revealed that these proteins were involved in the degradation of amino acids and fatty acids, as well as pathways like oxidative phosphorylation and TCA cycle, peroxisome, and spliceosome. In contrast, the proteins that decreased their expression in treated U87MG were associated with the transport and localization of proteins, biosynthesis of macromolecules, peptides, cellular nitrogen compounds, and translation (
Figure 4C).
A total of 933 proteins were significantly upregulated in the treated U87MG cell line (Mito-U87MG-3TYP) compared to the control (Mito-U87-Ctrol). The enrichment analysis showed that these proteins were involved in mitochondrial complex I, III, and IV assembly, oxidative phosphorylation, TCA cycle, cristae formation, mitochondrial biogenesis, and mitochondria organization. In contrast, the proteins that decreased their expression in treated U87MG were associated with apoptosis, cell cycle, Ras pathway, endocytosis, ribosome, peroxisome, proteasome, etc. (
Figure 4D).
The response of each cell line to the SIRT3 inhibition treatment is unique. However, the 2D enrichment analysis reveals that both cell lines overexpress proteins involved in mitochondrial metabolism, such as those related to cristae formation, the Krebs cycle, and the electron transport chain (
Figure 4E and 4F). It was unexpected to observe this outcome from the inhibition of SIRT3, given the enzyme's complex role in tumor biology. SIRT3 can act as a tumor promoter or tumor suppressor, depending on the context of the cancer [
31]. For instance, it has been shown to have protumorigenic properties in colorectal cancer and squamous cell carcinoma [
32,
33]. At the same time, its knockdown has been associated with tumor proliferation and tumorigenesis in breast and liver cancer, where it functions as a tumor suppressor [
34].
In a previous study where SIRT3 inhibition affected the glycolytic metabolism of a cell, the researchers found that the suppression of SIRT3 led to abnormal glycolysis [
35]. Therefore, in response to the reduced function of SIRT3, the cell overexpresses the mechanisms that were affected to counteract this effect. This finding suggests that although a cell's metabolism is mainly glycolytic, mitochondrial function is still present, which indicates that SIRT3 is crucial for maintaining both metabolic phenotypes and, more importantly, the integrity of mitochondria. Overall, the findings of this study highlight the importance of SIRT3 in maintaining the normal functioning of cells and the delicate balance between glycolysis and mitochondrial metabolism.
2.4. SIRT3 Regulates the Synthesis of Proteins.
To gain a deeper understanding of the role of SIRT3, we conducted a functional enrichment analysis with the proteins that exhibited an increase in acetylation occupancy by more than 0.2% after treatment with the SIRT3 inhibitor 3TYP in both T98G and U87MG cell lines. In the T98G-3TYP cell line, we observed an elevation in site-specific for 236 acetylation sites, whereas the U87MG cell line displayed an increase the occupancy for 269 acetylation sites.
Applying the same criterion to mitochondrial enriched samples, we discovered that the T98G cell line (Mito-T98G-3TYP) increased site-specific occupancy for 196 acetylation sites. Similarly, the treated U87MG cell line (Mito-U87-3TYP) increased in occupancy for 183 acetylation sites (
Table S2).
In cancer cells, growth and proliferation processes are intricately linked to cell metabolism, which is regulated to a large extent by acetylation. Our study provides valuable insights into the specific processes and pathways affected by inhibiting SIRT3.
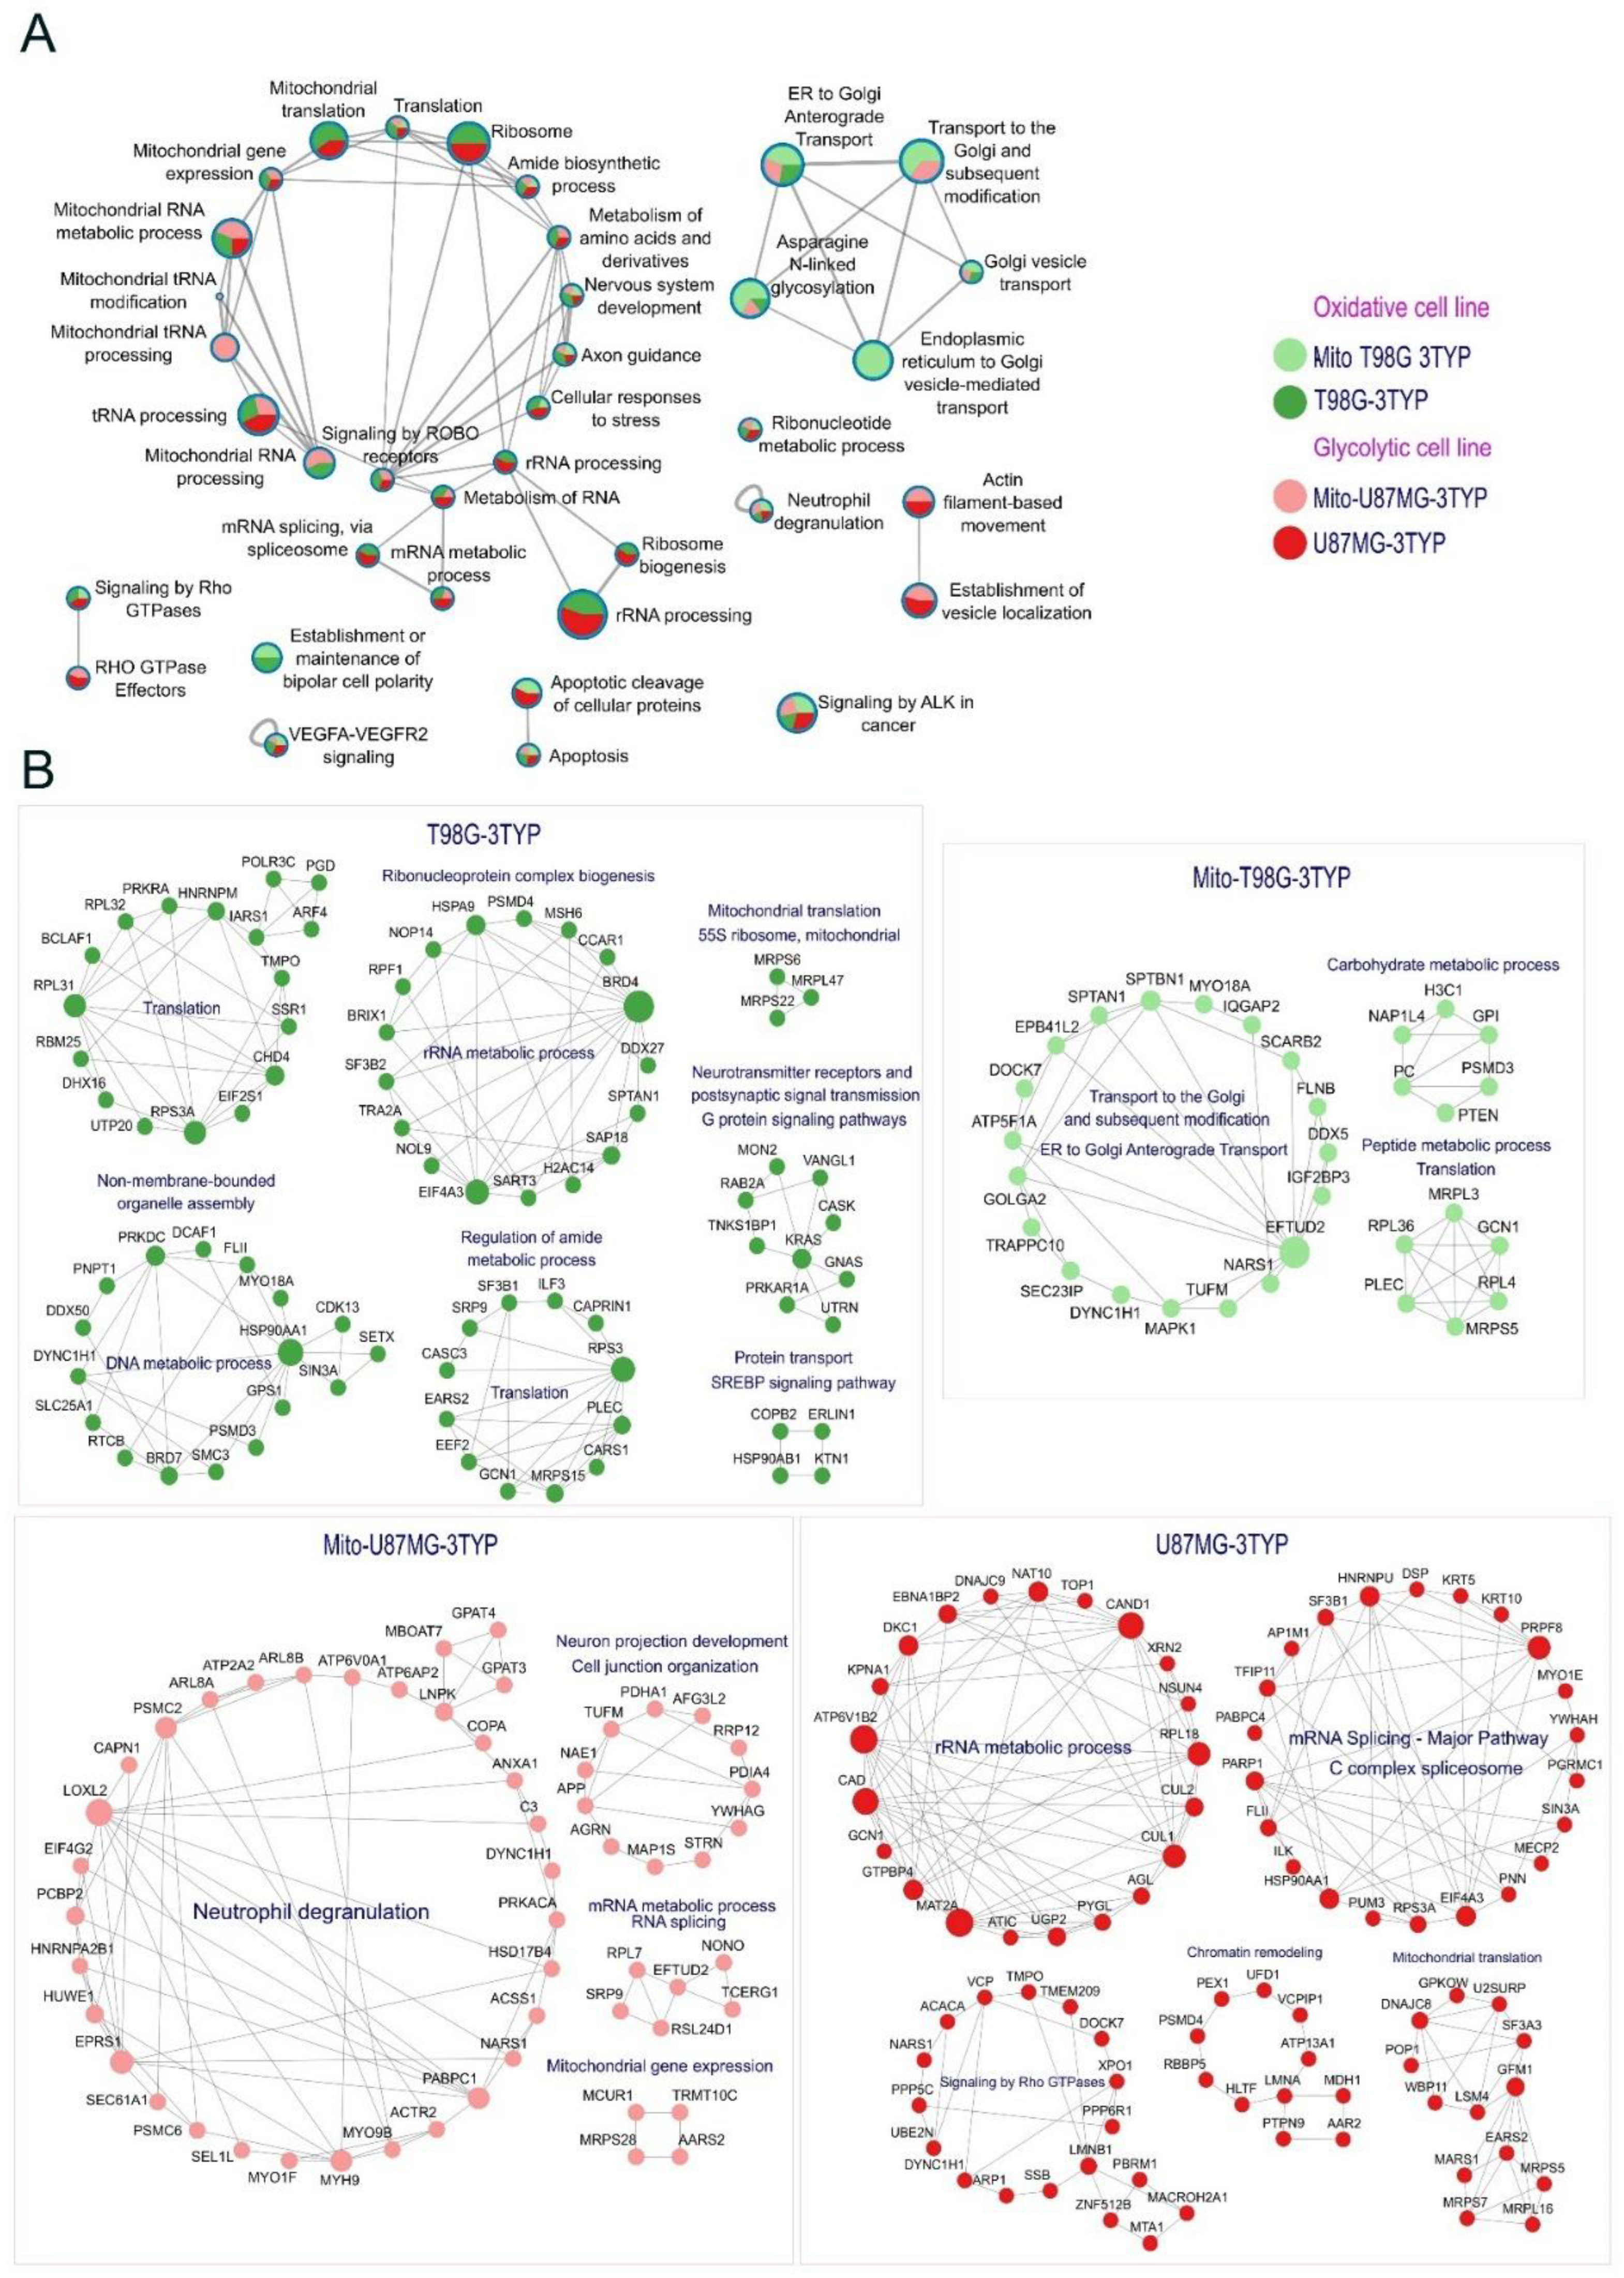
Figure 5A visually represents the impact of acetylation changes in response to treatment with 3TYP in both oxidative and glycolytic cell lines. The pie plots in the figure depict various pathways, with the size of the pie slices indicating the number of proteins that increased their acetylation in response to treatment in cellular or mitochondrial fractions associated with each pathway. This representation highlights the relative influence of acetylation changes on different biological processes.
The inhibition of SIRT3 predominantly impacts the acetylation of proteins involved in critical signaling pathways, such as vascular endothelial growth factor receptor (VEGFR) signaling, anaplastic lymphoma kinase (ALK) signaling, and ROBO receptor signaling. This highlights the regulatory role of acetylation in signaling pathways and the well-known role of phosphorylation. Additionally, RNA processing and mitochondrial RNA metabolism processes are significantly impacted. Notably, we observed acetylation changes in proteins associated with nervous system development and axon guidance.
Figure 5B provides a more detailed view of each sample's specific protein alterations resulting from SIRT3 inhibition.
We discovered acetylation in specific members of the ribosomal 55s subunit in the oxidative cell line. Previous studies have shown a direct interaction between SIRT3 and 55s ribosome, and acetylation of Mitochondrial ribosomal proteins (MRPs) proteins has been identified as a regulatory process [
36]. Acetylation of ribosomal proteins likely contributes to fine-tuning the regulation of translation and may play a role in the functions of MRPs beyond their involvement in ribosomes. Specifically, we found SIRT3-dependent acetylation in some proteins, including MRPS6, MRPS22, MRPL47, and MRPL3.
After treatment in the glycolytic cell line, we also observed increased acetylation in specific mitochondrial ribosomal proteins, including MRPS5, MRPL16, and MRPS7. This suggests that acetylation of ribosomal proteins is an essential modification in both cell lines and serves as a mechanism for regulating mitochondrial translation machinery. However, the exact implications of this modification still need to be fully understood, and its impact on energy metabolism has yet to be thoroughly studied. Further research is required in order to uncover the precise role of acetylation in regulating mitochondrial translation machinery and its effects on energy metabolism.
The effect of acetylation on most members of the ribonucleoprotein complex biogenesis remains poorly understood. Heat Shock Protein Family A (HSPA9), a mitochondrial chaperone of the heat shock 70 families, has been closely linked to mitochondrial sensitivity to stress in degenerative neurons. It is known to sense oxidative stress and activate antioxidant pathways, thereby conferring resistance against oxidative stress-induced apoptosis. In our study, we observed the regulation of HSPA9 through acetylation in the oxidative cell line.
In the same way, we observed increased acetylation of HSP90AB1, another cytosolic chaperone protein. It has been described that acetylation resulted in the inactivation of HSP90 and played a significant role in destabilizing its client proteins, which are crucial for cell growth and survival [
37,
38]. Moreover, our study shows that inhibiting SIRT3 in the oxidative cell line affected some regulatory factors, such as Runx3. The stability of Runx3 has been associated with specific acetylation sites and the role of this modification in preventing ubiquitination and their degradation [
39]. That suggests a protective role of acetylation.
Notably, N-Acetyltransferase 10 (NAT10), the only nuclear protein with lysine acetyltransferase activity, increased acetylation status after the treatment in the glycolytic cell line. This protein has been related to the cell cycle and promotes tumor metastasis[
40]. Interestingly, the auto-acetylation of NAT10 at K426 is required to activate rRNA transcription[
41]. This is another example of how inhibition of SIRT3 impacts RNA metabolism in our cell lines.
An important observation from our study is the decrease in acetylation levels of certain glycolytic enzymes in the glycolytic cell line following the inhibition of SIRT3. One such enzyme is phosphoglycerate kinase 1 (PGK1), which plays a crucial role in glycolysis by catalyzing the reversible conversion of 1,3-bisphosphoglycerate to 3-phosphoglycerate. The acetylation of PGK1 at the K323 site has been associated with enhanced enzymatic activity, carcinogenic effect, and increased glycolysis[
42]. Another enzyme that exhibited decreased acetylation was phosphoglycerate mutase 1 (PGAM), a key glycolysis enzyme. The deacetylation of PGAM reduces its enzymatic activity and hampers the glycolysis process[
43]. These findings highlight the critical role of acetylation in regulating the activity of glycolytic enzymes.
3. Materials and Methods
Cell Culture
Human glioblastoma cell lines, T98G and U87MG were cultured in Eagle's Minimum Essential Medium (EMEM) (from GIBCO) supplemented with 10% fetal bovine serum and 1% penicillin-streptomycin in 175 cm2 sterile culture dishes at 37°C and 5% C02 atmosphere. The medium was changed regularly, and cells were allowed to reach 80% confluence until SIRT3 inhibition treatment and protein extraction.
SIRT3 Selective Inhibition Treatment with a 3-TYP Reagent
All the experiments were carried out in triplicate. In each iteration, six 175 cm2 culture dishes of every cell line at 80% confluence were treated with the 3-TYP (3-(1H-1,2,3-triazol-4-yl) pyridine) reagent (from Selleck Chem) at a final concentration of 20 µM in EMEM medium without fetal bovine serum. This treatment was maintained for 24 hours for subsequent protein extraction from either mitochondrial or total cellular fractions. Concurrently, six 175 cm2 culture dishes for each cell line, also maintained at 80% confluence, were subjected to the same conditions but without of applying the 3-TYP reagent, serving as the control sample.
Mitochondrial Purification
To obtain a replicate of the mitochondrial fraction, six million cells from each cell line and condition were homogenized using a glass homogenizer in HEPES solution (20 mM Hepes, 2 mM EGTA, 250 mM sucrose, and 0.5 % albumin; pH 7.4). The lysates were centrifuged at 1,500 xg/ 20 min / 4°C, and the supernatant was collected. This process was repeated three more times, with the supernatants being combined at each step. The resulting mixture was then centrifuged at 15,600 xg/ 50 minutes/ 4°C.The precipitate obtained was suspended in a mannitol buffer (120 mM mannitol, 70 mM sucrose, 5 mM EDTA, and 5 mM Tris-HCl), which was placed on top of a centrifuge tube containing a sucrose gradient (1.7 M sucrose, 1M sucrose). The sucrose gradient tube was centrifuged in a swinging rotor at 40,000 xg / 60 minutes / 4°C. The lower white line contained the mitochondrial phase, which was carefully collected with a micropipette, dissolved in mannitol buffer, and centrifuged at 18,000 xg/ 40 minutes/ 4° C. The button was homogenized with SDS solution following the procedure in protein extraction section.
Chemical Acetylation with Deuterated N-acetoxysuccinimide (NAS-d3)
After obtaining mitochondria extracts and total cellular proteins, we followed the lysine acetylation stoichiometry analysis methodology developed by Jeovanis Gil et al. without any modifications [
15]. We applied the in-solution sample preparation procedure as described (SSP).
The protein extracts were incubated at 95 °C for five minutes to reduce the disulfide bridges completely. Iodoacetamide (IAA) was added at a final concentration of 0.1 M, incubated in the dark for 30 minutes, and centrifuged at 1,500 xg / five minutes. The supernatant was collected and quantified in an SDS-PAGE. 100 µg of each sample was suspended in Triethylammonium bicarbonate (TEAB) solution (100 mM TEAB, 1% SDS, and 0.5% sodium deoxycholate (SDC)). SDS and SDC in this methodology were essential to avoid protein precipitation. Proteins were precipitated with nine volumes of cold ethanol and incubated overnight at -20 °C, and samples were suspended in 200 µl TEAB.
NAS-d3 alkylating reagent that contains stable heavy isotopes was added to each extract at a ratio of 100:1 (reagent: number of amino groups) and incubated for one hour at room temperature. This reagent is a deuterated derivate of N-hydroxysuccinimide (NHS) and acetylates free lysine residues. Proteins suffer fewer collateral reactions than other reagents in residues, such as tyrosine, threonine, and serine.
Then, hydroxylamine was added at a concentration of 5% and incubated for 20 minutes at room temperature. Immediately after that, proteins were precipitated with ethanol and suspended in digestion buffer (50 mM albumin; pH 7.5-8, 0.5 % SDC). Trypsin was added at a ratio of 1:50 and incubated at 37 °C/16 hours. The SDC was eliminated through an ethyl acetate extraction process in an acidic environment. One volume of ethyl acetate was added to the sample and acidified with 0.5% trifluoroacetic acid (TFA). Following thorough vortexing and centrifugation, the organic phase was removed. Another round of ethyl acetate, excluding TFA, was conducted. Lastly, the peptide mixture underwent drying using a SPEED VAC.
The acetylation stoichiometry of all proteins was obtained by mass spectrometry thanks to the distinction in the spectrum of endogenously acetylated proteins and those chemically acetylated with the heaviest reagent.
LC-MS/MS and Data Analysis
We used a mass spectrometry-based proteomics strategy to describe the protein expression and mapped acetylation sites[
15].
Liquid chromatography-tandem mass spectrometry (LC-MS/MS) analysis was performed on a Dionex Ultimate 3000 RSLC nano UPLC system coupled in line with a Thermo Fisher Scientific Q-Exactive high-resolution mass spectrometer. The identification and relative quantification analysis of peptides and proteins were performed with the Max Quant v1.5.3.30 program. The same data generated from LC-MS/MS analysis was used to determine the acetylation stoichiometry using the Pview program.
The mass spectrometry proteomics data were submitted to the ProteomeXchange Consortium via the PRIDE[
44] partner repository using the data set identifier PXD045197.
Statistical analysis was done with Perseus v1.6.15.0 software [
45]. We corrected the intensity data based on the log2 transformation, then the average abundance for each protein was subtracted from the log2 transformation from the individual values. Proteins with less than two valid values were filtered out. The corrected data was used to compare the relative quantification of proteins in the three replicates and their controls using the two-sample T-test statistical analysis. We obtained relative quantitative information from 6158 proteins. Filtering based on 100% valid values, we performed the principal component analysis (PCA). Functional enrichment analysis of differentially abundant proteins between treated and control samples was performed using Metascape online resource[
46], Gene Ontology resource v14[
47], and ToppGene Suite [
48]. The Reactome pathways, KEGG pathways, and GO Biological Processes were used to do the enrichment analysis. The 2D functional annotation enrichment analysis was done using the default parameters with Perseus.
The proteins with acetylation sites with more than 0.2% difference in site occupancy between treated and control samples were submitted to a functional annotation enrichment analysis with Metascape and Cytoscape. The results were plotted with GraphPad Prism v8.0.1 program and RStudio software v R4.2.0.
4. Conclusions
In this study, we have demonstrated that the effects of SIRT3 inhibition on protein acetylation are diverse and influenced by the cell's metabolic characteristics. While no significant differences were observed in SIRT3 expression, measuring enzymatic activity would be essential, as cell lines respond differently to the inhibition of this enzyme. The inhibition of SIRT3 appears to enhance the glycolytic phenotype in the U87 cell line, leading to the generation of lactate levels. This lactate, acting as an HDAC inhibitor, resulted in increased protein acetylation not only in mitochondria but also in other cellular compartments.
Our findings suggest that SIRT3 primarily regulates assembly and production processes in the cell lines under investigation. These processes include chaperones, transcription factors, and ribosomal proteins, which are crucially regulated by acetylation. Further exploration is needed to understand these processes and establish their direct relationship with cellular metabolism. Interestingly, despite the distinct metabolic profiles of the cell lines, protein acetylation regulation is centered around similar processes in both. Although SIRT3 targets differ depending on the cell line, the overall processes regulated by this enzyme remain consistent. Notably, the inhibition of SIRT3 primarily induces the overexpression of mitochondrial proteins, irrespective of the cell's metabolic characteristics. This reinforces the involvement of SIRT3 in mitochondrial processes, even in cells with oxidative or glycolytic metabolism.
The significance of acetylation regulation in determining specific metabolic pathways lies in the acetylation of proteins involved in protein production, such as mitochondrial and cytoplasmic ribosomes. Although the exact implications of acetylation on these components still need to be well-described, their importance in cellular metabolism is evident.
Our study benefited from the high specificity of mass spectrometry and the acetylation stoichiometry technique, enabling us to visualize previously overlooked protein acetylation differences that are relevant to cellular metabolism. These results provide a deeper understanding and underscore the significant role of acetylation in protein production, highlighting how cellular metabolism is influenced from the early stages of protein synthesis. Although SIRT3 does not directly regulate these proteins, the impact of its inhibition extends to various cytoplasmic cellular processes.
Author Contributions
D.L. F.-C. designed and performed experiments analyzed data, performed bioinformatics analysis, and drafted the first and final manuscripts. G. A. designed experiments, analyzed results, and drafted the final manuscripts. J. G. conceived the study, designed and performed experiments and bioinformatics analysis, analyzed data, and wrote the manuscript. S. E. -G. conceived the study, designed experiments, analyzed results, got financial support to develop the study, and drafted the final manuscripts. All authors approved the final version of the manuscript.
Funding
The Programa de Apoyo a Proyectos de Investigación e Innovación Tecnológica (PAPIIT-UNAM) supported part of this work, granting IN-213522 to SE-G.
Data Availability Statement
The mass spectrometry proteomics data are available to the ProteomeXchange Consortium via the PRIDE partner repository with the data set identifier PXD045197. Any additional requests can be directed to the corresponding author.
Acknowledgments
Dr. Diana Lashidua Fernández Coto thanks the “Programa de Estancias Posdoctorales por México” of the “Consejo Nacional de Ciencia y Tecnología” (CONAHCYT) for the support received.
Conflicts of Interest
The authors declare no competing interests.
Appendix A
1.- Oximetry (Contribution of OXPHOS to ATP consumption)
An YSI model 5360 oxygen meter with a chamber volume of 1.9 mL was utilized. The cell pellet was resuspended in Krebs Ringer buffer (125 mM NaCl, 5 mM KCl, 1 mM MgCl2, 1.4 mM CaCl2, 1 mM KH2PO4, 25 mM HEPES, pH 7.4), centrifuged at 1,500 rpm for 5 minutes and the supernatant was removed. This process was repeated three times to completely remove any residual medium. The final cell pellet was resuspended in 1 mL of Krebs medium and quantified.
The chamber was brought to a volume of 1.9 mL with Krebs medium previously incubated at 37°C with constant bubbling. The chamber was calibrated to 100% oxygen, and 4 mg of cells were added.
The recording was allowed to run until a constant slope was observed. Then, 5 µM oligomycin was added until a constant slope was reached. Subsequently, 1 mM CN was added until a constant slope was achieved. Finally, a small amount of dithionite was added to completely reduce any remaining oxygen, thus concluding the tracing. Calculation of the ng O2/min/mg was performed.
Figure A1.
Oxygen consumption measurements were conducted in triplicate, and a t-test was performed to assess statistical significance (t=5.33; p=0.033).
Figure A1.
Oxygen consumption measurements were conducted in triplicate, and a t-test was performed to assess statistical significance (t=5.33; p=0.033).
2.- Lactate measurement (Contribution of glycolysis to ATP consumption)
The cell pellet was resuspended in Krebs Ringer buffer (125 mM NaCl, 5 mM KCl, 1 mM MgCl2, 1.4 mM CaCl2, 1 mM KH2PO4, 25 mM HEPES, pH 7.4), then centrifuged at 1,500 rpm for 5 minutes, and the supernatant was removed. This process was repeated three times to completely remove any residual medium. The final cell pellet was resuspended in 1 mL of Krebs medium and quantified. 4 mg of cells was taken and brought to a final volume of 2 mL with Krebs medium. This mixture was incubated under agitation at 150 rpm and 37°C for 10 minutes.
Two labeled tubes were prepared, one marked as "time 0" and the other as "time 10". To both tubes, 50 µL of PCA was added. After the initial 10 minutes of agitation, 500 µL of cells were taken and placed in the tube labeled as "time 0". To the remaining cells under agitation, 37.5 µL of glucose (200 mM) was added, and incubation was continued for an additional 10 minutes.
At the end of the last 10-minute period, 500 µL of cells were taken and placed in the tube labeled as "time 10". Both tubes were agitated and allowed to rest for 15-30 minutes at 4°C. Then, they were centrifuged at 2,500 rpm for 5 minutes. The supernatant was transferred to labeled tubes containing 50 µL of Kodak indicator. To this, 60 µL of a 3M KOH solution with 0.1M Tris was added and mixed. Finally, 5 µL increments of this last solution were added until the color turned milky white. The samples were stored at -70°C for subsequent lactate measurement by spectrophotometry.
As the LDH enzyme contains lactate that maintains it undenatured, this lactate had to be completely consumed to avoid interference with the measurements. For this purpose, 20 µL of NAD+ (100 mM), 40 µL of LDH, and 1890 µL of hydrazine lysine medium were placed in 2 mL quartz cells. One cell was used for each sample. The cells were inserted into a diode array computerized spectrophotometer (Agilent 8453) calibrated at 340 nm. The spectrophotometer measured absorbance every 3 seconds, which was plotted in real time. Once the lactate in the LDH solution was fully consumed, the absorbances remained constant, and a consistent slope was observed. At this point, 50 µL of previously thawed samples were added at room temperature and centrifuged at 10,000 rpm for 2 minutes.
The absorbance reading continued every 3 seconds until the lactate in the samples was completely consumed. The absorbance deltas (Δ) were calculated, along with the nmol/min/mg of glucose consumed by each sample.
Figure A2.
Lactate production measurements were conducted in triplicate, and a t-test was performed to assess statistical significance (t=4.35; p=0.012).
Figure A2.
Lactate production measurements were conducted in triplicate, and a t-test was performed to assess statistical significance (t=4.35; p=0.012).
References
- Francisco S (2016) Epidemiology 1. 134:. [CrossRef]
- Wilson TA, Karajannis MA, Harter DH (2014) Glioblastoma multiforme: State of the art and future therapeutics. Surg Neurol Int 5:. [CrossRef]
- Pet F Cover image: Primary diagnosis of a right frontal glioblastoma following acquisition of axial slices of T1-weighted gadolinium-enhanced MRI (left) and 18F-FDG PET (right). See page 158, chapter 9 for details.
- Duraj T, García-romero N, Carrión-navarro J, et al (2021) Beyond the warburg effect: Oxidative and glycolytic phenotypes coexist within the metabolic heterogeneity of glioblastoma. Cells 10:1–23. [CrossRef]
- Vlashi E, Lagadec C, Vergnes L, et al (2011) Metabolic state of glioma stem cells and nontumorigenic cells. Proc Natl Acad Sci U S A 108:16062–16067. [CrossRef]
- Shibao S, Minami N, Koike N, et al (2018) Metabolic heterogeneity and plasticity of glioma stem cells in a mouse glioblastoma model. Neuro Oncol 20:343–354. [CrossRef]
- Ramão A, Gimenez M, Laure HJ, et al (2012) Changes in the expression of proteins associated with aerobic glycolysis and cell migration are involved in tumorigenic ability of two glioma cell lines. Proteome Sci 10:53. [CrossRef]
- Wang Q, Zhang Y, Yang C, et al (2010) Acetylation of metabolic enzymes coordinates carbon source utilization and metabolic flux. Science (80- ) 327:1004–1007. [CrossRef]
- Arenas A, Chen J, Kuang L, et al (2020) Lysine acetylation regulates the RNA binding, subcellular localization and inclusion formation of FUS. Hum Mol Genet 29:2684–2697. [CrossRef]
- Fujita Y, Fujiwara K, Zenitani S, Yamashita T (2015) Acetylation of NDPK-D regulates its subcellular localization and cell survival. PLoS One 10:1–18. [CrossRef]
- Song EH, Oh W, Ulu A, et al (2015) Acetylation of the RhoA GEF Net1A controls its subcellular localization and activity. J Cell Sci 128:913–922. [CrossRef]
- Rardin MJ, Newman JC, Held JM, et al (2013) Label-free quantitative proteomics of the lysine acetylome in mitochondria identifies substrates of SIRT3 in metabolic pathways. Proc Natl Acad Sci U S A 110:6601–6606. [CrossRef]
- Gil J, Rezeli M, Lutz EG, et al (2021) An observational study on the molecular profiling of primary melanomas reveals a progression dependence on mitochondrial activation. Cancers (Basel) 13:. [CrossRef]
- Gil J, Betancourt LH, Pla I, et al (2019) Clinical protein science in translational medicine targeting malignant melanoma. Cell Biol Toxicol 35:293–332. [CrossRef]
- Gil J, Ramírez-Torres A, Chiappe D, et al (2017) Lysine acetylation stoichiometry and proteomics analyses reveal pathways regulated by sirtuin 1 in human cells. J Biol Chem 292:18129–18144. [CrossRef]
- Kuras M, Woldmar N, Kim Y, et al (2021) Proteomic Workflows for High-Quality Quantitative Proteome and Post-Translational Modification Analysis of Clinically Relevant Samples from Formalin-Fixed Paraffin-Embedded Archives. J Proteome Res 20:1027–1039. [CrossRef]
- Betancourt LH, Gil J, Sanchez A, et al (2021) The Human Melanoma Proteome Atlas-Complementing the melanoma transcriptome. Clin Transl Med 11:. [CrossRef]
- Elwell CE, Leung TS, Editors DKH Oxygen Transport to Tissue XXXVII.
- Uhlén M, Fagerberg L, Hallström BM, et al (2015) Tissue-based map of the human proteome. Science (80- ) 347:. [CrossRef]
- Cerchia L, Esposito CL, Jacobs AH, et al (2009) Differential SELEX in human glioma cell lines. PLoS One 4:e7971. [CrossRef]
- Choudhary C, Kumar C, Gnad F, et al (2009) Lysine acetylation targets protein complexes and co-regulated major cellular functions. Science (80- ) 325:834–840. [CrossRef]
- Allfrey VG, Faulkner R, Mirsky AE (1964) Acetylation and methylation of histones and their possible role in the regulation of RNA synthesis. Proc Natl Acad Sci U S A 51:786–794. [CrossRef]
- Access O (2021) immunosuppression in glioblastoma. 1111–1124. [CrossRef]
- Song H, Li C, Labaff AM, et al (2012) NIH Public Access. [CrossRef]
- Li P, Ge J, Li H Lysine acetyltransferases and lysine deacetylases as targets for cardiovascular disease. Nat Rev Cardiol 1:. [CrossRef]
- Manuscript A (2011) NIH Public Access. 22:263–268. [CrossRef]
- Kong F, Ma L, Wang X, et al (2022) Regulation of epithelial - mesenchymal transition by protein lysine acetylation. Cell Commun Signal 1–14. [CrossRef]
- Bradley RK, Anczuków O (2023) RNA splicing dysregulation and the hallmarks of cancer. Nat Rev Cancer 23:135–155. [CrossRef]
- Zhang J, Xiang H, Liu J, et al (2020) Mitochondrial Sirtuin 3: New emerging biological function and therapeutic target. Theranostics 10:8315–8342. [CrossRef]
- Zeng Z, Yang Y, Dai X, et al (2016) Polydatin ameliorates injury to the small intestine induced by hemorrhagic shock via SIRT3 activation-mediated mitochondrial protection. Expert Opin Ther Targets 20:645–652. [CrossRef]
- Alhazzazi TY, Kamarajan P, Verdin E, Kapila YL (2011) SIRT3 and cancer: Tumor promoter or suppressor? Biochim Biophys Acta - Rev Cancer 1816:80–88. [CrossRef]
- Wei Z, Song J, Wang G, et al Deacetylation of serine hydroxymethyl-transferase 2 by SIRT3 promotes colorectal carcinogenesis. Nat Commun. [CrossRef]
- Alhazzazi TY, Kamarajan P, Joo N, Huang J (2011) Sirtuin-3 ( SIRT3 ), a Novel Potential Therapeutic Target for Oral Cancer. 3:1670–1678. [CrossRef]
- Kim HS, Patel K, Muldoon-Jacobs K, et al (2010) SIRT3 Is a Mitochondria-Localized Tumor Suppressor Required for Maintenance of Mitochondrial Integrity and Metabolism during Stress. Cancer Cell 17:41–52. [CrossRef]
- Srivastava SP, Li J, Kitada M, et al (2018) SIRT3 de fi ciency leads to induction of abnormal glycolysis in diabetic kidney with fi brosis. [CrossRef]
- Yang Y, Cimen H, Han MJ, et al (2010) NAD+-dependent deacetylase SIRT3 regulates mitochondrial protein synthesis by deacetylation of the ribosomal protein MRPL10. J Biol Chem 285:7417–7429. [CrossRef]
- Haase M, Fitze G, Haase M, Fitze G (2015) HSP90AB1: Helping the good and the bad. Gene. [CrossRef]
- Lu Q, Guo P, Li H, et al (2022) Ecotoxicology and Environmental Safety Targeting the lncMST-EPRS / HSP90AB1 complex as novel therapeutic strategy for T-2 toxin-induced growth retardation. Ecotoxicol Environ Saf 247:114243. [CrossRef]
- Boyault C, Khochbin S (2005) Regulatory cross-talk between lysine acetylation and ubiquitination : role in the control of protein stability. 408–415. [CrossRef]
- Pan Z, Bao Y, Hu M, et al (2023) Role of NAT10-mediated ac4C-modi fi ed HSP90AA1 RNA acetylation in ER stress-mediated metastasis and lenvatinib resistance in hepatocellular carcinoma. 1–14. [CrossRef]
- Cai S, Liu X, Zhang C, et al (2016) Biochemical and Biophysical Research Communications Autoacetylation of NAT10 is critical for its function in rRNA transcription activation. Biochem Biophys Res Commun 1–6. [CrossRef]
- Li J, Wang T, Xia J, et al (2019) Enzymatic and nonenzymatic protein acetylations control glycolysis process in liver diseases. 1–15. [CrossRef]
- Tao Y, Yin H, Zhou L, et al This article has been accepted for publication and undergone full peer review but has not been through the copyediting , typesetting , pagination and proofreading process which may lead to differences between this version and the Version of Record . Pleas.
- Perez-Riverol Y, Bai J, Bandla C, et al (2022) The PRIDE database resources in 2022: A hub for mass spectrometry-based proteomics evidences. Nucleic Acids Res 50:D543–D552. [CrossRef]
- Tyanova S, Temu T, Sinitcyn P, et al (2016) The Perseus computational platform for comprehensive analysis of (prote)omics data. Nat. Methods 13:731–740. [CrossRef]
- Zhou Y, Zhou B, Pache L, et al (2019) Metascape provides a biologist-oriented resource for the analysis of systems-level datasets. Nat Commun 10:. [CrossRef]
- Mi H, Muruganujan A, Ebert D, et al (2019) PANTHER version 14: More genomes, a new PANTHER GO-slim and improvements in enrichment analysis tools. Nucleic Acids Res 47:D419–D426. [CrossRef]
- Raj RM, Sreeja A (2018) Analysis of computational gene prioritization approaches. Procedia Comput Sci 143:395–410. [CrossRef]
|
Disclaimer/Publisher’s Note: The statements, opinions and data contained in all publications are solely those of the individual author(s) and contributor(s) and not of MDPI and/or the editor(s). MDPI and/or the editor(s) disclaim responsibility for any injury to people or property resulting from any ideas, methods, instructions or products referred to in the content. |
© 2024 by the authors. Licensee MDPI, Basel, Switzerland. This article is an open access article distributed under the terms and conditions of the Creative Commons Attribution (CC BY) license (http://creativecommons.org/licenses/by/4.0/).
