1. Introduction
Electrochemical sensors (ES), as the name implies, are sensors that convert chemical data into electric signals. Because they are low-cost, can be highly sensitive, easy to use, can be integrated into a wide range of other devices like microfluidic devices, wearable sensors, point-of-care (POC) and lab-on-a-a-chip (LOC) devices, they are the market leader of the sensor sector.[
1]
The sensing capabilities of an electrochemical sensor can be enhanced by the material that represents the sensing area. In recent years, vertical graphene (VG), as a newly developed 3D carbonic nanomaterial, is experimented in the design and development of a new class of electrochemical sensors[
2]. Due to its excellent mechanical and electrical properties and because it has a high surface area it is an ideal material for electrochemical sensors. Roy et al. developed an ultrasensitive gas sensor based on vertical graphene.[
3] Wang et al. designed an vertical graphene-based microneedle sensor for in-situ determination of abscisic acid in plants.[
4] Moreover, VG can be functionalized with a wide range of biomolecules transforming the ES into biosensors that can be used for biomedical applications. [
5] Li et al. developed a vertical graphene-based electrochemical biosensor capable of detecting different biomarkers for Alzheimer’s disease diagnosis.[
6] Liu et al. also developed a vertical graphene based ES for the detection of Tau protein in blood samples from patients with Alzheimer’s disease.[
7]
Electrochemical biosensors have also been used in cancer research, especially in tumour biomarker detection[
8,
9], circulating tumour cells (CTCs) detection[
10] and for pharmacodynamics studies regarding different anti-tumour treatment protocols and for point-of-care drug efficiency monitoring[
11,
12,
13]. Different types of electrochemical sensors have been developed for body fluids monitoring of anticancer drugs.[
14,
15] Because in high concentrations chemotherapy drugs have cytotoxic side-effects, combinations of multiple chemotherapeutic agents with lower concentrations have been used. One such combination is the use of bleomycin, etoposide and cisplatin in various ways against cancers like lung cancer, leukaemia, Hodgkin's disease, non-Hodgkin lymphoma, testicular cancer, ovarian cancer, lymphomas, and different childhood malignancies. Because the mechanism through which these three drugs affect the DNA of targeted cells is not fully understood, electrochemical sensors based on graphene nanowalls, graphene quantum dots and carbon quantum dots have been developed to monitor and to better understand the pharmacodynamics properties of these drugs.[
16,
17,
18,
19,
20] However, further studies are required to help scientists design new anti-tumour drugs. By including 3D carbonic nanomaterials like vertical graphene into the design of the electrodes, their sensing capabilities could be improved.
Bleomycin (BLE) shows significant antitumor activity against squamous cell tumours, lymphomas and testicular tumours [
21]. BLE is a glycopeptide antibiotic with a unique mechanism of anti-tumour activity. It binds to guanosine-cytosine-rich areas of DNA through the association of structural tripeptide and partial intercalation of dithiazole rings. The group of five nitrogen atoms arranged in a square pyramidal conformation can bind divalent metals, especially iron, the active ligand, or copper, an inactive ligand. It most often uses iron because of its high abundance at the cellular level. Molecular oxygen, bound to iron, can produce highly reactive free radicals and Fe+3. Free radicals cause DNA breaks at the 3'-4' bond in deoxyribose. When sufficient DNA damage occurs, the tumour cell dies. Once in the cell, BLE is either translocated to the nucleus or broken down by bleomycin hydrolase, an enzyme found in both normal and malignant cells, but in lower concentrations in the lungs and skin. The high toxicity of the compound observed in the lung (10% of patients have lung damage leading to pulmonary fibrosis [
22]) and skin (hyperpigmenorrhoea, hyperkeratosis, erythema, ulceration) is thought to be the result of a lack of hydrolase activity in these regions. In humans, BLE is rapidly eliminated primarily by renal excretion. In patients with renal disease or previous extensive CIS therapy, plasma half-life may extend from 2 to 4 hours to 21 hours, leading to serious renal dysfunction [
23].
Apart from the well-known adverse reactions to antineoplastic drugs, the most important side effect of the three target drugs is myelosuppression followed by infection or haemorrhage. Due to major myelosuppression, there is a risk of secondary leukaemia. In the case of ETO, prior or concomitant use of other drugs with similar myelosuppressive action may result in additive or synergistic effects. CIS has a particular impact on haematopoiesis, with myelosuppression present in 25-30% of patients. BLE has the advantage of producing mild myelosuppression except in cases with compromised bone marrow function. There are recent studies that have attempted to correlate plasma concentrations of TEE with toxicity, in the hope of using this information to optimize drug dosing [
23]. Antineoplastic dose should also be adjusted taking into account the myelosuppressive effects of other associated drugs, or the effects of previous radiotherapy or chemotherapy that may compromise marrow reserves. Importantly, a common feature of ETO and BLE is their mutagenic and teratogenic effects [
24].
This study is part of an extended study of antineoplastic quantitative detection of three therapeutic molecules: etoposide, cisplatin, and bleomycin, to minimize adverse effects and maximize therapeutic effect. We are presenting the results for bleomycin detection, in terms of cyclic voltammetry and electrochemical impedance spectroscopy for two types of electrochemical sensors: (i) with gold (Au) and with vertical graphene (VG) interdigitated electrodes (IDE). We are continuing an approach we have recently started, of an electrochemical biosensor based on vertical graphene (or Graphene Nanowalls), which is evidenced to be a revolutionary nanomaterial. The vertical graphene, acting as an active layer for the analyte of interest, demonstrated enhanced sensitivity, selectivity, minimal interference with biological matrices and prolonged stability. The electrochemical sensor was fabricated by growing vertically aligned graphene nanosheets on the conductive surface (Au) of interdigitated electrodes, and vertical graphene was decorated with gold nanoparticles (AuNPs) [
25].
2. Materials and Methods
2.1. Materials and Instruments
AuNPs were obtained by chemical reduction method of chloroauric acid (HAuCl4 · 4H2O, ≥ 99.9%, Sigma Aldrich, USA) with sodium citrate (C6H5O7Na3 · 2H2O, Sigma-Aldrich, USA), 3-aminopropyltriethoxysilane solution (APTES), phosphate-buffered saline (PBS), and bovine serum albumin (BSA) were purchased from Sigma-Aldrich, SUA, and Sigma-Aldrich, Auckland, New Zealand, respectively. Bleomycin sulphate was purchased from Sigma-Aldrich, Schnelldorf, Germany. The DNA sequence (5'–T/Spacer C12/G AGA GAG AGG GGG GGG AAA AAA AAA AAAAAA ACC CCC CCC TCT CTC TCAAAA–3' (53 pb)) was custom made by Biolegio B.V., Nijmegen, The Netherlands.
Scanning electron microscopy (SEM) was used for the morphological characterization of the working interdigitated electrodes modified with VG (vertical graphene). The surface morphology was evaluated with Nova NanoSEM 630 (FEI Company, Hillsboro, OR, USA).
Electrochemical measurements were performed with Autolab PGSTAT204 with an FRA32M electrochemical impedance spectroscopy (EIS) module (METROHM AUTOLAB AG., Utrecht, The Netherlands) with AC amplitude 0.01 V.
2.2. Experimental Procedures
2.2.1. Fabrication of Interdigitated Electrodes Modified with Vertical Graphene
The technological flow for the fabrication of the electrochemical sensor with IDE modified with vertical graphene is presented in our previous work [
25]. The main steps of the flow consisted of: (1) Si wafer cleaning in Piranha solution, (2) mask photolithography used for patterning the metallic layer configuration by the Lift-off process, (3) 50nm titanium nitride layer (TiN) deposition for diffusion barrier by RF magnetron sputtering, (4) 10 nm chromium (Cr) and 200 nm gold (Au) deposition by e-beam evaporation, (5) Lift-off process by dissolving the photoresist in acetone, (6) VG growth via plasma-enhanced chemical vapor deposition (PECVD), (7) mask photolithography for the configuration of VG/interdigitated electrodes, (8) VG etching; (9) photoresist removal; (10) mask photolithography for the deposition of the counter electrode; (11) Ag deposition, (12) final VG biosensor (
Figure 1b). For the fabrication of bare Au IDE electrochemical sensor (
Figure 1a) we have used only steps: 1, 2, 4, 5 and 11.
2.2.2. Reference Electrode Preparation
The silver reference electrode was subjected to electrochemical chlorination using an Autolab PGSTAT204 potentiostat. The process consisted of using the potentiometric stripping analysis (PSA) option with a constant current of 10 mA for 0.5 s, and placing a drop of 0.1 M HCl solution onto the electrodes. When the process concluded, a visual confirmation was obtained (wetted area darkening), stating the silver chloride (AgCl) formation.
2.2.3. Functionalization of the Electrochemical Biosensor
2.2.3.1. Gold IDE
10 µl of thiolated DNA sequence was applied to the active area of the electrochemical gold sensor and incubated in a humid atmosphere for 1 hour at room temperature. Subsequently, any potentially remaining active sites of gold were blocked with BSA (1%, in PBS). The modified sensors were then tested by applying 10 µl of bleomycin (10 mM) to the active area of the sensors under the same conditions
2.2.3.2. Vertical graphene-based IDE
Gold nanoparticles (AuNPs) were synthesized using a previously reported method [
25] employing 0.3 mM HAuCl
4 as a metal precursor and 1% sodium citrate as a reducing agent. To bind the thiolated DNA sequence on VG-based sensors, we decorated the carbonic nanomaterial with AuNPs (approximately 30 nm) through electrostatic interaction between the negative charge of nanoparticles and the positive amino group from the APTES structure. Consequently, VG-based electrochemical sensors were immersed in a 10% APTES solution for 30 minutes, and afterward, the sensors were washed and dried in an oven for 10 minutes at 120 ◦C to prevent APTES elution. Subsequently, the modified VG-based sensors were directly immersed in the AuNPs' colloidal solution for 18 hours. The immobilization of the thiolated DNA sequence on AuNPs was mediated by the thiol group from the DNA sequence. 1% BSA solution was applied for 1 hour to minimize nonspecific adsorption. Testing involved the application of 10 µl of bleomycin (10 mM) for 1 hour on the active area of sensors. All stages of the functionalization of VG-based electrochemical sensors were conducted at room temperature (25 °C) and washed with PBS (pH 7.4).
2.2.4. Morphological Characterization
The morphological characterization of the VG working electrodes was performed to observe the surface of working electrode, and also the size, distribution and coverage of the gold nanoparticles attached to the surface of the electrode. This characterization was carried out by Scanning electron microscopy (SEM) using the Nova NanoSEM 630 Scanning Electron Microscope (FEI Company, Hillsboro, OR, USA) using an accelerating voltage of 10kx.
2.2.5. Spectrometric Characterization
The spectrometric characterization of the VG working electrodes was carried out to observe modification on the surface of the working electrodes with BLE. Raman spectra were achieved on the Witech Raman spectrometer (Alpha-SNOM 300 S, WiTech. GmbH, Kroppach, Germany) with back-scattering collection. It was employed an excitation radiation at 532 nm from a Nd-YAG laser with power of 10 mW, by 600 grooves/mm grating and 20 s acquisition time. The spectra were collected by WiTech Project Five software and processing (pick identification) with Origin 8.5 software.
2.2.6. Electrochemical Characterization
As part of the characterization of the working electrodes, cyclic voltammetry and impedance spectroscopy (EIS) techniques were used to study the degree of modification of the electrode surface. A CV study was performed using a PBS solution containing 1 mM [Fe(CN)6]3-/4- and 0.1 M KCl, where a 15 μL drop from the solution was placed on the electrodes and a CV scan was then performed with a potential window from −0.4 to 0.4 V at a scan rate of 100 mV/s. For the EIS study, a drop of PBS solution containing 1 mM [Fe(CN)6]3-/4- and 0.1 M KCl was placed and analysed using a range of frequencies starting from 1 MHz to 0.1 Hz.
3. Results
3.1. Electrochemical Sensor Fabrication Process
3.2. Morphological Characterization
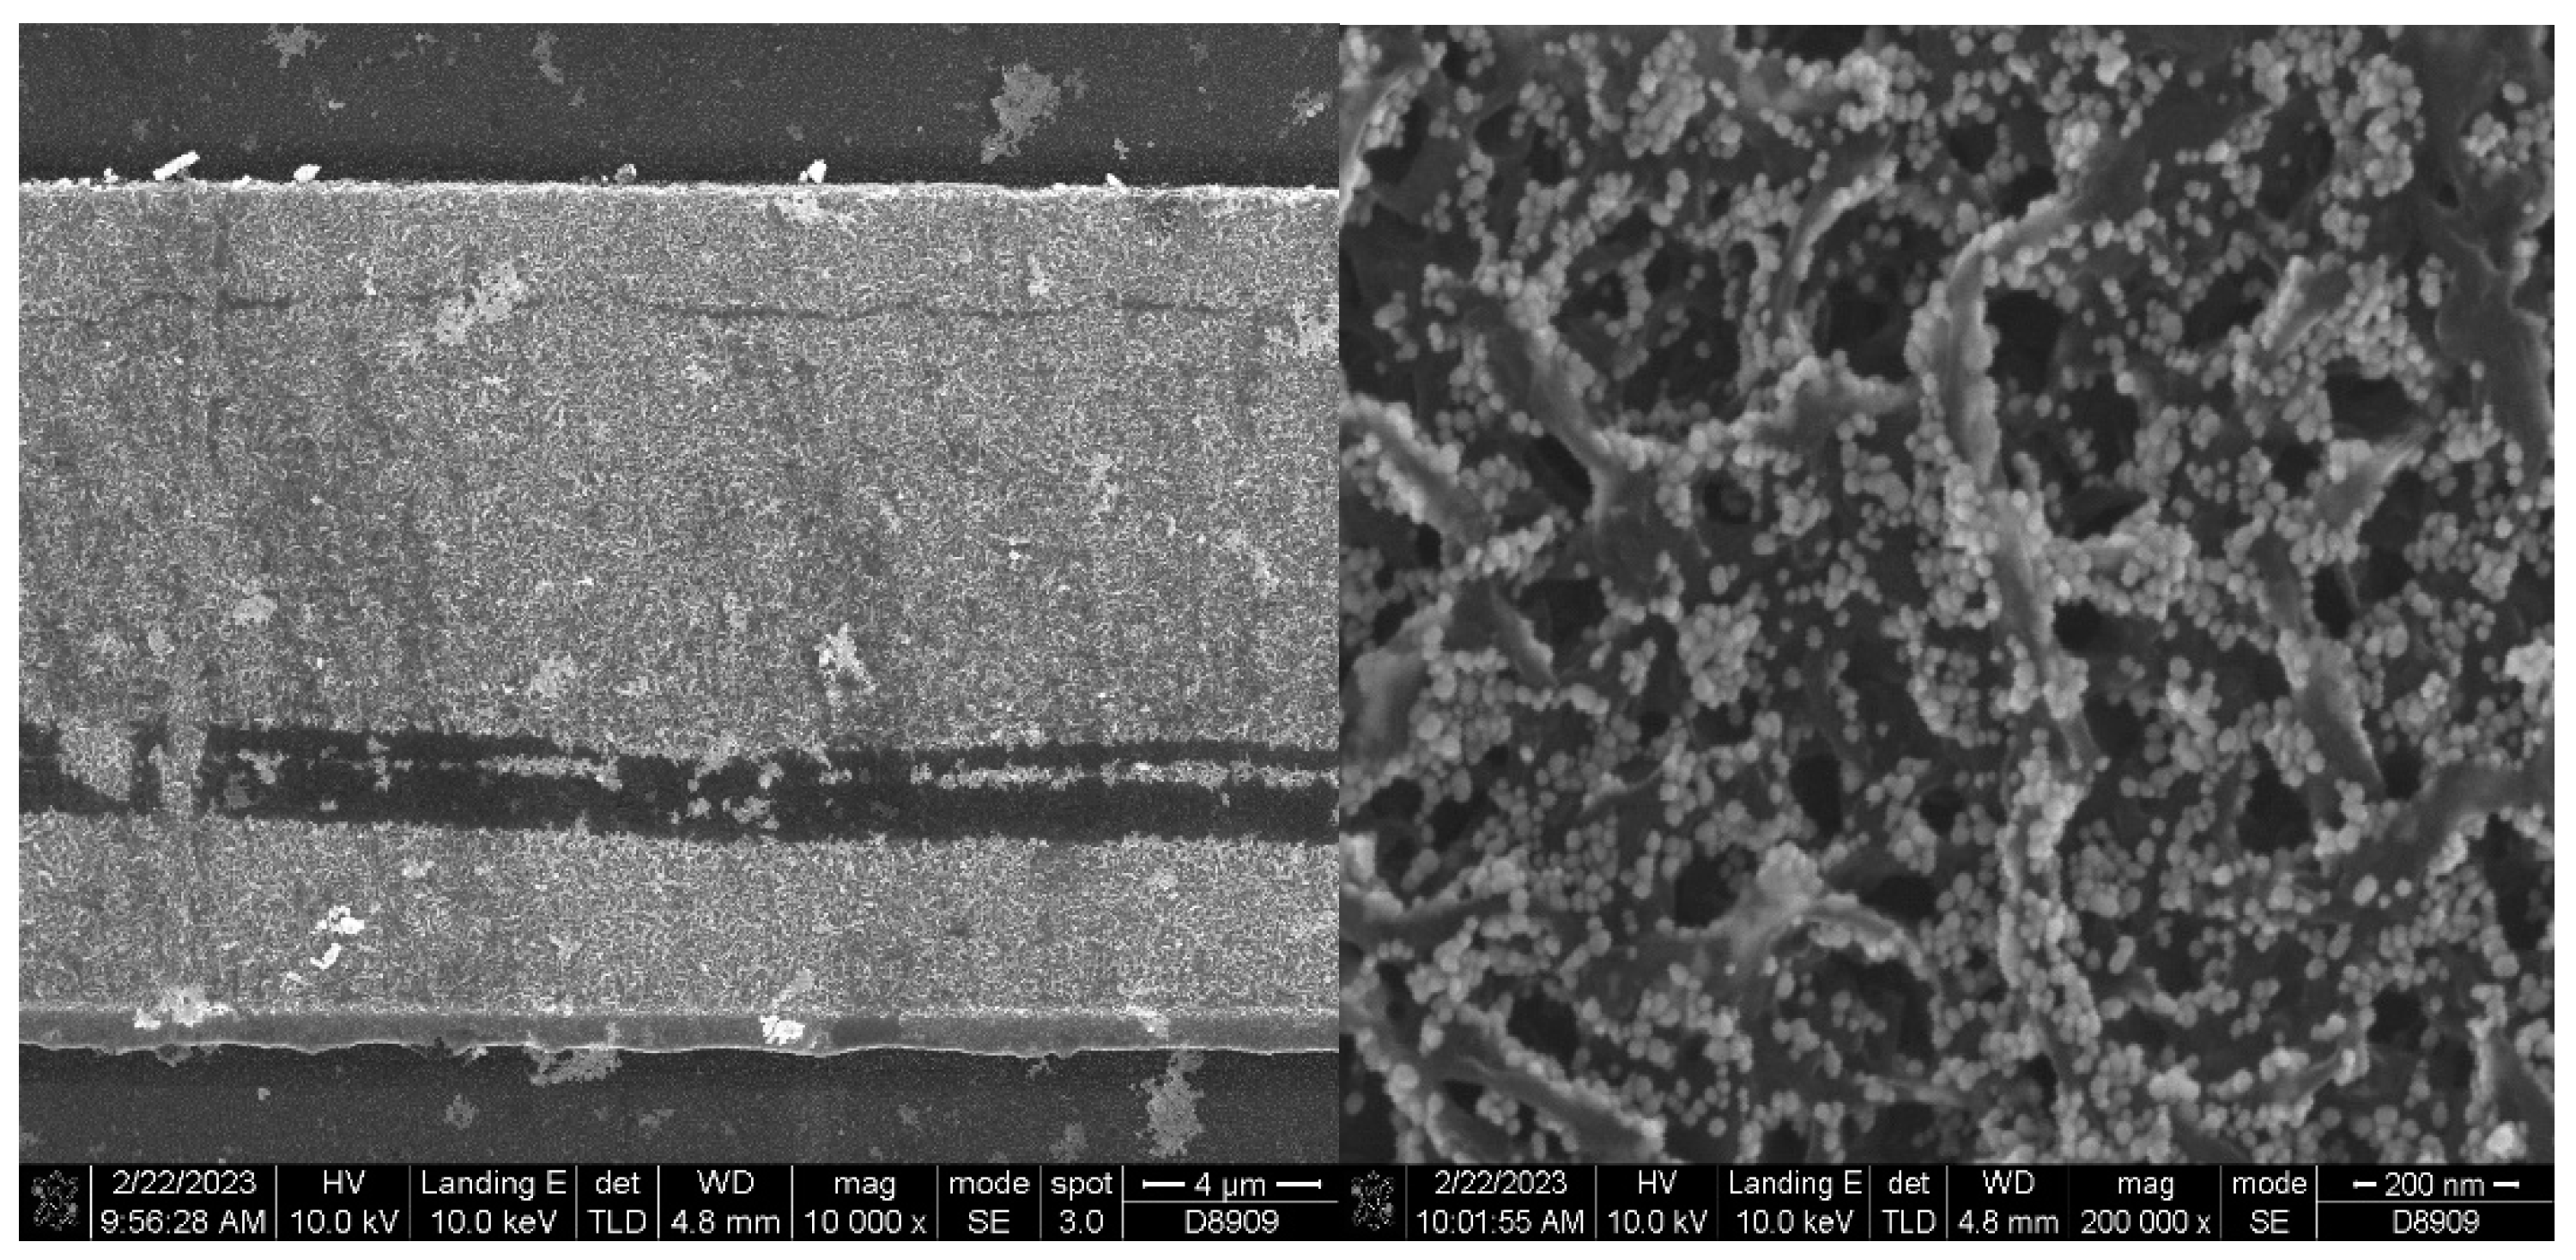
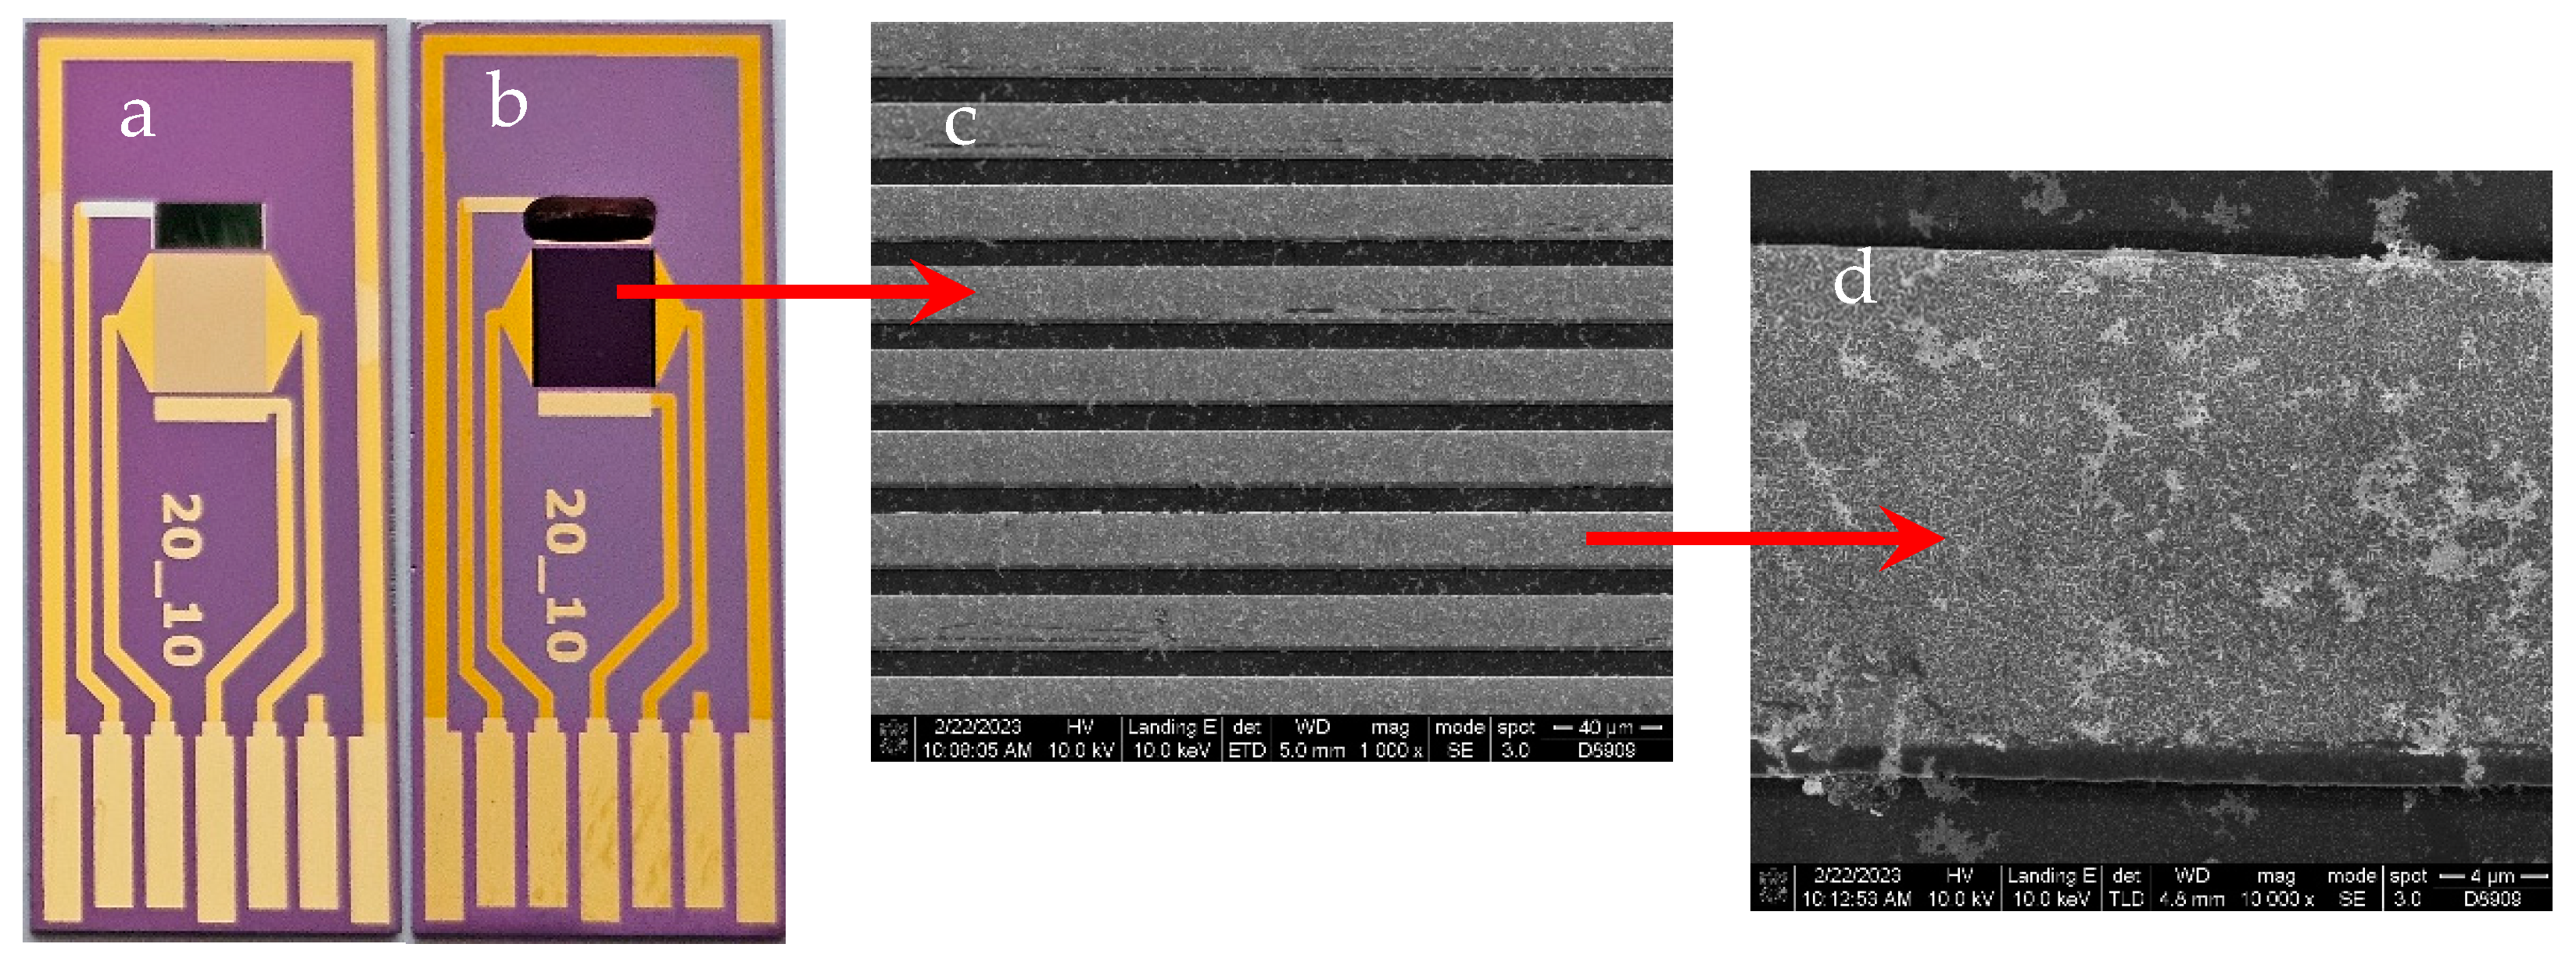
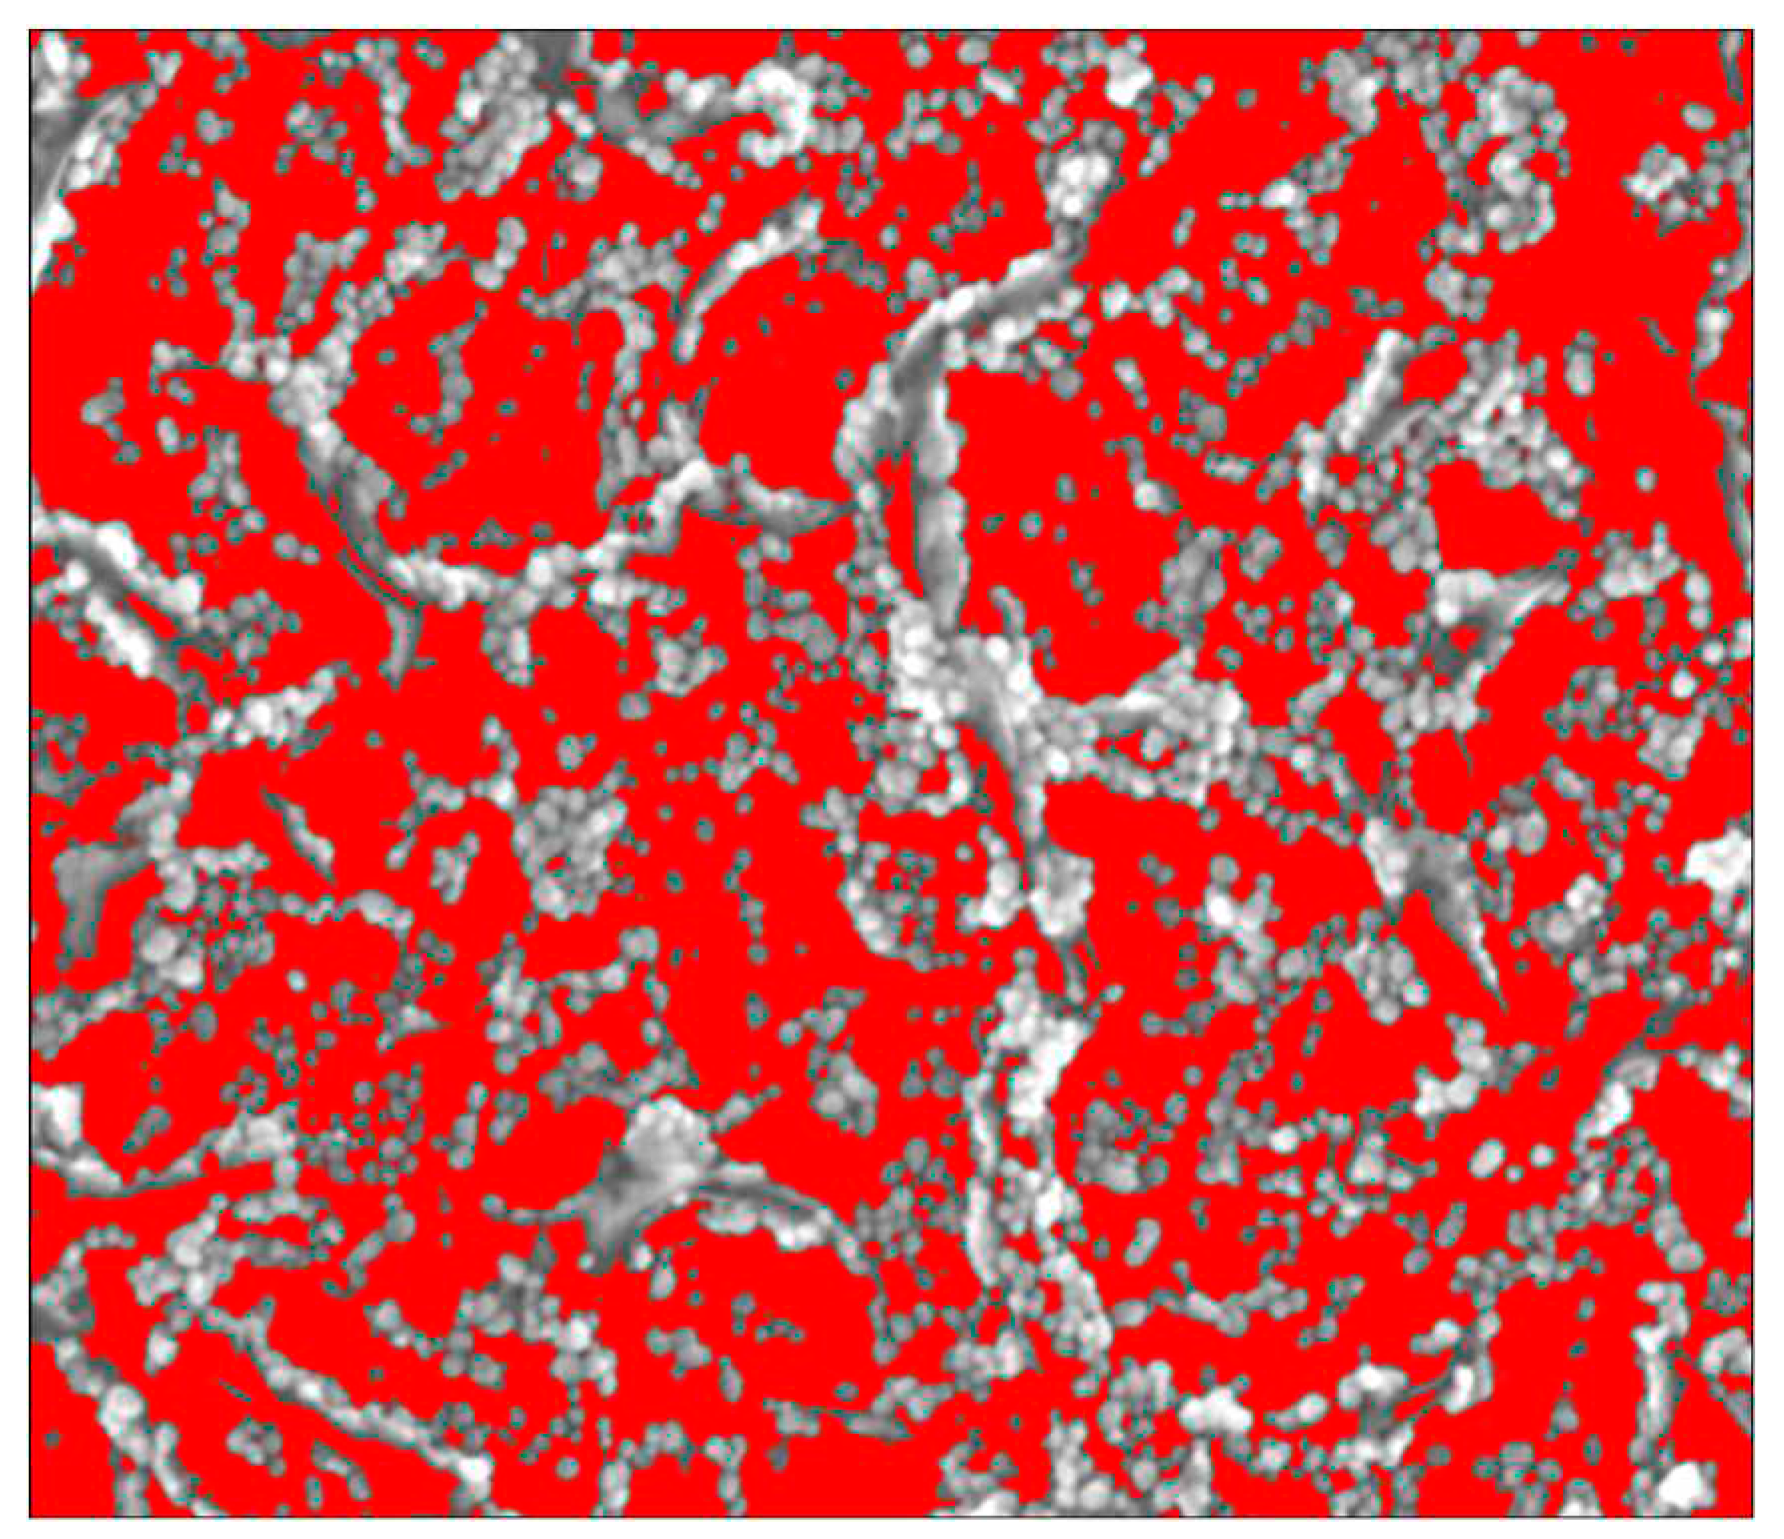
Using Nova NanoSEM 630 we were able to obtain SEM micrographs of the AuNPs deposited on the vertical graphene electrodes. We have chosen one of the sensors (VG_S6) to present the AuNPs deposition, the size distribution and covering rate.
Figure 2.
SEM micrograph of AuNPs decorated vertical graphene electrode (left) with detail (right).
Figure 2.
SEM micrograph of AuNPs decorated vertical graphene electrode (left) with detail (right).
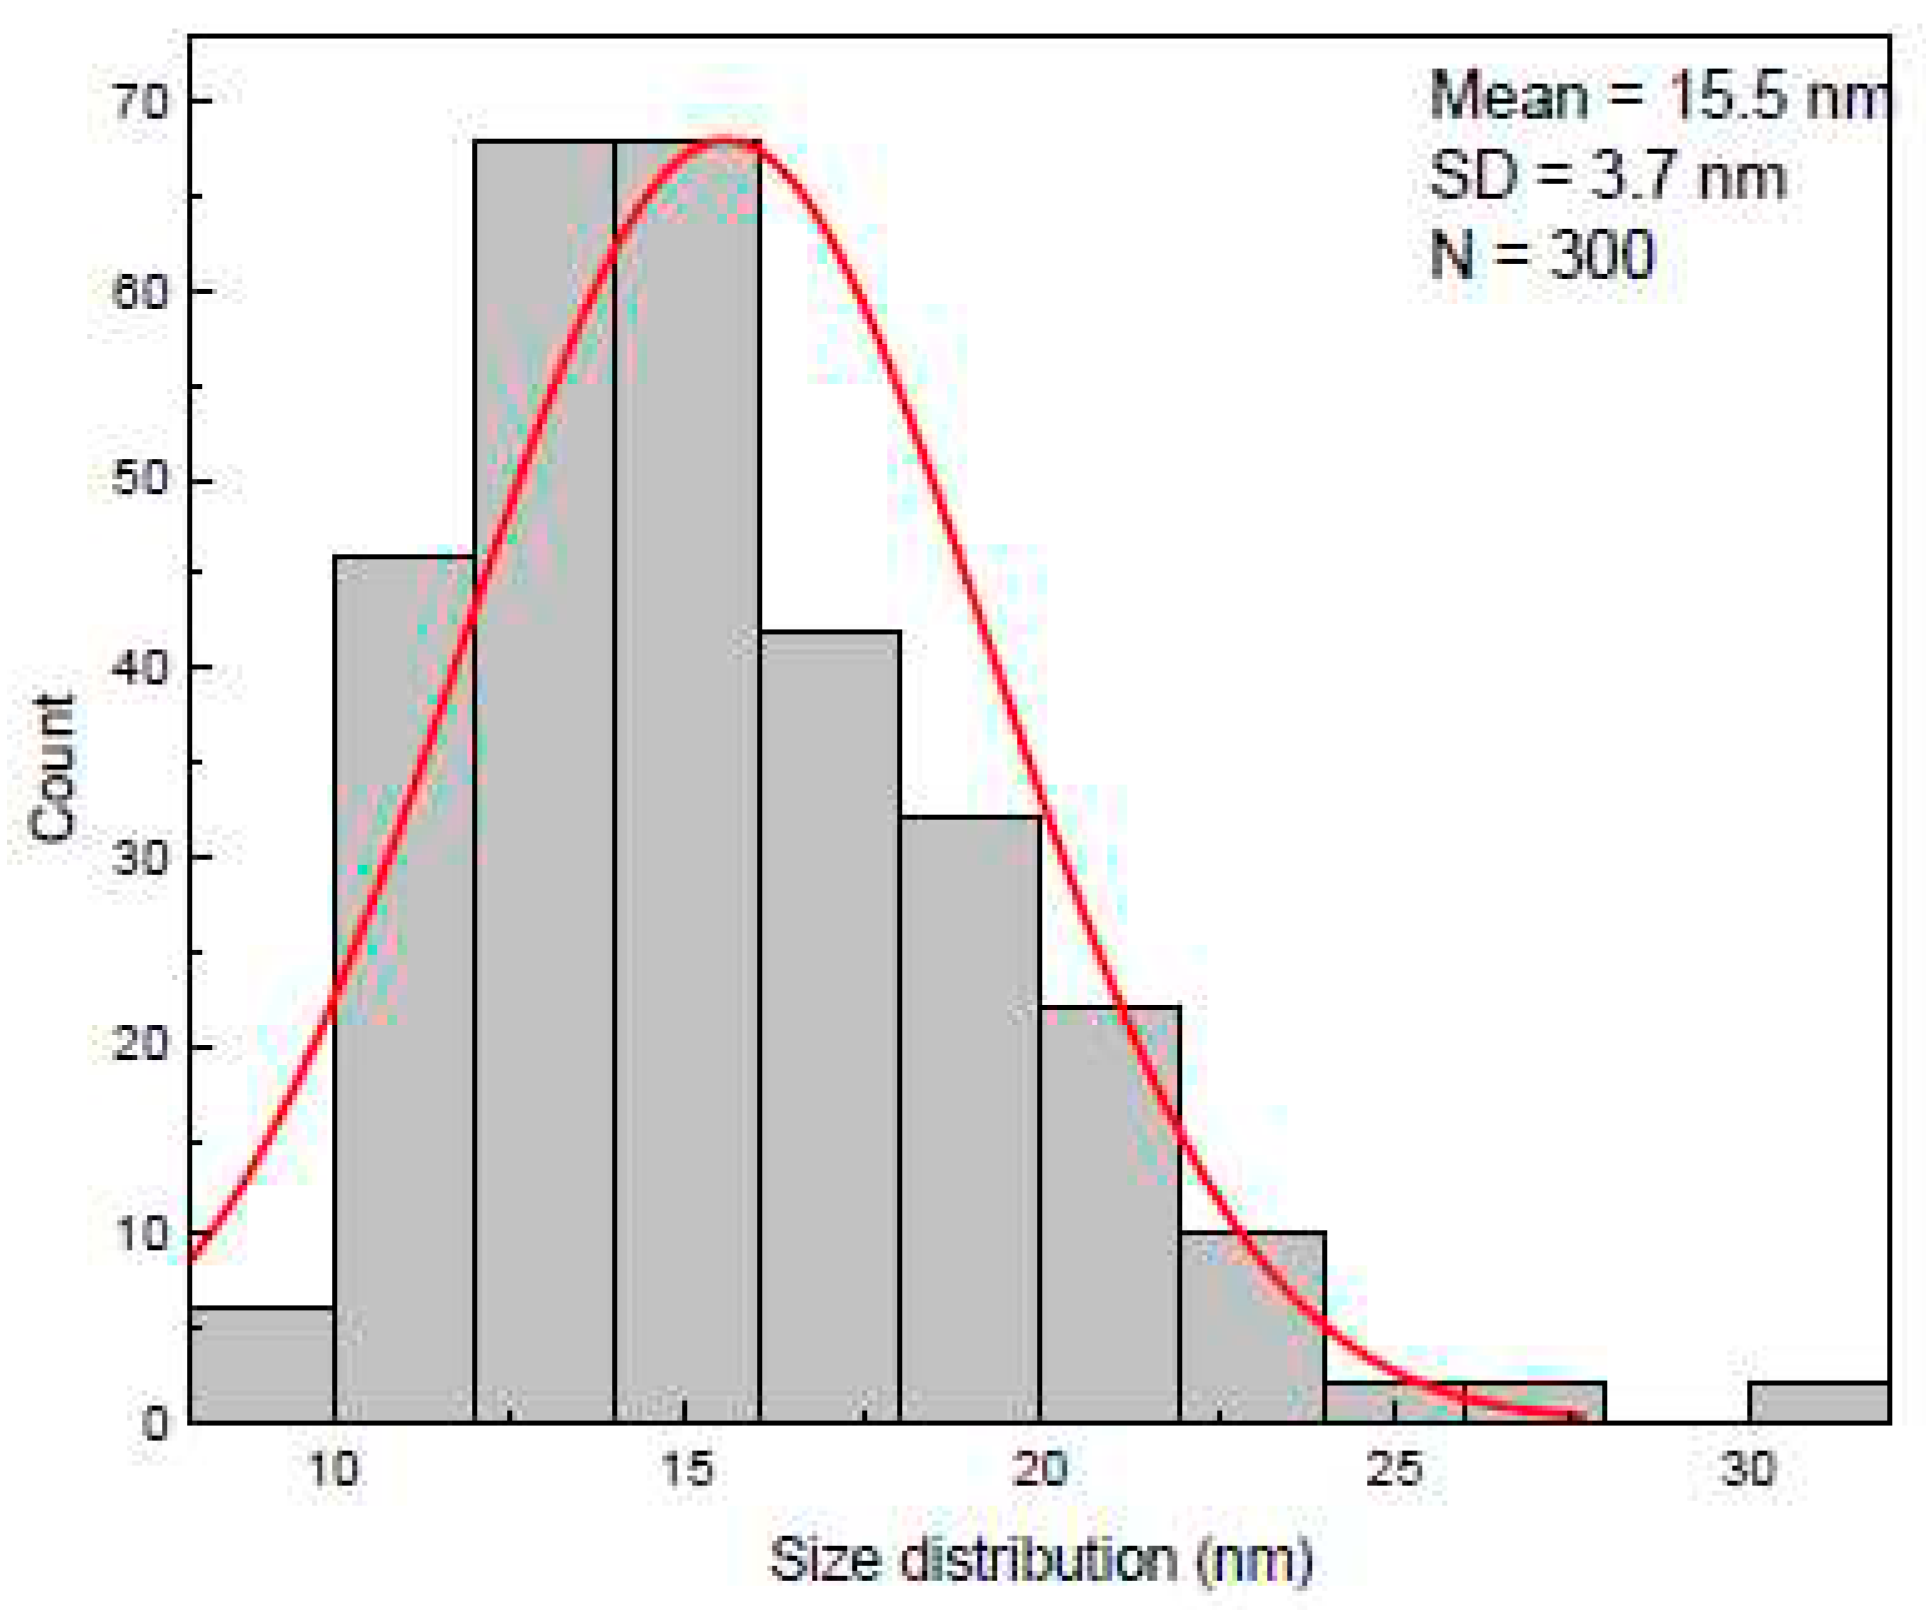
The size distribution of the AuNPs was extracted from SEM micrographs by measuring around 300 individual nanoparticles. The AuNPs sizes, determined based on SEM analysis, were found to be ranged from 9 nm to 30 nm.
The histogram was best fitted with Gauss function and exhibited a unimodal distribution of AuNPs. The highest percentage of the nanoparticles were found to be within 11 – 19 nm diameter size range having the mean length 15.5 ± 3.7 nm (
Figure 3). The area covered of AuNPs in the
Figure 4 is 46.4%.
3.3. Spectrometric Characterization
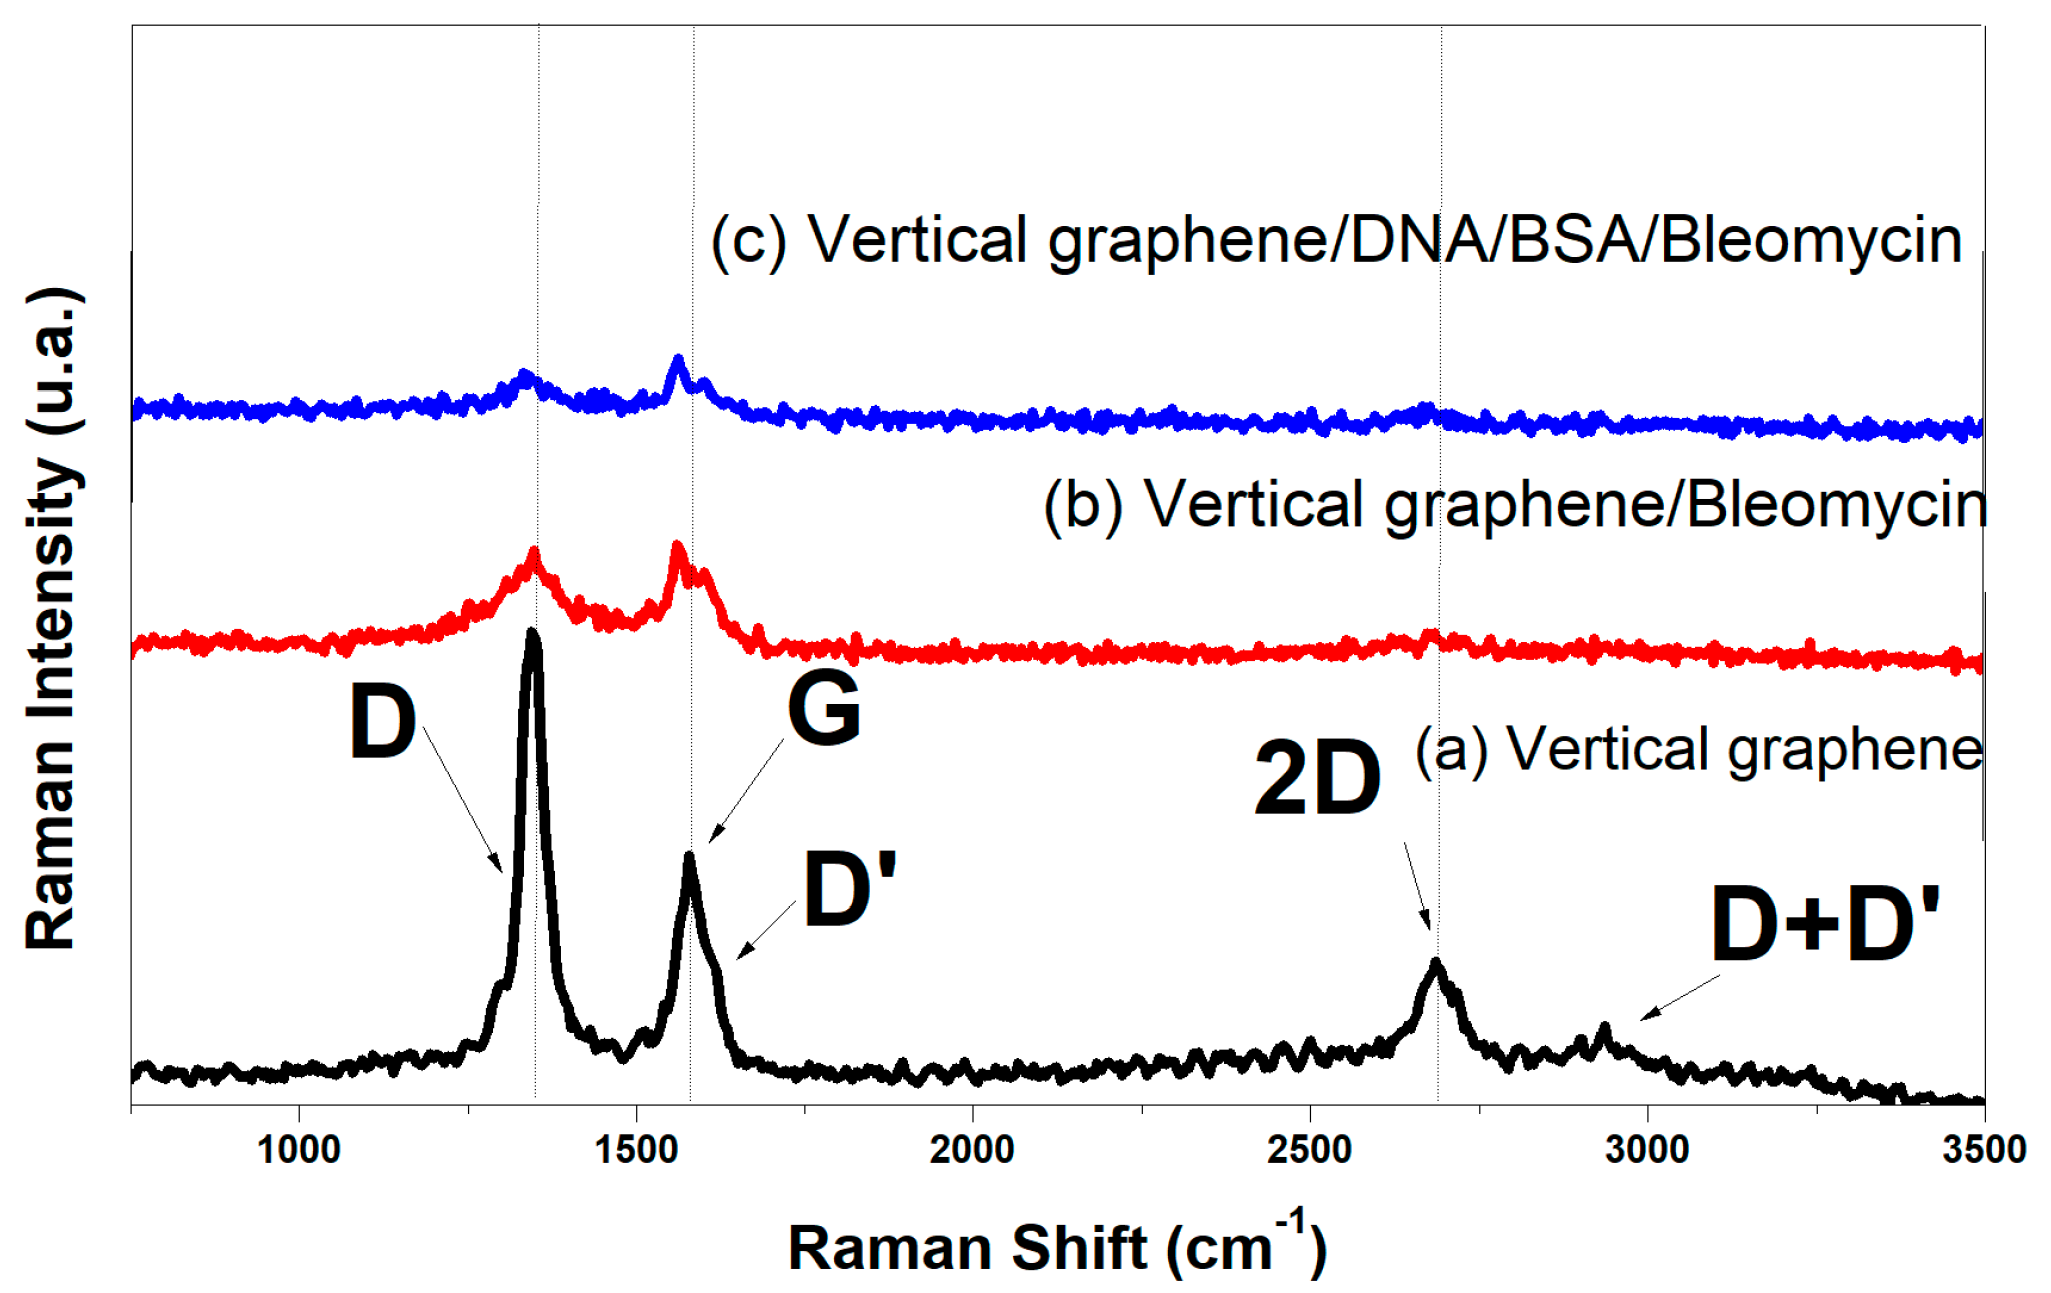
The Raman spectra of vertical graphene and vertical graphene functionalized with organic materials are shown in
Figure 5. All Raman spectra are initially vector normalized, and a Savitzky–Golay filter is applied over an 11-point window with a third-order polynomial to improve the signal-to-noise ratio. The spectra are then background corrected by linear subtraction and deconvoluted into individual Lorentzian peaks, with the exception of the G peak, which is described by a Breit–Wigner–Fano shape. The coefficient of determination for the proposed cumulative fits is ≥98%. The nanocrystalline structure of the VG thin films can be ascertained from the sharp increase of the D band’s intensity, the sub-unitary value of the I
2D/I
G ratio, a shift towards lower wavenumbers of the G peak, the appearance of bands D’ and D + D’ , and a general broadening of all Raman bands[
26]. In the carbonic materials, the G-band at ~1579 cm
-1 is attributed to a well ordered sp
2 carbon-type structure and the D-band at ~1351 cm
-1 is attributed to the structural disorder of the hexagonal graphitic structure.
In the Vertical graphene/Bleomycin and Vertical graphene/DNA/BSA/Bleomycin spectra, the G band had a lower frequency shift and the intensity decreases of the all-carbonic band with the enhancement of organic material coverage. This shift indicates the increase of disorder structure of the carbonic material, which reflects to the notable modification of structure upon organic coverage.
3.4. Electrochemical Characterization
The purpose of EIS data analysis is to determine the nature of the processes occurring at the electrode and their characteristic parameters. Impedance measurements are sensitive to non-uniform surface reactivity, which can be caused by surface heterogeneity, non-uniform mass transfer, and geometry-induced current and potential distribution.
Electrical charge transfer underlies both faradaic and non-faradaic components of the current. The faradaic component occurs in the case of electron transfer as a result of a reaction at the interface with the working electrode by overcoming the barrier, called polarization resistance (Rp). The activation of the barrier at any potential is represented by Rp, but at the potential at which the capacitive impedance is maximum, it becomes resistance to the transfer of electric charge (Rct). In the case of the ideal electrode, Rp is twice as large as Rct. Rct may be associated with energy dissipation related to the activation energy rather than being associated with electron transfer.
The non-faradaic current results from charging the capacitor formed by the electric double layer (Cdl). When charge transport occurs at the electrode-electrolyte interface, the mass transfer of reactants and reaction products plays a role in determining ion transfer rates, which depend on the consumption of oxidants and the production of reductants near the electrode surface. The transport rate of reactants and reaction products is determined by Warburg impedance (ZW) analysis. It is observed that kinetic effects occur at high frequencies, and mass transfer occurs at low frequencies. At high frequencies, the faradaic current is blocked, and the current passes only through the capacitor formed by the electric double layer.
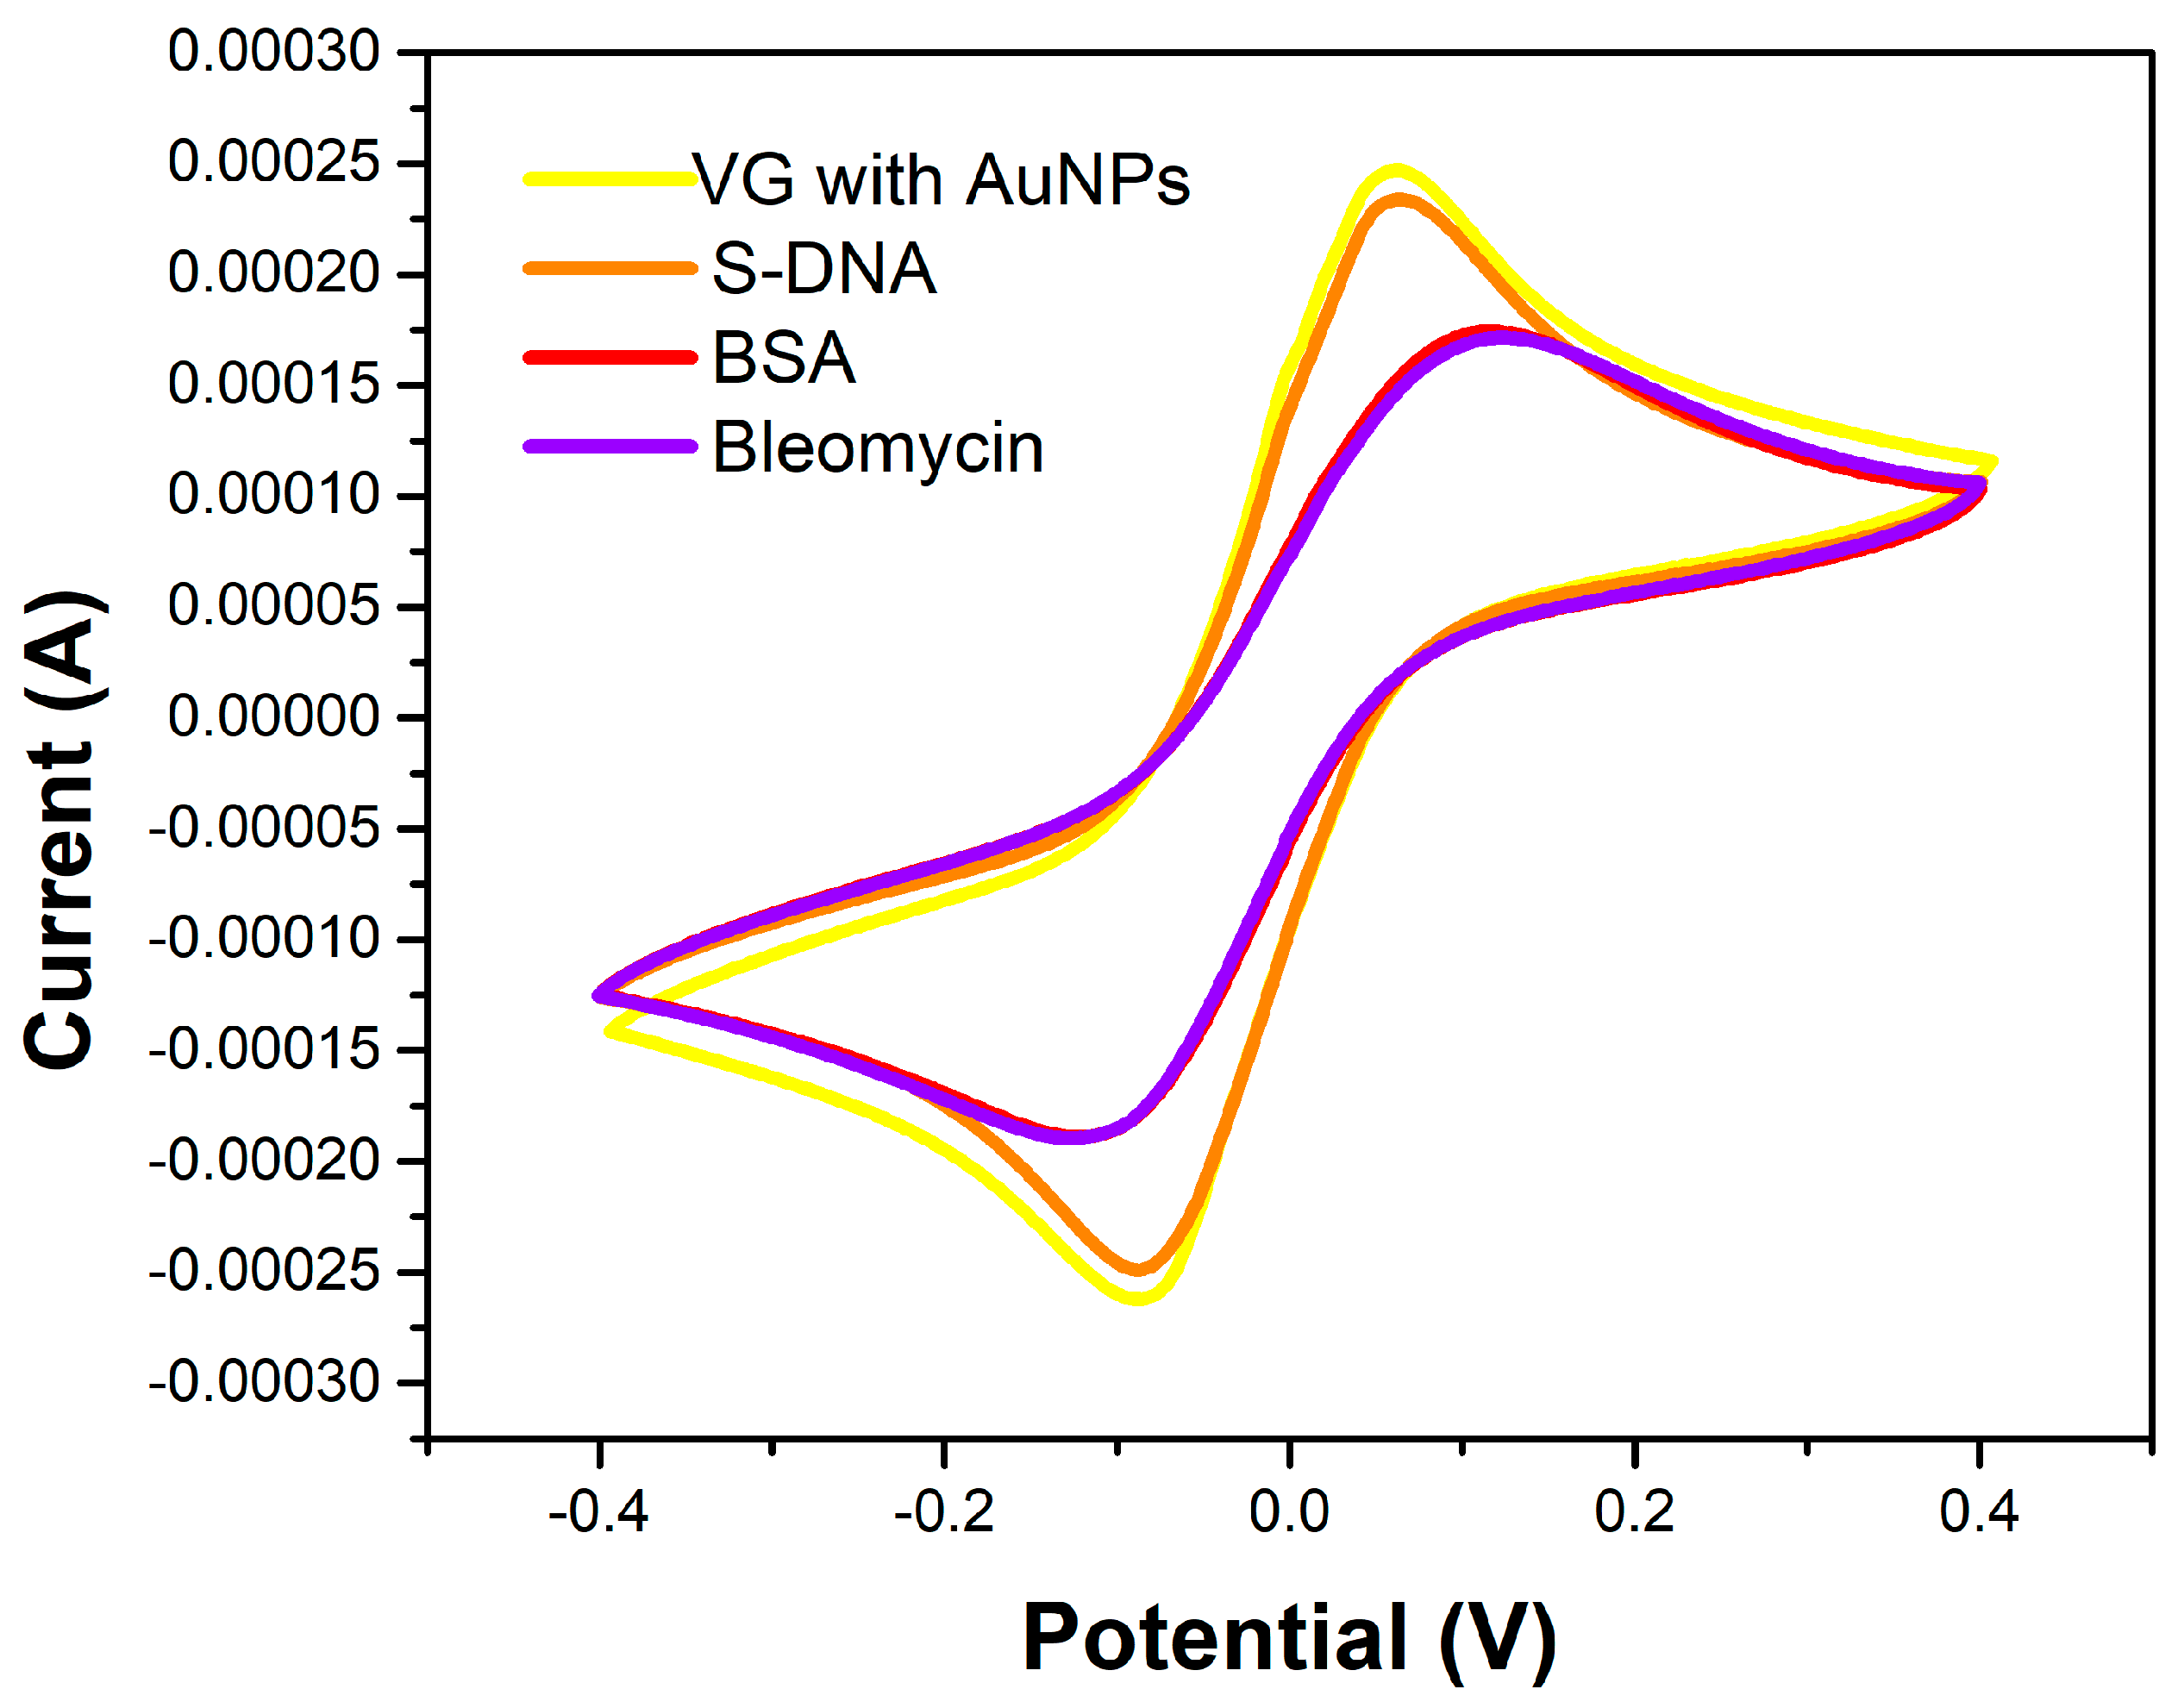
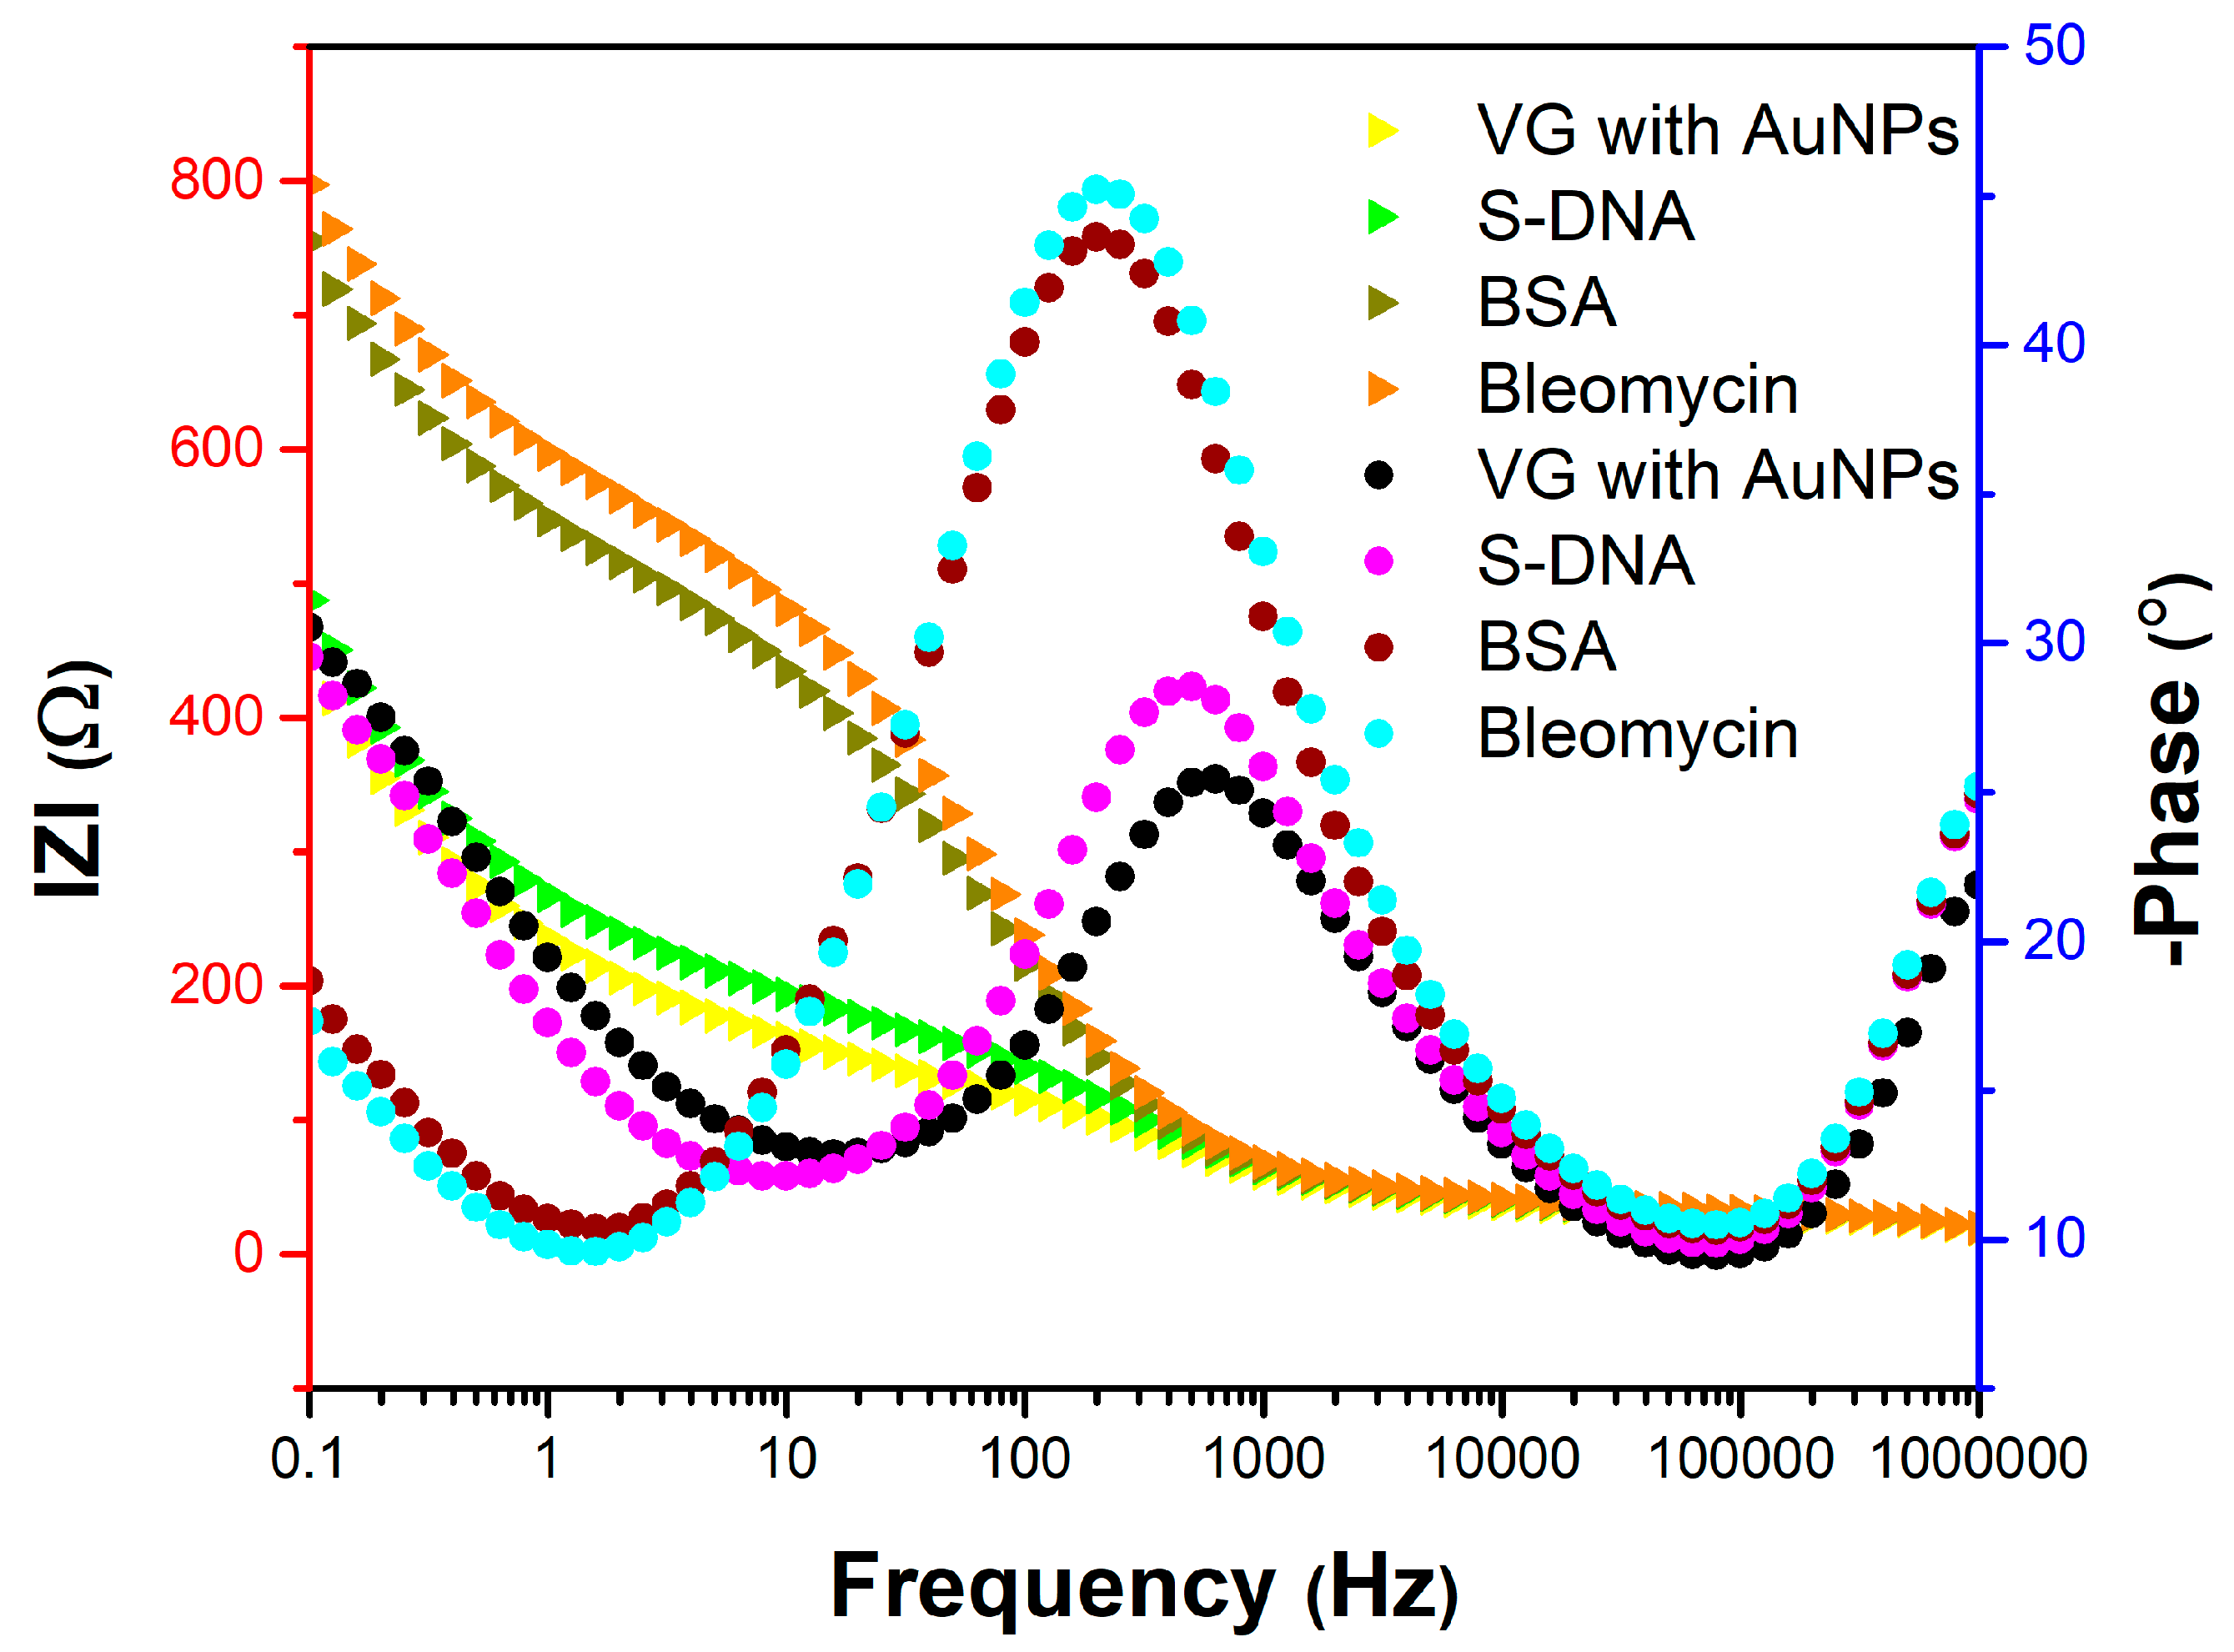
For the electrochemical characterization, we performed measurements on some sensors and selected three most representative sensors: (1) Au_S1 (internal denomination) – gold IDE electrochemical sensor with BLE functionalization, (2) VG_S5 - VG IDE electrochemical sensor with BLE functionalization, and (3) VG_S6 - VG IDE electrochemical sensor with AuNPs, S-DNA, BSA and BLE functionalization. We have performed both CV (
Figure 6 and
Figure 9) and EIS (
Figures 7, 8, 10, and 11) characterizations.
The EIS study reveals the influence of each surface modification on the sensor resistivity (
Figure 10) and phase shift (
Figure 11). Measurements were performed after each important step in the surface modification: AuNPs decoration, S-DNA attachment, BSA and BLE functionalization for the VG_S6 sensor.
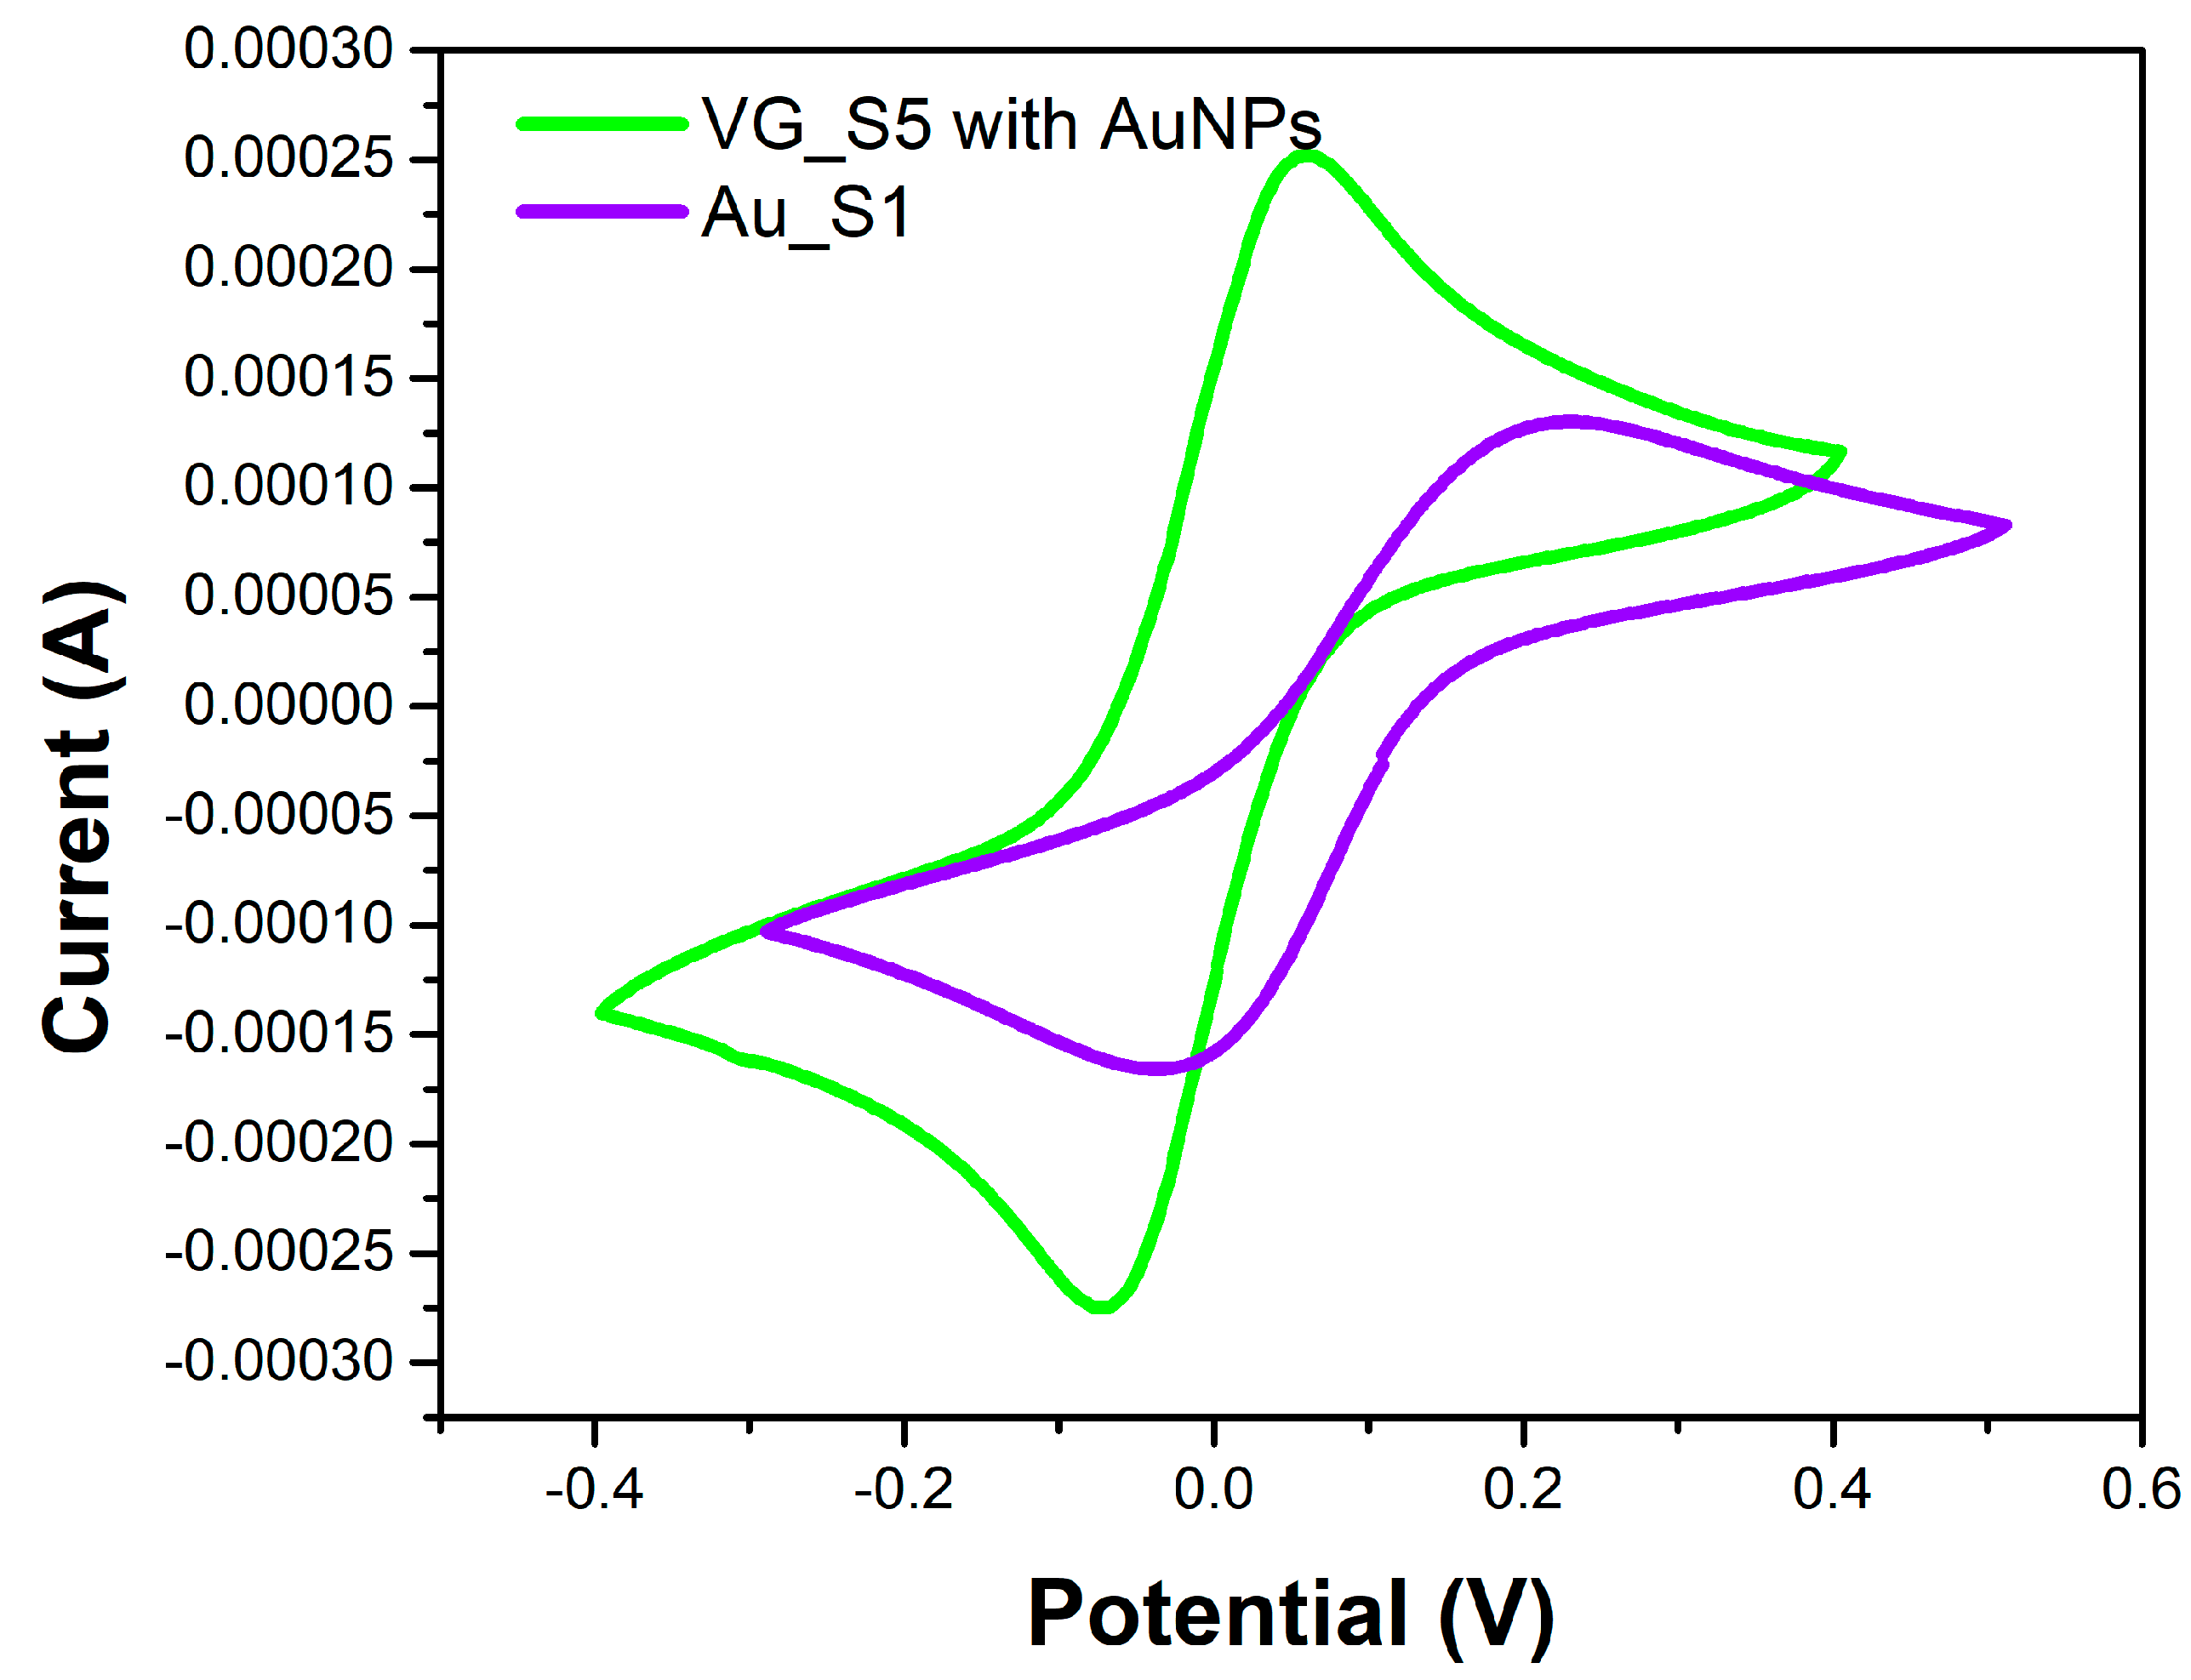
Figure 6 shows the cyclic voltammograms of the two microfabricated sensors (Au_S1 and VG_S5). The Au_S1 sensor electrodes are made of gold on the surface of which bleomycin has been attached. Vertical graphene was grown on the gold electrodes of the VG_S5 sensor, which was decorated with AuNPs and attached with bleomycin.
Figure 6.
Cyclic voltammogram for the Au_S1 and VG_S5 sensors with measurements after bleomycin functionalization, using a PBS solution containing 1 mM [Fe(CN)6]3-/4- and 0.1 M KCl, at a scan rate of 100 mV/s.
Figure 6.
Cyclic voltammogram for the Au_S1 and VG_S5 sensors with measurements after bleomycin functionalization, using a PBS solution containing 1 mM [Fe(CN)6]3-/4- and 0.1 M KCl, at a scan rate of 100 mV/s.
Figure 7.
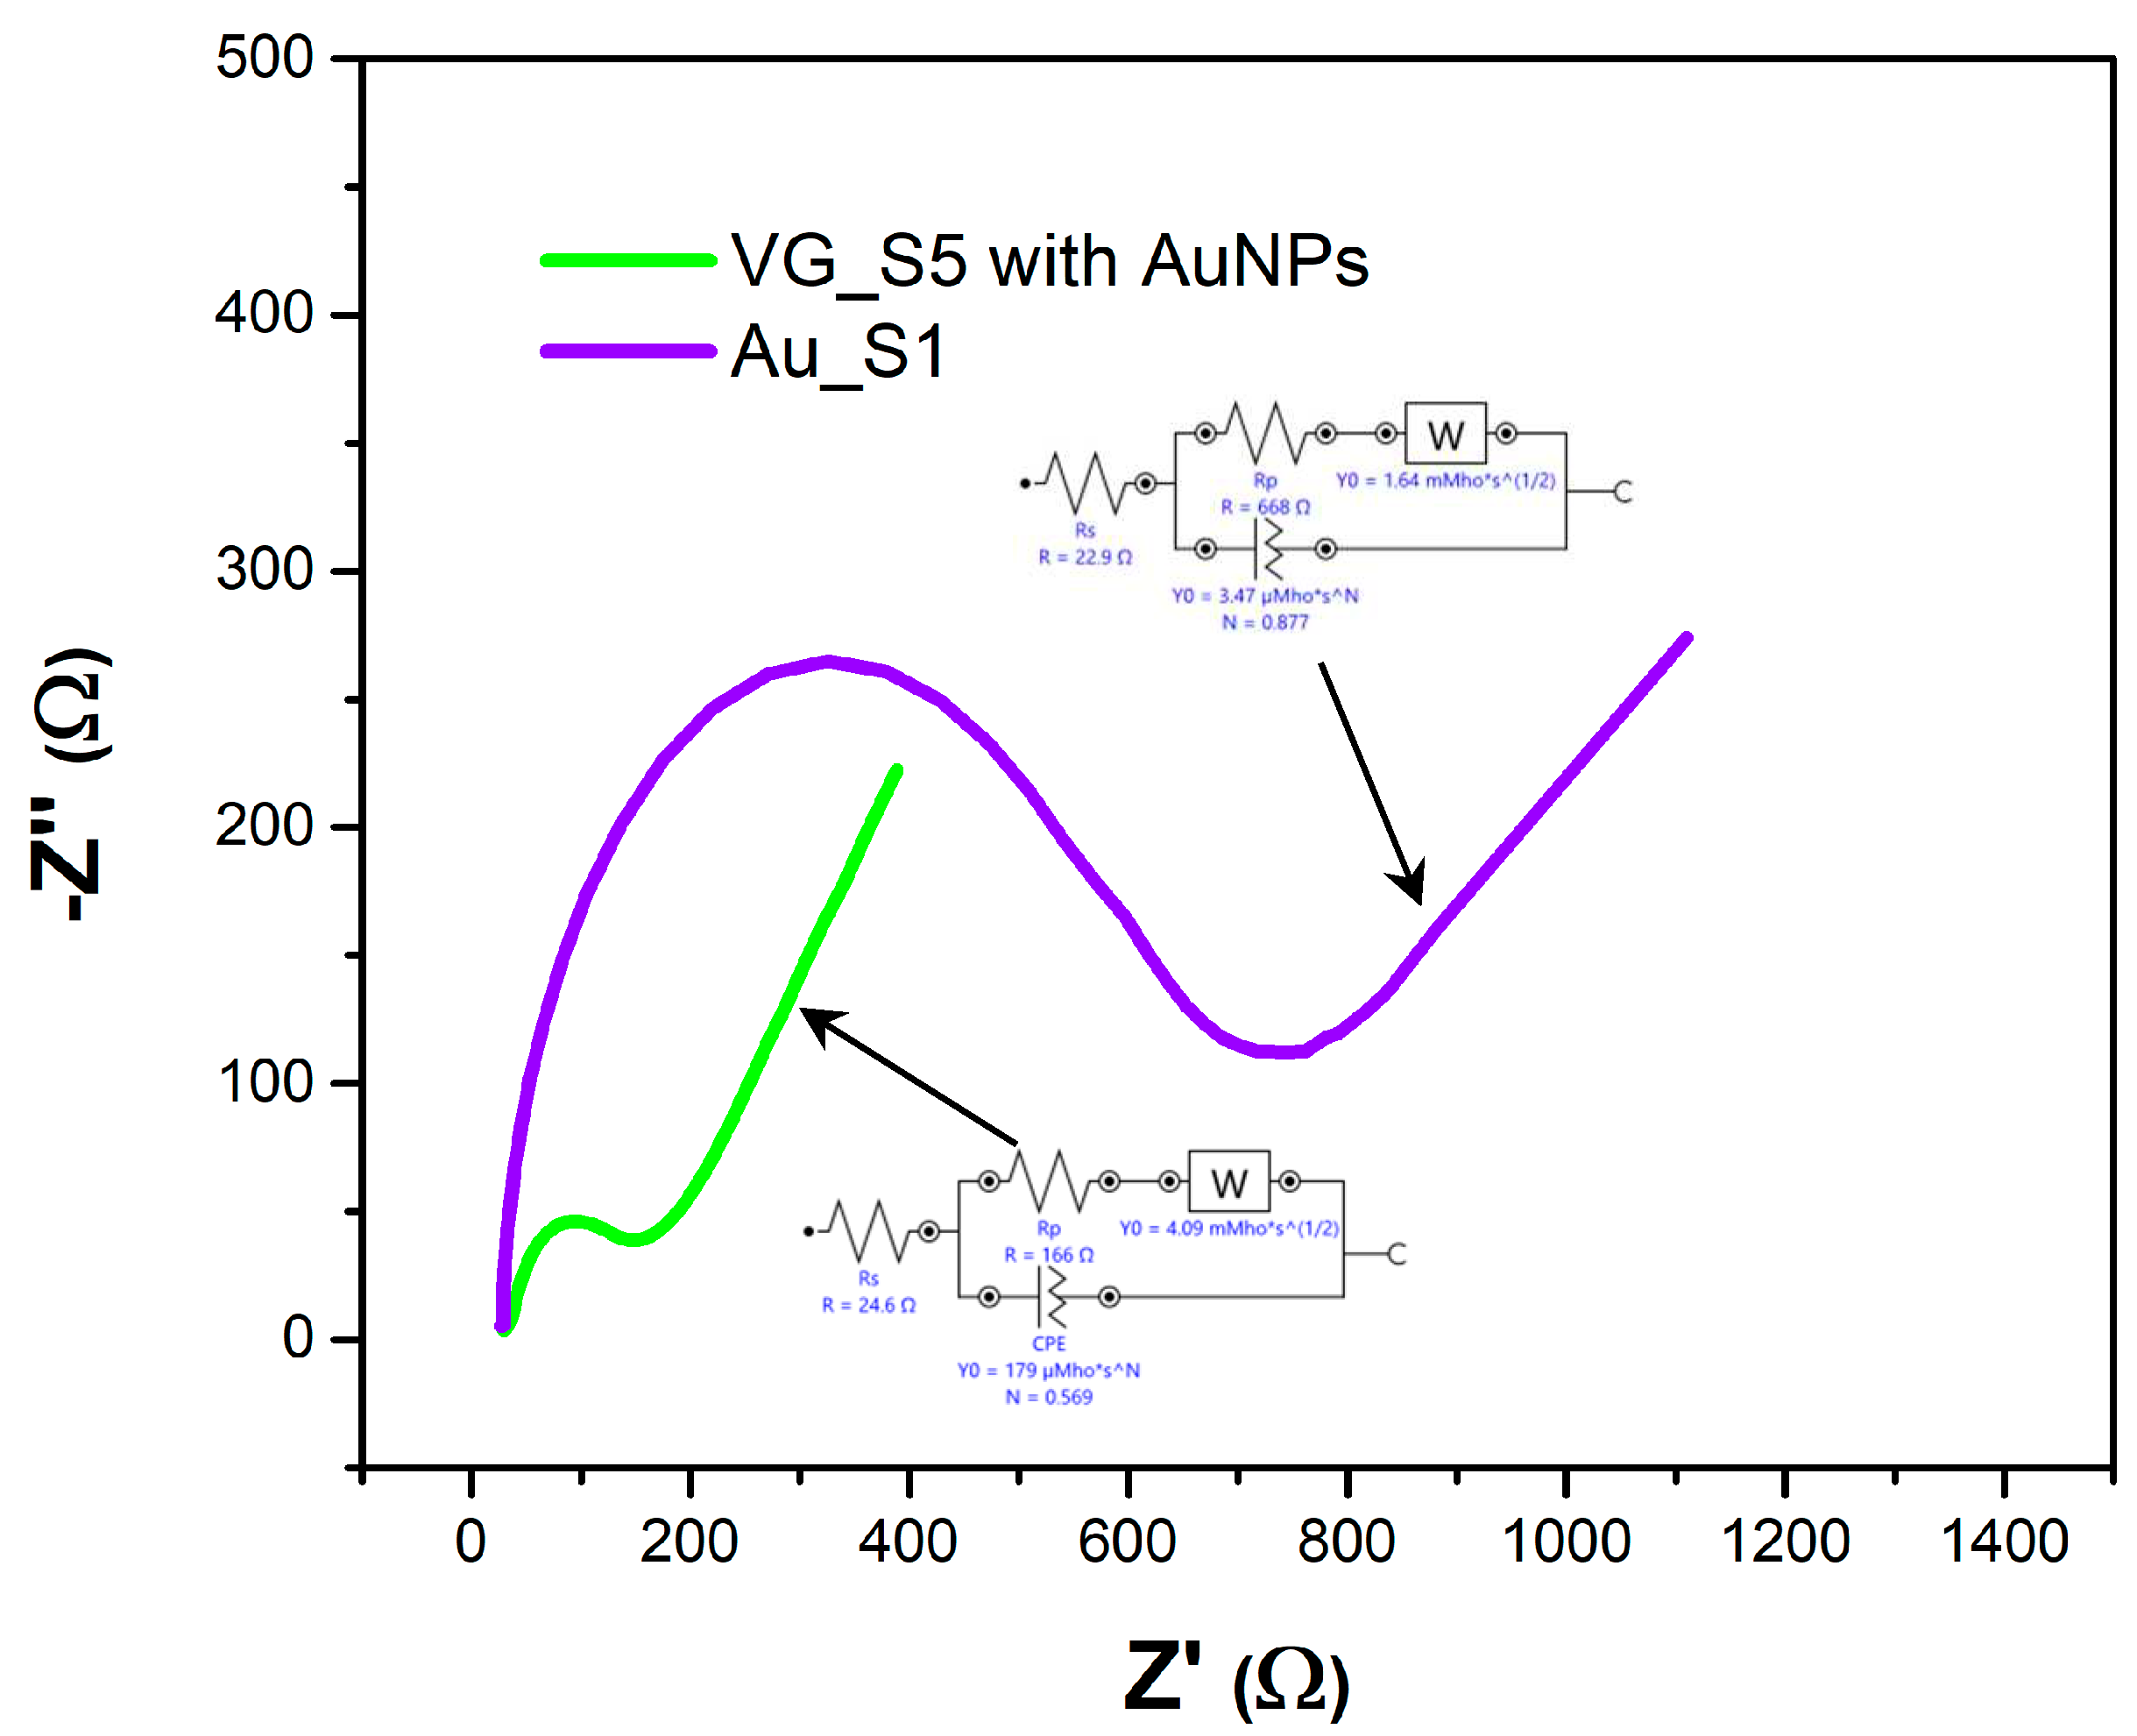
Nyquist diagram for the Au_S1 and VG_S5 sensors with measurements after bleomycin functionalization, using a PBS solution containing 1 mM [Fe(CN)6]3-/4 and 0.1 M KCl.
Figure 7.
Nyquist diagram for the Au_S1 and VG_S5 sensors with measurements after bleomycin functionalization, using a PBS solution containing 1 mM [Fe(CN)6]3-/4 and 0.1 M KCl.
Figure 7 shows the Nyquist diagrams and Randles circuits and
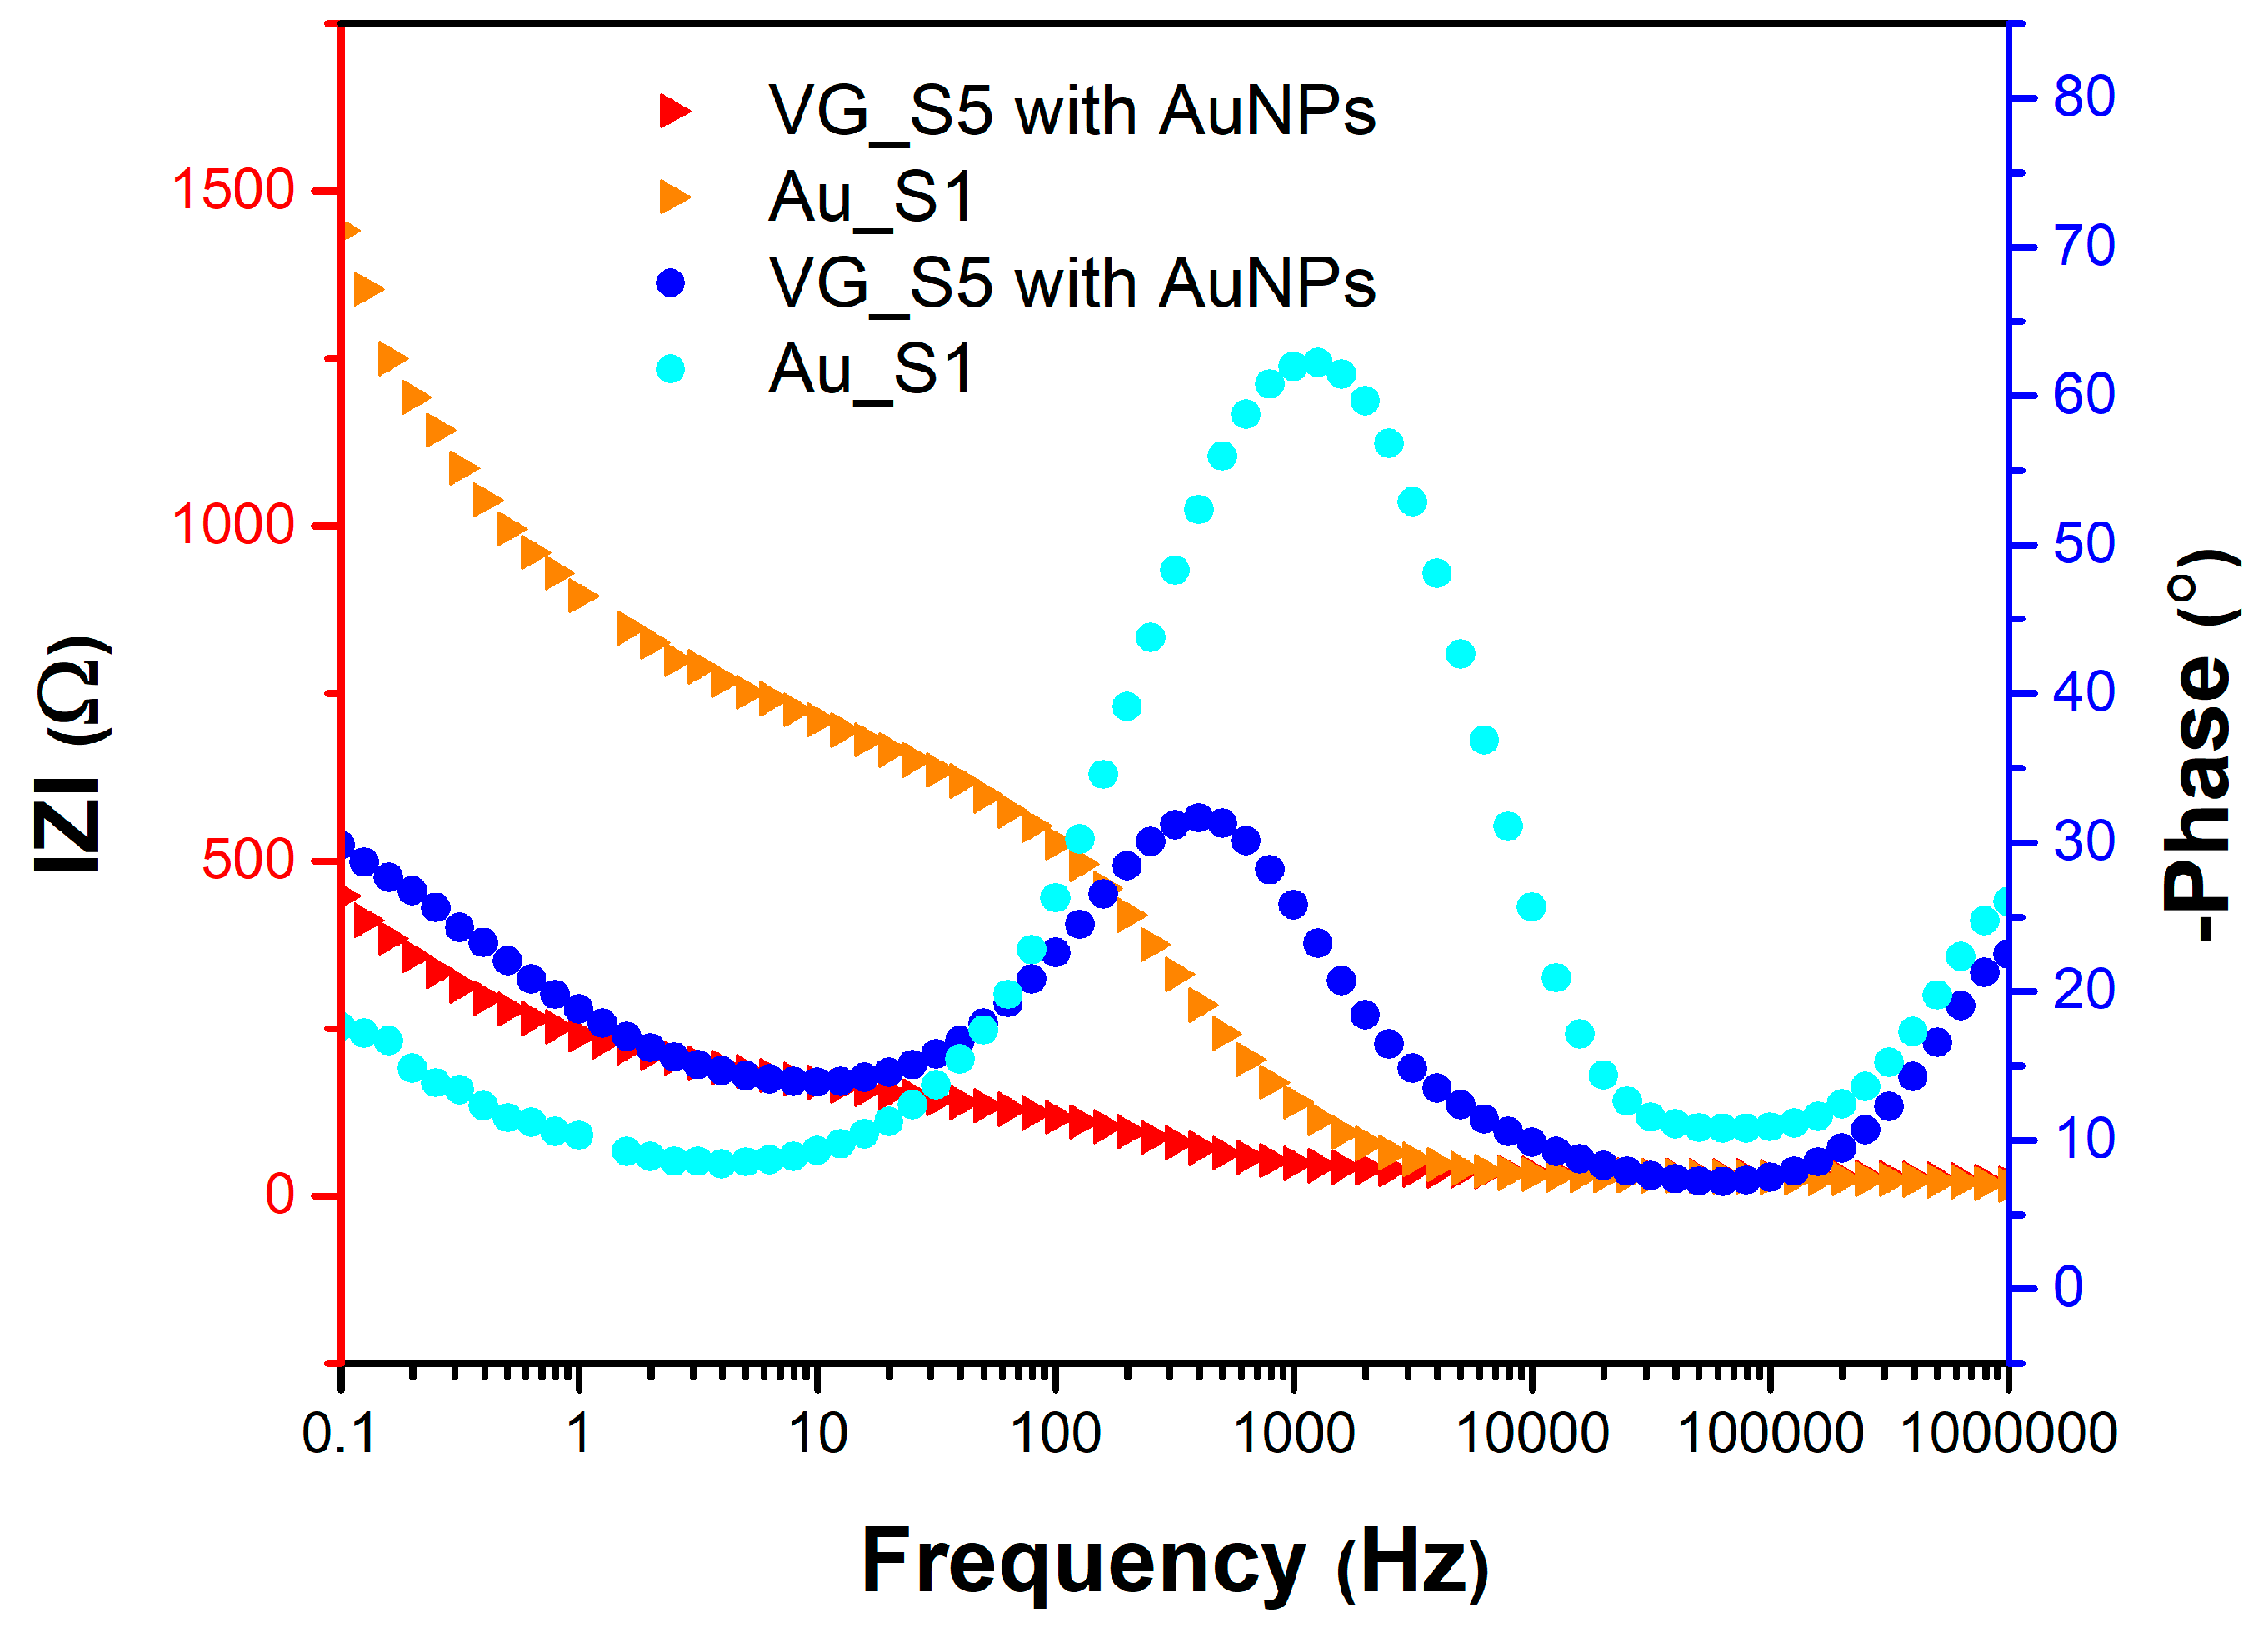
Figure 8 shows the variation of the impedance modulus and the phase difference between the current and voltage as a function of frequency for the two sensors, Au_S1 and VG_S5.
The Nyquist diagram describes the competition between surface and bulk diffusion, coupled with electrical charge exchange processes, or weak adsorption coupled with surface diffusion. The semicircle in the Nyquist diagram is due to the resistive coupling of electrical charge transfer with the capacitance C
dl at high frequencies. Z
W and R
ct depend on the concentration of electroactive species. At low concentrations, part of the semicircle overlaps with diffusion, while at high concentrations the two processes are well separated. If the ideal Nyquist diagram is a perfect semicircle, the response that controls the process corresponds to single activation energy. A depressed semicircle indicates that a detailed model is required because a distribution of activation energies appears on the surface of the electrode. In the diffusion-based kinetic model, two limiting cases arise: (i) mass transfer can be neglected in the case of high concentrations of redox species and small currents; (ii) the kinetic effect can be neglected if the processes at the electrode are very fast and R
ct is very small (the semicircle radius is very small at high frequencies). The maximum of the capacitive impedance (minimum capacitance of the capacitor) at high frequencies is observed at the electron relaxation time τ
1 = 1/ω
1=R
ctC
dl, and the minimum of the imaginary impedance (at the place where the semicircle ends and mass transfer begins) is observed at the ion relaxation time τ
2 = 1/ω
2=R
pC, where C is the capacity of the system. C = Q/U, where Q is the total charge stored in the capacitor, and U is the voltage applied to the capacitor terminals. In conclusion, a material with high electrical capacity stores a greater amount of electrical charge at the same potential difference.
Figure 8.
Bode diagram for the Au_S1 and VG_S5 sensors with measurements after bleomycin functionalization, using a PBS solution containing 1 mM [Fe(CN)6]3-/4 and 0.1 M KCl.
Figure 8.
Bode diagram for the Au_S1 and VG_S5 sensors with measurements after bleomycin functionalization, using a PBS solution containing 1 mM [Fe(CN)6]3-/4 and 0.1 M KCl.
If the surface of the working electrode is porous, the capacity of the electric double layer is no longer a purely capacitive element, but exhibits frequency dispersion. In this case C
dl is replaced by a constant phase element (CPE), which represents a capacitor with losses. Its conductance, Y
CPE, is:
where C
CPE refers to the capacitance of the electrode and N refers to the deviation of the capacitive line from 90
o with the angle α = 90
o(1-N). If N=1, then the line is purely capacitive. CPE and Warburg are two examples of Voigt elements that help properly fit AC electrical circuits.
The Bode plot provides information on the variation of the impedance modulus and the phase difference between current and voltage (ϕ) as a function of frequency, from which the characteristic frequency at the inflection point of both the phase difference and the impedance modulus can be identified. In other words, these curves provide information about the dielectric behaviour of the molecules attached to the electrode. In the immediate vicinity of the electrode, the concentration of the electroactive species can be higher (oxidation) or lower (reduction) than the concentration in the volume of the solution. A concentration gradient is thus created which causes the electroactive species to move from areas with high concentration to those with low concentration. Diffusion processes occur due to electrochemical reactions at the electrode surface. If the phase difference tends to zero for low frequencies, this indicates that the potential and current are in phase. The phase difference is sensitive to system parameters, providing an efficient way to compare the theoretical model with the experimental one. If the phase difference tends to zero for high frequencies, it indicates that the imaginary impedance is much lower than the real impedance. The impedance modulus is sensitive to the system parameters through the asymptotic values at high frequencies, providing information about the electrolyte resistance (R
s), and, respectively, at low frequencies, where the impedance modulus is approximately equal to the direct current resistance.
Figure 9.
Cyclic voltammogram for the VG_S6 sensor with measurements after AuNPs decoration, S-DNA attachment, BSA and bleomycin functionalization, using a PBS solution containing 1 mM [Fe(CN)6]3-/4- and 0.1 M KCl, at a scan rate of 100 mV/s.
Figure 9.
Cyclic voltammogram for the VG_S6 sensor with measurements after AuNPs decoration, S-DNA attachment, BSA and bleomycin functionalization, using a PBS solution containing 1 mM [Fe(CN)6]3-/4- and 0.1 M KCl, at a scan rate of 100 mV/s.
Figure 10.
Nyquist diagram for the VG_S6 sensor with measurements after AuNPs decoration, S-DNA attachment, BSA and bleomycin functionalization, using a PBS solution containing 1 mM [Fe(CN)6]3-/4 and 0.1 M KCl.
Figure 11.
Bode diagram for the VG_S6 sensor with measurements after AuNPs decoration, S-DNA attachment, BSA and bleomycin functionalization, using a PBS solution containing 1 mM [Fe(CN)6]3-/4 and 0.1 M KCl.
Figure 11.
Bode diagram for the VG_S6 sensor with measurements after AuNPs decoration, S-DNA attachment, BSA and bleomycin functionalization, using a PBS solution containing 1 mM [Fe(CN)6]3-/4 and 0.1 M KCl.
4. Discussion
By correlating the diagrams in
Figure 6,
Figure 7 and
Figure 8, it can be seen that the VG_S5 sensor has more suitable electrochemical parameters for the detection of bleomycin. From the CV we deduce the potential difference between the anodic and cathodic peaks for the two sensors ΔE
VG = 135 mV versus ΔE
Au = 263 mV, maximum anode current I
QVG = 0.25 mA versus I
QAu = 0.14 mA, and minimum cathode current I
CVG = -0.27 mA versus I
CAu = 0.17 mA. These differences are due to the attachment of Bleomycin on the VG_S5 sensor, both by AuNPs on the surface of the vertical graphene and by the gold below the graphene.
The values of the EIS parameters extracted from the Nyquist and Bode diagrams are given in
Table 1.
Almost all electrochemical parameters presented in
Table 1, indicate that sensor VG_S5 is more suitable for BLE detection: low charge transfer resistance (R
ct) and polarization resistance (R
p), implying a faster response, low capacitive impedance (Z’’
max and Z’’
min) indicating the high sensitivity of the vertical graphene, high conductance (Y
CPE and Y
W) and capacitance (C
dl) correlated with lower reactive species relaxation time (τ
2) emphasising the faster occurrence of the chemical reactions, and lower phase angle (φ
max), indicating higher electrode surface conductivity.
In
Table 2, we are presenting the electrochemical parameters for the sensor VG_S6 after sDNA attachment and after BLE functionalization. This is because the values for the electrochemical parameters after AuNPs decoration and after DNA attachment are similar, as are the values for the BSA and BLE functionalization.
Comparing VG_S6 electrochemical parameters after the final step of BLE functionalization with the ones of VG_S5 after the BLE functionalization, we can notice that all VG_S6 parameters have worse values, which implies that the simpler surface modification method is more efficient.
The BLM molecule contains two cysteine (Cys) residues that have thiol groups. The thiol groups have affinity binding towards Au molecules. In our case, the BLM molecules bind both to the gold nanoparticles on the surface of vertical graphene and to the gold electrodes beneath VG that can still be accessed by BLM molecules. Thus, BLM molecules can bind directly to the sensor’s surface with no need for the sDNA molecules. This can be seen in the R
ct values in
Table 1 and
Table 2. The R
ct value of VG_S5 sensor (
Table 1) without sDNA probes after BLM attachment is 93 Ω , while the R
ct value of the VG_S6 sensor (
Table 2) with sDNA probes after BLM attachment is 275 Ω. The VG_S6 sensor has a much higher charge transfer resistance compared to the VG_S5 sensor. The sensitivity of the sensor is greatly influenced by R
ct. As the charge transfer resistance is lower, the sensitivity of the sensor improves. The higher charge transfer resistance gets, the sensitivity of the sensor drops. Thus, we can conclude that by using the sensor without sDNA probes we can increase overall sensitivity and decrease complexity and costs by removing the sDNA functionalization step.
5. Conclusions
The results for bleomycin detection, in terms of cyclic voltammetry and electrochemical impedance spectroscopy, emphasized that a simpler surface modification method proved to be more efficient. In other words, the sensor VG_S5 with only 2 steps of surface modification: AuNPs decoration and BLE functionalization of the working electrode, was more suitable for BLE detection, considering the electrochemical parameters, than the Au_S1 and the VG_S6, that had numerous steps of surface modification: AuNPs decoration, S-DNA attachment, BSA and Bleomycin functionalization.
Once again, the vertical graphene biosensor exhibited improved sensitivity, faster response, faster occurrence of the chemical reactions, and higher electrode surface conductivity, than the classical gold IDE sensor.
The next steps in our research will include the plasma-level monitoring for different concentrations of all three chemotherapeutic agents: etoposide, cisplatin, and bleomycin, distinctly and in combination.
Author Contributions
Conceptualization, C.M. and M.A.; Data curation, E.C. and T.B.; Funding acquisition, M.A.; Investigation, C.M. and P.P.; Methodology, C.M., P.P., A.A., C.P., O.B. and M.A.; Project administration, M.A.; Software, C.M.; Supervision, M.A. and A.A.; Visualization, C.M and O.B.; Writing—original draft, C.M., T.B., P.P., C.P., O.B. and M.A.; Writing—review & editing, C.M., E.C. and M.A. All authors have read and agreed to the published version of the manuscript.
Funding
This research was financially supported by the PN-III-P2-2_1-PTE-2021-0444 project (Grant No. 69PTE ⁄ 2022) and the PN-III-P2-2_1-PED-2021-3112 project (Grant No. 597PED ⁄ 2022), both funded by Agency for Higher Education, Research, Development and Innovation (UEFISCDI).
Acknowledgments
Special thanks for dr. Cristina Pachiu, for the morphological characterization.
Conflicts of Interest
The authors declare no conflict of interest.
References
- Baranwal, J.; Barse, B.; Gatto, G.; Broncova, G.; Kumar, A. Electrochemical Sensors and Their Applications: A Review. Chemosensors 2022, 10, 363. [Google Scholar] [CrossRef]
- Santhosh, N.M.; Filipič, G.; Tatarova, E.; Baranov, O.; Kondo, H.; Sekine, M.; Hori, M.; Ostrikov, K. (Ken); Cvelbar, U. Oriented Carbon Nanostructures by Plasma Processing: Recent Advances and Future Challenges. Micromachines 2018, 9, 565. [Google Scholar] [CrossRef] [PubMed]
- Roy, P.K.; Haider, G.; Chou, T.-C.; Chen, K.-H.; Chen, L.-C.; Chen, Y.-F.; Liang, C.-T. Ultrasensitive Gas Sensors Based on Vertical Graphene Nanowalls/SiC/Si Heterostructure. ACS Sensors 2019, 4, 406–412. [Google Scholar] [CrossRef] [PubMed]
- Wang, Z.; Xue, L.; Li, M.; Li, C.; Li, P.; Li, H. Au@SnO2-Vertical Graphene-Based Microneedle Sensor for in-Situ Determination of Abscisic Acid in Plants. Materials Science and Engineering: C 2021, 127, 112237. [Google Scholar] [CrossRef] [PubMed]
- Anghel, E.; Adiaconita, B.; Demetrescu, I.; Avram, A. A Review of Vertical Graphene and Its Biomedical Applications. Coatings 2023, 13. [Google Scholar] [CrossRef]
- Li, M.; Zeng, Y.; Huang, Z.; Zhang, L.; Liu, Y. Vertical Graphene-Based Printed Electrochemical Biosensor for Simultaneous Detection of Four Alzheimer’s Disease Blood Biomarkers. Biosensors 2023, 13. [Google Scholar] [CrossRef] [PubMed]
- Liu, Y.; Liu, X.; Li, M.; Liu, Q.; Xu, T. Portable Vertical Graphene@Au-Based Electrochemical Aptasensing Platform for Point-of-Care Testing of Tau Protein in the Blood. Biosensors 2022, 12. [Google Scholar] [CrossRef]
- Hasan, M.R.; Ahommed, M.S.; Daizy, M.; Bacchu, M.S.; Ali, M.R.; Al-Mamun, M.R.; Saad Aly, M.A.; Khan, M.Z.H.; Hossain, S.I. Recent Development in Electrochemical Biosensors for Cancer Biomarkers Detection. Biosensors and Bioelectronics: X 2021, 8, 100075. [Google Scholar] [CrossRef]
- Chiorcea-Paquim, A.-M. Advances in Electrochemical Biosensor Technologies for the Detection of Nucleic Acid Breast Cancer Biomarkers. Sensors 2023, 23. [Google Scholar] [CrossRef]
- Dong, M.; Gao, Z.; Zhang, Y.; Cai, J.; Li, J.; Xu, P.; Jiang, H.; Gu, J.; Wang, J. Ultrasensitive Electrochemical Biosensor for Detection of Circulating Tumor Cells Based on a Highly Efficient Enzymatic Cascade Reaction. RSC Advances 2023, 13, 12966–12972. [Google Scholar] [CrossRef]
- Fu, E.; Khederlou, K.; Lefevre, N.; Ramsey, S.A.; Johnston, M.L.; Wentland, L. Progress on Electrochemical Sensing of Pharmaceutical Drugs in Complex Biofluids. Chemosensors 2023, 11. [Google Scholar] [CrossRef]
- Montero-Arevalo, B.; Seufert, B.I.; Hossain, M.S.; Bernardin, E.; Takshi, A.; Saddow, S.E.; Schettini, N. SiC Electrochemical Sensor Validation for Alzheimer Aβ42 Antigen Detection. Micromachines 2023, 14, 1262. [Google Scholar] [CrossRef] [PubMed]
- Jing, A.; Zhang, C.; Liang, G.; Feng, W.; Tian, Z.; Jing, C. Hyaluronate-Functionalized Graphene for Label-Free Electrochemical Cytosensing. Micromachines 2018, 9, 669. [Google Scholar] [CrossRef] [PubMed]
- Dodevska, T.; Hadzhiev, D.; Shterev, I. Recent Advances in Electrochemical Determination of Anticancer Drug 5-Fluorouracil. ADMET & DMPK 2023, 11, 135–150. [Google Scholar] [CrossRef] [PubMed]
- Hajian, R.; Tayebi, Z.; Shams, N. Fabrication of an Electrochemical Sensor for Determination of Doxorubicin in Human Plasma and Its Interaction with DNA. Journal of Pharmaceutical Analysis 2017, 7, 27–33. [Google Scholar] [CrossRef] [PubMed]
- Gholivand, M.B.; Ahmadi, E.; Mavaei, M. A Novel Voltammetric Sensor Based on Graphene Quantum Dots-Thionine/Nano-Porous Glassy Carbon Electrode for Detection of Cisplatin as an Anti-Cancer Drug. Sensors and Actuators B: Chemical 2019, 299, 126975. [Google Scholar] [CrossRef]
- Heydari-Bafrooei, E.; Amini, M.; Saeednia, S. Electrochemical Detection of DNA Damage Induced by Bleomycin in the Presence of Metal Ions. Journal of Electroanalytical Chemistry 2017, 803, 104–110. [Google Scholar] [CrossRef]
- Nguyen, H.V.; Richtera, L.; Moulick, A.; Xhaxhiu, K.; Kudr, J.; Cernei, N.; Polanska, H.; Heger, Z.; Masarik, M.; Kopel, P.; et al. Electrochemical Sensing of Etoposide Using Carbon Quantum Dot Modified Glassy Carbon Electrode. Analyst 2016, 141, 2665–2675. [Google Scholar] [CrossRef]
- Hrichi, H.; Monser, L.; Adhoum, N. Selective Electrochemical Determination of Etoposide Using a Molecularly Imprinted Overoxidized Polypyrrole Coated Glassy Carbon Electrode. International Journal of Electrochemistry 2019, 2019, 5394235. [Google Scholar] [CrossRef]
- Tzouvadaki, I.; Aliakbarinodehi, N.; Dávila Pineda, D.; De Micheli, G.; Carrara, S. Graphene Nanowalls for High-Performance Chemotherapeutic Drug Sensing and Anti-Fouling Properties. Sensors and Actuators B: Chemical 2018, 262, 395–403. [Google Scholar] [CrossRef]
- Enna, S.J.; Bylund, D.B. XPharm: The Comprehensive Pharmacology Reference; Elsevier: Amsterdam, 2008; ISBN 978-0-08-055232-3. [Google Scholar]
- Izbicki, G.; Segel, M.J.; Christensen, T.G.; Conner, M.W.; Breuer, R. Time Course of Bleomycin-Induced Lung Fibrosis. Int J Exp Pathol 2002, 83, 111–119. [Google Scholar] [CrossRef] [PubMed]
- Dorr, R.T. Bleomycin Pharmacology: Mechanism of Action and Resistance, and Clinical Pharmacokinetics. Semin Oncol 1992, 19, 3–8. [Google Scholar] [PubMed]
- Toffoli, G.; Corona, G.; Basso, B.; Boiocchi, M. Pharmacokinetic Optimisation of Treatment with Oral Etoposide. Clin Pharmacokinet 2004, 43, 441–466. [Google Scholar] [CrossRef] [PubMed]
- Tincu, B.; Burinaru, T.; Enciu, A.-M.; Preda, P.; Chiriac, E.; Marculescu, C.; Avram, M.; Avram, A. Vertical Graphene-Based Biosensor for Tumor Cell Dielectric Signature Evaluation. Micromachines 2022, 13, 1671. [Google Scholar] [CrossRef]
- Simionescu, O.-G.; Avram, A.; Adiaconiţă, B.; Preda, P.; Pârvulescu, C.; Năstase, F.; Chiriac, E.; Avram, M. Field-Effect Transistors Based on Single-Layer Graphene and Graphene-Derived Materials. Micromachines 2023, 14, 1096. [Google Scholar] [CrossRef]
|
Disclaimer/Publisher’s Note: The statements, opinions and data contained in all publications are solely those of the individual author(s) and contributor(s) and not of MDPI and/or the editor(s). MDPI and/or the editor(s) disclaim responsibility for any injury to people or property resulting from any ideas, methods, instructions or products referred to in the content. |
© 2024 by the authors. Licensee MDPI, Basel, Switzerland. This article is an open access article distributed under the terms and conditions of the Creative Commons Attribution (CC BY) license (http://creativecommons.org/licenses/by/4.0/).
