1. Introduction
Materials that can be controlled by external stimuli to cause dramatic changes in their properties are referred to as smart materials. Among the smart materials that can be affected by the magnetic field are magnetorheological (MR) fluids. The MR fluids behave like Newtonian Fluids under normal conditions, meaning that their magnetic particles can move freely in the absence of a magnetic field. However, when the magnetic field is applied, the structure of the fluids transforms into a solid-like structure and the particles will form chain structures which are known as Bingham Plastic materials [
1,
2]. The iron particles evenly disperse to the carrier fluids in milliseconds after the magnetic field is removed, making it possible to control the MR effect almost in real-time conditions. Because of these characteristics, MR fluids are widely used in various device applications including MR clutches [
3,
4,
5], MR brakes [
6,
7,
8,
9], MR dampers [
10,
11,
12,
13,
14], and MR mounts [
15]. Another technology for material removal [
16,
17] and medical devices was also proposed [
18,
19,
20]. Furthermore, MR fluids have been utilized extensively in surface precision machining in recent years. Even though surface precision machining using MR fluids technology has a better machining result than traditional machining, sedimentation may affect the machining precision. Specifically, the machining accuracy is highly dependent on the size, shape, channel length, and current input [
21,
22,
23,
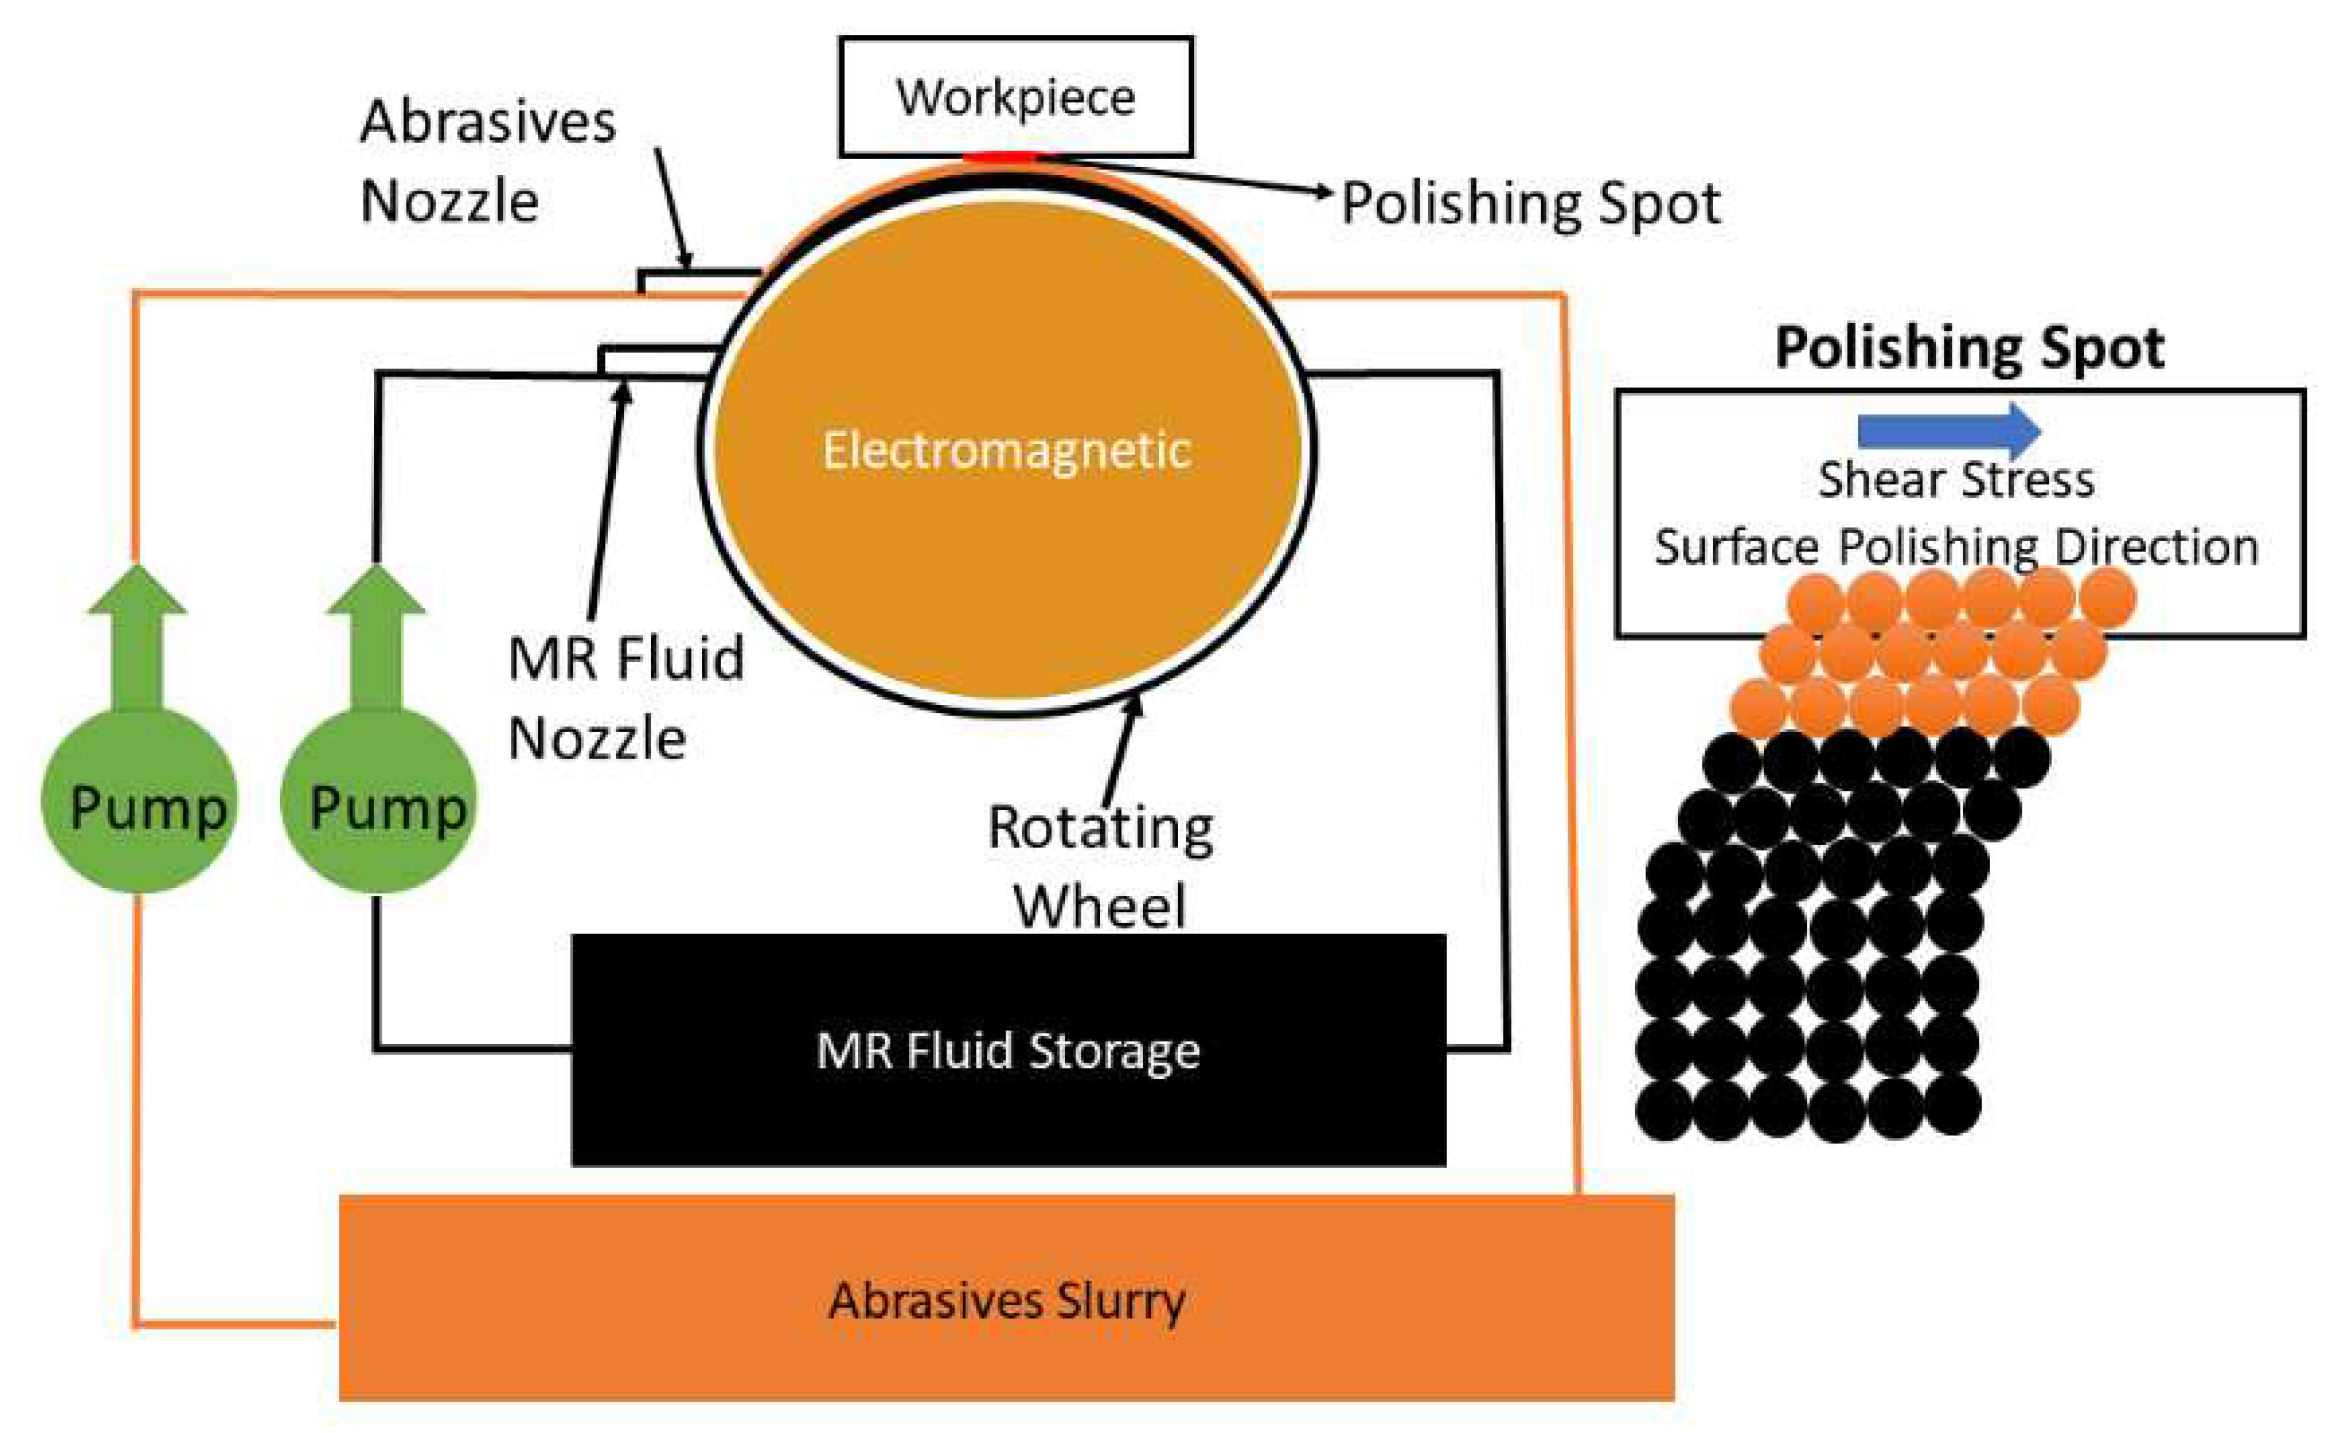
24]. This may impact the magnetorheological properties related to surface area elimination. The general process and the scheme of surface precision machining are portrayed in
Figure 1, respectively. The process of the polishing medium will be circulated cycling in and out through the MR fluids storage and abrasives slurry. Then, abrasives and carbonyl iron particles are spread throughout the carrier fluids to form the polishing medium.
Generally, MR fluids contain carbonyl iron particles and carrier fluids which have a density of around 7.5 g/cm3 and 1 g/cm3 respectively [
25]. This significant difference in density may cause the relative motion in the settlement of the carbonyl iron particles on the bottom under the influence of gravity over time which is called sedimentation. Sedimentation of MR fluids itself has an impact on the fluids’ performance and longevity, and frequent disposal of the fluids may lead to a severe environmental impact [
26]. Since sedimentation is considered a serious problem for commercial applications, many researchers have developed many methods to prevent sedimentation. The capability of MR fluids to stand against the settling particle is usually called sedimentation stability. Various developments for the improvement of sedimentation stability have been conducted including modifying the particles, modifying the carrier fluids, adding additives, and combining the mentioned methods [
1]. A previous study by K. Shah et al. [
27] modified the particles to plate-like iron particles which proved that it could reduce sedimentation by testing the modified MR fluids to the small-sized damper. Another development by modifying carrier fluids was done by S. Zhibin et al. [
28] By using molybdenum disulfide as the lubricant, the result showed the improvement of the anti-sedimentation in the MR fluids because it generated a good wetting effect, high zero-field viscosity, and a small contact angle. In addition, H. Cheng et al. [
29] experimented by adding additives by coating the surface of iron particles with organic molecules which resulted in an increment of suspension stability and a reduction of the sedimentation rate without significantly reducing the MR effect. Furthermore, the study of combining the modified magnetic particles, carrier fluids, and additives was done and resulted in good stability against sedimentation [
30,
31,
32]. However, these methods are not applicable and useable yet for practical applications such as MR damper since they need a certain response time and MR performance [
1]. Therefore, another method to improve the sedimentation stability in an applicable way for the commercialized MR fluids needs to be proposed to develop MR fluids application.
It was found that recent studies only conducted experiments based on a constant magnetic field influence which is associated with the measurement methods of sedimentation. A study by K.P. Lijesh et al. [
33] used a 1 T Neodymium magnet (constant magnetic field) to generate a uniform magnetic field to measure the settling particles by utilizing the hall sensors. The testing parameters for the study were MR fluids with three different surfactants (tetramethylammonium hydroxide, citric acid, and oleic acid) without any magnetism influence. By comparing the voltage value of the sedimentation profile that was measured using Data Acquisition Systems through the hall sensors, the results showed that MR fluids with DTE oil and 10% carbonyl iron had the highest settling time. Another experimental study by M.T. López-López et al. [
34] used Helmholtz coils to generate a vertical direction of low intensity which was 0.73 mT in the form of an AC magnetic field. The sensing coil was also placed around the MR fluids which induced electromotive force. The results showed that the volume fraction of the magnetic particles decreased around the sensing coil region to affect the samples of MR fluids. Recently, J. Roupec et al. [
35] proposed a study using the coil windings placed on guide steel to generate a magnetic field around the MR fluids. The experiment was performed with a constant current input of 0.108 A of a switch power supply generating an electromagnetic field of approximately 7.9 mT. The study applied a lower magnetic field to increase the sensitivity of the hall probe measurement and prevent the measurement from being affected by the magnetic field. The result of the study compared the accuracy of the proposed measurement with the visual observation.
As mentioned before, recent studies of surface precision machining using MR fluids also consider sedimentation as a crucial problem that needs to be prevented since it influences machining accuracy. The effort for this was only by coating the iron particles using silica which was proposed by K.P. Hong et. al. [
36]. In general, MR devices are operated under different magnetic field strengths to achieve the desired device’s performance. However, the resting time of the devices over a long period leads to the sedimentation of MR fluids which can decrease the devices’ performance. Theoretically, when MR fluids are under zero magnetic field intensity (off-state condition), the iron particles will settle down over time which is caused by the gravity, buoyancy, resistance movement, and viscous drag of carrier fluids. Whereas, when MR fluids are under magnetic field intensity (on-state condition), the iron particles will form a chain-like structure following the direction of the magnetic field. These characteristics may be a crucial parameter to prevent MR fluids sedimentation. Nonetheless, as mentioned before, the efforts of improving the sedimentation stability in recent studies focused only on modifying the particles, modifying the carrier fluids, adding additives, and combining the methods. As far as the authors know, there is a very few studies only on the sedimentation stability with respect to the different current magnitudes and wave types even though these parameters are crucial parameters affecting to the particle sedimentation.
Consequently, the main technical contribution of this work is to provide new results on the sedimentation behavior of the magnetic particles of MR fluid by adopting the “input current (external magnetic field)” as a crucial parameter. In this work, three factors regarding to the input current are used: current magnitude, current profile (wave) and diameter of the channel. It is note here that the width of the channel (diameter) will affect the sedimentation since the gap of the walls impedes the movement of the particles result in different sedimentation [
37]. In this work, the sedimentation is measured by visual observation and the sedimentation rate is defined considering the initial height and settled height. The hall sensor is also used to monitor the generated magnetic field since the current magnitudes are varied. It should be remarked that the first two parameters of the current magnitudes are significant to determine an appropriate controller of certain MR application systems in terms of maximum current and controlled current wave. In the other hand, the third parameter is crucial to determine an appropriate diameter in which MR fluid can flow smoothly at the off-state and a generate the maximum magnetic field with the same current magnitude at the on-state.
2. Materials and Methods
2.1. Magnetic Analysis
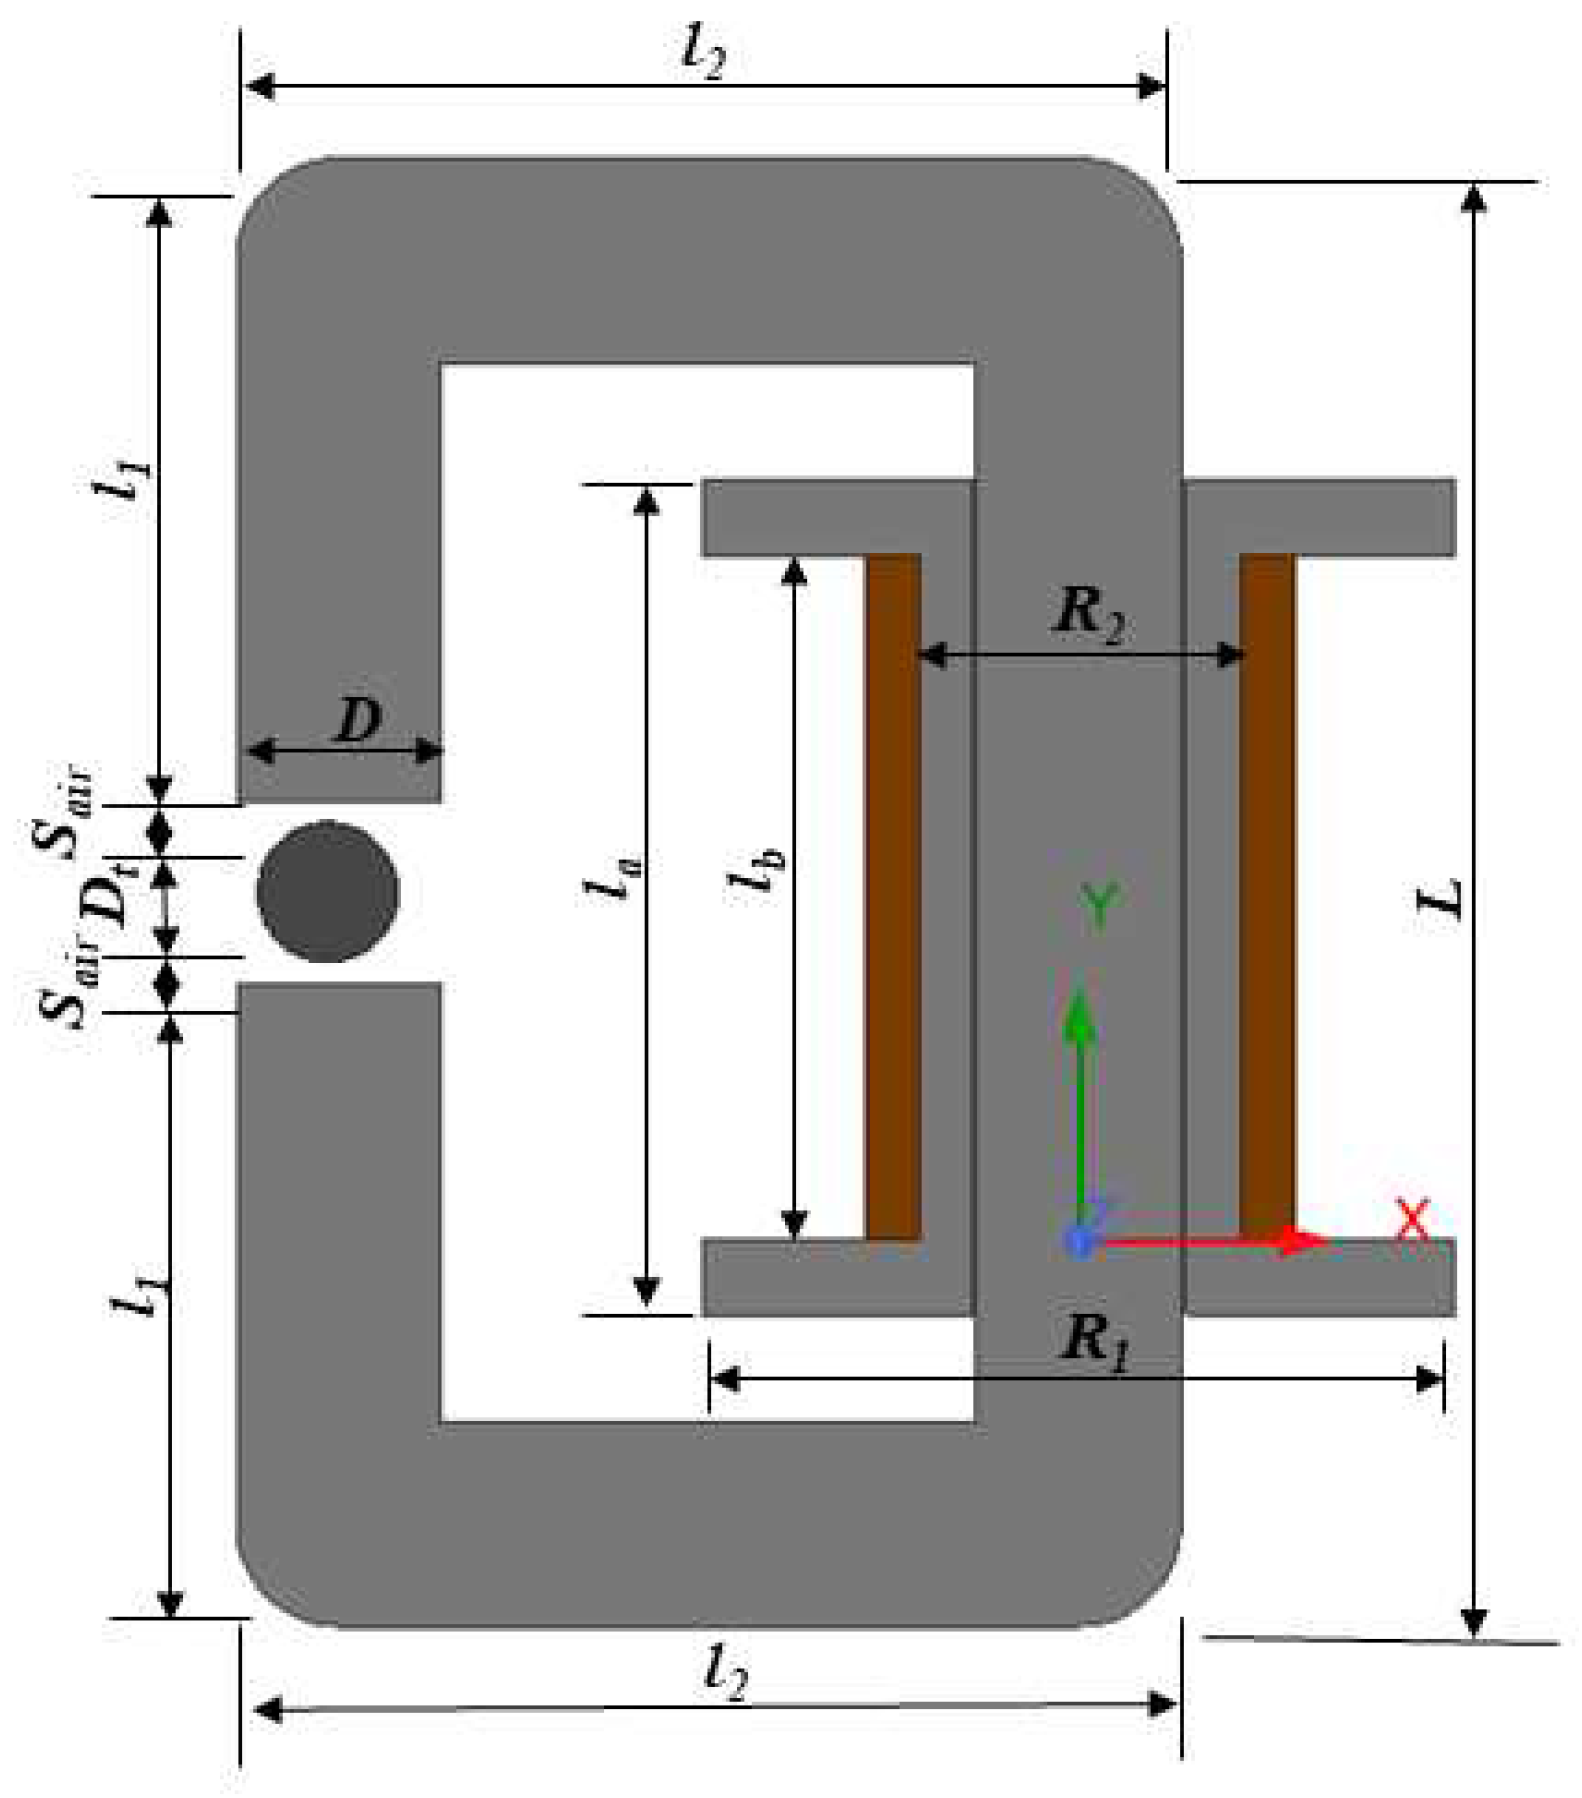
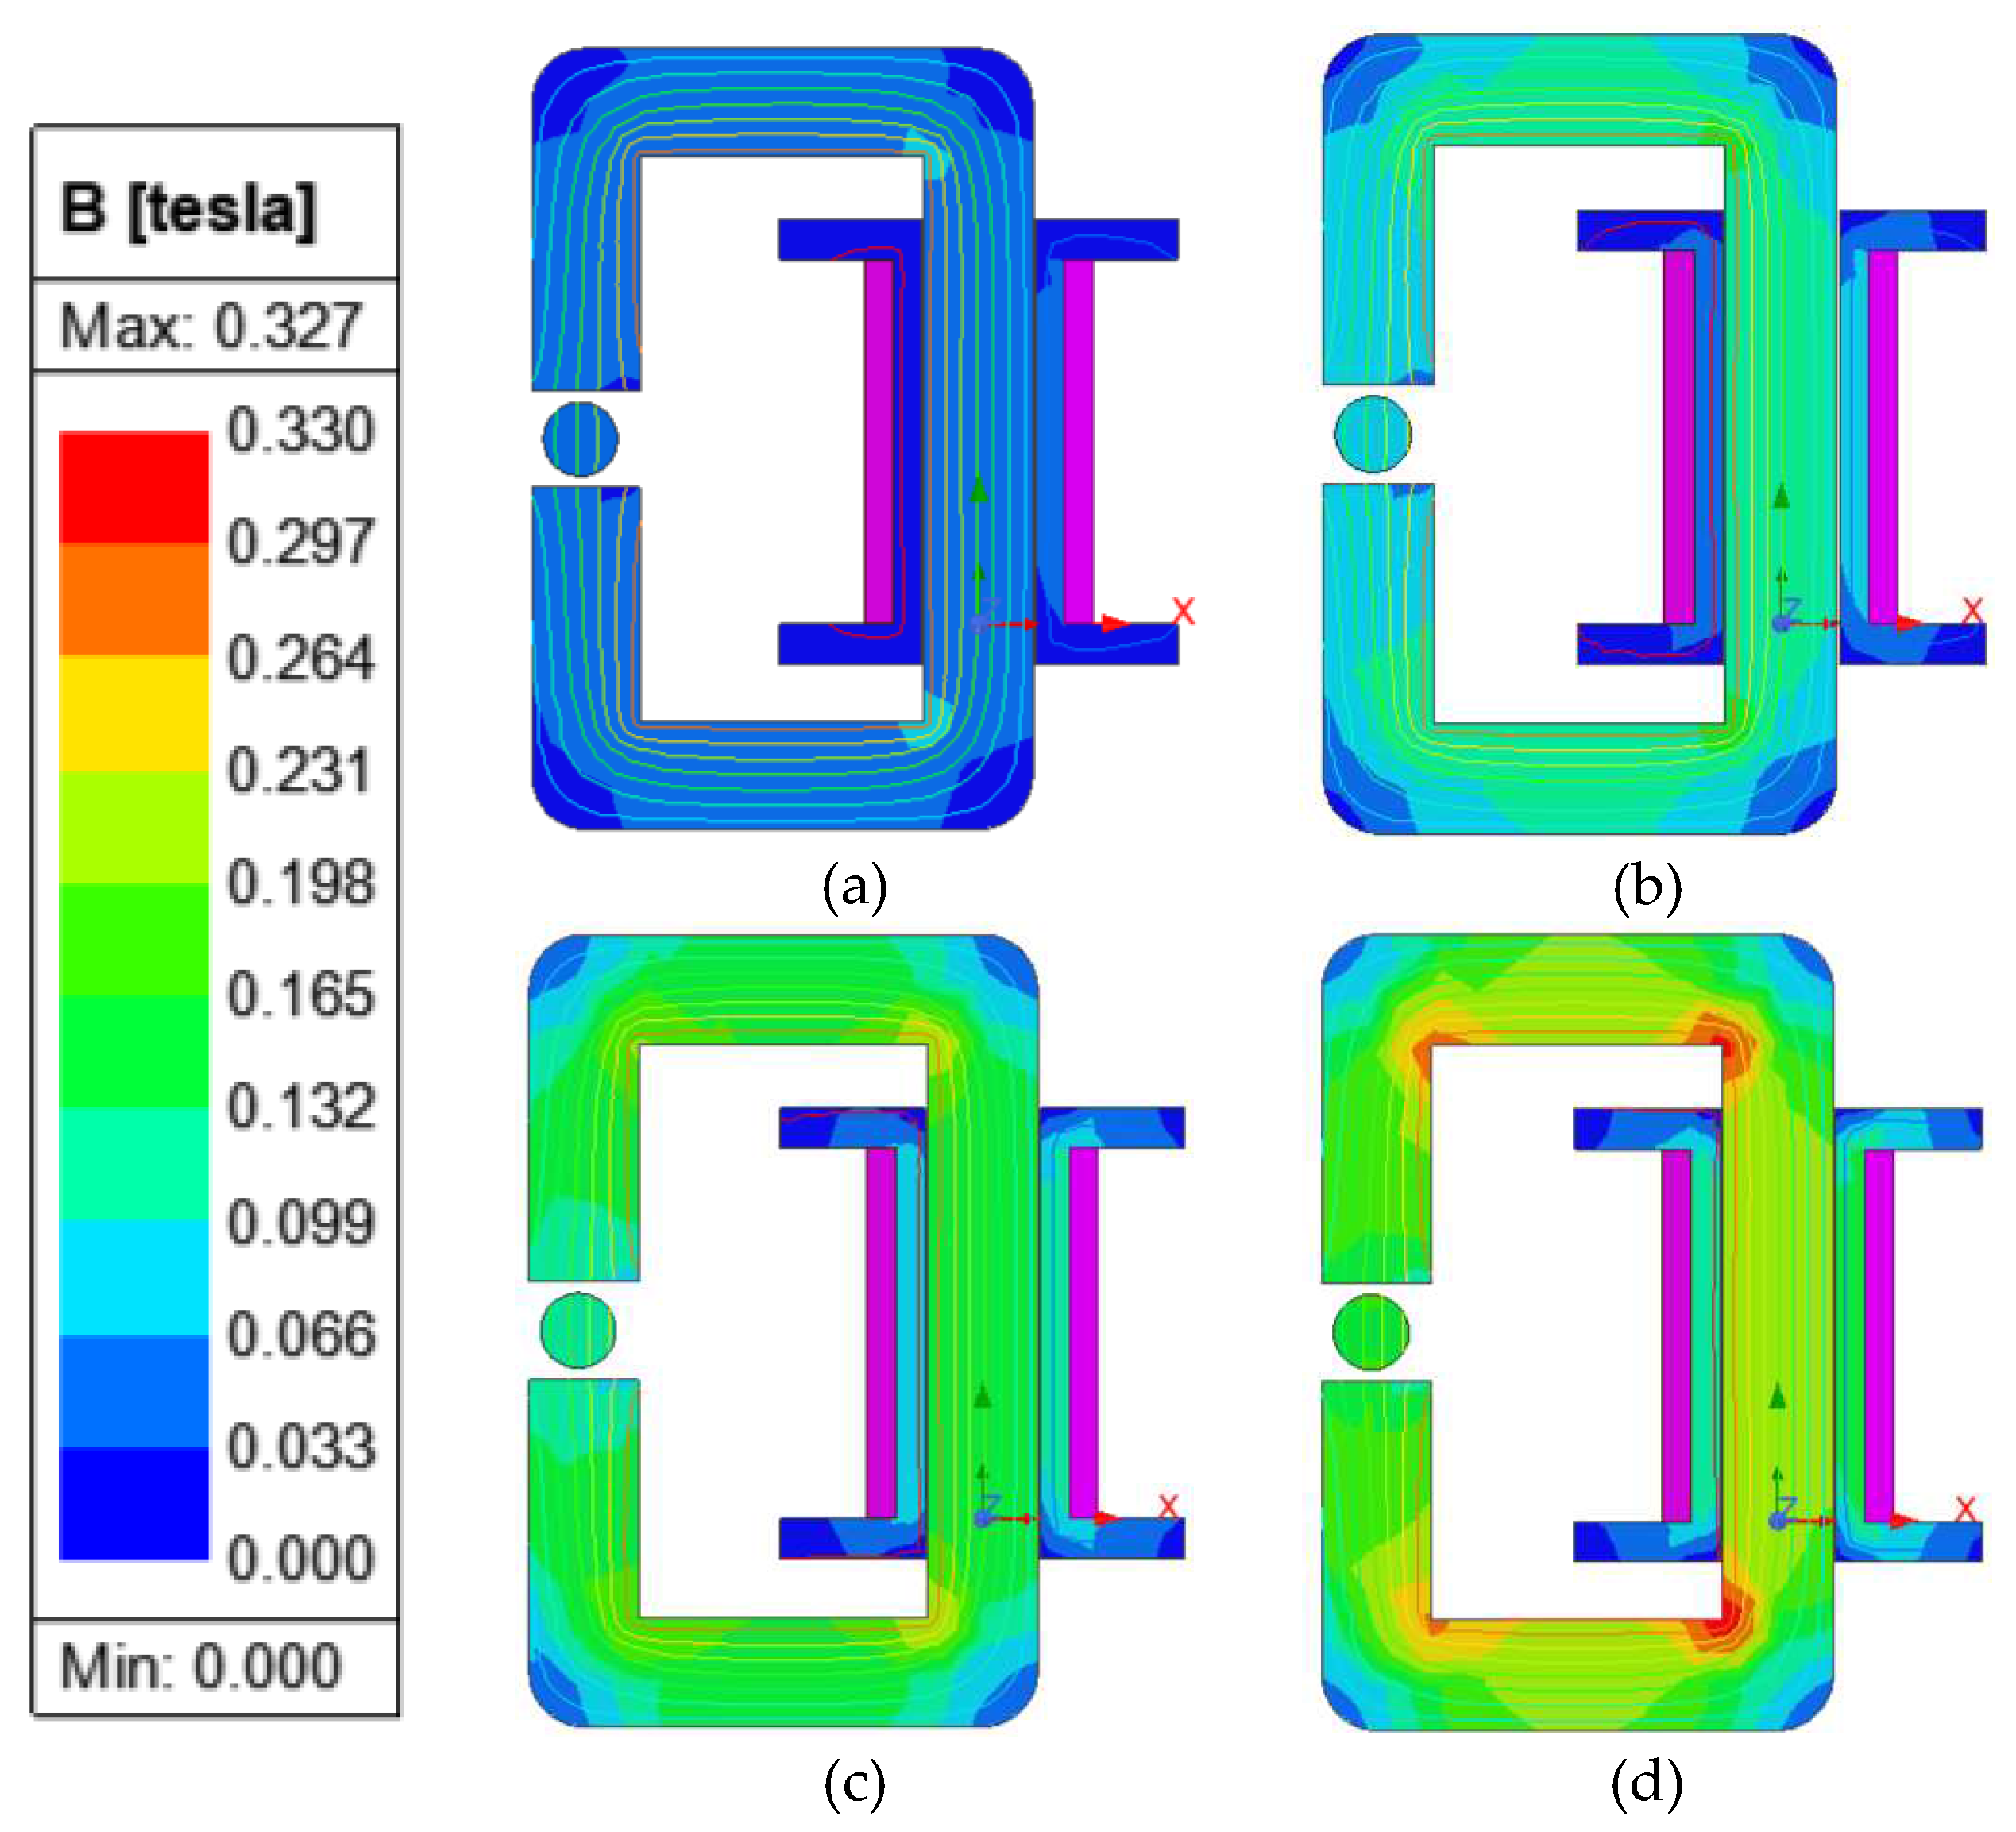
The transient magnetic simulation was conducted using the software ANSYS Maxwell to confirm the generated magnetic flux density and the flux lines region. The generated magnetic flux path from the electromagnetic circuit should be uniformly formed around the MR fluids. The initial stage of the simulation was designing the geometry in a cross-section model depicted in
Figure 2, with the details of parameters as shown in
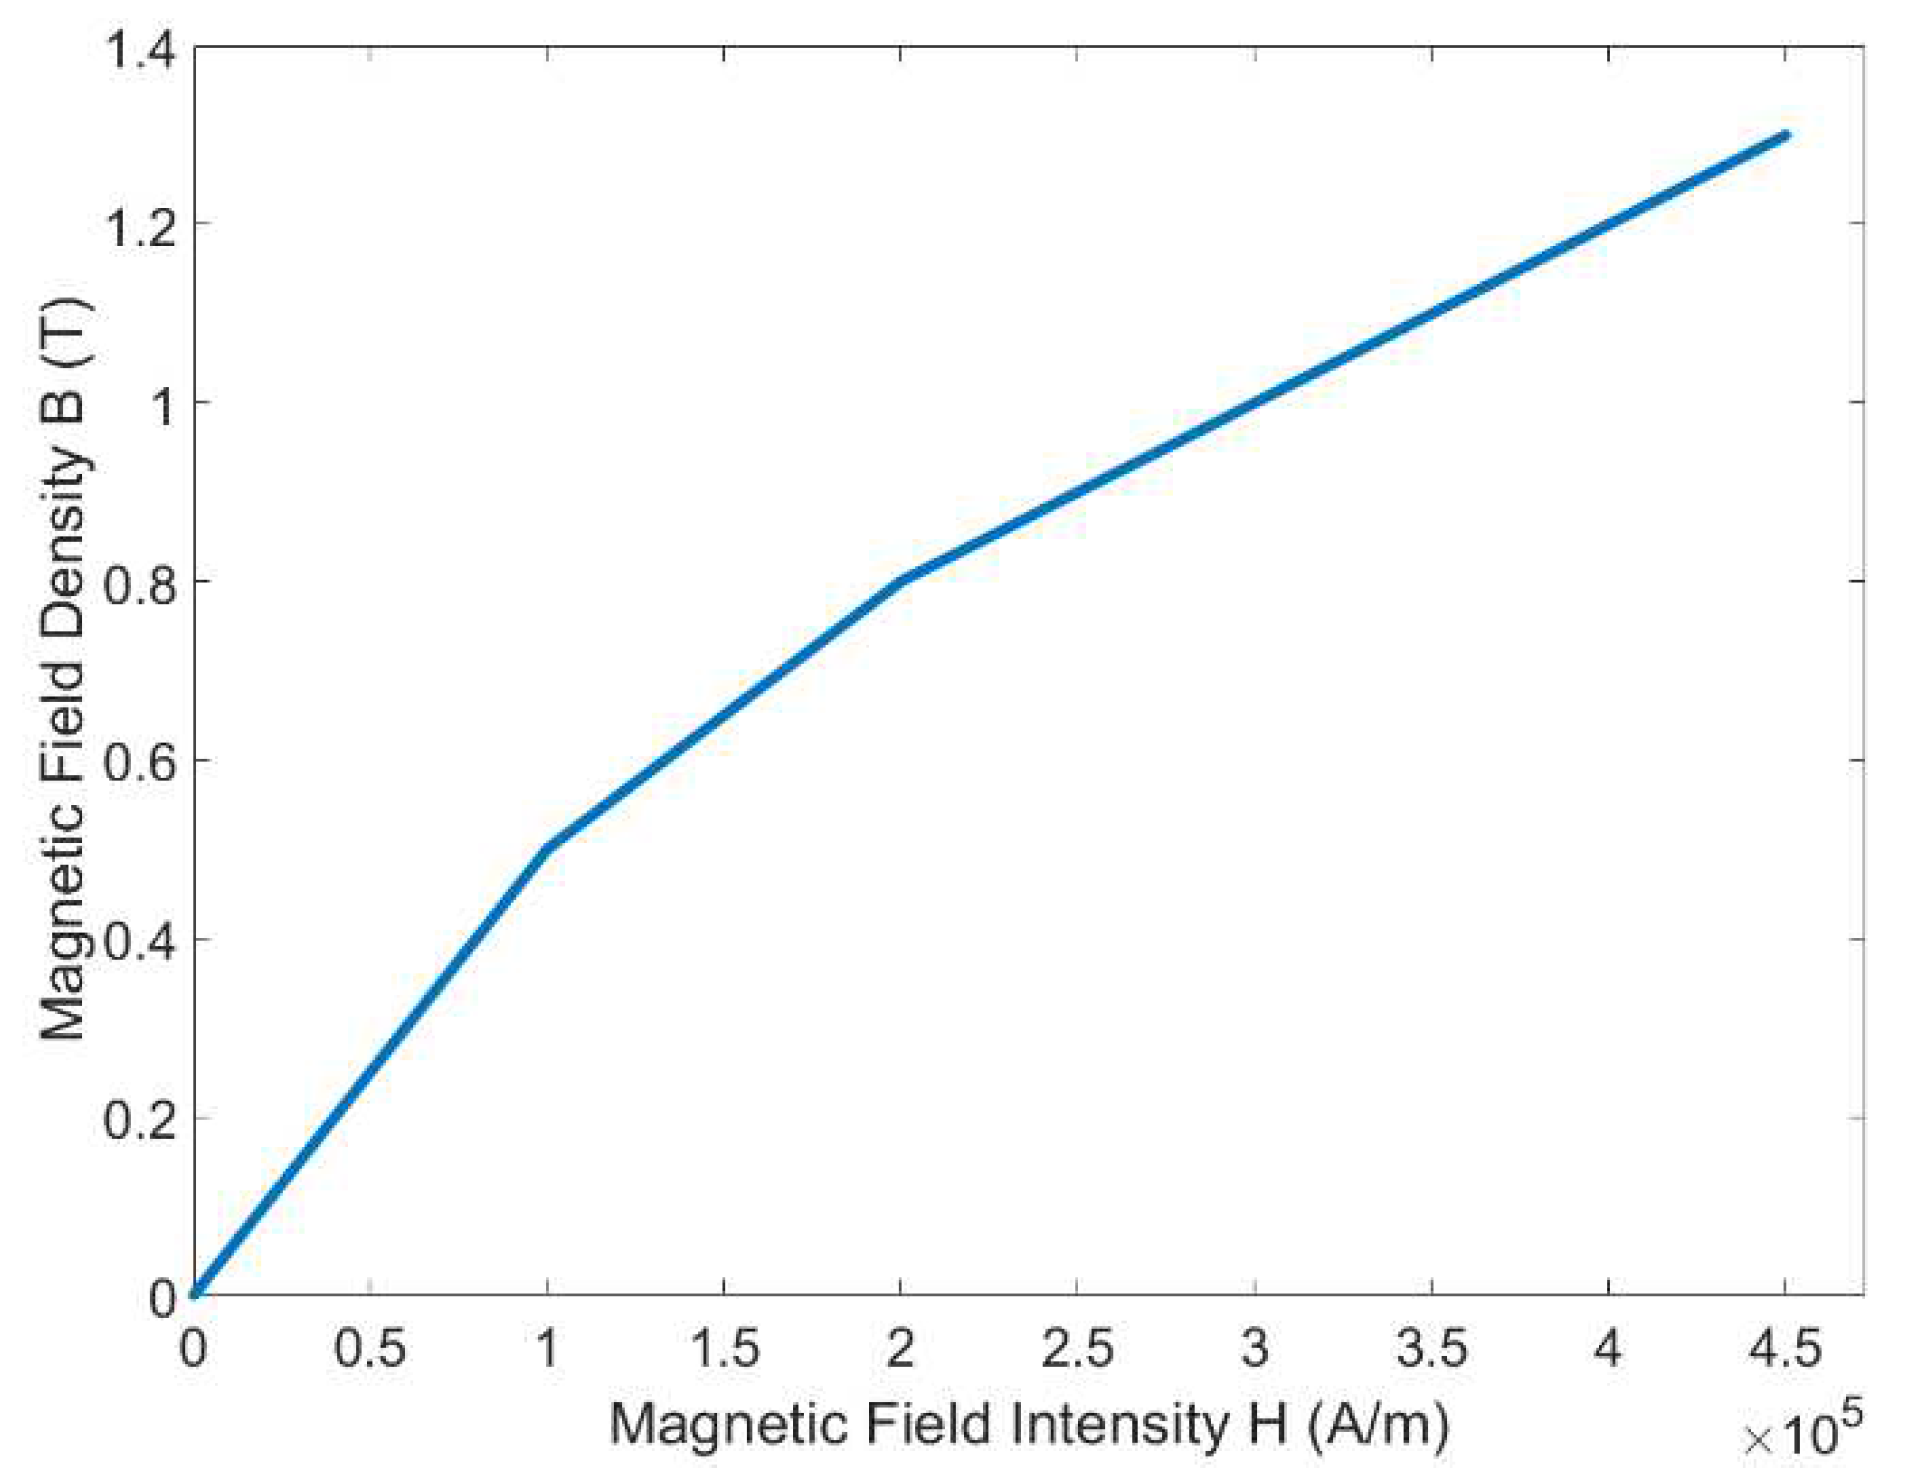
Table 1. By adding the air gap between the MR fluids and the magnetic circuit, it can decrease the resistance of the magnetic circuit which can increase the magnetic flux density around the gap. Subsequently, the boundary, excitations, and mesh were assigned to the simulation to acquire the analysis result of the magnetic fields. Steel 1008 was chosen as the material for the magnetic circuit. In addition, a copper wire with a diameter of 1 mm was wound approximately 500 turns around the steel bobbin. Commercialized MR fluids 132-DG by LORD Corporation which has typical properties and magnetic properties that can be seen in
Table 2 and
Figure 3 were also added. The different colors of the results represent the strength of the generated electromagnetic field as seen in
Figure 4. The simulation was done in four different currents (0.5 A, 1 A, 1.5 A, and 2 A) with the generated magnetic flux density around the MR fluids of 0.038 Tesla, 0.069 Tesla, 0.102 Tesla, and 0.135 Tesla, respectively. By increasing the current input, the magnetic flux density gets stronger. The lines that are shown in
Figure 4 portray the covered area of the magnetic flux within the magnetic circuit and MR fluids. A weak generated magnetic flux density was also not found around the MR fluids region. Therefore, the experimental setup and parameters of this study were conducted as the magnetic simulation for the optimum MR effect.
Figure 2.
Cross-section model of experimental setup.
Figure 2.
Cross-section model of experimental setup.
Table 1.
Parameters of cross-section model of experimental setup.
Table 1.
Parameters of cross-section model of experimental setup.
| Parameters |
Description |
Value |
Unit |
| D |
Magnetic Core Diameter |
19 |
mm |
| L |
Magnetic Core Length |
118 |
mm |
| l1 |
Magnetic Core Length |
50.5 |
mm |
| l2 |
Magnetic Core Length |
88 |
mm |
| R1 |
Bobbin Outer Radius |
35 |
mm |
| R2 |
Bobbin Inner Radius |
10 |
mm |
| la |
Bobbin Total Length |
78 |
mm |
| lb |
Bobbin Length |
64 |
mm |
| r |
Coil Radius |
0.5 |
mm |
| N |
Coil Winding |
500 |
mm |
| Sair |
Air Gap Length |
2 |
mm |
| Dt |
MR Fluids Tube Diameter |
13 |
mm |
| h |
MR Fluids Tube Height |
100 |
mm |
Table 2.
The typical properties of MR fluids 132-DG.
Table 2.
The typical properties of MR fluids 132-DG.
| Parameters |
Value |
Unit |
| Viscosity |
0.112 |
Pa-s |
| Density |
2.95-3.15 |
g/cm3
|
| Solid Content by Weight |
80.90 |
W% |
| Flash Point |
>150 |
℃ |
| Temperature |
-40 to +130 |
℃ |
Figure 3.
B-H curve of MR fluids 132-DG.
Figure 3.
B-H curve of MR fluids 132-DG.
Figure 4.
The result of the magnetic field analysis in a different current input, (a) 0.5 A, (b) 1 A, (c) 1.5 A, (d) 2 A.
Figure 4.
The result of the magnetic field analysis in a different current input, (a) 0.5 A, (b) 1 A, (c) 1.5 A, (d) 2 A.
2.2. Experimental Setup
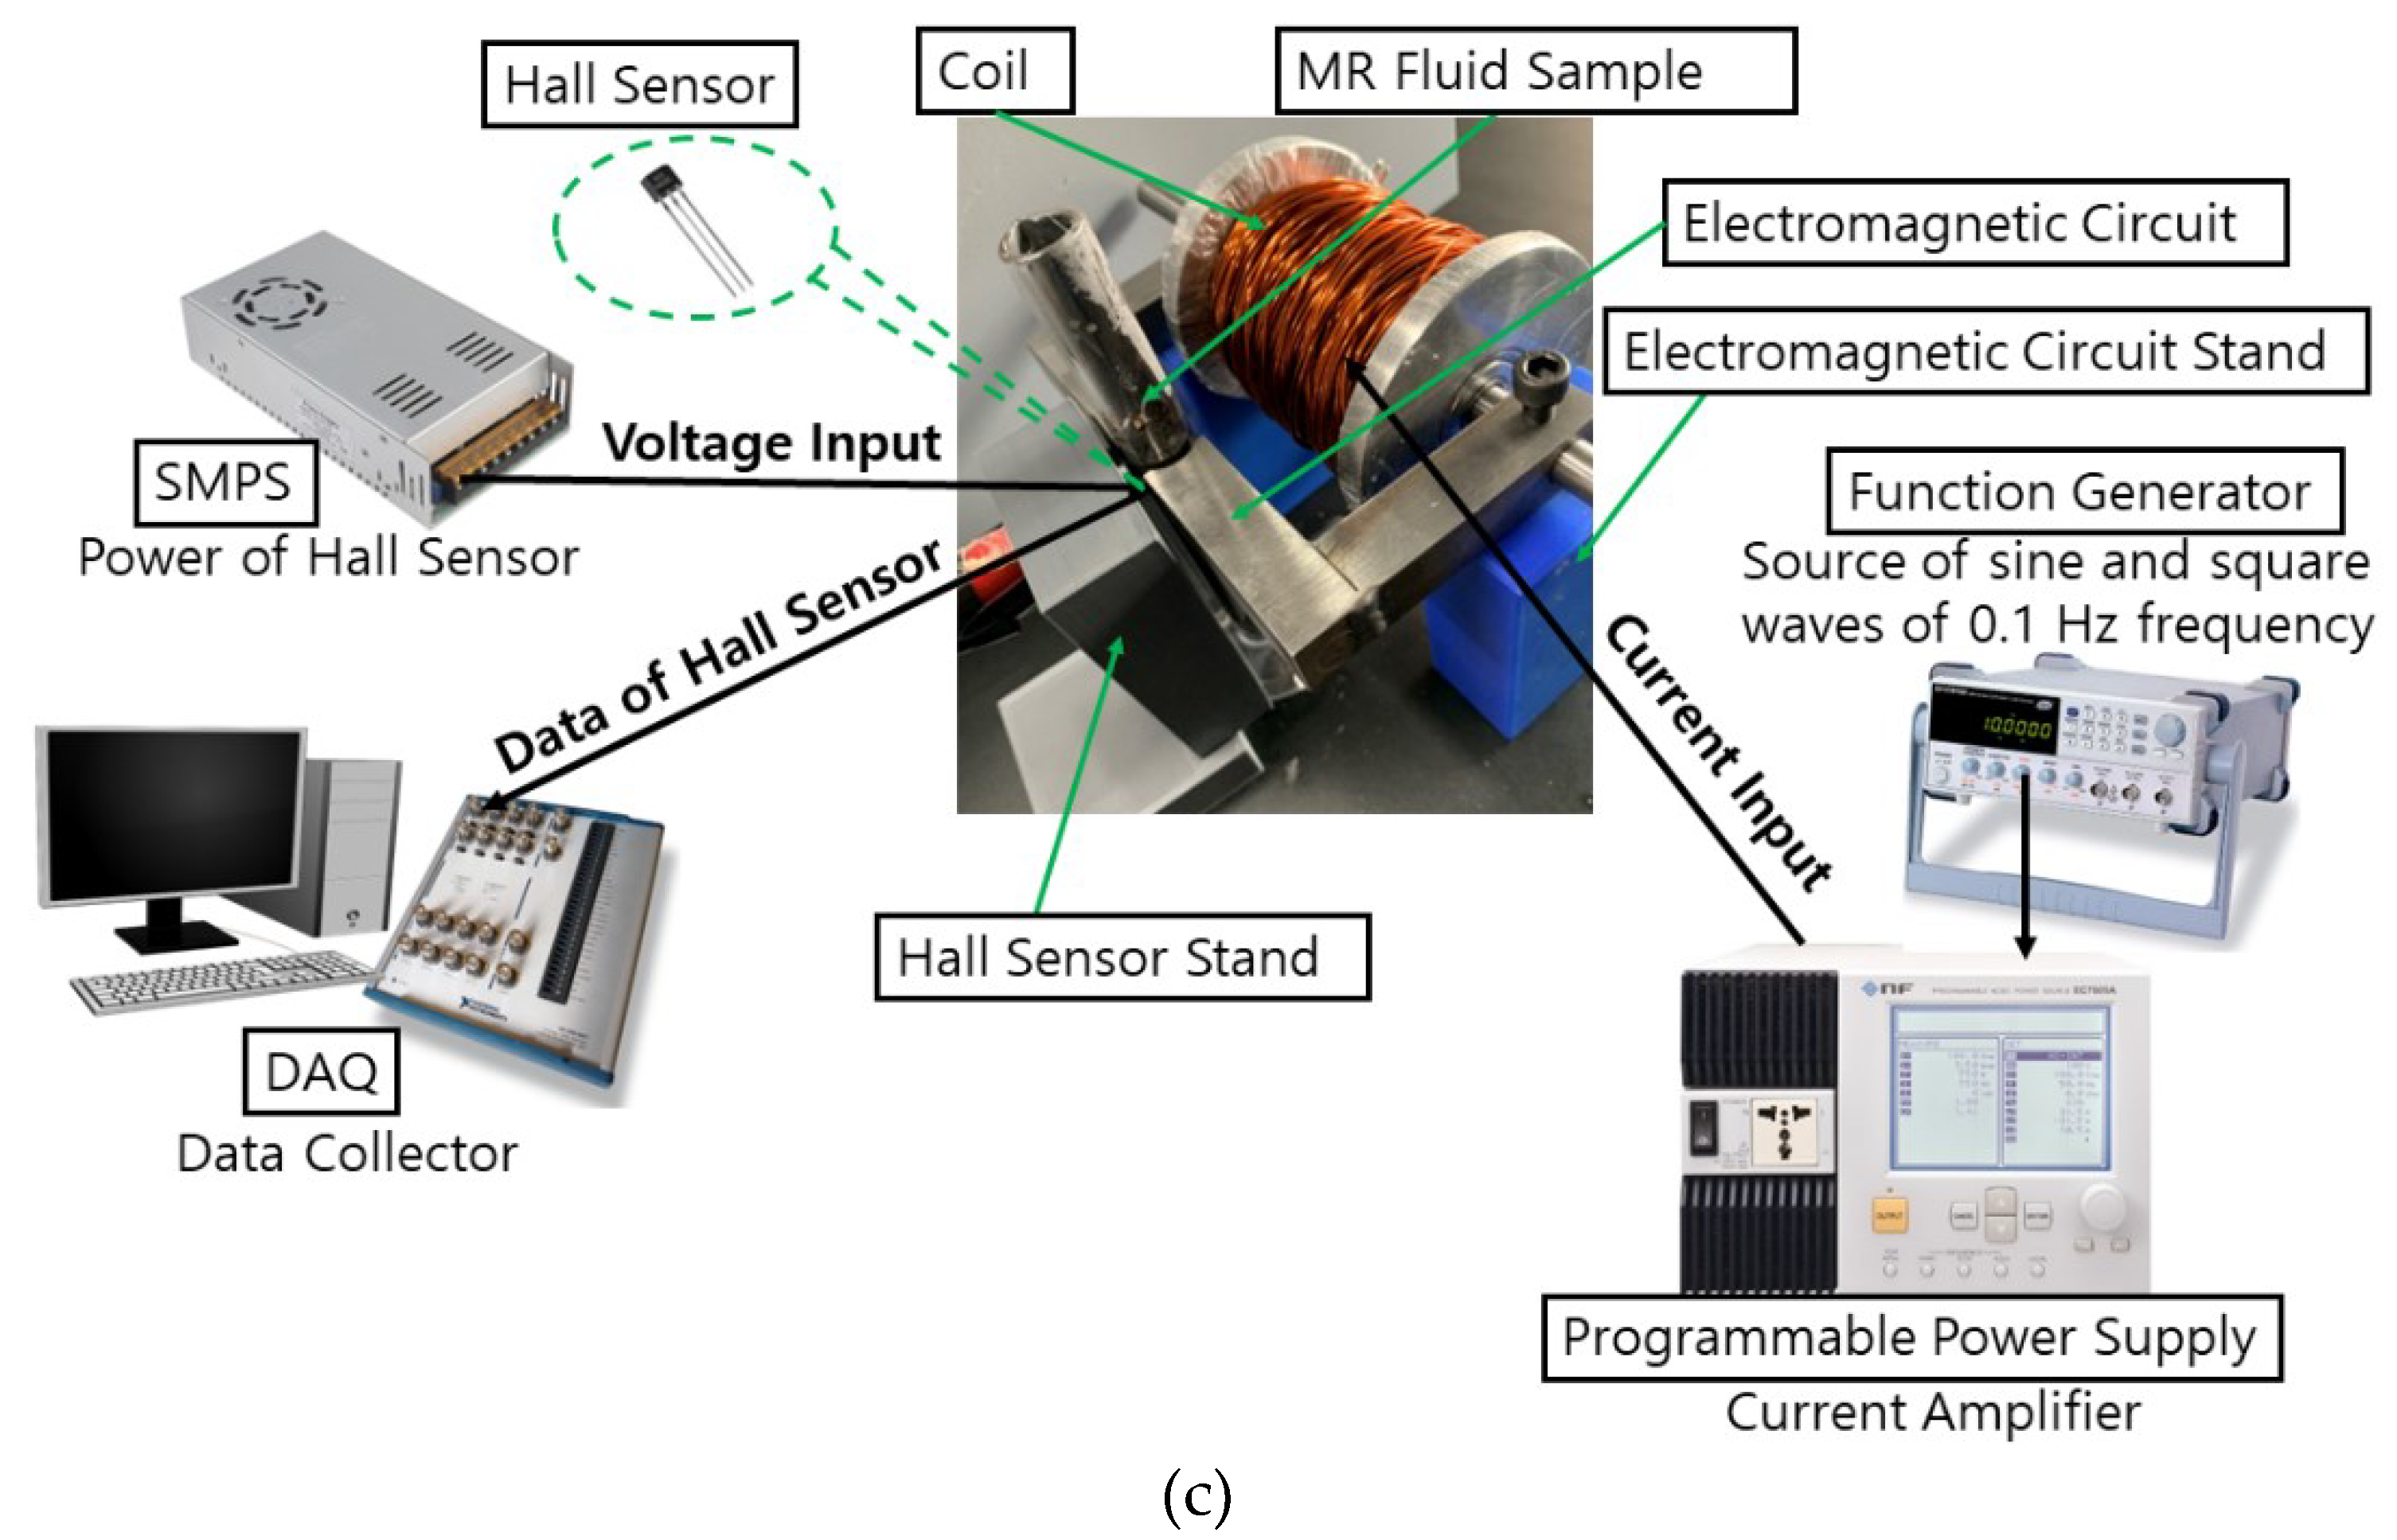
A programmable power supply (NF. EC750SA, Programmable AC/DC Power Source, NF Corporation, Inc., Yokohama, Japan) was used to control the current input and wave types. The setting output was set to AC+DC-EXT since the signal of sine and square wave with a low frequency from the function generator (GW INSTEK SFG-2104) can be amplified using this mode. It is noted that sedimentation happens when the iron particles settle against the surface of the fluids over time because of gravitational forces. Since the application of the MR effect can be controlled in only milliseconds, influencing iron particles using electromagnetic fields can improve sedimentation stability. Thus, higher current input and lower frequency were considered as experimental parameters since the magnetism will be stronger so the iron particles will be difficult to settle down. Since the considered parameters of the experiment were varied, the experiment of this study was conducted with ten different testing parameters considering the various current input intensity, wave excitation, and diameter of the measuring tube (13 mm and 15 mm) that can be seen in
Table 3 and
Table 4.
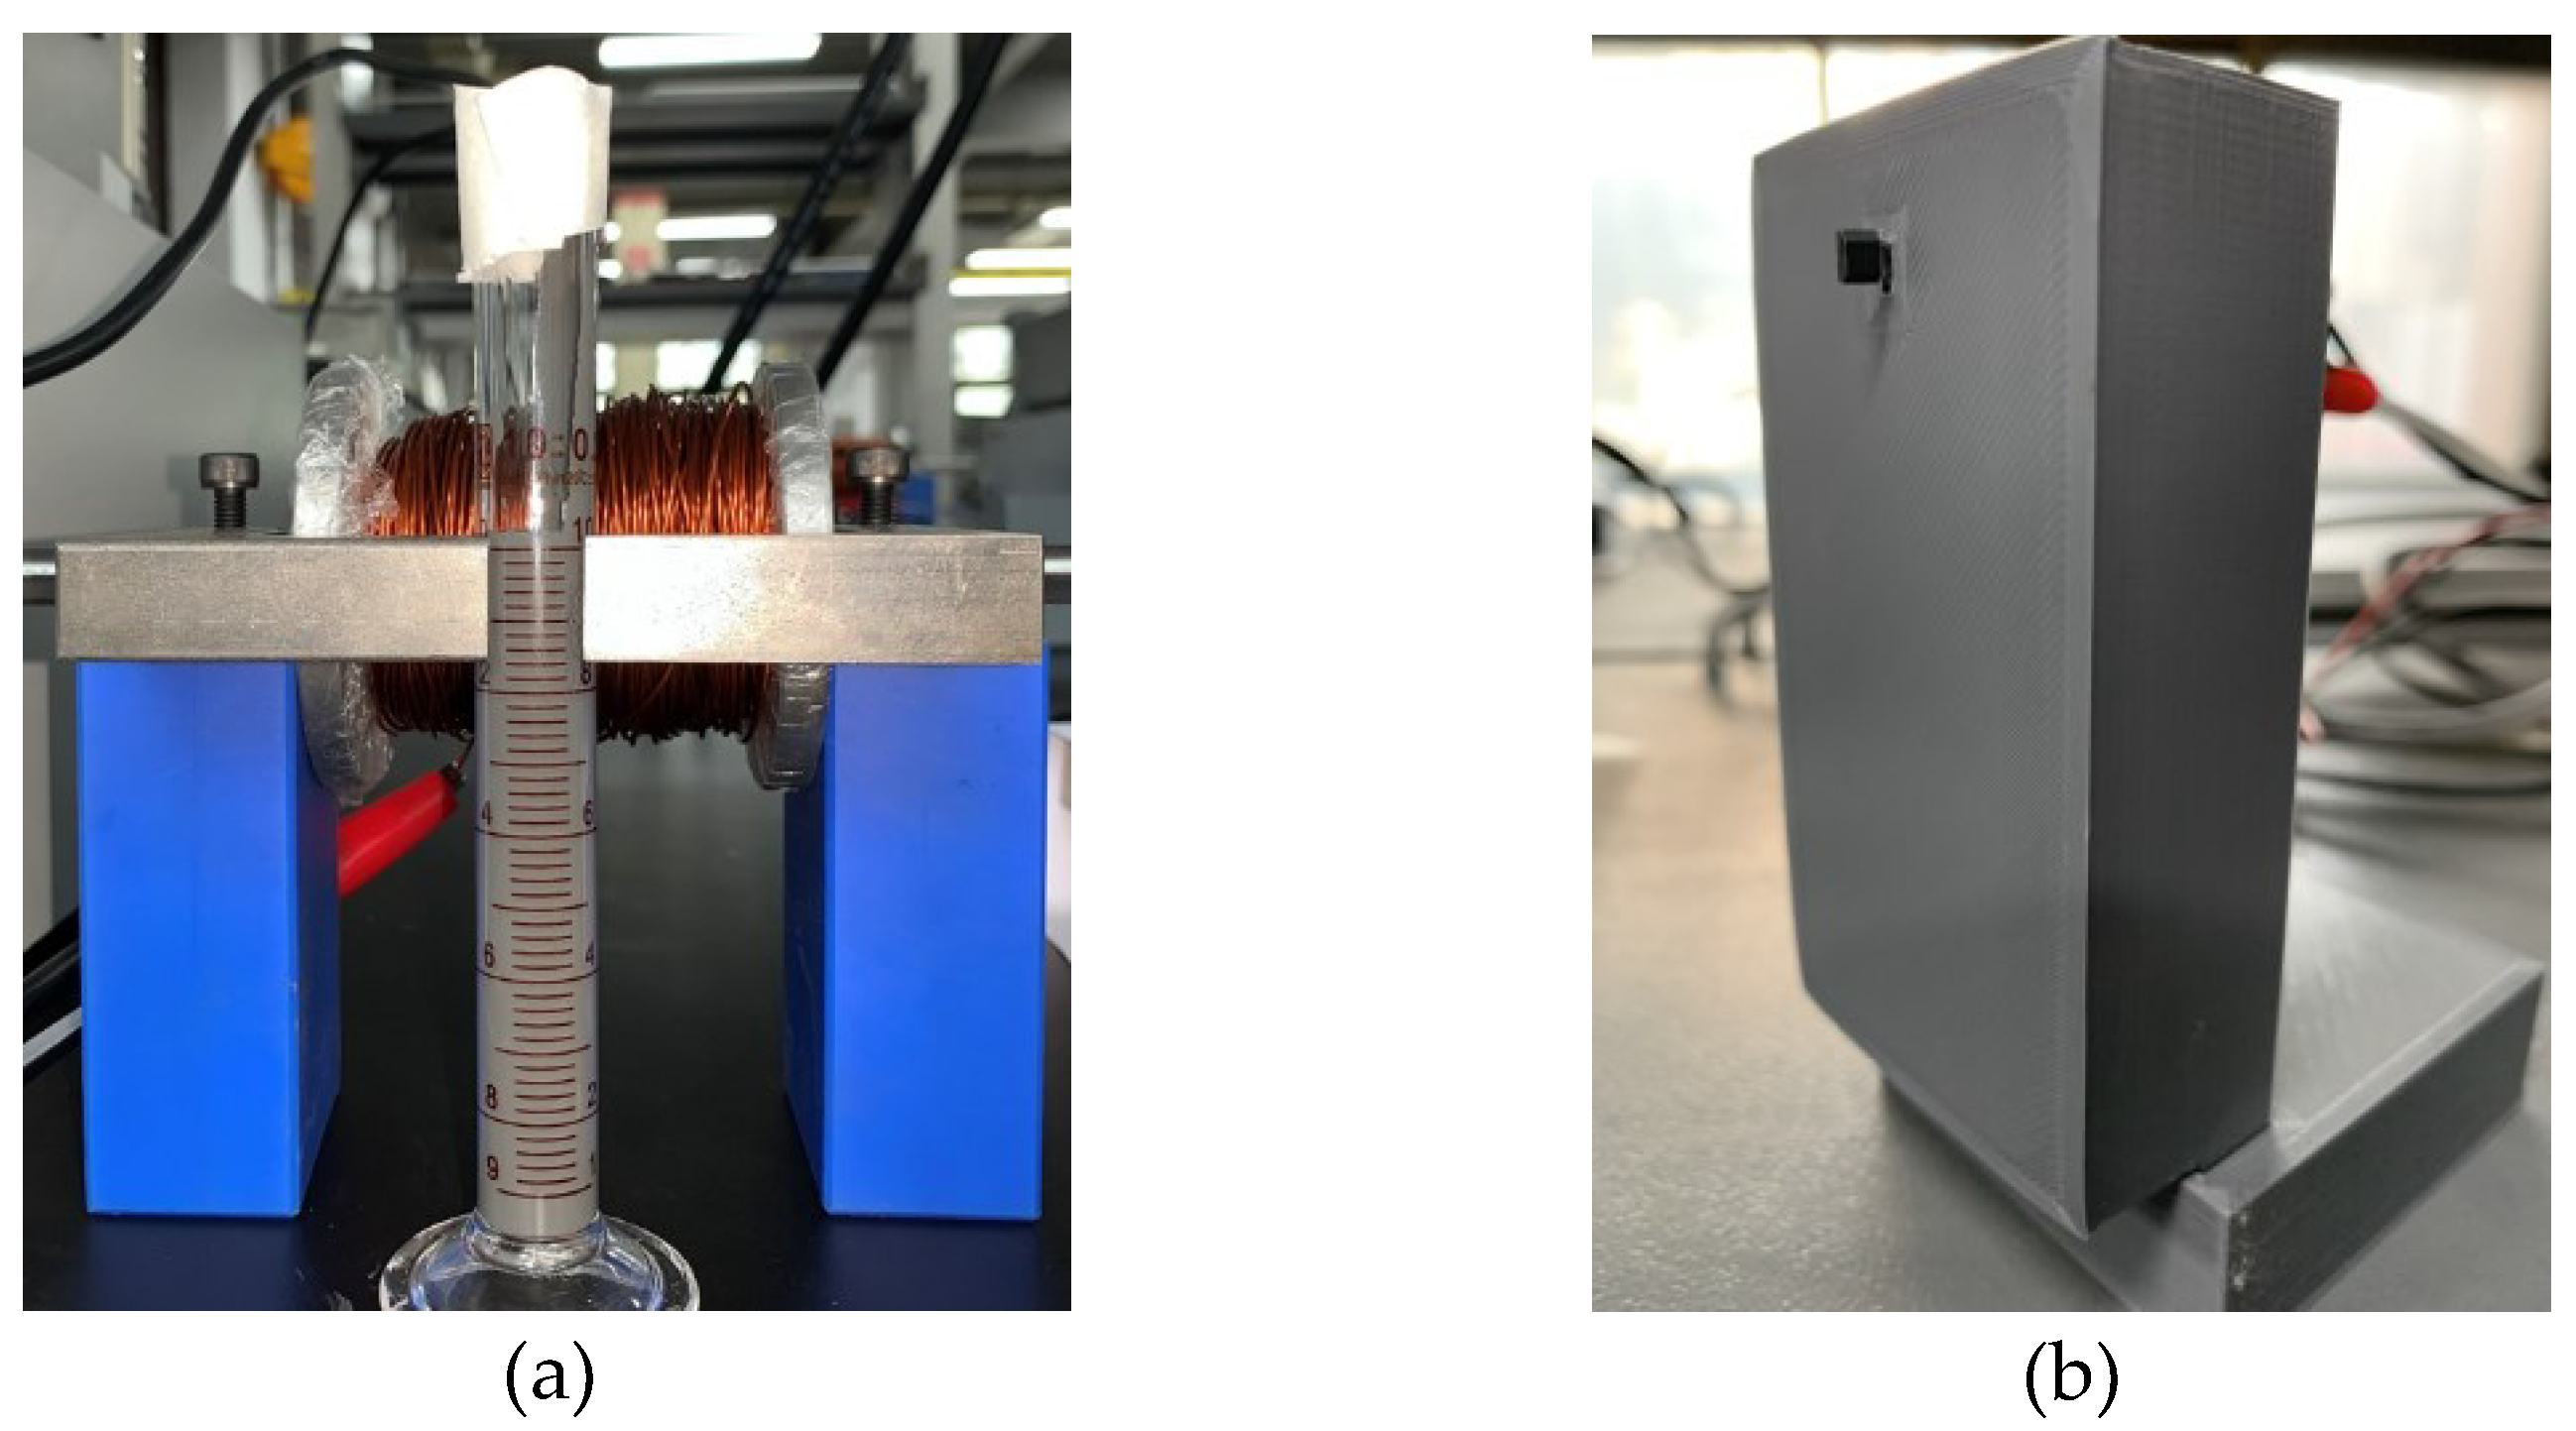
In addition, a hall sensor that received power from a 5V Switching Mode Power Supply (SMPS) was utilized. A Data Acquisition (DAQ National Instruments USB-6341-BNC) was connected to the hall sensor as the measuring tool for monitoring the generated electromagnetic fields. The measuring range of the hall sensor is from -10 V to +10 V which is associated with the strength of the magnetic fields. Since the sedimentation of iron particles occurs from the surface to the bottom, the magnetic circuit was placed on the top position of the measuring tube. By applying the magnetic field around the top position of the experimental tube, the iron particles were not freely dispersed. Then the concentration of the settling particle changed to the sedimentation profile over time. The experimental setup of this work (
Figure 5) was prepared by connecting the function generator and power supply to the coil. In addition, a hall sensor was connected to the DAQ which was placed in the middle of the magnetic circuit and MR fluids measuring tube.
3. Results and Discussion
3.1. Hall Sensor Measurement
A study by K.P. Lijesh et al. [
33] placed four hall sensors near the MR fluids with a permanent magnet at some distance to evaluate the settling particles. By placing the MR fluids sample far from the permanent magnet, the permeability of the medium between the sensor and magnet is changed from air to MR fluids which increases the induced magnetic field in the sensor. Another study by J. Roupec et al. [
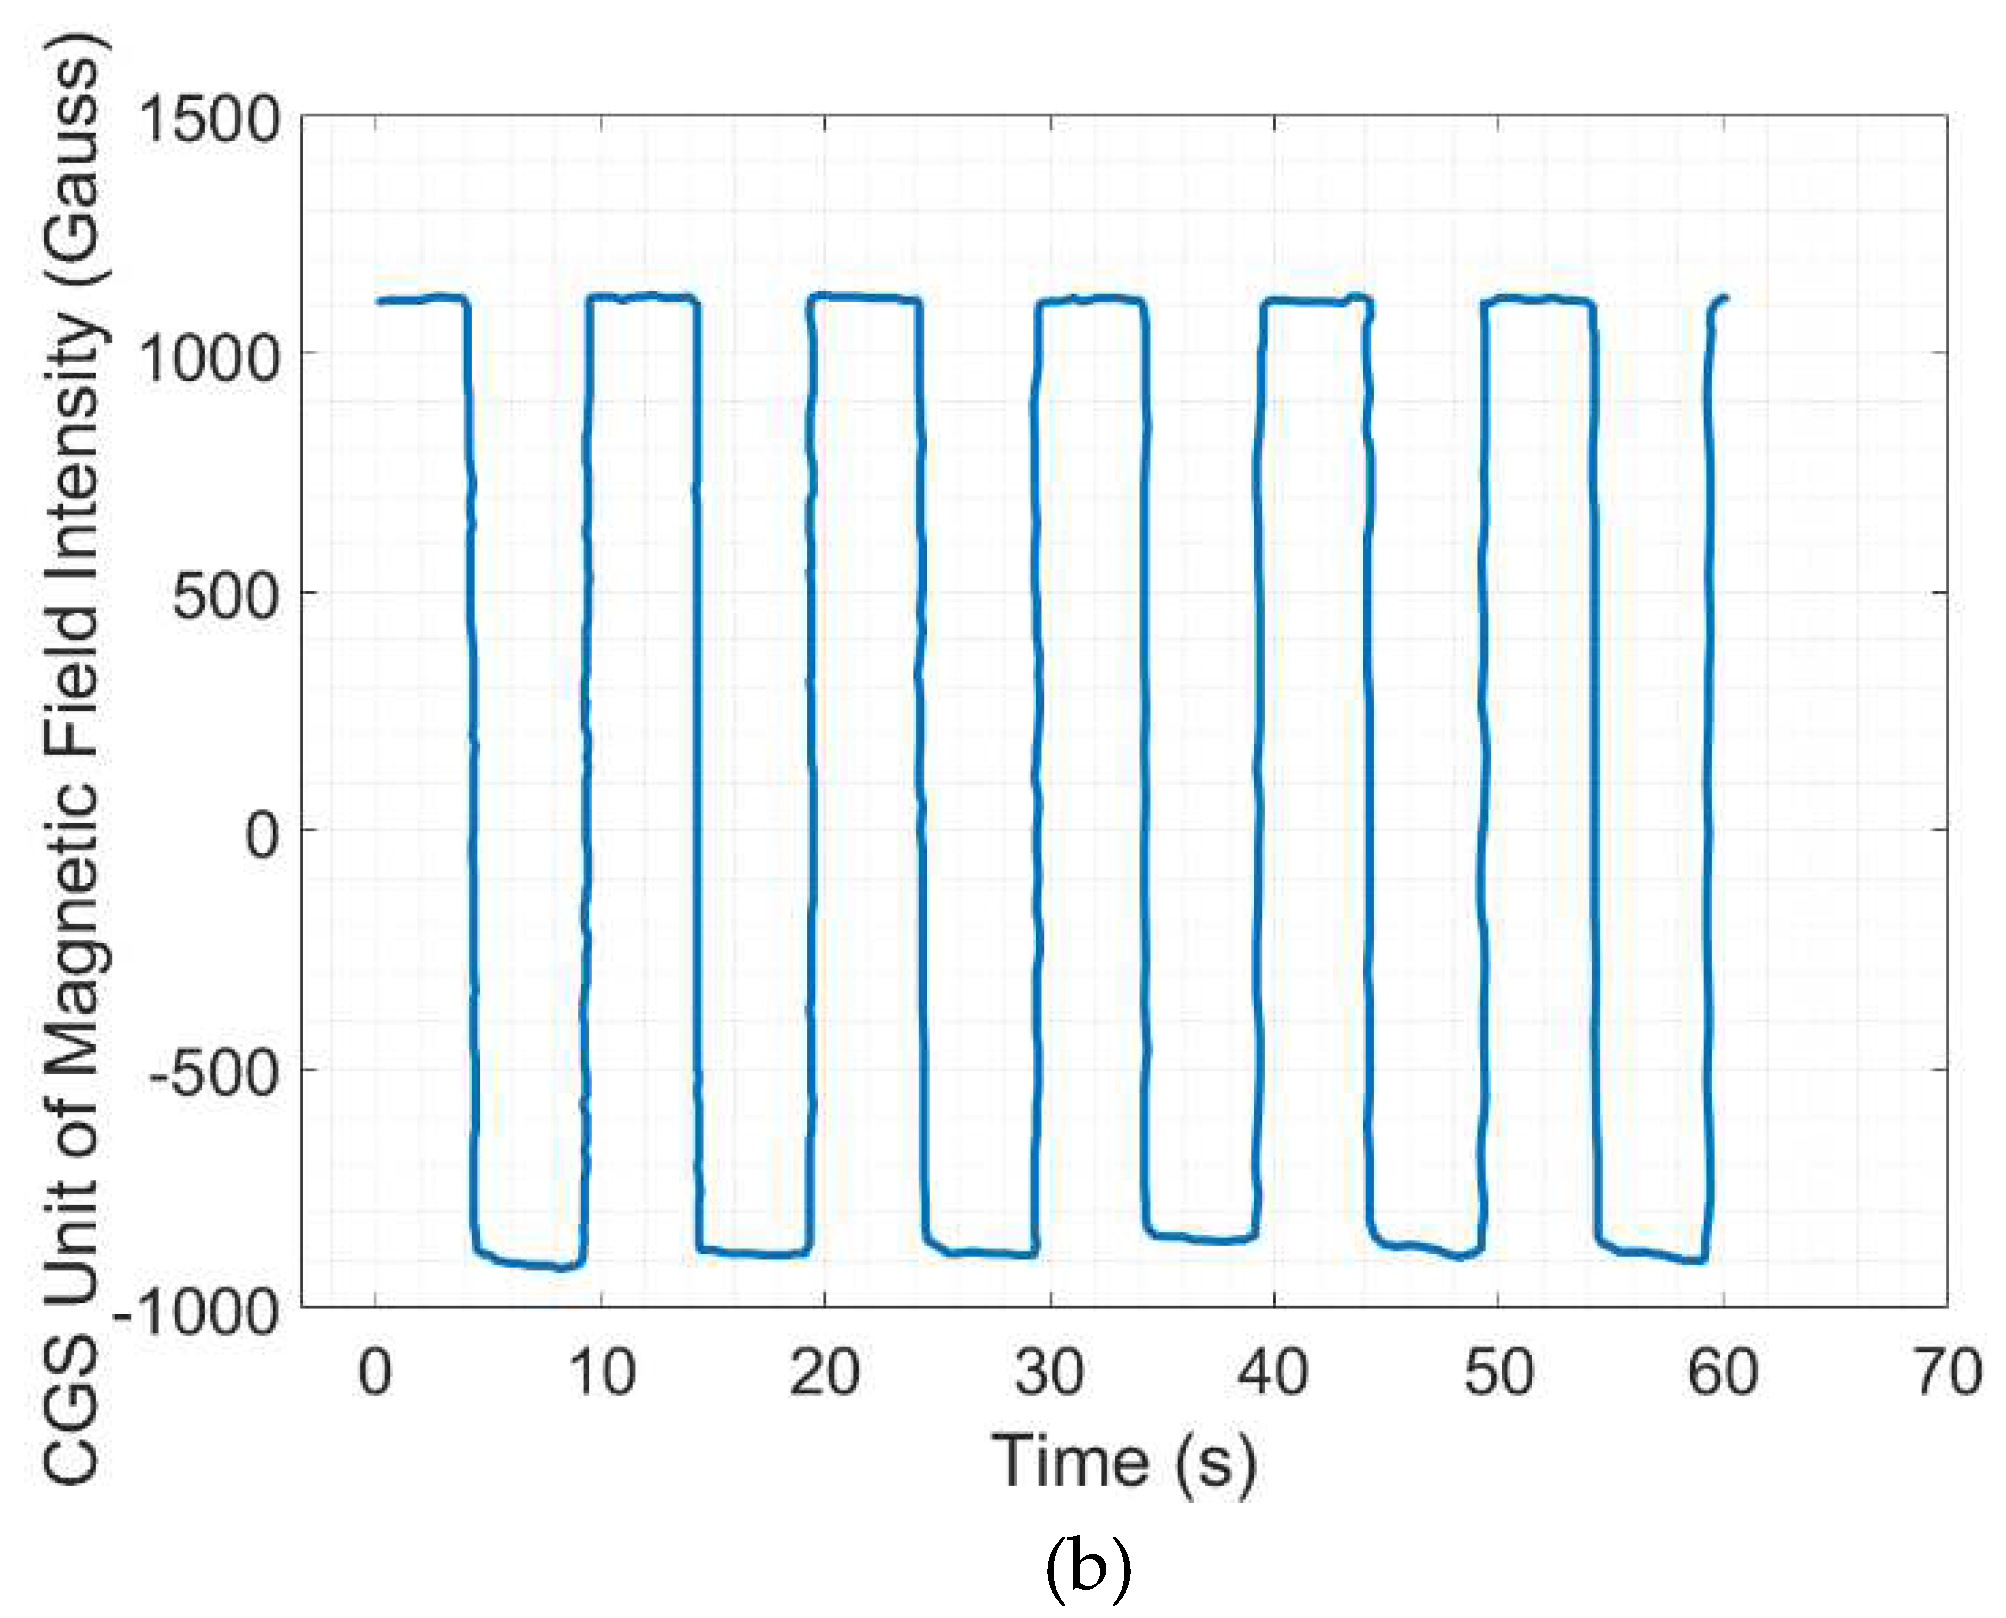
35] utilized a hall probe that was covered by a thick brass plate to obtain the sedimentation rate. The thick brass had a relative permeability of 1 to prevent the hall probe from getting affected by the magnetic field and could measure the magnetic flux of the iron particles. On the other hand, this work utilized a hall sensor for a different purpose to monitor the output wave signals and electromagnetic fields. The measurement was conducted in analog output. The output signal of the hall sensor is amplified with the voltage output which is proportional to the magnetic field crossing the hall sensor. The voltage readings by the hall sensor were then converted to the CGS unit of magnetic field intensity (Gauss) using the typical voltage characteristics of the hall sensor. The data was taken at the highest current input of 2 A using the DAQ as shown in
Figure 6. The signal output is formed in square wave and sine wave as power supply output to the coil with the highest obtained magnetic flux density around 1100 Gauss which was approximately equal to 0.11 Tesla.
3.2. Sedimentation Rate
The evaluation was done by comparing the sedimentation rate using the method of visual observation. The measurement of the sedimentation of each sample was conducted over two weeks (336 hours) every 24 hours. The indication of sedimentation was concluded after the iron particles that were against the surface of carrier fluids (sedimentation layer) were seen. The following equation was used to obtain the sedimentation rate.
where
SR is the sedimentation rate,
HS is the height of the sedimentation layer, and
HMRF is the total height of the MR fluids.
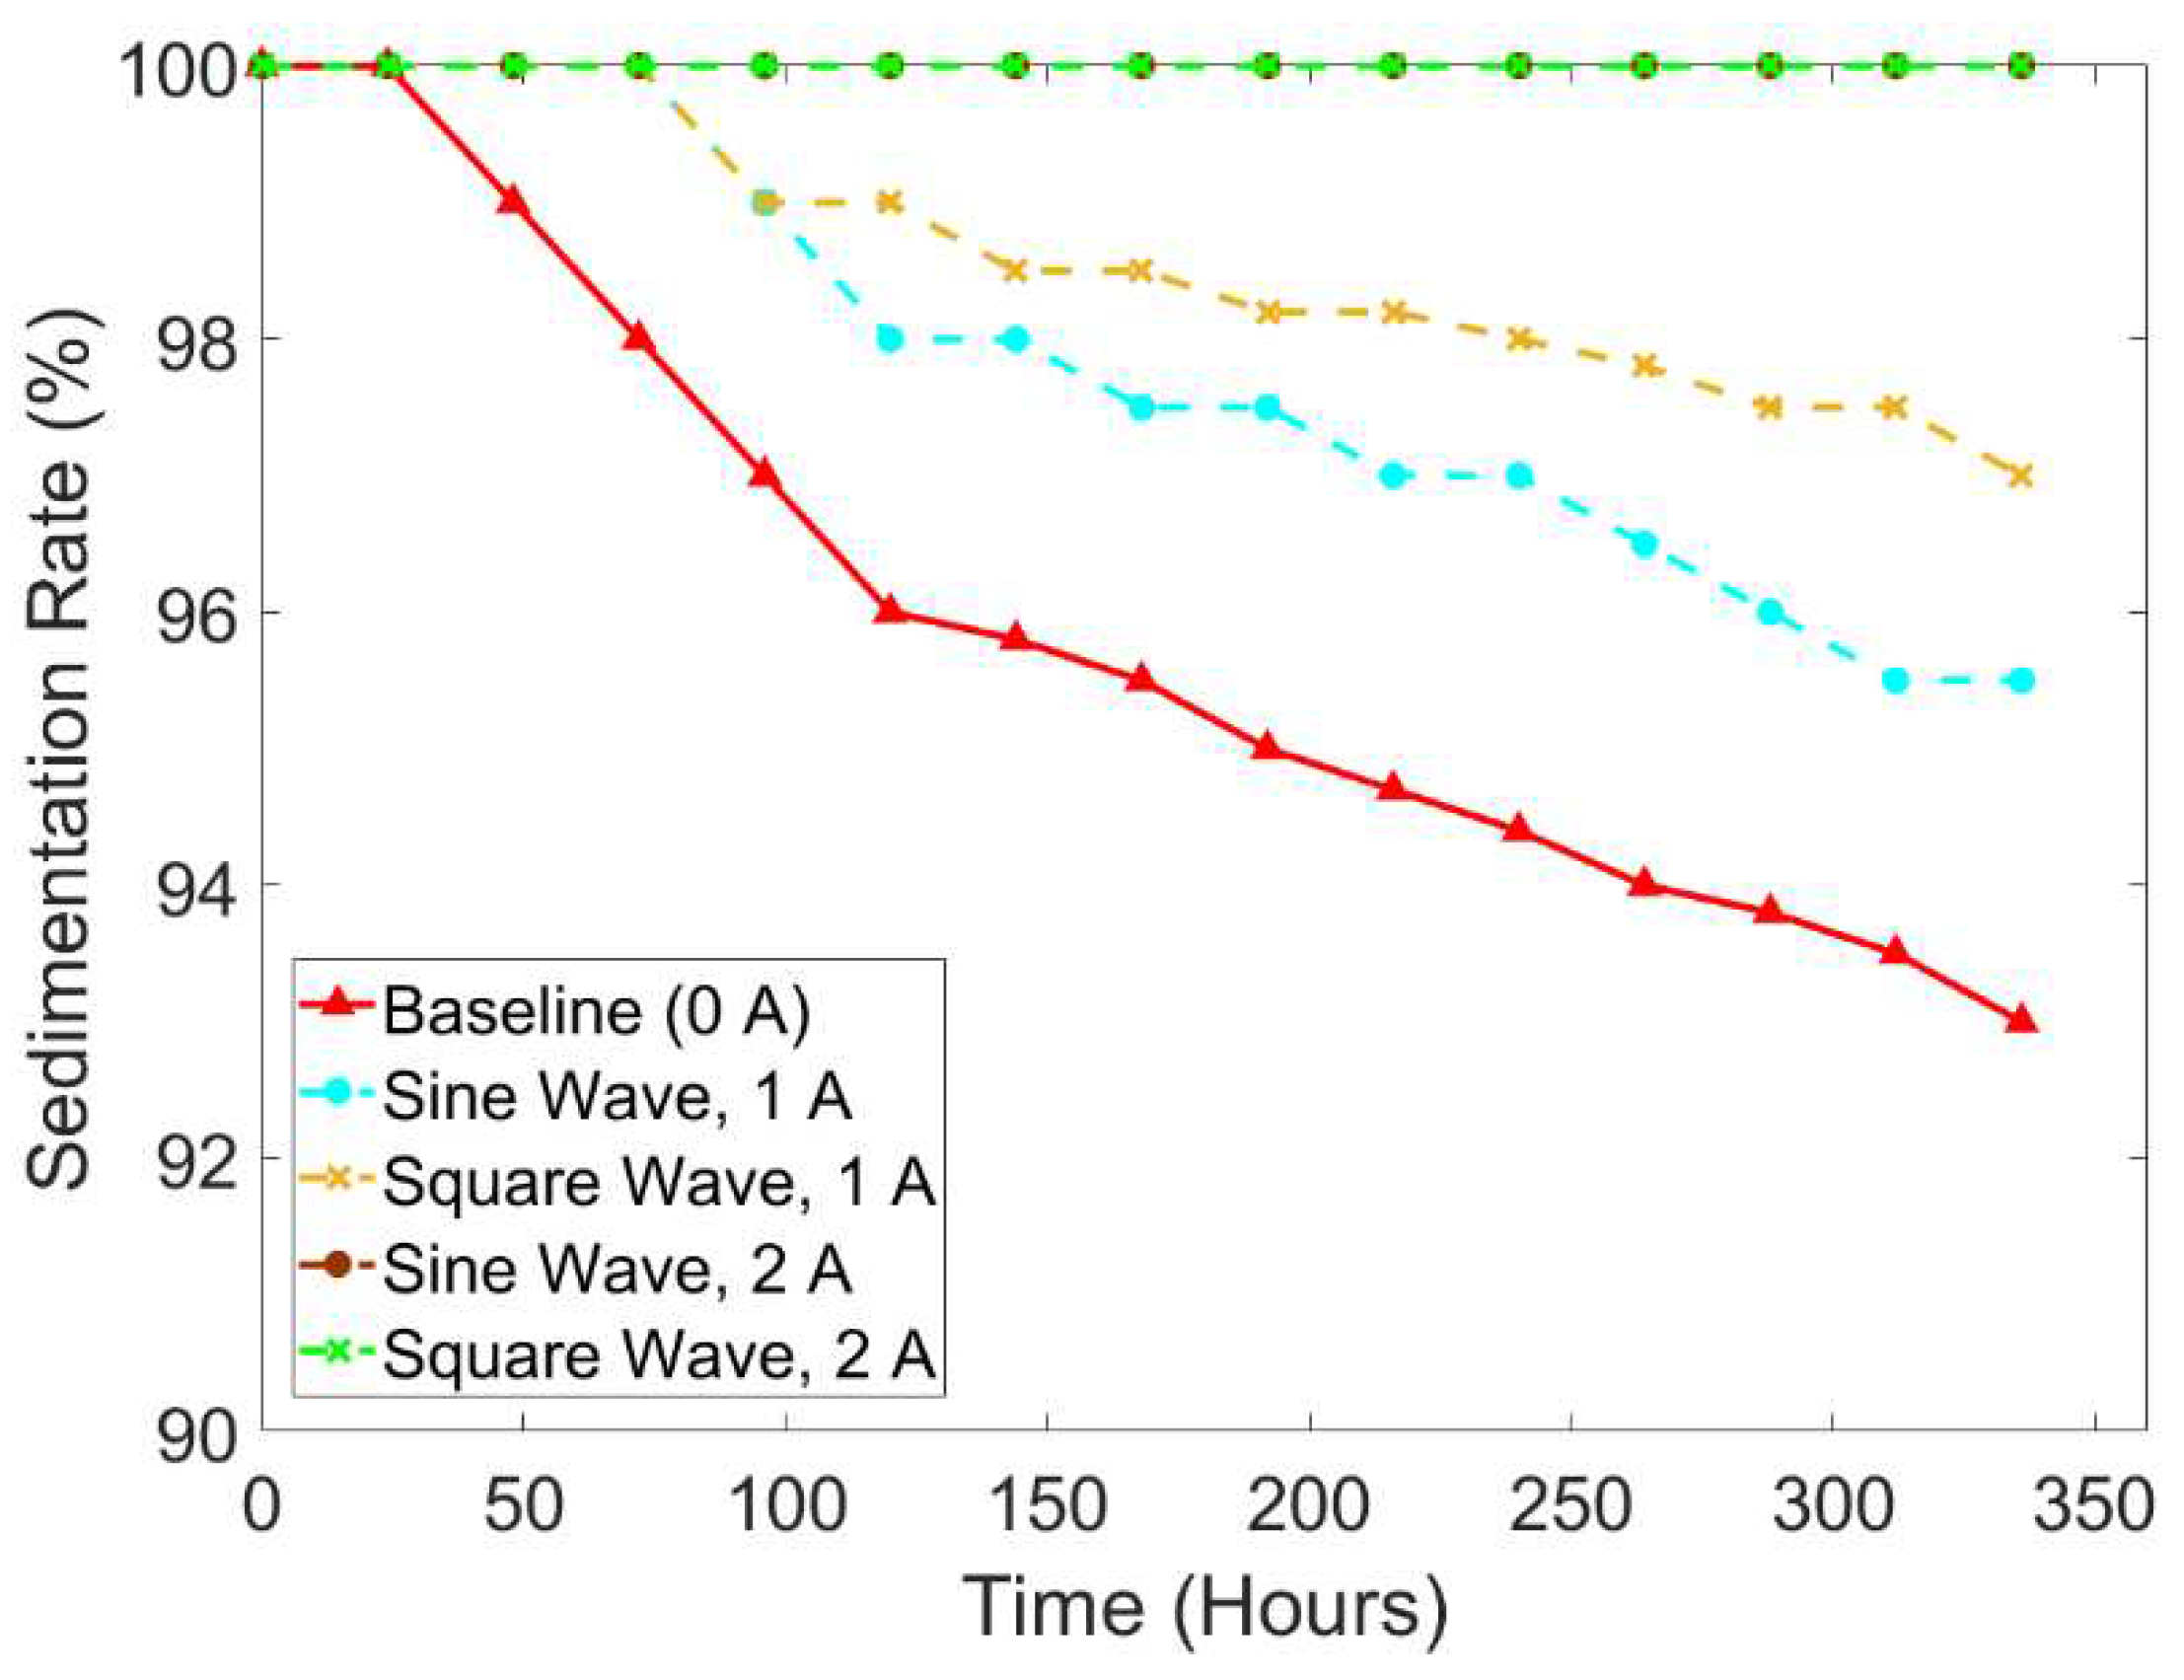
Figure 7 shows the comparison results according to the wave types and current input intensity using the small tube. In addition,
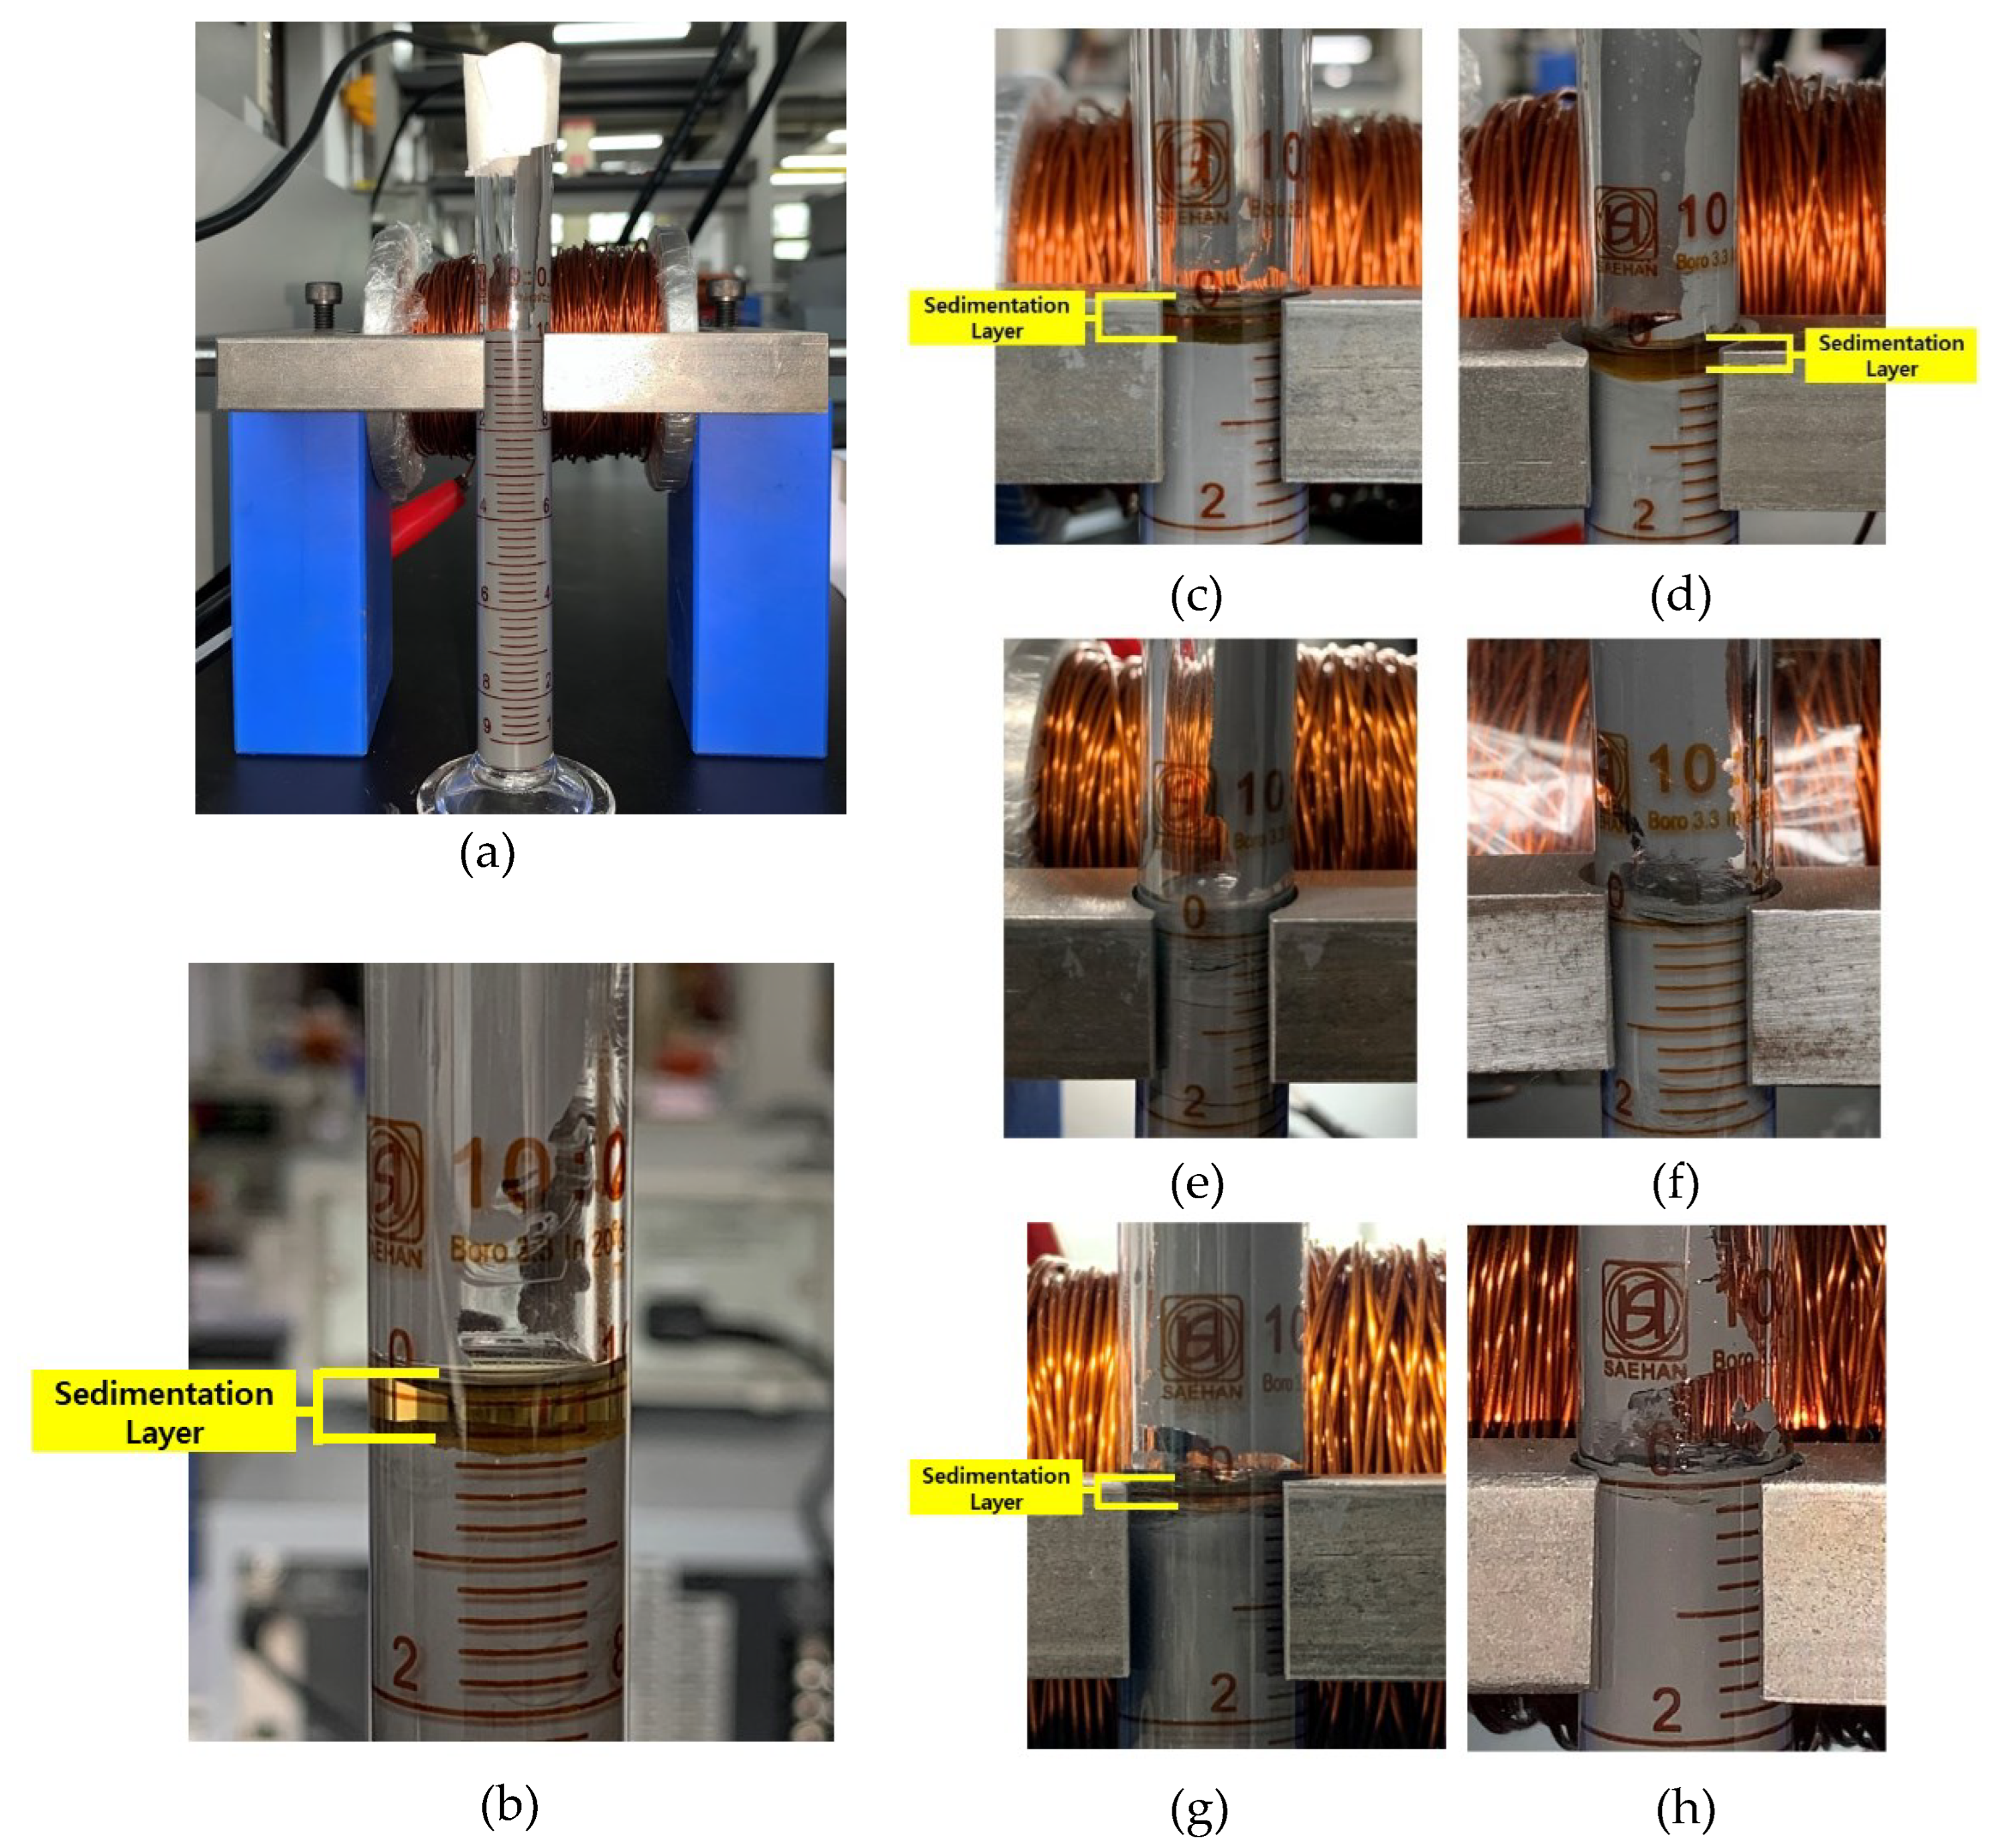
Figure 8 depicts the sedimentation layer of small tube samples. It can be seen that the sample without any waves and current input influence (baseline) took 48h to start the sedimentation rate reaching the value of 99% and ended up at the value of around 93% followed by the sample with the current of 1 A under the sine wave and square wave which started the sedimentation after 72 hours with the similar value of 99% and ended at the value of around 95.5% and 97%, respectively. Based on the 336-hour experiment, the square wave with the current input of 1 A showed a slower settling process. The obtained average value of the sedimentation rate of the baseline (0 A), sine wave (1 A), and square wave (1 A) was 95.83%, 97.83%, and 98.61%, respectively. The results showed the square wave had a better effect in slowing down the sedimentation. Interestingly, after 336 hours the sedimentation rate of 2 A both the sine wave and square wave remained stable at 100% and did not show any sedimentation layer as seen in
Figure 9. This was caused by the stronger chain-like structure in parallel direction as the high value of generated electromagnetic fields. Under this condition, iron particles were hard to settle down to the bottom as illustrated in
Figure 8. More specifically, MR fluids operating mode under a magnetic field is within milliseconds (real-time). As a previous study by K. Shah et al. [
27], the response time of MR fluids based on plate-like iron was 0.035 s after the magnetic field was applied, while the time that the MR fluids returned to their original state was 0.065 s after the removal of the magnetic fields. Therefore, when the electromagnetic fields were applied during the experiment time (non-stop), the iron particles remained in chain-like structures until they were removed.
To verify the minimum current input that could prevent sedimentation, another comparison is delivered in
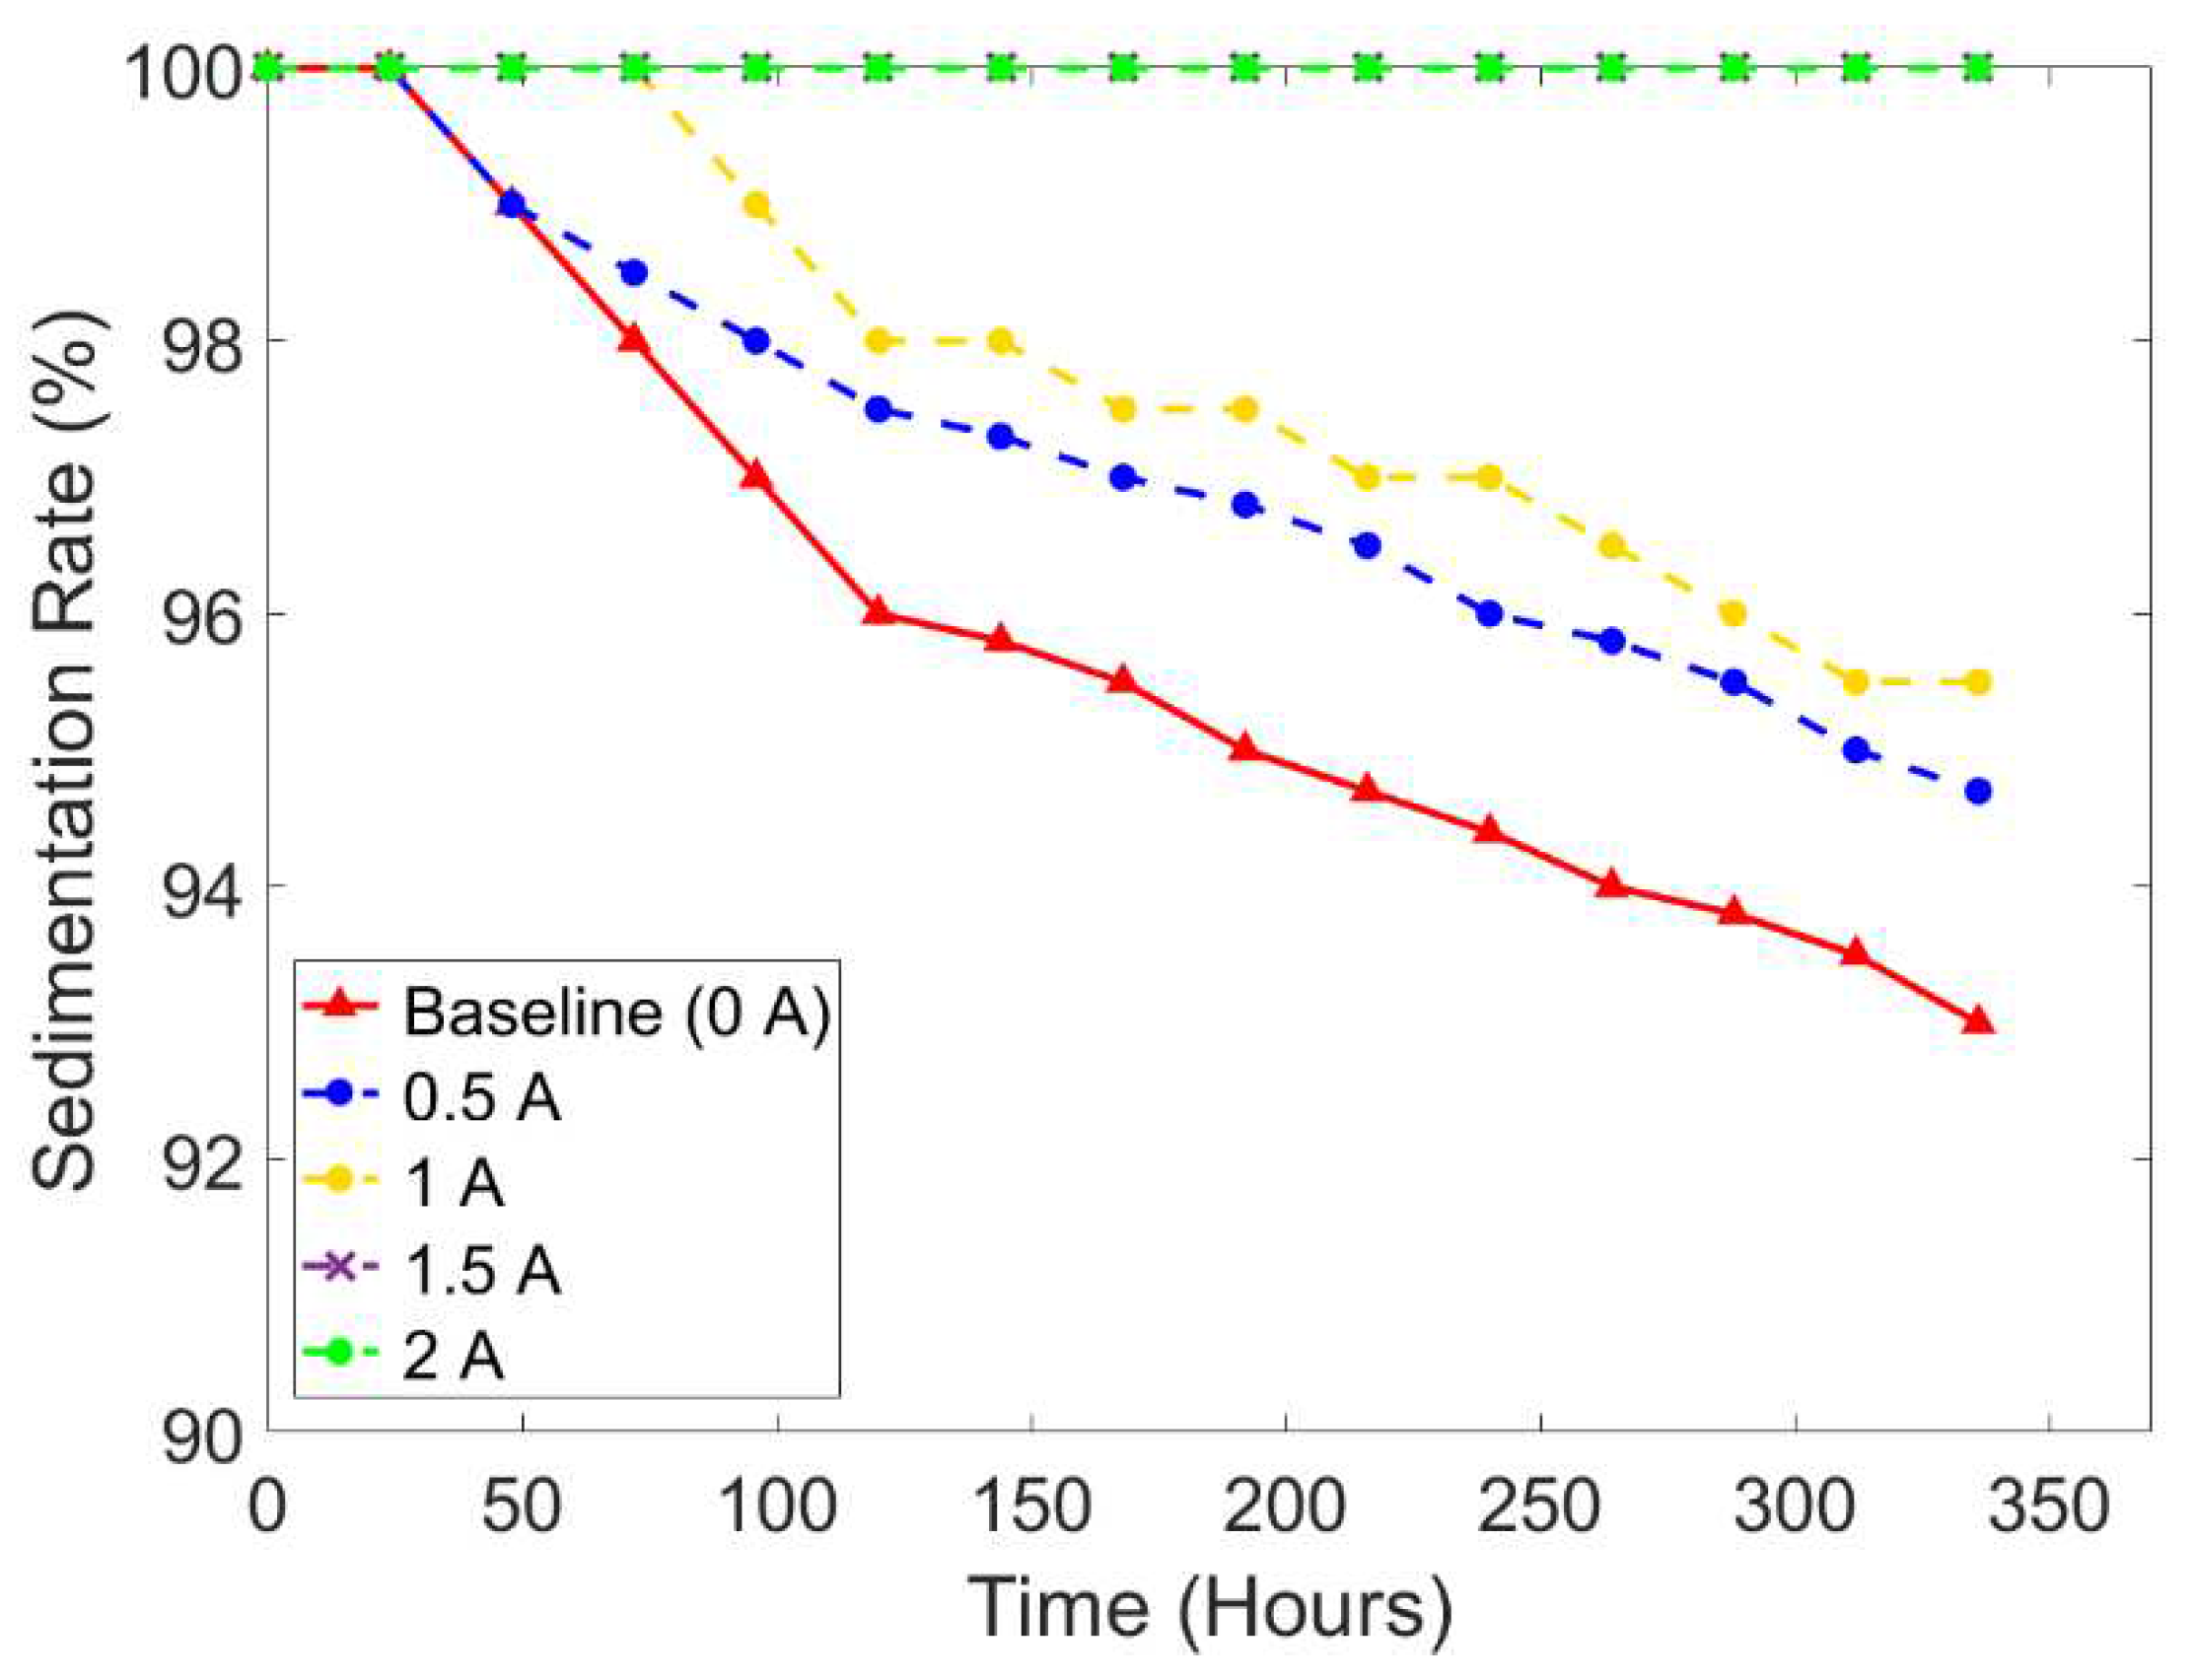
Figure 10, representing the sedimentation rate under sine wave at the frequency of 0.1 Hz and different current input intensities. It is noted that the current input of 1.5 A was sufficient to prevent the occurrence of sedimentation. The sedimentation tendency was not changed from 0 hours until 336 hours of the experiment. The average value of the sedimentation rate for each current input was 95.98% (0 A), 97.13% (0.5 A), 97.83% (1 A), 100% (1.5 A), and 100% (2 A). In general, the higher applied current input will slow down the process of sedimentation. As shown in
Figure 10, the sample with the current input of 1.5 A did not show any sedimentation layer.
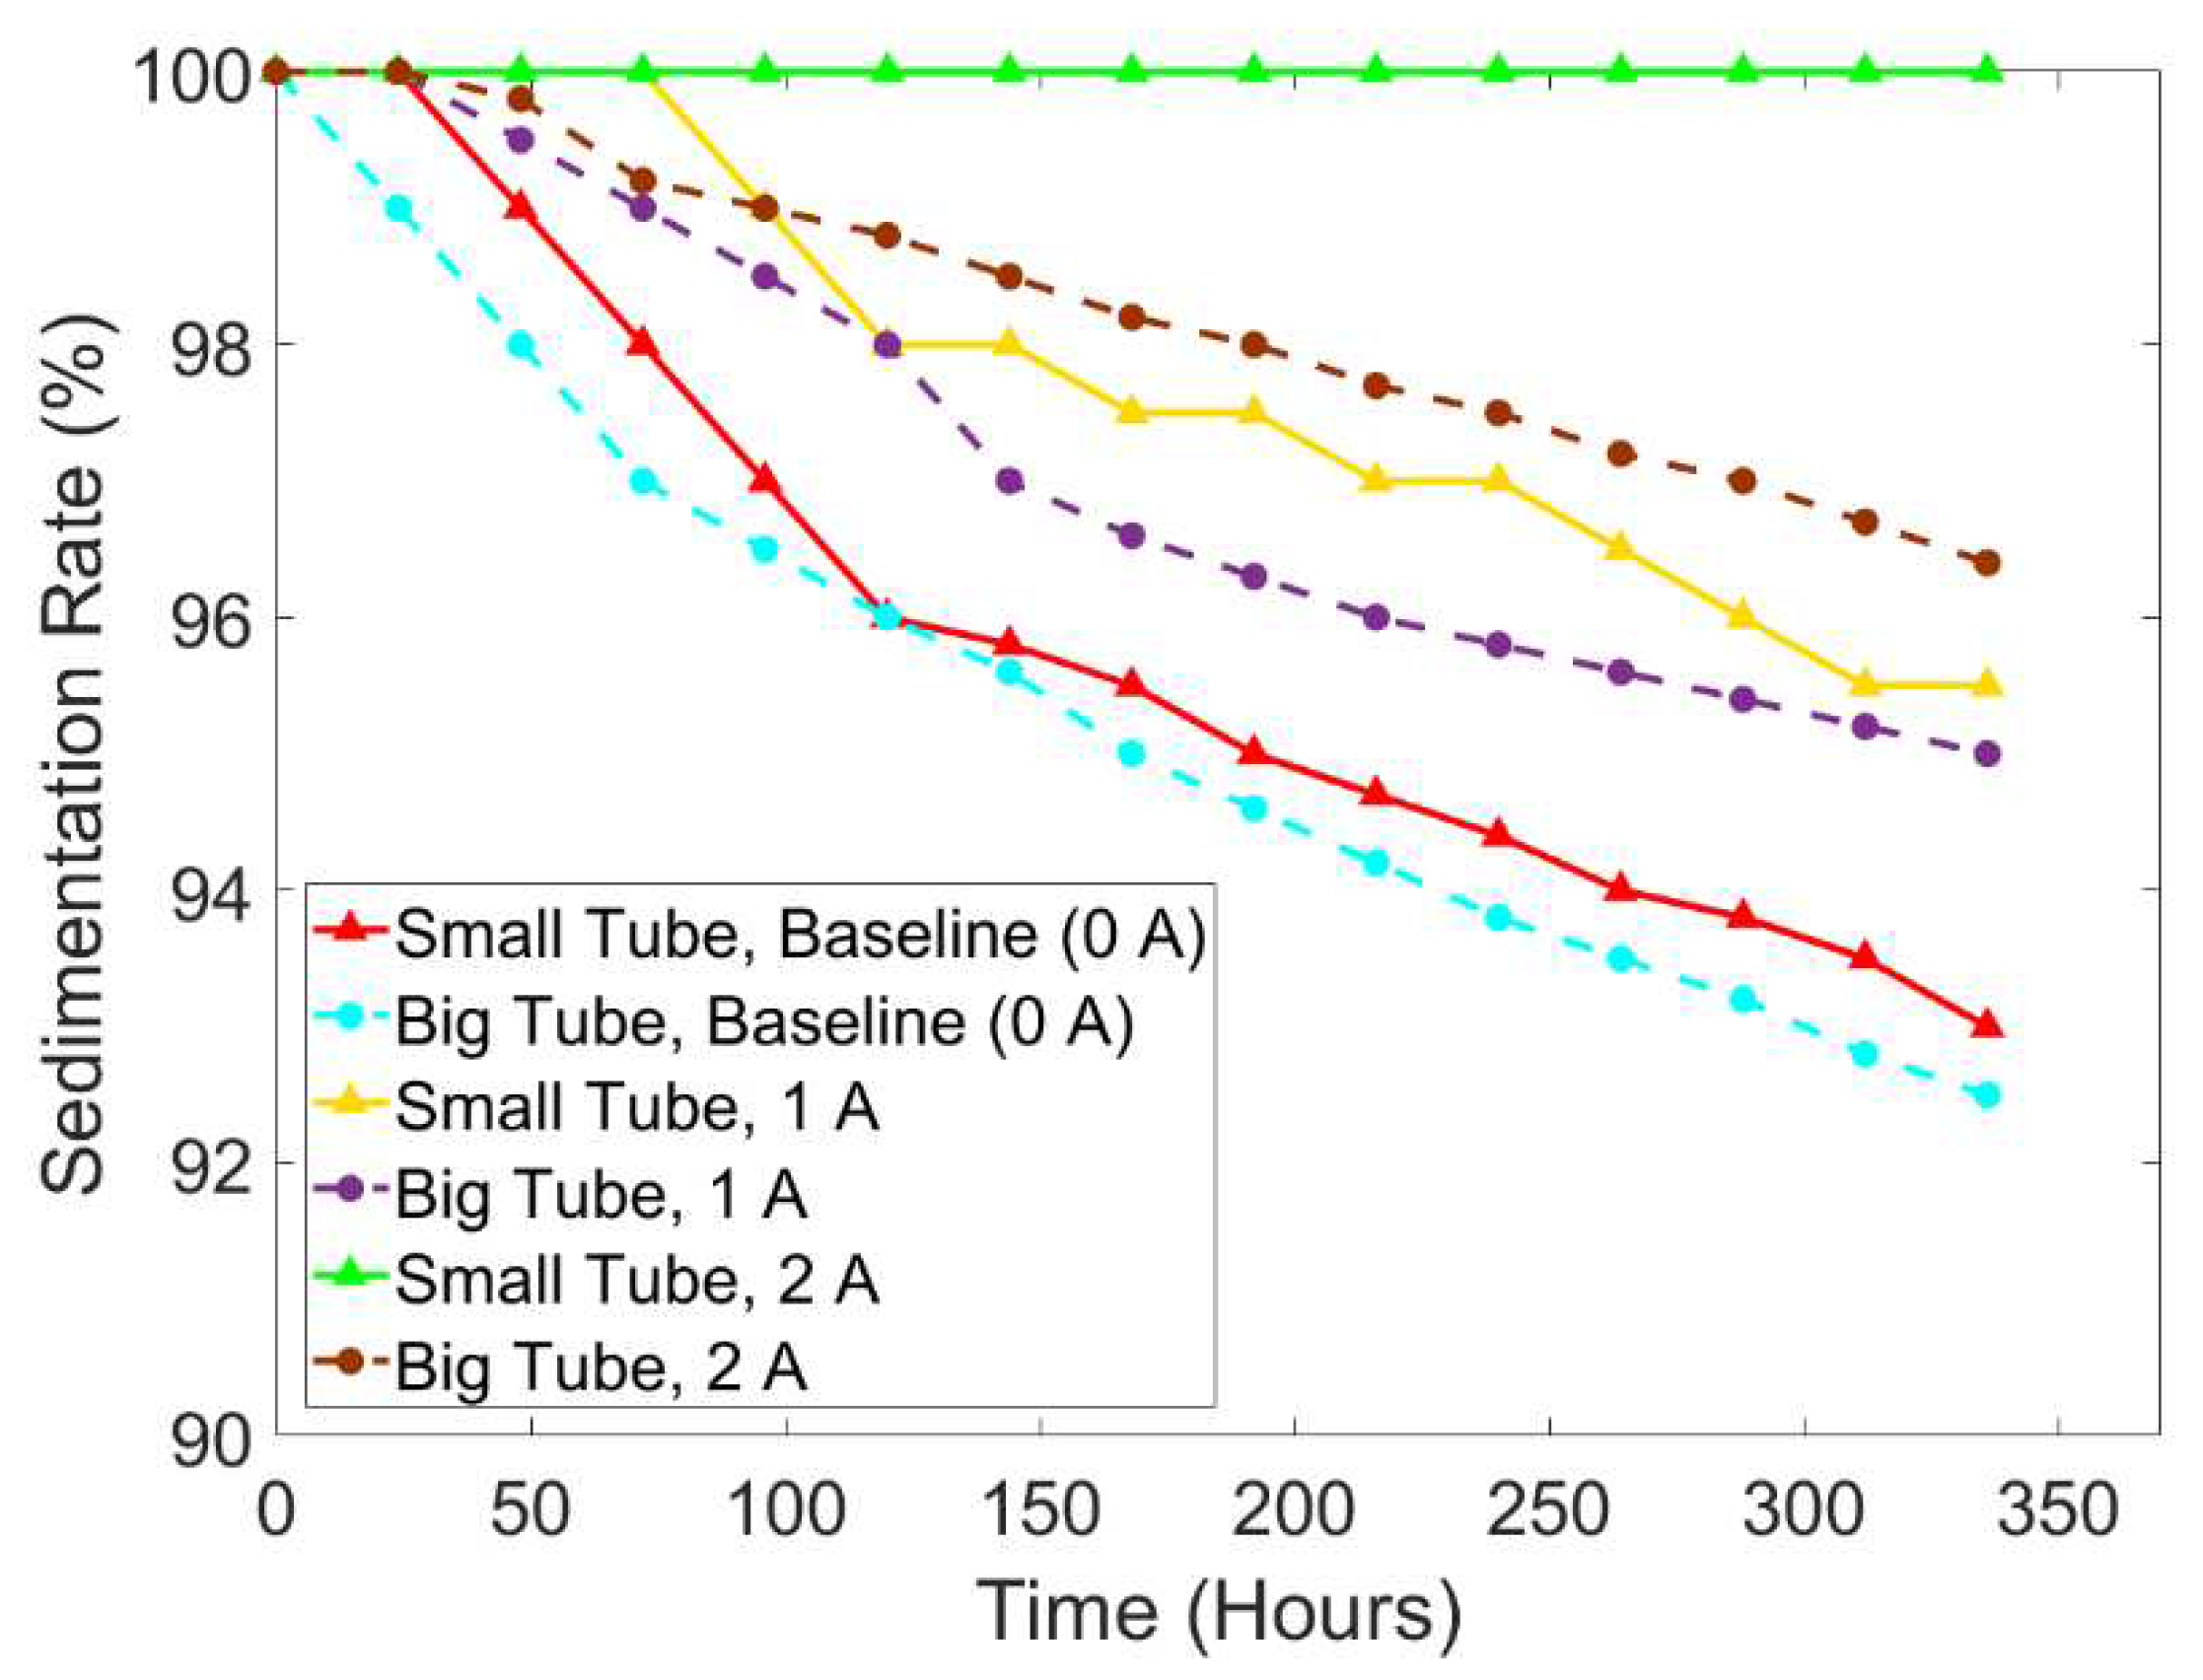
The other purpose of this study is also to compare the effect of the diameter on sedimentation. For this purpose, the sedimentation rate comparison is depicted in
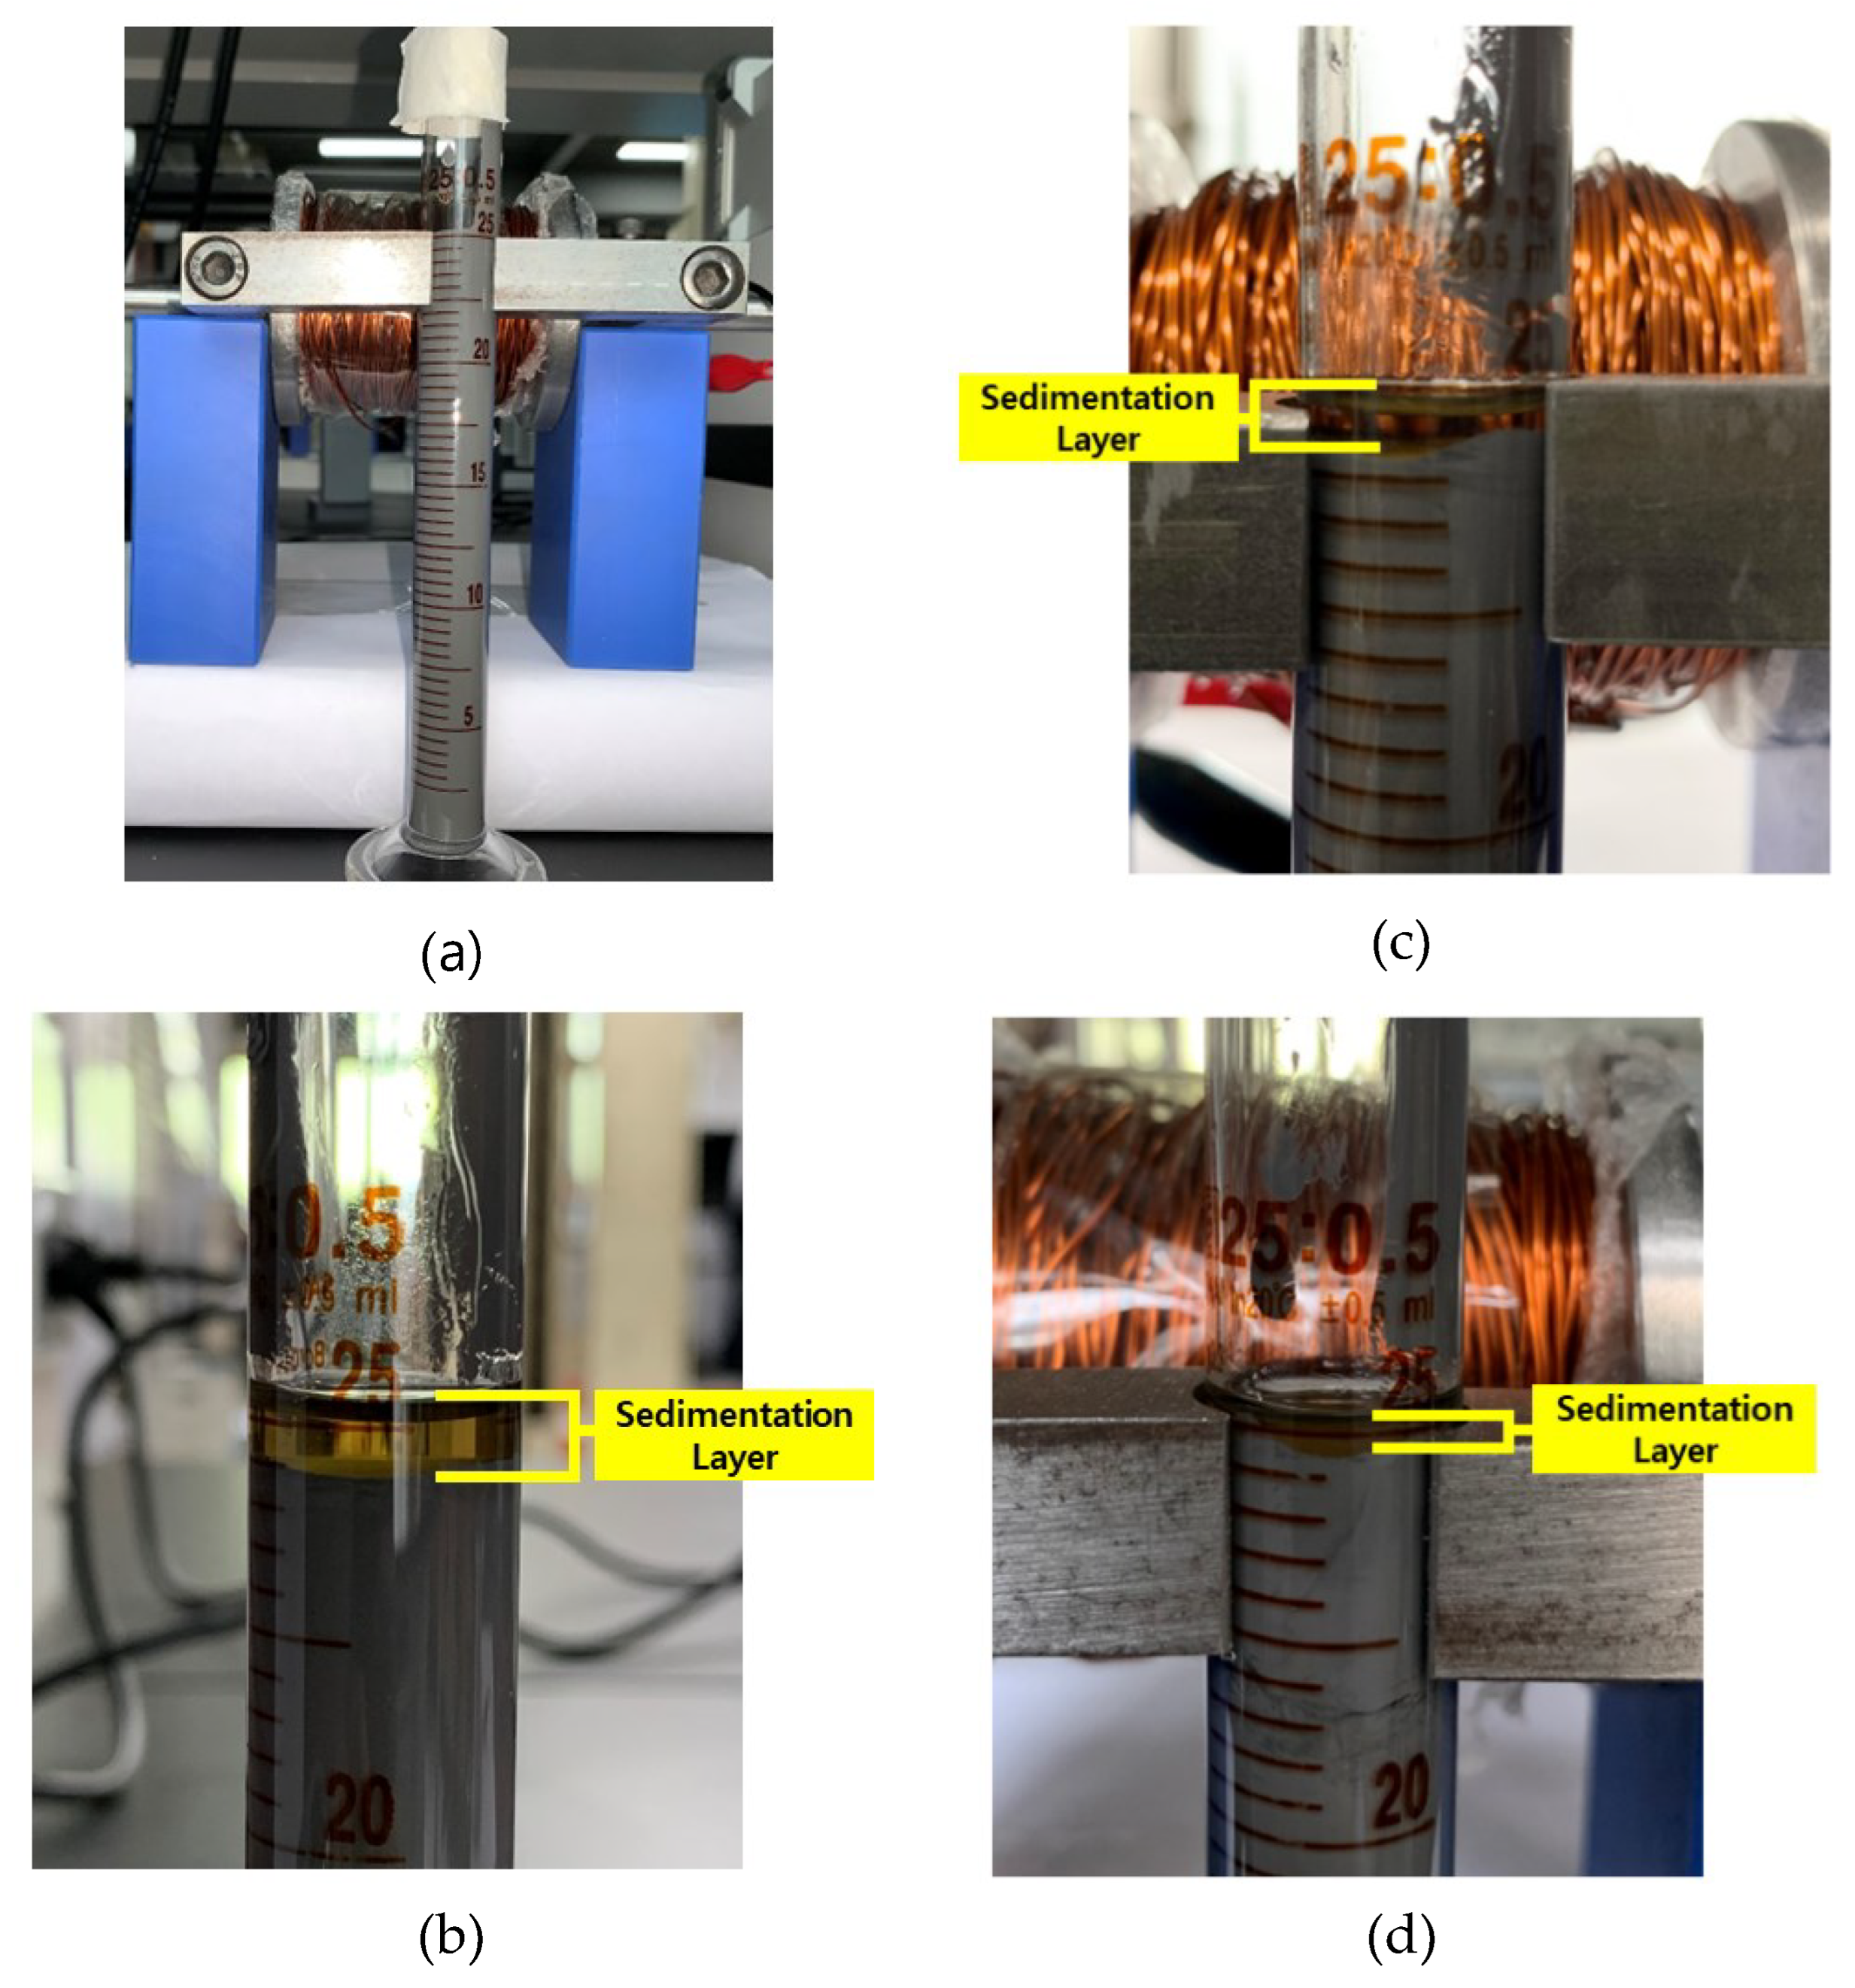
Figure 11. The sedimentation layer of each sample of the big tube (15 mm) and the small tube (13 mm) can be seen in
Figure 12. The small tube with the current input of 2 A did not show any changes in the sedimentation rate remaining stable at 100%, while the big tube (15 mm) started the sedimentation after 48 hours of the experiment with a value of around 99.8% and ended up at 96.4%. The average sedimentation rate of small tubes was 95.98% (0 A), 97.83% (1 A), and 100% (2 A). Meanwhile, the average sedimentation rate of the big tube was 95.45% (0 A), 97.19% (1 A), and 98.27% (2 A). Generally, the tendency lines showed that the big tubes had the faster sedimentation for all current input intensities. This study strengthens the assumption of a previous study by Roupec et al. [
35] that the difference between their study with the study of Xie et al. [
38] in sedimentation rate was caused by the diameter of the tube. Roupec used a tube with a diameter of 31.6 mm, while Xie used a tube with a diameter of 25 mm which resulted in a sedimentation rate of 67 % and 70%, respectively. The sedimentation for smaller diameters can happen slower since the particles are hindered by the walls by the imposition of no-slip conditions.
4. Conclusions
In this work, the magnetic circuit with 500 turns of the wounded coil was placed on the top position of the measuring tube to influence the iron particles to not easily settle down to the bottom. The experiment was conducted under different current input intensities (0 A, 0.5 A, 1 A, 1.5 A, and 2 A), current wave types (square wave and sine wave), and diameters of the measuring tube (13 mm and 15 mm). Based on the experimental results and investigation of the sedimentation rate, the conclusions are summarized as follows:
- 1)
The square current wave shows slower sedimentation compared to the sine wave. When the intensity of 1 A current input was applied, the average sedimentation rate under the square wave was observed by 98.61%, while the average sedimentation rate under the square wave was 97.83%.
- 2)
The higher intensity of the applied current input resulted in stronger electromagnetic which could slow down the sedimentation of MR fluids caused by the strongly formed chain-like structure. The minimum input current for preventing sedimentation was identified by 1.5 A.
- 3)
The walls on the smaller tube diameter could hinder the movement of the particles resulted in slow down the sedimentation rate.
Even though some meaningful results have been achieved in this experimental study, the observed phenomena in real application systems should be further explored for more accurate validation. In other words, the investigation on the sedimentation behavior in the surface finishing or the field-dependent damping force by applying different current magnitude and different input profiles with small and large diameter channels needs to be observed and analyzed in the near future.
Author Contributions
Conceptualization, E.T.M., M.-W.S., J.-S.O., and S.-B.C.; methodology, E.T.M., M.-W.S., and J.-S.O., and S.-B.C.; software, E.T.M., M.-W.S.; validation, E.T.M., M.-W.S., J.-W.S., J.-S.O., and S.-B.C.; formal analysis, E.T.M., J.-S.O., and S.-B.C.; investigation, E.T.M.; resources, E.T.M., J.-S.O, S.-B.C., data curation, E.T.M., J.-S.O.; writing—original draft preparation, E.T.M.; writing—review and editing, E.T.M., J.-S.O., J.-W.S., and S.-B.C.; visualization, E.T.M.; supervision, J.-S.O. and S.-B.C.; project administration, M.-W.S. and J.-S.O.; funding acquisition, J.-S.O. and S.-B.C. All authors have read and agreed to the published version of the manuscript.
Funding
This work was partially supported by "Regional Innovation Strategy (RIS)" through the National Research Foundation of Korea (NRF) funded by the Ministry of Education (2021RIS-004) and the National Research Foundation of Korea (NRF) grant funded by the Korean Government (MSIT) (No. 2022R1F1A1074691)
Data Availability Statement
No new data was created or analyzed in this study. Data sharing is not applicable to this article.
Conflicts of Interest
The authors declare no conflicts of interest.
References
- Choi S-B (2022) Sedimentation Stability of Magnetorheological Fluids: The State of the Art and Challenging Issues. Micromachines 13:1904. [CrossRef]
- Ashtiani M, Hashemabadi SH, Ghaffari A (2015) A review on the magnetorheological fluid preparation and stabilization. J Magn Magn Mater 374:711–715. [CrossRef]
- Song B-K, Kang S-R, Cha S-W, et al (2018) Design of a novel 6-DOF haptic master mechanism using MR clutches and gravity compensator. Mech Based Des Struct Mach 46:767–780. [CrossRef]
- Singh A, Kumar Thakur M, Sarkar C (2020) Design and development of a wedge shaped magnetorheological clutch. Proc Inst Mech Eng Part L J Mater Des Appl 234:1252–1266. [CrossRef]
- Park JY, Kim GW, Oh JS, Kim YC (2021) Hybrid multi-plate magnetorheological clutch featuring two operating modes: Fluid coupling and mechanical friction. J Intell Mater Syst Struct 32:1537–1549. [CrossRef]
- Wang DM, Hou YF, Tian ZZ (2013) A novel high-torque magnetorheological brake with a water cooling method for heat dissipation. Smart Mater Struct 22:. [CrossRef]
- Song WL, Li DH, Tao Y, et al (2017) Simulation and experimentation of a magnetorheological brake with adjustable gap. J Intell Mater Syst Struct 28:1614–1626. [CrossRef]
- Nguyen QH, Choi SB (2010) Optimal design of an automotive magnetorheological brake considering geometric dimensions and zero-field friction heat. Smart Mater Struct 19:. [CrossRef]
- Lutanto A, Ubaidillah U, Imaduddin F, et al (2022) Development of Tiny Vane-Type Magnetorheological Brake Considering Quality Function Deployment. Micromachines 14:26. [CrossRef]
- Sohn JW, Oh J-S, Choi S-B (2015) Design and novel type of a magnetorheological damper featuring piston bypass hole. Smart Mater Struct 24:35013. [CrossRef]
- Ghafarian Eidgahi Moghadam M, Shahmardan MM, Norouzi M (2022) Dissipative particle dynamics modeling of MR fluid flow in a novel magnetically optimized mini-MR damper. Korea-Australia Rheol J 34:291–315. [CrossRef]
- Oh JS, Shin YJ, Koo HW, et al (2016) Vibration control of a semi-active railway vehicle suspension with magneto-rheological dampers. Adv Mech Eng 8:1–13. [CrossRef]
- Oh JS, Choi SB (2019) Ride quality control of a full vehicle suspension system featuring magnetorheological dampers with multiple orifice holes. Front Mater 6:1–10. [CrossRef]
- Maharani ET, Ubaidillah U, Imaduddin F, et al (2021) A mathematical modelling and experimental study of annular-radial type magnetorheological damper. Int J Appl Electromagn Mech Preprint:1–18. [CrossRef]
- Kim S-H, Yoon D-S, Kim G-W, et al (2020) Road traveling test for vibration control of a wheel loader cabin installed with magnetorheological mounts. J Intell Mater Syst Struct 32:1336–1348. [CrossRef]
- Kordonski WI, Shorey AB, Tricard M (2006) Magnetorheological Jet (MR JetTM) Finishing Technology. J Fluids Eng 128:20–26. [CrossRef]
- Kim W-B, Nam E, Min B-K, et al (2015) Material removal of glass by magnetorheological fluid jet. Int J Precis Eng Manuf 16:629–637. [CrossRef]
- Park YJ, Lee ES, Choi SB (2022) A Cylindrical Grip Type of Tactile Device Using Magneto-Responsive Materials Integrated with Surgical Robot Console: Design and Analysis. Sensors 22:. [CrossRef]
- Park YJ, Yoon JY, Kang BH, et al (2020) A tactile device generating repulsive forces of various human tissues fabricated from magnetic-responsive fluid in porous polyurethane. Materials (Basel) 13:1–14. [CrossRef]
- Cha S-W, Kang S-R, Hwang Y-H, et al (2018) Design and control of a parallel mechanism haptic master for robot surgery using magneto-rheological clutches and brakes. J Intell Mater Syst Struct 29:3829–3844. [CrossRef]
- Ganapathy Srinivasan R, Shanmugan S, Palani S (2016) Application of magnetorheological fluid in machining process. Int J Control Theory Appl 9:3705–3712.
- Lu H, Hua D, Wang B, et al (2021) The Roles of Magnetorheological Fluid in Modern Precision Machining Field: A Review. Front Mater 8:1–11. [CrossRef]
- B Girinath, A Mathew, J Babu1* JT and SSB (2018) Improvement of Surface Finish and Reduction of Tool Wear during Hard Turning of AISI D3 using Magnetorheological Damper. J Sci Ind Res 77:35–40.
- Mutalib NA, Ismail I, Soffie SM, Aqida SN (2019) Magnetorheological finishing on metal surface: A review. IOP Conf Ser Mater Sci Eng 469:. [CrossRef]
- Gorodkin SR, Kordonski WI, Medvedeva E V., et al (2000) A method and device for measurement of a sedimentation constant of magnetorheological fluids. Rev Sci Instrum 71:2476–2480. [CrossRef]
- Kumar Kariganaur A, Kumar H, Arun M (2022) Effect of temperature on sedimentation stability and flow characteristics of magnetorheological fluids with damper as the performance analyser. J Magn Magn Mater 555:169342. [CrossRef]
- Shah K, Phu DX, Seong MS, et al (2014) A low sedimentation magnetorheological fluid based on plate-like iron particles, and verification using a damper test. Smart Mater Struct 23:. [CrossRef]
- Zhibin S, Yiping L, Ying W, et al (2020) Study on sedimentation stability of magnetorheological fluids based on different lubricant formulations. Mater Res Express 7:. [CrossRef]
- Cheng H, Wang M, Liu C, Wereley NM (2018) Improving sedimentation stability of magnetorheological fluids using an organic molecular particle coating. Smart Mater Struct 27:. [CrossRef]
- Morillas JR, de Vicente J (2020) Magnetorheology: a review. Soft Matter 16:9614–9642. [CrossRef]
- Singh H, Singh Gill H, Sehgal SS (2016) Synthesis and Sedimentation Analysis of Magneto Rheological Fluids. Indian J Sci Technol 9:. [CrossRef]
- Thiagarajan S, Koh AS (2021) Performance and Stability of Magnetorheological Fluids—A Detailed Review of the State of the Art. Adv Eng Mater 23:2001458. [CrossRef]
- Lijesh KP, Muzakkir SM, Hirani H (2016) Rheological measurement of redispersibility and settling to analyze the effect of surfactants on MR particles. Tribol - Mater Surfaces Interfaces 10:53–62. [CrossRef]
- López-López MT, de Vicente J, Bossis G, et al (2005) Preparation of stable magnetorheological fluids based on extremely bimodal iron–magnetite suspensions. J Mater Res 20:874–881. [CrossRef]
- Roupec J, Berka P, Mazůrek I, et al (2017) A novel method for measurement of MR fluid sedimentation and its experimental verification. Smart Mater Struct 26:. [CrossRef]
- Hong KP, Song KH, Cho MW, et al (2018) Magnetorheological properties and polishing characteristics of silica-coated carbonyl iron magnetorheological fluid. J Intell Mater Syst Struct 29:137–146. [CrossRef]
- Heitkam S, Yoshitake Y, Toquet F, et al (2013) Speeding up of sedimentation under confinement. Phys Rev Lett 110:1–5. [CrossRef]
- Xie L, Choi Y-T, Liao C-R, Wereley NM (2016) Long term stability of magnetorheological fluids using high viscosity linear polysiloxane carrier fluids. Smart Mater Struct 25:075006. [CrossRef]
Figure 1.
The schematic of surface precision machining.
Figure 1.
The schematic of surface precision machining.
Figure 5.
Experimental setup, a) front view of hall sensor, (b) front view of MR fluids and magnetic circuit, (c) overall experimental setup.
Figure 5.
Experimental setup, a) front view of hall sensor, (b) front view of MR fluids and magnetic circuit, (c) overall experimental setup.
Figure 6.
The calibrated value of the unit of magnetic flux density by the hall sensor at a current input of 2 A under (a) sine wave excitation (b) square wave excitation.
Figure 6.
The calibrated value of the unit of magnetic flux density by the hall sensor at a current input of 2 A under (a) sine wave excitation (b) square wave excitation.
Figure 7.
The comparison of sedimentation rate according to wave types and current input intensity using the small tube.
Figure 7.
The comparison of sedimentation rate according to wave types and current input intensity using the small tube.
Figure 8.
MR fluids samples for small measuring tube, (a) initial condition (0 h), (b) 0 A (336 h), (c) sine wave, 0.5 A (336 h), (d) sine wave, 1 A (336h), (e) sine wave, 1.5 A (336h), (f) sine wave, 2 A (336h), (g) square wave, 1 A (336h), (h) square wave, 2 A (336h).
Figure 8.
MR fluids samples for small measuring tube, (a) initial condition (0 h), (b) 0 A (336 h), (c) sine wave, 0.5 A (336 h), (d) sine wave, 1 A (336h), (e) sine wave, 1.5 A (336h), (f) sine wave, 2 A (336h), (g) square wave, 1 A (336h), (h) square wave, 2 A (336h).
Figure 9.
The distribution of iron particles under exciting electromagnetic fields.
Figure 9.
The distribution of iron particles under exciting electromagnetic fields.
Figure 10.
The comparison of sedimentation rate according to different current input intensities under sine wave using the small tube.
Figure 10.
The comparison of sedimentation rate according to different current input intensities under sine wave using the small tube.
Figure 11.
The comparison of sedimentation rate according to different current input intensities under sine wave using the small tube and big tube.
Figure 11.
The comparison of sedimentation rate according to different current input intensities under sine wave using the small tube and big tube.
Figure 12.
MR fluids samples for big measuring tube, (a) initial condition (0 h), (b) 0 A (336 h), (c) sine wave, 1 A (336 h), (d) sine wave, 2 A (336h).
Figure 12.
MR fluids samples for big measuring tube, (a) initial condition (0 h), (b) 0 A (336 h), (c) sine wave, 1 A (336 h), (d) sine wave, 2 A (336h).
Table 3.
Experimental parameters for the small tube diameter (13 mm).
Table 3.
Experimental parameters for the small tube diameter (13 mm).
| Wave Type |
Current Input |
Frequency |
| Baseline |
- |
- |
| Sine Wave |
0.5 A |
0.1 Hz |
| Sine Wave |
1 A |
0.1 Hz |
| Sine Wave |
1.5 A |
0.1 Hz |
| Sine Wave |
2 A |
0.1 Hz |
| Square Wave |
1 |
0.1 Hz |
| Square Wave |
2A |
0.1 Hz |
Table 4.
Experimental parameters for the big tube diameter (15 mm).
Table 4.
Experimental parameters for the big tube diameter (15 mm).
| Wave Type |
Current Input |
Frequency |
| Baseline |
- |
- |
| Sine Wave |
1 A |
0.1 Hz |
| Sine Wave |
2 A |
0.1 Hz |
|
Disclaimer/Publisher’s Note: The statements, opinions and data contained in all publications are solely those of the individual author(s) and contributor(s) and not of MDPI and/or the editor(s). MDPI and/or the editor(s) disclaim responsibility for any injury to people or property resulting from any ideas, methods, instructions or products referred to in the content. |
© 2024 by the authors. Licensee MDPI, Basel, Switzerland. This article is an open access article distributed under the terms and conditions of the Creative Commons Attribution (CC BY) license (http://creativecommons.org/licenses/by/4.0/).
