1. Introduction
The Shannonian entropy [
1], namely
reads as:
serves as the ith-event probability.
The probability of the
ith -event is given in this expression as
. This entropy establishes the definition of information in information theory. There are many methods for measuring information, as well as in this scenario, we argue regarding how entropy and
interact with one another.
, is a measure that assesses how a fractal pattern expands beyond the area it occupies, indicating the complexity of the pattern in spatial dimensions.
[
2,
3,
4,
5,
6,
7], involves calculations that consider sticks’ number (
) required in coastline coverage and the factor of scaling (ε). By analyzing these factors, the fractal dimension provides insights into the intricate nature of patterns and their representation of complexity in spatial dimensions.
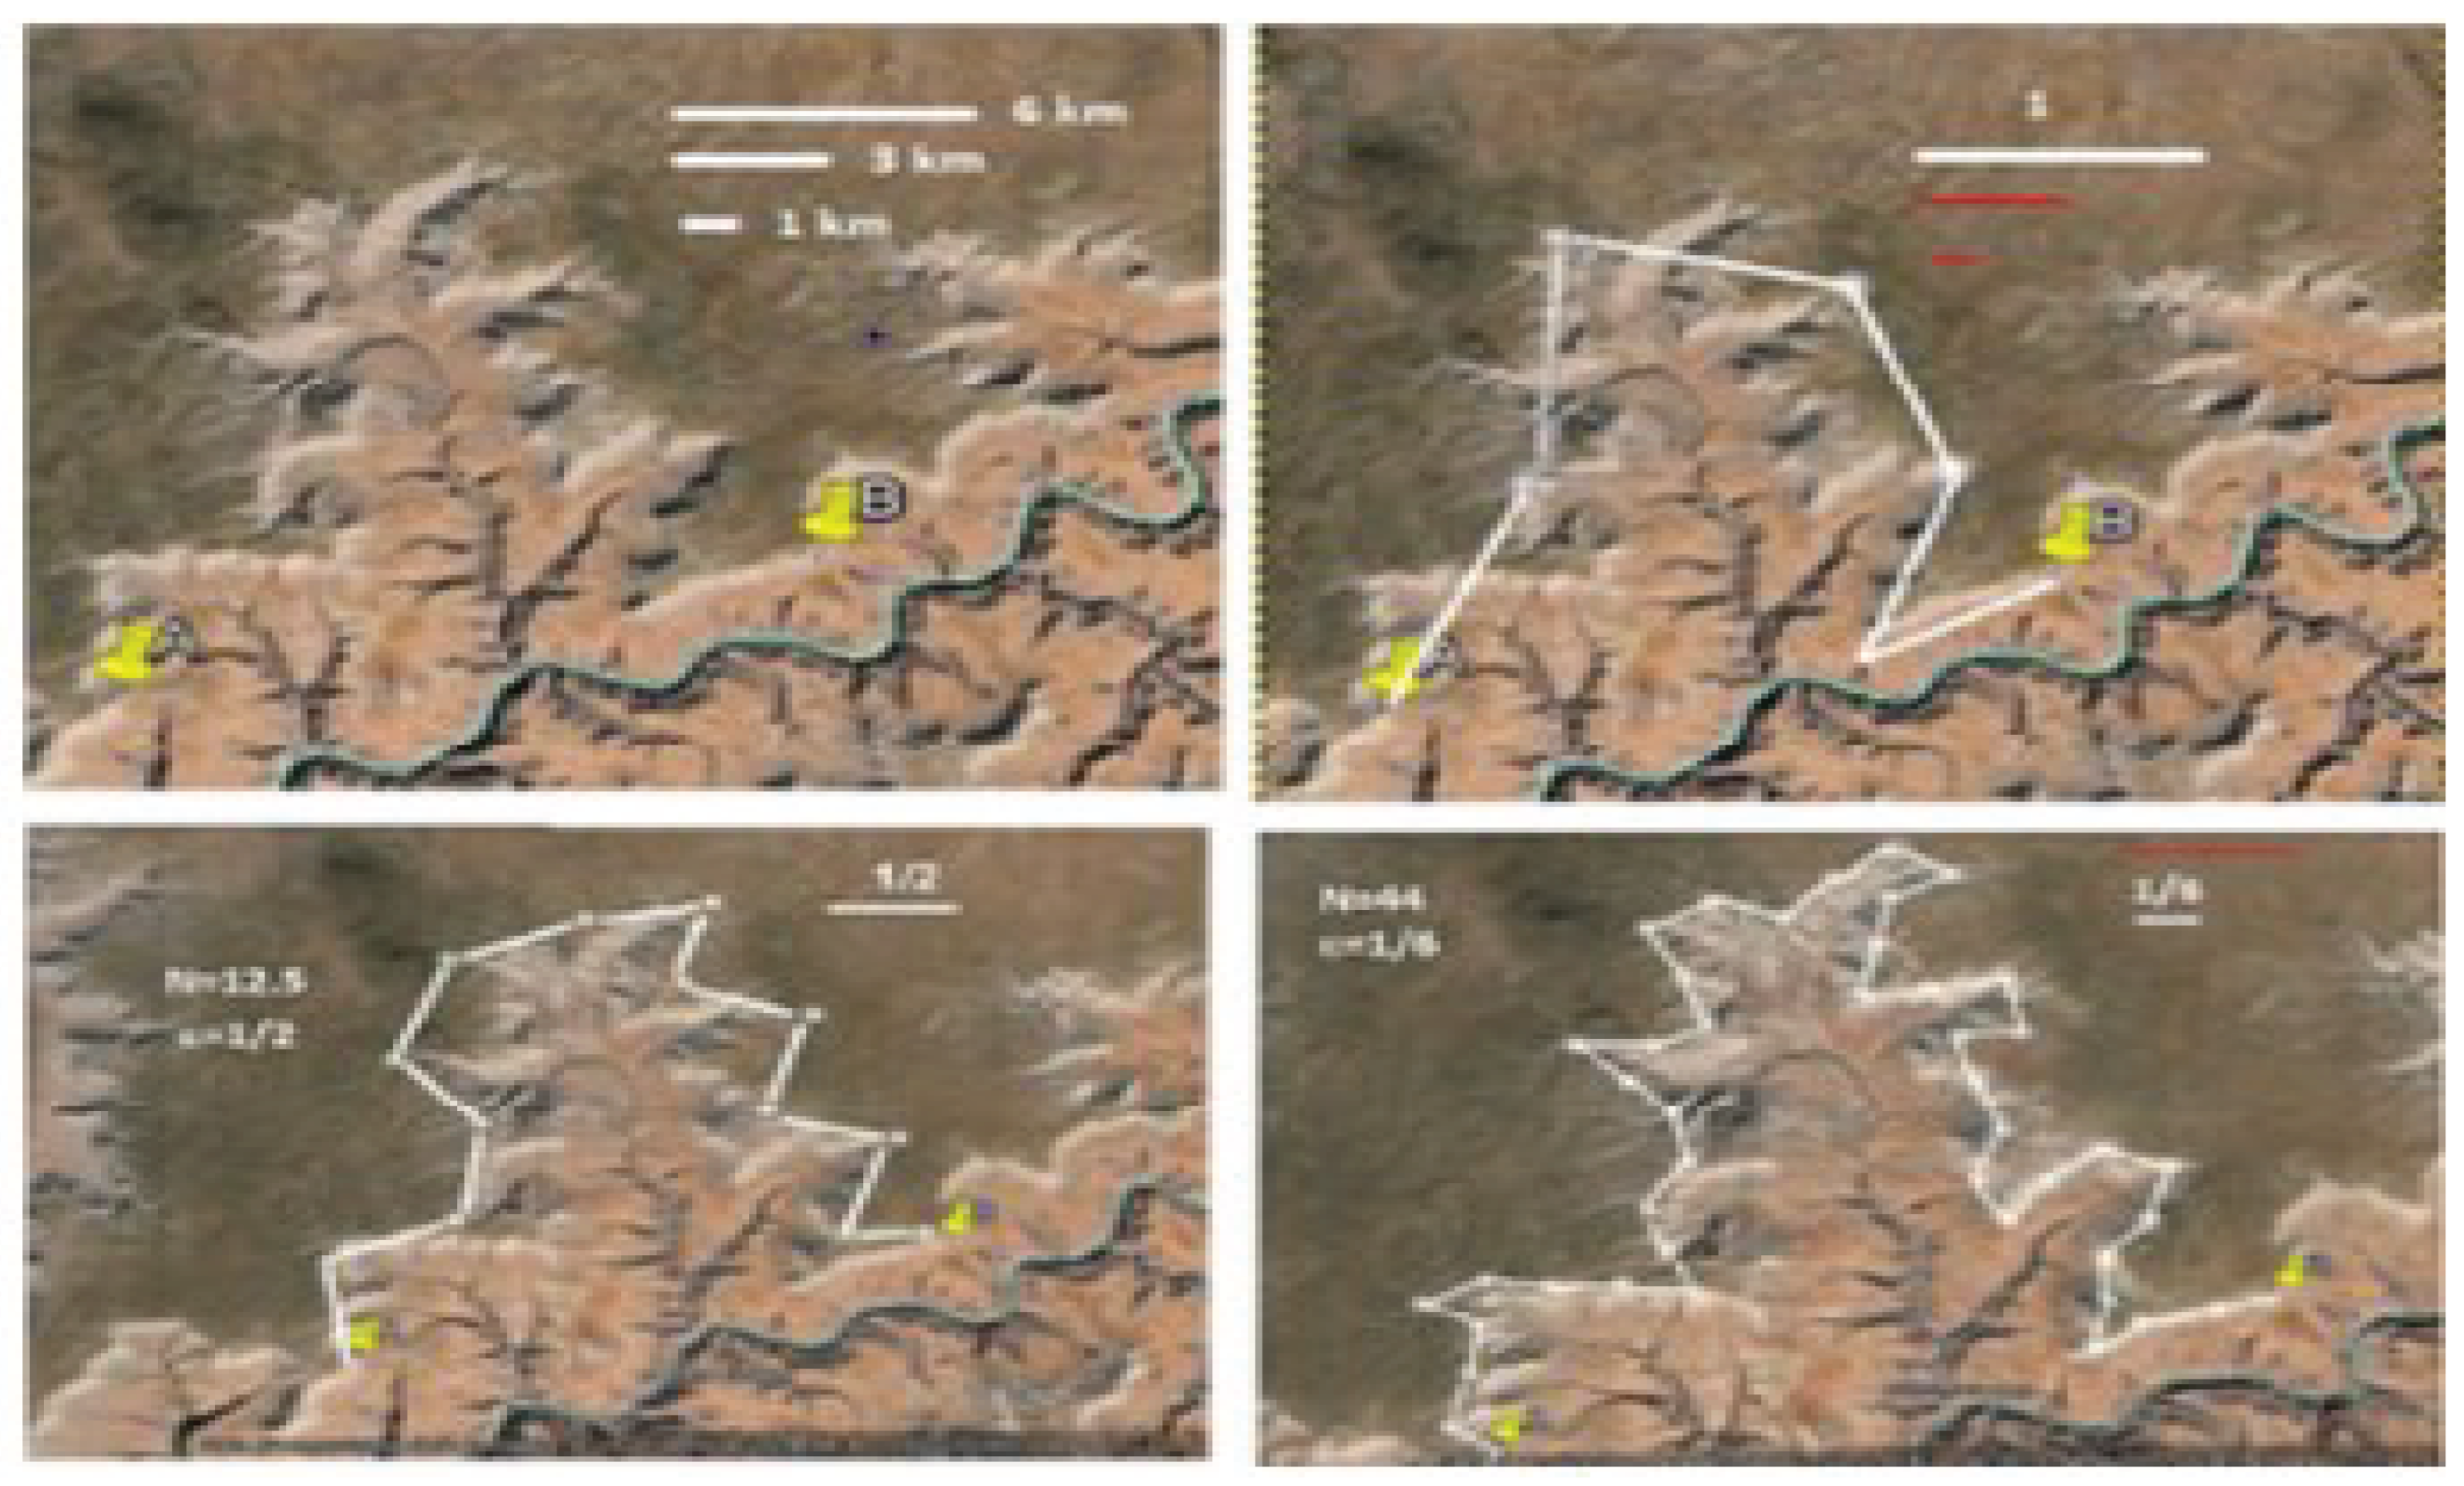
[
8] created a map and rigid sticks for an experiment like Richardson's in the book by using GEs pictures combined with GIMP (c.f.,
Figure 1). The practical application of this technique for measuring the fractal dimension was demonstrated on a part of the Grand Canyon.
The road map of this paper is: Section II provides an overview of previous research on deriving fractal dimension using entropy. Section III introduces the definition of the Rényi formalism of queue in the stability phase and presents new results combined with a numerical analysis that demonstrates the substantial influence of the parameters on the behavior of the fractal dimension. Section IV explores some potential applications to BDAs, Finally, closing remarks combined with the next phase of research are provided in section V.
2. D of Entropies
In [
8], the fractal dimension (
)associated with different types of entropy measures was determined, for entropies measures [
9,
10,
11,
12]. These derivations were conducted under proposing that all outcomes have equal probabilities.
The Shannonian fractal dimension [
8] reads:
Rényian dimension of order
[
10]
As for the Tsallisian case [
8], of order
,
With ,
The Kaniadakisian fractal dimension [
8] for the entropic index,
κ reads as:
Notably, are entropic index impacted. The Koch snowflake (KSF) fractal dimension follows for ( and ε = 1/3).
3. Rényian Formalism of Stable Queueuing System
Non-extensivity coins interactions of long range [
13].
The Rényi’s [
9] non-extensive maximum entropy functionals reads:
respectively, for a constant
The Rényi’s non-extensive maximum entropy solution,
,
queue in the stability under normalization, server utilization and Mean Queue Length reads:
where
and
x to be:
with
With
The Generalized Z-Entropy (GZE) [
14] reads as:
Such that
4. New Results
Theorem 2
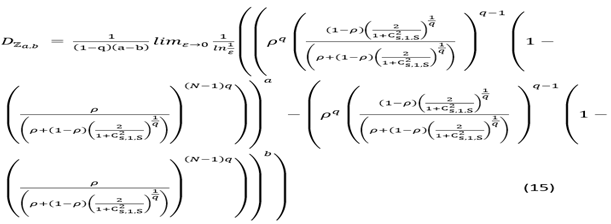
Engaging [
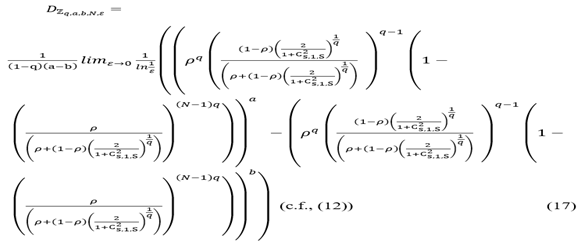
14], (9)-(14), the GZE fractal dimension,
is devised by:
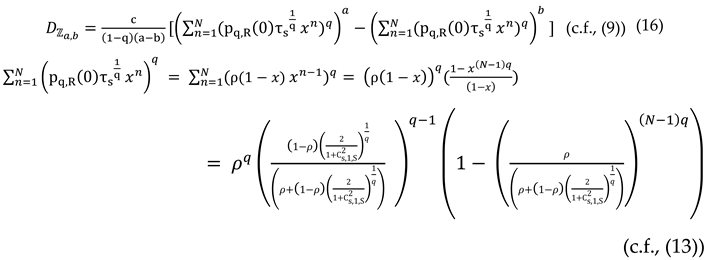
Proof
By the definition,
Hence, it follows that:
Hence, (15) follows.
Accordingly, let’s discuss the following cases:
Case 1:
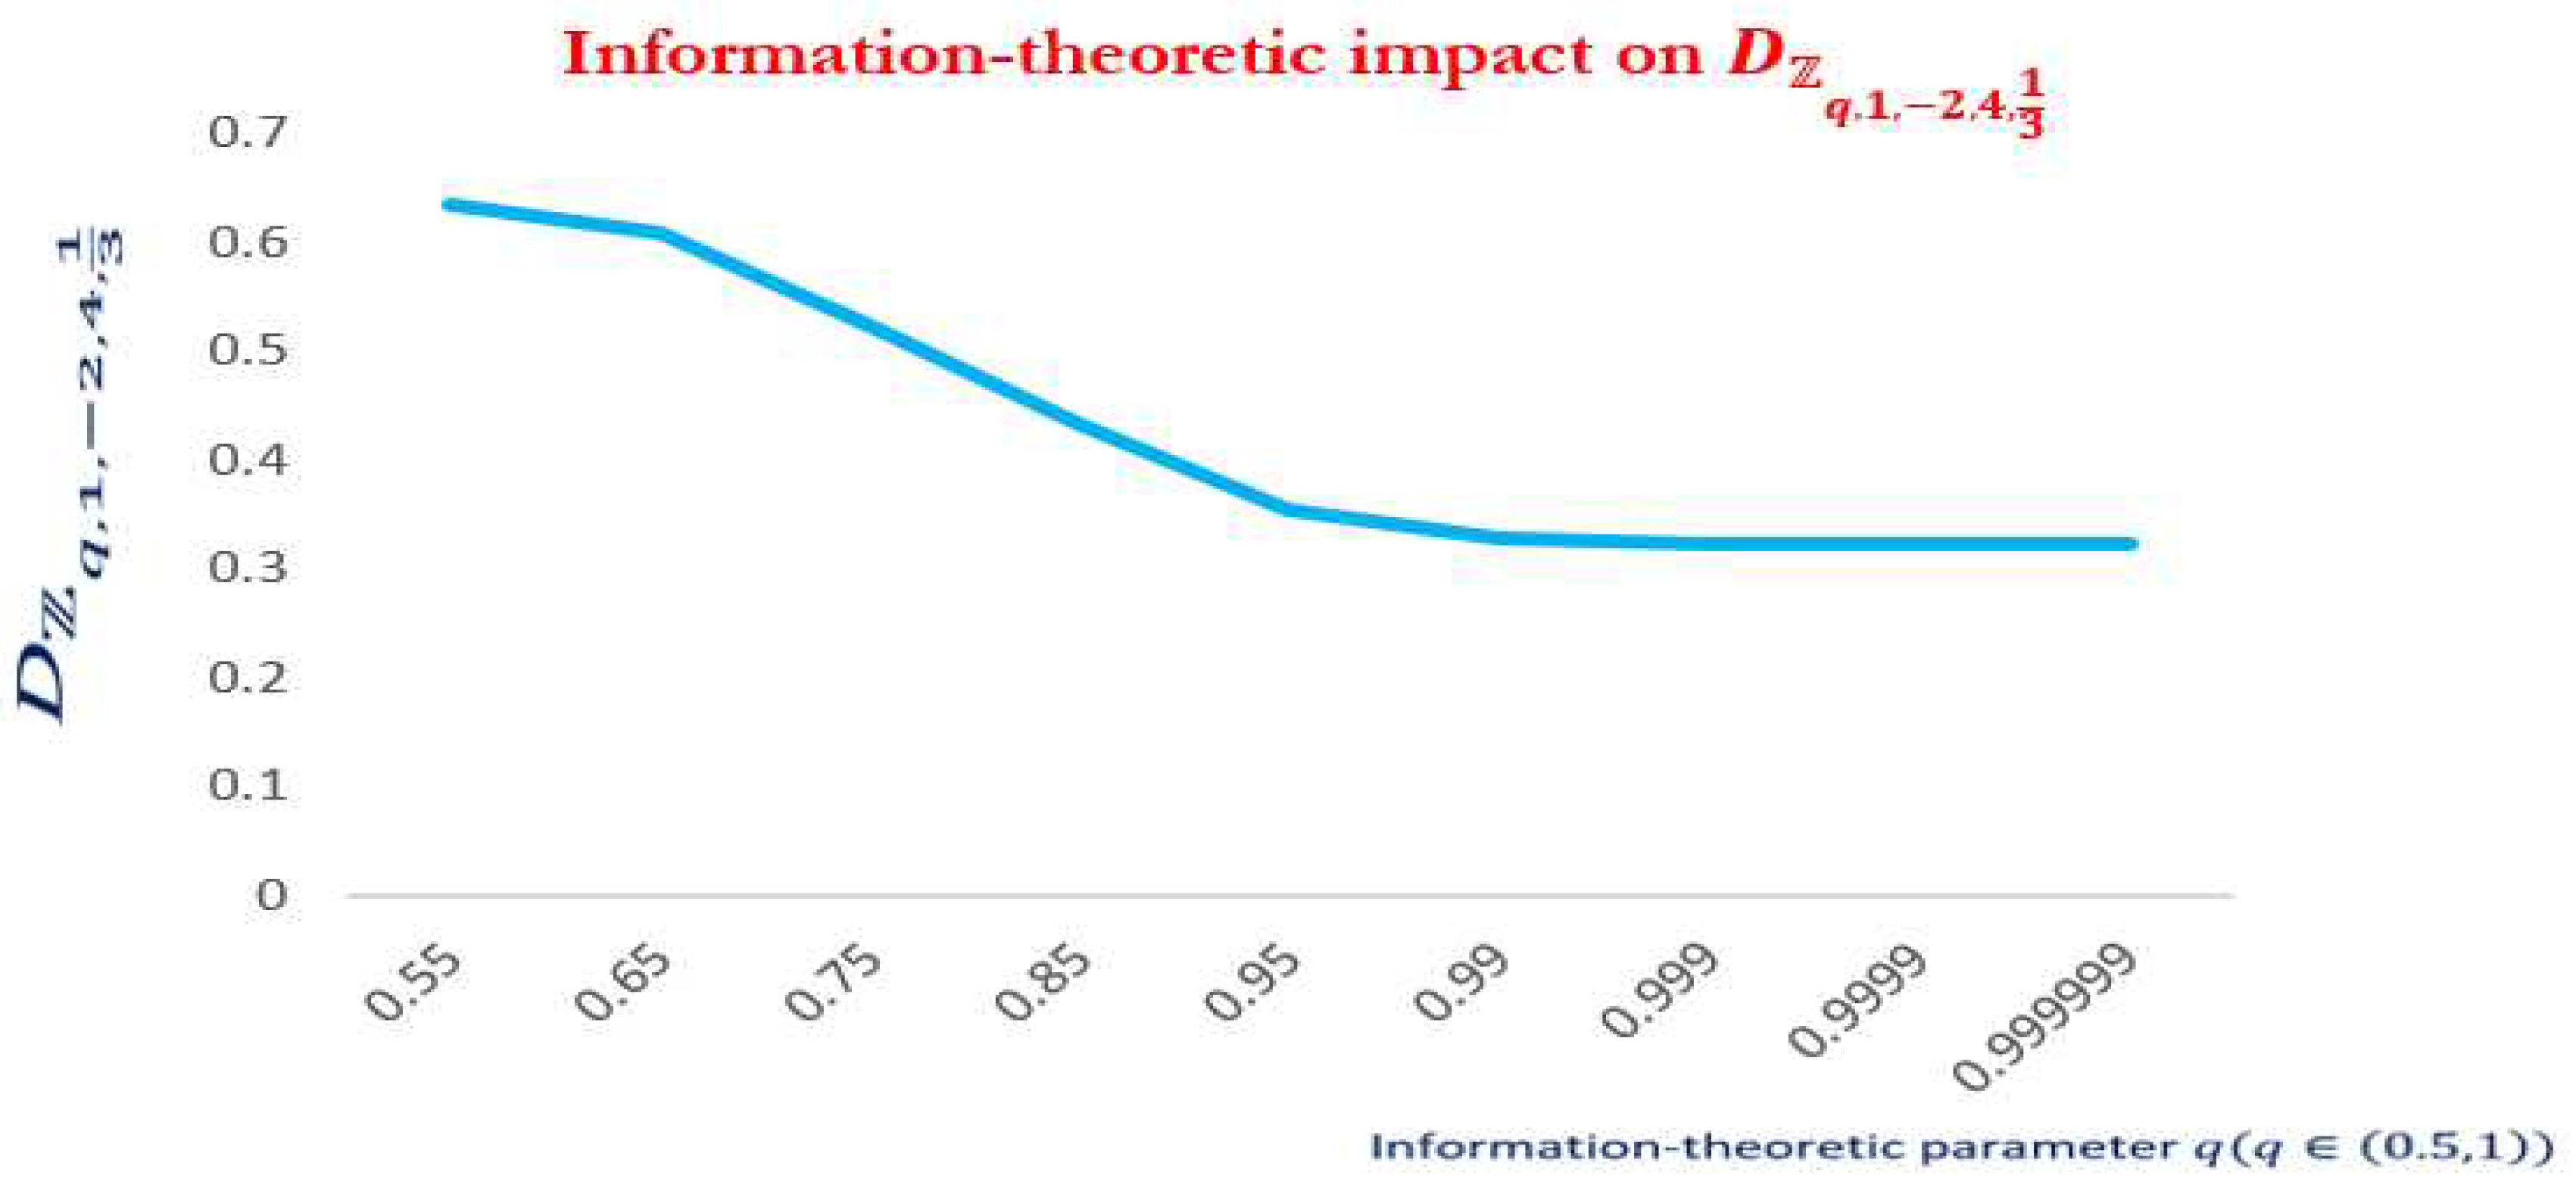
The information-theoretic impact on
is visualized by
Figure 3.
Approaching the instability zone,
For
, Clearly, we have
Figure 4,
Figure 5 and
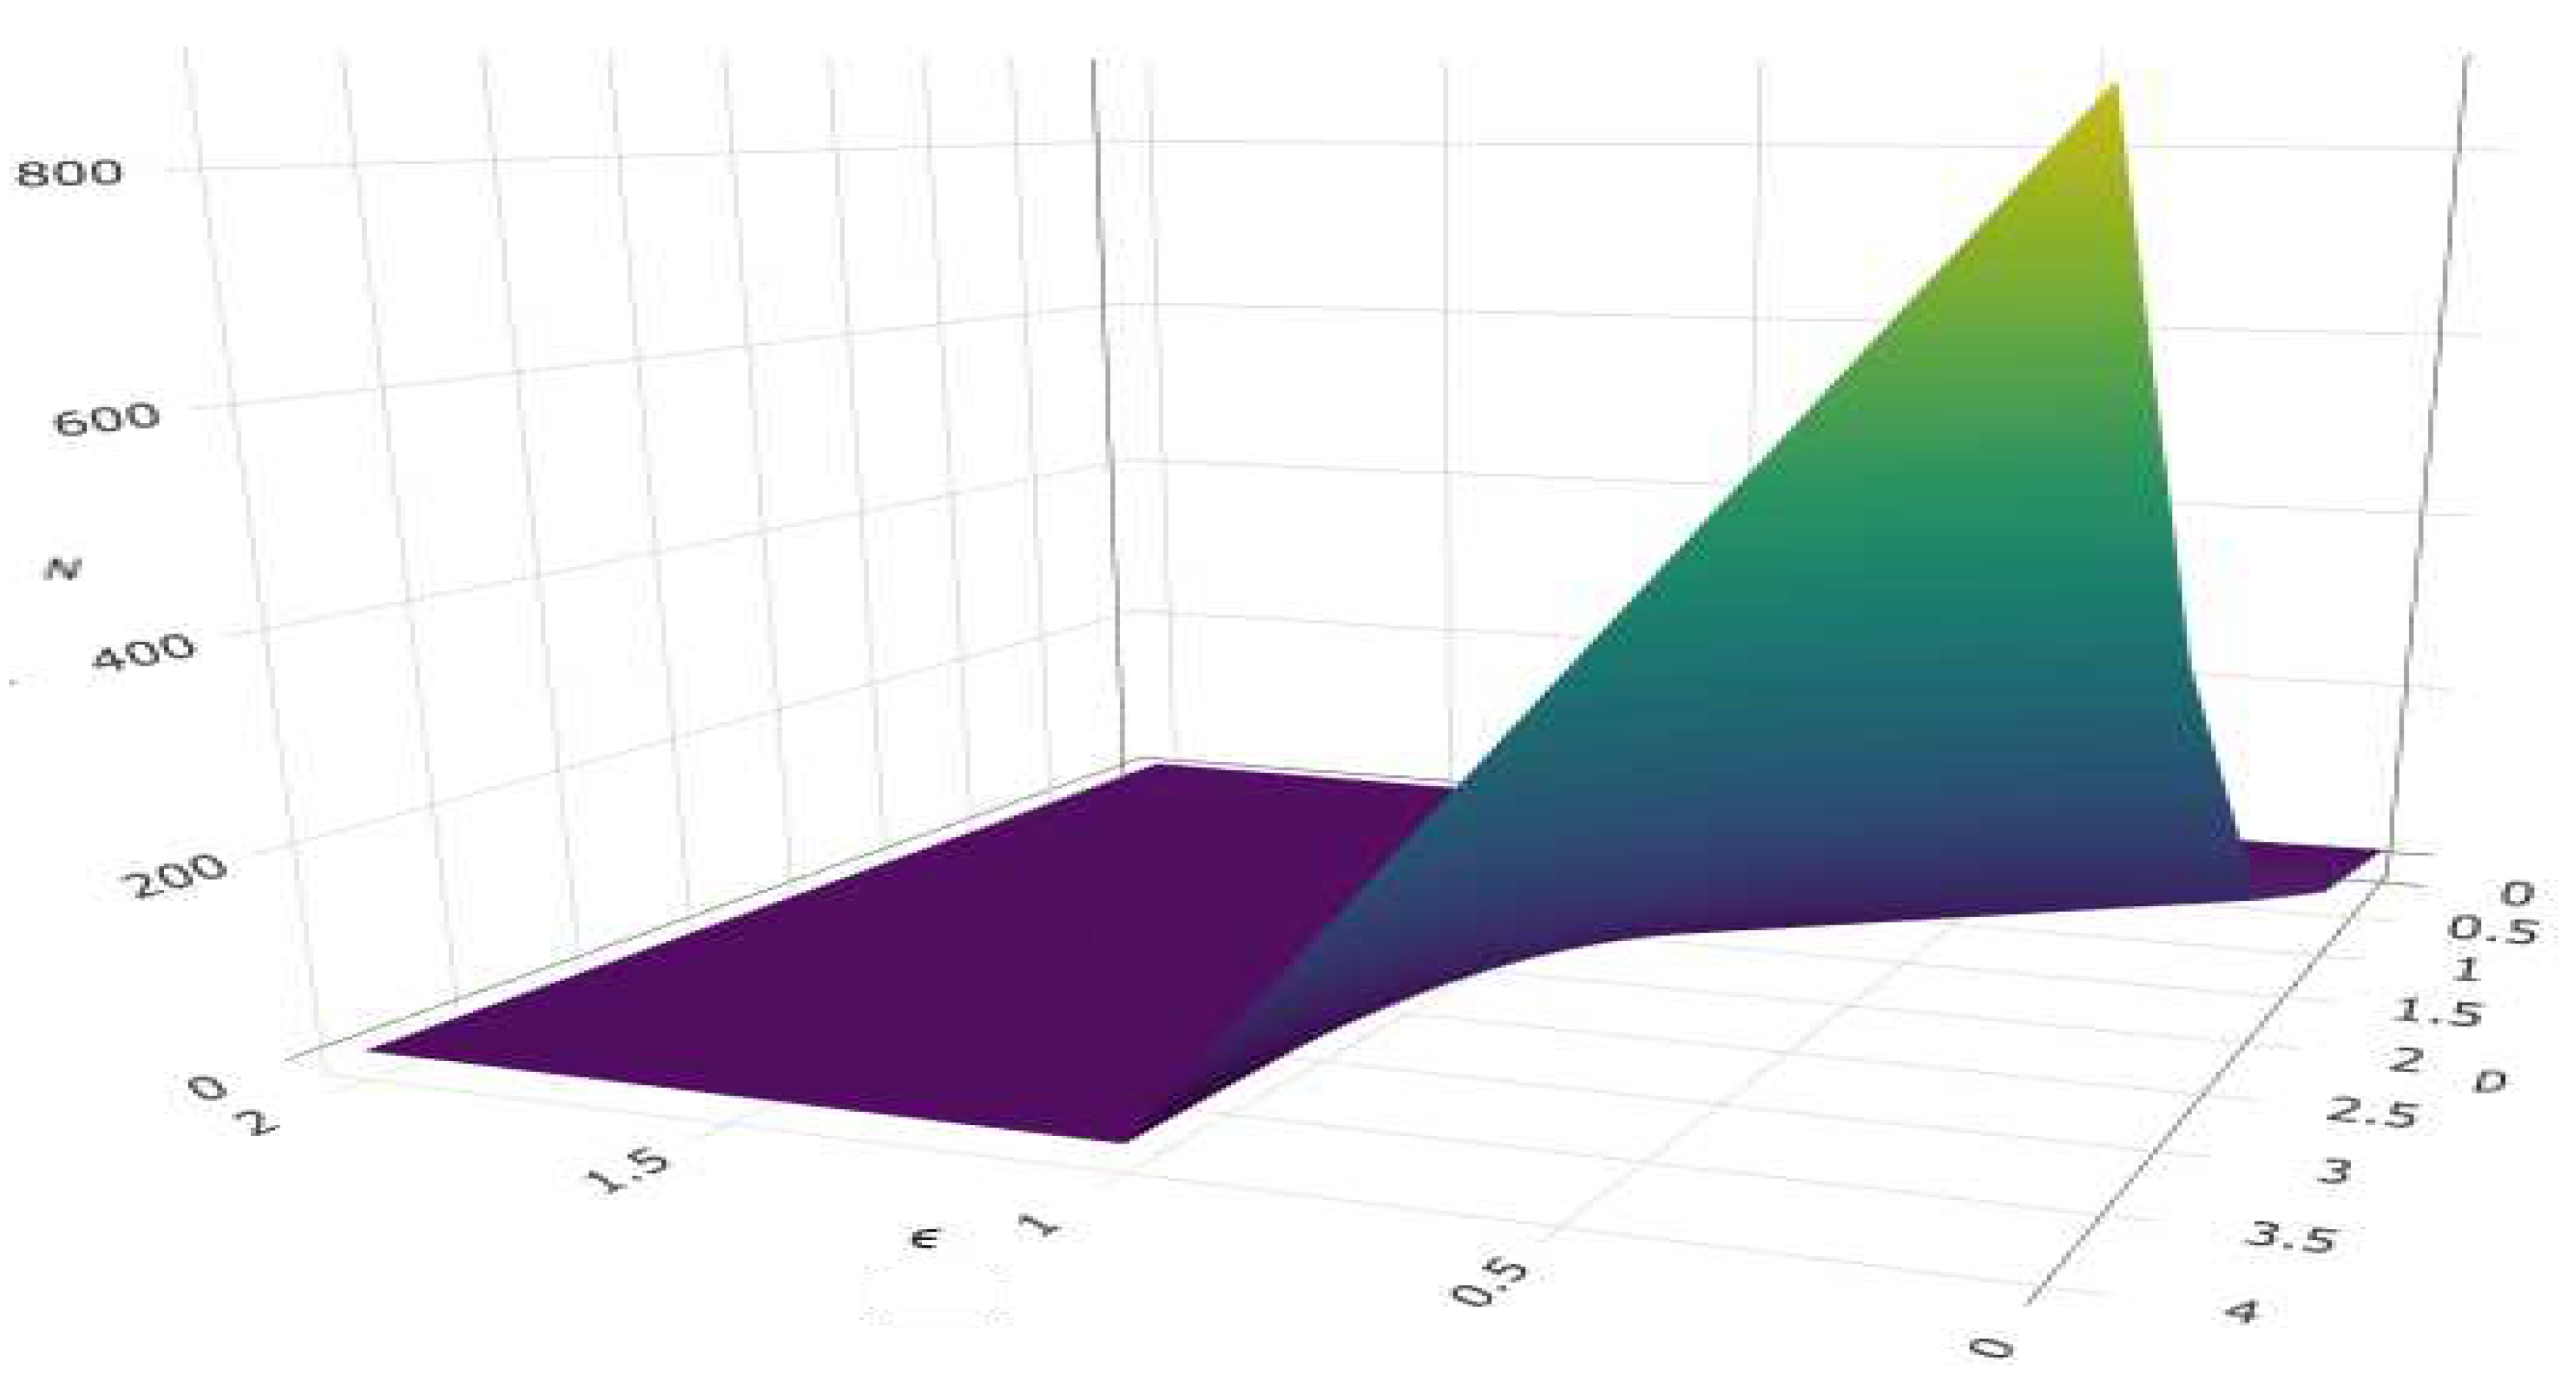
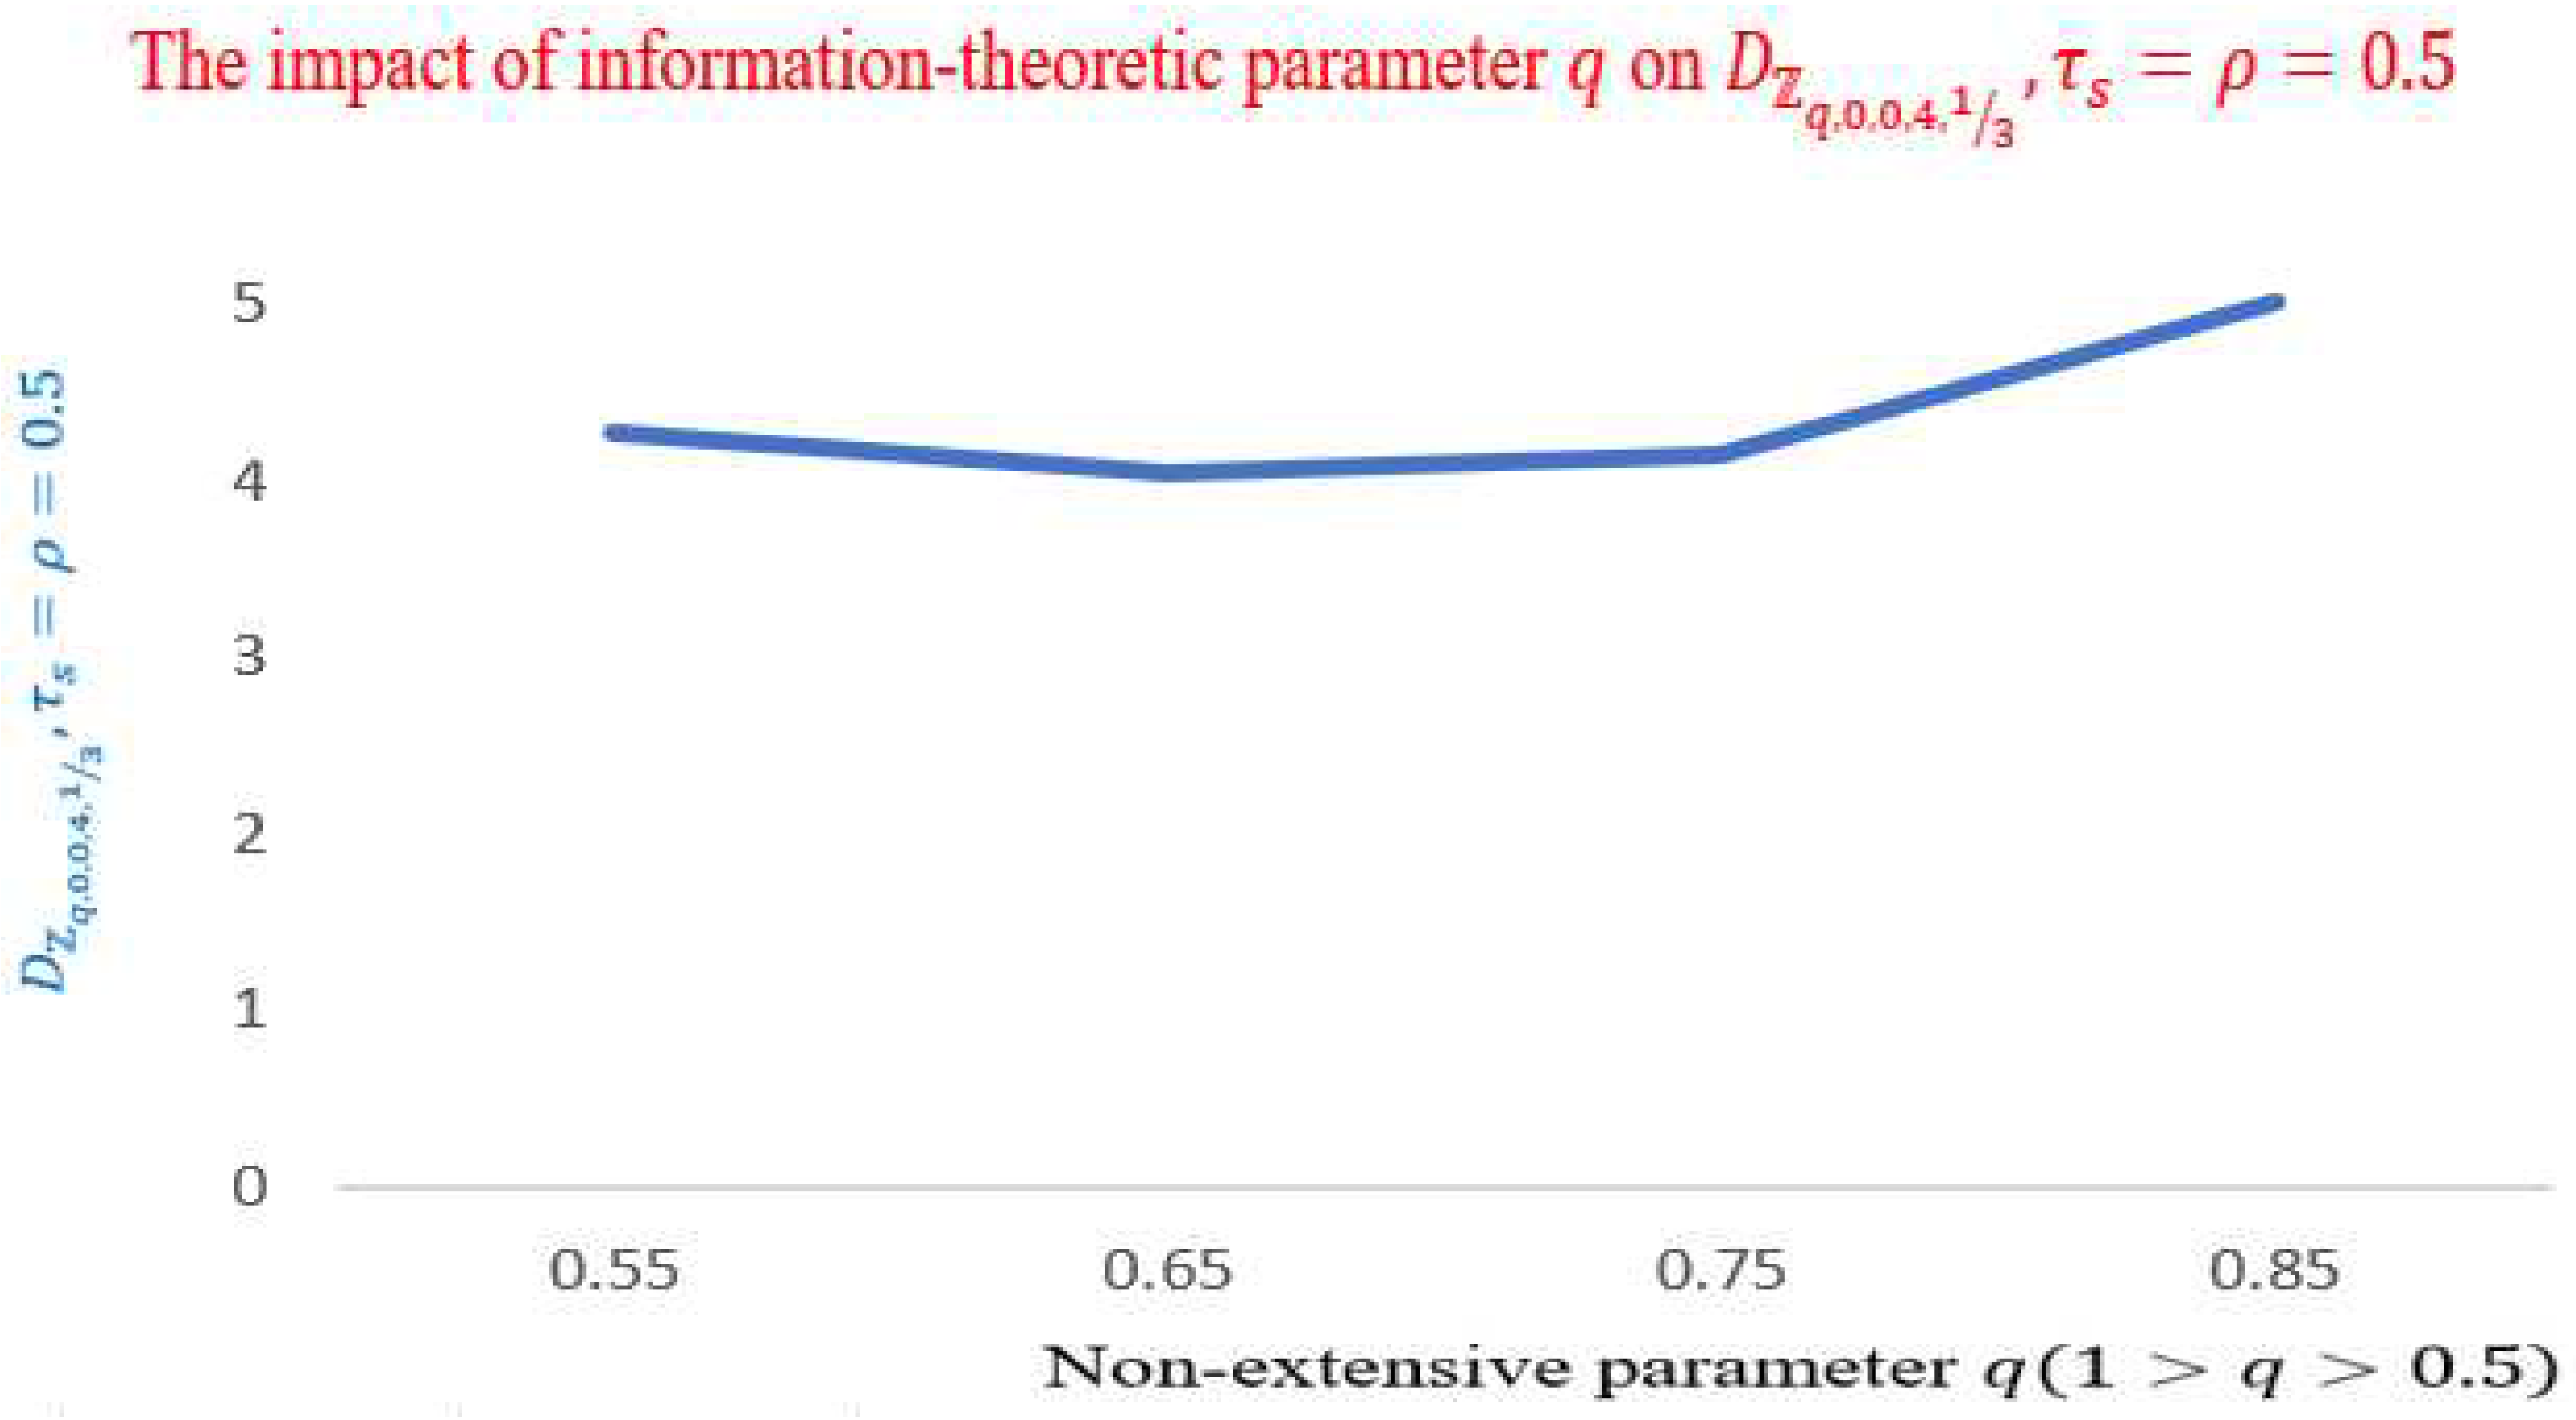
Figure 6 portrays the significant impact of
on
for the prescribed values
The impact of information-theoretic parameter on is clear, as decreases while is in the extensivity phase and starts to increase drastically when is non-extensive.
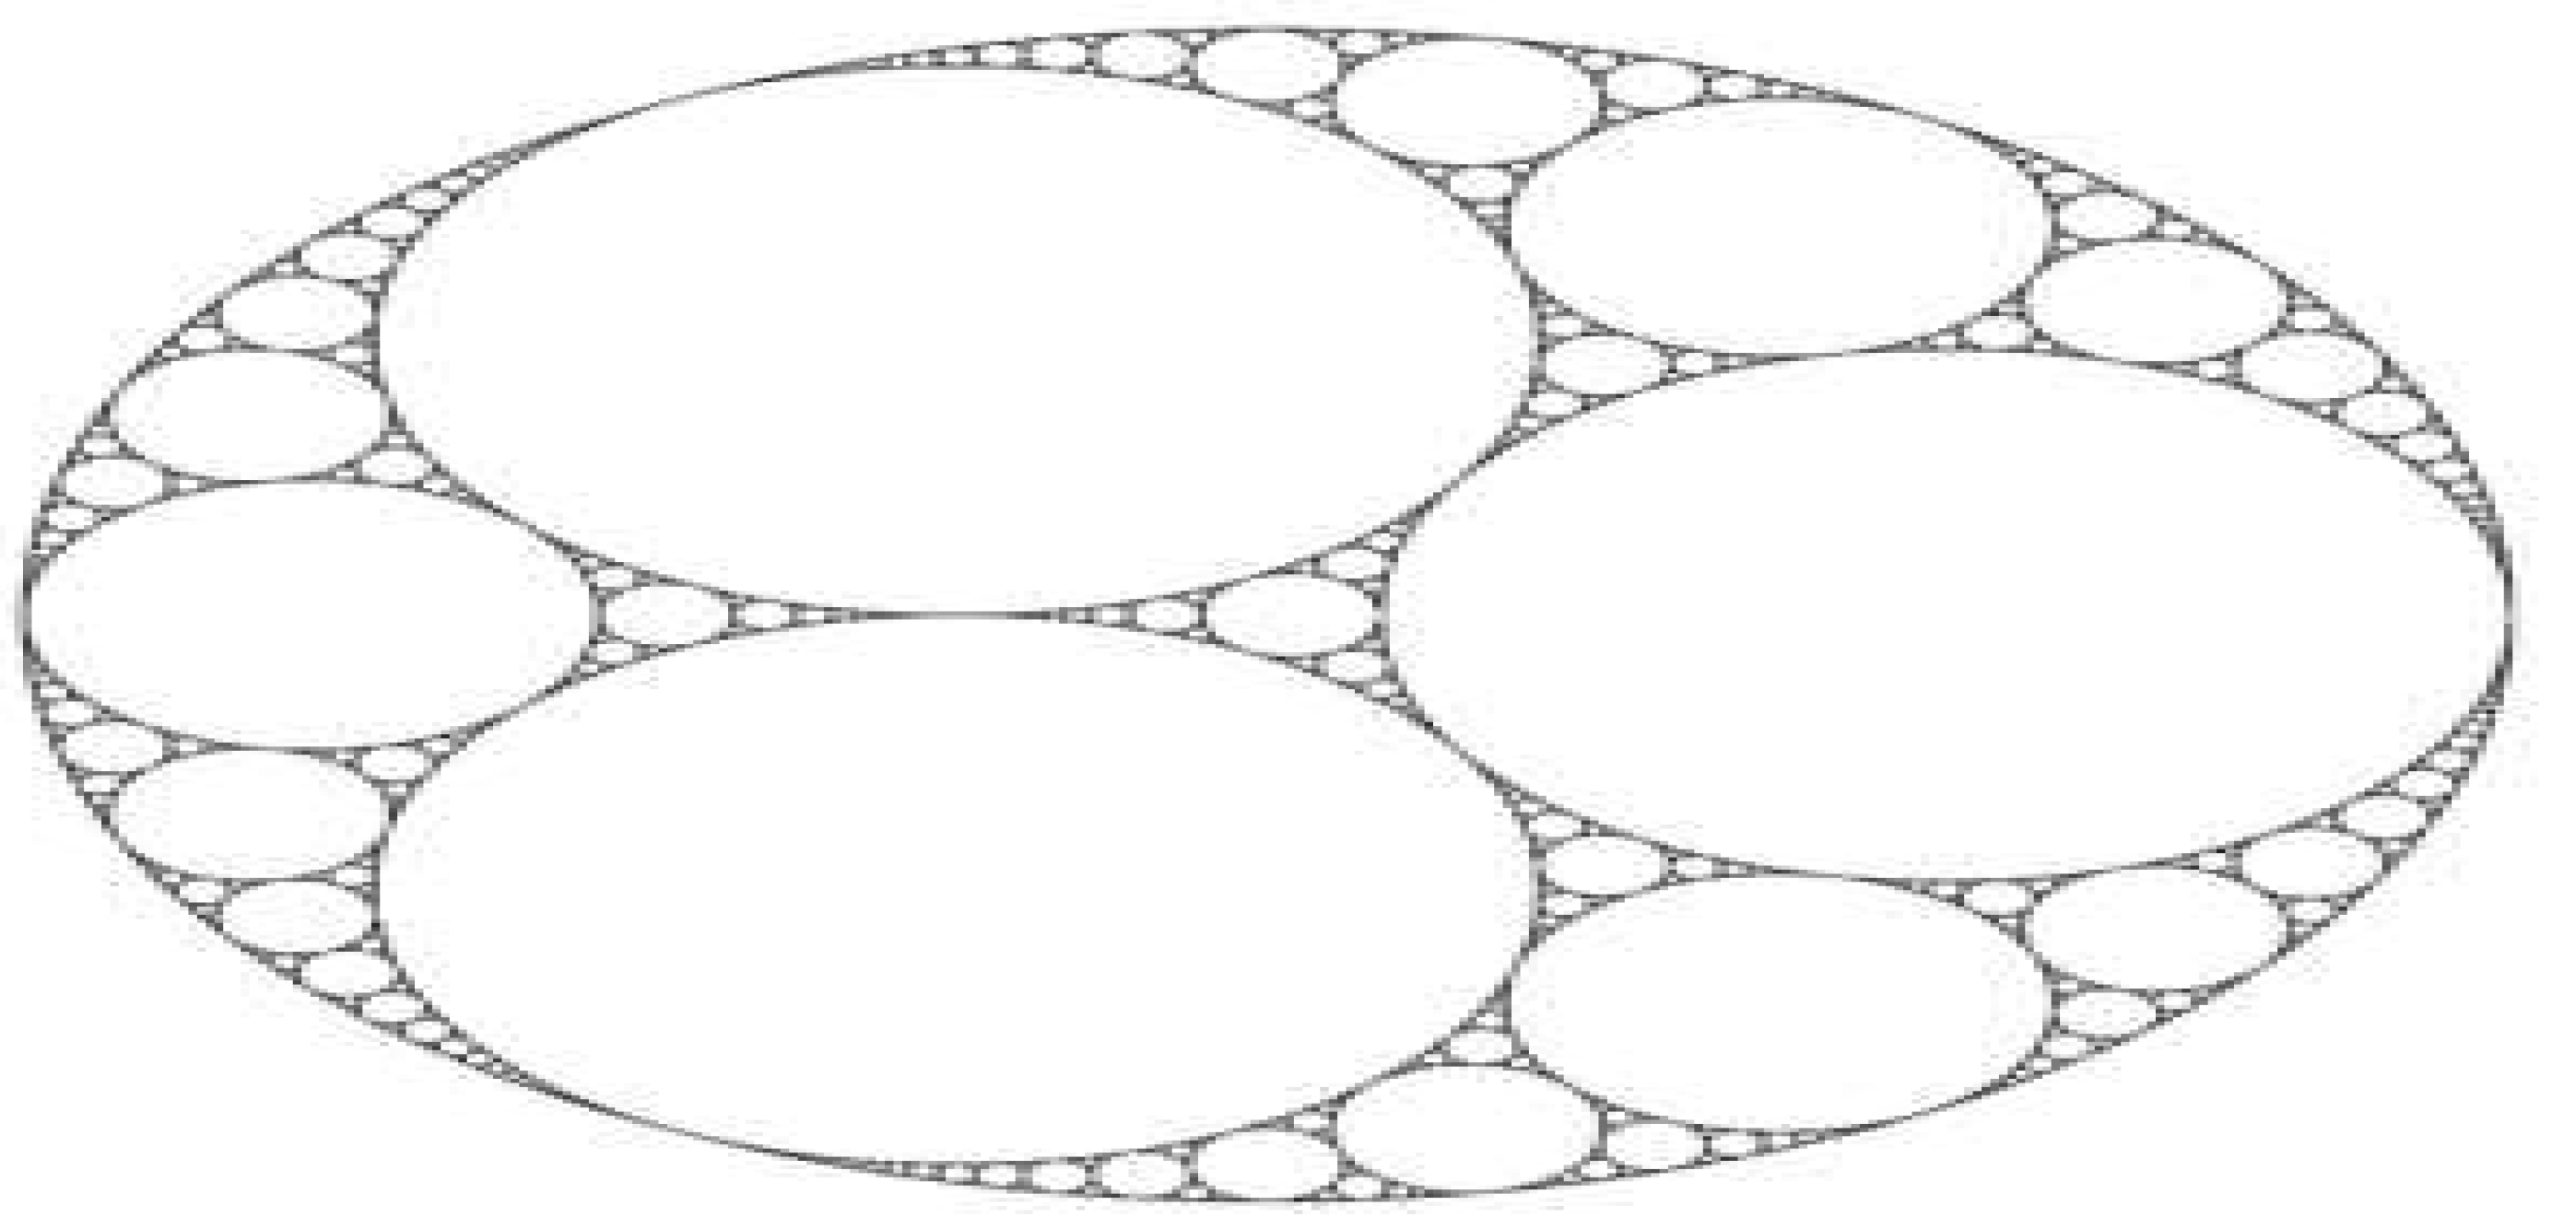
There is no clearly defined scaling-dimension since the Apollonian gasket [
15,
16,
17] is only roughly self-similar. However, any "triangular" region enclosed within three circles appeared to be a curved Sierpinski gasket. Remember that scaling it by a factor of 2 requires 3 copies of the Sierpinski gasket as shown by
Figure 7 and
Figure 8(c.f., [
17]). Consequently, we would expect that the Apollonian gasket's fractal dimension will be near to:
Case 2: (instability)
Mathematically speaking, the un-defindedness of SG at many points is based on the fact of attaining complex values at these points, for example:
So, we are in a situation of a complex valued SG fractal dimension. After some mathematical manipulation, one gets:
Notably, the fluctuations of the derived values of SG fractal dimension between decreasing and the drastic decreasing along the path of approaching sufficiently large values of while approaching the extensivity zone, . For we arrive at invite value for the corresponding SG fractal dimension. Clearly, this shows the significant information-theoretic impact in both non-extensive and extensive phases. This paper provides another revolutionary approach to the traditional definition of both Apollonian and SG dimensions, while mine includes several respective parameters, including queueing and information-theoretic parameters.
5. D Applications to PDAs
A data structure called the box locality index (BLI) is used to adapt the box-counting method for fractal dimension calculation [
18] for huge data. By encoding the information required for fractal dimension computation, the BLI streamlines the hierarchical structure. Scalable fractal dimension calculation for large data is made possible by the BLI by utilising distributed computing techniques like MapReduce and Spark. This is valuable for a variety of machine learning techniques and data analytics jobs like feature selection and dimensionality reduction.
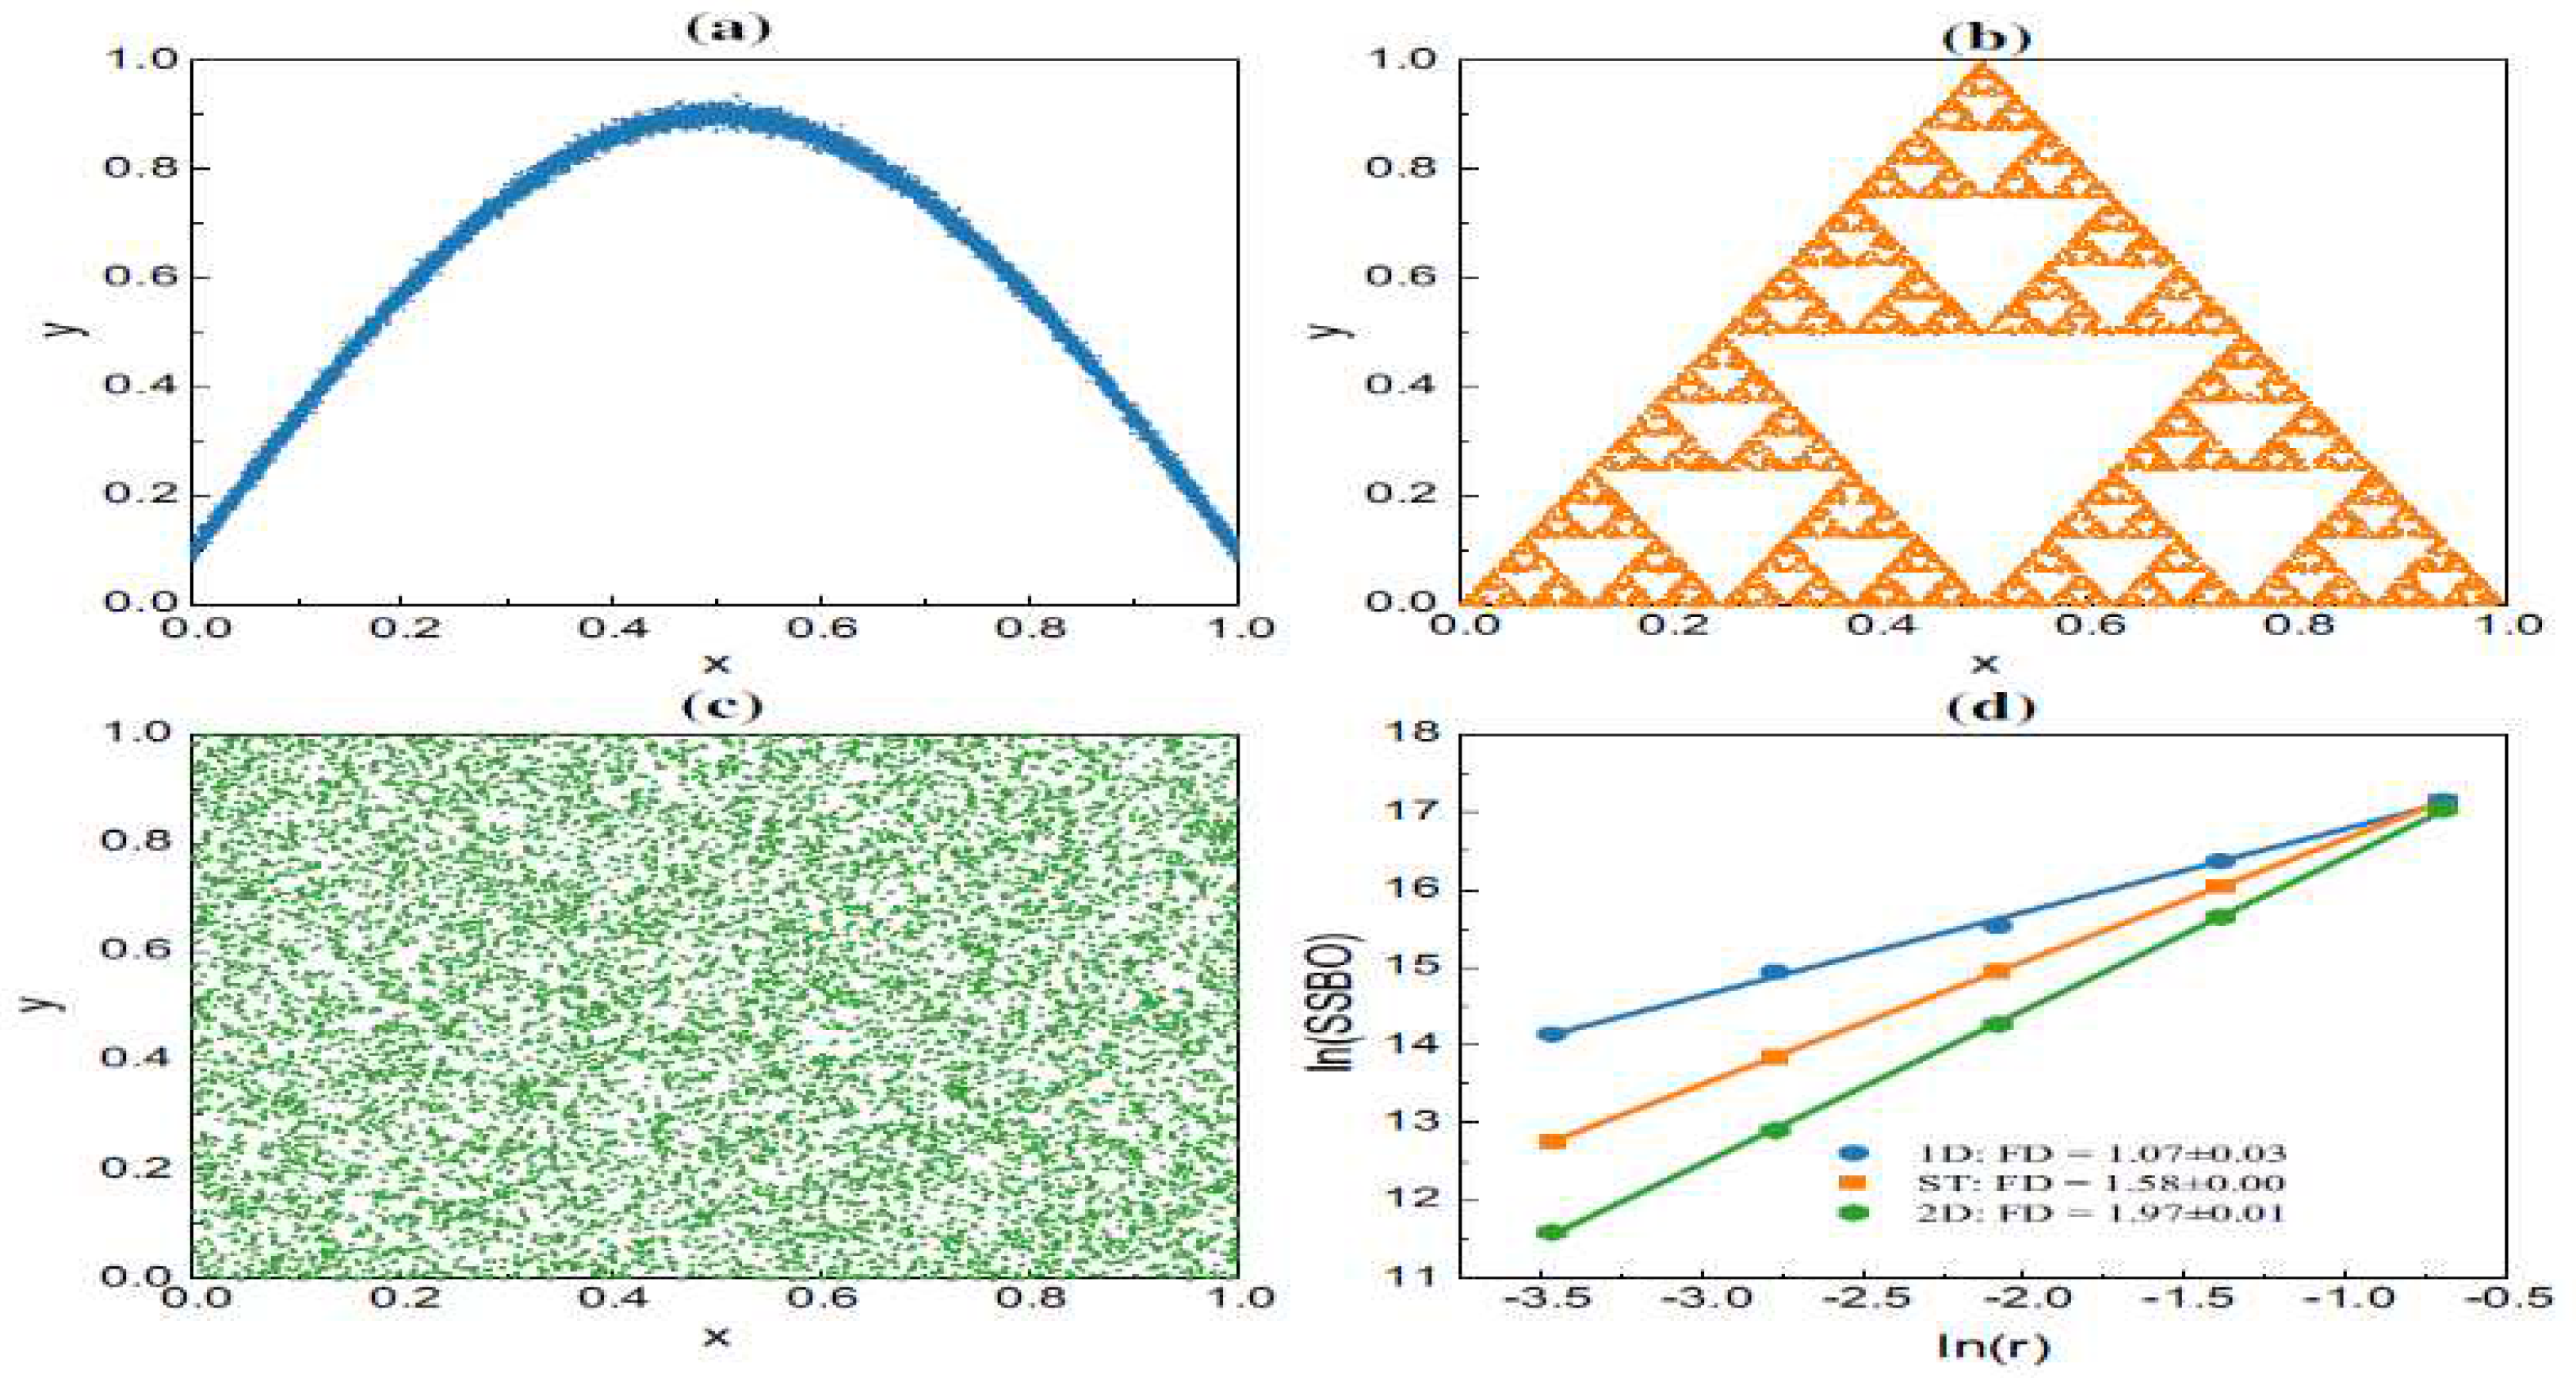
One methodology that is frequently used to determine the fractal dimension of a dataset is the box-counting method. It involves dividing the dataset's embedding space into a grid of boxes and counting the number of points in each box. By analyzing the relationship between the size of the boxes and the number of points, the fractal dimension can be estimated. This approach is illustrated with three example datasets in
Figure 9 [
18], where the first and third datasets represent one- and two-dimensional objects, respectively, while the second dataset is a well-known fractal called the Sierpinski triangle with a fractal dimension of approximately 1.58. The given one-dimensional dataset generated by a mathematical function. The dataset consists of points (y) that are calculated using the equation
y = 0.1 + 0.8sin(
πx) +
σ, where
x values are uniformly distributed between 0 and 1, and σ represents random noise following a normal distribution with mean 0 and standard deviation 0.01. This dataset is an example of a 1D dataset with a sinusoidal pattern and random noise.
İn [
19], the challenge of online clustering in high-dimensional data and the limitations of existing algorithms in handling this task are thoroughly discussed. Therefore, [
19] proposed a novel approach called FractStream to discover core fractal clusters, progressive fractal clusters, and outlier fractal clusters using fractal dimension, basic window technology, and a damped window model. The proposed technique [
19] aimed to reduce search complexity, execution time, and memory usage, and its effectiveness and efficiency are demonstrated through experimental studies on various datasets.
An exposition of the construction of a multi-layered nested grid structure for determining the fractal dimension of a dataset is undertaken by [
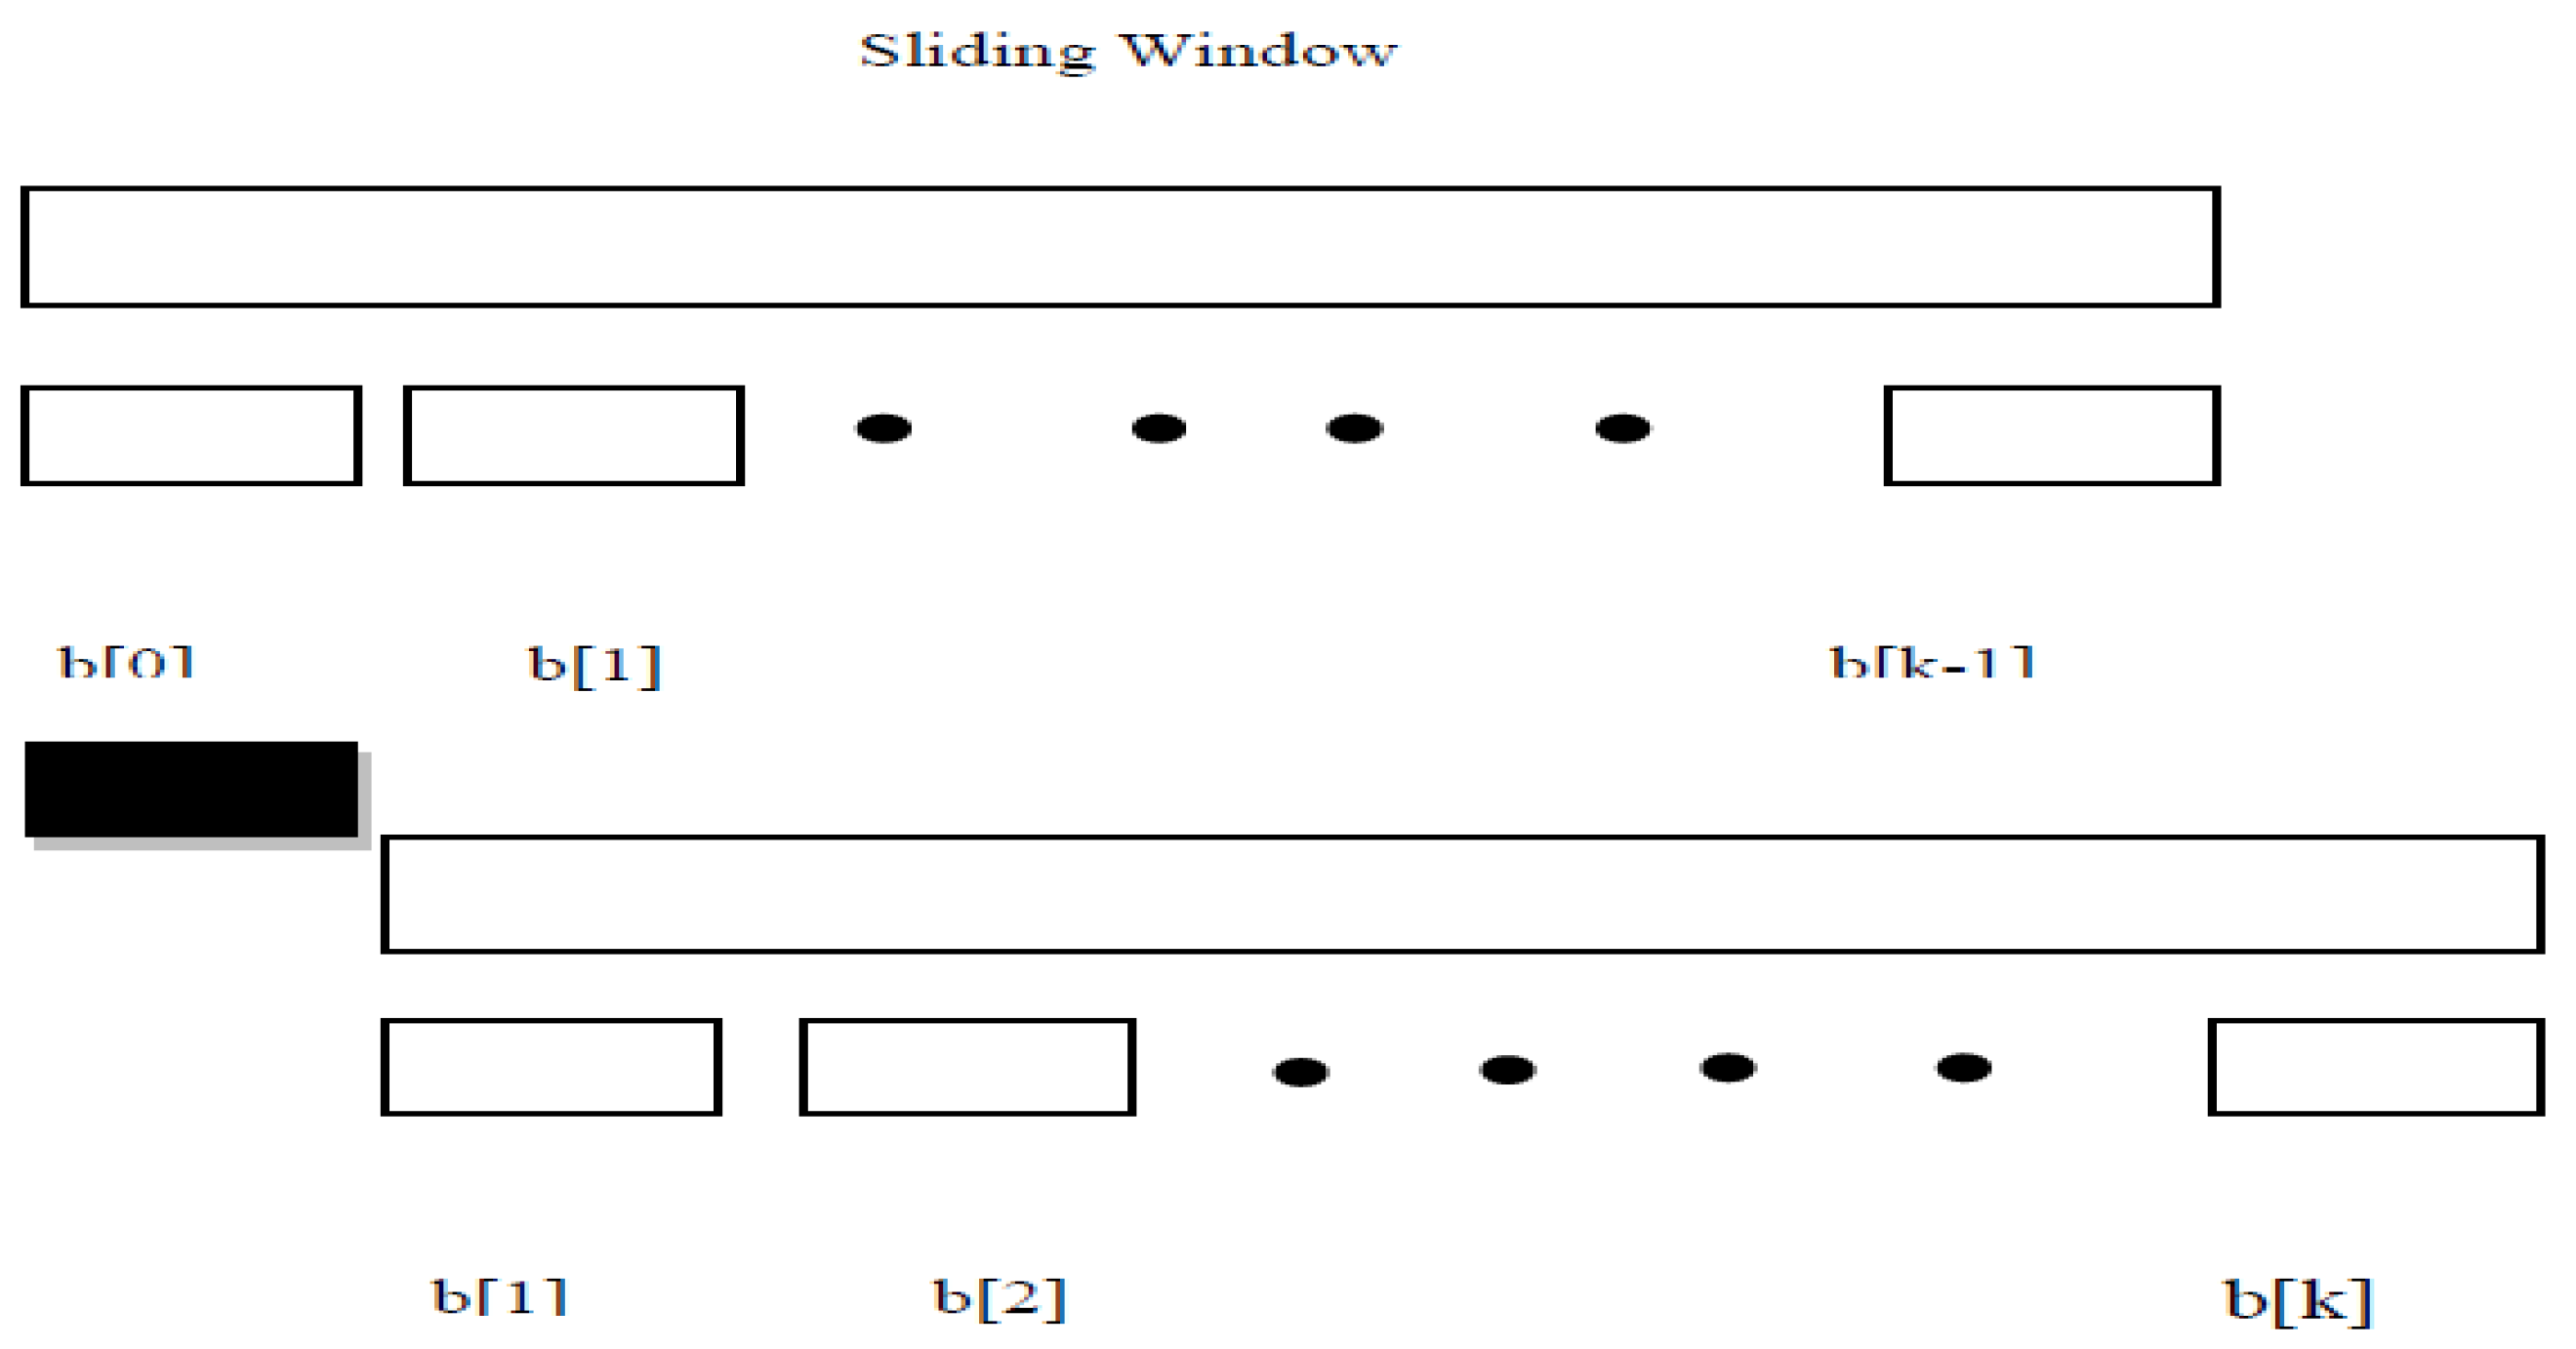
19]. The fractal dimension is calculated by counting the number of data points within each grid of the lowest layer of the grid structure. Additionally, the use of sliding window model for computing cluster partitions on evolving data streams, as discribed by
Figure 10 [
19].
In the given context, a clustering algorithm based on correlation fractal dimension for an evolving data stream was developed [
19]. The algorithm involves inserting points into existing clusters based on their relative change in fractal dimension, creating new progressive fractal clusters if certain conditions are met, and creating outlier fractal clusters for points that do not fit into existing clusters. The weight of the clusters is periodically checked, and if a progressive fractal cluster's weight falls below a threshold, it is deleted to make space for new clusters.
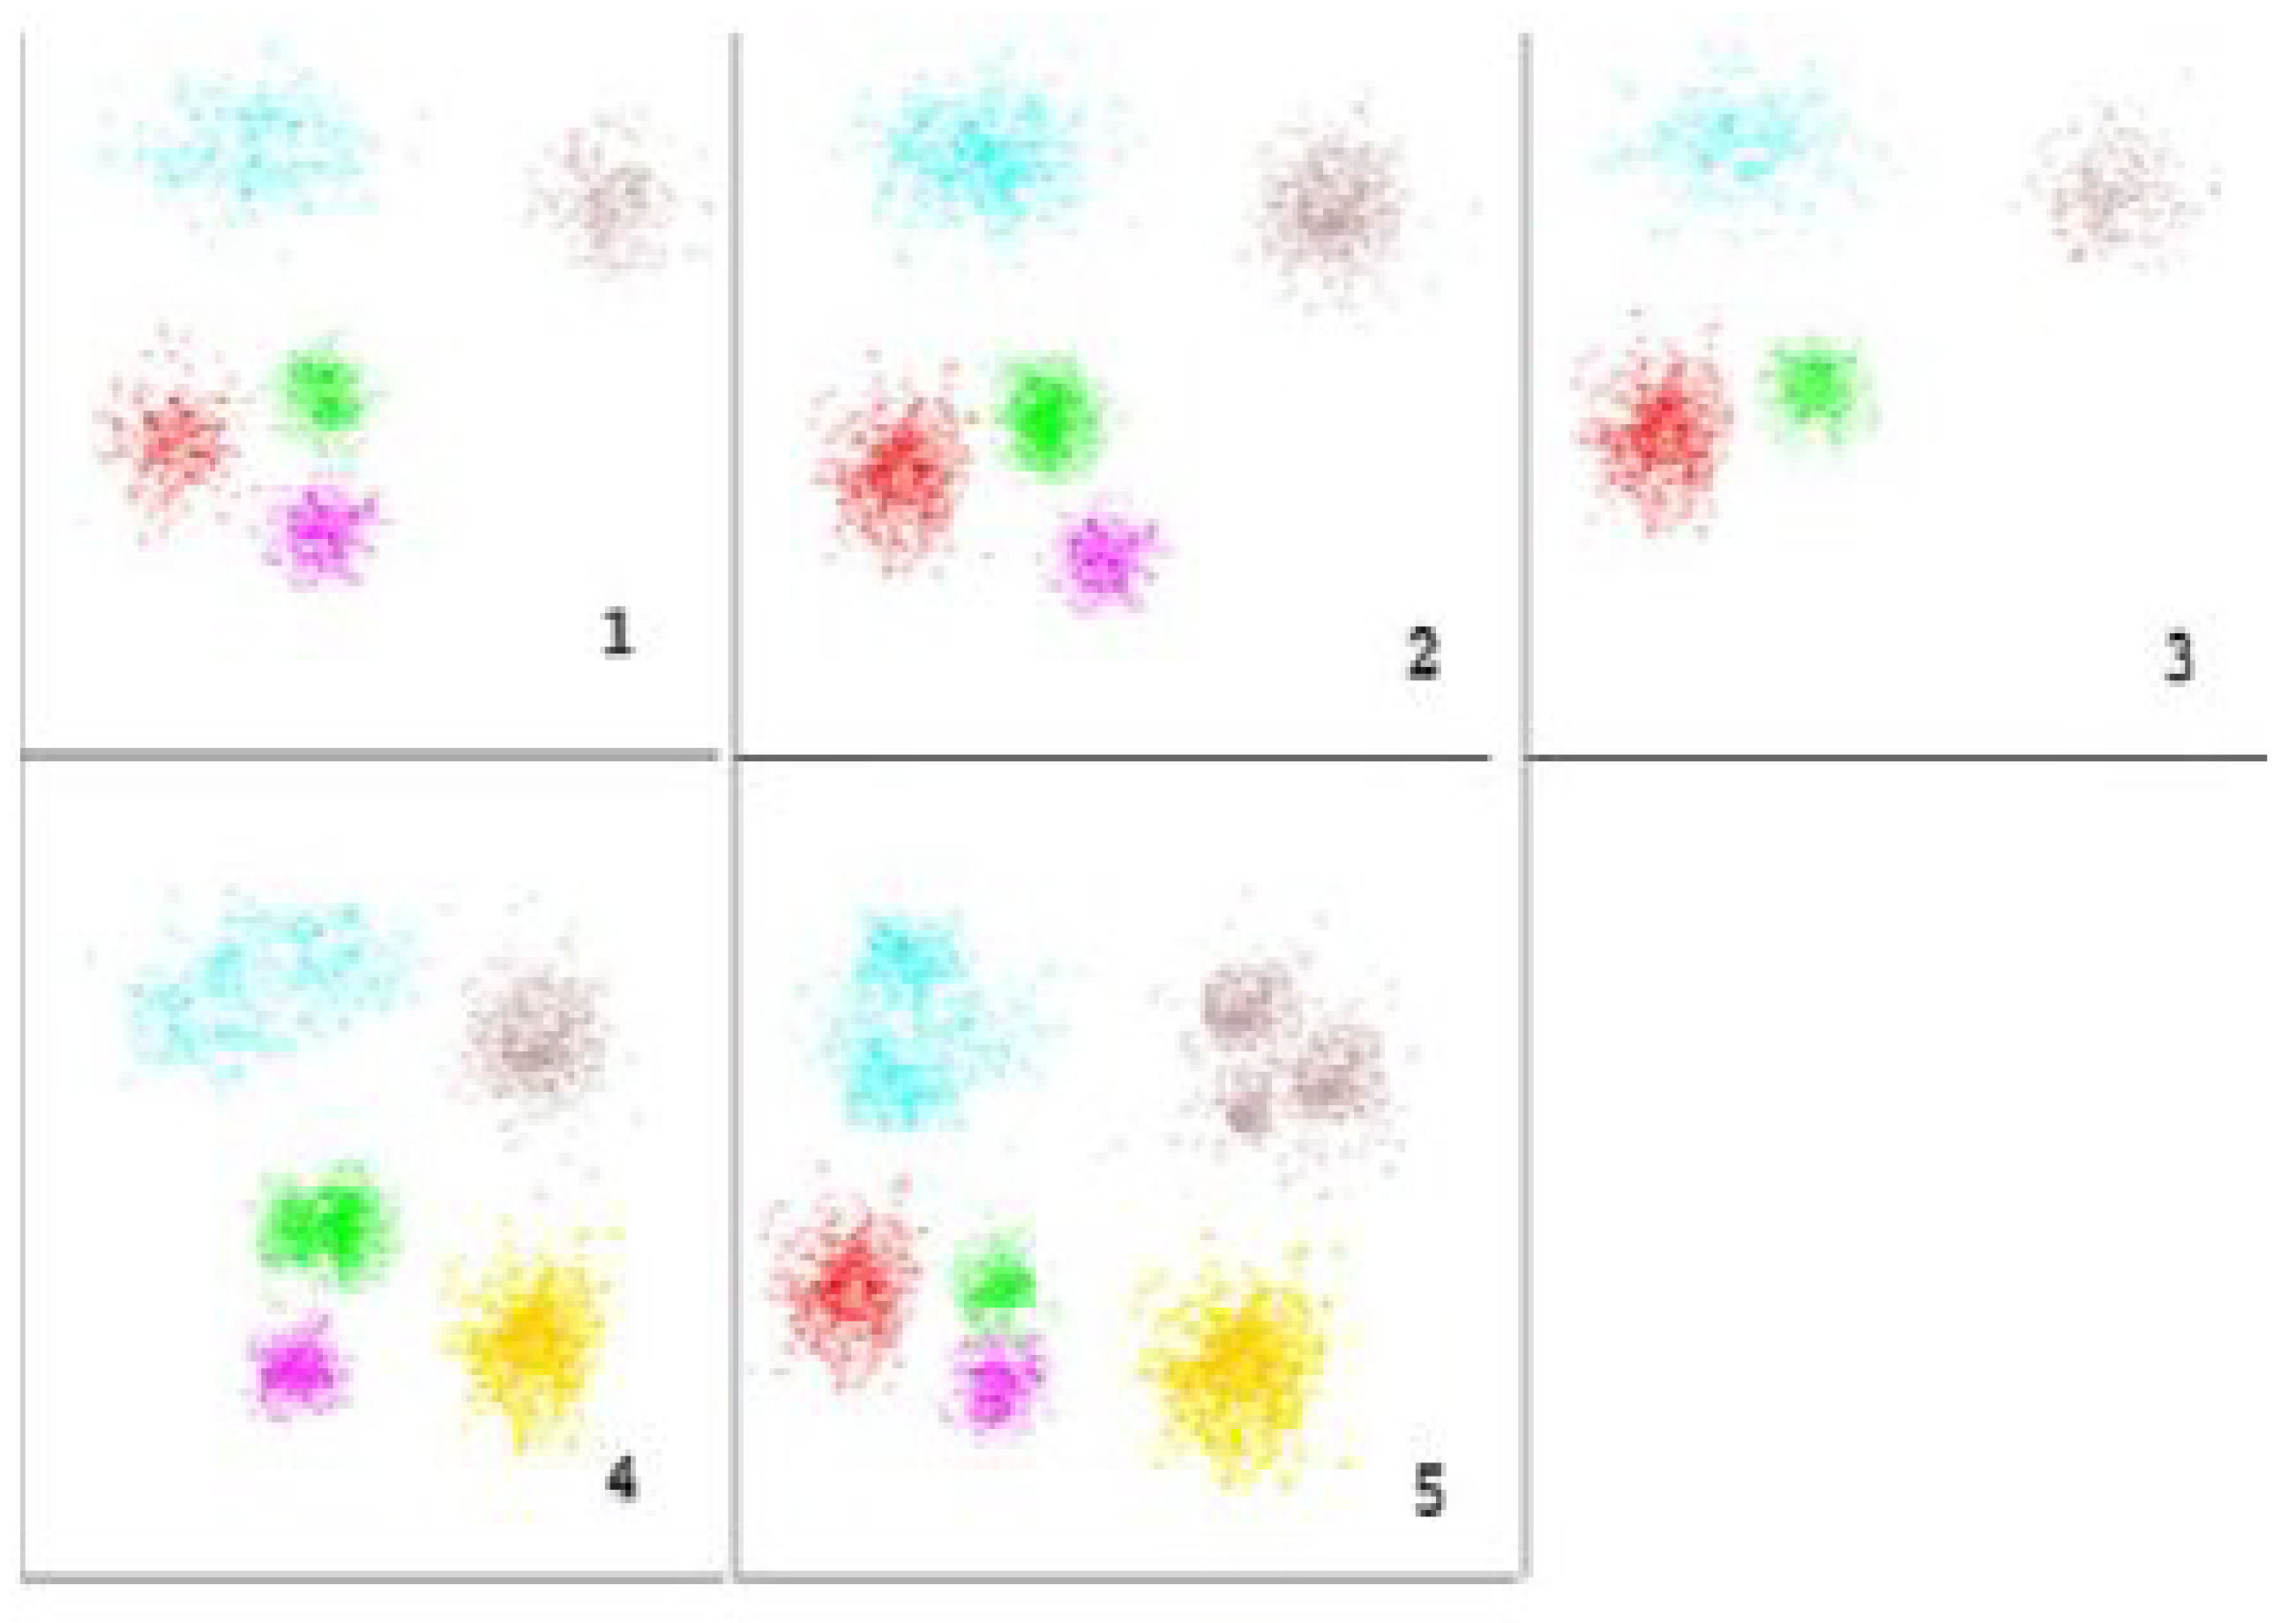
The behavior of clusters changes over time when performing online clustering with a window of 1000 data points. This evolution of data can be segmented into intervals, as shown in
Figure 11 [
19], to analyze the changes in cluster composition.
In the area of big data applications, disturbances like COVID-19, pollution, or policy changes have a huge effect on economic and financial systems [
20]. For expanding the use of big data in financial and economic systems, it is imperative to investigate how these disruptions affect associated time series. The complexity of these time series is analysed using the Generalised Weierstrass-Mandelbrot Function (GWMF) [
20], which demonstrates how disturbances in the form of exponential functions can produce multifractal characteristics. Additionally, the model replicates long memory and irregularity, which are evaluated by multifractal analysis and the R/S approach.
Research on how disturbances affect time series produced by the actual part of GWMF, or C(t, μ), and how to replicate multifractal features in time series is scarce [
19]. Furthermore, there is little theoretical evidence to support the claim that time series produced by WMF naturally possess the fractal dimension D. Consequently, more statistical examination is required to determine the connection between disturbances and the nonlinear properties of time series produced by C(t, μ), including multifractal analysis and Hurst exponent.
Disturbance's effect on the statistical characteristics of time series produced by the identified generalized Wavelet Multifractal model. This study demonstrates that disturbances, including feedback terms, can play a complex role in changing the structure of nonlinear time series, shifting from a single fractal dimension to long memory and multifractal features, defying the widely held belief that disturbances have no effect on statistical results. These results emphasize how crucial it is for those working in the financial and economic sectors to comprehend the basic theory of time series, especially when it comes to large data applications [
20].
6. Closing Remarks Combined with Open Problems and the Next Phase of Research
This paper explores the relationship between the information-theoretic queueing parameters. Numerical experiments analyze the behavior of the derived fractal index to evidence that this work represents a significant advancement in unifying information theory and fractal geometry.
An explanation is given to confirm the influential role of fractal dimension in developing and revolutionizing BDAs. The current paper has several emerging open problems.
Open Problem One
Based on the findings of this paper, is it feasible to undertake their approach much further to find the fractal dimension theory of Ismail’s Entropy, namely IE(c.f., [
21,
22]), which is by default the ultimate generalization of numerous in literature?
Open Problem Two
Based on the possibility to unlock open problem one, can we find any mathematical approach to decide the threshold of the involved universal parameters of IE. If so, what will be the expected form of the mathematical relations involved?
Open Problem Three
Can we extend the case to investigate possible applicability of other fractal dimensions in literatures, such as Sierpinski Gasket and Koch Snowflake?
Future research aims to determine the fractal dimensions of other entropies in literature and compare them to further advance the field of Information Theoretic Fractal Geometry (ITFG). Notably, the search is ongoing to possibly find solutions to the above provided open problems.
Funding
This research received no external funding.
References
- Mageed, Q. Zhang, and B. Modu, “ The Linearity Theorem of Rényian and Tsallisian Maximum Entropy Solutions of The Heavy-Tailed Stable M/G/1 Queueing System entailed with Potential Queueing-Theoretic Applications to Cloud Computing and IoT,” electronic Journal of Computer Science and Information Technology, 2023, vol. 9, no. 1, p. 15-23.
- Mageed et al, “Generalization of Renyi’s Entropy and its Application in Source Coding,” Appl. Math. Inf. Sci. vol. 17, No. 5, 2023, p. 941-948.
- L. Zhou, C. R. L. Zhou, C. R. Johnson, and D. Weiskopf, “ Data-driven space-filling curves,” IEEE transactions on visualization and computer graphics, vol. 27, no. 2, 2020, p. 1591-1600.
- W. J. Wang et al, “ Fractal growth of giant amphiphiles in langmuir-blodgett films,” Chinese Journal of Polymer Science, vol. 40, no. 6, 2022, p. 556-66. [CrossRef]
- I.A. Mageed and Q. Zhang, “Formalism of the Rényian Maximum Entropy (RMF) of the Stable M/G/1 queue with Geometric Mean (GeoM) and Shifted Geometric Mean (SGeoM) Constraints with Potential GeoM Applications to Wireless Sensor Networks (WSNs),” electronic Journal of Computer Science and Information Technology, vol. 9, no. 1, 2023, p. 31-40.
- G. L. Gao et al, “ Do the global grain spot markets exhibit multifractal nature? ”Chaos, Solitons & Fractals, vol. 164, 2022, p. 112663.
- S. R. Nayak and J. Mishra, “ Analysis of medical images using fractal geometry,” In Research Anthology on Improving Medical Imaging Techniques for Analysis and Intervention, IG Global, 2023, p. 1547-1562.
- T. Zhao, Z. T. Zhao, Z. Li, and Y. Deng, “ Information fractal dimension of Random Permutation Set,” Chaos, Solitons & Fractals, vol. 174, 2023, p. 113883. [CrossRef]
- I.A. Mageed and Q.Zhang, “Threshold Theorems for the Tsallisian and Rényian (TR) Cumulative Distribution Functions (CDFs) of the Heavy-Tailed Stable M/G/1 Queue with Tsallisian and Rényian Entropic Applications to Satellite Images (SIs),” electronic Journal of Computer Science and Information Technology, vol. 9, no. 1, 2023, p. 41-27.
- F. Pons, G. F. Pons, G. Messori, and D. Faranda, “ Statistical performance of local attractor dimension estimators in non-Axiom A dynamical systems,” Chaos: An Interdisciplinary Journal of Nonlinear Science, vo. 33, no. 7, 2023. [CrossRef]
- Mageed and, Q. Zhang, “An Introductory Survey of Entropy Applications to Information Theory, Queuing Theory, Engineering, Computer Science, and Statistical Mechanics,” In 2022 27th IEEE International Conference on Automation and Computing (ICAC) 2022, pp. 1-6.
- Mageed and, Q. Zhang, “Inductive Inferences of Z-Entropy Formalism (ZEF) Stable M/G/1 Queue with Heavy Tails. In 2022 IEEE 27th International Conference on Automation and Computing (ICAC), 2022, p. 1-6.
- Mageed, Q. Zhang, and B. Modu, “ The Linearity Theorem of Rényian and Tsallisian Maximum Entropy Solutions of The Heavy-Tailed Stable M/G/1 Queueing System entailed with Potential Queueing-Theoretic Applications to Cloud Computing and IoT,” electronic Journal of Computer Science and Information Technology, 2023, vol. 9, no. 1, p. 15-23.
- Mageed and, A.H. Bhat, “Generalized Z-Entropy (Gze) and Fractal Dimensions,” Appl. Math, vol. 16, no. 5, 2022, p. 829-834. [CrossRef]
- H. Deng, W. H. Deng, W. Wen, and W. Zhang, “Analysis of Road Networks Features of Urban Municipal District Based on Fractal Dimension,” ISPRS International Journal of Geo-Information, vol. 12, no. 5, 2023, p. 188. [CrossRef]
- Mageed, “ The Entropian Threshold Theorems for the Steady State Probabilities of the Stable M/G/1 Queue with Heavy Tails with Applications of Probability Density Functions to 6G Networks,” electronic Journal of Computer Science and Information Technology, vol. 9, no. 1, 2023, p. 24-30.
- D. Lippman, “Mathematics for the Liberal Arts,” Website title: Lumen.Online available at: https://courses.lumenlearning.com/wmopen-mathforliberalarts/chapter/introduction-fractals-generated-by-complex-numbers/. [Last accessed on ]. 20 August.
- R. Liu, R. R. Liu, R. Rallo, and Y. Cohen, “ Fractal dimension calculation for big data using box locality index,” Annals of Data Science, 2018, p. 549-63. [CrossRef]
- Yarlagadda, M.V. Jonnalagedda, and K. Munaga, “Clustering based on correlation fractal dimension over an evolving data stream,” Int. Arab J. Inf. Technol., vol. 1, no. 15, 2018, p. 1-9.
- L. Zhang, “Generalized Weierstrass-Mandelbrot with Disturbance for Big Data Applications in Economic and Financial Systems,” In 2023 IEEE 8th International Conference on Big Data Analytics (ICBDA), 2023, p. 53-56.
- Mageed and, Q. Zhang, “An Information Theoretic Unified Global Theory For a Stable M/G/1 Queue With Potential Maximum Entropy Applications to Energy Works,” In 2022 IEEE Global Energy Conference (GEC), 2022, p. 300-305.
- D. D. Kouvatsos I. A. and Mageed, “Non-Extensive Maximum Entropy Formalisms and Inductive Inferences of Stable M/G/1 Queue with Heavy Tails, in “Advanced Trends in Queueing Theory,” Vladimir Anisimov and Nikolaos Limnios (eds.), Books in ‘Mathematics and Statistics’, Sciences by ISTE & J. Wiley, London, UK, vol. 2, 2021.
|
Disclaimer/Publisher’s Note: The statements, opinions and data contained in all publications are solely those of the individual author(s) and contributor(s) and not of MDPI and/or the editor(s). MDPI and/or the editor(s) disclaim responsibility for any injury to people or property resulting from any ideas, methods, instructions or products referred to in the content. |
© 2024 by the authors. Licensee MDPI, Basel, Switzerland. This article is an open access article distributed under the terms and conditions of the Creative Commons Attribution (CC BY) license (http://creativecommons.org/licenses/by/4.0/).
