1. Introduction
The devices that release electromagnetic radiation (radiofrequency: 100kHz-300GHz) are successively gaining more importance in the daily lives of the general population [
1,
2]. Nonetheless, this exposure is continuously modified due to the development of new infrastructure, such as fifth and sixth-generation networks (5G and 6G) [
2]. Over the last 20 years, due to technological development, communication has become easier by using mobile phones, computers, and the internet, therefore, all mentioned before (mobile phones, computers, internet) have become affordable to the major part of the population [
3,
4].
Especially, the number of the mobile phone users worldwide was 6.95 billion in 2020. In 2022, it rose to 7.26 billion and it forecast to reach 7.49 billion in 2025 [
5]. Through the period of 2005-2022, a noteworthy increase was detected in the global number of internet users. In 2005, the number of users rose at 1.02 billion, while by 2022 it was quintupled. This rate represents more than half of the world's population, almost 66% [
6].
Although, this advancement has provoked a glut of reactions concerning the influence it has on human health [
3]. This influence is associated with long-term exposure to radiofrequency of electromagnetic radiation [
7]. Studies have been focused to survey the varying levels of exposure among different groups of individuals [
8,
9]. Measurements of electromagnetic radiation are conducted in several environments (indoor, outdoor, and population-based). Especially, the population environment incorporates workplaces, educational facilities (schools, universities, etc.), public transportation and sensitive areas (playgrounds, gyms, etc.) among others [
10]. Particularly, in crowded places, anxiety expand due to the existence of many devices that are being used at the same time within the same space. These areas include urban centers, bustling commercial districts, stadiums, etc., where the frequency of the population expands exposure to electromagnetic radiation, prompting reactions [
11].
So, exposure increases as the number of users increase? Scientists have started researching the biological effects that may be caused by electromagnetic radiation [
12].
The population’s necessity for knowledge has led scientists to generate and visualize their findings in a different and more logical way [
13], by constructing maps that spatially display the exposure to electromagnetic radiation [
13,
14]. The necessity for a complete display of electromagnetic radiation allows researchers to recognize which areas have been exposed, along with the exposure of population [
16]. For this reason, georeferencing processes are progressing regarding exposure to electromagnetic fields. This progress is worthy of attention and the georeferencing assists with the following ways:
It displays the straight relationship between the image and the ground, based on their specific coordinates,
There is a decrease in the number of ground control points,
Reliable mapping is achieved across the entire geographic frame of reference an
Supplies the chance to include further parameters regarding adaptation, some of which involve internal orientation parameters, field observations, etc. [
17,
18].
These maps for electromagnetic exposure are a great way to visualize and assess distributing fields of electromagnetic radiation in the environment. Geographic information systems that are automated systems used for recording, storing, analyzing, and visualizing spatial data [
15], are widely utilized, as many relevant parties [
3,
19,
20,
21,
22,
23], are trying to analyze variable source of electromagnetic field data, such as Mobile Phone Base Stations emission. Electromagnetic Field Exposure Mapping is a an informative and an accurate decision-making tool about electromagnetic radiation levels in public and mostly crowded urban areas. Furthermore, the GIS map producing capabilities continuously enhances our current knowledge concerning electromagnetic exposure in urban environments, with a great regard to public health and safety [
16,
24,
25]. The purpose of this work is to study the exposure, of the general population, to electromagnetic radiation in crowded places (for example squares) in the city of Larisa, one of the five largest cities in Greece.
Practically, our purpose was to measure the RF field strength evaluating RF compliance with the ICNIRP's [2020] 2020 safety limits in children population (children exposure).
2. Materials and Methods
Regarding the evaluation of electromagnetic fields (EMFs), there are two measurement approaches available:
spot measurements using either a broadband or narrowband selective meter (such as a spectrum analyzer), and
personal exposimetry involving personal monitoring.
In this research, we performed spot measurements to assess radiofrequency (RF) exposure levels [
26]. A portable field strength analyzer (SRM 3006, Narda Safety Test Solutions, Pfullingen, Germany) and a three-axis isotropic antenna covering frequencies ranging from 27 MHz to 6 GHz were used for environmental electromagnetic radiation measurements. The values displayed by the SRM-3006 during the measurement express the total electric field strength measured in V/m but also the contribution of all the individual RF sources.
Table 1.
RF services and their Frequency range (MHz).
Table 1.
RF services and their Frequency range (MHz).
| RF Service |
Frequency Range (MHz) |
| UHF TV digital |
470–694 |
| WIND700UL |
703-713 |
| VF700DL |
713-723 |
| WIND700DL |
758-768 |
| Microphones |
821–832 |
| VF800UL |
842–852 |
| COS900UL |
880–890 |
| WIND900UL |
890–900 |
| Defense/GSM-Railway |
915–925 |
| VF900DL |
945–960 |
| Nav/GPS/Sat |
960–1,710 |
| COS1900 TDD |
1,905.1–1,910.1 |
| WIND1900 TDD |
1,910.1–1,915.1 |
| VF1900 TDD |
1,915.1–1,920.1 |
| Space research |
1,965.3–2,110.3 |
| Space research |
2,155.3–2,400 |
| Fixed/Sat |
2,483.5–2,500 |
| Links/defense |
2,570–2,575 |
| Links/defense |
2,615–2,620 |
| Radar/meteo radar |
2,690–3,000 |
| Meteo/Def |
3000-3400 |
| COS3500 |
3450-3600 |
| Links/Radar |
3800-5470 |
| WiFi/Links |
5470-5725 |
| Meteo/ISM |
5725-6000 |
The measurements with frequency selectivity encompass 54 bands, as per the Greek spectrum allocation, within the measurement range of 703 to 6000 MHz. The electric field strength is measured as the average value in 6 min for all the bands. The Reference Levels for the incident electric field strength (V/m) are defined according to the ICNIRP's 2020 guidelines [
26]. To ensure a conservative assessment, we adopt the most stringent limit associated with each band. Employing a combination of theoretical knowledge and the advanced beamforming technology of 5G antennas, we conducted measurements on 5G signals. The measurements for 5G were carried out using the identical equipment (SRM 3006) utilized for 4G, featuring a dynamic range spanning from 0.14 mV/m to 160 V/m. Following the established protocol, the laboratory recorded both the 6-minute average and maximum electric field (E) values in various scenarios:
- A.
"Active": Activating a user equipment (mobile phone) it commenced downloading 4K resolution YouTube content or/and performed a speed test.
- B.
"Non-active": The measurements were taken while the mobile phone continued to remain active without downloading any data from the Internet.
The objective was to assess the fluctuation in electric field strength by simulating a scenario in which a non-active user is near an active user at crowded places such as a square.
Anticipated exposure from 5G networks is expected to consistently stay well below the safety limits outlined in the ICNIRP 2020 guidelines, and this level of exposure is comparable to that of earlier legacy technologies. The efficacy of beamforming, a phenomenon that enables the precise direction of the electromagnetic field emitted by an antenna towards the user, contributes significantly to reducing exposure levels beyond the targeted beam.
2.1. Geospatial Services - Geographic Information System
Reliable information regarding the strength of the distribution of electromagnetic fields impacting the environment can be obtained using a variety of techniques. Mathematical modeling or the application of information technologies for data visualization are two of these approaches. Geographic Information Systems GIS are robust platforms for geographical information that can be used to create digital maps of different topologies, visualize spatial geodata graphically, and extrapolate more information about studied phenomena [
27].
Integrating electromagnetic fields (EMF) monitoring data from sources like power lines and base stations, GIS can help identify and reduce harmful incidents, unify data from measurement instruments and maps to support monitoring efforts, as well as support decision making to provide a suitable quality of life for the public [
28].
An electromagnetic environment map, which can be thought of as an abstract depiction of the electromagnetic spectrum in the environment with spatial information, is typically the result of GIS analysis. Several spatial interpolation procedures, which fall under the categories of spatial statistics, spatial geometry, and function, are primarily used in the construction of the electromagnetic environment map. Kriging is one of the algorithms used in spatial statistics that can be utilized to estimate the value of a phenomena in unsampled locations. It’s a stochastic spatial interpolation technique and a powerful and versatile method of spatial interpolation that is widely used in various fields. It is based on a statistical framework that takes into account the spatial correlation structure of the data, leading to more accurate predictions and uncertainty estimates. It has significant statistical advantages over other interpolation methods and yields the best linear unbiased estimates as well as information on the distribution of the estimation error [
29]. Estimation of the values of unsampled site is accomplished by the linear combination of the values recorded close to the target site. The linear combination's weights are selected to reduce the estimate's variance [
30].
In most cases, the basic method of Kriging Spatial interpolation is used [ex.:13], namely Ordinary Kriging.
The basic Ordinary Kriging equations are expressed in matrix form as:
where:
X is the vector of interpolated values at the unsampled locations
W is the variogram matrix, which relates the interpolated locations to the sampled locations
Z is the vector of observed values at the sampled locations
b is the vector of kriging weights
The variogram matrix, W, is calculated from the variogram function, which describes the relationship between the variance of the variable of interest and the distance between pairs of locations. The variogram function is typically estimated from the observed data using a variogram fitting algorithm.
The kriging weights, b, is calculated using various numerical methods, such as the least squares algorithm or the conjugate gradient algorithm.
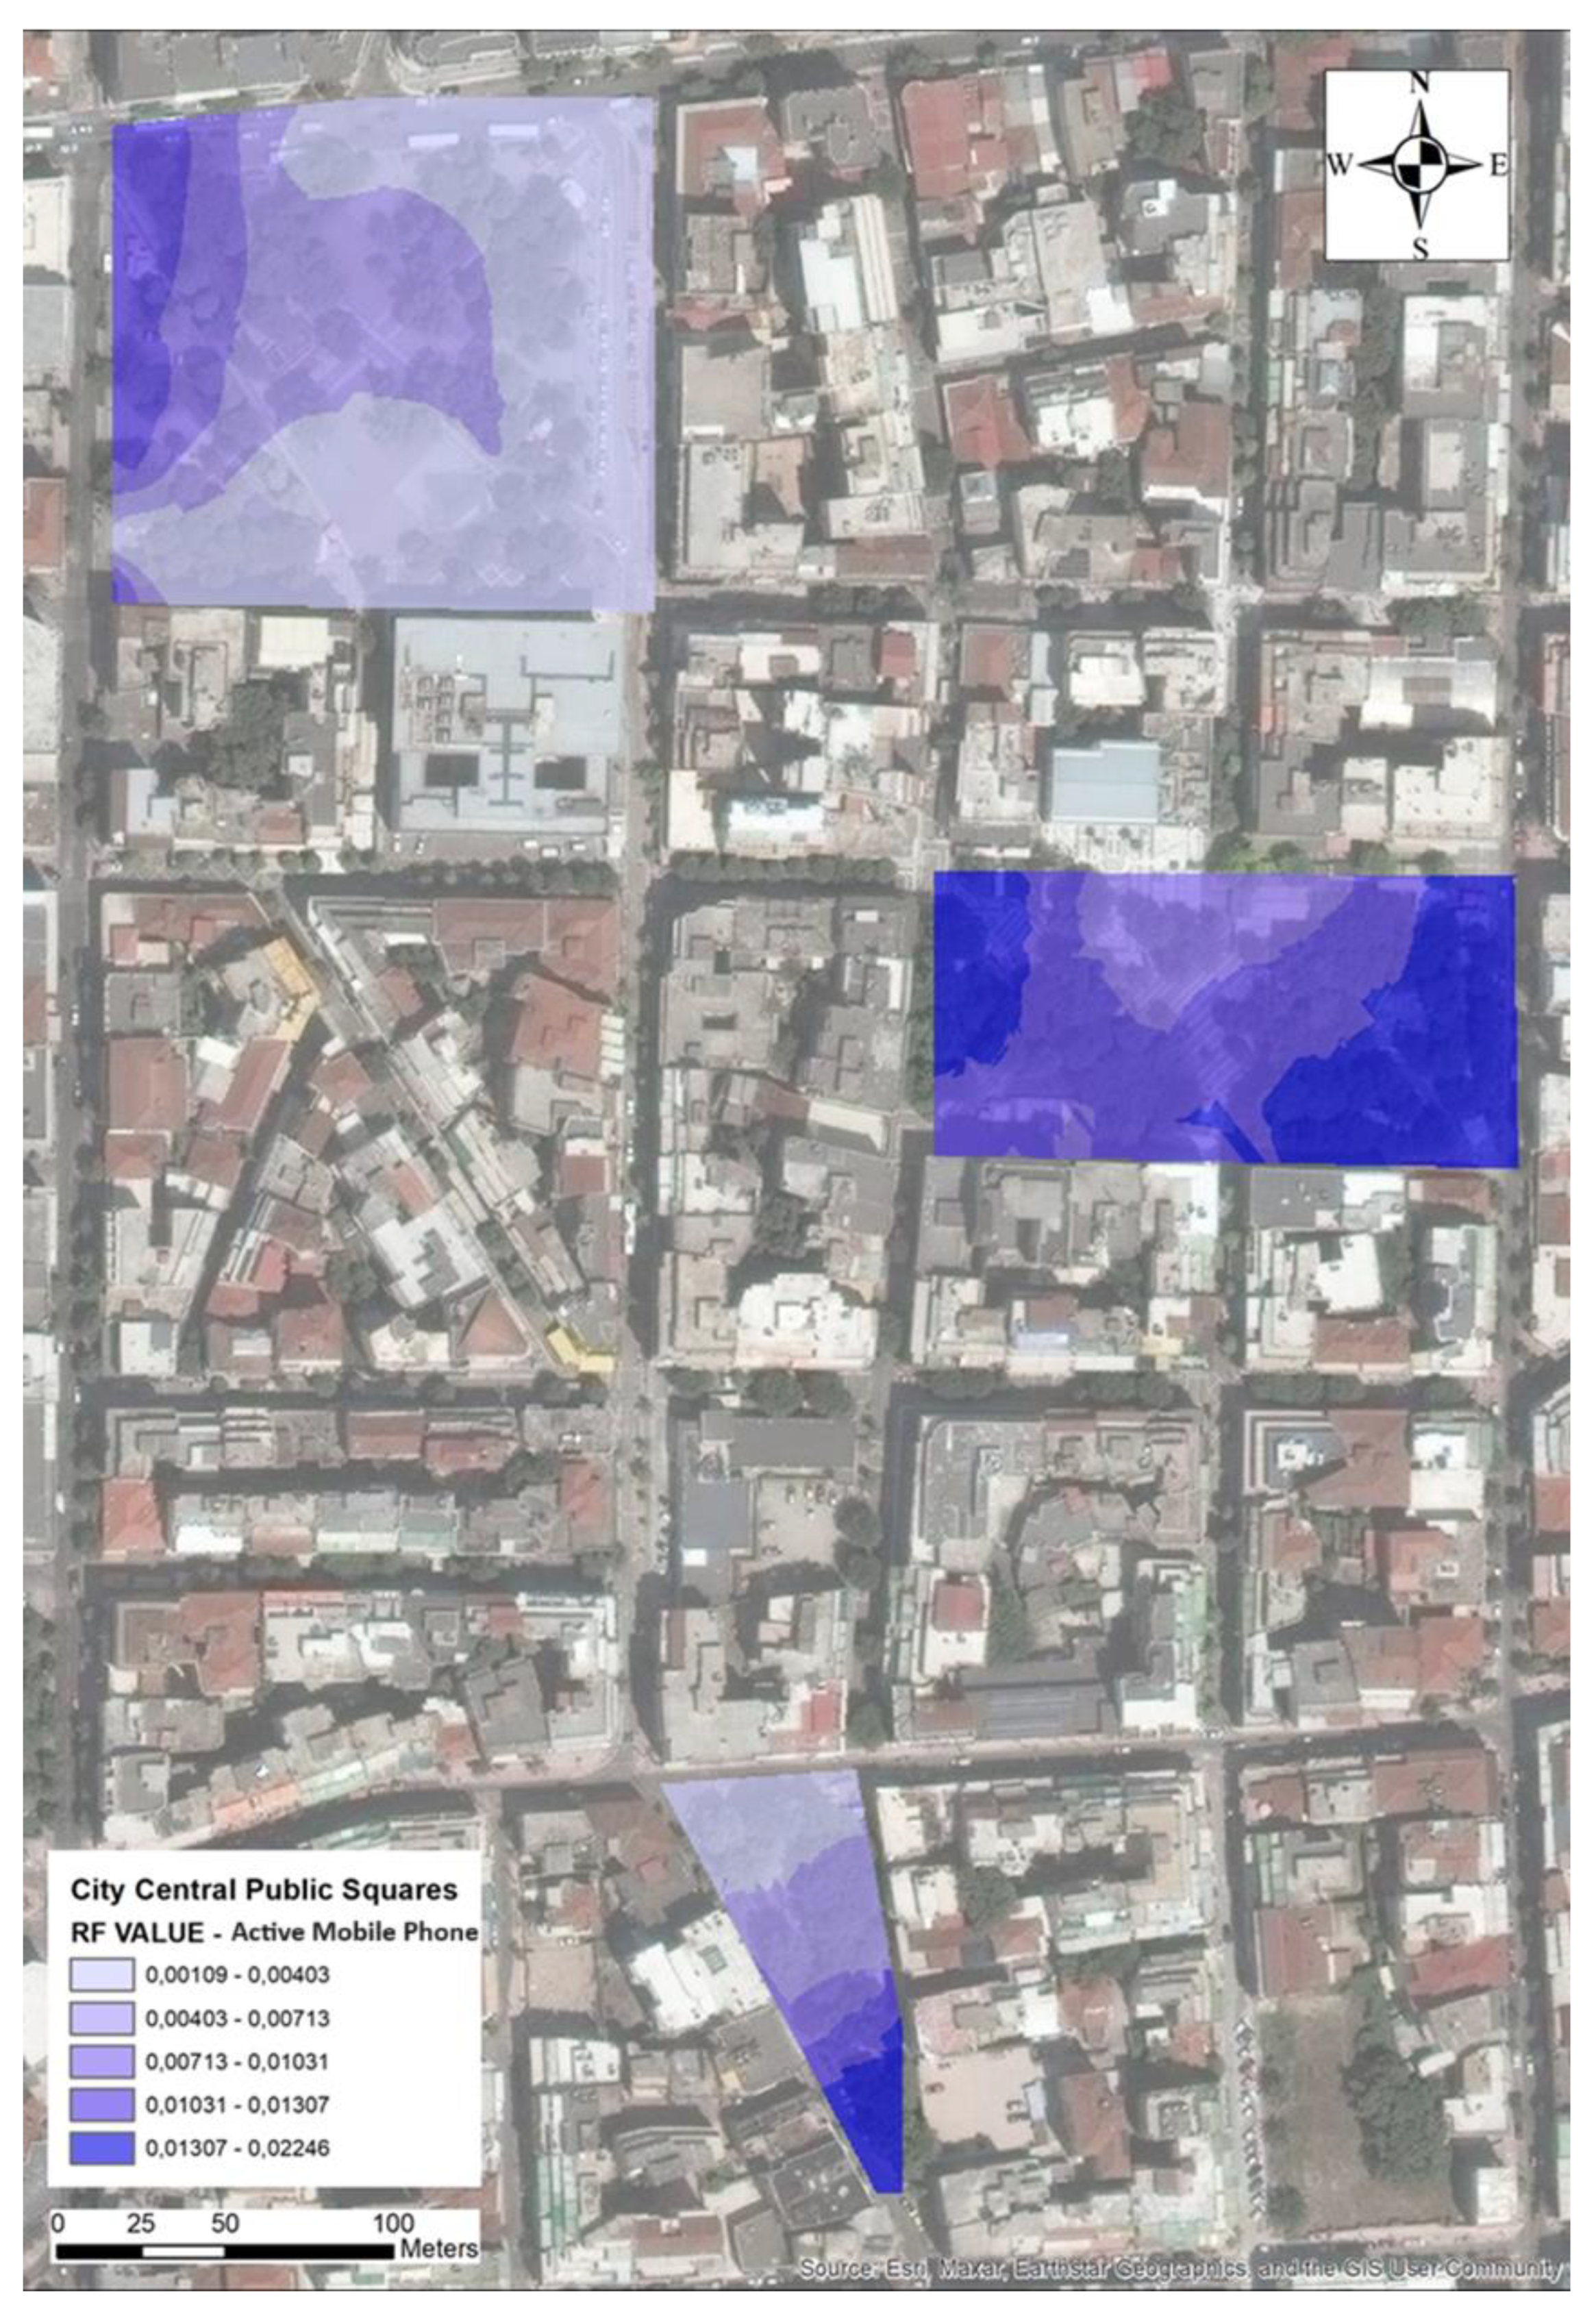
To create the electromagnetic environment maps, we used ArcGIS 10.8.1 software. To visualize the study area, we created a polygon shapefile, representing each city central public square as a polygon area with defined boundaries. Due to the uncontinuity of the electromagnetic radiation data recorded, we utilized the Ordinary Kriging Interpolation tool in ArcGIS 10.8.1, to produce a continuous raster file for each city central square concerning RF values calculated for 4G and 5G radiation respectively. For the production of the final maps, using Mosaic To New Raster tool in ArcGIS 10.8.1, we created a unified raster file for all three squares for the RF values of 4G and 5G radiation respectively. The final maps are visualizations of the spatial distribution of the electromagnetic radiation, which can be used to evaluate the radiation levels at the squares.
Case Study: Crowded Squares
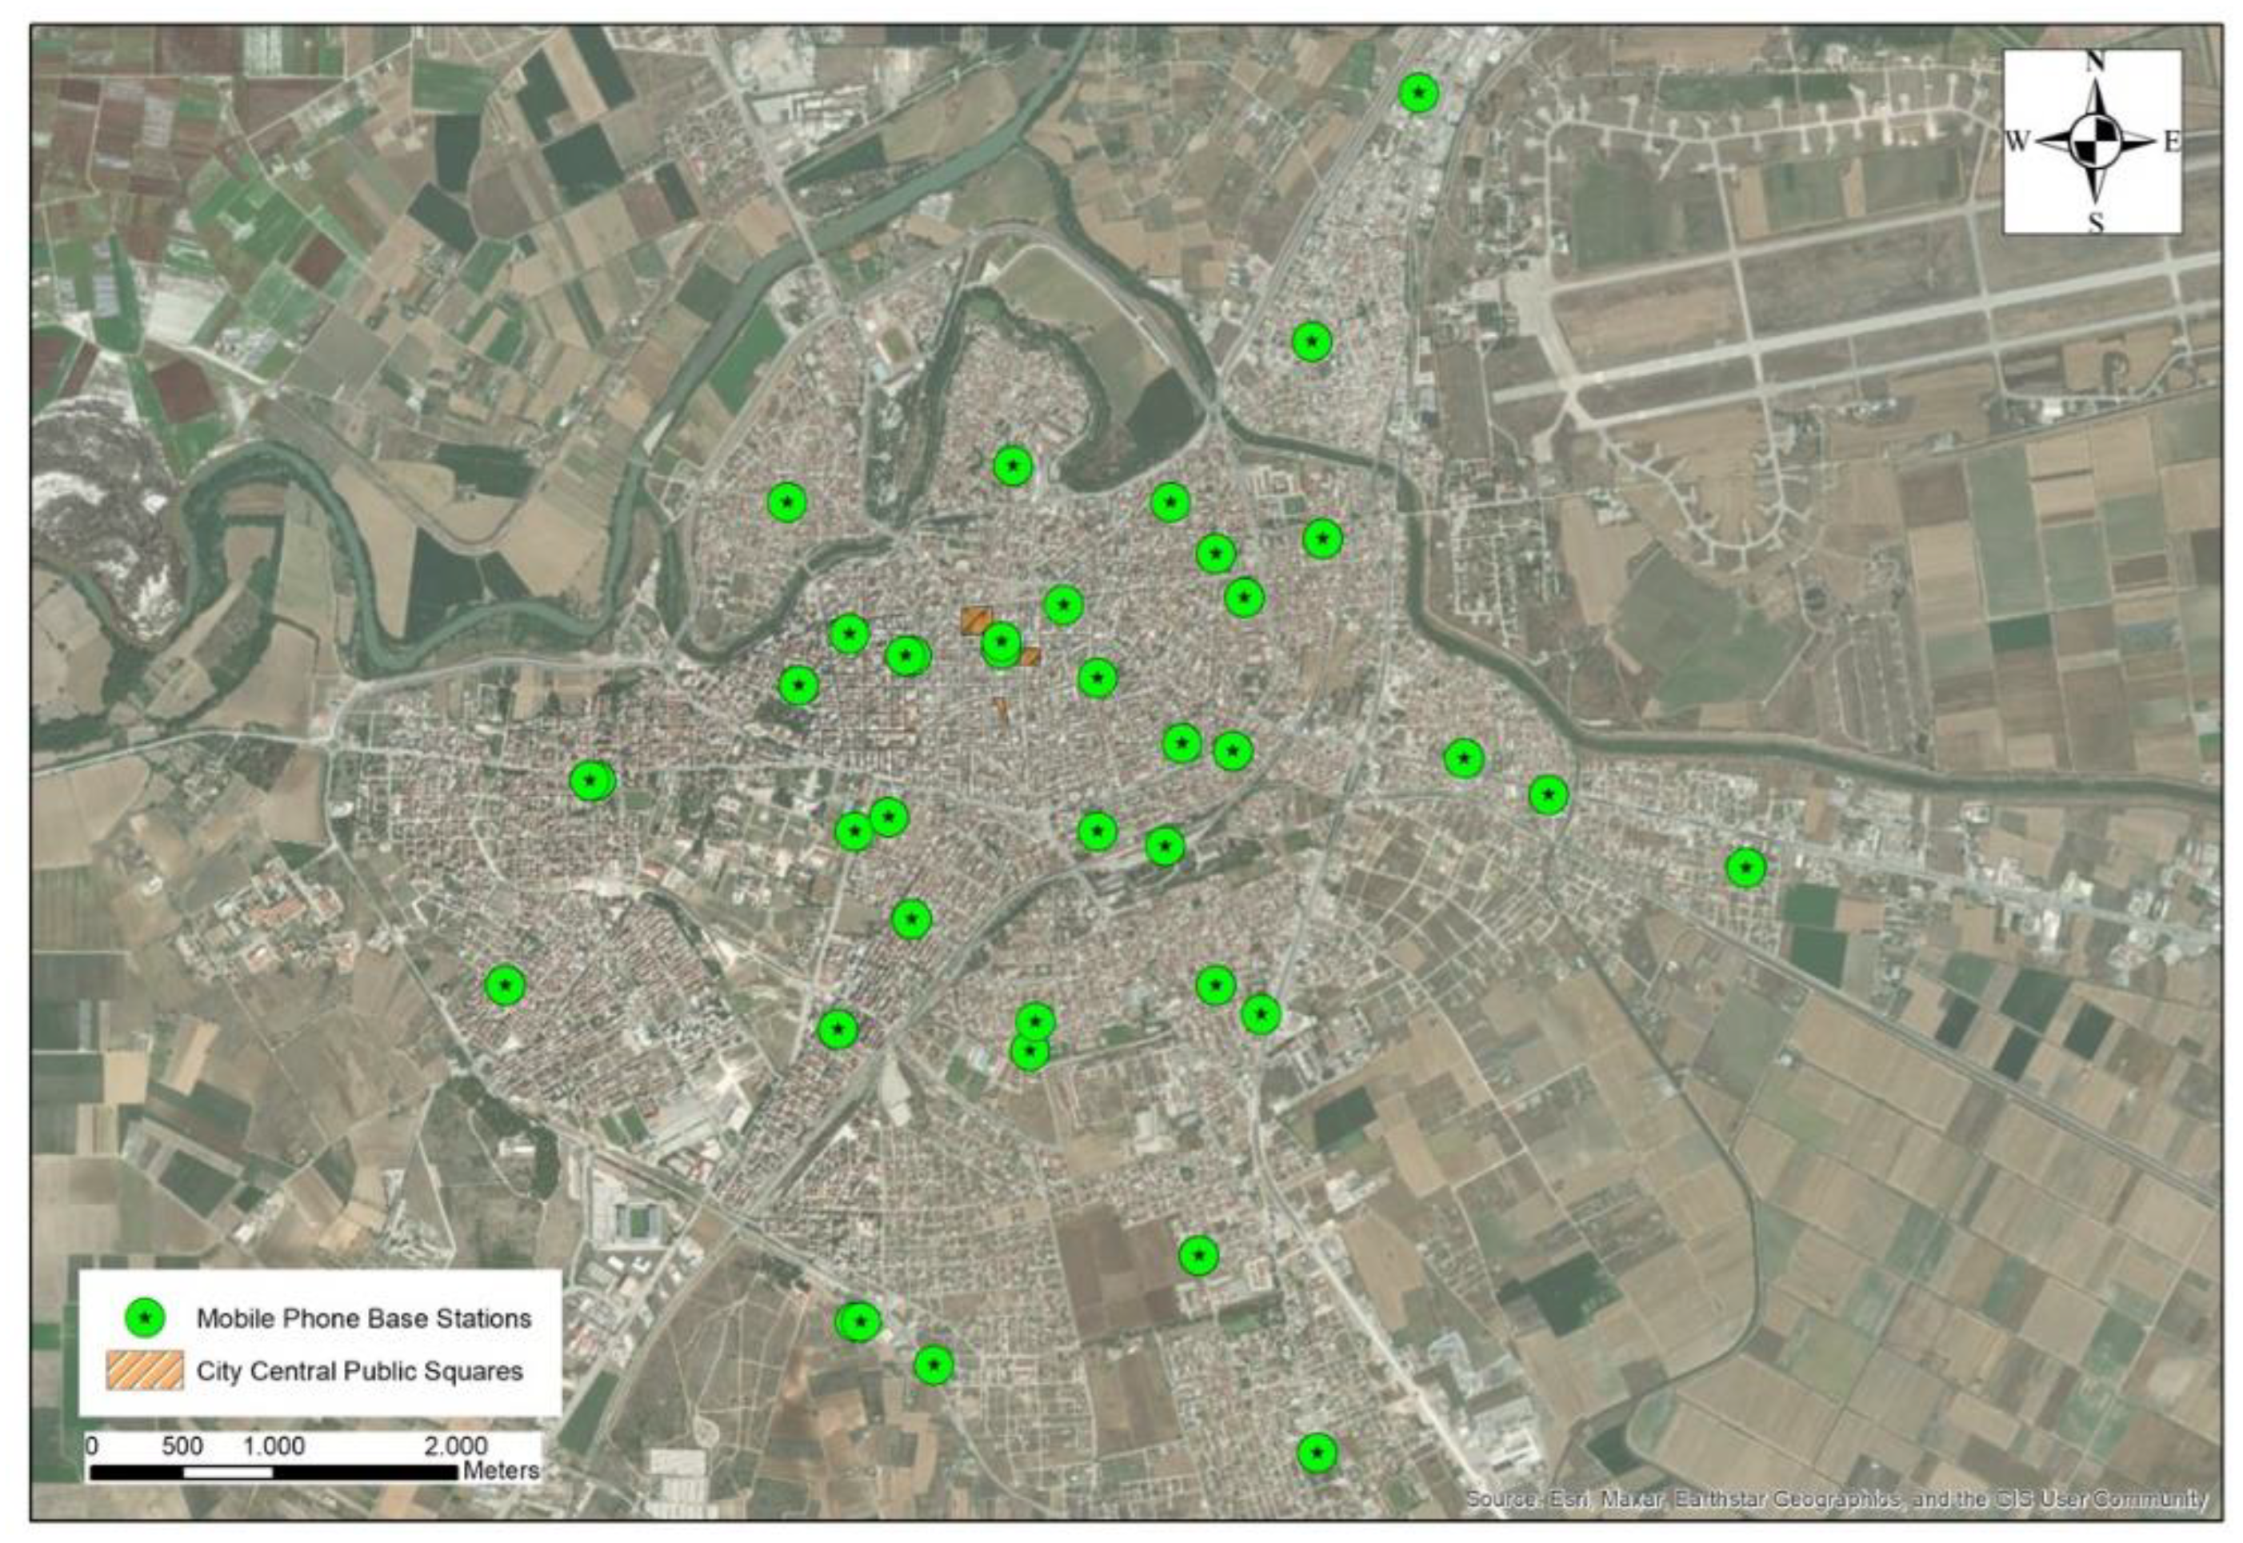
The city of Larisa is located in central Greece and host a population of approximately 150.000 residents. The city center consists of a three-square complex among a wide net of pedestrian streets. Throughout the city area, several mobile base stations are located as seen in
Figure 1.
Our study area is the three-square complex, where the majority of the city papulation pass by in a daily basis.
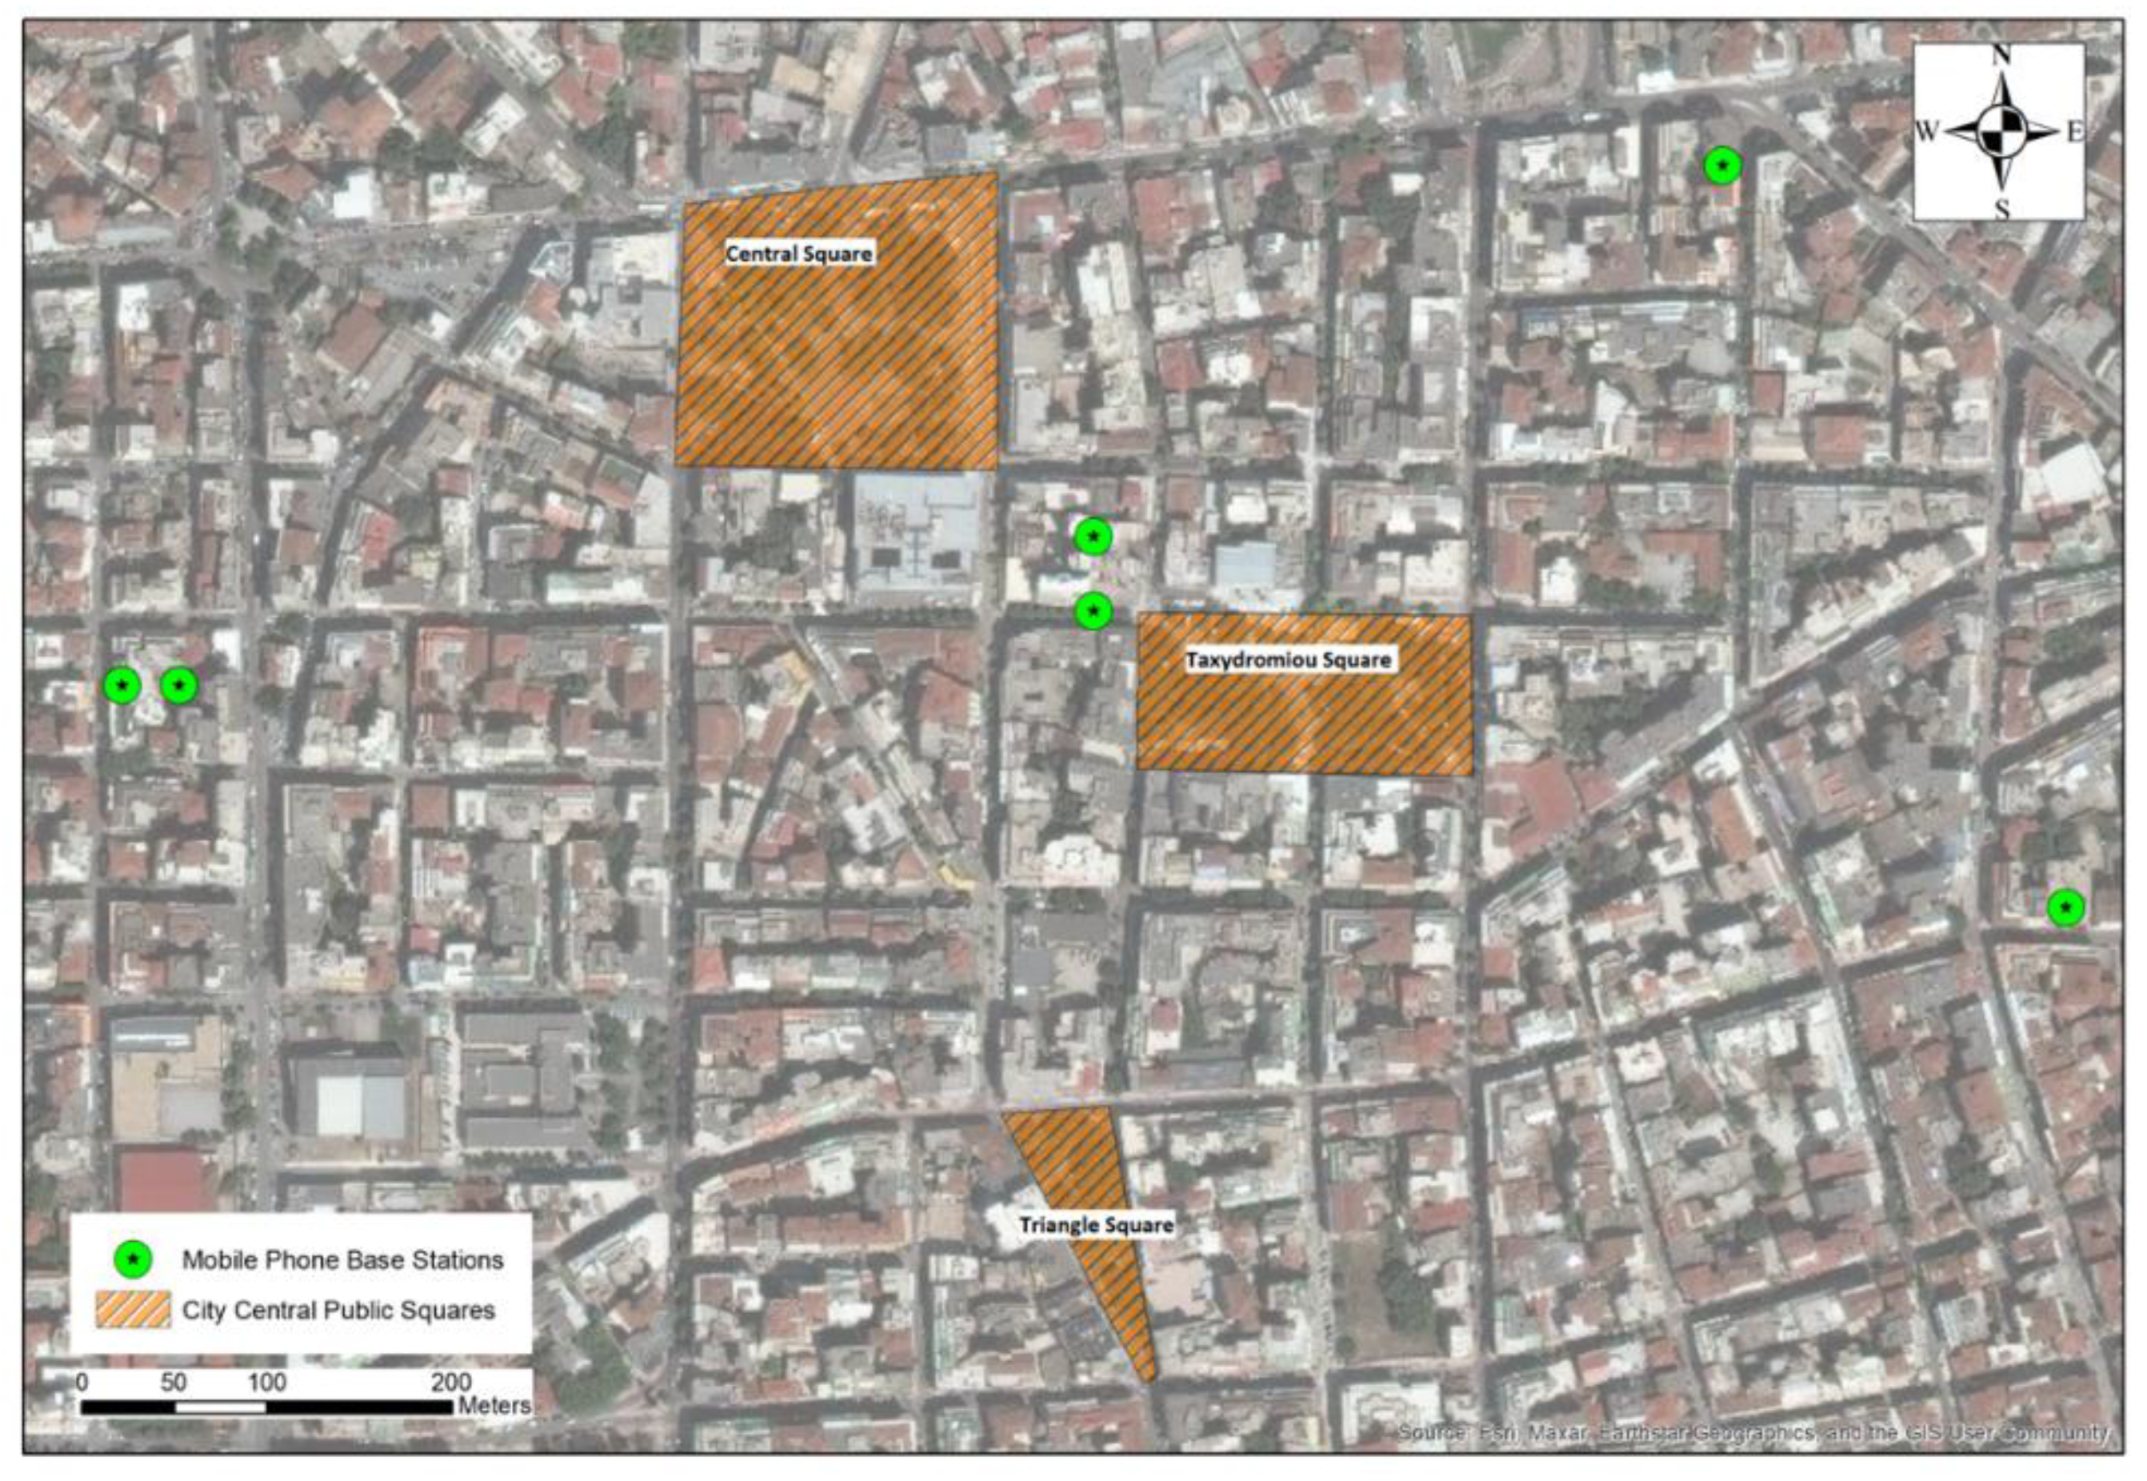
The presented image (
Figure 2) captures a comprehensive overview of Larissa city center, highlighting its three larger squares (Central, Taxydromiou and Triangle) and the proximate mobile phone base stations. This visual representation serves as a valuable insight into the urban landscape, emphasizing the strategic locations of major public spaces. This spatial depiction not only provides a snapshot of Larissa's urban planning but also hints at the strategic placement of telecommunication infrastructure to cater to the communication needs of residents and visitors in these bustling public areas.
The provided images showcase strategic points of electromagnetic measurements within the three largest and most densely populated squares in Larissa. These designated spots serve as critical locations for assessing the electromagnetic environment in urban settings. This deliberate approach to measurements provides valuable data for understanding the spatial distribution of electromagnetic fields and aids in formulating informed strategies for managing and optimizing the electromagnetic environment in these vibrant city squares.
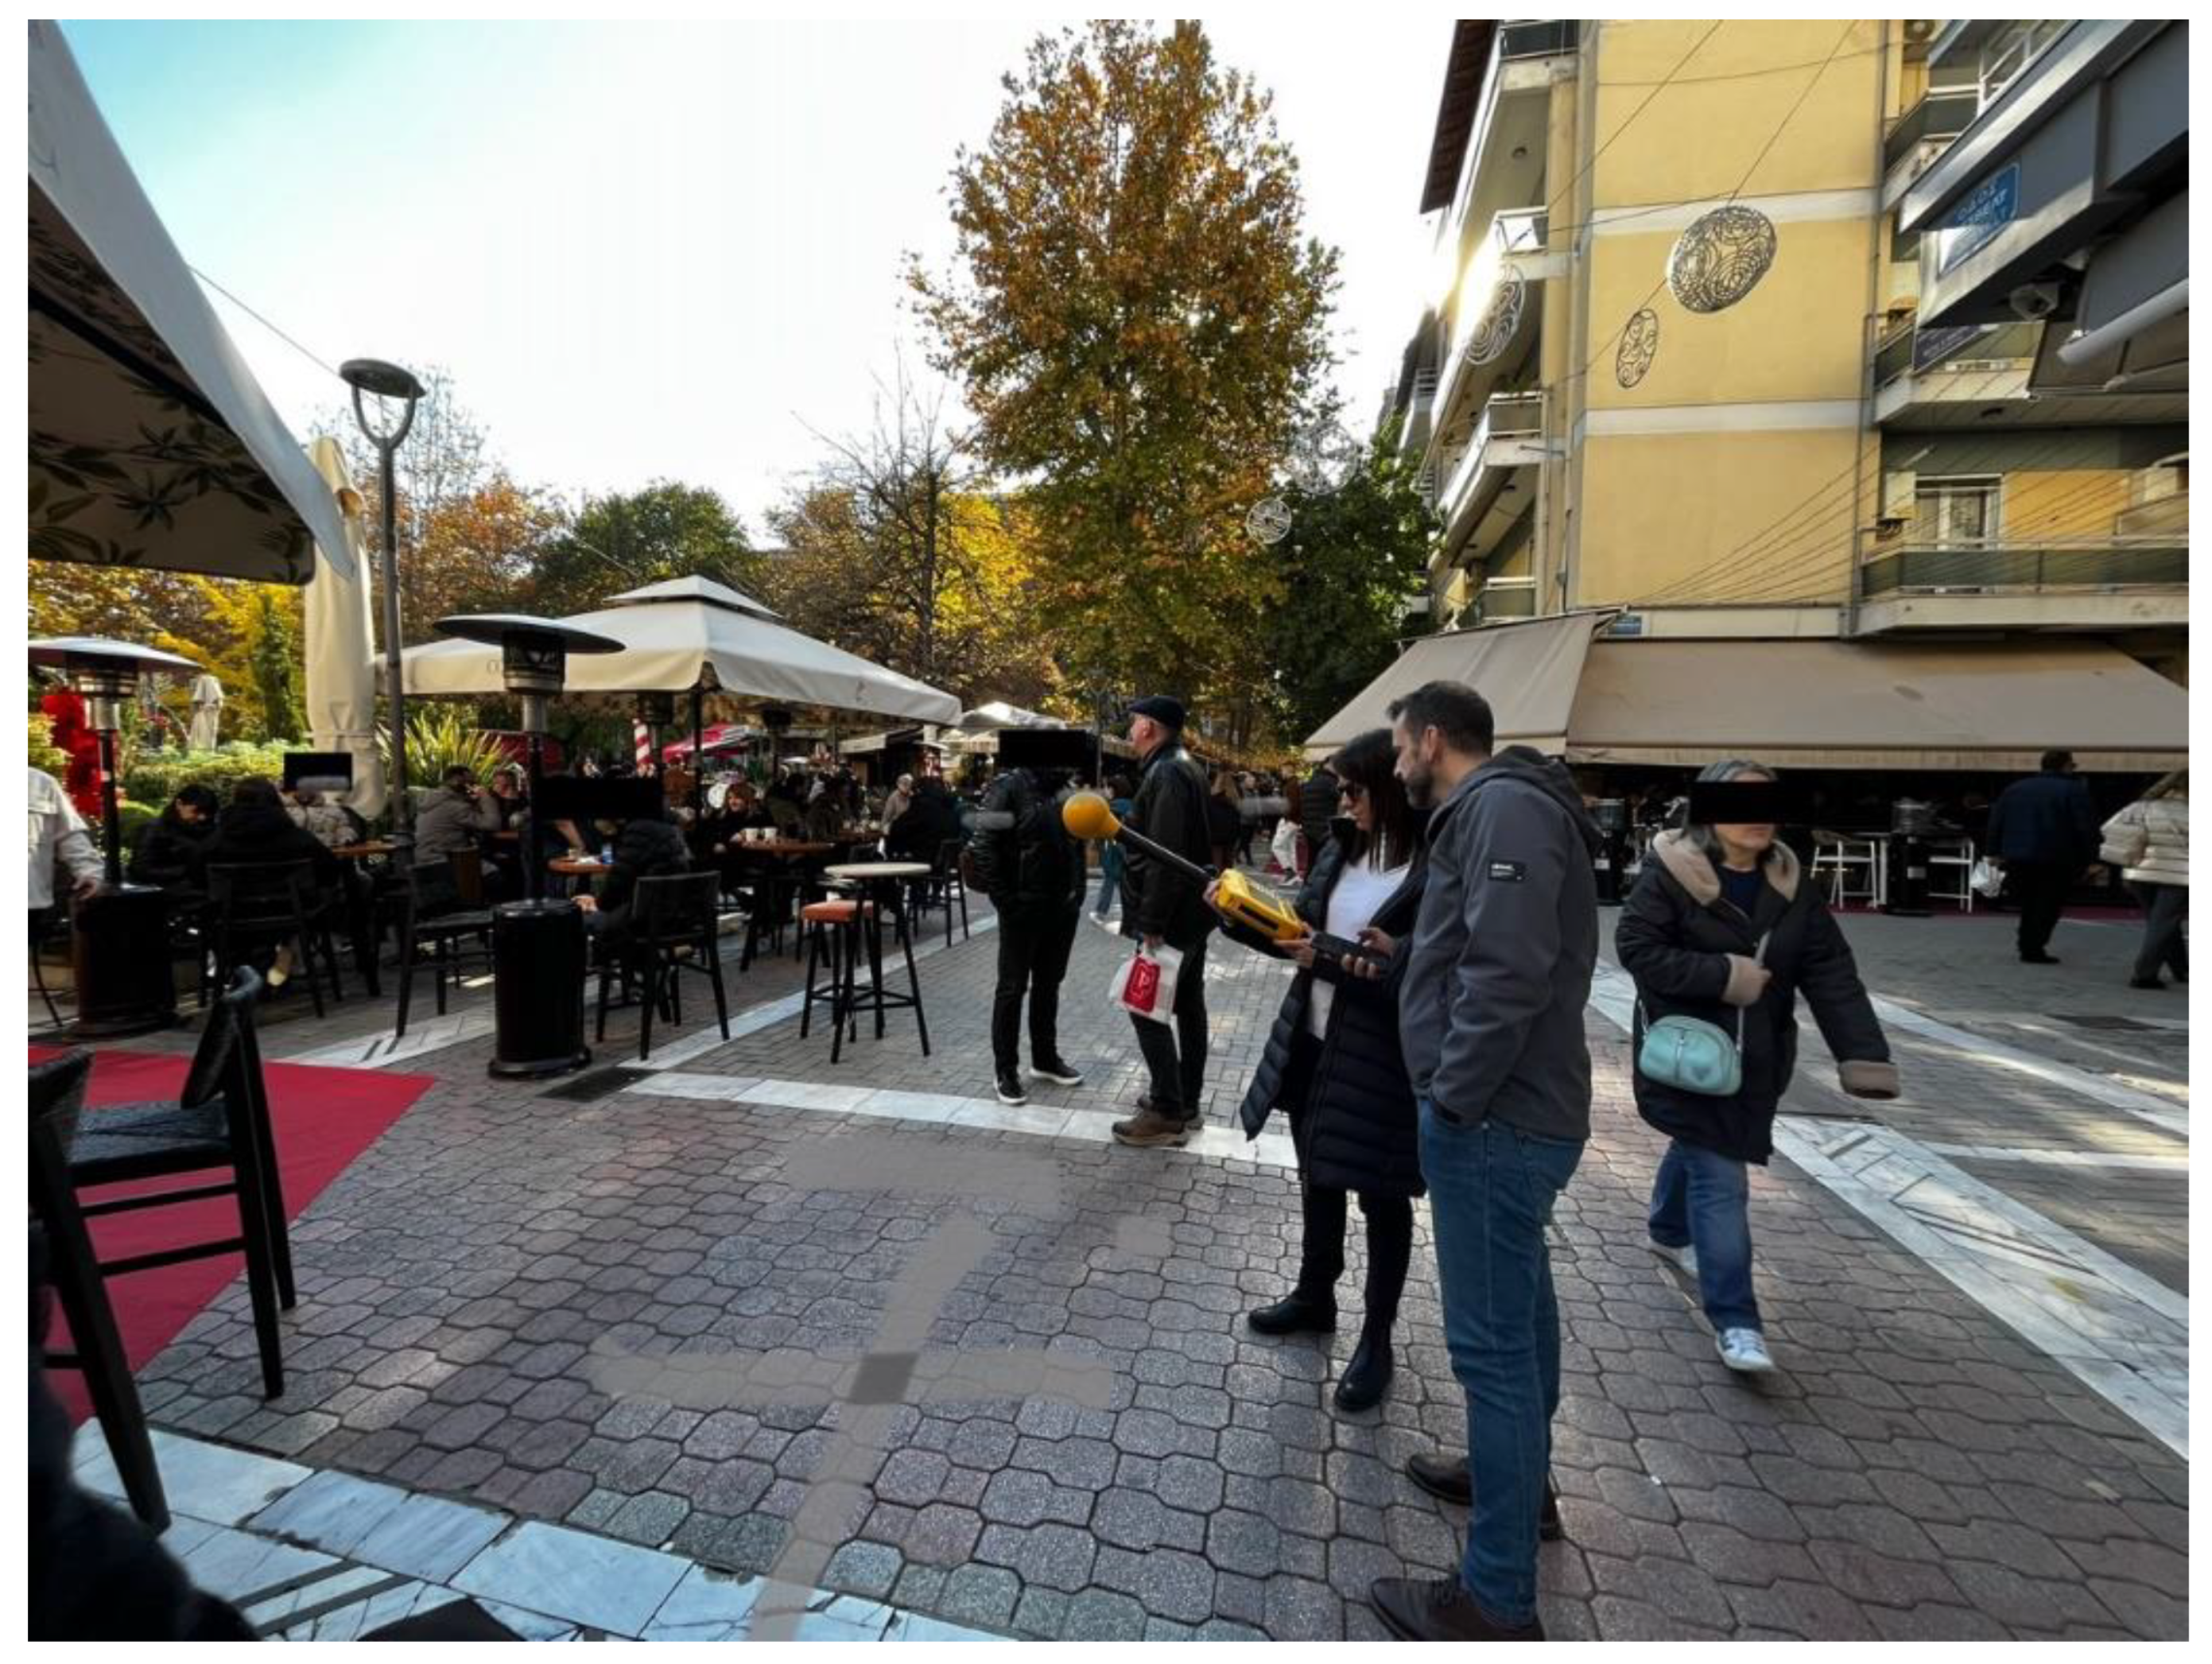
Figure 3.
Electromagnetic radiation measurements in Taxydromiou square.
Figure 3.
Electromagnetic radiation measurements in Taxydromiou square.
In this study, we employed the suggested framework to assess the impact of mobile electromagnetic radiation on the human population in three biggest squares in the city of Larissa. Utilizing the SRM-3006, we evaluated radiofrequency exposure within the ranges of 27 MHz to 6 GHz in areas designated for sensitive land use. A total of three hundred and sixty-five (496) measurements were carried out in the three squares of Larisa city, encompassing these crowded public urban locations.
3. Results
3.1. Measurements
The selected squares were categorized based on traffic and the population density. Based on this we categorized central and triangle square as low traffic and low population density complex and Τaxydromiou square as a high traffic and high population density.
Table 2.
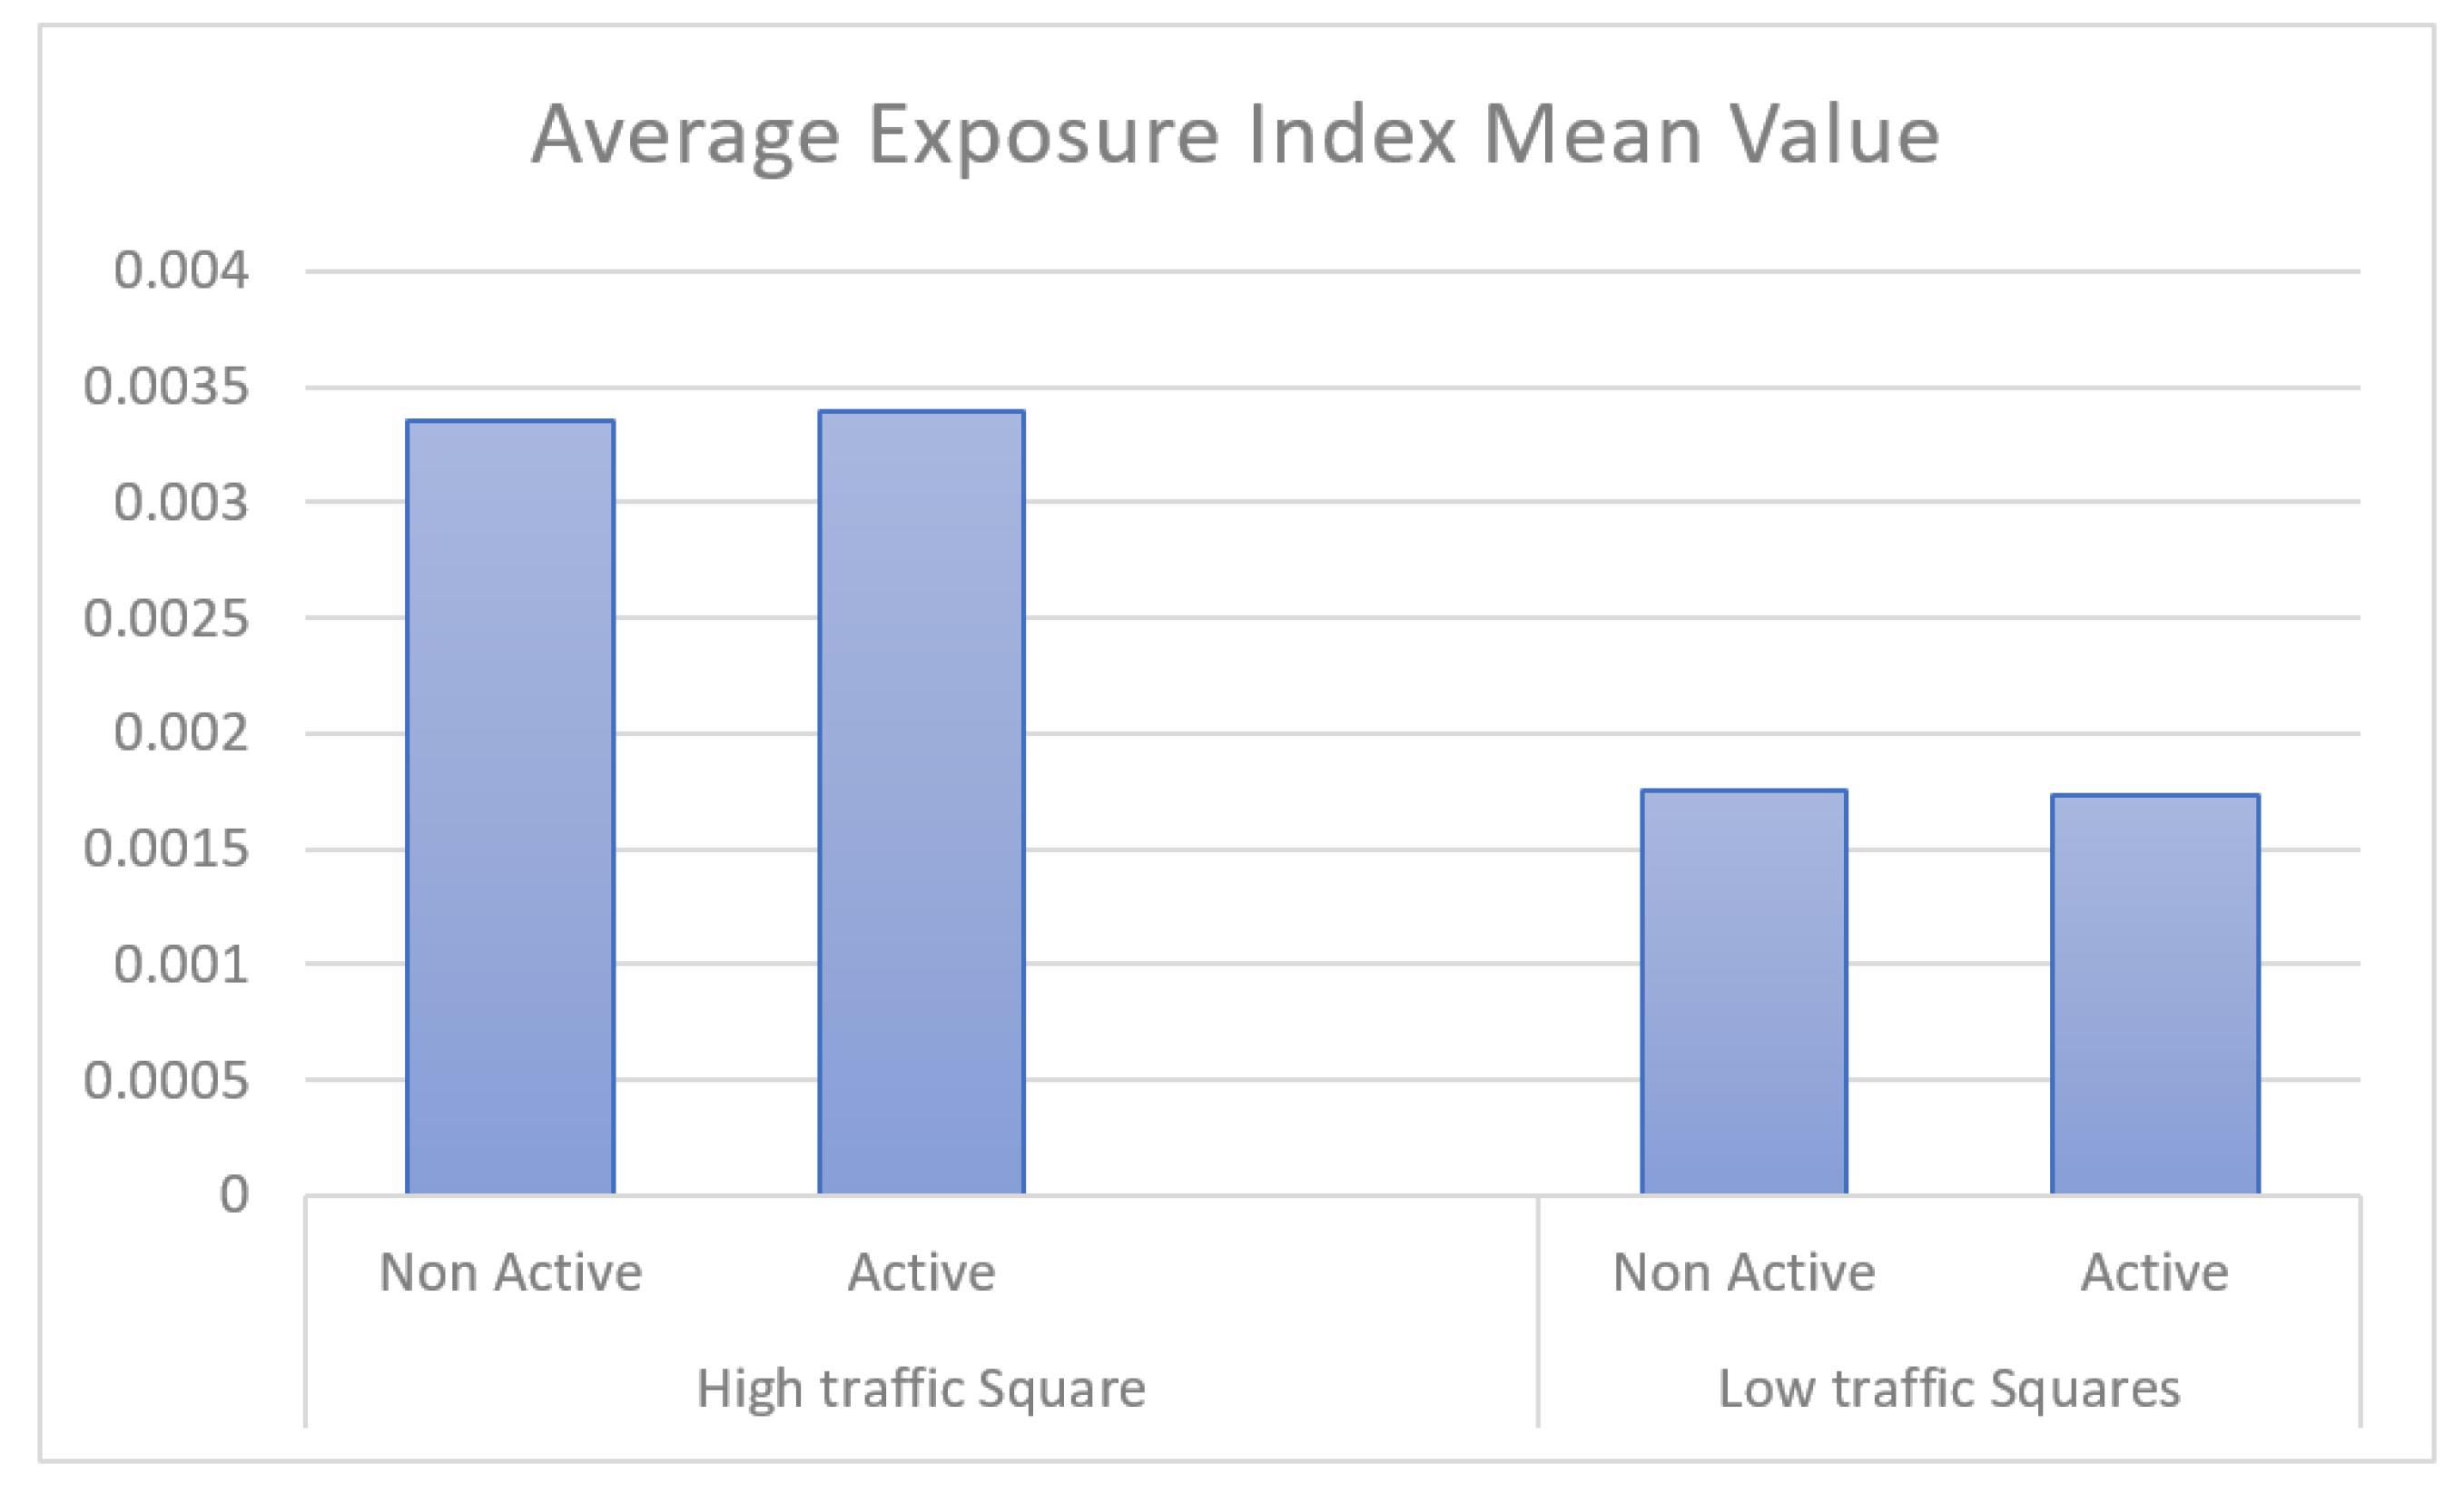
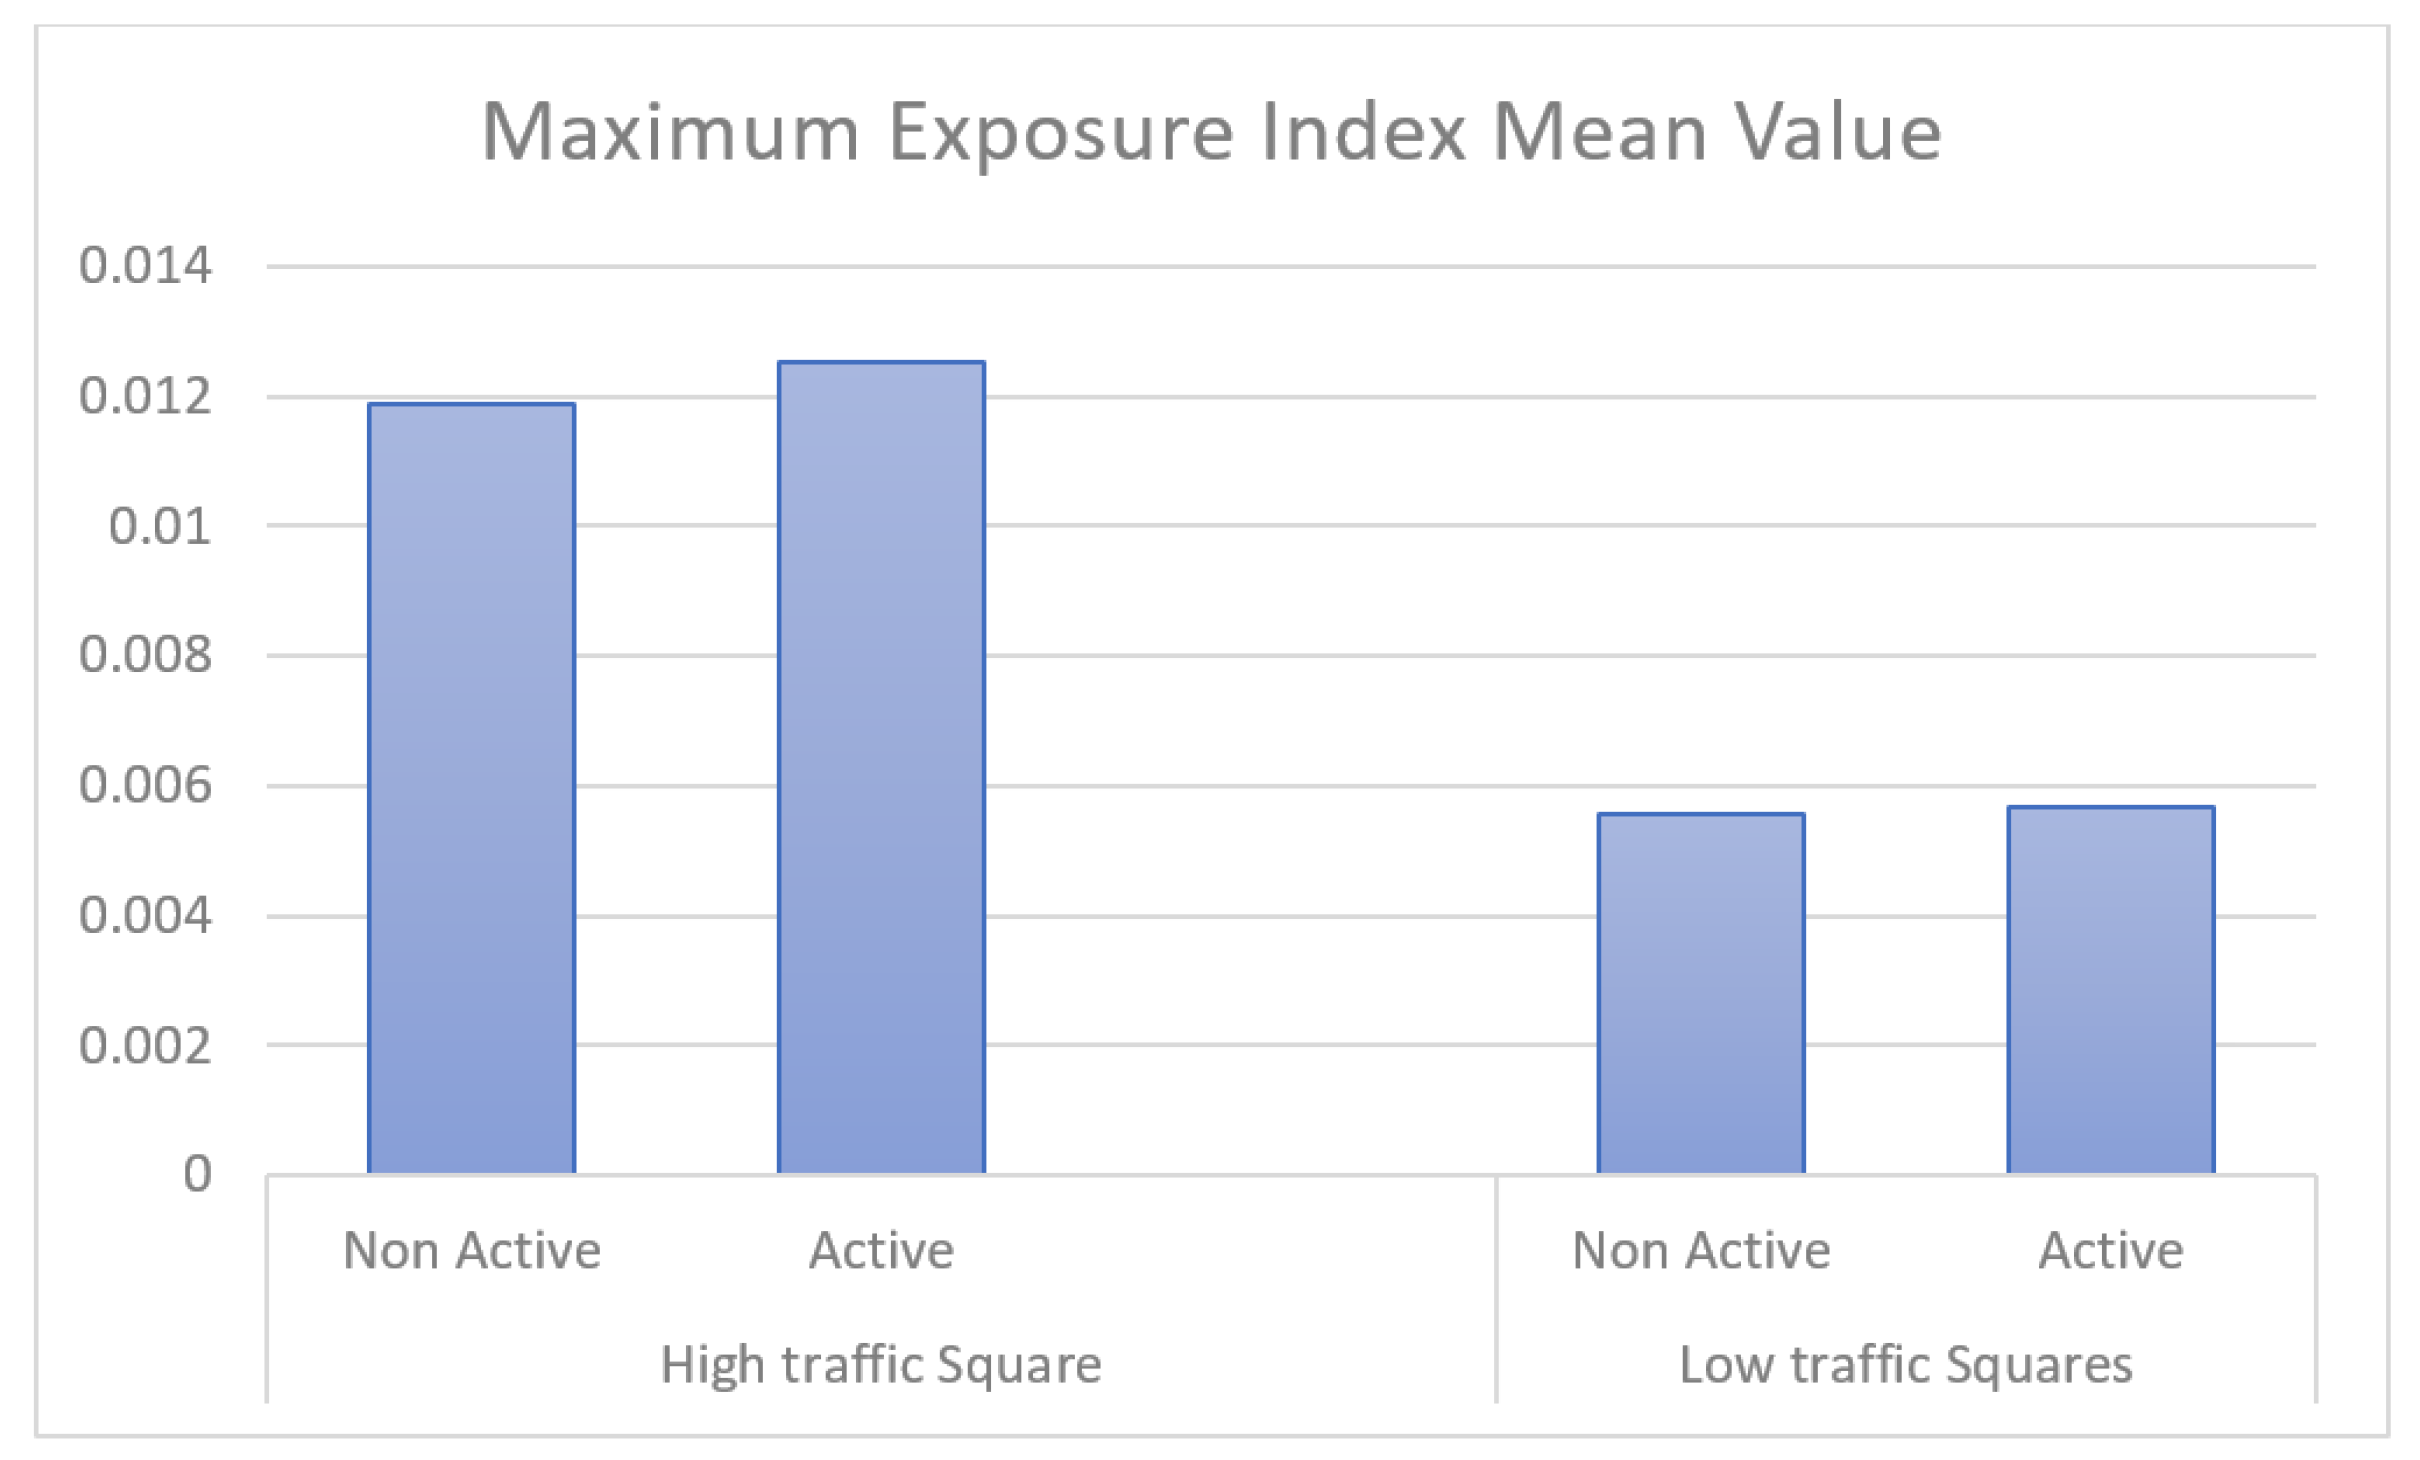
Exposure Index for active and non-active cases measured on the low traffic squares (n = 496).
Table 2.
Exposure Index for active and non-active cases measured on the low traffic squares (n = 496).
| Parameter |
Status |
Median |
Mean |
Average
|
Non Active |
0,0012 |
0,00175 |
| Active |
0,0012 |
0,00173 |
Maximum
|
Non Active |
0,00325 |
0,00558 |
| Active |
0,00325 |
0,00569 |
Figure 4.
Comparison of average exposure index, mean value for all the cases.
Figure 4.
Comparison of average exposure index, mean value for all the cases.
Table 3.
Exposure Index for active and non-active cases measured on the high traffic squares (n = 496).
Table 3.
Exposure Index for active and non-active cases measured on the high traffic squares (n = 496).
| Parameter |
Status |
Median |
Mean |
Average
|
Non Active |
0,0033 |
0,0035 |
| Active |
0,0033 |
0,0034 |
Maximum
|
Non Active |
0,00131 |
0,0119 |
| Active |
0,00131 |
0,0125 |
Figure 5.
Comparison of maximum exposure index, mean value for all the cases.
Figure 5.
Comparison of maximum exposure index, mean value for all the cases.
Mood's median test is a non-parametric statistical test used to assess whether the medians of two or more groups are equal. The selection of Mood's median test for comparing electromagnetic measurements is likely based on certain characteristics of the data or the nature of the study. The nature of electromagnetic measurements do not follow a normal distribution, so Mood’s median test is more appropriate than t-test or ANOVA. Furthermore, non-parametric tests, including Mood's median test, can be more robust when dealing with small sample sizes. If the number of observations in each group is limited, non-parametric tests are often preferred.
Mood's median test analysis was conducted in two distinct scenarios, specifically categorizing the data into Low Traffic, Maximum, and High Traffic, Maximum for the two groups: Non-Active and Active. This statistical test was chosen due to its suitability for comparing median values when dealing with non-normally distributed data. The test allowed for an assessment of whether there were statistically significant differences in the medians of electromagnetic measurements between the Non-Active and Active groups in low and high traffic squares.
The significant level for both tests are α = 0.05. If p > α then, no significant difference between the two samples. If (p < α) then, the two samples (Non-Active and Active groups) are different.
At the first case (low traffic, maximum exposure index) the p-value was 0.871, p > a, so there is no significant difference between two samples.
At the second (worst) case (high traffic, maximum exposure index) the p-value was 1, p > a, so there is no significant difference between two samples.
3.2. Georeference demonstration
Continuous monitoring and assessments are systematically carried out to ensure adherence to established safety standards, offering assurance to the Larissa community that public squares in the region maintain a safe environment with respect to electromagnetic radiation. The emissions from mobile phones primarily consist of Non-Ionizing radiation, generally considered safe for everyday communication usage. Parents, students, and square visitors can trust that their well-being remains a paramount concern, with the utilization of mobile devices and communication infrastructure Posing clinically non-detectable health risks in the urban areas of Larissa.
Furthermore, the design and operation of base stations are meticulously executed to mitigate potential exposure risks to nearby residents, including individuals frequenting these public spaces. This strategic approach involves a network of towers that collectively reduces the power output of each individual tower, resulting in an overall decline in electromagnetic radiation within the environment. The density of the towers distribution in the area corresponds to lower levels of radiation exposure, a principle substantiated by our measurements in Larissa. The distributed tower network enables signal transmission at reduced power levels, effectively minimizing cumulative electromagnetic radiation in the squares. Our measurements affirm that this approach not only upholds the quality of mobile phone services but also prioritizes the safety of the local community, ensuring that radiation levels remain well within established safety limits.
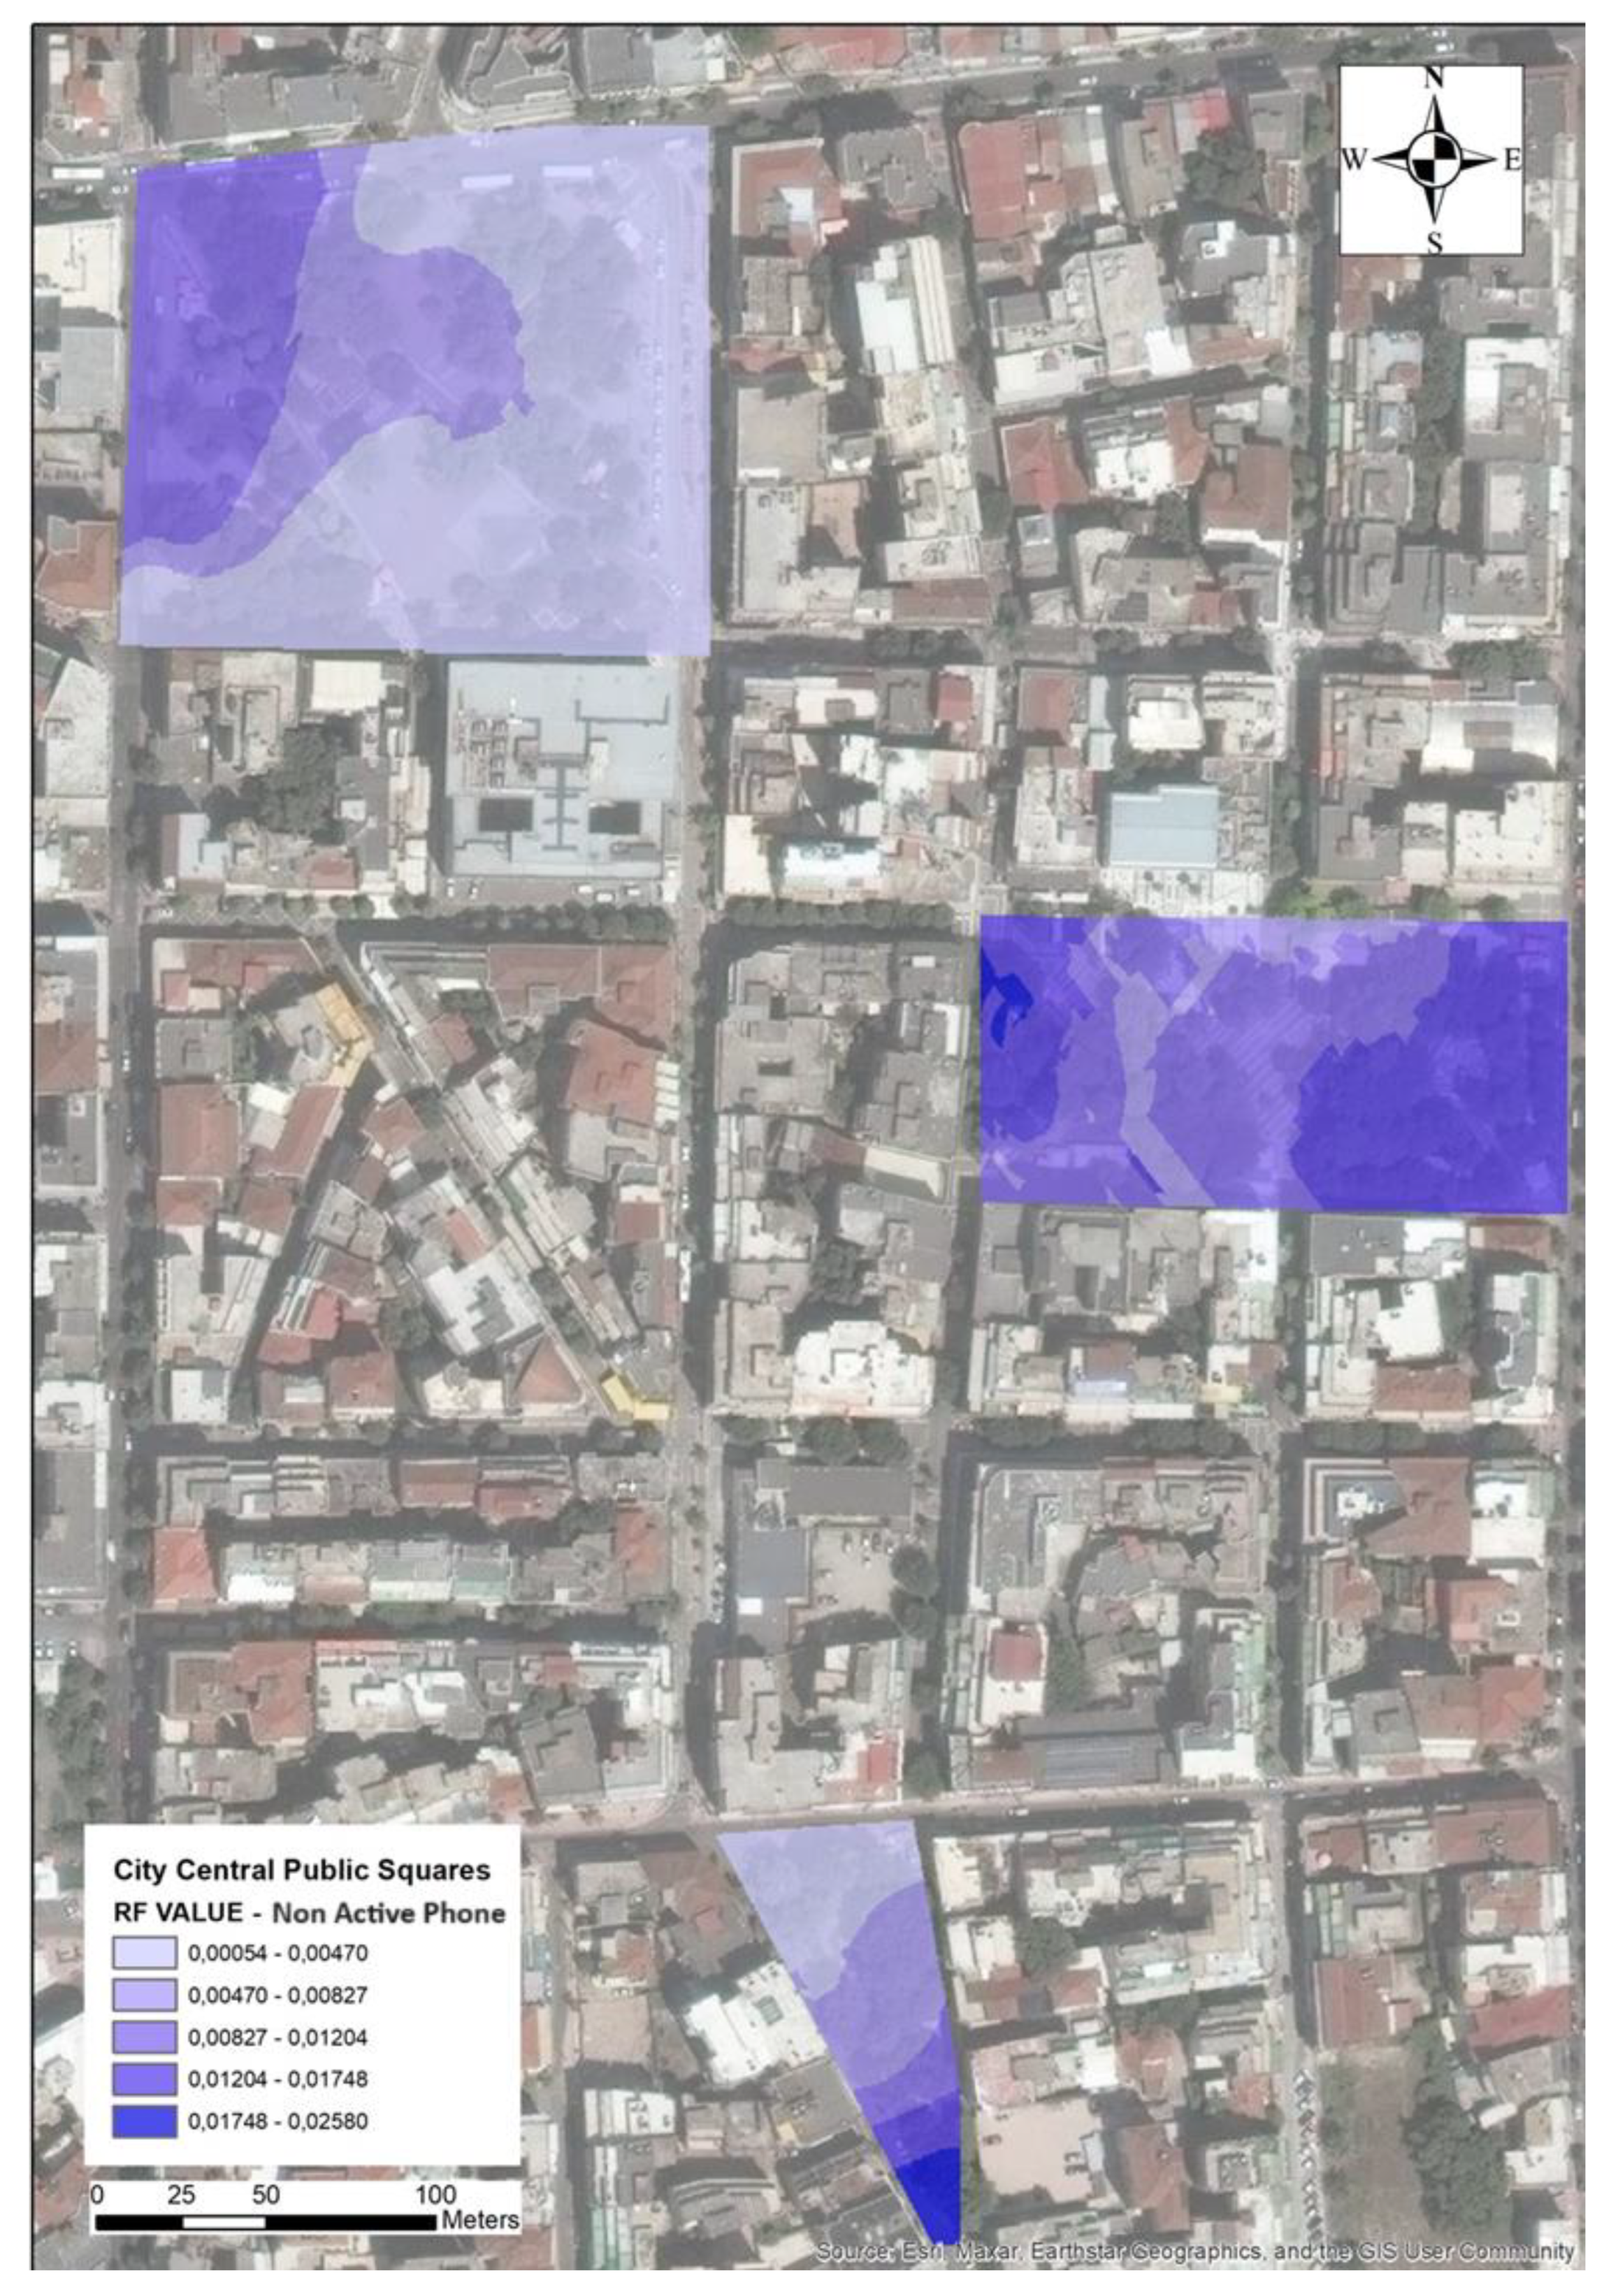
Figure 6.
The maximum exposure index of Non-Active Mobile Phone case for all the crowded squares.
Figure 6.
The maximum exposure index of Non-Active Mobile Phone case for all the crowded squares.
Figure 7.
The maximum exposure index of Active Mobile Phone case for all the crowded squares.
Figure 7.
The maximum exposure index of Active Mobile Phone case for all the crowded squares.
4. Discussion
The findings of our electromagnetic field (EMF) measurements reveal that the levels of exposure in the studied areas, including the larger squares in the city of Larissa’s are consistently below the established safety limits. This discussion aims to delve into the significance of our results, emphasizing the adherence to international guidelines and drawing comparisons with relevant literature in the field.
Our study employed rigorous measurements using the SRM-3006 equipment to assess radiofrequency exposure within the specified frequency ranges (27 MHz -3000 GHz and 420 MHz to 6 GHz) in areas designated for sensitive land use. The calculated electric field strengths were then compared against safety thresholds, notably those outlined in the International Commission on Non-Ionizing Radiation Protection (ICNIRP) 2020 guidelines. Remarkably, our results consistently demonstrate that the observed EMF levels remain well below the recommended limits, affirming the safety of the studied environments. Specifically, in the worst-case scenario (high traffic, maximum exposure index and active mobile phone), our measurements indicate that we are 360 times below the Internationally accepted safety limits. This underscores the effectiveness of existing safety standards in ensuring that our exposure to electromagnetic radiation remains well below permissible limits.
The consistent alignment of our measurements with international safety standards has significant implications for public health and policy-making. Firstly, there is no statistically significant difference between the two scenarios under comparison. This suggests that, in terms of electromagnetic measurements, the variations between the scenarios are not significant enough to be considered beyond random fluctuations. Secondly, when considering low and high traffic scenarios with maximum exposure index in active groups, a notable difference of approximately 300% is observed in both mean and median values. This disparity is attributed to the presence of numerous active beams in the area, likely stemming from other users. Additionally, our location, situated at a considerable distance from antennas, causes the beam to widen, rendering our field homogeneous. It provides reassurance regarding the safety of daily exposure to electromagnetic fields in the studied regions. These results can add in informing policy decisions related to the deployment of wireless technologies, ensuring that the expansion of communication networks is carried out in a manner that prioritizes public safety.
While our study offers valuable insights, it is essential to acknowledge certain limitations. The measurements were conducted at specific points in time and locations, and the exposure levels may vary under different conditions. Also, the number of the data are limited, so in the future will be performing more measurements in crowded places. Future research could involve continuous monitoring and the inclusion of additional parameters for a comprehensive understanding of electromagnetic exposure.
5. Conclusions
In conclusion, this scientific study on electromagnetic field (EMF) measurements in crowded places provides valuable insights into the complex landscape of electromagnetic radiation within densely populated environments. Through the utilization of spot measurements and rigorous assessment techniques, our investigation aimed to elucidate the potential impact of the increasing use of EMF-emitting sources.
The findings of this study reveal that, within the selected crowded places, EMF exposure levels remain within established safety limits and guidelines. The meticulous analysis of RF exposure in crowded urban settings, employing both theoretical insights and advanced measurement techniques, allowed for a comprehensive evaluation of the electromagnetic landscape. Our results indicate that the concurrent use of various electronic devices and communication networks does not lead to considerable EMF exposure of the general population. Also, through our measurements, we have demonstrated that being in a highly frequented square, whether actively downloading data or not, results in minimal additional radiation compared to other users. Therefore, we conclude that our environment transforms into a homogeneous field, indicating that the radiation levels experienced by individuals in the square remain consistent, regardless of their specific data usage.
Moreover, the application of georeferencing techniques in assessing exposure to 4G and 5G radiofrequency electromagnetic fields provided a nuanced understanding of the spatial distribution of EMF levels. The integration of this geographical context into our measurements enhances the relevance and applicability of our findings to real-world scenarios.
In summary, the results of this study provide evidence that, at present, EMF exposure in crowded places remains within acceptable limits. This work contributes to the broader scientific discourse on electromagnetic safety in urban environments and underscores the significance of continued research and communication to ensure the responsible and informed integration of evolving technologies into our daily lives.
References
- Yetiş, C.; Tuna, M. Determination of EMF Pollution in the Context of Urban Health: The Case of Safranbolu. Comput. Res. Prog. Appl. Sci. Eng. 2021, 7, 1–10. [Google Scholar] [CrossRef]
- Dürrenberger, G.; Fröhlich, J.; Röösli, M.; Mattsson, M.O. EMF monitoring-concepts, activities, gaps and options. Int. J. Environ. Res. Public Health 2014, 11, 9460–9479. [Google Scholar] [CrossRef]
- Ramirez-Vazquez, R.; Arabasi, S.; Al-Taani, H.; Sbeih, S.; Gonzalez-Rubio, J.; Escobar, I.; Arribas, E. Georeferencing of Personal Exposure to Radiofrequency Electromagnetic Fields from Wi-Fi in a University Area. Int. J. Environ. Res. Public Health 2020, 17, 1898. [Google Scholar] [CrossRef]
- Alexias, A.; Kiouvrekis, Y.; Softa, V.; Kappas, C.; Tyrakis, C.; Theodorou, K. RF-EMF EXPOSURE LEVELS IN SENSITIVE LAND USE IN GREECE: EDUCATIONAL UNITS CENSUS IN THE MUNICIPALITY OF KORYDALLOS. Radiat. Prot. Dosim. 2020, 190, 193–199. [Google Scholar] [CrossRef]
- Forecast number of mobile users worldwide from 2020 to 2025 (in billions). Available online: https://www.statista.com/statistics/218984/number-of-global-mobile-users-since-2010/ (accessed on 11 December 2023).
- Number of internet users worldwide from 2005 to 2022 (in millions). Available online: https://www.statista.com/statistics/273018/number-of-internet-users-worldwide (accessed on 11 December 2023).
- Kiouvrekis, Y.; Manios, G.; Tsitsia, V.; Gourzoulidis, G.; Kappas, C. A statistical analysis for RF-EMF exposure levels in sensitive land use: A novel study in Greek primary and secondary education schools. Environ. Res. 2020, 191. [Google Scholar] [CrossRef]
- Birks, L.E.; Struchen, B.; Eeftens, M.; van Wel, L.; Huss, A.; Gajšek, P.; Kheifets, L.; Gallastegi, M.; Dalmau-Bueno, A.; Estarlich, M.; et al. Spatial and temporal variability of personal environmental exposure to radio frequency electromagnetic fields in children in Europe. Environ. Int. 2018, 117, 204–214. [Google Scholar] [CrossRef]
- Frei, P.; Mohler, E.; Bürgi, A.; Fröhlich, J.; Neubauer, G.; Braun-Fahrländer, C.; Röösli, M. Classification of personal exposure to radio frequency electromagnetic fields (RF-EMF) for epidemiological research: Evaluation of different exposure assessment methods. Environ. Int. 2010, 36, 714–720. [Google Scholar] [CrossRef]
- Kiouvrekis, Y.; Alexias, A.; Filipopoulos, Y.; Softa, V.; Tyrakis, Ch., D.; Kappas, C. Unsupervised Machine Learning and EMF radiation in schools: a study of 205 schools in Greece. European Journal of Medical Physics, ECMP, Torino, Italy, July 2021. 20 July.
- Song, X.; Han, M.; Chen, Y.; Yue, Y. Public exposure to broadband electromagnetic fields and its association with population density and building density: The case study of Beijing. Heliyon 2023, 9. [Google Scholar] [CrossRef]
- Saliev, T.; Tachibana, K.; Bulanin, D.; Mikhalovsky, S.; Whitby, R.D. Bio-effects of non-ionizing electromagnetic fields in context of cancer therapy. Front. Biosci. (Elite Ed.) 2014, 6, 175–184. [Google Scholar] [CrossRef]
- Liu, J.; Wei, M.; Li, H.; Wang, X.; Wang, X.; Shi, S. Measurement and mapping of the electromagnetic radiation in the urban environment. Electromagn. Biol. Med. 2020, 39, 38–43. [Google Scholar] [CrossRef]
- Nyerges, T.; Robkin, M.; Moore, T.J. Geographic Information Systems for Risk Evaluation: Perspectives on Applications to Environmental Health. Cartogr. Geogr. Inf. Sci. 1997, 24, 123–144. [Google Scholar] [CrossRef]
- Clarke, K.C.; McLafferty, S.L.; Tempalski, B.J. On epidemiology and geographic information systems: a review and discussion of future directions. Emerg. Infect. Dis. 1996, 2, 85–92. [Google Scholar] [CrossRef]
- Rinaldi, A.M. A GIS-based system for electromagnetic risk management in urban areas. J. Locat. Based Serv. 2009, 3, 3–23. [Google Scholar] [CrossRef]
- Tobin, R.; Grover, C.; Byrne, K.; Reid, J.; Walsh, J. Evaluation of Georeferencing. GIR '10: Proceedings of the 6th Workshop on Geographic Information Retrieval, Zurich, Switzerland, 18–19 February 2010. Association for Computing Machinery, New York, NY, United States, 2010. 18–19 February.
- Zhu, L.; Erving, A.; Koistinen, K.; Nuikka, M.; Junnilainen, H.; Heiska, N.; Haggrén, H. Georeferencing multi-temporal and multi-scale imagery in photogrammetry. The International Society for Photogrammetry and Remote Sensing, Beijing, China, 3–11 July 2008. 3–11 July.
- Nuckols, J.R.; Ward, M.H.; Jarup, L. Using geographic information systems for exposure assessment in environmental epidemiology studies. Environ. Health Perspect. 2004, 112, 1007–1015. [Google Scholar] [CrossRef]
- Barrile, V.; Bilotta, G.; Di Capua, F. GIS for calculating electromagnetic field. In Proceedings of the 2nd WSEAS International Conference on URBAN PLANNING and TRANSPORTATION, Rodos, Greece, 22–24 July 2009. [Google Scholar]
- Al–Sahly, A.; Hassan, M.M.; Al–Rubaian, M.; Al–Qurishi, M. Using GIS for Measuring Mobile Tower Radiation on Human. In Proceedings of the 1st International Conference on Computer Applications & Information Security, Riyadh, Kingdom of Saudi Arabia, 4–6 April 2018. [Google Scholar]
- Gonzalez-Rubio, J.; Najera, A.; Arribas, E. Comprehensive personal RF-EMF exposure map and its potential use in epidemiological studies. Environ. Res. 2016, 149, 105–112. [Google Scholar] [CrossRef]
- Pesaresi, C.; Pavia, D. Radio Base Stations and Electromagnetic Fields: GIS Applications and Models for Identifying Possible Risk Factors and Areas Exposed. Some Exemplifications in Rome. ISPRS Int. J. Geo-Inf 2021, 10, 3. [Google Scholar] [CrossRef]
- Nguyen, A.; Crespi, C.M.; Vergara, X.; Kheifets, L. Pesticides as a potential independent childhood leukemia risk factor and as a potential confounder for electromagnetic fields exposure. Environ. Res. 2023, 238. [Google Scholar] [CrossRef]
- Ramirez-Vazquez, R.; Escobar, I.; Thielens, A.; Arribas, E. Measurements and Analysis of Personal Exposure to Radiofrequency Electromagnetic Fields at Outdoor and Indoor School Buildings: A Case Study at a Spanish School. IEEE 2020, 8, 195692–195702. [Google Scholar] [CrossRef]
- Tyrakis, C.; Theodorou, K.; Kiouvrekis, Y.; Alexias, A.; Kappas, C. Radiofrequency Exposure Levels in Greece. Bioelectromagnetics 2023, 44, 17–25. [Google Scholar] [CrossRef]
- Faiz, N.S.; Satayev, M.I.; Berdaliyeva, A.A.; Azimov, A.M.; Shapalov, Sh.K.; Nikonov, O.Ya. THE ROLE GIS IN THE ASSESMENT OF ELECTROMAGNETIC RADIATION ON THE EXAMPLE OF A RESIDENTAL AREA. Sci. J. «Rep. NAS RK» 2023, 2, 87–93. [Google Scholar] [CrossRef]
- Ghosh, S.; Dasgupta, A.; Ghosh, S.K. 2011. A geospatial framework for mapping of electromagnetic radiations. Proceedings of the 2nd International Conference on Computing for Geospatial Research & Applications (COM.Geo '11), Washington, DC, USA, May 23-25, 2011. Association for Computing Machinery, New York, NY, USA. 23 May.
- Wang, J.F.; Li, L.F.; Christakos, G. Sampling and Kriging Spatial Means: Efficiency and Conditions. Sensors 2009, 9, 5224–5240. [Google Scholar] [CrossRef] [PubMed]
- Jawad, O.; Lauro, D.; Benlarbi-Delai, A.; Dricot, J.M.; De Doncker, P. Study of Human Exposure Using Kriging Method. Prog. Electromagn. Res. B 2014, 61, 241–252. [Google Scholar] [CrossRef]
|
Disclaimer/Publisher’s Note: The statements, opinions and data contained in all publications are solely those of the individual author(s) and contributor(s) and not of MDPI and/or the editor(s). MDPI and/or the editor(s) disclaim responsibility for any injury to people or property resulting from any ideas, methods, instructions or products referred to in the content. |
© 2024 by the authors. Licensee MDPI, Basel, Switzerland. This article is an open access article distributed under the terms and conditions of the Creative Commons Attribution (CC BY) license (http://creativecommons.org/licenses/by/4.0/).
