Submitted:
17 April 2024
Posted:
18 April 2024
You are already at the latest version
Abstract
Keywords:
1. Introduction
2. Related Work
3. Materials and Methods
3.1. Principal Components Analysis (PCA)
3.2. Linear Discriminant Analysis (LDA)
3.3. Random Forest (RF)
3.4. Training and Test Datasets
3.5. Accuracy Measures for Multi-Level Classification
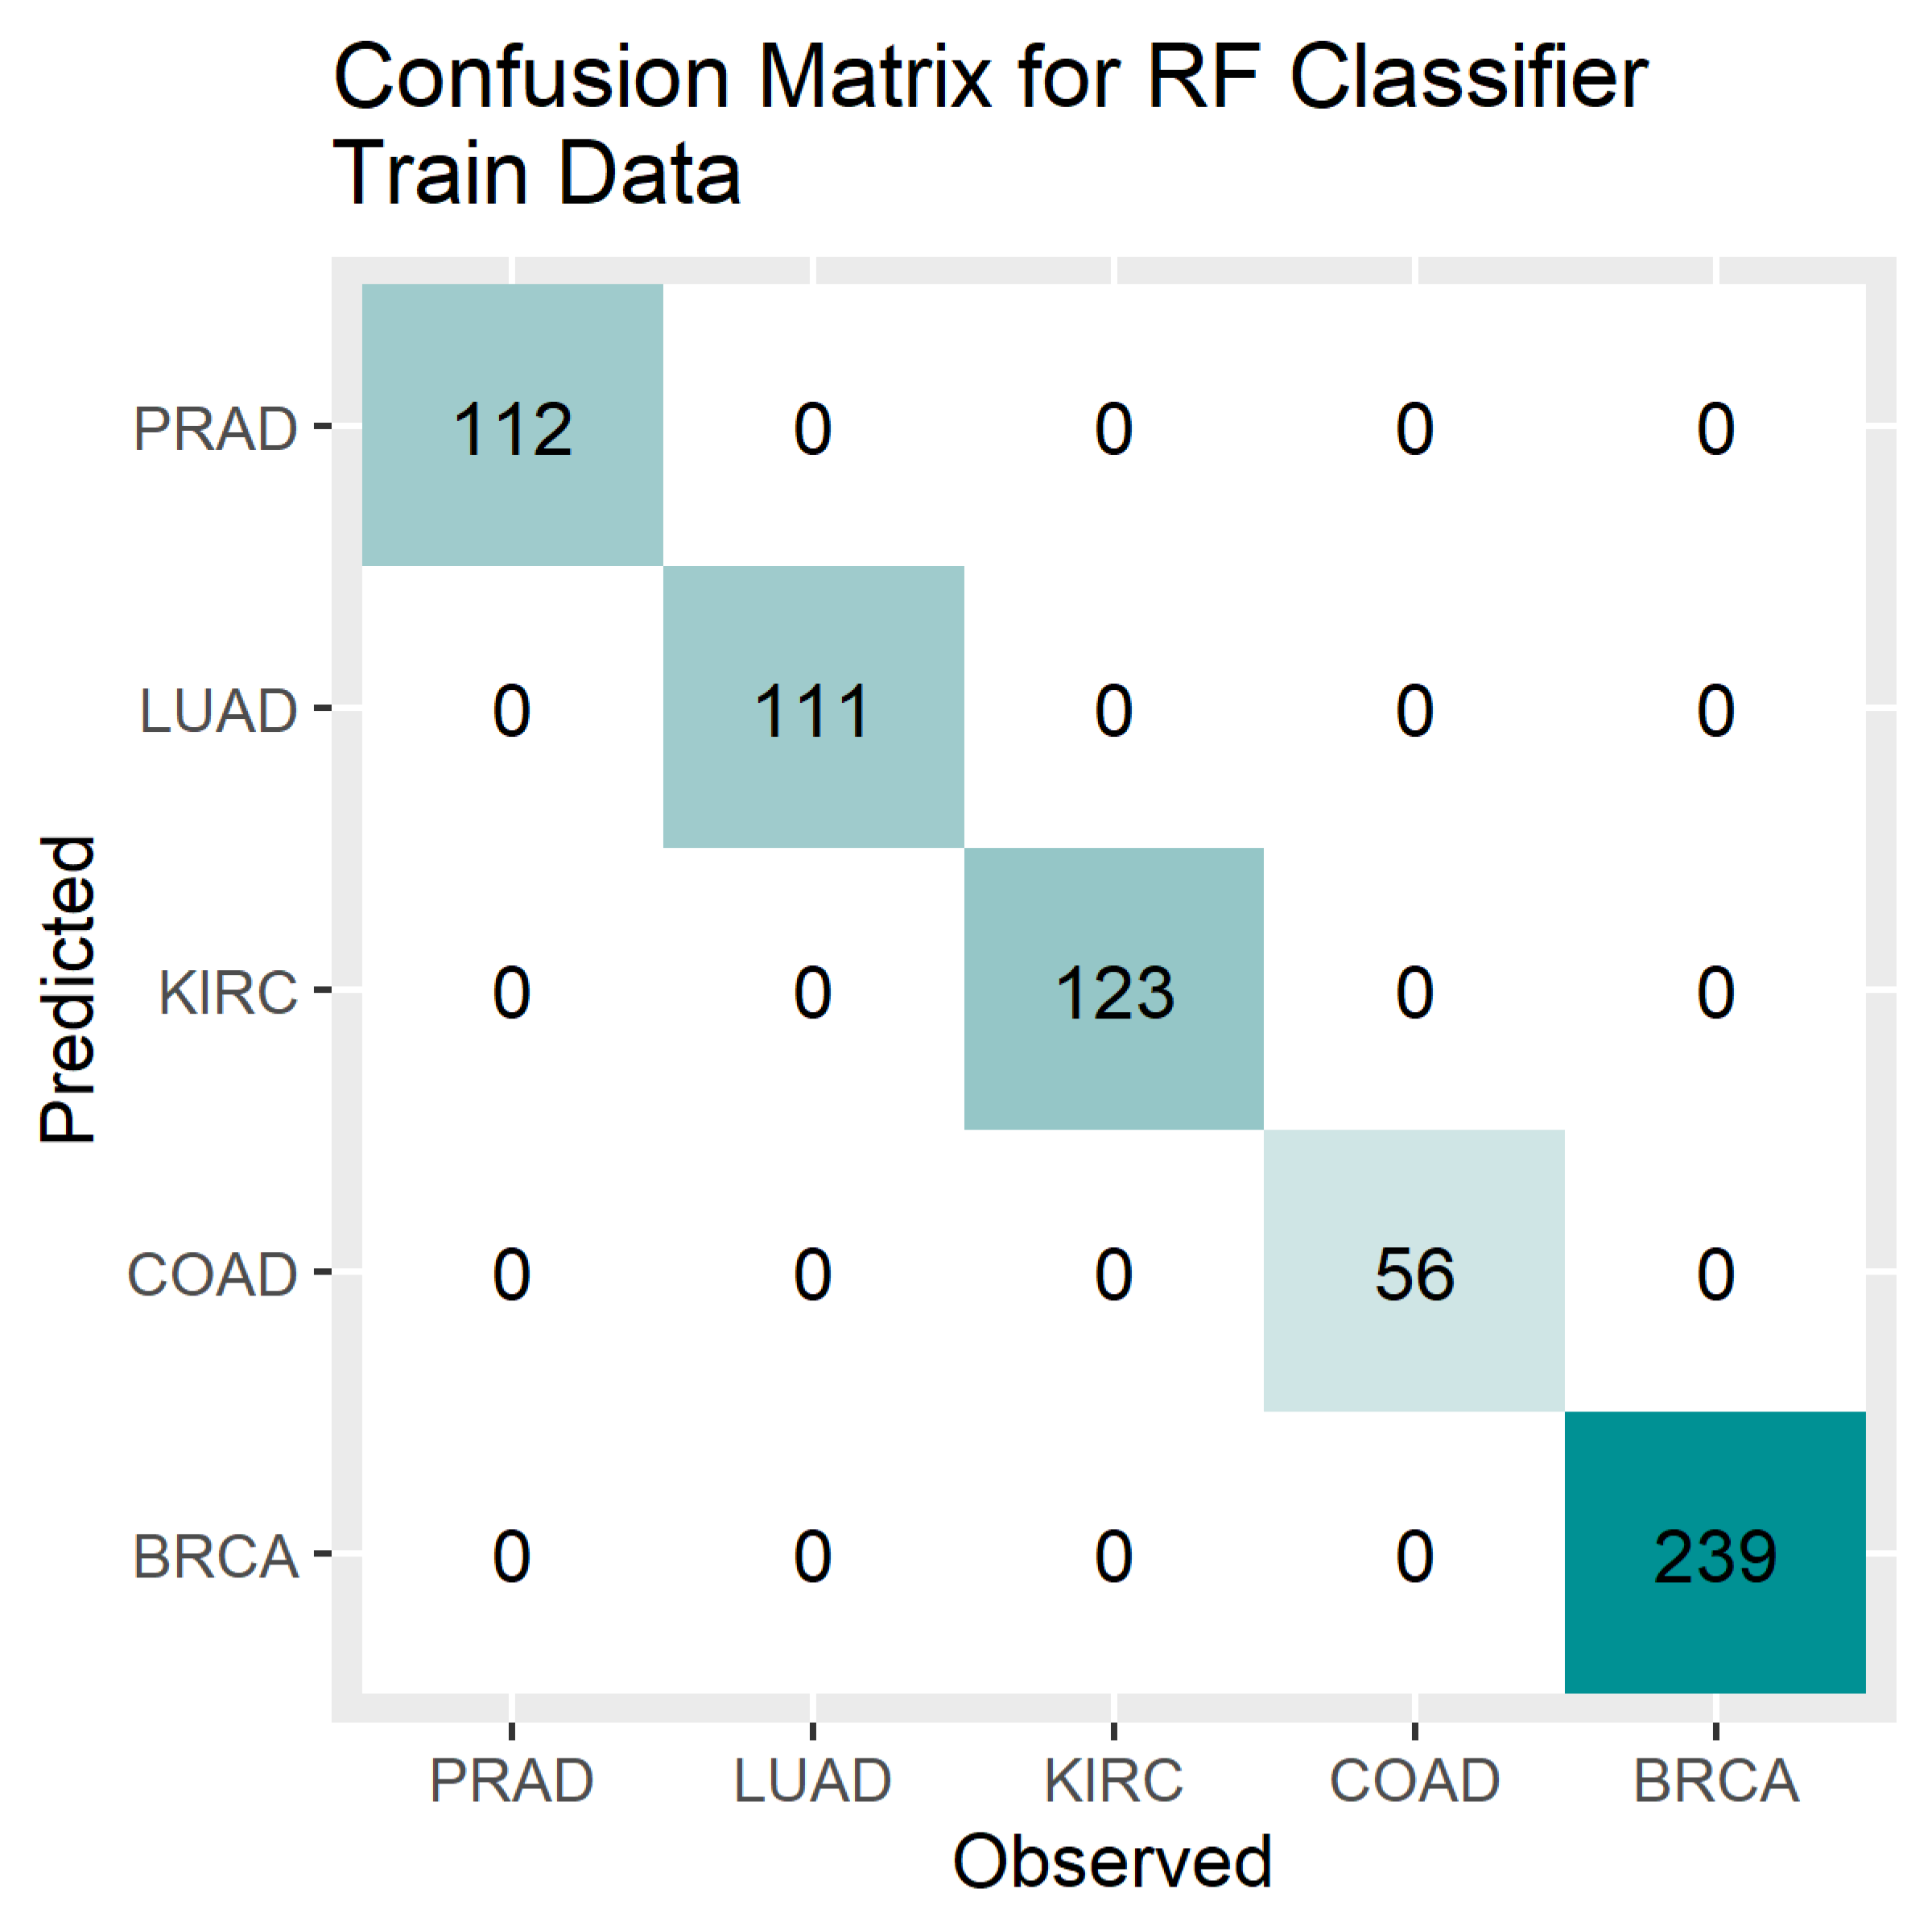
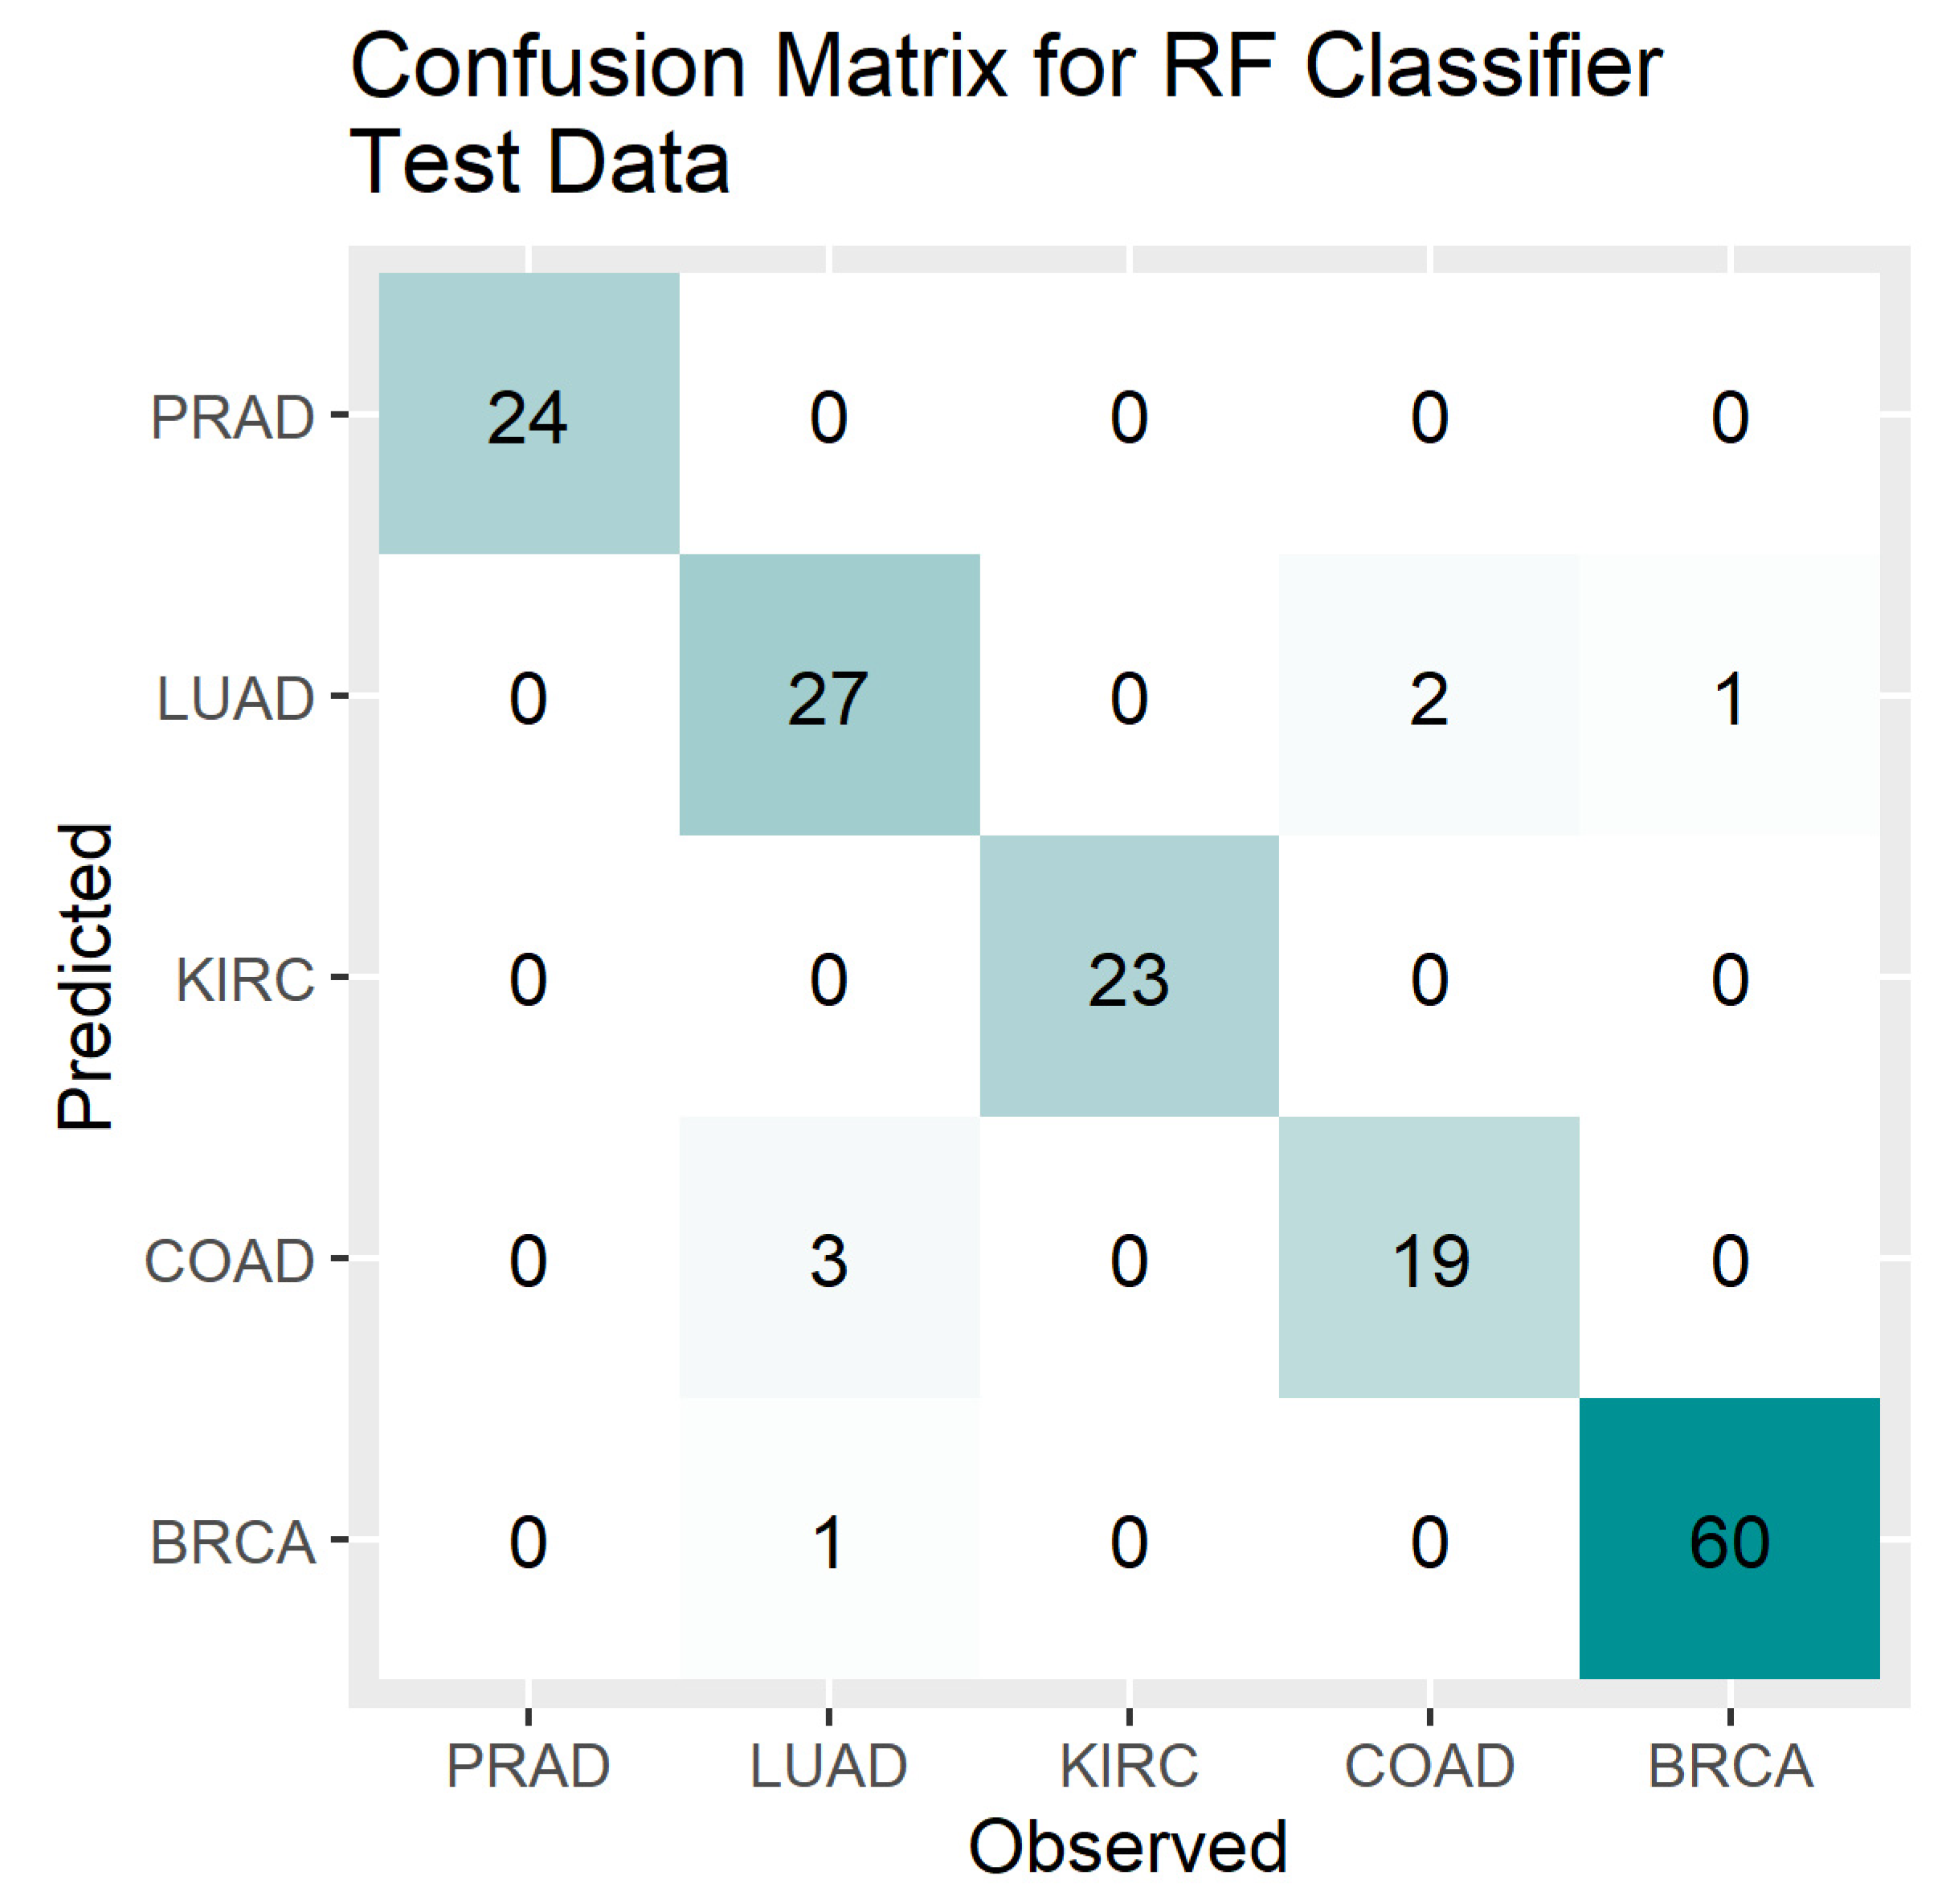
- Overall Accuracy (OA) = sum of diagonal elements of CM/sum of all elements of CM
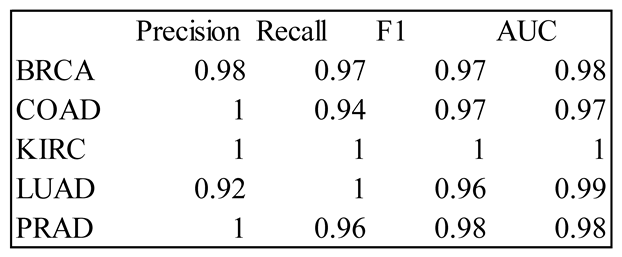
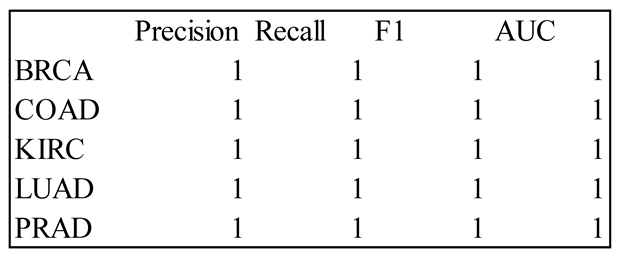
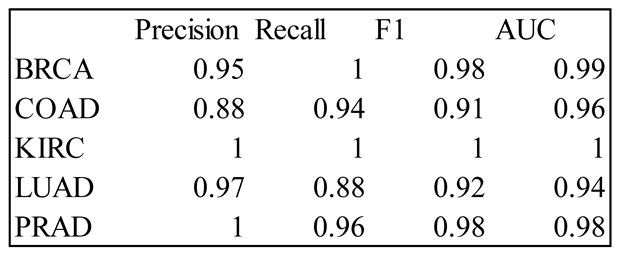
- Precision_j = j-th diagonal element of CM/sum of j-th column of CM
- Recall_j = j-th diagonal element of CM/sum of j-th row of CM
- F1_j = harmonic mean of Precision_j and Recall_j
- Area Under the Curve (AUC)
- Macro- and micro-averages of AUC
- Explanations of the accuracy measures and computational details are provided in [52].
4. Results
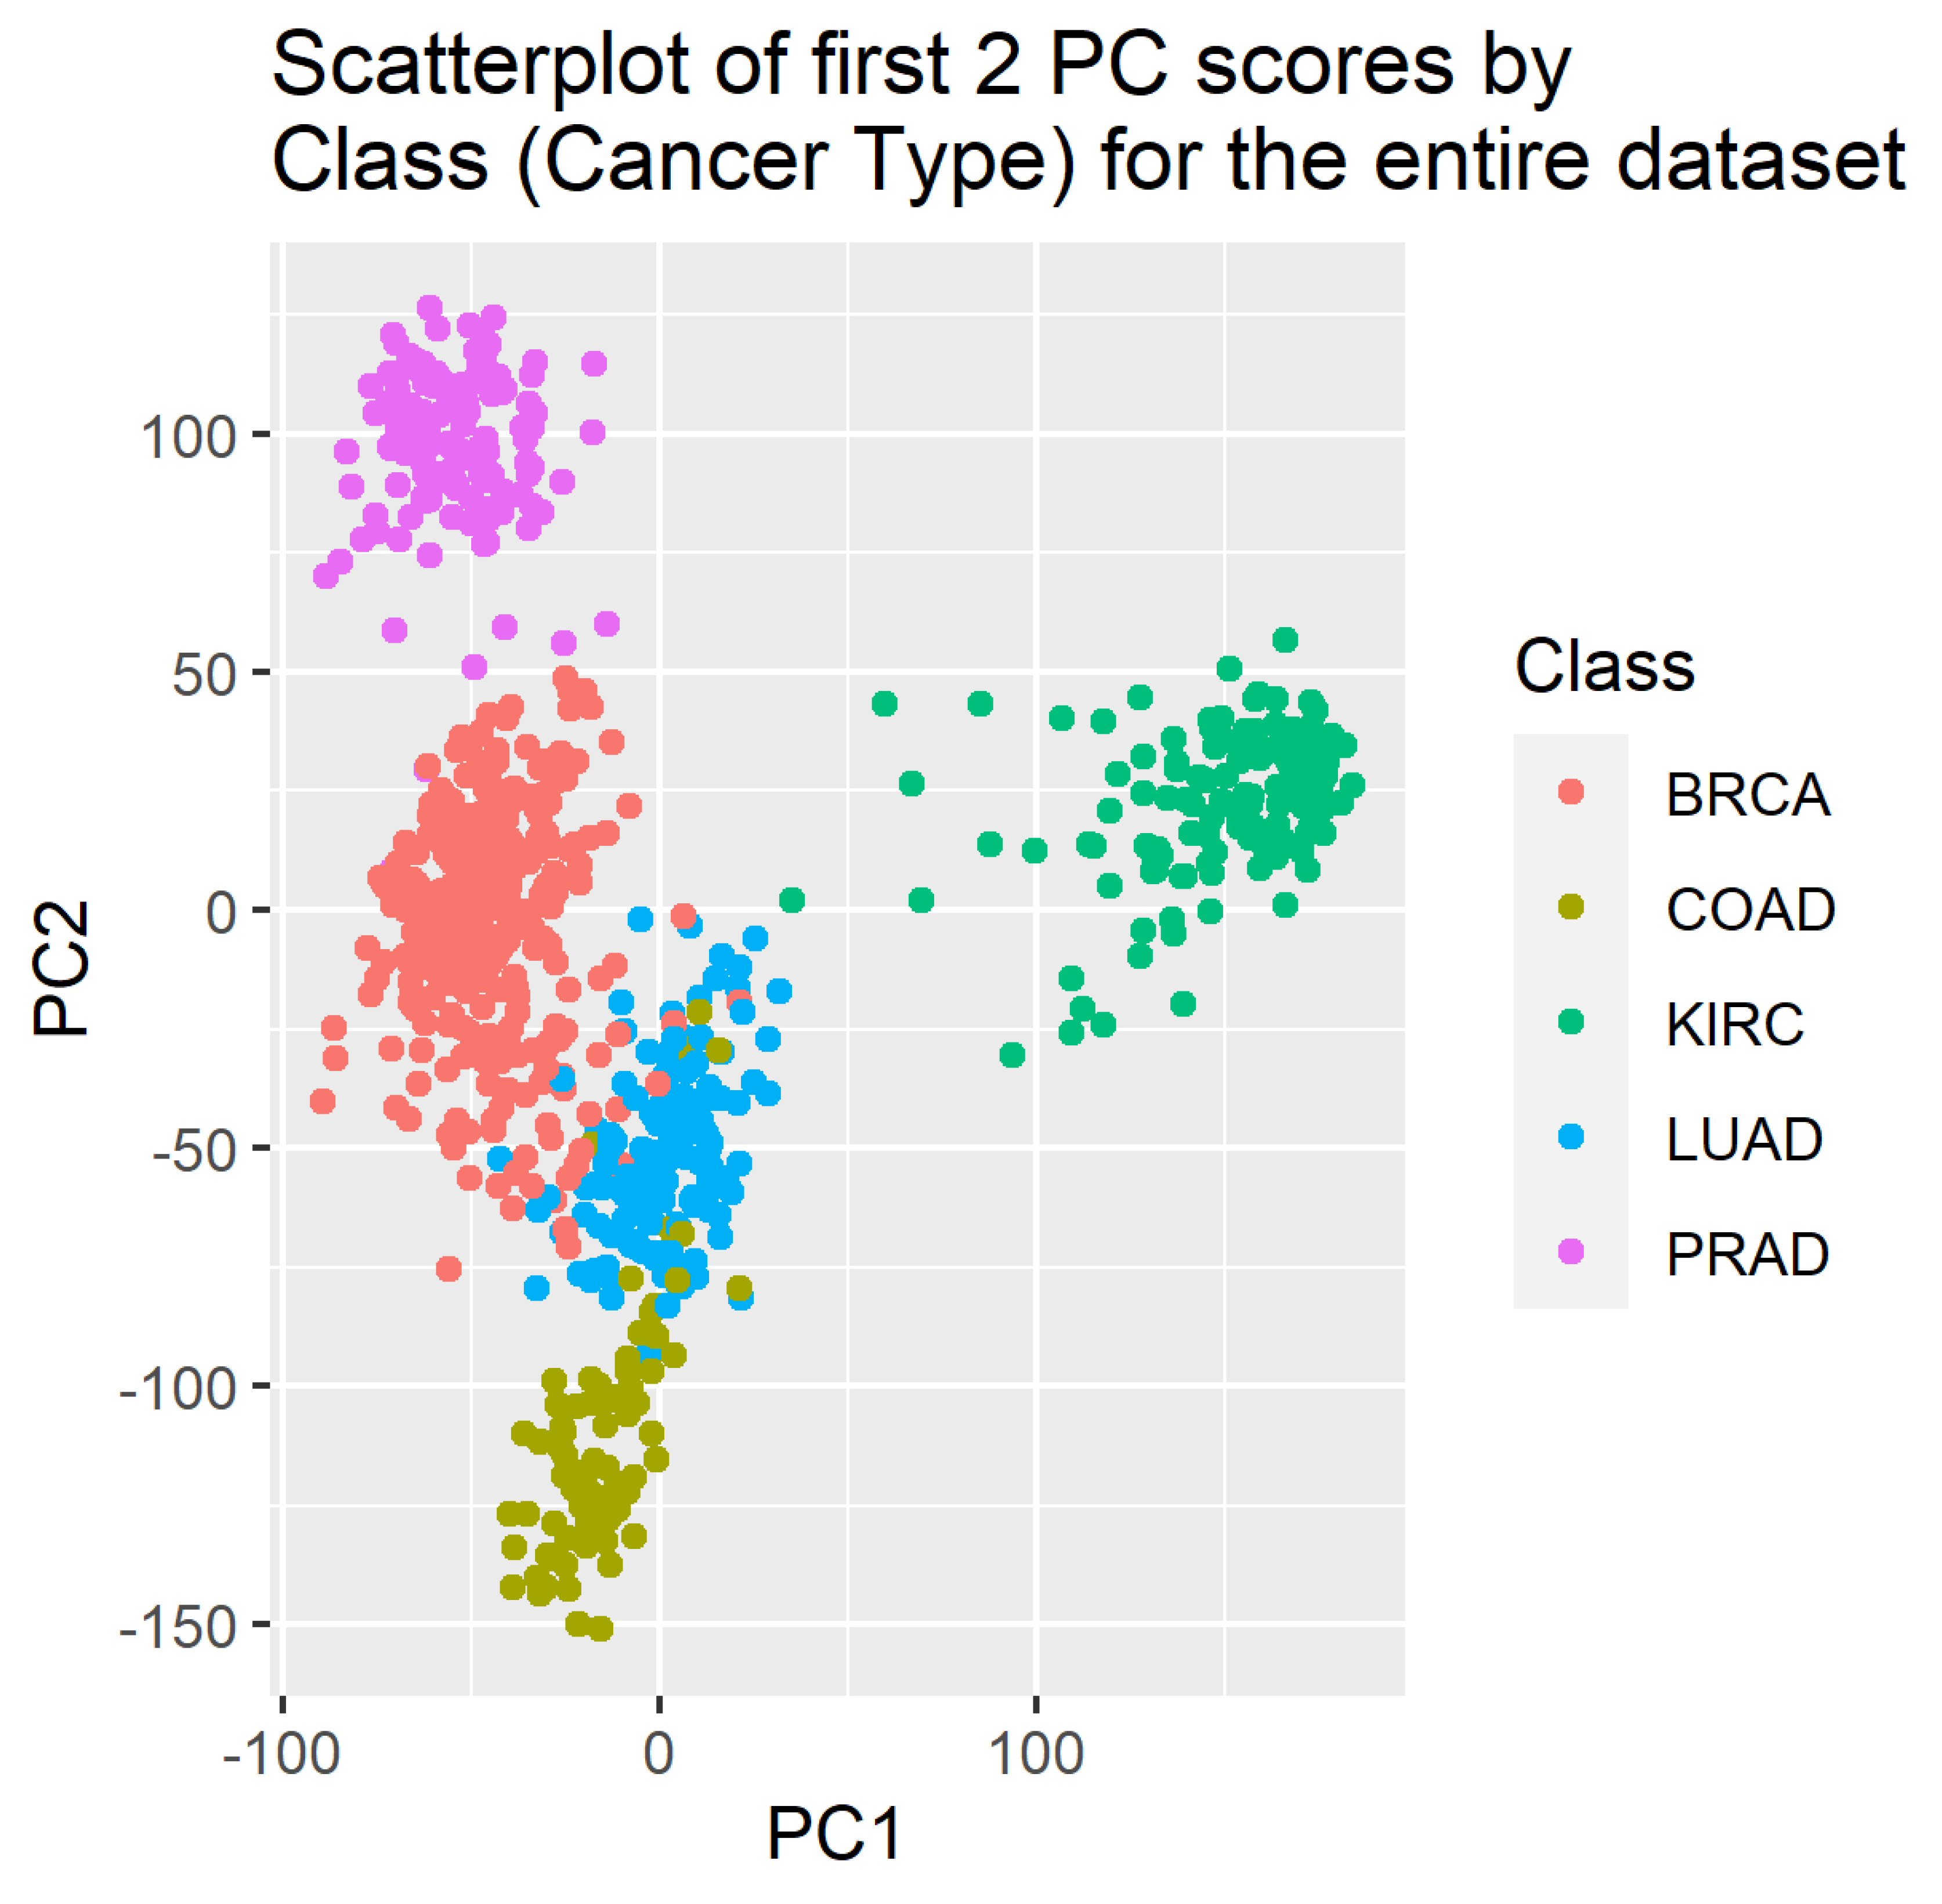
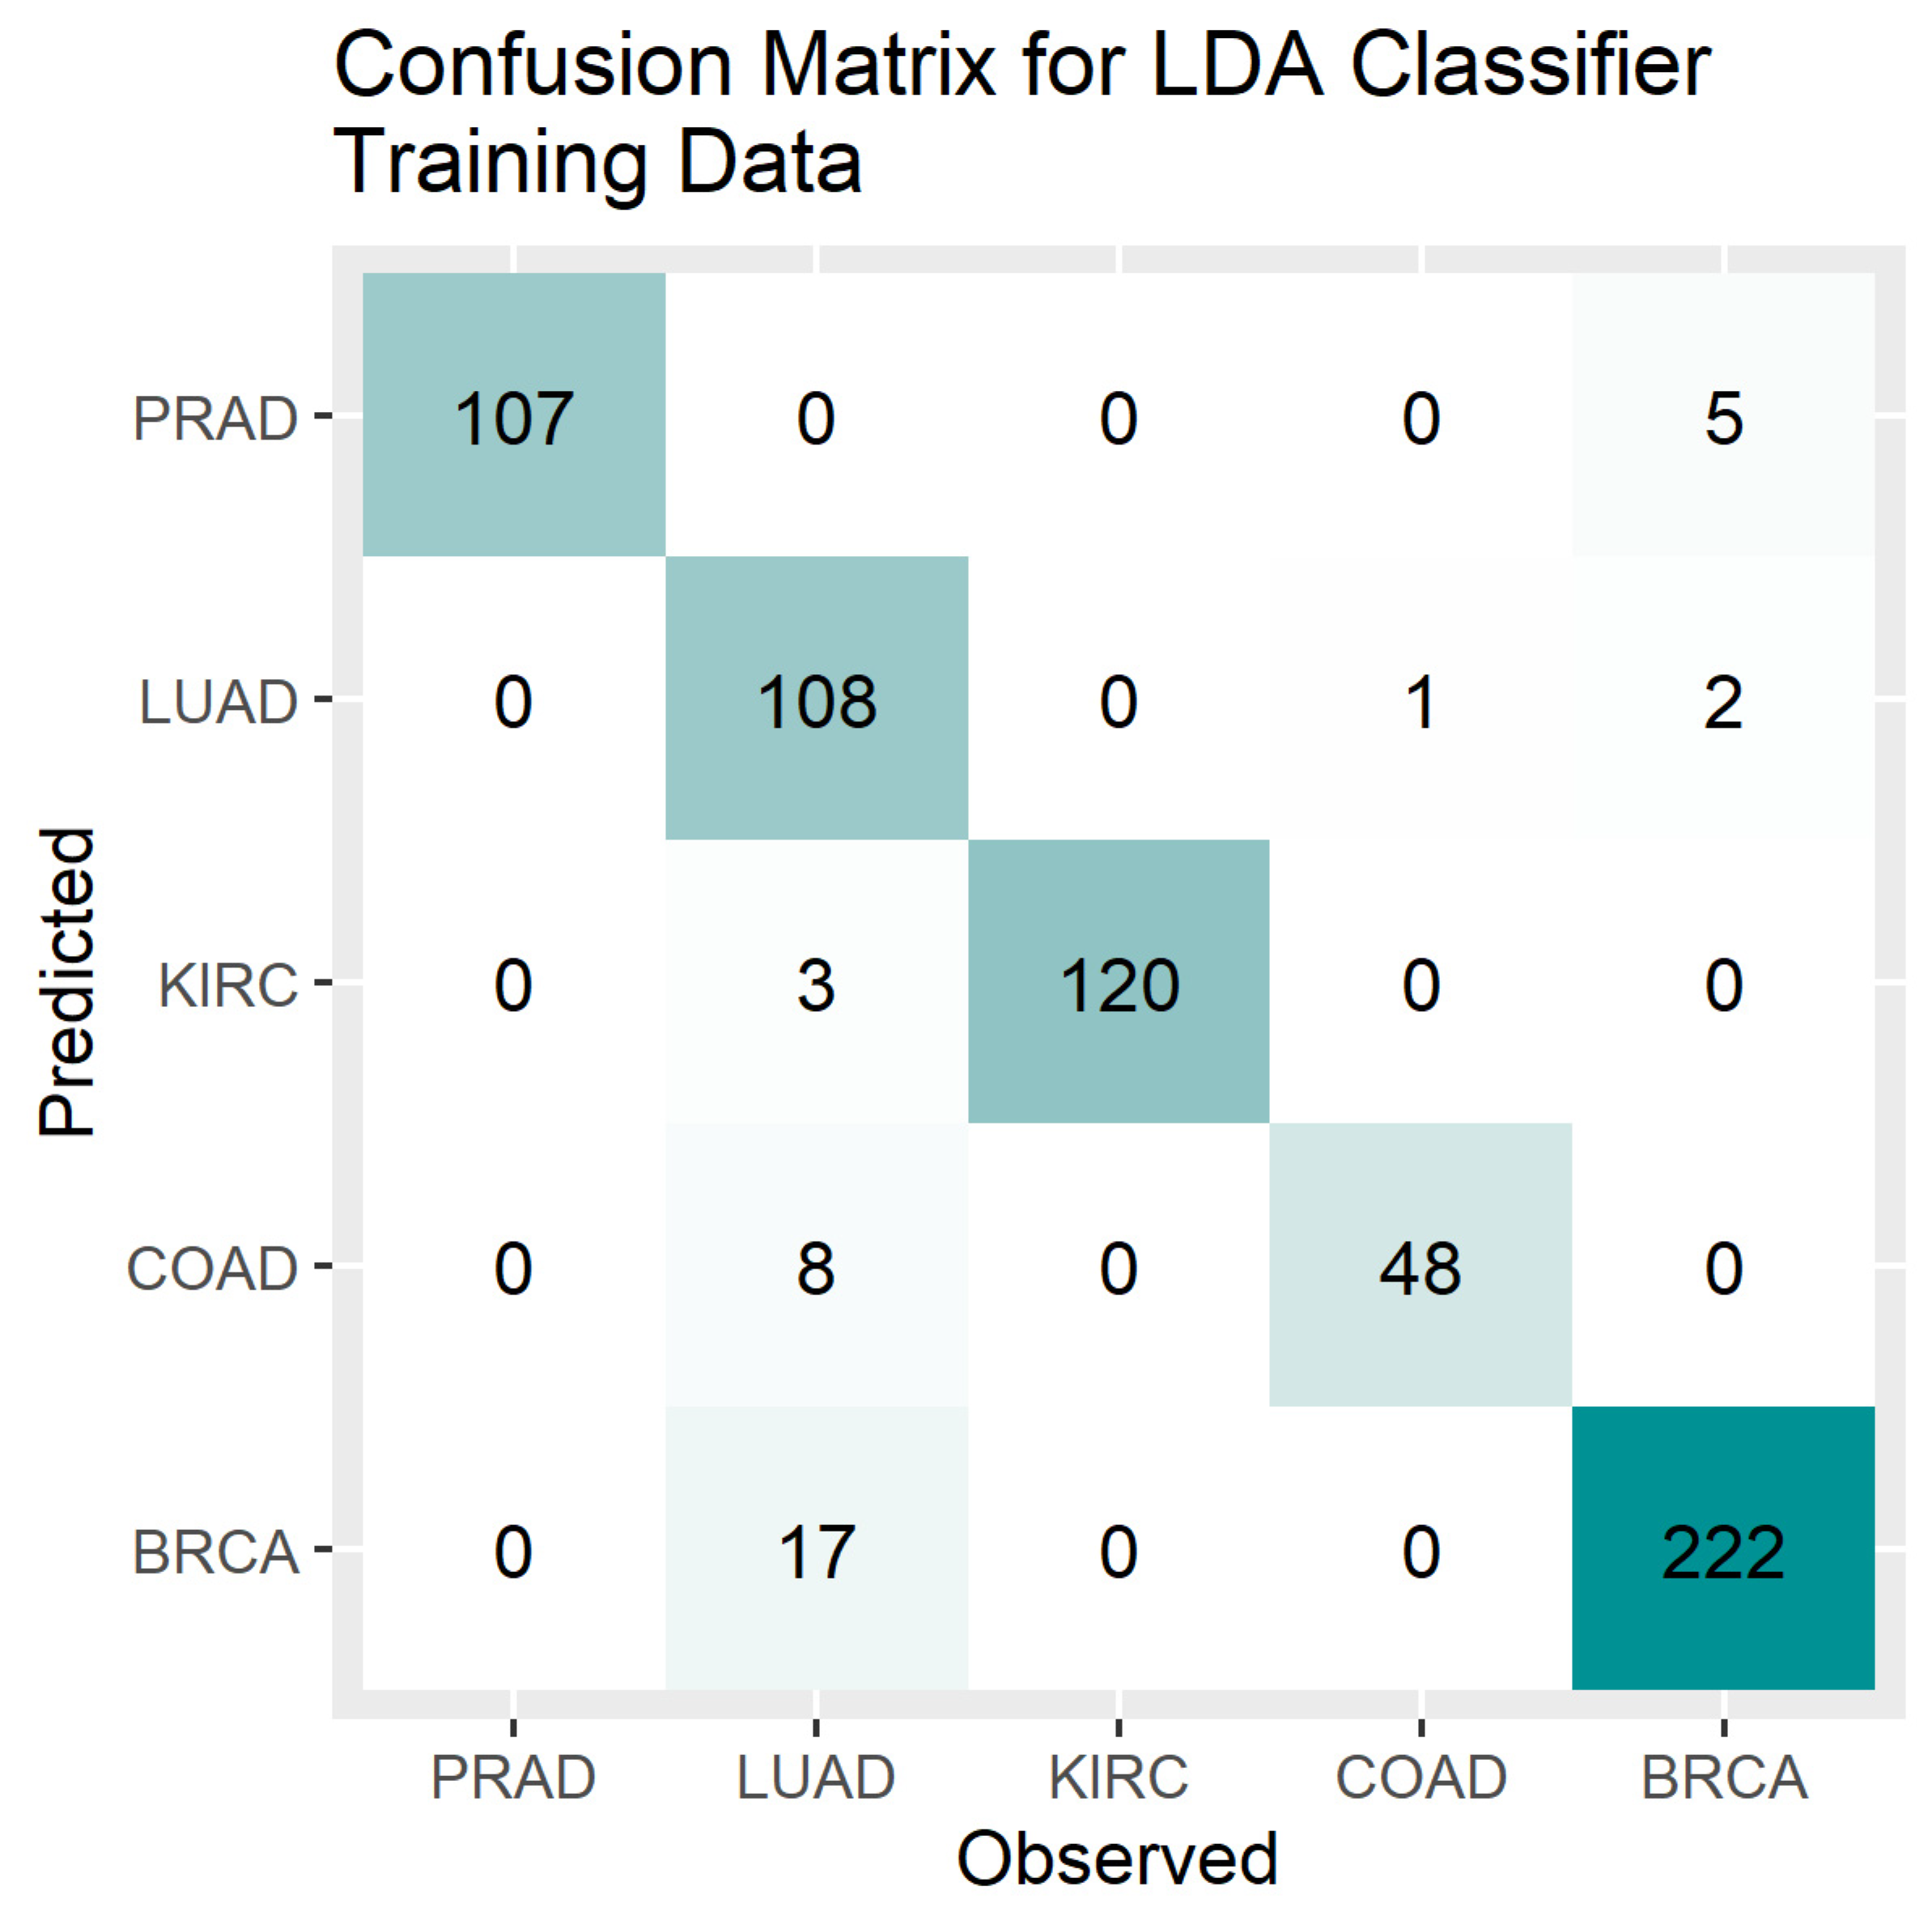
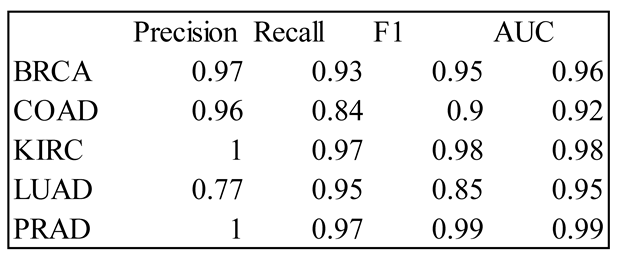

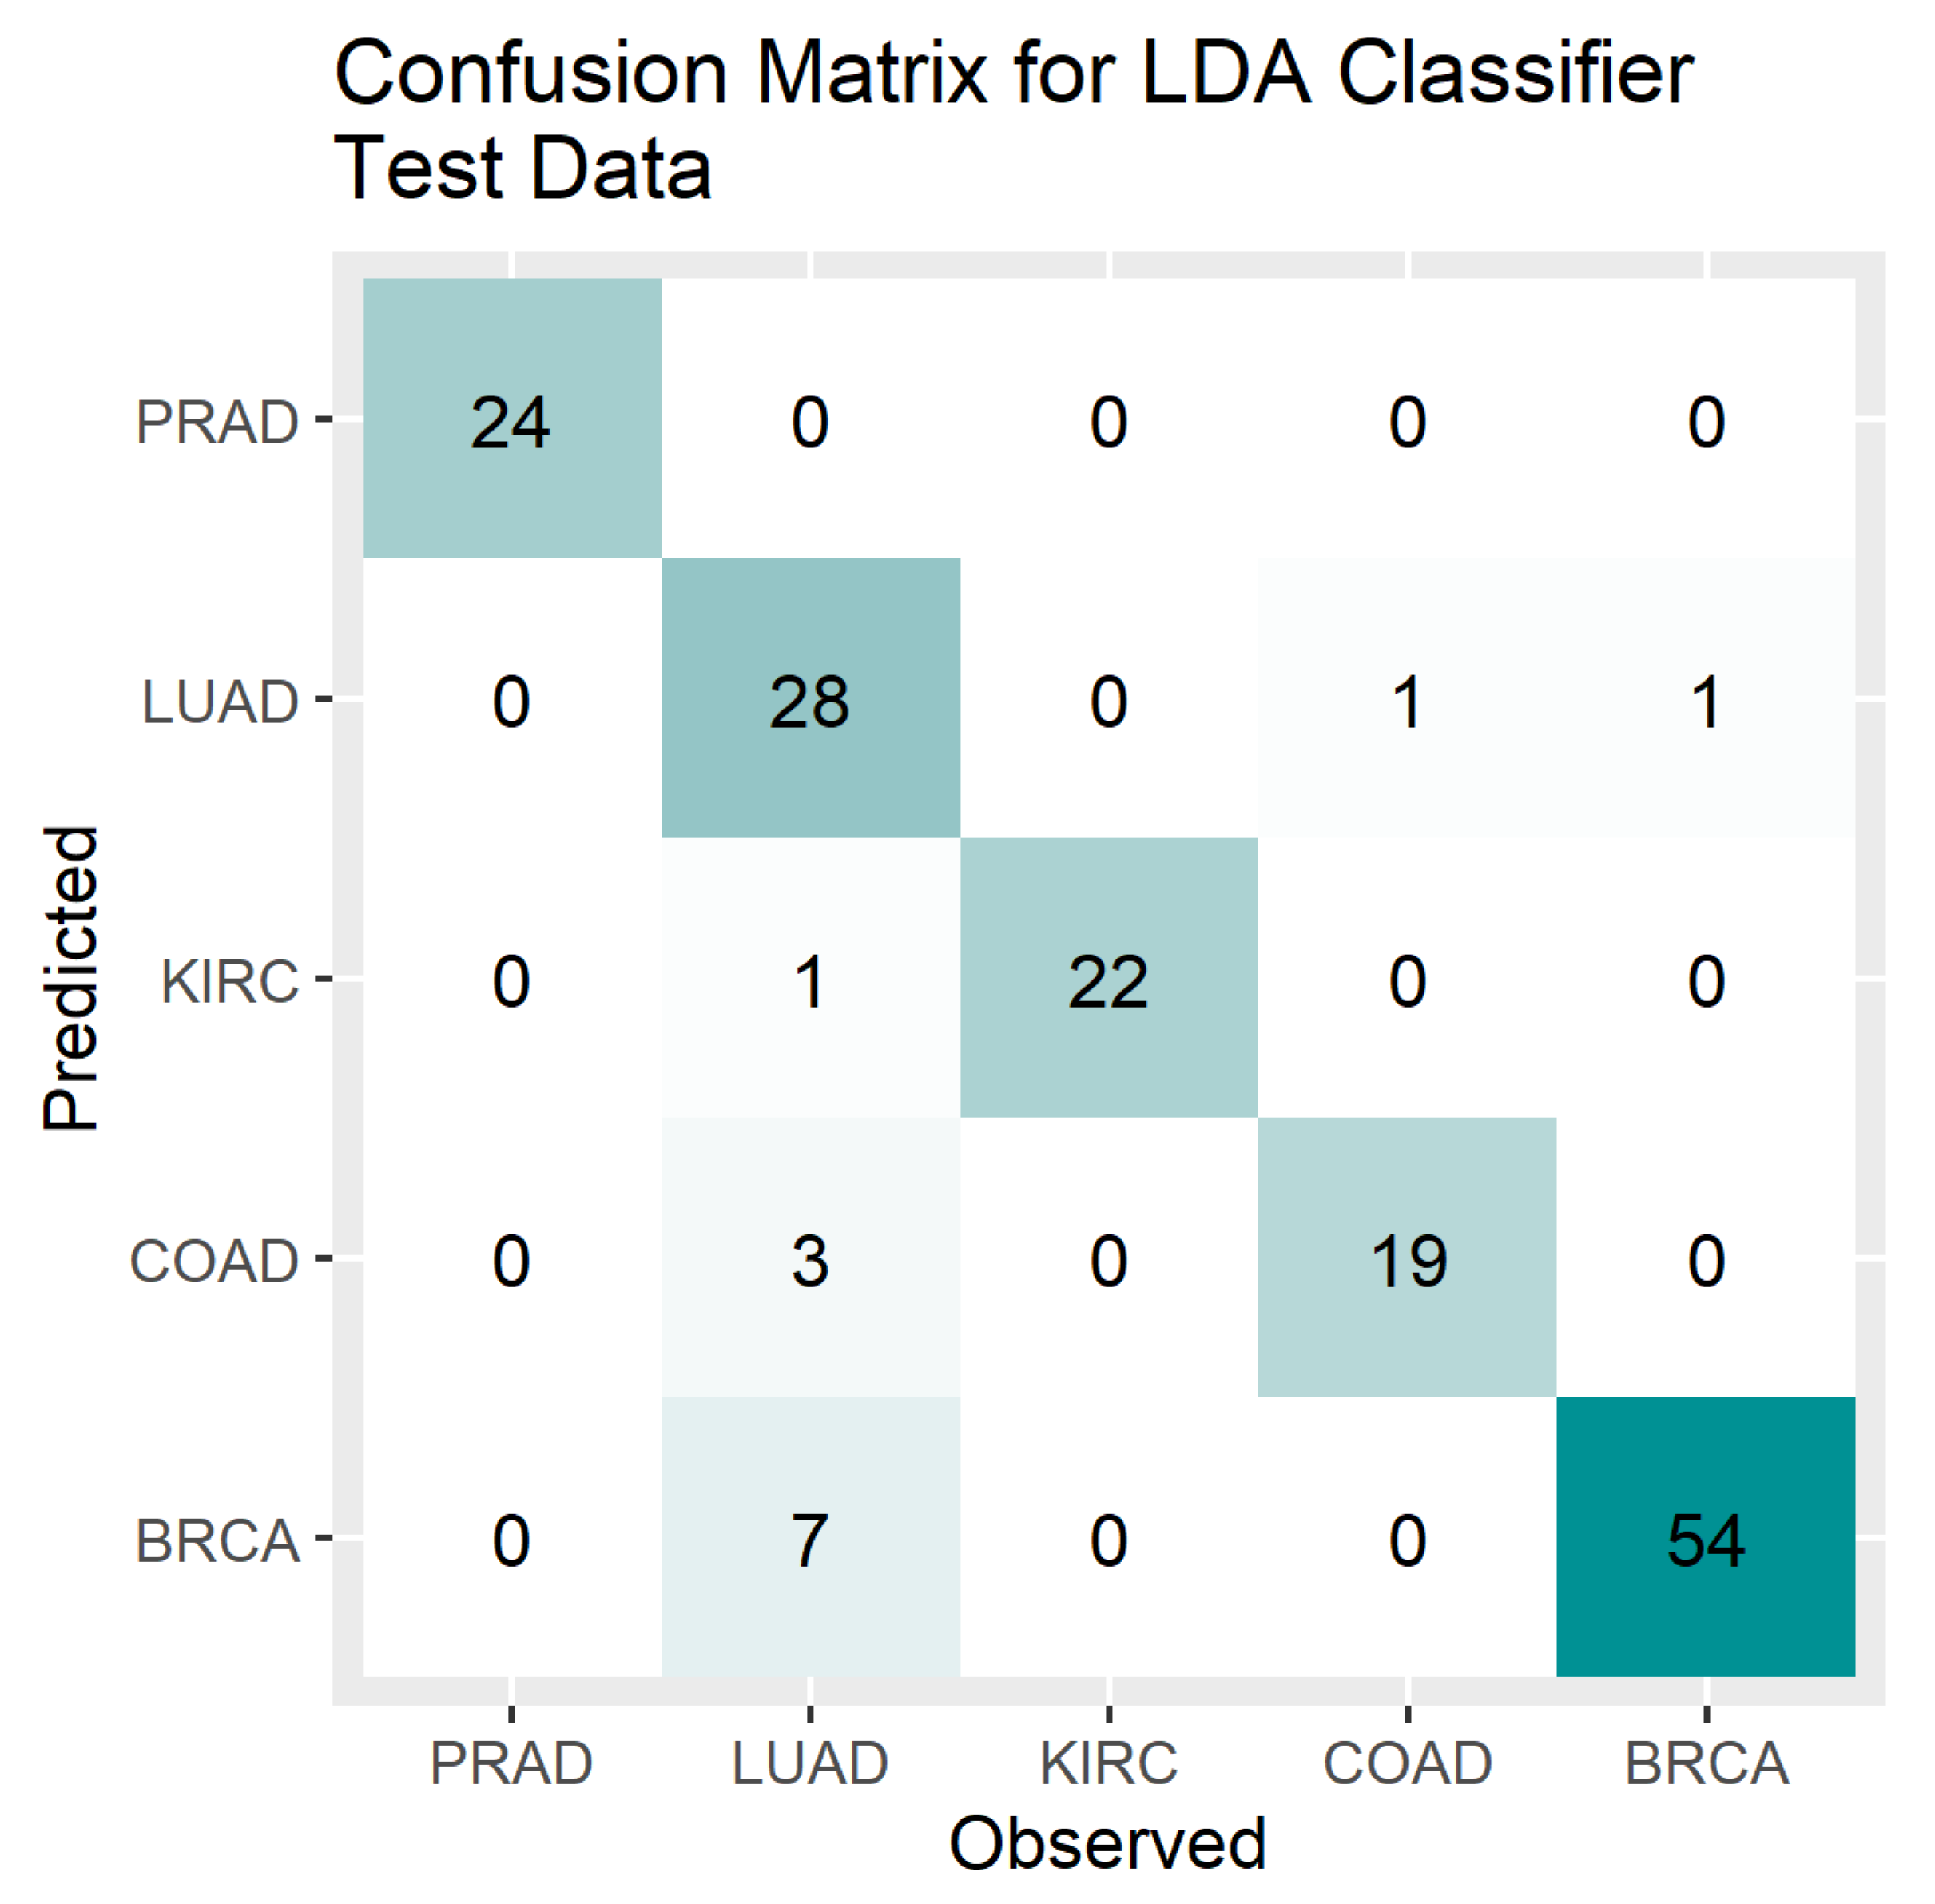



5. Discussion
Author Contributions
Funding
Institutional Review Board Statement
Informed Consent Statement
Data Availability Statement
Conflicts of Interest
References
- Alladi, Subha Mahadevi, Vadlamani Ravi, and Upadhyayula Suryanarayana Murthy. "Colon cancer prediction with genetic profiles using intelligent techniques." Bioinformation 3, no. 3 (2008): 130. [CrossRef]
- Alon, Uri, Naama Barkai, Daniel A. Notterman, Kurt Gish, Suzanne Ybarra, Daniel Mack, and Arnold J. Levine. "Broad patterns of gene expression revealed by clustering analysis of tumor and normal colon tissues probed by oligonucleotide arrays." Proceedings of the National Academy of Sciences 96, no. 12 (1999): 6745-6750. [CrossRef]
- Siegel, Rebecca L., Kimberly D. Miller, Nikita Sandeep Wagle, and Ahmedin Jemal. "Cancer statistics, 2023." Ca Cancer J Clin 73, no. 1 (2023): 17-48. [CrossRef]
- Slonim, Donna K. "From patterns to pathways: Gene expression data analysis comes of age." Nature genetics 32, no. 4 (2002): 502-508. [CrossRef]
- Harrington, Christina A., Carsten Rosenow, and Jacques Retief. "Monitoring gene expression using DNA microarrays." Current opinion in Microbiology 3, no. 3 (2000): 285-291. [CrossRef]
- Schena, Mark, Dari Shalon, Ronald W. Davis, and Patrick O. Brown. "Quantitative monitoring of gene expression patterns with a complementary DNA microarray." Science 270, no. 5235 (1995): 467-470. [CrossRef]
- Brewczyński, Adam, Beata Jabłońska, Agnieszka Maria Mazurek, Jolanta Mrochem-Kwarciak, Sławomir Mrowiec, Mirosław Śnietura, Marek Kentnowski, Zofia Kołosza, Krzysztof Składowski, and Tomasz Rutkowski. "Comparison of selected immune and hematological parameters and their impact on survival in patients with HPV-related and HPV-unrelated oropharyngeal Cancer." Cancers 13, no. 13 (2021): 3256. [CrossRef]
- Munkácsy, Gyöngyi, Libero Santarpia, and Balázs Győrffy. "Gene expression profiling in early breast cancer—Patient stratification based on molecular and tumor microenvironment features." Biomedicines 10, no. 2 (2022): 248. [CrossRef]
- Siang, Tan Ching, Ting Wai Soon, Shahreen Kasim, Mohd Saberi Mohamad, Chan Weng Howe, Safaai Deris, Zalmiyah Zakaria, Zuraini Ali Shah, and Zuwairie Ibrahim. "A review of cancer classification software for gene expression data." International Journal of Bio-Science and Bio-Technology 7, no. 4 (2015): 89-108. [CrossRef]
- Adiwijaya, Wisesty Untari, E. Lisnawati, Annisa Aditsania, and Dana Sulistiyo Kusumo. "Dimensionality reduction using principal component analysis for cancer detection based on microarray data classification." Journal of Computer Science 14, no. 11 (2018): 1521-1530. [CrossRef]
- Alpaydin, Ethem. Introduction to machine learning. MIT press, 2020. [CrossRef]
- Sidey-Gibbons, Jenni AM, and Chris J. Sidey-Gibbons. "Machine learning in medicine: A practical introduction." BMC medical research methodology 19 (2019): 1-18. [CrossRef]
- Erickson, Bradley J., Panagiotis Korfiatis, Zeynettin Akkus, and Timothy L. Kline. "Machine learning for medical imaging." radiographics 37, no. 2 (2017): 505-515. [CrossRef]
- Mahmood, Nasir, Saman Shahid, Taimur Bakhshi, Sehar Riaz, Hafiz Ghufran, and Muhammad Yaqoob. "Identification of significant risks in pediatric acute lymphoblastic leukemia (ALL) through machine learning (ML) approach." Medical & Biological Engineering & Computing 58 (2020): 2631-2640. [CrossRef]
- Kononenko, Igor. "Machine learning for medical diagnosis: History, state of the art and perspective." Artificial Intelligence in medicine 23, no. 1 (2001): 89-109. [CrossRef]
- Golub, Todd R., Donna K. Slonim, Pablo Tamayo, Christine Huard, Michelle Gaasenbeek, Jill P. Mesirov, Hilary Coller et al. "Molecular classification of cancer: Class discovery and class prediction by gene expression monitoring." science 286, no. 5439 (1999): 531-537. [CrossRef]
- Kourou, Konstantina, Themis P. Exarchos, Konstantinos P. Exarchos, Michalis V. Karamouzis, and Dimitrios I. Fotiadis. "Machine learning applications in cancer prognosis and prediction." Computational and structural biotechnology journal 13 (2015): 8-17. [CrossRef]
- Wang, Xujing, Martin J. Hessner, Yan Wu, Nirupma Pati, and Soumitra Ghosh. "Quantitative quality control in microarray experiments and the application in data filtering, normalization and false positive rate prediction." Bioinformatics 19, no. 11 (2003): 1341-1347. [CrossRef]
- Mohamad, Mohd Saberi, Sigeru Omatu, Michifumi Yoshioka, and Safaai Deris. "An approach using hybrid methods to select informative genes from microarray data for cancer classification." In 2008 Second Asia International Conference on Modelling & Simulation (AMS), pp. 603-608. IEEE, 2008. [CrossRef]
- Sung, Hyuna, Jacques Ferlay, Rebecca L. Siegel, Mathieu Laversanne, Isabelle Soerjomataram, Ahmedin Jemal, and Freddie Bray. "Global cancer statistics 2020: GLOBOCAN estimates of incidence and mortality worldwide for 36 cancers in 185 countries." CA: A cancer journal for clinicians 71, no. 3 (2021): 209-249. [CrossRef]
- Reid, Alison, Nick de Klerk, and Arthur W. Musk. "Does exposure to asbestos cause ovarian cancer? A systematic literature review and meta-analysis." Cancer epidemiology, biomarkers & prevention 20, no. 7 (2011): 1287-1295. [CrossRef]
- Ünver, Halil Murat, and Enes Ayan. "Skin lesion segmentation in dermoscopic images with combination of YOLO and grabcut algorithm." Diagnostics 9, no. 3 (2019): 72. [CrossRef]
- Maniruzzaman, Md, Md Jahanur Rahman, Benojir Ahammed, Md Menhazul Abedin, Harman S. Suri, Mainak Biswas, Ayman El-Baz, Petros Bangeas, Georgios Tsoulfas, and Jasjit S. Suri. "Statistical characterization and classification of colon microarray gene expression data using multiple machine learning paradigms." Computer methods and programs in biomedicine 176 (2019): 173-193. [CrossRef]
- Kalina, Jan. "Classification methods for high-dimensional genetic data." Biocybernetics and Biomedical Engineering 34, no. 1 (2014): 10-18. [CrossRef]
- Lee, Jae Won, Jung Bok Lee, Mira Park, and Seuck Heun Song. "An extensive comparison of recent classification tools applied to microarray data." Computational Statistics & Data Analysis 48, no. 4 (2005): 869-885. [CrossRef]
- Yeung, Ka Yee, Roger E. Bumgarner, and Adrian E. Raftery. "Bayesian model averaging: Development of an improved multi-class, gene selection and classification tool for microarray data." Bioinformatics 21, no. 10 (2005): 2394-2402. [CrossRef]
- Jirapech-Umpai, Thanyaluk, and Stuart Aitken. "Feature selection and classification for microarray data analysis: Evolutionary methods for identifying predictive genes." BMC bioinformatics 6 (2005): 1-11. [CrossRef]
- Hua, Jianping, Zixiang Xiong, James Lowey, Edward Suh, and Edward R. Dougherty. "Optimal number of features as a function of sample size for various classification rules." Bioinformatics 21, no. 8 (2005): 1509-1515. [CrossRef]
- Li, Yi, Colin Campbell, and Michael Tipping. "Bayesian automatic relevance determination algorithms for classifying gene expression data." Bioinformatics 18, no. 10 (2002): 1332-1339. [CrossRef]
- Díaz-Uriarte, Ramón. "Supervised methods with genomic data: A review and cautionary view." Data analysis and visualization in genomics and proteomics (2005): 193-214. [CrossRef]
- Piao, Yongjun, Minghao Piao, Kiejung Park, and Keun Ho Ryu. "An ensemble correlation-based gene selection algorithm for cancer classification with gene expression data." Bioinformatics 28, no. 24 (2012): 3306-3315. [CrossRef]
- Chen, Kun-Huang, Kung-Jeng Wang, Kung-Min Wang, and Melani-Adrian Angelia. "Applying particle swarm optimization-based decision tree classifier for cancer classification on gene expression data." Applied Soft Computing 24 (2014): 773-780. [CrossRef]
- Akay, Mehmet Fatih. "Support vector machines combined with feature selection for breast cancer diagnosis." Expert systems with applications 36, no. 2 (2009): 3240-3247. [CrossRef]
- Brahim-Belhouari, Sofiane, and Amine Bermak. "Gaussian process for nonstationary time series prediction." Computational Statistics & Data Analysis 47, no. 4 (2004): 705-712. [CrossRef]
- Bray, Freddie, Jacques Ferlay, Isabelle Soerjomataram, Rebecca L. Siegel, Lindsey A. Torre, and Ahmedin Jemal. "Global cancer statistics 2018: GLOBOCAN estimates of incidence and mortality worldwide for 36 cancers in 185 countries." CA: A cancer journal for clinicians 68, no. 6 (2018): 394-424. [CrossRef]
- Cai, Jie, Jiawei Luo, Shulin Wang, and Sheng Yang. "Feature selection in machine learning: A new perspective." Neurocomputing 300 (2018): 70-79. [CrossRef]
- Jain, Anil, and Douglas Zongker. "Feature selection: Evaluation, application, and small sample performance." IEEE transactions on pattern analysis and machine intelligence 19, no. 2 (1997): 153-158. [CrossRef]
- Wang, Yu, Igor V. Tetko, Mark A. Hall, Eibe Frank, Axel Facius, Klaus FX Mayer, and Hans W. Mewes. "Gene selection from microarray data for cancer classification—A machine learning approach." Computational biology and chemistry 29, no. 1 (2005): 37-46. [CrossRef]
- Liu, Kun-Hong, Muchenxuan Tong, Shu-Tong Xie, and Vincent To Yee Ng. "Genetic programming based ensemble system for microarray data classification." Computational and mathematical methods in medicine 2015 (2015). [CrossRef]
- Bhonde, Swati B., and Jayashree R. Prasad. "Performance analysis of dimensionality reduction techniques in cancer detection using microarray data." Asian Journal For Convergence In Technology (AJCT) ISSN-2350-1146 7, no. 1 (2021): 53-57. [CrossRef]
- Sun, Xiaoxiao, Yiwen Liu, and Lingling An. "Ensemble dimensionality reduction and feature gene extraction for single-cell RNA-seq data." Nature communications 11, no. 1 (2020): 5853. [CrossRef]
- Rowe, Raymond C., and Ronald J. Roberts. "Artificial intelligence in pharmaceutical product formulation: Knowledge-based and expert systems." Pharmaceutical Science & Technology Today 1, no. 4 (1998): 153-159. [CrossRef]
- Yu, Chaoran, and Ernest Johann Helwig. "The role of AI technology in prediction, diagnosis and treatment of colorectal cancer." Artificial Intelligence Review 55, no. 1 (2022): 323-343. [CrossRef]
- Kumar, Yogesh, Surbhi Gupta, Ruchi Singla, and Yu-Chen Hu. "A systematic review of artificial intelligence techniques in cancer prediction and diagnosis." Archives of Computational Methods in Engineering 29, no. 4 (2022): 2043-2070. [CrossRef]
- McKinney, Scott Mayer, Marcin Sieniek, Varun Godbole, Jonathan Godwin, Natasha Antropova, Hutan Ashrafian, Trevor Back et al. "International evaluation of an AI system for breast cancer screening." Nature 577, no. 7788 (2020): 89-94. [CrossRef]
- Mersch, Jacqueline, Michelle A. Jackson, Minjeong Park, Denise Nebgen, Susan K. Peterson, Claire Singletary, Banu K. Arun, and Jennifer K. Litton. "Cancers associated with BRCA 1 and BRCA 2 mutations other than breast and ovarian." Cancer 121, no. 2 (2015): 269-275. [CrossRef]
- Chang, Michael, Rohan J. Dalpatadu, Dieudonne Phanord, and Ashok K. Singh. "Breast cancer prediction using bayesian logistic regression." Biostatistics and Bioinformatics 2, no. 3 (2018): 1-5. [CrossRef]
- Wolberg, William, W. Street, and Olvi Mangasarian. "Breast cancer wisconsin (diagnostic)." UCI Machine Learning Repository 414 (1995): 415. [CrossRef]
- Cordova, Claudio, Roberto Muñoz, Rodrigo Olivares, Jean-Gabriel Minonzio, Carlo Lozano, Paulina Gonzalez, Ivanny Marchant, Wilfredo González-Arriagada, and Pablo Olivero. "HER2 classification in breast cancer cells: A new explainable machine learning application for immunohistochemistry." Oncology Letters 25, no. 2 (2023): 1-9. [CrossRef]
- Hu, Fuyan, Wenying Zeng, and Xiaoping Liu. "A gene signature of survival prediction for kidney renal cell carcinoma by multi-omic data analysis." International journal of molecular sciences 20, no. 22 (2019): 5720. [CrossRef]
- Wang, Licheng, Yaru Zhu, Zhen Ren, Wenhuizi Sun, Zhijing Wang, Tong Zi, Haopeng Li et al. "An immunogenic cell death-related classification predicts prognosis and response to immunotherapy in kidney renal clear cell carcinoma." Frontiers in Oncology 13 (2023): 1147805. [CrossRef]
- Yue, Fu-Ren, Zhi-Bin Wei, Rui-Zhen Yan, Qiu-Hong Guo, Bing Liu, Jing-Hui Zhang, and Zheng Li. "SMYD3 promotes colon adenocarcinoma (COAD) progression by mediating cell proliferation and apoptosis." Experimental and Therapeutic Medicine 20, no. 5 (2020): 1-1. [CrossRef]
- Li, Yuanyuan, Kai Kang, Juno M. Krahn, Nicole Croutwater, Kevin Lee, David M. Umbach, and Leping Li. "A comprehensive genomic pan-cancer classification using The Cancer Genome Atlas gene expression data." BMC genomics 18 (2017): 1-13. [CrossRef]
- Liu, Yangyang, Lu Liang, Liang Ji, Fuquan Zhang, Donglai Chen, Shanzhou Duan, Hao Shen, Yao Liang, and Yongbing Chen. "Potentiated lung adenocarcinoma (LUAD) cell growth, migration and invasion by lncRNA DARS-AS1 via miR-188-5p/KLF12 axis." Aging (Albany NY) 13, no. 19 (2021): 23376. [CrossRef]
- Yang, Jian, Zhike Chen, Zetian Gong, Qifan Li, Hao Ding, Yuan Cui, Lijuan Tang et al. "Immune landscape and classification in lung adenocarcinoma based on a novel cell cycle checkpoints related signature for predicting prognosis and therapeutic response." Frontiers in Genetics 13 (2022): 908104. [CrossRef]
- Liu, Qian, Jiali Lei, Xiaobo Zhang, and Xiaosheng Wang. "Classification of lung adenocarcinoma based on stemness scores in bulk and single cell transcriptomes." Computational and Structural Biotechnology Journal 20 (2022): 1691-1701. [CrossRef]
- Zhao, Xin, Daixing Hu, Jia Li, Guozhi Zhao, Wei Tang, and Honglin Cheng. "Database mining of genes of prognostic value for the prostate adenocarcinoma microenvironment using the cancer gene atlas." BioMed research international 2020 (2020). [CrossRef]
- Khosravi, Pegah, Maria Lysandrou, Mahmoud Eljalby, Qianzi Li, Ehsan Kazemi, Pantelis Zisimopoulos, Alexandros Sigaras et al. "A deep learning approach to diagnostic classification of prostate cancer using pathology–radiology fusion." Journal of Magnetic Resonance Imaging 54, no. 2 (2021): 462-471. [CrossRef]
- Basilevsky, Alexander T. Statistical factor analysis and related methods: Theory and applications. John Wiley & Sons, 2009. [CrossRef]
- Everitt, Brian, and Graham Dunn. Applied multivariate data analysis. Vol. 2. London: Arnold, 2001. [CrossRef]
- Pearson, Karl. "LIII. On lines and planes of closest fit to systems of points in space." The London, Edinburgh, and Dublin philosophical magazine and journal of science 2, no. 11 (1901): 559-572. [CrossRef]
- Hilsenbeck, Susan G., William E. Friedrichs, Rachel Schiff, Peter O'Connell, Rhonda K. Hansen, C. Kent Osborne, and Suzanne AW Fuqua. "Statistical analysis of array expression data as applied to the problem of tamoxifen resistance." Journal of the National Cancer Institute 91, no. 5 (1999): 453-459. [CrossRef]
- Vohradsky, Jiří, Xin-Ming Li, and Charles J. Thompson. "Identification of procaryotic developmental stages by statistical analyses of two-dimensional gel patterns." Electrophoresis 18, no. 8 (1997): 1418-1428. [CrossRef]
- Craig, J. C., J. H. Eberwine, J. A. Calvin, B. Wlodarczyk, G. D. Bennett, and R. H. Finnell. "Developmental expression of morphoregulatory genes in the mouse embryo: An analytical approach using a novel technology." Biochemical and molecular medicine 60, no. 2 (1997): 81-91. [CrossRef]
- Liu, JingJing, WenSheng Cai, and XueGuang Shao. "Cancer classification based on microarray gene expression data using a principal component accumulation method." Science China Chemistry 54 (2011): 802-811. [CrossRef]
- Oladejo, Ayomikun Kubrat, Tinuke Omolewa Oladele, and Yakub Kayode Saheed. "Comparative evaluation of linear support vector machine and K-nearest neighbour algorithm using microarray data on leukemia cancer dataset." Afr. J. Comput. ICT 11, no. 2 (2018): 1-10. https://afrjcict.net/2017/08/29/african-journal-of-computing-ict/.
- Adebiyi, Marion Olubunmi, Micheal Olaolu Arowolo, Moses Damilola Mshelia, and Oludayo O. Olugbara. "A linear discriminant analysis and classification model for breast cancer diagnosis." Applied Sciences 12, no. 22 (2022): 11455. [CrossRef]
- Ak, Muhammet Fatih. "A comparative analysis of breast cancer detection and diagnosis using data visualization and machine learning applications." In Healthcare, vol. 8, no. 2, p. 111. MDPI, 2020. [CrossRef]
- Díaz-Uriarte, Ramón, and Sara Alvarez de Andrés. "Gene selection and classification of microarray data using random forest." BMC bioinformatics 7 (2006): 1-13. [CrossRef]
- Tan, Aik Choon, and David Gilbert. "Ensemble machine learning on gene expression data for cancer classification." (2003). URL: http://bura.brunel.ac.uk/handle/2438/3013.
- Sharma, Alok, Seiya Imoto, Satoru Miyano, and Vandana Sharma. "Null space based feature selection method for gene expression data." International Journal of Machine Learning and Cybernetics 3 (2012): 269-276. [CrossRef]
- Degroeve, Sven, Bernard De Baets, Yves Van de Peer, and Pierre Rouzé. "Feature subset selection for splice site prediction." Bioinformatics 18, no. suppl_2 (2002): S75-S83.7. [CrossRef]
- Peng, Yanxiong, Wenyuan Li, and Ying Liu. "A hybrid approach for biomarker discovery from microarray gene expression data for cancer classification." Cancer informatics 2 (2006): 117693510600200024. [CrossRef]
- Sharma, Alok, and Kuldip K. Paliwal. "Cancer classification by gradient LDA technique using microarray gene expression data." Data & Knowledge Engineering 66, no. 2 (2008): 338-347. [CrossRef]
- Bar-Joseph, Ziv, Anthony Gitter, and Itamar Simon. "Studying and modelling dynamic biological processes using time-series gene expression data." Nature Reviews Genetics 13, no. 8 (2012): 552-564. [CrossRef]
- Cho, Ji-Hoon, Dongkwon Lee, Jin Hyun Park, and In-Beum Lee. "Gene selection and classification from microarray data using kernel machine." FEBS letters 571, no. 1-3 (2004): 93-98. [CrossRef]
- Huang, Desheng, Yu Quan, Miao He, and Baosen Zhou. "Comparison of linear discriminant analysis methods for the classification of cancer based on gene expression data." Journal of experimental & clinical cancer research 28 (2009): 1-8. [CrossRef]
- Dwivedi, Ashok Kumar. "Artificial neural network model for effective cancer classification using microarray gene expression data." Neural Computing and Applications 29 (2018): 1545-1554. [CrossRef]
- Sun, Yingshuai, Sitao Zhu, Kailong Ma, Weiqing Liu, Yao Yue, Gang Hu, Huifang Lu, and Wenbin Chen. "Identification of 12 cancer types through genome deep learning." Scientific reports 9, no. 1 (2019): 17256. [CrossRef]
- Alhenawi, Esra'A., Rizik Al-Sayyed, Amjad Hudaib, and Seyedali Mirjalili. "Feature selection methods on gene expression microarray data for cancer classification: A systematic review." Computers in Biology and Medicine 140 (2022): 105051. [CrossRef]
- Khatun, R., Akter, M., Islam, M.M., Uddin, M.A., Talukder, M.A., Kamruzzaman, J., Azad, A.K.M., Paul, B.K., Almoyad, M.A.A., Aryal, S. and Moni, M.A., 2023. Cancer classification utilizing voting classifier with ensemble feature selection method and transcriptomic data. Genes, 14(9), p.1802. [CrossRef]
- Osama, Sarah, Hassan Shaban, and Abdelmgeid A. Ali. "Gene reduction and machine learning algorithms for cancer classification based on microarray gene expression data: A comprehensive review." Expert Systems with Applications 213 (2023): 118946. [CrossRef]
- Kabir, Md Faisal, Tianjie Chen, and Simone A. Ludwig. "A performance analysis of dimensionality reduction algorithms in machine learning models for cancer prediction." Healthcare Analytics 3 (2023): 100125. [CrossRef]
- Kharya, S., D. Dubey, and S. Soni. "Predictive machine learning techniques for breast cancer detection." International journal of computer science and information Technologies 4, no. 6 (2013): 1023-8.
- Rana, Mandeep, Pooja Chandorkar, Alishiba Dsouza, and Nikahat Kazi. "Breast cancer diagnosis and recurrence prediction using machine learning techniques." International journal of research in Engineering and Technology 4, no. 4 (2015): 372-376. [CrossRef]
- Johnson, Richard Arnold, and Dean W. Wichern. "Applied multivariate statistical analysis." (2002). https://books.google.com/books?id=gFWcQgAACAAJ.
- Genuer, Robin, Jean-Michel Poggi, Robin Genuer, and Jean-Michel Poggi. Random forests. Springer International Publishing, 2020. [CrossRef]
- Frank, Andrew. "UCI machine learning repository." http://archive. ics. uci. edu/ml (2010). [CrossRef]
- Team, R. Core. "R: A language and environment for statistical computing. R Foundation for Statistical Computing." (No Title) (2013). https://www.R-project.org/.
- Jolliffe, Ian T., and Jorge Cadima. "Principal component analysis: A review and recent developments." Philosophical transactions of the royal society A: Mathematical, Physical and Engineering Sciences 374, no. 2065 (2016): 20150202. [CrossRef]
- Hastie, Trevor, Robert Tibshirani, Jerome H. Friedman, and Jerome H. Friedman. The elements of statistical learning: Data mining, inference, and prediction. Vol. 2. New York: Springer, 2009. [CrossRef]
- Molin, Nicole L., Clifford Molin, Rohan J. Dalpatadu, and Ashok K. Singh. "Prediction of obstructive sleep apnea using Fast Fourier Transform of overnight breath recordings." Machine Learning with Applications 4 (2021): 100022. [CrossRef]
Disclaimer/Publisher’s Note: The statements, opinions and data contained in all publications are solely those of the individual author(s) and contributor(s) and not of MDPI and/or the editor(s). MDPI and/or the editor(s) disclaim responsibility for any injury to people or property resulting from any ideas, methods, instructions or products referred to in the content. |
© 2024 by the authors. Licensee MDPI, Basel, Switzerland. This article is an open access article distributed under the terms and conditions of the Creative Commons Attribution (CC BY) license (http://creativecommons.org/licenses/by/4.0/).


