1. Introduction
Emerging technologies like Augmented Reality (AR) and various positioning-based applications are driving the need for indoor positioning technology. Positioning systems with the ability to provide precise accuracy in indoor settings are essential for various applications, including but not limited to mall navigation, pathfinding in large hospitals or airports, automatic guidance for unmanned cleaning and maintenance vehicles, surveillance systems, and more [
1,
2,
3,
4,
5]. Trilateration, a well-established technique, is commonly employed in accurate positioning systems for indoor use. This method relies on three (or more) range measurements between emitters placed at reference locations and a sensor to determine their distances and spatial positions with a high degree of accuracy at a relatively low cost. Ultrasonic wave-based systems have proven effective in providing accurate positioning [
6,
7,
8,
9].
The widely used ranging technique involves estimating the Time of Arrival (TOA) of a suitable ultrasonic signal. Typically, TOA is determined by identifying a specific feature in the received signal or the post-processed signal that is easily recognizable upon arrival. In certain situations, the determination of the time of arrival (TOA) often relies on pinpointing the maximum peak within the envelope of an ultrasonic pulse. However, despite the apparent simplicity of this method, it remains susceptible to disruptions caused by acoustic interference, leading to errors on the scale of wavelengths (centimeters), even with a high Signal-to-Noise Ratio (SNR) [
9,
10,
11,
12,
13].
Methods employing cross-correlation, on the other hand, provide a markedly precise estimation of TOA and generally demonstrate robust resistance to acoustical disturbances [
12,
13,
14,
15]. Digital cross-correlation techniques proficiently sample and transform the received acoustical signal into the array C = S ★ T. In this context, S denotes the numerical array of received signal samples, T represents the digital reference signal stored in the sensor processor memory as a numerical array of samples, and ★ serves as the cross-correlation operator. The optimum alignment of S and T in time is discerned through the peak of the cross-correlation. The displacement between signals, or lag τ, corresponding to the cross-correlation peak (i.e., τ
MAX), is directly proportional to the TOA [
16,
17].
The precision in measuring distance, within the current spatial sampling framework—defined as the distance traversed by ultrasound during the time sample interval—can be markedly reduced compared to the ultrasonic wavelength. This enhanced accuracy is achieved by determining the TOA through the identification of the cross-correlation peak.
In practical systems, a range resolution can be achieved up to approximately one-tenth of the wavelength used. For instance, in [
14], an experimental range resolution of ±1.2 mm was attained using a 15 – 40 kHz chirp, with a wavelength range of 22.86 – 8.57 mm. This was realized considering a sampling frequency of 1 MHz, resulting in a space sampling of 0.34 mm, and utilizing a sound speed of 343 m/s. In cases where the signal and noise are uncorrelated, the process of cross-correlation significantly enhances the Signal-to-Noise Ratio (SNR), commonly referred to as process gain.
Extensive research has been conducted in the past on the acoustic field produced by acoustic transducers, considering impulsive or continuous sinusoidal wave signals and varying the shape and aperture of the transducer. The exploration of closed-form solutions for the generated acoustic field has facilitated the derivation of simple approximate formulas for calculating the emission angle. These formulas depend on factors such as wavelength, aperture, and distance from the emitter, with the most recognized ones being applicable to circular apertures. In the far field, the semi-angle ϑ of the emission cone is approximately characterized by the well-established relationship [
18]:
where D is the diameter or aperture of the transducer and λ is the emitted wavelength.
Furthermore, it is well-established that achieving optimal results in signal reception requires the receiver to consistently operate within the designated "emission cone" of the emitter [
19]. Presently, there are no equivalent formulas applicable to signals of varying shapes, such as chirp signals. In the development of a positioning system based on ultrasonic signals, the utilization of numerical tools becomes essential to evaluate the spatial coverage of each transducer in terms of the quality (including amplitude and deformation level) of the received signal. For signals with arbitrary shapes, reliable indications cannot be derived from simplified formulas, making the use of numerical tools imperative.
In the context of the considered ultrasonic positioning systems, simulations must encompass extensive spatial domains, spanning several cubic meters, and temporal windows extending over tens of milliseconds (see, for instance, [
8,
9,
12]). A robust numerical instrument, the academic Field II software [
20,
21], has demonstrated its suitability for analyzing ultrasound positioning systems. It allows simulating any shape of transducers and ultrasonic signals for both transmission and reception. Moreover, Field II has the numerical features that allow simulating the large spatial regions and time windows required in the field of ultrasonic positioning. This tool is also able to take into account the attenuation properties of the propagation medium.
In a past work [
22], using Field II, it was shown that a chirp emitted by a transducer with a certain aperture, and consequently its cross-correlation, undergoes a shape aberration that increases with a larger aperture. The larger the aperture, the narrower the useful emission cone within which the signal is sufficiently undeformed to estimate the time of arrival using the classical technique of identifying the global peak of the cross-correlation between the emitted and received signals. The conclusions drawn were that there is a practical limit to the maximum aperture of emitting transducers that can be used in an ultrasonic localization system, and the aperture is smaller as the frequency of the emitted signal increases. Unfortunately, the power of the emitted signal is also proportional to the effective surface area of the transducer, so having a small aperture means limiting the power of the signal and thus limiting the available signal-to-noise ratio (SNR).
In this work, an alternative technique for recognizing the signal's time of arrival is proposed, which also works on strongly aberrated signals. Ultimately, the use of the proposed technique allows the use of larger transducers while maintaining the same spatial coverage and bandwidth of the chirp used, thereby providing a higher SNR. Higher SNRs enable the use of ultrasonic positioning systems in progressively noisier environments, allowing their deployment not only in quiet settings like offices, shops, or hospitals but also in industrial environments.
This paper is structured as follows.
Section 2 briefly introduces the simulation tool and setup, while
Section 3 focuses on the problem to be addressed.
Section 4 presents the proposed technique and the simulation results.
Section 5 concludes the paper.
2. Brief introduction to Field II and Simulation Setup
This section provides a concise overview of the operating principle of the Field II simulator [
21] and offers a detailed description of the simulation setup. The simulator utilizes spatial impulse responses to model the ultrasound field for pulsed and continuous wave scenarios, employing linear systems theory [
23,
24,
25]. The spatial impulse response describes the ultrasound field emitted at a specific spatial point over time when the transducer is excited by a Dirac delta function. The overall field generated by any excitation is determined by convolving the spatial impulse response with the excitation function. The technique divides the transducer surface into small rectangles, treating each as a rectangular piston with a known impulsive response [
26]. The emitted spherical waves from these elements are then combined to calculate the impulsive responses at each desired field point. This approach allows for flexibility in considering various excitations while maintaining computational efficiency.
In the following simulations, the objective is to investigate the acoustic field and assess the efficacy of the proposed ranging technique within a standard 4 × 4 × 3 m
3 room [
27]. Specifically, the simulation results will be carried out for a grid of points forming a vertical section (refer to Section A in the room volume, see
Figure 1 in [
22]) and a horizontal section positioned midway between the floor and ceiling (refer to Section B in the room volume,
Figure 1 in [
22]). The transducer, a circular planar one, is centrally positioned on the ceiling at coordinates x = 0, y = 0, and z = 0, emitting downward toward the room floor.
The transducer operates in air, assuming a linearized air absorption model (slope 39.3 dB/m·MHz, constant term -0.262 dB/m, approximately 0.917 dB/m @ 20 kHz, and 1.703 dB/m @ 50 kHz) around 40 kHz. This corresponds to a transducer central frequency of 40 kHz under conditions of 20 °C temperature, 1 atm pressure, and 55% relative humidity [
28,
29].
The signals emitted and received at various points in the space are influenced by the shape and size of the transducer's emission surface (i.e., aperture D). For this study, a circular plane transducer was selected, possessing similar acoustic properties to widely used transducers in positioning applications, such as the Murata MA40S4S piezoelectric transducer (D = 9.9 mm) or the Pro-wave 328ST/R160 (D = 13.1 mm) [
30,
31].
Capacitive transducers, on the other hand (e.g., Senscomp models 600 and 7000, etc.), ensure a broader bandwidth but, structurally, have larger apertures ranging from 15 mm to 37 mm. In [
22], it was demonstrated that an aperture larger than 8.5 mm does not guarantee the required spatial coverage for indoor positioning applications. Better results were achieved with an aperture as small as 6 mm. Therefore, achieving optimal spatial coverage necessitates a significant reduction in the aperture of these capacitive transducers. However, mechanically reducing the aperture is not well-suited to these transducers and substantially decreases their available acoustic power.
The emitting disk is segmented into a specific quantity of rectangles, specifically square elements measuring 0.125 mm by 0.125 mm in all subsequent simulations. The chosen transducer element size in this study represents a well-balanced compromise between solution accuracy and the computational resources utilized in the simulation, as shown in
Figure 2 in [
22].
The signal employed in the simulations is a linear chirp spanning a bandwidth of 30-50 kHz and lasting 5.12 milliseconds [
9,
27]. For simulation purposes, the signal was sampled at a rate of f
S = 1 MHz. The acoustic field was computed at various points in space throughout a time window aligning with the complete reception duration of the signal [
26].
After completing the simulation, the temporal behavior of the acoustic pressure generated by the entire excitation signal was obtained for each considered point in space. This facilitated subsequent assessments and post-processing of the signal, such as calculating peak pressure and total signal strength at each point. Following that, an ideal receiver was assumed, linearly transducing the pressure signal into an electrical signal after suitable sampling and numerical quantization. This process allowed for the calculation of the cross-correlation vector C.
3. Signal aberration
In a previous work [
22], the dependence of the signal aberration with the transducer emitting surface area or aperture was shown. The simulations included acoustic diffractive phenomena and frequency-dependent absorption phenomena, as anticipated in the previous section.
In
Figure 3 (
c) in [
22], it was shown the results of the estimate of the range obtained using the usual technique based on the search for the position of the cross-correlation peak (τ
MAX) [
14,
32]As a result, for the first four aperture diameters (i.e. 25, 20, 16, and 13.1 mm), the lag of the cross-correlation peak did not correspond to the correct time of arrival (TOA), and the range estimation differed by more than 1.5 cm. It also should be noted that the magnitude of this ranging error is amplified in the subsequent process of spatial coordinate estimation [
9].
Further, the impact of using the larger aperture diameter, i.e., D = 25 mm, and the classic ranging technique based on global cross-correlation peak detection in a typical room was illustrated. With this transducer aperture, there was a significant signal shape aberration. However, on the other hand, as expected, the highest power level was achieved, resulting in a higher Signal-to-Noise Ratio (SNR), which is highly desirable in noisy environments.
In
Figure 4 (
a) in [
22], the ranging error was evaluated for D = 25 mm. It shows the ranging error along a rectangular vertical section (Section of the room volume,
Figure 1) of 3 m height and 4 m base passing through the center of the transducer, equal to the vertical section of the typical office room taken as a reference in some positioning works [
27,
33], while Figure 7 (
b) in [
22] shows the behavior of the ranging error on a horizontal section of 4 m × 4 m at z = 1.5 m, or halfway between the ground and the ceiling. In both the figures, the grid pitch is 5 cm in the
x and
y directions.
In this figures, as discussed in [
22], it is possible to clearly recognize the low error areas, where the ranging errors are lower than about 3.09 mm. Such ranging error level is due to the numerical approximations and the sampling frequency chosen for the simulation. The simulation results demonstrated that, using the aperture D = 25 mm, therefore, it is not possible to cover the whole room for that height, and things go even worse for higher heights, which, however, are certainly of interest for three-dimensional indoor positioning systems.
4. The signal aberration correction technique
As mentioned earlier, it is highly advantageous to use a transducer with the largest possible emitting surface to achieve high signal intensity and a high Signal-to-Noise Ratio (SNR).
For instance, in
Figure 3a, it can be observed that the acoustic pressure level increases significantly when transitioning from D = 6 mm, which ensures excellent coverage of the entire volume of interest, to D = 25 mm, resulting in a gain of 20 dB on the axis and approximately 15 dB at 90°. However, this larger aperture suffers from substantial ranging errors just outside its emission semi-cone, spanning about 20°.
Therefore, there is a need to develop a new technique that, while preserving the benefits of increased emitted power and SNR with wide apertures, can extend the spatial region where the ranging error is sufficiently low. In other words, it aims to reduce errors across the entire area of interest.
To achieve this goal, it is insightful to examine the cross-correlation along the same circular path depicted in
Figure 1 in [
22], namely, along a quarter of a circumference within a plane passing through the transducer's emission axis with a radius of R = 1 m.
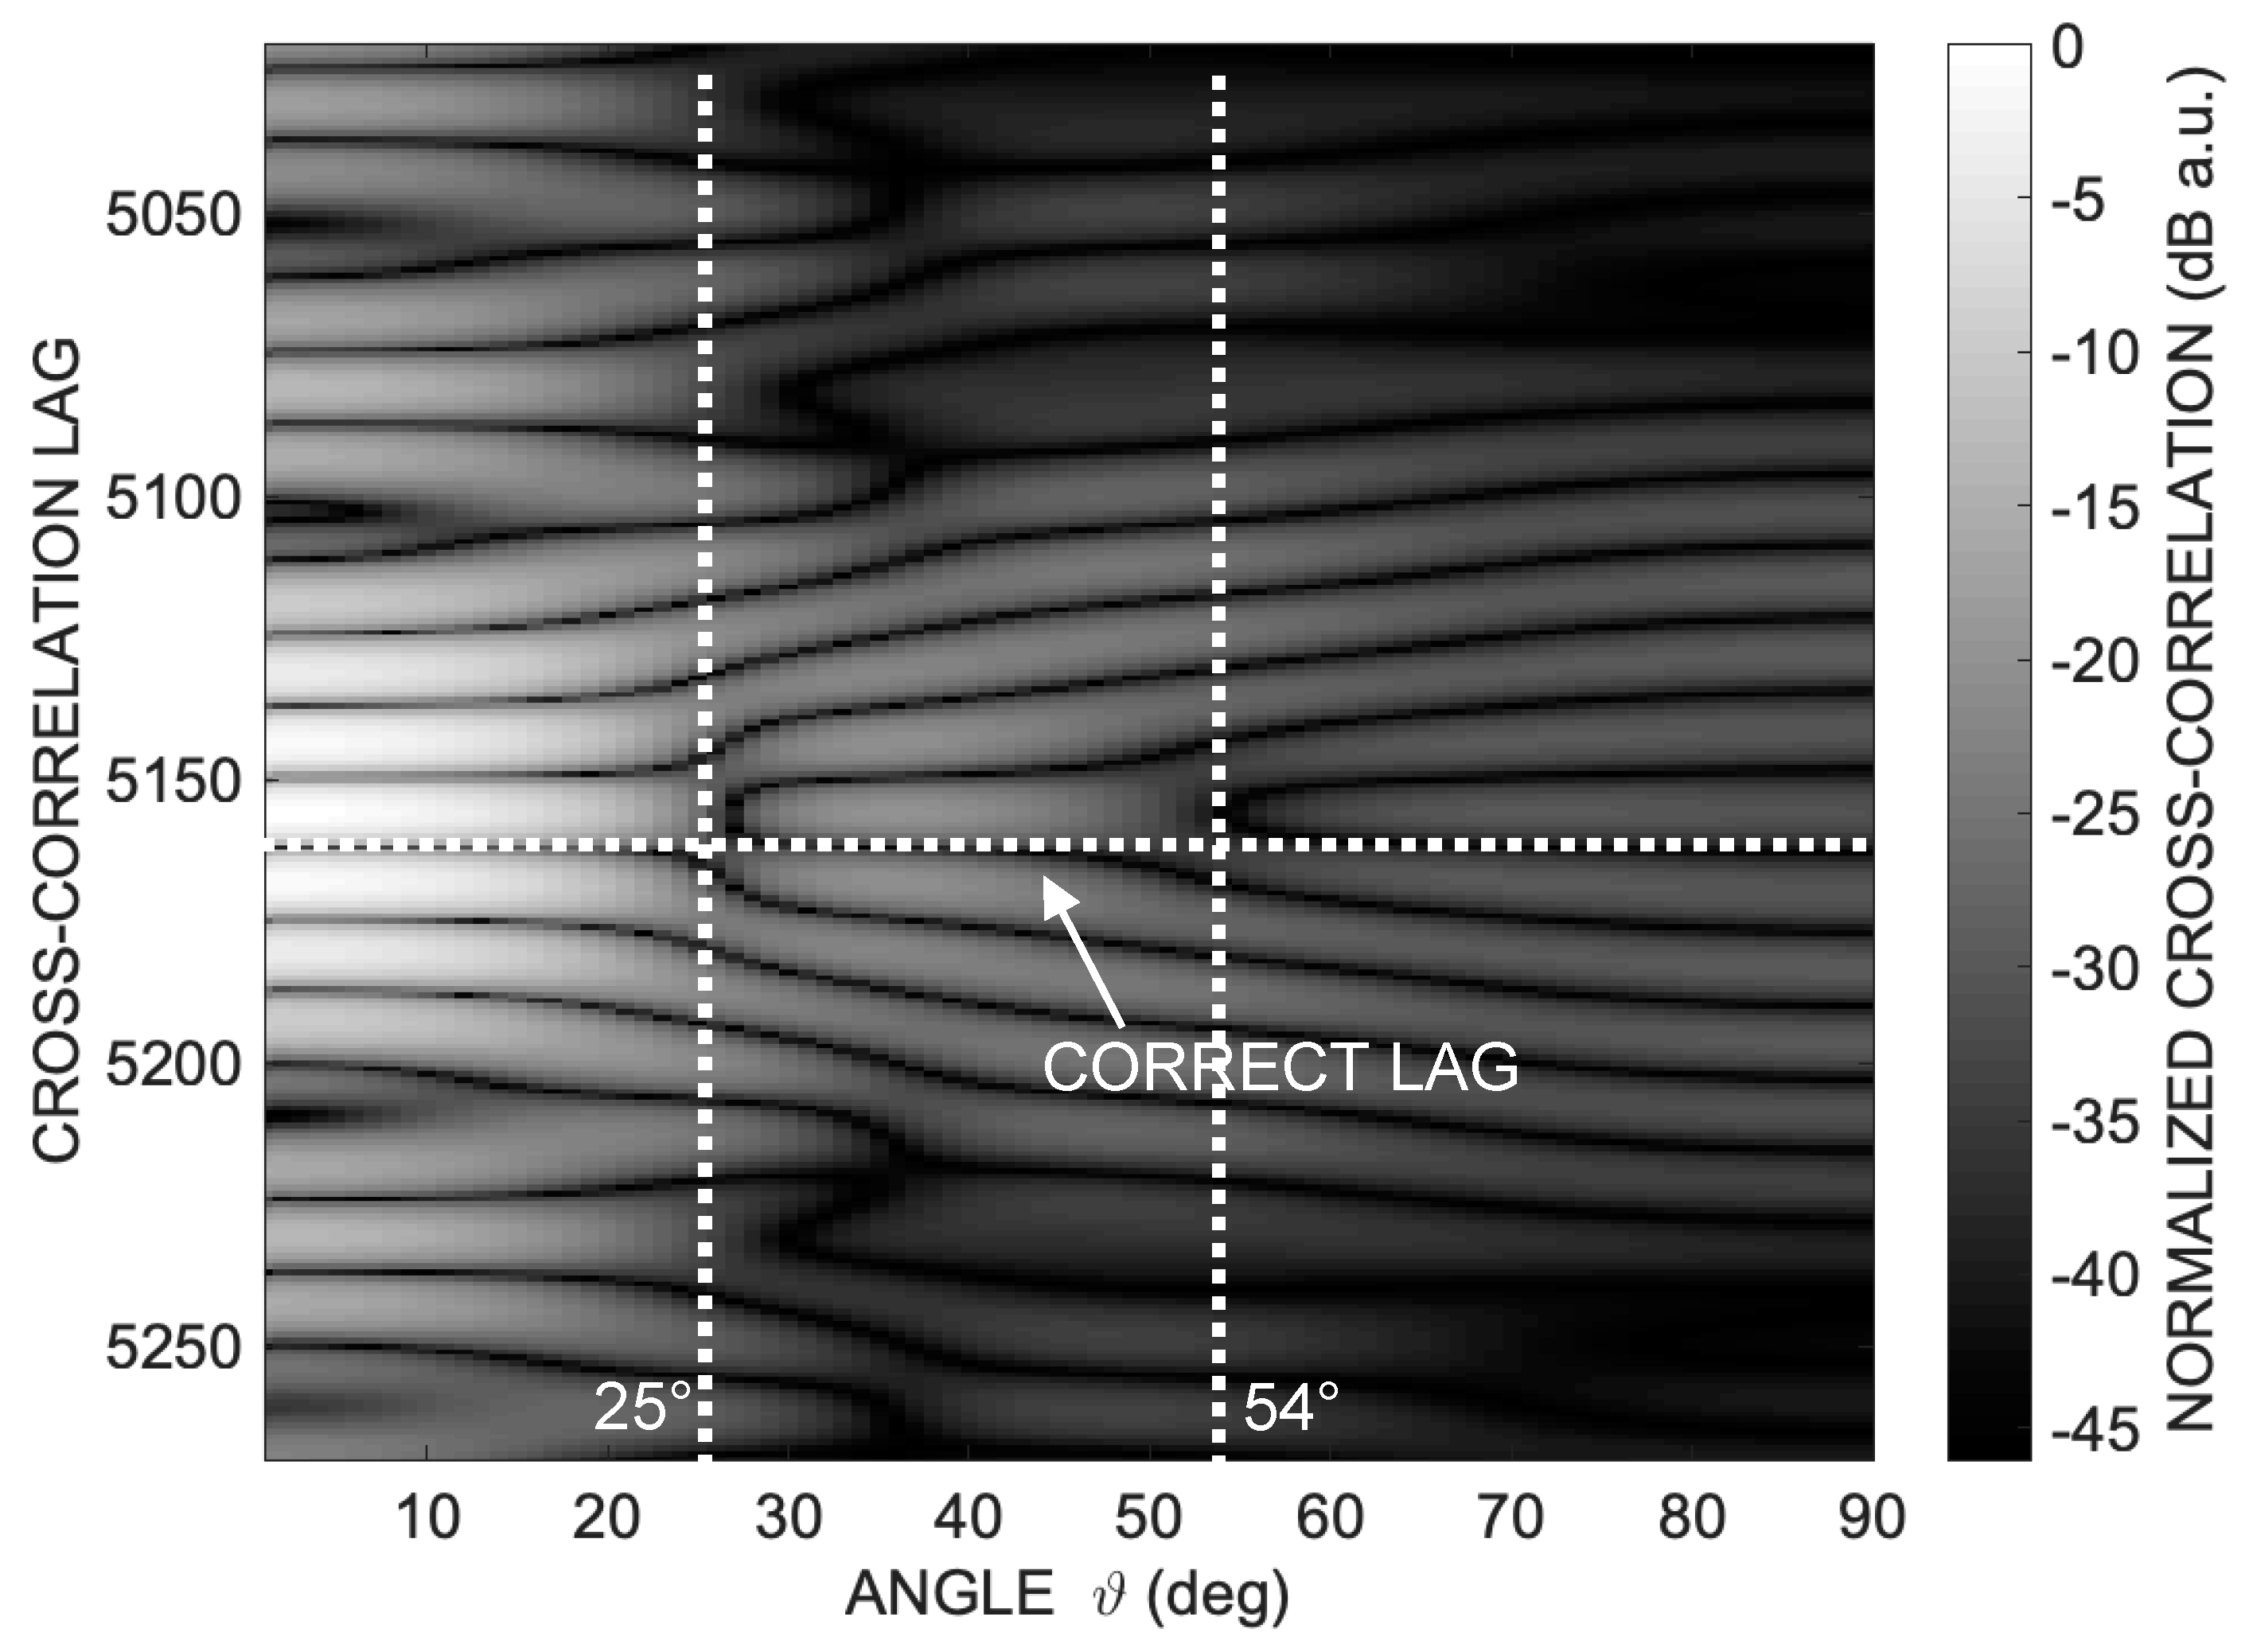
Figure 1 illustrates the absolute values of cross-correlation amplitudes in dB grayscale, plotted against lag and angle ϑ, for the considered aperture D = 25 mm.
While a well-recognizable cross-correlation peak (white pixels) is evident for ϑ less than 20°, there is a gradual disappearance of a well-defined correlation peak as ϑ increases. There is a double bifurcation at approximately 25° and 54°, complicating the unambiguous identification of the Time of Arrival (TOA).
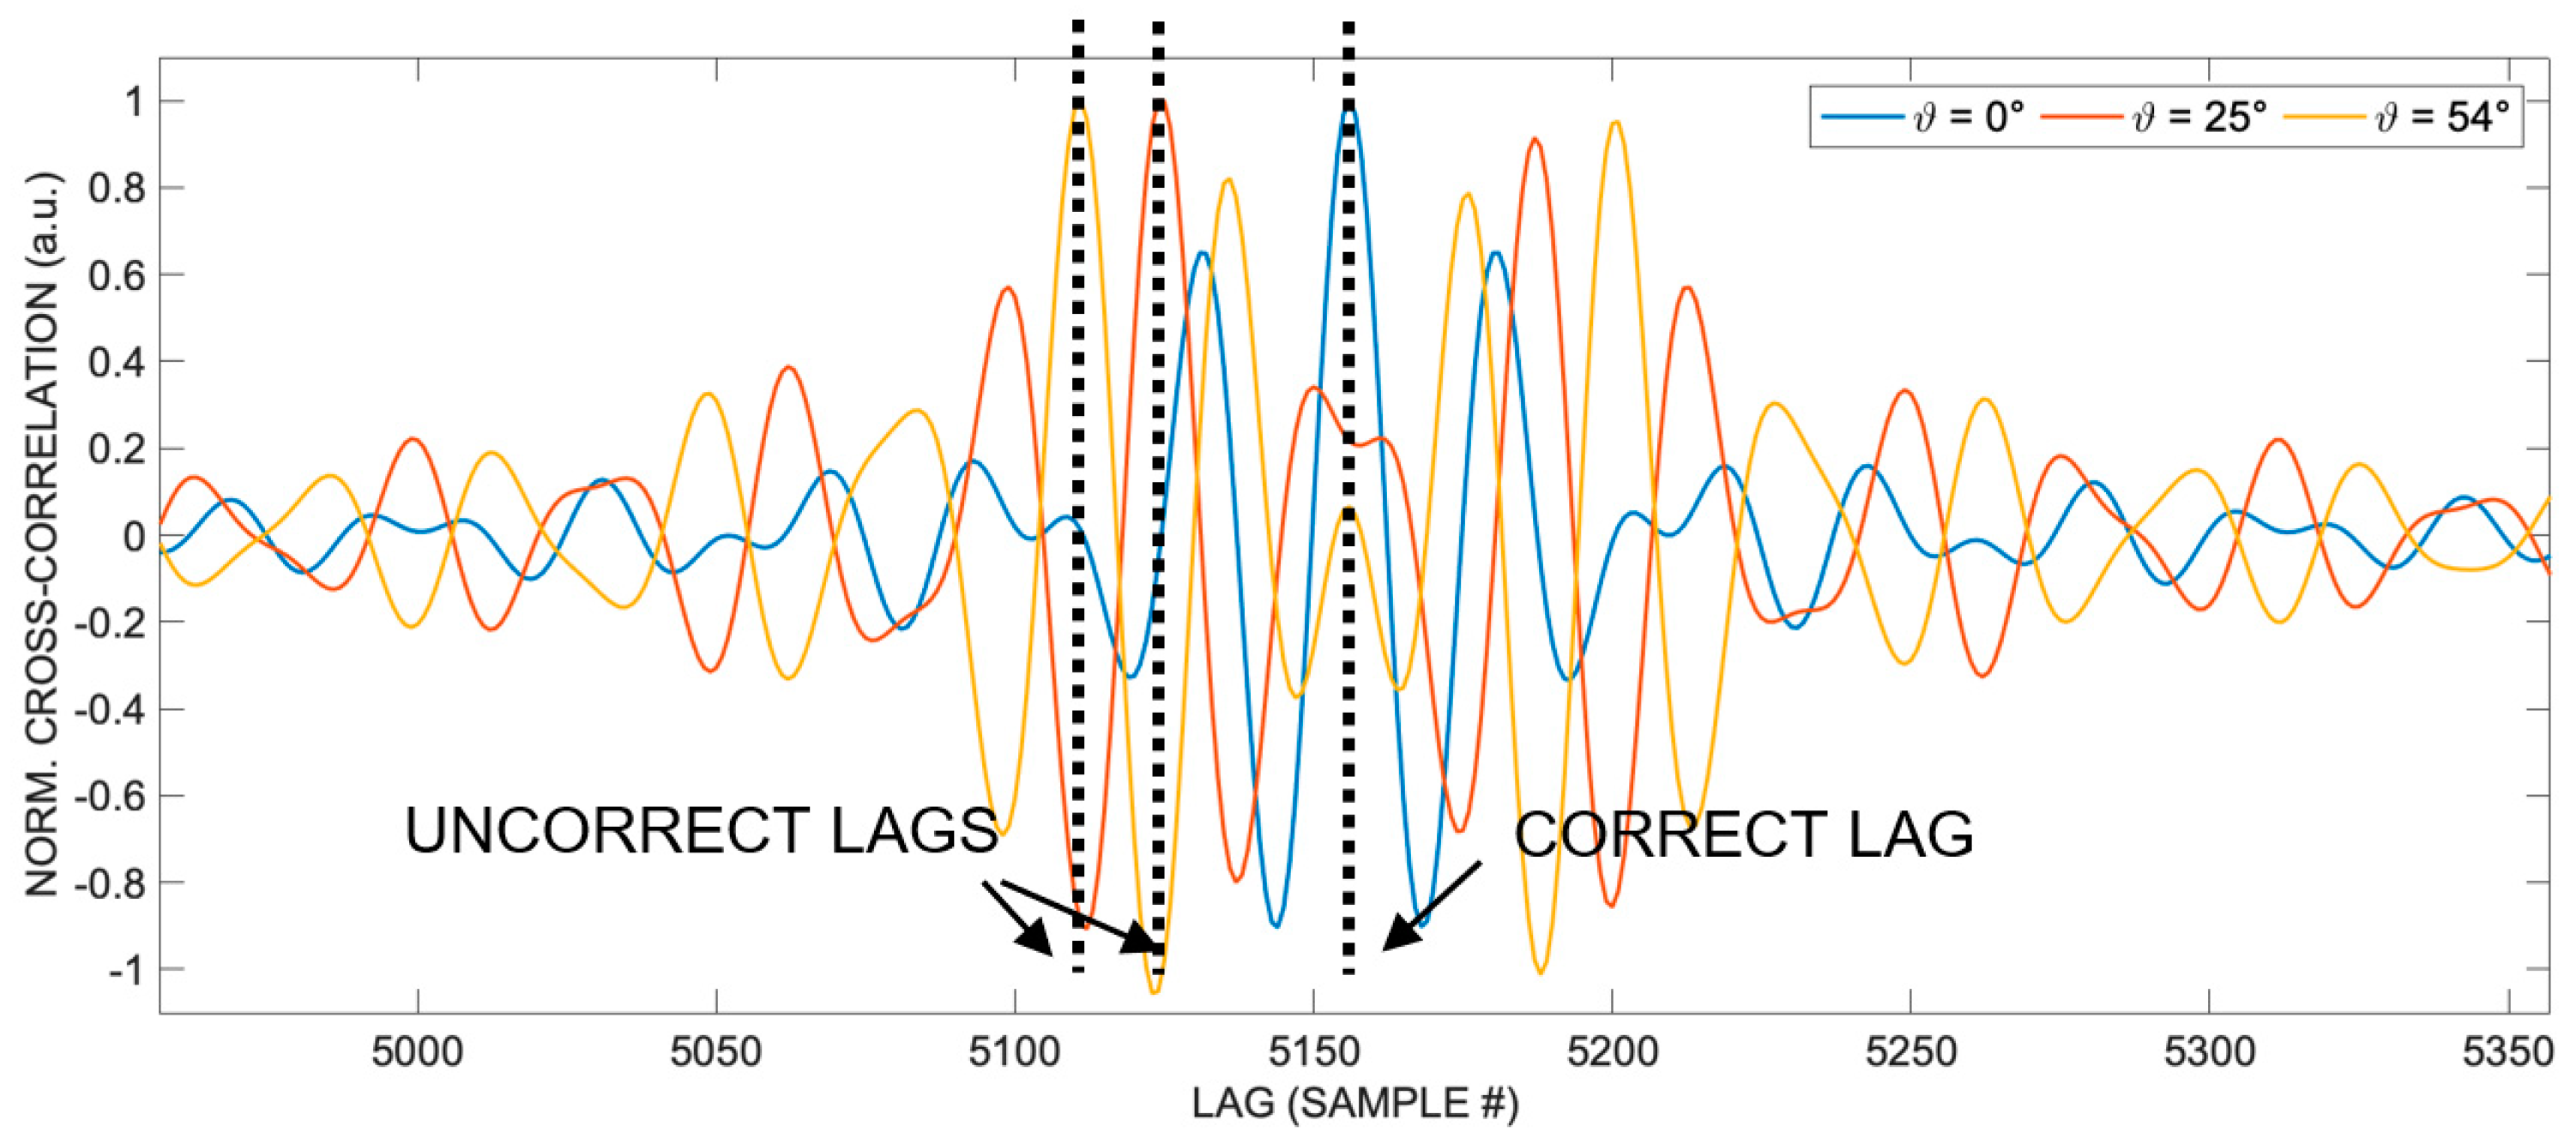
Figure 2 displays the cross-correlations along a semicircular path at a distance R = 1 m from the emitting transducer with aperture D = 25 mm at angles out-of-the-axis 0°, 25° and 54°, respectively. In particular, three correlations are shown at 0°, 25° and 54° respectively, which are three columns, represented linearly, of the matrix representing the logarithmic compressed image of
Figure 1. The cross-correlations values are normalized to their maximum values. It is possible to appreciate the progressive disappearance of a well-defined single correlation peak as the angle ϑ increases and the appearance of double peaks at the angles of approximately 25° and 54°, in the vicinity of which it is difficult to unambiguously identify the TOA.
Since the main cause of the increasing error with the angle ϑ from which the transducer is viewed is the self-interference of the acoustic signal from different regions of the same emitting surface of the transducer, which alters the signal shape at the receiver, the underlying idea of the proposed technique is to employ a more sophisticated approach than simple detection of the global peak of the cross-correlation to identify the lag corresponding to the correct Time of Arrival (TOA).
Examining the trend of the cross-correlation in
Figure 1 provides a crucial observation. Indeed, it can be observed that at angles around 25° and 52°, the cross-correlation exhibits evident distortion and even a bifurcation in its shape, while elsewhere it remains relatively regular.
These bifurcations underlie the errors in
Figure 3 (c) in [
22]. More specifically, it is noted that each cross-correlation, despite distorting and losing its unique peak at the correct lag, remains substantially symmetrical around that point, as shown in
Figure 2.
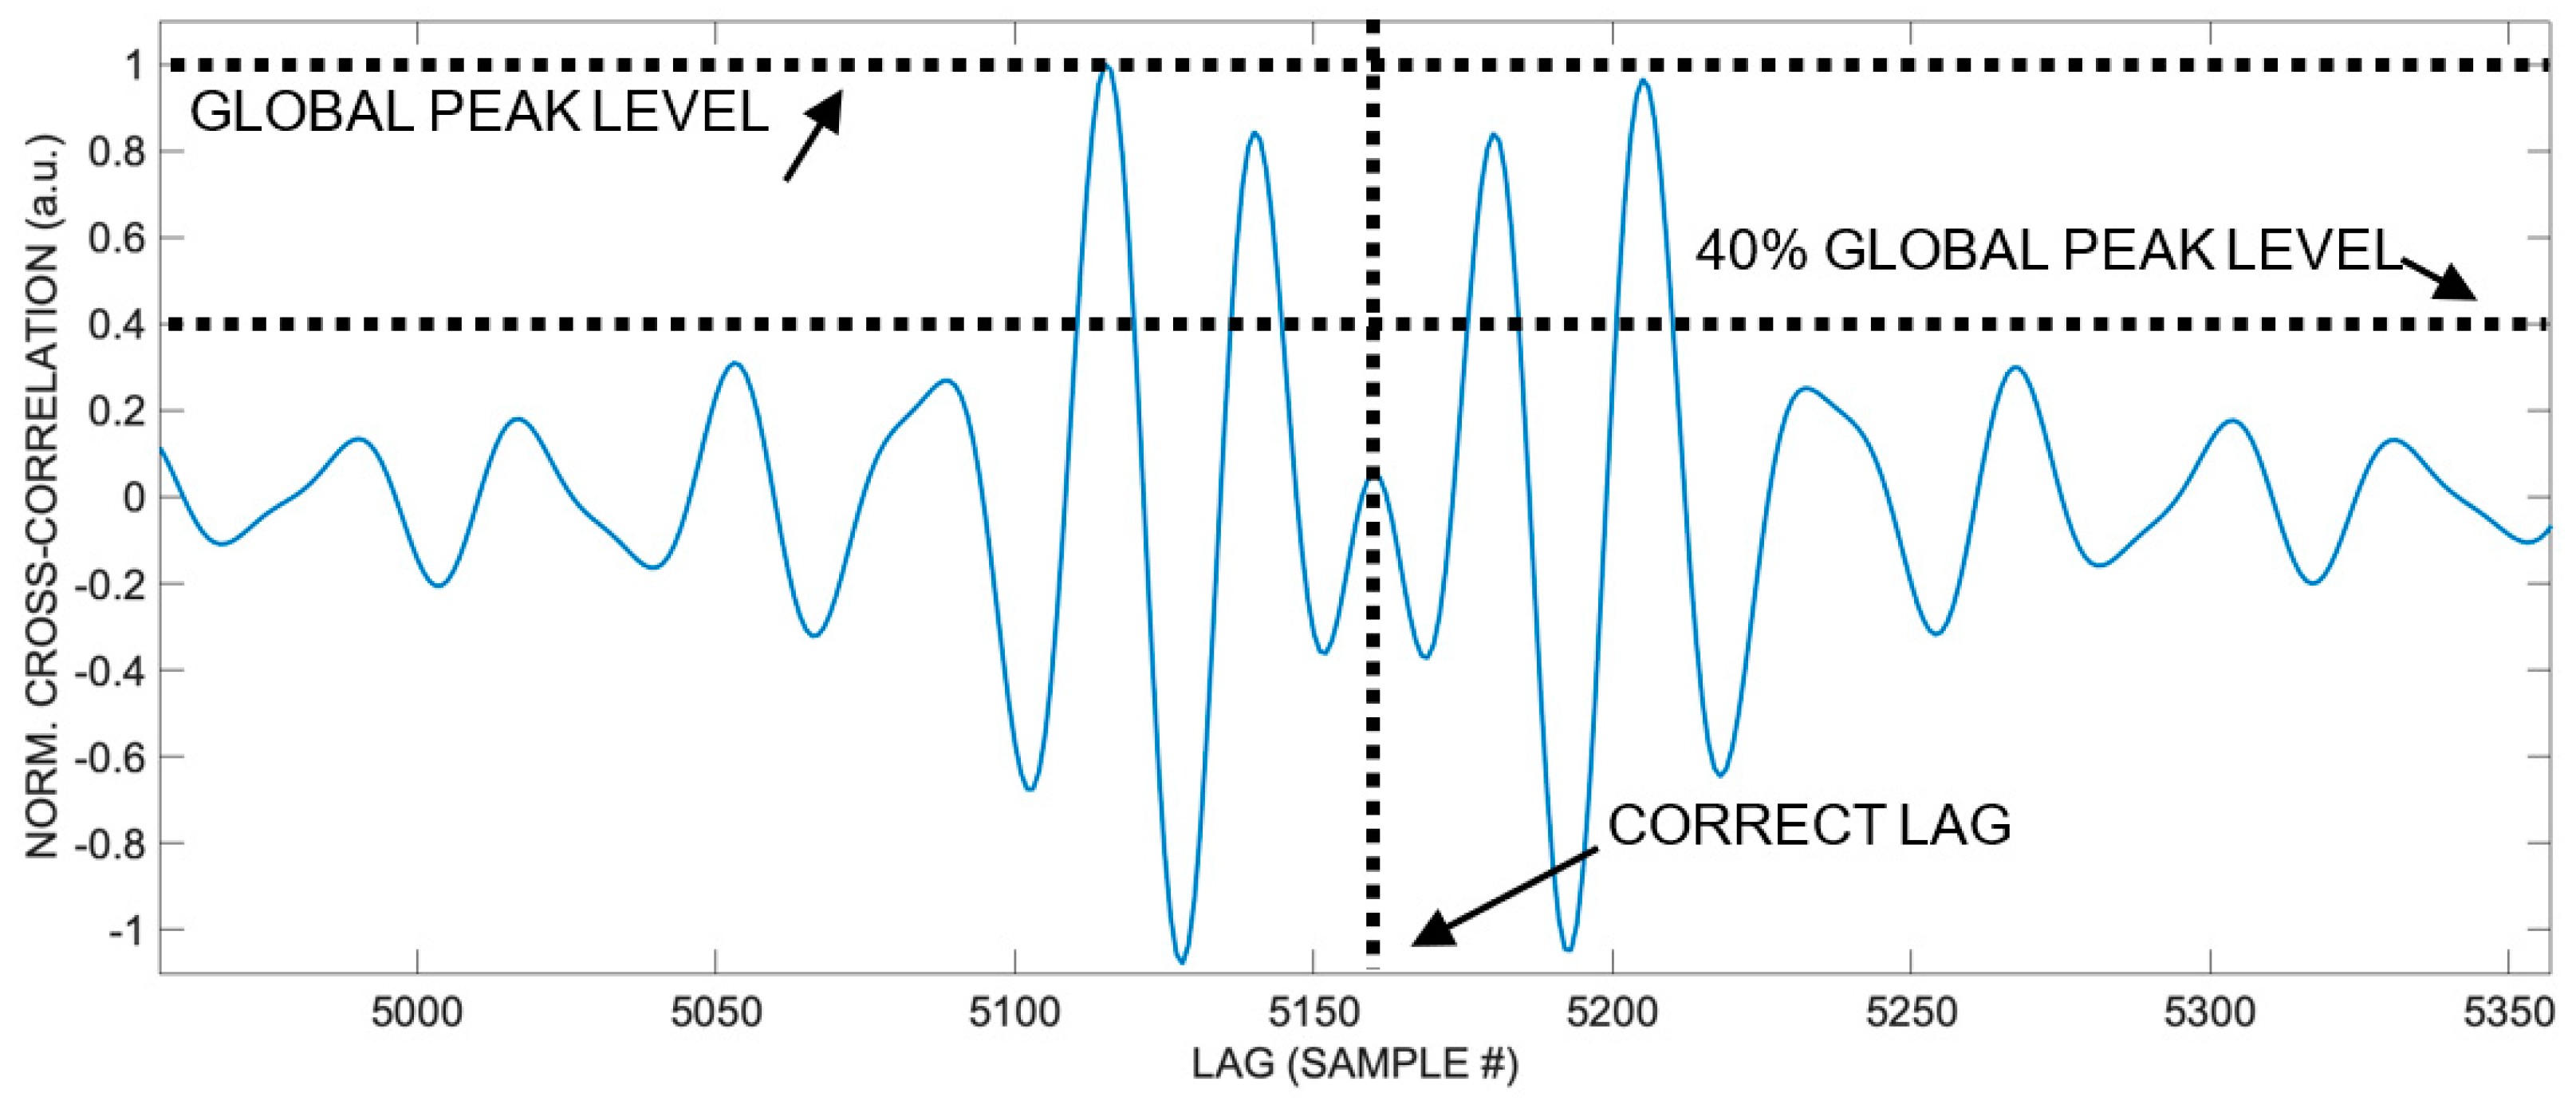
This fact suggests the technique proposed here. In fact, considering the points of the cross-correlation falling within a certain amplitude range, for example, with a value exceeding 40% of the global peak, thanks to the symmetry of the waveform, it is possible to estimate the center of this symmetry as the average of the lag for each point weighted with the amplitude of each point, with good approximation. In other words, taking the set of points with values comparable to the global maximum (for example in the range 100% - 40% of the peak value, but of course other choices are possible) of the aberrated cross-correlation, its weighted average has a lag value very similar to that of the global maximum of the undistorted cross-correlation. Hence, it corresponds with good approximation to the correct lag, proportional to the TOA sought.
So, once the signal is received, to estimate the lag corresponding to the Time of Arrival (TOA), it is sufficient to calculate the cross-correlation, take all the points with a value exceeding 40% of the global peak, and compute the weighted average of their lags (see
Figure 3).
The following simulations illustrate the results of the procedure described so far.
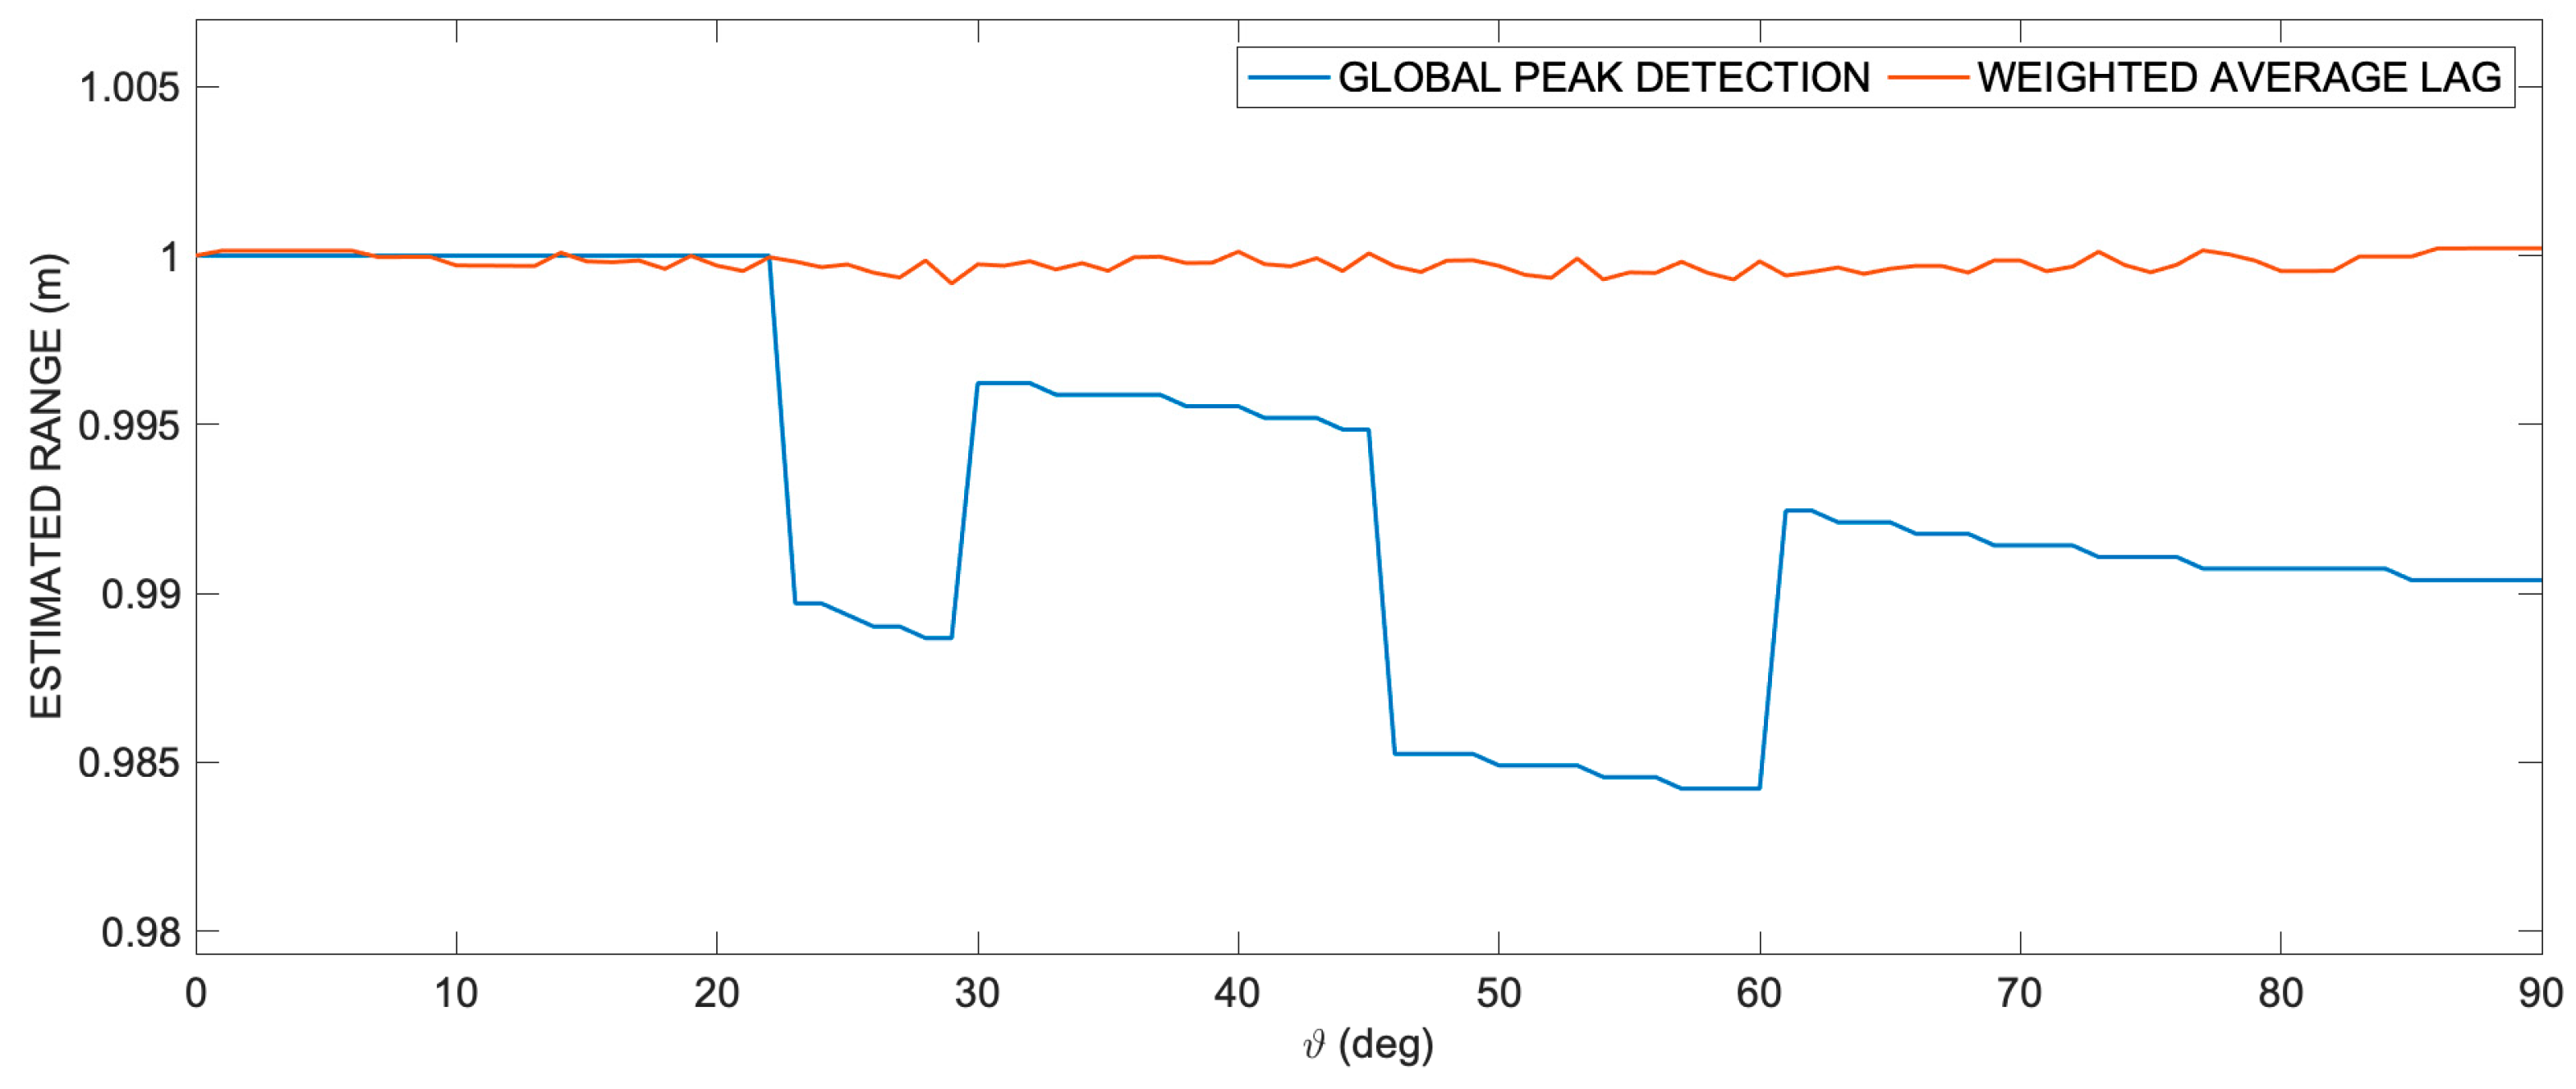
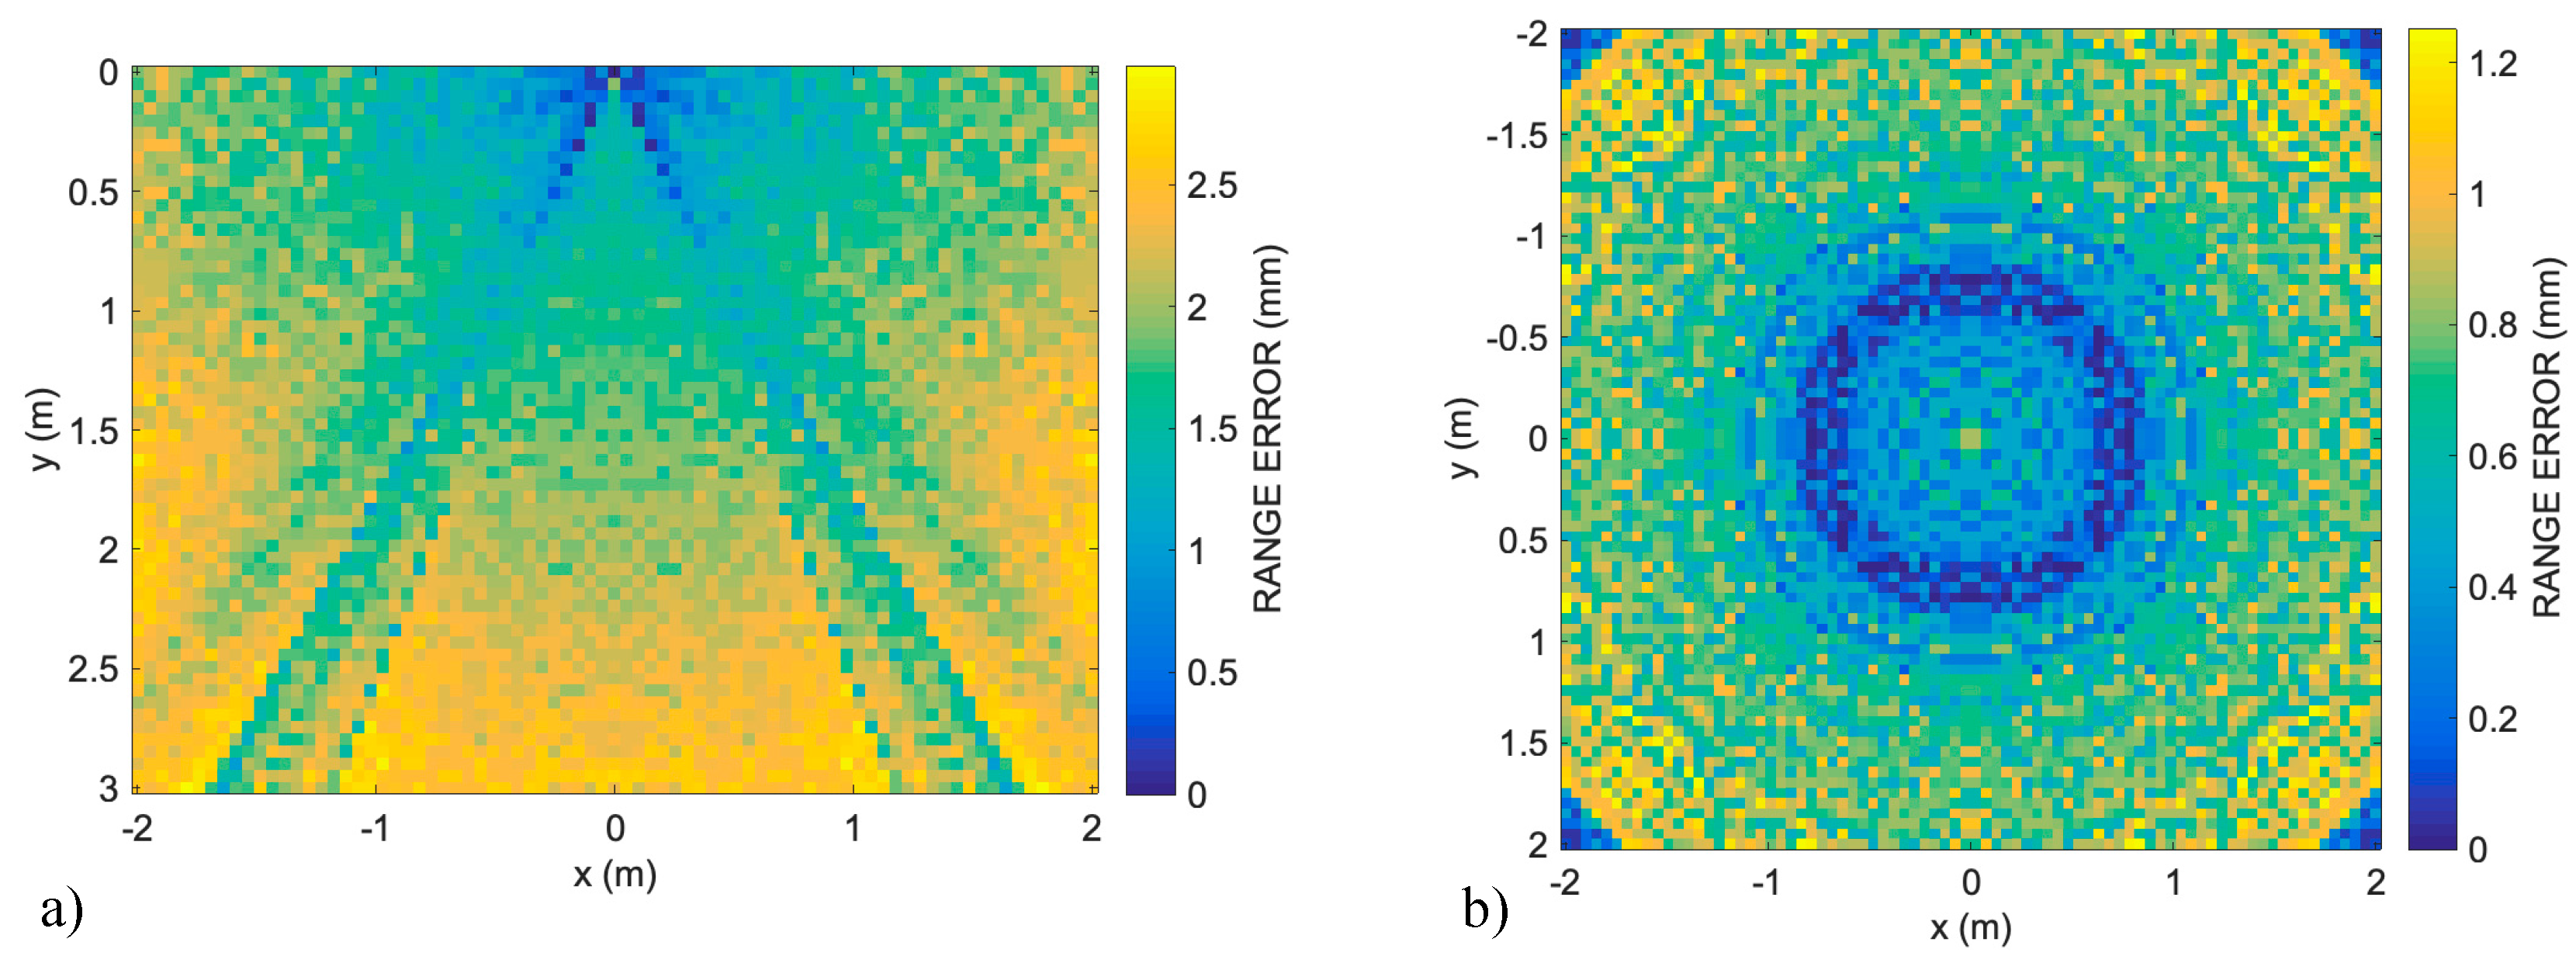
Figure 4 compares the estimated ranges along the circumference of R = 1, obtained by applying the classical cross-correlation global peak detection technique and the proposed weighted averaging lag technique. As is clearly evident, range errors induced by shape aberration are corrected, and the corrected delay can be calculated. The result was of course precisely permitted by the quasi-symmetry of the aberrated cross-correlation.
In
Figure 5, the estimated range errors for the transducer aperture (D = 25 mm, horizontal and vertical step = 0.05 m) are shown using the technique of weighted average lag on the vertical and horizontal sections of the typical room: (
a) vertical 4 m × 3 m Section A (see
Figure 1 in [
22]), where it is noticeable that the cone of minimum ranging error in the vicinity of the transducer axis in the half-space in front of the transducer has disappeared (compare with Figure 6 (
a) in [
22]); (
b) horizontal 4 m × 4 m Section B, where the disk error pattern present in Figure 7 (
a) in [
22] is absent.
5. Conclusions
The article presents a method for correcting signal aberrations in ultrasonic indoor positioning. The challenges associated with signal aberrations in ultrasonic systems, particularly when the aperture of the transducer exceeds a certain limit, causing shape aberrations in the typical linear chirp signal, are addressed. These aberrations impact the cross-correlation technique, leading to errors in range estimation.
To overcome this challenge, the authors propose an alternative technique based on the inherent symmetry observed in the shape of the aberrated cross-correlation. The proposed technique involves calculating the weighted average of lags for points with cross-correlation values exceeding a certain threshold. This method aims to correct the errors introduced by shape aberrations and improve the accuracy of range estimation, allowing for the use of transducers with larger apertures.
The numerical simulations, conducted using the Field II acoustic simulation software, compare the classical cross-correlation technique with the proposed weighted average lag technique in a standard office room. The results demonstrate that the proposed technique enables accurate range estimation even in the presence of severe cross-correlation shape aberrations. This advancement allows for the use of transducers with larger apertures, leading to higher acoustic power and improved Signal-to-Noise Ratio (SNR), and expanding the applicability of ultrasonic systems for indoor positioning and tracking.
Author Contributions
Conceptualization, R.C.; data curation, R.C., M.M., and D.I.; formal analysis, R.C.; investigation, R.C., M.M., D.I.; methodology, R.C.; software, R.C.; supervision, R.C.; writing—original draft, R.C.; and writing—review and editing, R.C., M.M., D.I. All authors have read and agreed to the published version of the manuscript.
Funding
This research received no external funding.
Conflicts of Interest
The authors declare no conflicts of interest.
References
- Zafari, F.; Gkelias, A.; Leung, K.K. A Survey of Indoor Localization Systems and Technologies. IEEE Commun. Surv. Tutorials 2019, 21, 2568–2599. [Google Scholar] [CrossRef]
- Paredes, J.; Álvarez, F.; Aguilera, T.; Villadangos, J. 3D Indoor Positioning of UAVs with Spread Spectrum Ultrasound and Time-of-Flight Cameras. Sensors 2017, 18, 89. [Google Scholar] [CrossRef] [PubMed]
- Kunhoth, J.; Karkar, A.; Al-Maadeed, S.; Al-Ali, A. Indoor positioning and wayfinding systems: a survey. Human-centric Comput. Inf. Sci. 2020, 10, 18. [Google Scholar] [CrossRef]
- Merenda, M.; Catarinucci, L.; Colella, R.; Iero, D.; Corte, F.G. Della; Carotenuto, R. RFID-based Indoor Positioning using Edge Machine Learning. IEEE J. Radio Freq. Identif. 2022, 1–1. [Google Scholar] [CrossRef]
- Obeidat, H.; Shuaieb, W.; Obeidat, O.; Abd-Alhameed, R. A Review of Indoor Localization Techniques and Wireless Technologies. Wirel. Pers. Commun. 2021, 119, 289–327. [Google Scholar] [CrossRef]
- Seco, F.; Jimenez, A.R.; Prieto, C.; Roa, J.; Koutsou, K. A survey of mathematical methods for indoor localization. In Proceedings of the 2009 IEEE International Symposium on Intelligent Signal Processing; IEEE; 2009; pp. 9–14. [Google Scholar]
- Filonenko, V.; Cullen, C.; Carswell, J. Indoor Positioning for Smartphones Using Asynchronous Ultrasound Trilateration. ISPRS Int. J. Geo-Information 2013, 2, 598–620. [Google Scholar] [CrossRef]
- Urena, J.; Hernandez, A.; Garcia, J.J.; Villadangos, J.M.; Carmen Perez, M.; Gualda, D.; Alvarez, F.J.; Aguilera, T. Acoustic Local Positioning With Encoded Emission Beacons. Proc. IEEE 2018, 106, 1042–1062. [Google Scholar] [CrossRef]
- Carotenuto, R.; Merenda, M.; Iero, D.; Della Corte, F.G. An Indoor Ultrasonic System for Autonomous 3-D Positioning. IEEE Trans. Instrum. Meas. 2019, 68, 2507–2518. [Google Scholar] [CrossRef]
- Sabatini, A.M.; Rocchi, A. Sampled baseband correlators for in-air ultrasonic rangefinders. IEEE Trans. Ind. Electron. 1998, 45, 341–350. [Google Scholar] [CrossRef]
- Huang, S.S.; Huang, C.F.; Huang, K.N.; Young, M.S. A high accuracy ultrasonic distance measurement system using binary frequency shift-keyed signal and phase detection. Rev. Sci. Instrum. 2002, 73, 3671–3677. [Google Scholar] [CrossRef]
- Saad, M.M.; Bleakley, C.J.; Dobson, S. Robust High-Accuracy Ultrasonic Range Measurement System. IEEE Trans. Instrum. Meas. 2011, 60, 3334–3341. [Google Scholar] [CrossRef]
- De Marziani, C.; Urena, J.; Hernandez, Á.; Garcia, J.J.; Alvarez, F.J.; Jimenez, A.; Perez, M.C.; Carrizo, J.M.V.; Aparicio, J.; Alcoleas, R. Simultaneous Round-Trip Time-of-Flight Measurements With Encoded Acoustic Signals. IEEE Sens. J. 2012, 12, 2931–2940. [Google Scholar] [CrossRef]
- Carotenuto, R.; Merenda, M.; Iero, D.; Della Corte, F.G. Ranging RFID tags with ultrasound. IEEE Sens. J. 2018, 18, 2967–2975. [Google Scholar] [CrossRef]
- Carotenuto, R.; Pezzimenti, F.; Corte, F.G. Della; Iero, D.; Merenda, M. Acoustic Simulation for Performance Evaluation of Ultrasonic Ranging Systems. Electronics 2021, 10, 1298. [Google Scholar] [CrossRef]
- Rubio, M.C.P.; Serrano, R.S.; Urena, J.U.; Alonso, Á.H.; De Marziani, C.; Franco, F.J.Á. Correlator Implementation for Orthogonal CSS Used in an Ultrasonic LPS. IEEE Sens. J. 2012, 12, 2807–2816. [Google Scholar] [CrossRef]
- Jackson, J.C.; Summan, R.; Dobie, G.I.; Whiteley, S.M.; Pierce, S.G.; Hayward, G. Time-of-flight measurement techniques for airborne ultrasonic ranging. IEEE Trans. Ultrason. Ferroelectr. Freq. Control 2013, 60, 343–355. [Google Scholar] [CrossRef]
- Kinsler, L.E.; Frey, A.R.; Coppens, A.; Sanders, J. Fundamentals of Acoustics; John Wiley & Sons, Inc.: New York, NY, USA, 2000; ISBN 0-471-84789-5. [Google Scholar]
- Gualda, D.; Ureña, J.; Jesús García, J.; Jiménez, A.; Pérez, M.C.; Ciudad, F. Coverage analysis of an ultrasonic local positioning system according to the angle of inclination of the beacons structure. In Proceedings of the CEUR Workshop Proceedings; 2019; Vol. 2498; pp. 355–361. [Google Scholar]
- Jensen, J.A. FIELD: A program for simulating ultrasound systems. Med. Biol. Eng. Comput. 1996, 34, 351–352. [Google Scholar]
- Field II Ultrasound Simulation Program Available online:. Available online: https://field-ii.dk/ (accessed on Dec 19, 2023).
- Carotenuto, R.; Merenda, M.; Iero, D.; G. Della Corte, F. Simulating Signal Aberration and Ranging Error for Ultrasonic Indoor Positioning. Sensors 2020, 20, 3548. [Google Scholar] [CrossRef] [PubMed]
- Tupholme, G.E. Generation of acoustic pulses by baffled plane pistons. Mathematika 1969, 16, 209–224. [Google Scholar] [CrossRef]
- Stepanishen, P.R. The Time-Dependent Force and Radiation Impedance on a Piston in a Rigid Infinite Planar Baffle. J. Acoust. Soc. Am. 1971, 49, 841–849. [Google Scholar] [CrossRef]
- Stepanishen, P.R. Transient Radiation from Pistons in an Infinite Planar Baffle. J. Acoust. Soc. Am. 1971, 49, 1629–1638. [Google Scholar] [CrossRef]
- Jensen, J.A.; Svendsen, N.B. Calculation of pressure fields from arbitrarily shaped, apodized, and excited ultrasound transducers. IEEE Trans. Ultrason. Ferroelectr. Freq. Control 1992, 39, 262–267. [Google Scholar] [CrossRef] [PubMed]
- Carotenuto, R.; Merenda, M.; Iero, D.; G. Della Corte, F. Mobile Synchronization Recovery for Ultrasonic Indoor Positioning. Sensors 2020, 20, 702. [Google Scholar] [CrossRef] [PubMed]
- Bass, H.E.; Sutherland, L.C.; Zuckerwar, A.J.; Blackstock, D.T.; Hester, D.M. Atmospheric absorption of sound: Further developments. J. Acoust. Soc. Am. 1995, 97, 680–683. [Google Scholar] [CrossRef]
- García, E.; Holm, S.; García, J.J.; Ureña, J. Link Budget for Low Bandwidth and Coded Ultrasonic Indoor Location Systems. In Proceedings of the International Conference on Indoor Positioning and Indoor Navigation; Guimaraes, Portugal; 2011. [Google Scholar]
- 3Murata Manufacturing Co. Ltd. Specification of Ultrasonic Transducer Type MA40S4S . Available online: https://www.murata.com/products/productdata/8797589340190/MASPOPSE.pdf?1450668610000 (accessed on Dec 19, 2023).
- Pro-Wave Electronic Corp. Air Ultrasonic Ceramic Transducers: 328ST/R160. Available online: http://www.prowave.com.tw/english/products/ut/open-type/328s160c.htm (accessed on Dec 19, 2023).
- Ens, A.; Reindl, L.M.; Bordoy, J.; Wendeberg, J.; Schindelhauer, C. Unsynchronized ultrasound system for TDOA localization. In Proceedings of the 2014 International Conference on Indoor Positioning and Indoor Navigation (IPIN); IEEE; 2014; pp. 601–610. [Google Scholar]
- Medina, C.; Segura, J.; De la Torre, Á. Ultrasound Indoor Positioning System Based on a Low-Power Wireless Sensor Network Providing Sub-Centimeter Accuracy. Sensors 2013, 13, 3501–3526. [Google Scholar] [CrossRef]
|
Disclaimer/Publisher’s Note: The statements, opinions and data contained in all publications are solely those of the individual author(s) and contributor(s) and not of MDPI and/or the editor(s). MDPI and/or the editor(s) disclaim responsibility for any injury to people or property resulting from any ideas, methods, instructions or products referred to in the content. |
© 2024 by the authors. Licensee MDPI, Basel, Switzerland. This article is an open access article distributed under the terms and conditions of the Creative Commons Attribution (CC BY) license (http://creativecommons.org/licenses/by/4.0/).
