Preprint
Article

Climate Change Impact on Management Practices of Maize Yield: Case of Mount Makulu, Zambia

Altmetrics

Downloads

167

Views

147

Comments

0

Submitted:

30 January 2024

Posted:

31 January 2024

You are already at the latest version

Alerts
Abstract
Abstract: Long-term rainfall, temperature and solar radiation time series data are required to simulate crop yield and yield variability. A field experiment conducted at Mount Makulu was used to simulate the interactive effect of planting dates (SD1, SD2, SD3), maize varieties (PIO30G19, PIO30B50, ZMS606), and nitrogen fertilizer application levels (N1 = 66; N2 = 132; N3 = 198 kg N ha-1) on strategic and economic assessment. Statistical downscaled climate datasets from three GCMs from 1971-2000, 2010-2039, 2040-2069, and 2070-2099 using Representative Concentration Pathways (RCP4.5, RCP8.5) were utilized as DSSAT v4.7 inputs. The Seasonal analysis Program of the DSSAT model was used to simulate the impacts of climate change on maize yield. Results show increasing trends in temperature while there is variability in rainfall. The biophysical analysis showed varied grain yield responses to sowing date, maize cultivars and N application rates. The Mean-Gini analysis showed that PIO30B50 had an efficient late sowing data (SD3) with an application of 132 and 168 kg N ha-1 under both scenarios. Further, PIO30G19 at SD3 with 198 kg N ha-1 would be the most dominant management option for maize grain yield under future climate scenarios from 2010-2099. This research emphasizes the urgency for tailored adaptation actions and collaborative efforts along the maize value chain to mitigate future yield losses and sustain food security. Increasing maize grain yield requires implementing adaptation strategies such as varying sowing dates, adopting late-maturing varieties with high thermal heat requirements under future climate scenarios.
Keywords: 
Subject: Environmental and Earth Sciences  -   Other

1. Introduction

Maize (Zea mays L.) is an important cereal crop in the world, including Zambia [4,5,6]. Agricultural practices, such as sowing dates, cultivar and fertility affects crop productivity based on soil properties [4]. However, nitrogen (N) is the most limiting nutrient for maize production [7,8]. Nitrogen is a chlorophyll component, and important in protein synthesis and determine maize grain yield. A sufficient supply of nitrogen is essential for maximizing crop yield [4]. However, delay in sowing have been shown to have negative effects on maize yield [5,9].
For the application of N to be optimal, it must adhere to the 4Rs in nutrient stewardship [4]. These are right source, rate, time, and place [4]. Optimizing N application rate helps in balancing maize nitrogen nutrient requirements and soil quality [4,10]. The inorganic forms of N utilized by plants through the maize root system are nitrate and ammonium. The nitrate and ammonium can be oxidized into nitrate ion form and taken up by the maize roots. On the other hand, field experiments at either on-farm or research stations are labour intensive and expensive to conduct [11]. The effect of nitrogen application rates on crop yield and soil fertility depends on status of the soil properties and on climatic conditions, crop types, agronomic practices, and the interactions among these factors [4,12].
Crop simulation models complement field experimentation for the development of innovative crop management practices [13]. Crop models are widely applied in agricultural impact research [14]. Further, the effects of environmental, and genetic factors and management practices on crop productivity and yield can be simulated using crop models [15]. Crop models are used to simulate crop growth and yield using soil, climate, management and cultivar properties [16]. The models provide opportunity to explore the effects of management on future maize yield relative to the baseline [17,18]. They also allow for the development and selection of the best management practices and economic analysis to improve crop production and profitability [16].
The DSSAT and CENTURY soil models have been applied to explore the effect of low N input on wheat (Triticum aestivum L.) growth and yield [16]. This study analysed for concentration of N in grain and soil organic carbon in a long-term experiment (19 years) under a wheat-maize rotation in China [16]. The researchers observed that the DSSAT-CENTURY model was able to simulate observed wheat grain yield and grain N without N application. However, the simulation of wheat grain yield and grain N at application of 150kg N/ha and soil organic carbon was poor. Several researchers have reiterated that, an adequately calibrated DSSAT models is a useful decision support management tool for assessing and predicting crop yield, nitrogen uptake, and other parameters [16,19,20,21,22,23].
The most popular crop simulation model used globally is the DSSAT-CERES-maize model [24]. It has been parameterized, calibrated, tested and validated globally at local and regional scales [17,25,26,27,28,29]. An adequately calibrated and tested/or validated DSSAT-CERES-maize can be used to address risks, uncertainty and inefficiencies in the agricultural sector in order to make informed decisions [30]. Further, the crop models can be applied to quantify risks linked with yield, climate and economic risks due to uncertainty in the cost of production. Calibrated and validated DSSAT-CERES-maize model has been able to simulate grain yield [31,32,33].
Crop models can be utilized to come up with optimal management practices based on field trials and simulations for agronomic recommendations [34]. They have been used in decision making and to inform policy for future biophysical and economic analyses [35]. However, many yield and nitrogen simulation studies using DSSAT models have inadequately assessed agronomic and economic risk of management practices [23].
Furthermore, crop simulation models can be applied to developing strategies and recommendations for improving and enhancing optimal crop yield under future climate scenarios. Crop growth, yield components and yield simulations requires long-term, high-quality rainfall, temperature and solar radiation dataset. Researchers have generated historical and future climate scenarios by statistically downscaling Global Climate Models (GCMs) and Regional Climate Models (RCMs) [36,37,38,39]. Others have used weather generators such as LARSWG, CLIMGEN, SIMMETEO and WGEN [40,41,42].
Climate data from observations, GCMs and RCMs can be utilized as inputs for crop models. Statistically downscaled rainfall and temperature have been used as inputs into crop models [17,18,43,44]. DSSAT as a process-based models can be used to estimate yield through computer simulation [45]. The output from simulations becomes inputs into economic models which then simulates the responses of important economic parameters to variations in bio-physical crop yields. Studying maize and the impacts of climate change on its growth, yield components and yield requires that biophysical and economic factors be considered [46]. Economic analysis and fertilizer use and rates for maize production under the changing climate condition have not been well studied in Zambia. The research progress on impacts of climate change on maize growth and yield using biophysical and economic analyses. Therefore, the objective of the study was to assess the impacts of climate on interactive effect on planting dates, cultivar and nitrogen and yield. The study outcome could serve as a standard to assess the impact of climate change scenarios on crop growth and yield.

2. Results

2.1. Projected Changes in Temperature and Rainfall

Results shows that temperature will increase under all future climate scenarios (2010-2039, 2040-2069, 2070-2099 [RCP4.5, RCP8.5]) w.r.t the baseline (1971-2000) as shown in Table 5 and Table 6. There is higher increase in Tmin compared to the Tmax. The mean increase in minimum temperature is 1.20oC during 2010-2039/1971-2000 under both RCPs. However, the mean increase in maximum temperature under future climate scenarios is below the 1.5oC.
Rainfall will increase by 1.94%, 8.43% and 4.26% during 2010-2039/1971-2000, 2040-2069/1971-2000 and 2070-2099/1971-2000 under RCP4.5 (Table 6). On the other, rainfall will reduce under RCP8.5 by 0.98% and 27.49% during 2010-2039/1971-2000 and 2070-2099/1971-2000 (Table 6).
Table 5. Annual means in rainfall and temperature during the baseline and future climate scenarios (2010-2039, 2040-2069 and 2070-2099 (RCP4.5, RCP8.5)) for each GCM.
Scenarios Rainfall (mm) SD Tmax (oC) SD Tmin (oC) SD Tmean (oC) SD
Historical GFDL-ESM2M 743.28 143.99 27.76 3.60 14.69 4.18 21.22 3.46
MIROC-ESM 824.69 181.91 27.86 3.70 14.75 4.12 21.31 3.45
MPI-ESM-MR 848.59 226.85 27.92 3.43 14.73 4.09 21.32 3.32
Ensemble 805.52 184.25 27.85 3.58 14.72 4.13 21.28 3.41
RCP4.5 GFDL-ESM2M 2025 914.91 28.92 15.53 22.22
MIROC-ESM 2025 713.16 27.80 17.01 22.41
MPI-ESM-MR 2025 835.40 28.72 15.22 21.97
Ensemble* 821.16* 28.48* 15.92 22.20
GFDL-ESM2M 2055 1,021.93 29.38 15.71 22.55
MIROC-ESM 2055 730.12 27.04 17.08 22.06
MPI-ESM-MR 2055 868.33 29.58 15.71 22.65
Ensemble 873.46 28.66 16.17 22.42
GFDL-ESM2M 2085 929.44 29.77 15.91 22.84
MIROC-ESM 2085 788.55 26.20 17.11 21.66
MPI-ESM-MR 2085 801.61 29.85 15.82 22.83
Ensemble 839.87 28.61 16.28 22.44
RCP8.5 GFDL-ESM2M 2025 841.52 28.88 15.39 22.14
MIROC-ESM 2025 721.98 27.75 17.02 22.38
MPI-ESM-MR 2025 829.40 28.96 15.36 22.16
Ensemble 797.64 28.53 15.92 22.23
GFDL-ESM2M 2055 875.60 29.93 15.88 22.90
MIROC-ESM 2055 821.06 26.21 17.12 21.66
MPI-ESM-MR 2055 764.61 29.98 15.91 22.95
Ensemble 820.42 28.71 16.30 22.51
GFDL-ESM2M 2085 426.43 30.91 16.86 23.89
MIROC-ESM 2085 943.07 24.83 17.11 20.97
MPI-ESM-MR 2085 382.62 30.71 16.78 23.74
Ensemble 584.04 28.82 16.92 22.87
Table 6. Projected mean changes in multi-model ensemble in Tmax, Tmin and rainfall during 2010-2039/1971-2000, 2040-2069/1971-2000 and 2070-2099/1971-2000 (RCP4.5, RCP8.5).
RCP4.5 RCP8.5
2010-2039 2040-2069 2070-2099 2010-2039 2040-2069 2070-2099
Rainfall (mm) 15.64 67.94 34.35 -7.88 14.91 -221.48
Tmax (oC) 0.64 0.82 0.97 0.69 0.86 0.97
Tmin (oC) 1.20 1.45 1.56 1.20 1.58 2.20
Tmean (oC) 0.92 1.13 1.16 0.94 1.22 1.58
Rainfall % change 1.94 8.43 -27.49 -0.98 1.85 -27.49

2.2. Probability Distribution Functions (PDFs) for Rainfall and Temperature
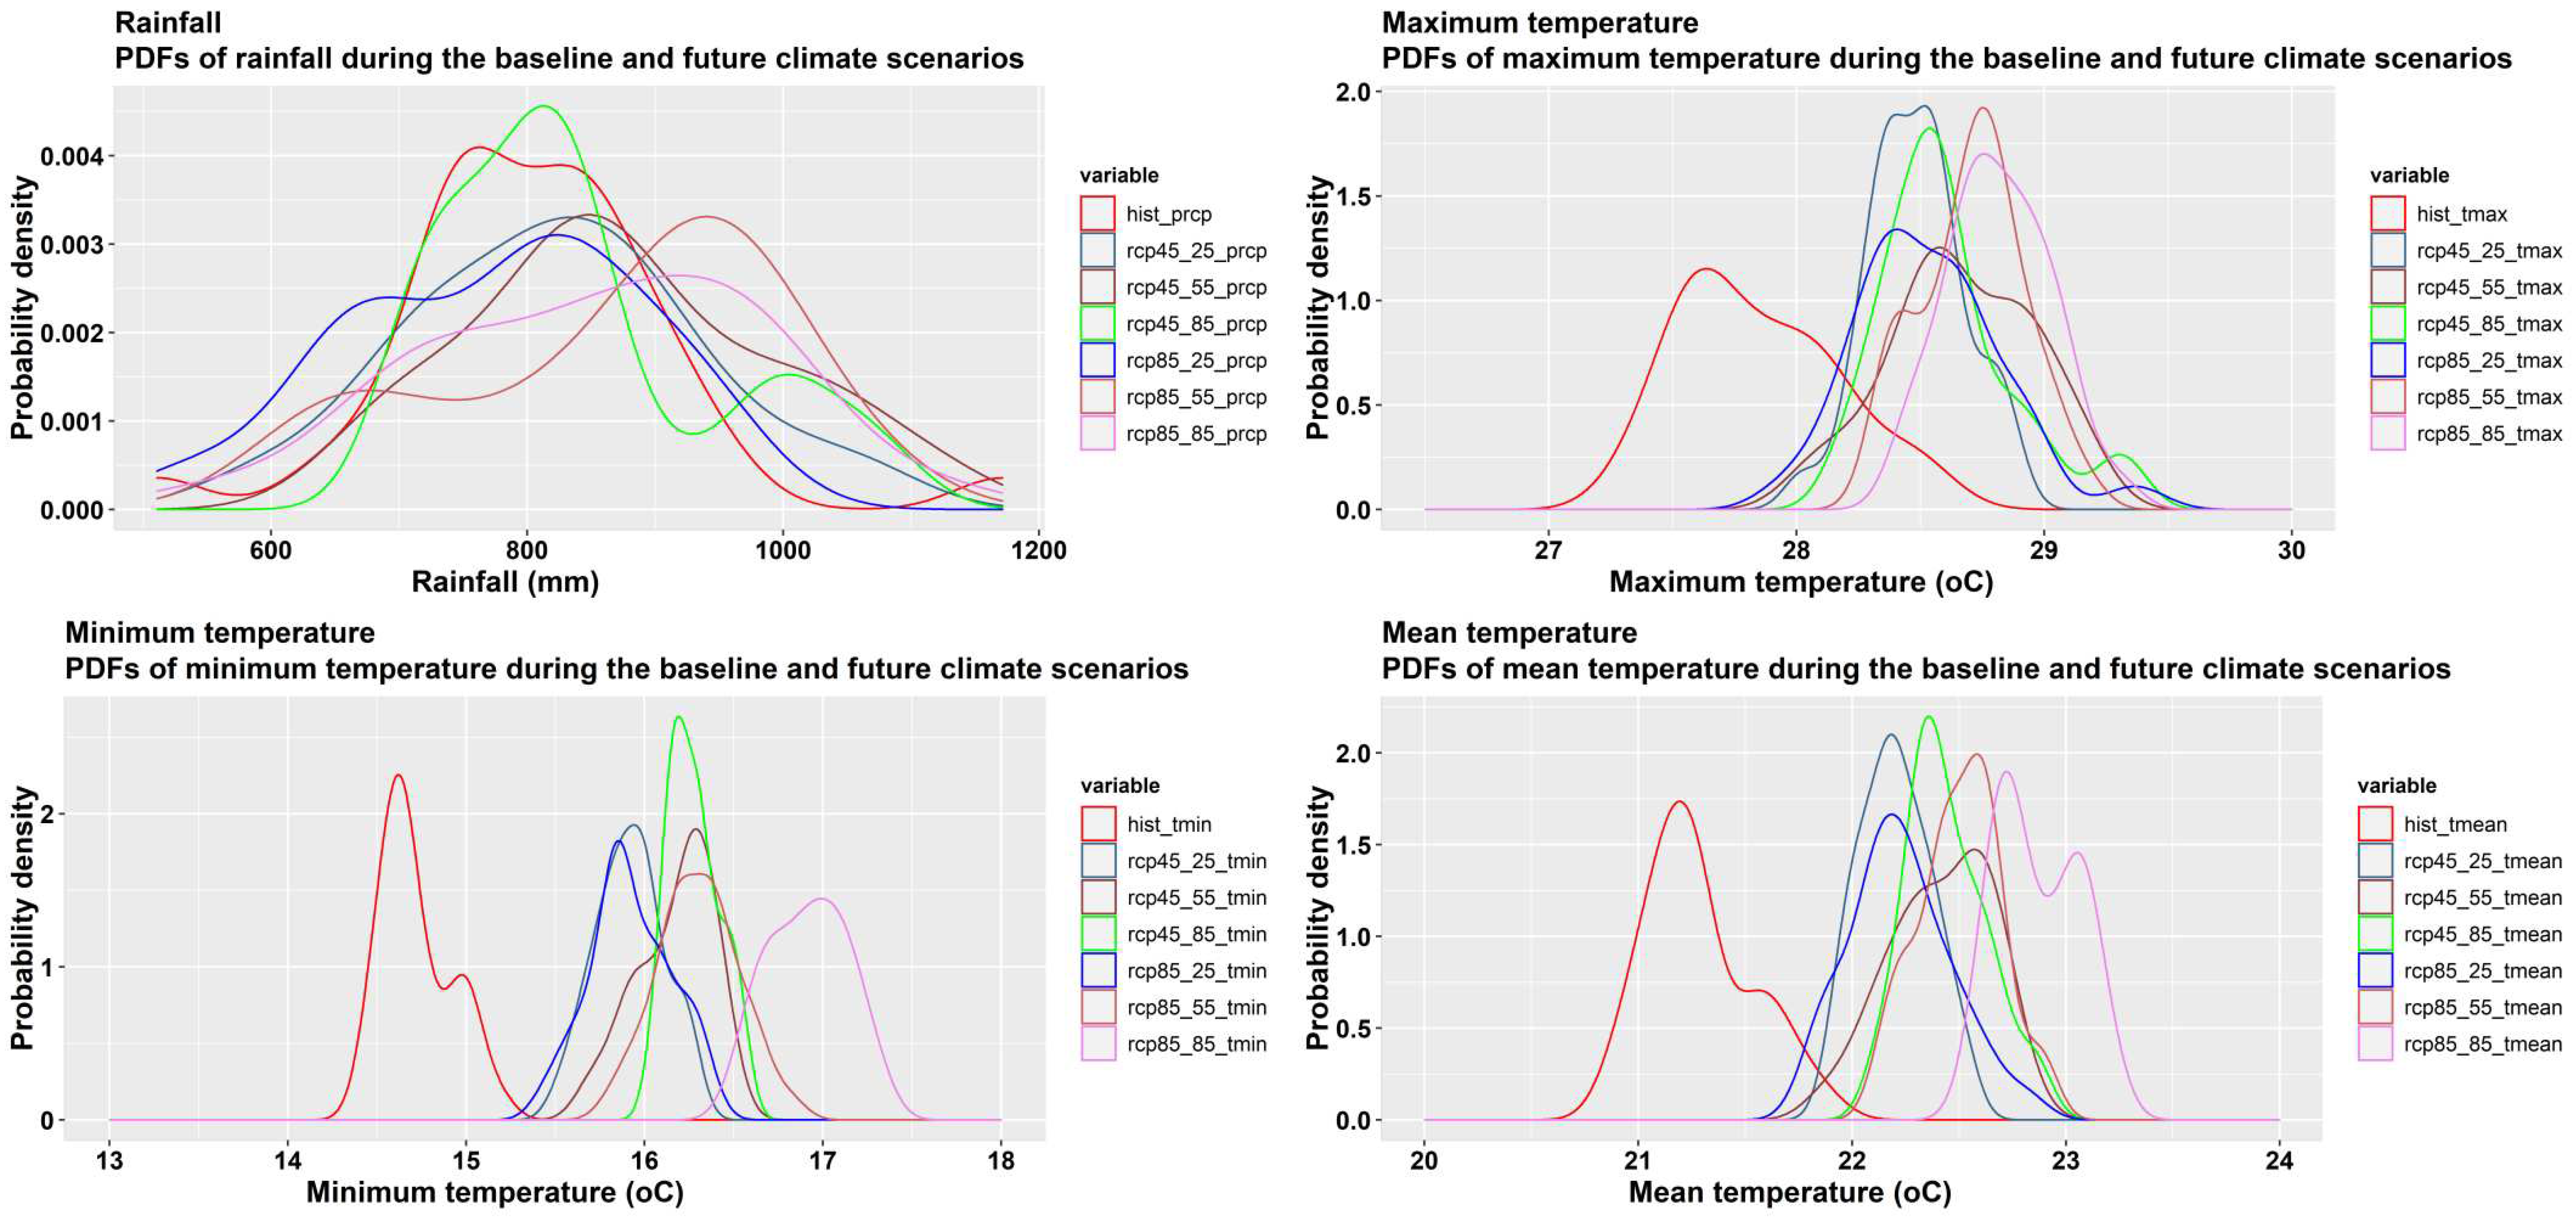
The Probability Distribution Functions for multi-model rainfall and temperature ensemble are shown in Figure 2. The PDFs shows that rainfall will increase/or decrease under future climate scenarios. The PDFs for future climate scenarios show a horizontal shift relative to the historical (1971-2000). The PDFs shows that maximum, minimum and mean temperature will increase under future climate scenarios 2010-2039 (RCP4.5, RCP8.5)/1971-2000, 2040-2069 (RCP4.5, RCP8.5)/1971-2000 and 2070-2099 (RCP4.5, RCP8.5)/1971-2000.
Figure 2. Probability Distribution Functions for multi-model rainfall, maximum, minimum and mean temperature ensemble for the baseline and future climate (2010-2039, 2040-2069, 2070-2099 [RCP4.5, RCP8.5]) scenarios.
Preprints 97700 g002

2.3. Biophysical Analysis of Maize Yield

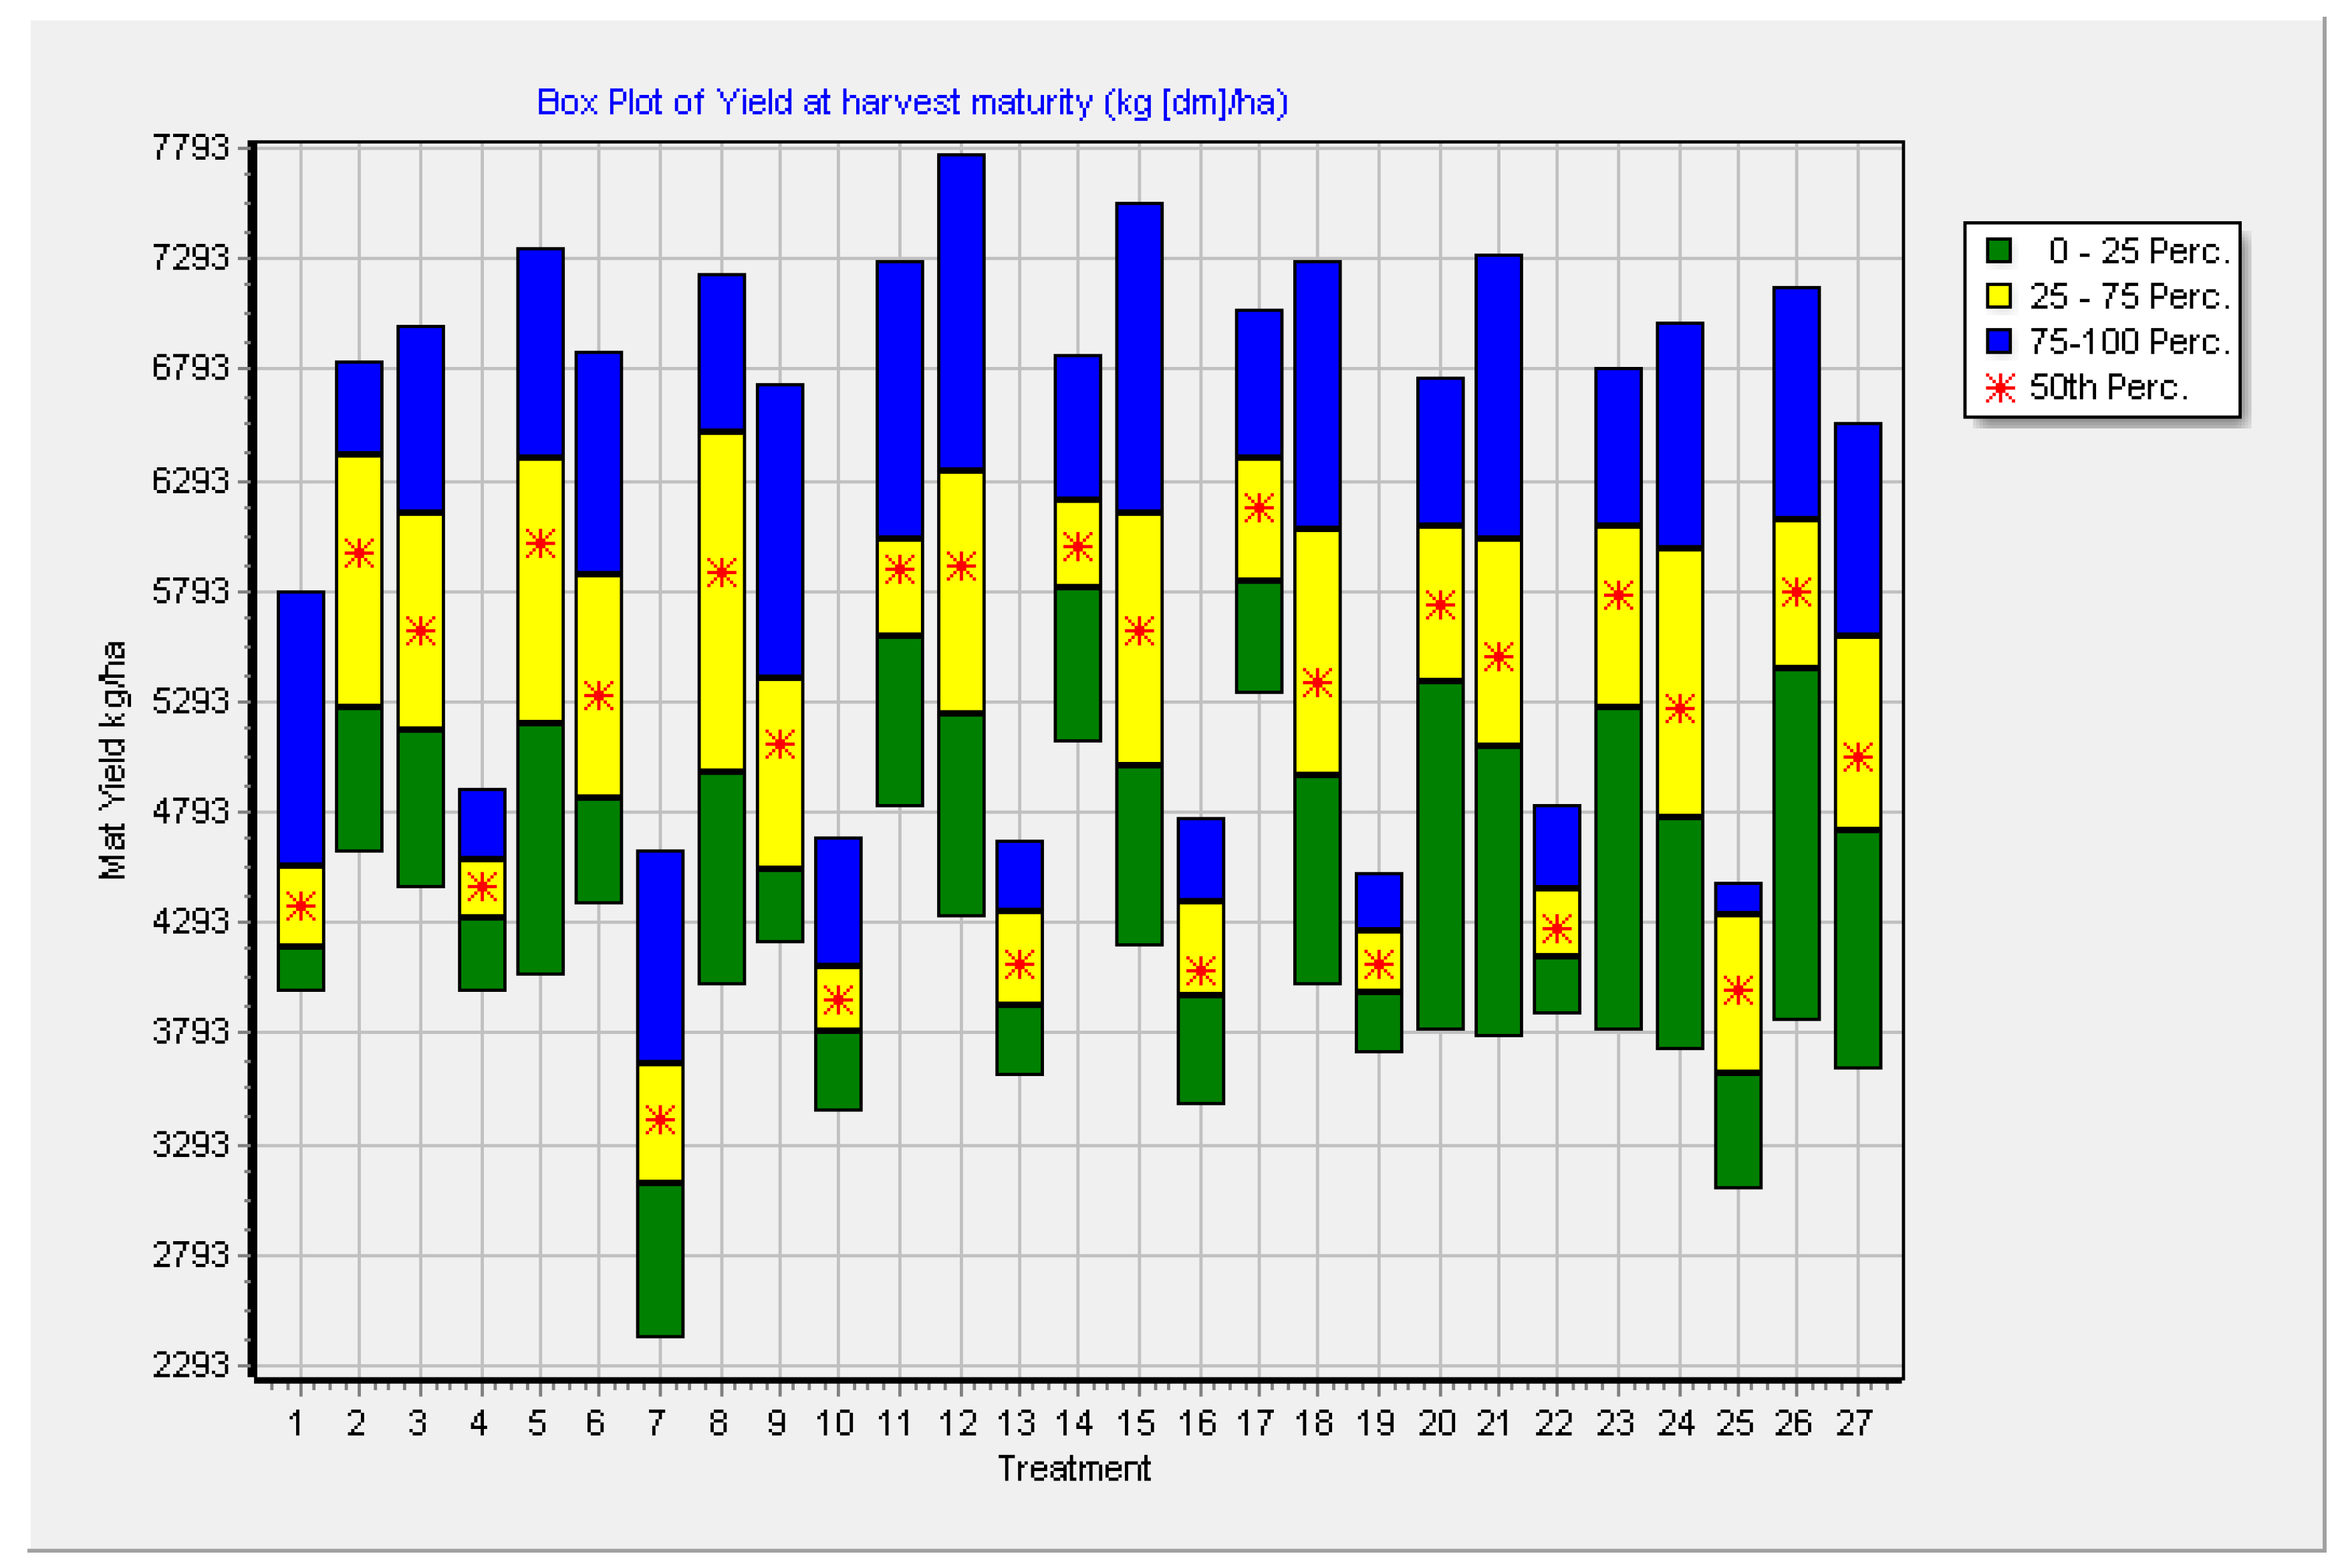
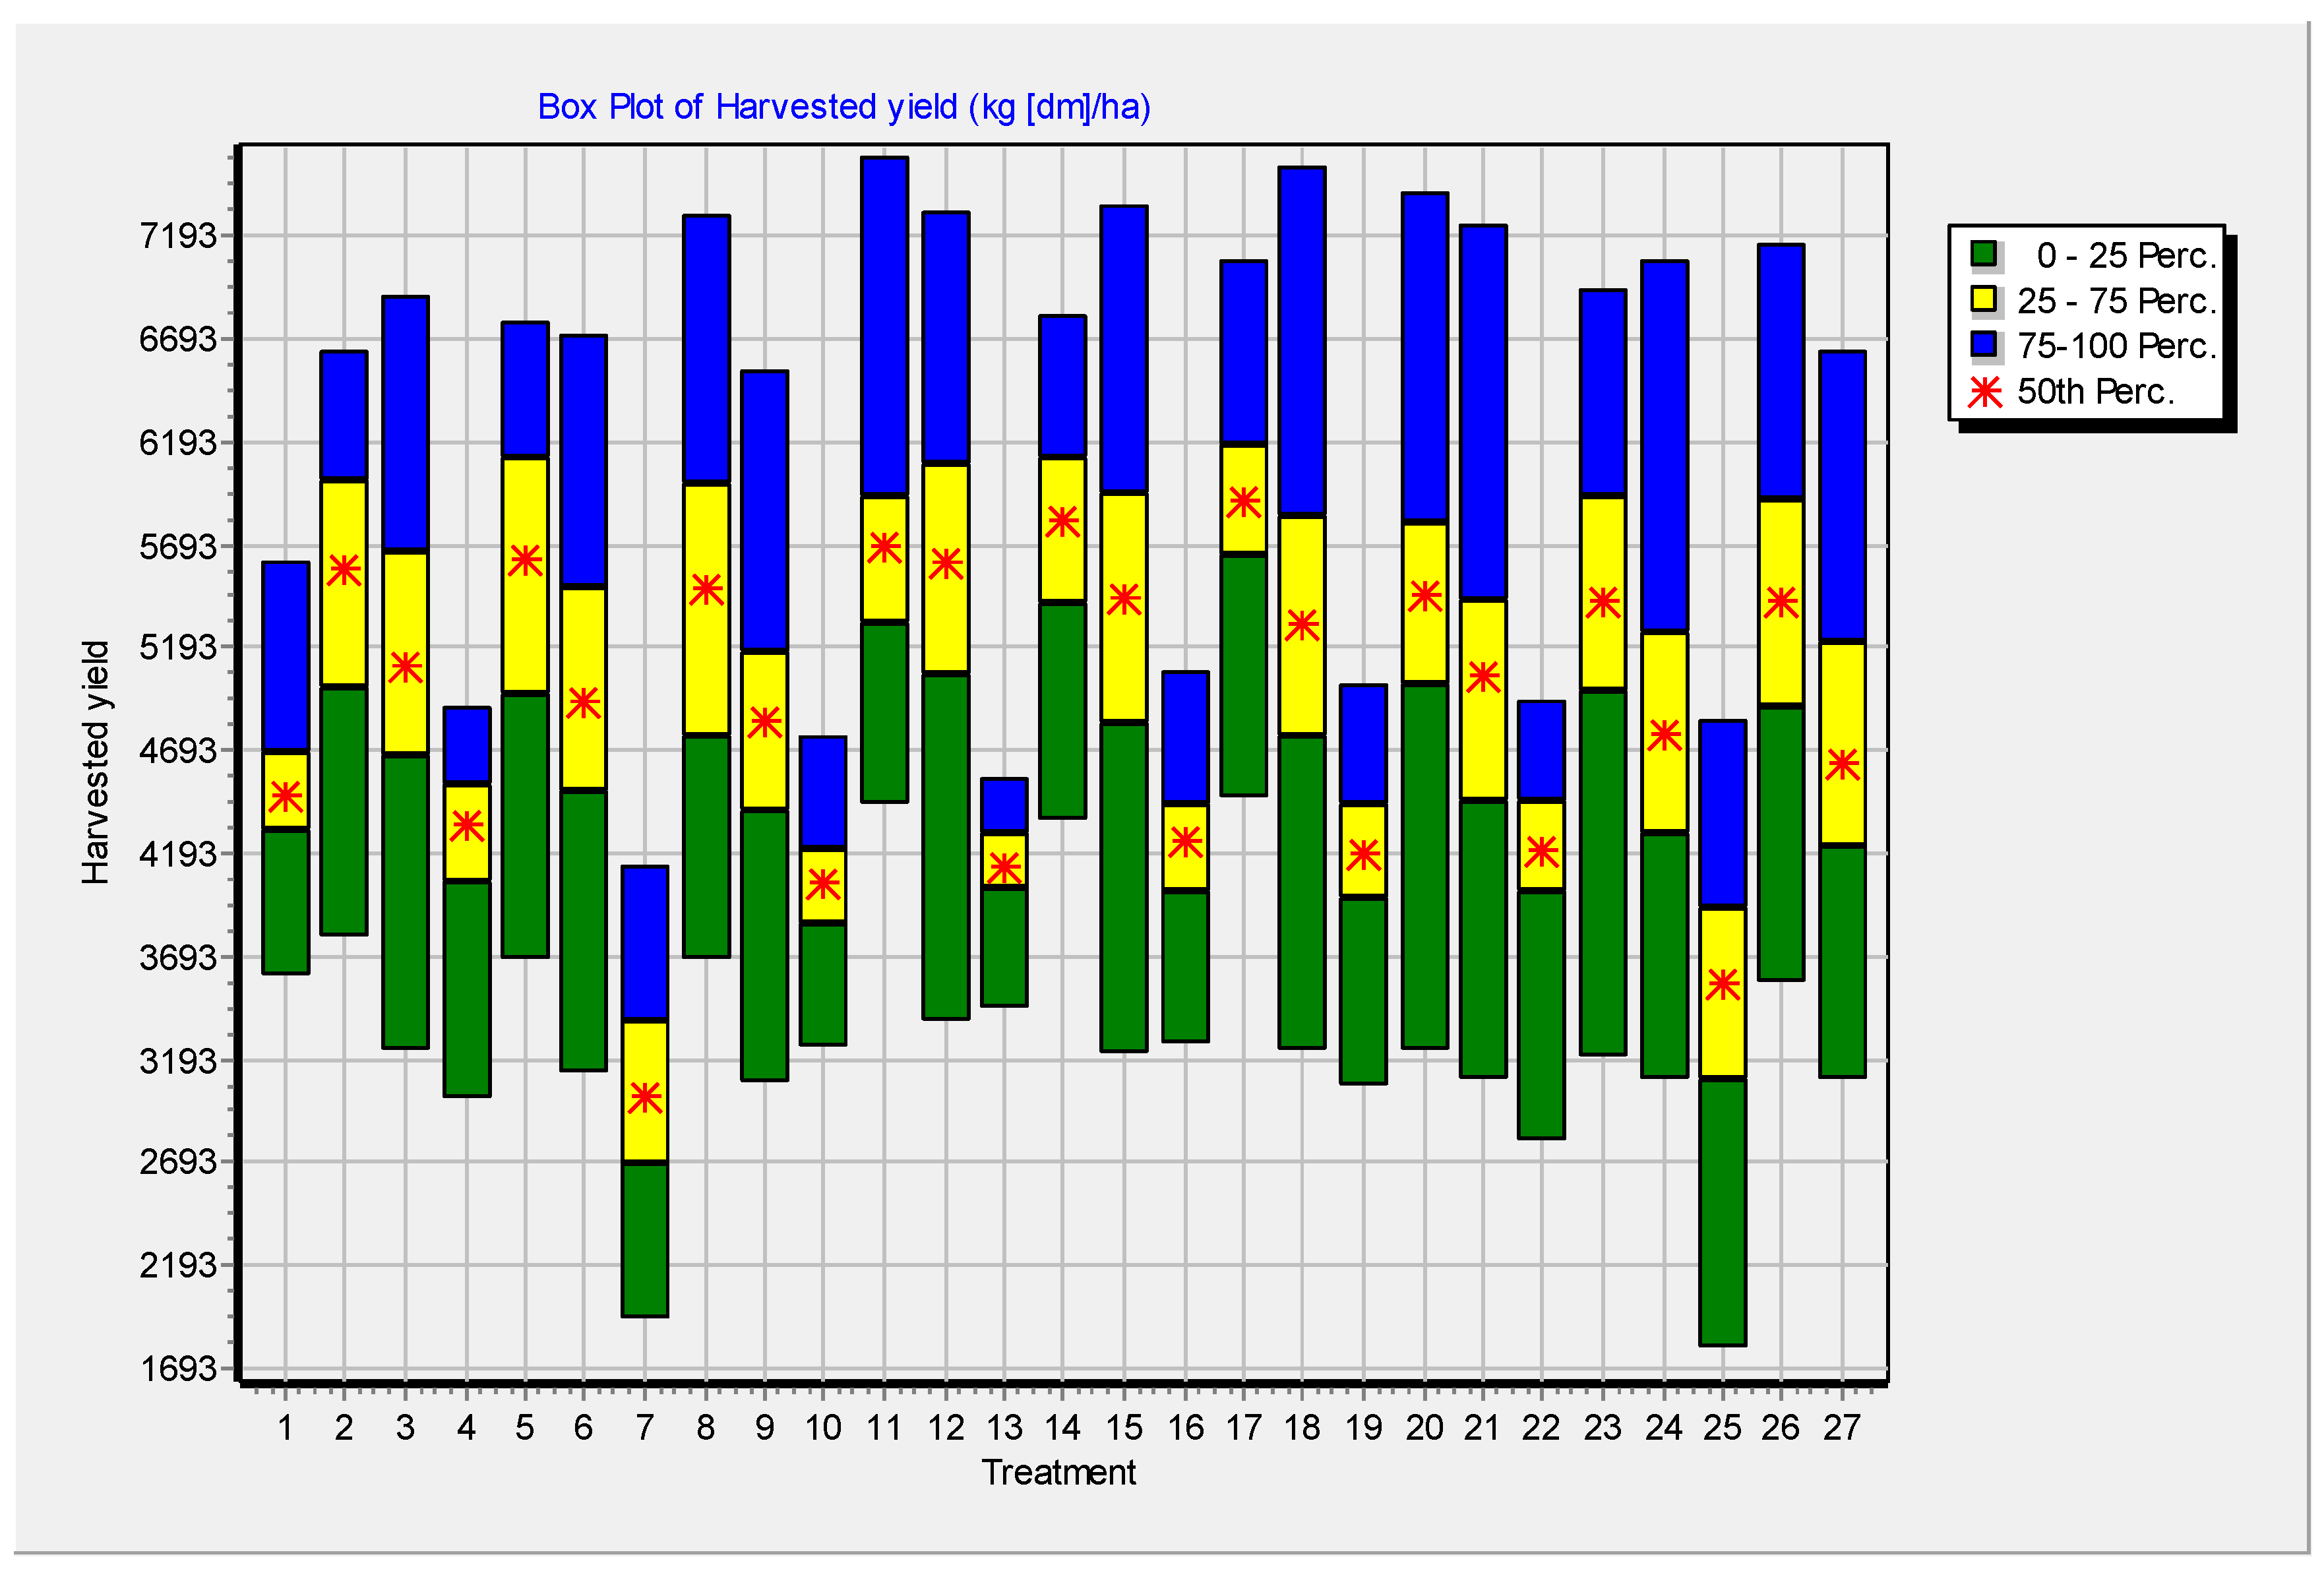
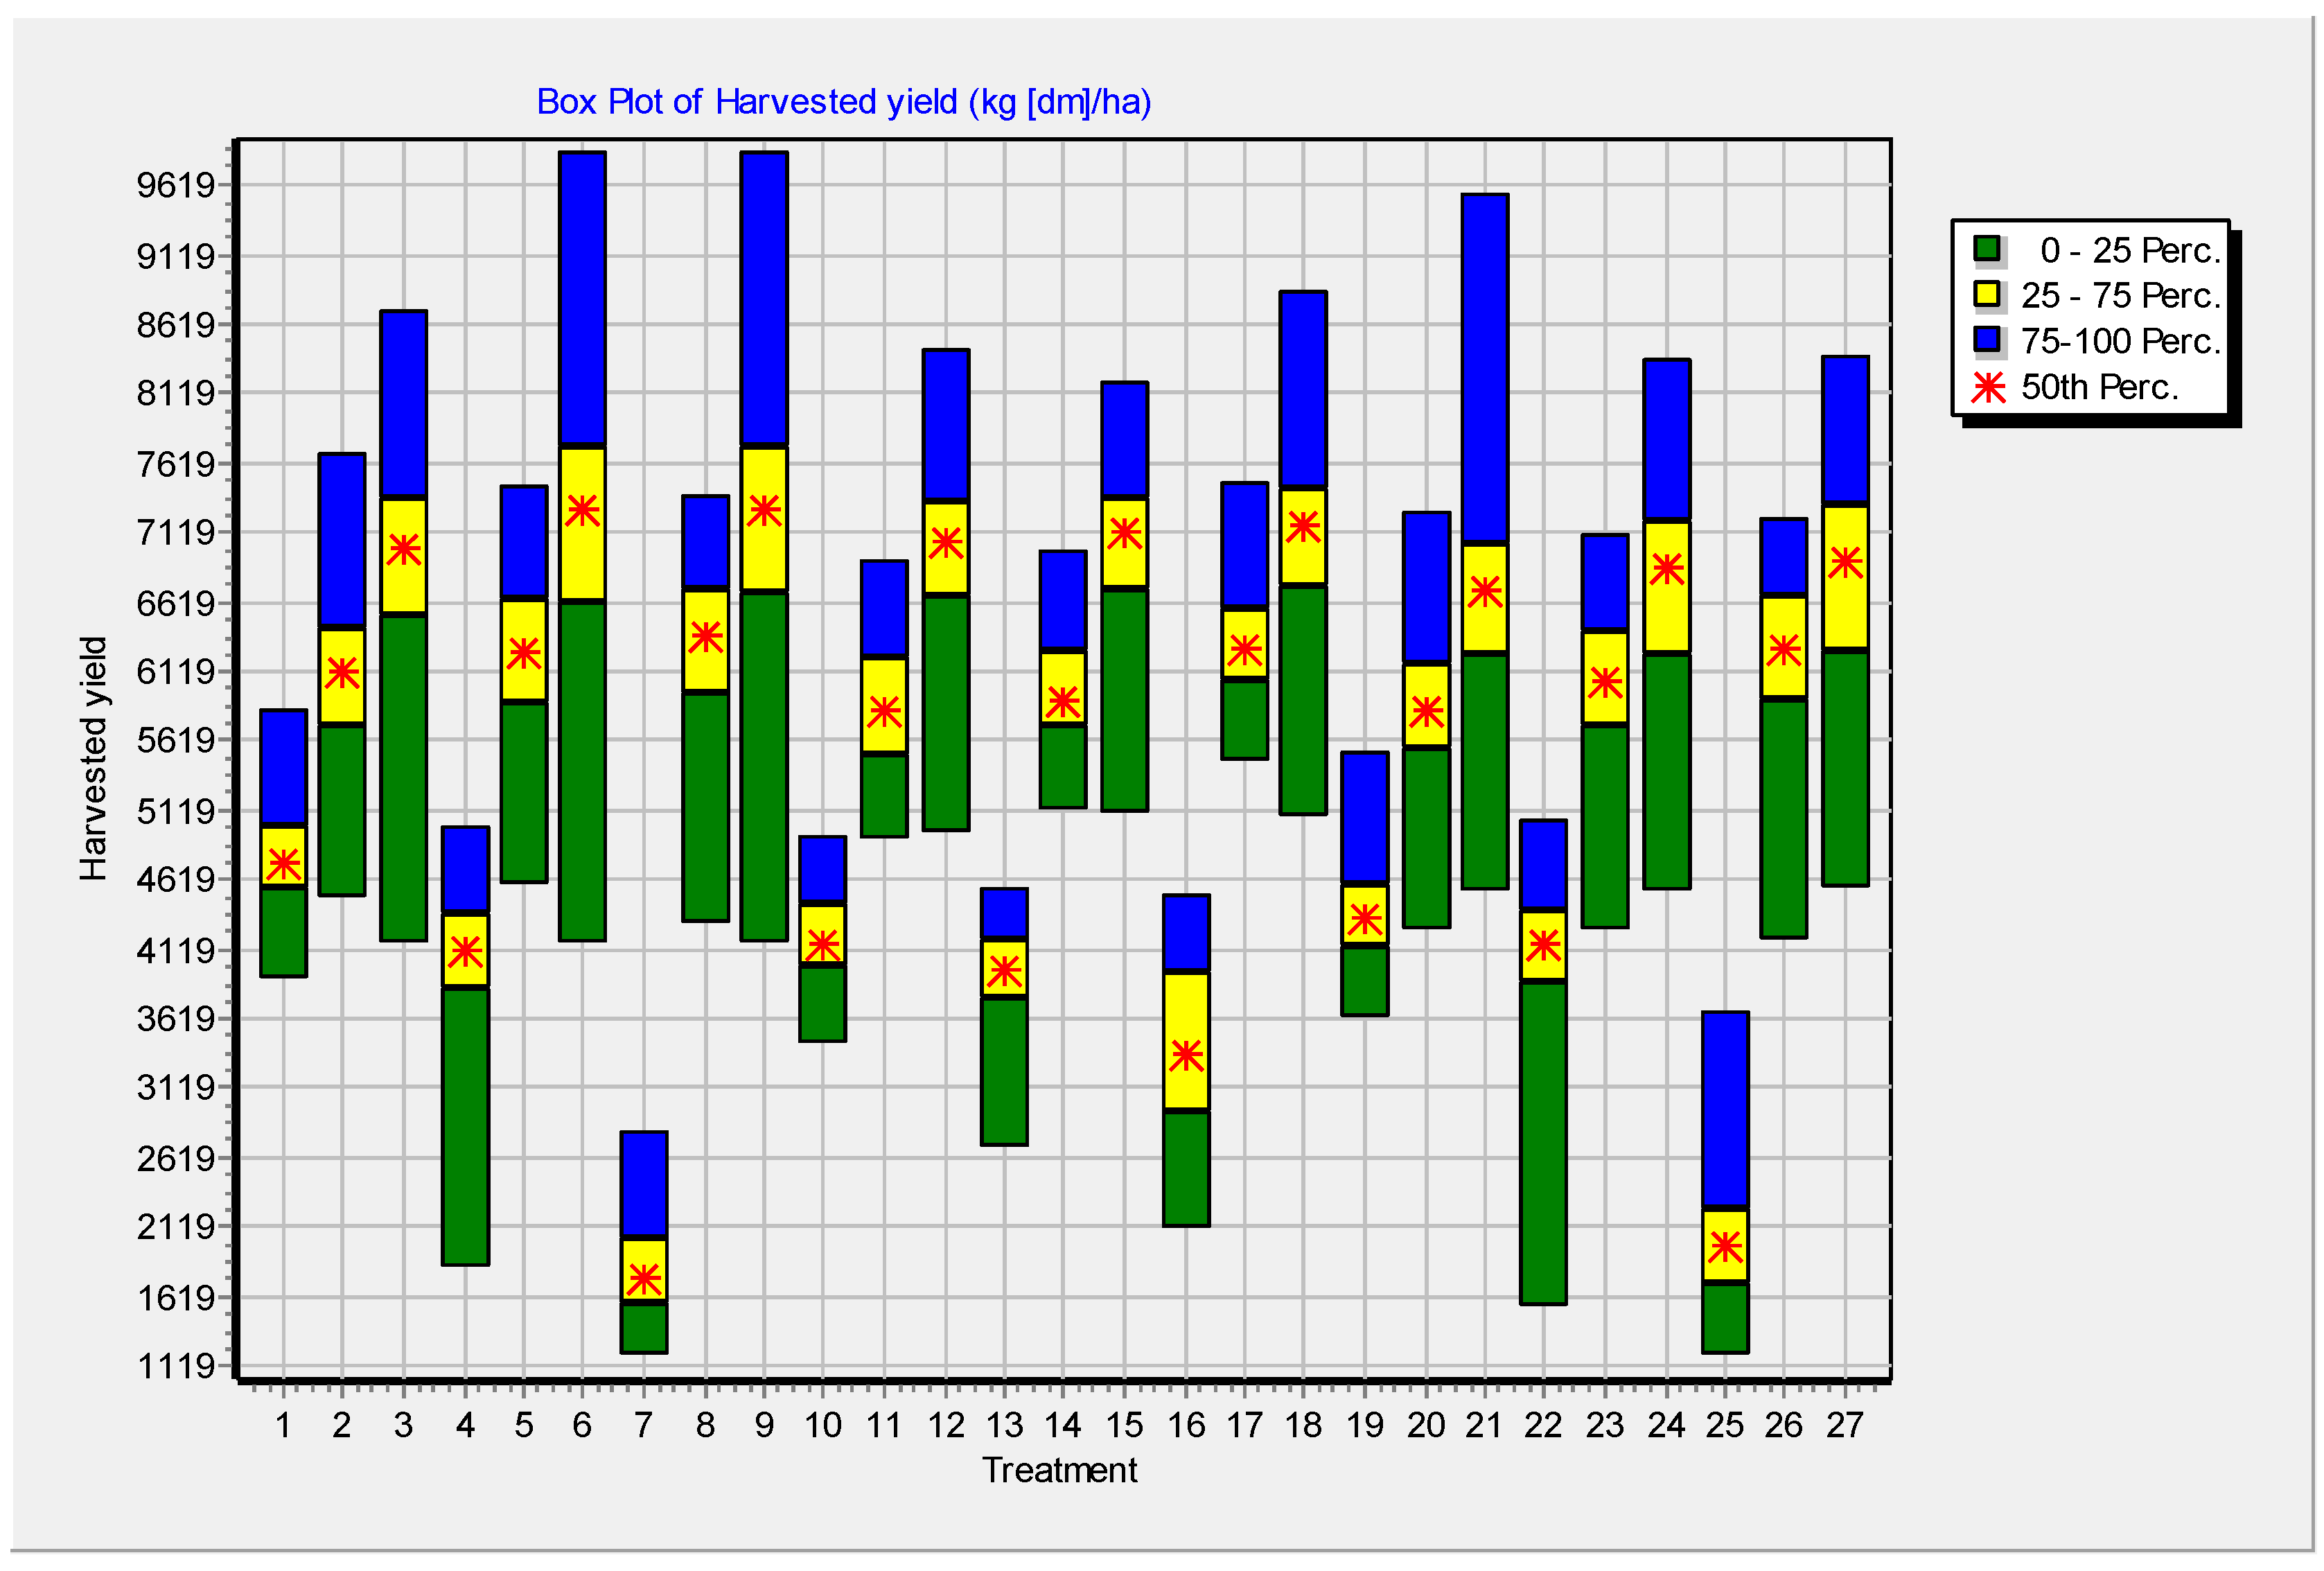
The box plots show the maize yield responses to N treatments effects. Simulated mean grain yields for 30 years using the seasonal analysis tool in DSSAT v4.7 are presented in Table 7. Maize cultivars PIO30G19, PIO30B50 and ZMS606 were simulated using SDs, and nitrogen fertilizer rate for the baseline and future climate scenarios. The grain yield under baseline and future climate scenarios using multi-model ensembles are shown in Table 7, Figure 3, Figure 4 and Figure 5. The application of 66 kg N ha-1 (N1) will increase grain yield for PIO30G19 at SD1 and SD3 during 2025, 2055 and 2085 under both scenarios (RCP4.5, RCP8.5). Further, grain yield will increase with application of 198 kg N ha-1 for PIO30G19 at SD2. At SD2 with the application of 132 kg N ha-1, grain yield for ZMS606 will increase at all future climate scenarios. Grain yield at high soil fertility (nitrogen fertilizer) accompanied by delaying the sowing (SD) will reduce maize yield in future. Further, grain yield will increase for PIO30G19 at SD1 (N2, N3) and SD3 (N3) (Table 7) under RCP8.5. On the other hand, grain yield for PIO30B50 will increase under future climate scenario at SD1 with 132 and 198 kg N ha-1.
Grain yield will be statistically significant at 95% confidence interval (CI) for PIO30G19 at SD2 (6.81 [2025], 6.93 [2055], 7.14 kg ha-1 [2085]) and SD3 (6.70 [2025], 6.53 [2055], 6.68 kg ha-1 [2085]) with 198 kg N ha-1 during 2025, 2050 and 2085 under RCP8.5 scenario. Moreover, grain yield with 198 kg N ha-1 at SD2 (7.24 kg ha-1 [2085]) and SD3 (6.66 kg ha-1 [2055], 6.83 kg ha-1 [2085]) for the ZMS606 will be statistically significant at 95% CI.
Using the pooled data, the projected percent in grain yield would be -27 to 22.95%, -25.37 to 25.89%, -26.56 to 22.00%, -55.78 to 33.72%, -57.37 to 31.95 and -53.81 to 36.49% during 2010-2039/1971-2000 (RCP4.5), 2040-2069/1971-2000 (RCP4.5), 2070-2099/1971-2000 (RCP4.5), 2010-2039/1971-2000 (RCP8.5), 2040-2069/1971-2000 (RCP8.5) and 2070-2099/1971-2000 (RCP8.5), respectively. The RCP8.5 scenarios will experience varying degrees of decrease and increase in grain yield.
Table 7. Biophysical analysis of grain yield for the baseline and future climate scenarios (RCP4.5, RCP8.5).
Mean Grain Yield Grain Yield under RCP4.5 Grain Yield under RCP8.5
1971-2000 SD 2025 2055 2085 2025 2055 2085
1 SD1_v1n1 4402 342 4492.8 4550.87 4440.33 4854.73 4634.43 4787.07
2 SD1_v1n2 5849 659 5725.23 5374.3 5369.93 5979.1 6089.23 6222.07
3 SD1_v1n3 5658 715 5051.93 5192.9 5264.9 6948.53 6906.63 6819.9
4 SD2_v1n1 4456 210 4086.8 4006.17 3984.43 4197.43 4285.73 4140.3
5 SD2_v1n2 5877 790 5610.37 5889.6 5518.43 5916.03 5738.77 5915.73
6 SD2_v1n3 5392 653 5493.67 5693.17 5465.83 6805.20* 6926.00* 7138.37*
7 SD3_v1n1 3392 538 4170.83 4270.5 4138.63 4403.13 4312.2 4422.2
8 SD3_v1n2 5831 901 5378.17 5412.3 5345.7 5914.73 5693 5981
9 SD3_v1n3 5094 627 4860.53 5011 5051.4 6702.10* 6532.70* 6683.80*
10 SD1_v2n1 3970 281 4212.4 4308.67 4216.73 3932.2 3989.1 4161.67
11 SD1_v2n2 5854 465 5750.33 5419.97 5366.33 6210.07 6266.9 6354.5
12 SD1_v2n3 5789 824 4847.03 5013.23 5098.27 7140.3 7086.5 7019.13
13 SD2_v2n1 4111 266 4188.3 4151.97 4066.7 3949.83 4003.87 3972.5
14 SD2_v2n2 5984 405 5696.13 5911.73 5683.23 6035.3 5991.7 6025.67
15 SD2_v2n3 5562 807 5352.23 5520.13 5330.9 6868.17 6959.17 7171.57
16 SD3_v2n1 4150 322 4139.07 4224.8 4193.5 3862.8 4036.03 4028.33
17 SD3_v2n2 6160 404 5370.5 5401.17 5378.83 6087.9 5872.53 6105.67
18 SD3_v2n3 5422 792 4688.43 4879.4 4879.63 6784.97 6613.13 6806.97
19 SD1_v3n1 4121 223 2982.47 3075.27 3026.1 1822.13 1756.6 1903.2
20 SD1_v3n2 5690 637 5691.43 5306.07 5298.1 6239.23 6194.77 6402.47
21 SD1_v3n3 5523 894 4701.03 4836.37 4916.3 7195.73 7094.17 7071.27
22 SD2_v3n1 4289 234 4196.5 4325.53 4148.13 3481.53 3358.13 3400.87
23 SD2_v3n2 5676 697 5895.93 6041.3 5765.43 6373.37 6208.4 6321.63
24 SD2_v3n3 5308 854 5265.97 5397.83 5293.93 6957.1 7003.3 7244.53*
25 SD3_v3n1 3931 436 3433.6 3403.5 3717.13 1891.8 2048 2106.73
26 SD3_v3n2 5766 752 5379.53 5421.73 5474.4 6288.17 5992.77 6510.1
27 SD3_v3n3 5087 785 4543.07 4777.17 4762.8 6801.9 6661.40 6831.27*
SD1 = first SD; SD2 = second SD; SD3 = third SD; V1 = PIO30G19; V2 = PIO30B50; V3 = ZMS606; N1 = 66 kg N ha-1; N2 = 132 kg N ha-1; N3 = 198 kg N ha-1; 2025 = 2010-2039; 2055 = 2040-2069; 2085 = 2070-2099; * = statistically significant at 95% CI.
Figure 3. Multi-model ensemble mean grain yield at harvest maturity (kg [dm]/ha) from 1971-2000. SD1 = first SD; SD2 = second SD; SD3 = third SD; V1 = PIO30G19; V2 = PIO30B50; V3 = ZMS606; N1 = 66 kg N ha-1; N2 = 132 kg N ha-1; N3 = 198 kg N ha-1; 1 = SD1_v1n1; 2 = SD1_v1n2; 3 = SD1_v1n3; 4 = SD2_v1n1; 5 = SD2_v1n2; 6 = SD2_v1n3; 7 = SD3_v1n1; 8 = SD3_v1n2; 9 = SD3_v1n3; 10 = SD1_v2n1; 11 = SD1_v2n2; 12 = SD1_v2n3; 13 = SD2_v2n1; 14 = SD2_v2n2; 15 = SD2_v2n3; 16 = SD3_v2n1; 17 = SD3_v2n2; 18 = SD3_v2n3; 19 = SD1_v3n1; 20 = SD1_v3n2; 21 = SD1_v3n3; ; 22 = SD2_v3n1; 23 = SD2_v3n2; 24 = SD2_v3n3; 25 = SD3_v3n1; 26 = SD3_v3n2; 27 = SD3_v3n3.
Preprints 97700 g003
Figure 4. Multi-model ensemble mean grain yield at harvest maturity (kg [dm]/ha) from 2010-2099 under RCP4.5. SD1 = first SD; SD2 = second SD; SD3 = third SD; V1 = PIO30G19; V2 = PIO30B50; V3 = ZMS606; N1 = 66 kg N ha-1; N2 = 132 kg N ha-1; N3 = 198 kg N ha-1; 1 = SD1_v1n1; 2 = SD1_v1n2; 3 = SD1_v1n3; 4 = SD2_v1n1; 5 = SD2_v1n2; 6 = SD2_v1n3; 7 = SD3_v1n1; 8 = SD3_v1n2; 9 = SD3_v1n3; 10 = SD1_v2n1; 11 = SD1_v2n2; 12 = SD1_v2n3; 13 = SD2_v2n1; 14 = SD2_v2n2; 15 = SD2_v2n3; 16 = SD3_v2n1; 17 = SD3_v2n2; 18 = SD3_v2n3; 19 = SD1_v3n1; 20 = SD1_v3n2; 21 = SD1_v3n3; ; 22 = SD2_v3n1; 23 = SD2_v3n2; 24 = SD2_v3n3; 25 = SD3_v3n1; 26 = SD3_v3n2; 27 = SD3_v3n3.
Preprints 97700 g004
Figure 5. Multi-model ensemble mean grain yield at harvest maturity (kg [dm]/ha) from 2010-2099 under RCP8.5. SD1 = first SD; SD2 = second SD; SD3 = third SD; V1 = PIO30G19; V2 = PIO30B50; V3 = ZMS606; N1 = 66 kg N ha-1; N2 = 132 kg N ha-1; N3 = 198 kg N ha-1; 1 = SD1_v1n1; 2 = SD1_v1n2; 3 = SD1_v1n3; 4 = SD2_v1n1; 5 = SD2_v1n2; 6 = SD2_v1n3; 7 = SD3_v1n1; 8 = SD3_v1n2; 9 = SD3_v1n3; 10 = SD1_v2n1; 11 = SD1_v2n2; 12 = SD1_v2n3; 13 = SD2_v2n1; 14 = SD2_v2n2; 15 = SD2_v2n3; 16 = SD3_v2n1; 17 = SD3_v2n2; 18 = SD3_v2n3; 19 = SD1_v3n1; 20 = SD1_v3n2; 21 = SD1_v3n3; ; 22 = SD2_v3n1; 23 = SD2_v3n2; 24 = SD2_v3n3; 25 = SD3_v3n1; 26 = SD3_v3n2; 27 = SD3_v3n3.
Preprints 97700 g005

2.4. Economic and Strategic Analysis
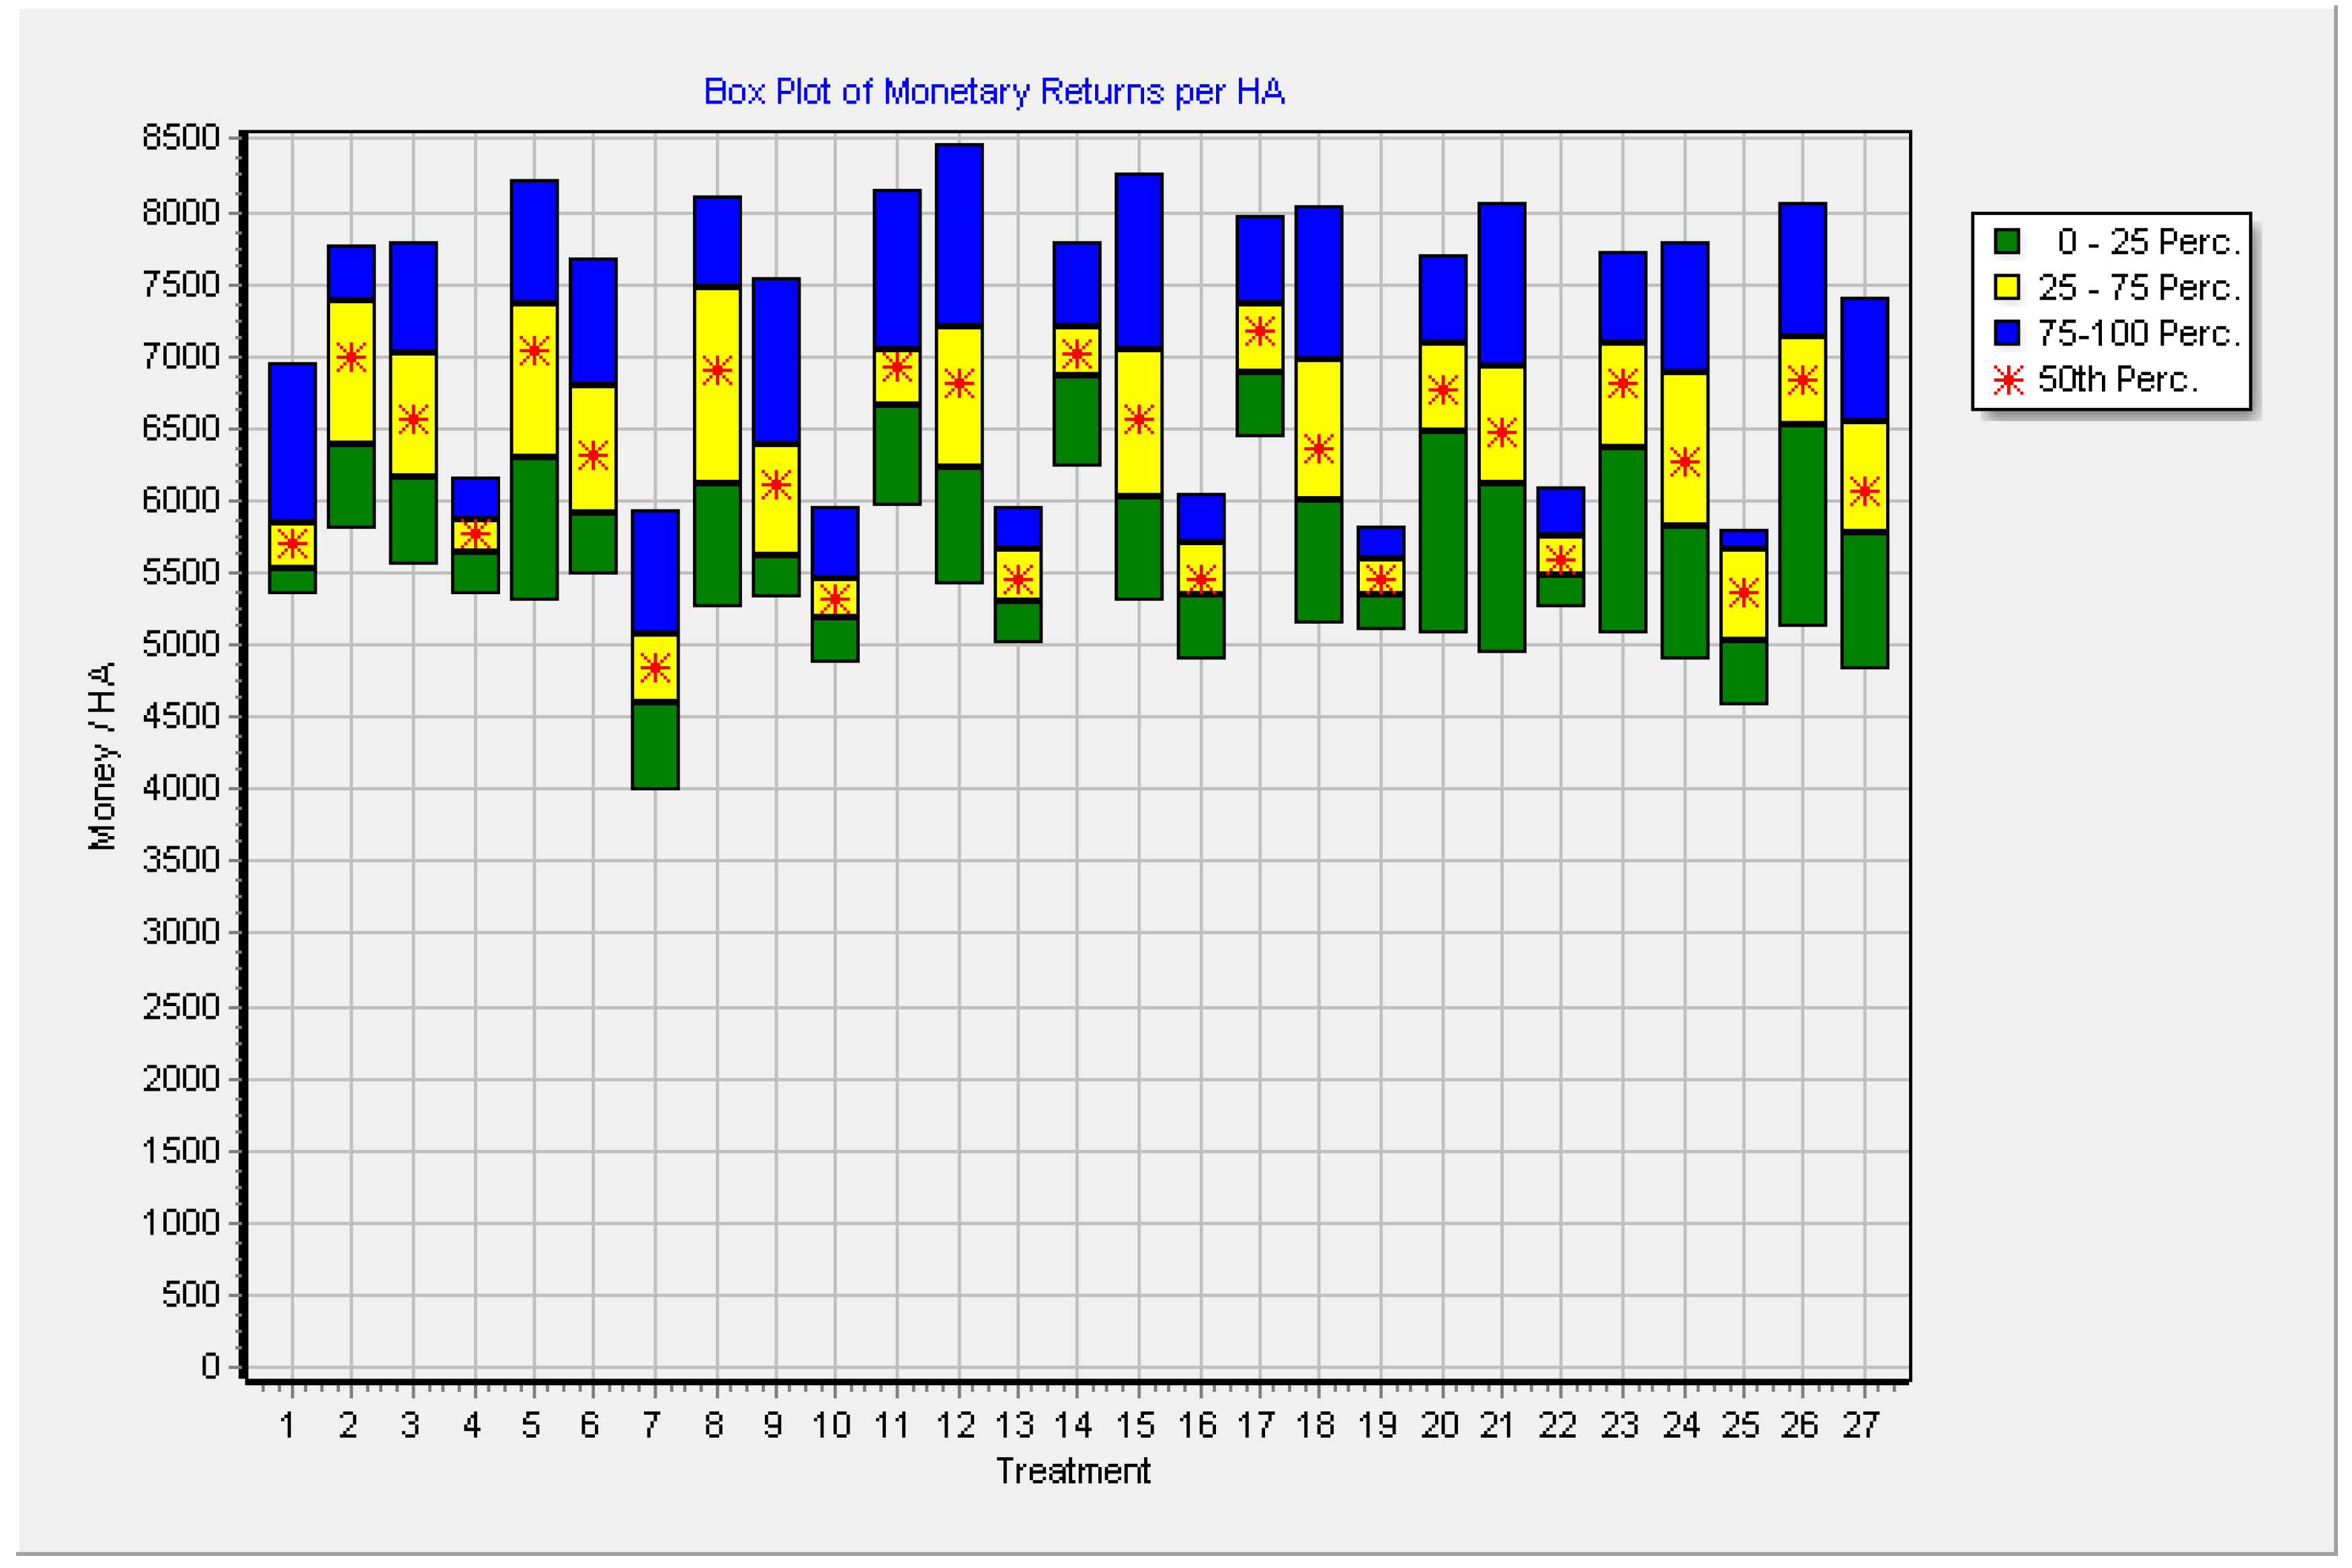
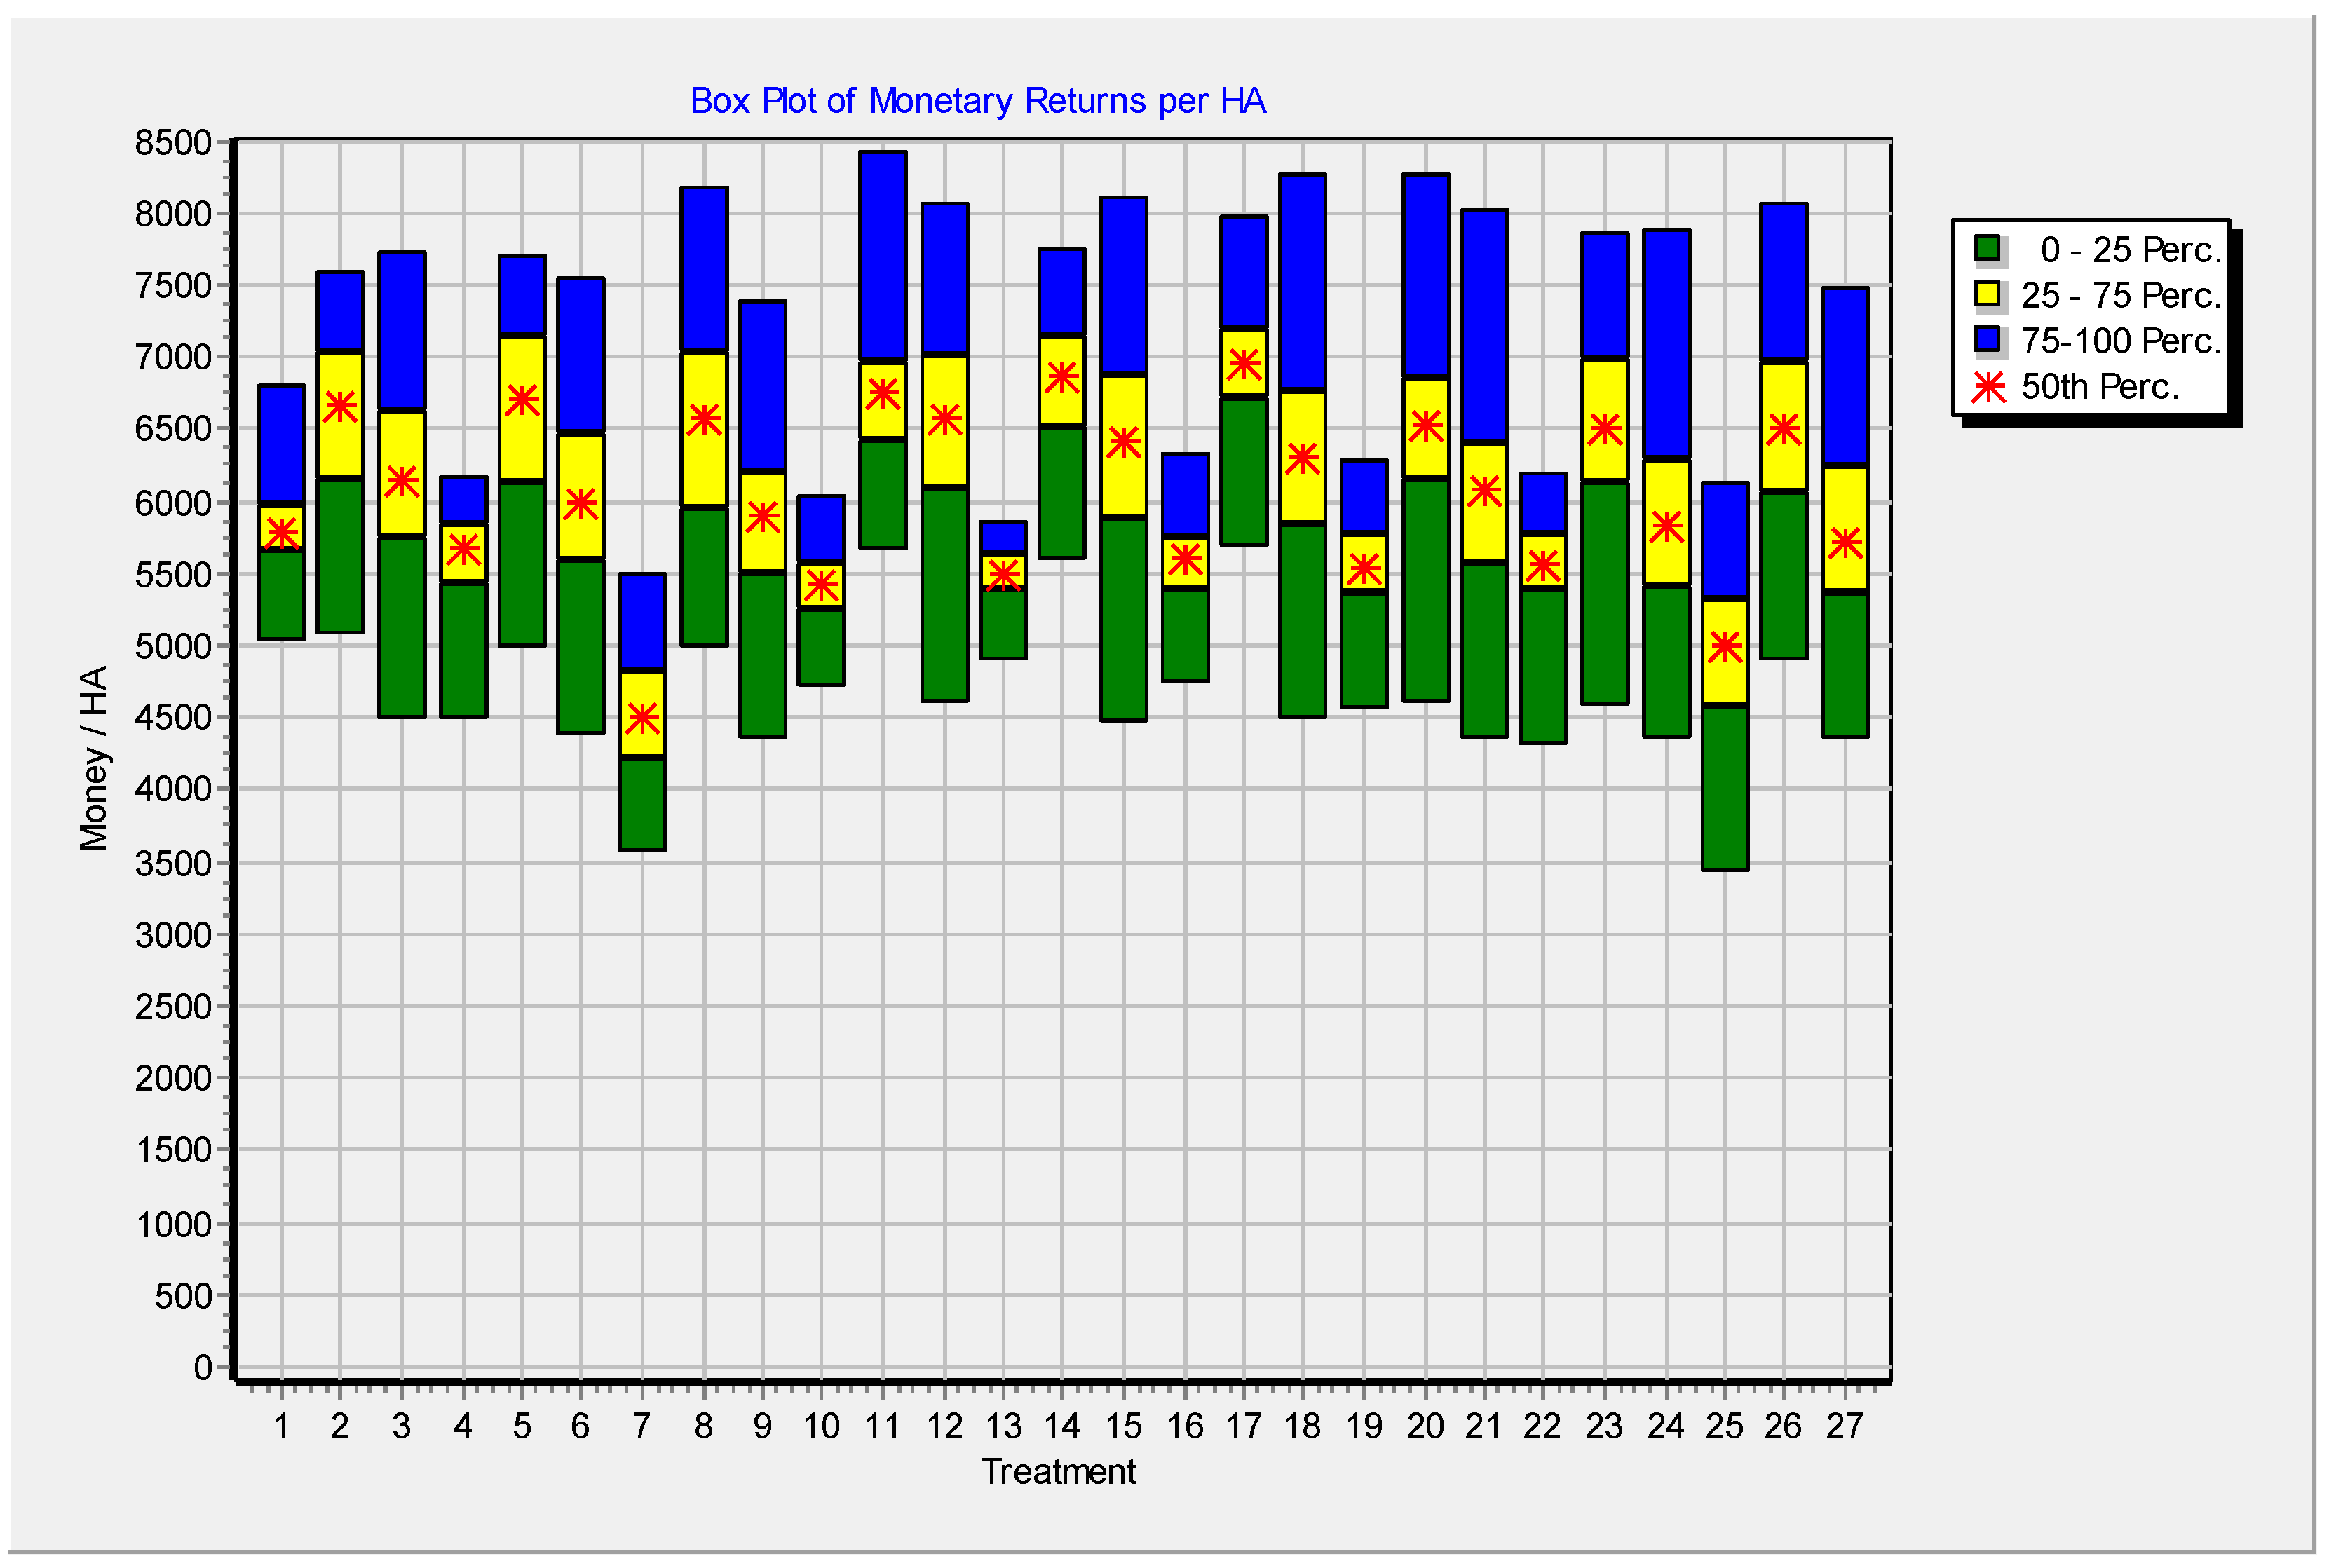
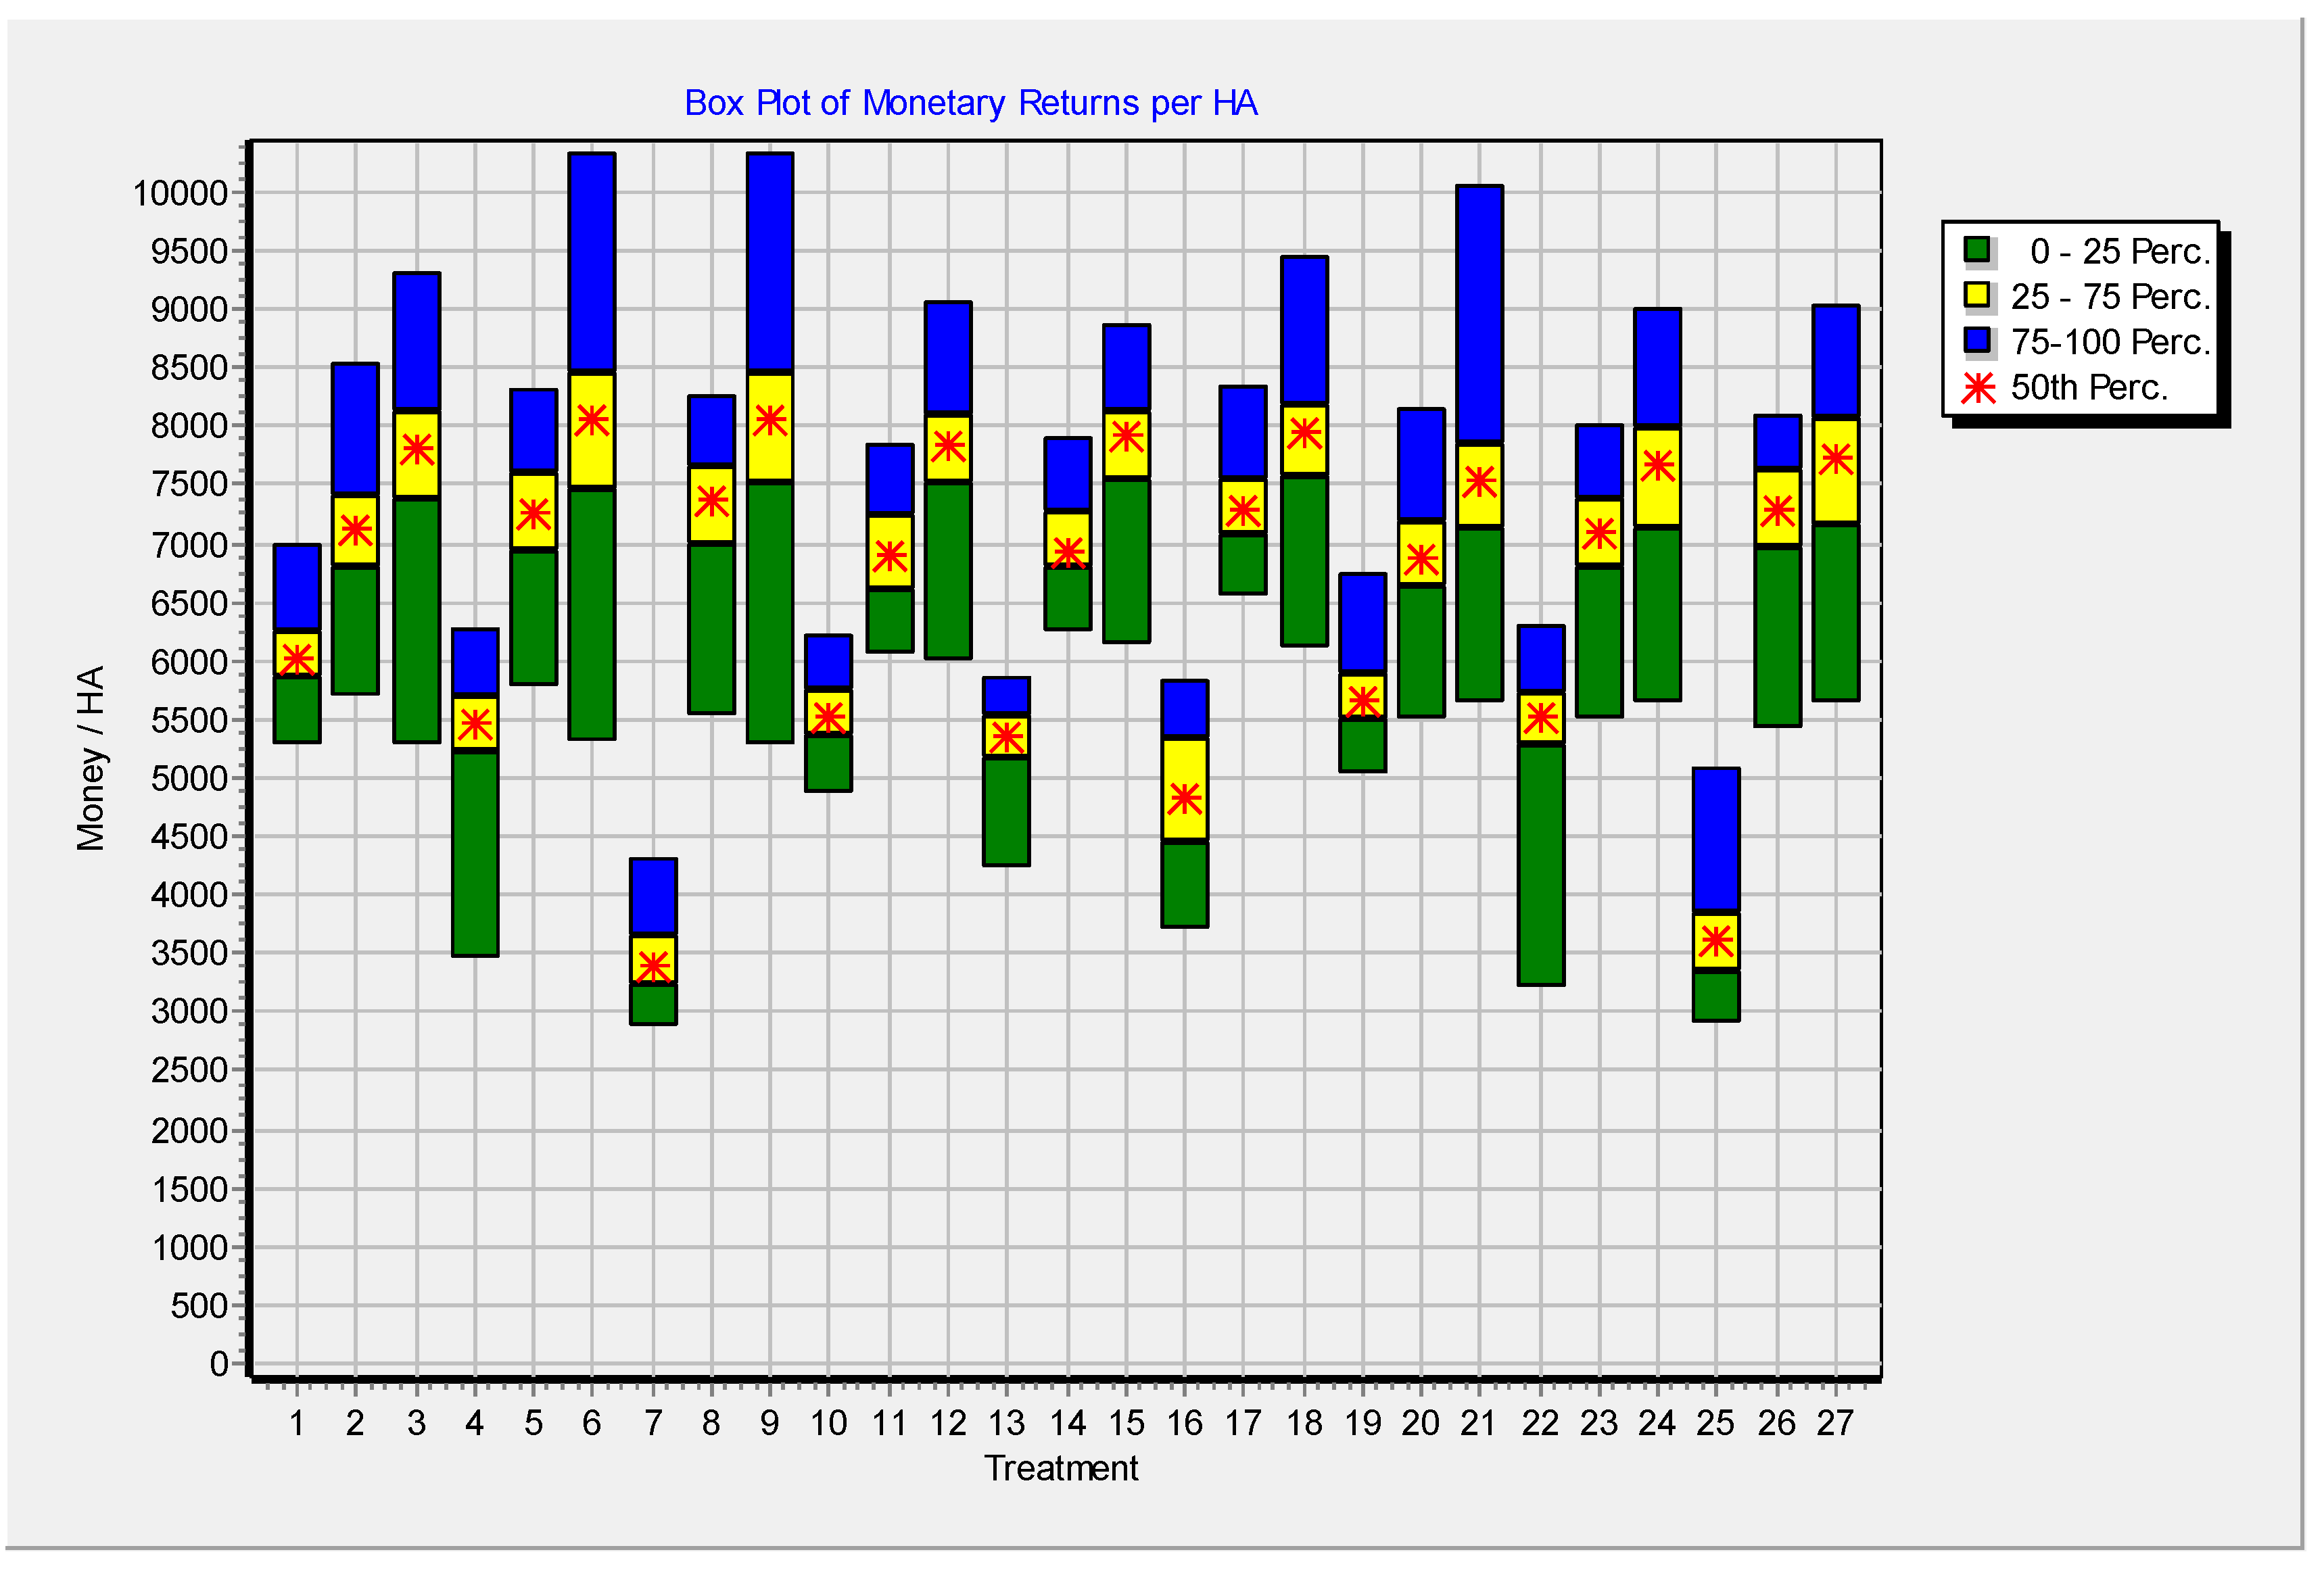
The economic analysis output is a time series of distributions for the gross margin or net return (Figure 5, Figure 6 and Figure 7). The Mean-Gini analysis (Table 8) showed that PIO30B50 maize cultivar under third sowing date with 132 kg N ha-1 was efficient. However, economic analysis shows that PIO30B50 maize cultivar under third sowing date with 132 kg N ha-1 was efficient. However, the economic analysis shows that PIO30B50 maize cultivars under SD3 would be efficient under RCP4.5 (132 kg N ha-1) and RCP8.5 (198 kg N ha-1), respectively. Furthermore, at SD3, PIO30B50 (N2, N3) and PIO30G19 (N3) would be the most dominant management options for maize grain yield under future climate scenarios from 2010-2099.
Figure 6. Economic and strategic analysis using multi-model ensemble mean grain yield at harvest maturity (kg [dm]/ha) from 1971-2000.
Preprints 97700 g006
Figure 7. Economic and strategic analysis using multi-model ensemble mean grain yield at harvest maturity (kg [dm]/ha) from 2010-2099 under RCP4.5.
Preprints 97700 g007
Figure 8. Economic and strategic analysis using multi-model ensemble mean grain yield at harvest maturity (kg [dm]/ha) from 2010-2099 under RCP8.5.
Preprints 97700 g008
Table 8. Dominance analysis of different management strategies using the mean-Gini Dominance: E(x) mean return $/ha and F(x) Gini coefficient $/ha for the baseline and future climate scenarios.
Historical RCP4.5 RCP8.5
Treatment Cultivar E(x) E(x) - F(x) Efficient E(x) E(x) - F(x) Efficient E(x) E(x) - F(x) Efficient
1 SD1N1 30G19 5711.2 5561.9 No 5813.9 5643.1 No 6046.4 5873.8 No
2 SD1N2 30G19 6856.9 6525.1 No 6581.8 6252.6 No 7117.1 6856.4 No
3 SD1N3 30G19 6556.4 6189.5 No 6188.4 5797.1 No 7708.1 7290.4 No
4 SD2N1 30G19 5758.6 5652.9 No 5594.3 5401.4 No 5400.9 5141.4 No
5 SD2N2 30G19 6881.5 6486 No 6601.5 6240.3 No 7276.3 7017.6 No
6 SD2N3 30G19 6321.5 5986.6 No 6026.2 5638.7 No 7876.1 7411.5 No
7 SD3N1 30G19 4831.4 4561.6 No 4518.8 4283 No 3458 3275.6 No
8 SD3N2 30G19 6840.7 6381.1 No 6530.6 6101.4 No 7277.8 6968.8 No
9 SD3N3* 30G19* 6058.1 5742.4 No 5877.6 5520.3 No 7910* 7447.4* Yes*
10 SD1N1 30B50 5329.1 5190.5 No 5399.9 5257.1 No 5560 5415.6 No
11 SD1N2 30B50 6860.7 6636.6 No 6743.3 6473.5 No 6905.2 6665.4 No
12 SD1N3 30B50 6672.1 6255.6 No 6524.8 6160.8 No 7765.3 7450.4 No
13 SD2N1 30B50 5453.8 5317.4 No 5496.9 5382.1 No 5354.7 5205.5 No
14 SD2N2 30B50 6975.8 6774.2 No 6823.6 6555.2 No 7047.1 6827.5 No
15 SD2N3 30B50 6470.9 6062.7 No 6392.5 6020 No 7803.4 7492.3 No
16 SD3N1 30B50 5500.7 5338.4 No 5574.4 5429.5 No 4858.6 4564.3 No
17 SD3N2 30B50 7131.6 6928.2 Yes 6944.7 6719.3 Yes 7297.5 7103.2 No
18 SD3N3 30B50 6347.5 5945.9 No 6320.3 5951.8 No 7864 7534.6 Yes
19 SD1N1 ZMS606 5462.6 5349.1 No 5547.8 5369.2 No 5711.3 5530 No
20 SD1N2 ZMS606 6716.6 6404.7 No 6483.7 6144.3 No 6910.5 6656.4 No
21 SD1N3 ZMS606 6437 5982.8 No 6015.7 5640.2 No 7485.4 7125.3 No
22 SD2N1 ZMS606 5611.6 5493.5 No 5541.2 5351.7 No 5355 5030.4 No
23 SD2N2 ZMS606 6704 6355.9 No 6487.9 6123.7 No 7051 6793.6 No
24 SD2N3 ZMS606 6246.6 5812.3 No 5875.7 5501.6 No 7569.7 7193.1 No
25 SD3N1 ZMS606 5306.7 5084.9 No 4951.6 4639.1 No 3624.2 3390.7 No
26 SD3N2 ZMS606 6783.2 6409.3 No 6524.7 6129.4 No 7264.4 6997.8 No
27 SD3N3 ZMS606 6051.5 5651.3 No 5768.5 5406.4 No 7596.1 7206.4 No

3. Discussion

3.1. Projected Changes in Tmax, Tmin and Rainfall

Results shows that temperature will increase under future climate scenarios (2010-2039, 2040-2069, 2070-2099 [RCP4.5, RCP8.5]) w.r.t to the baseline (1971-2000). The increase in temperature has implication on growth, development and yield. Further, this affects the rates of evapotranspiration. Nevertheless, the projected mean increase in maximum temperature under future climate scenarios is below the 1.5oC [68]. Rainfall exhibits both increase and decrease in future relative to the baseline. The projected changes in rainfall and temperature at Mount Makulu Research Station are consistent with similar studies conducted in the region. A study by Chisanga et al. [17] using a multimodal ensemble of five GCMs undertaken at Mount Makulu indicated an increase in Tmax and Tmin from 2040-2069 under RCP4.5 (Tmax = 1.92oC; Tmin = 1.71oC) and RCP8.5 (Tmax = 2.51oC; Tmin = 2.44oC), respectively. A study by Maúre et al. [68] shows an increase in temperature ranging from 1.5-2.5oC in southern African compared to 1971-2000 at Mount Makulu Research Station. Further, the south-western sub-Sahara Africa (SSA) is projected to experience the largest increase in temperature compared to the global mean warming. Additionally, SSA where Zambia is located is warming at a fast rate with growing season temperatures predicted to surpass extreme temperatures recorded in the past [70]. Zambia has experienced adverse climatic conditions such as higher temperatures, droughts and floods [71]. A simulation study using five GCMs indicated variability and uncertainty in rainfall for Mount Makulu Research Station [17]. The results showed a reduction in rainfall of 11.63 mm (RCP4.5) and 15.24 mm (RCP8.5) for 2049-2069 relative to the baseline 1971-2000. However, the projected temperatures are suitable for growing maize at Mount Makulu Research Station [17,69]. Maize requires temperatures between 15 and 35oC for optimal growth and yield [69].

3.2. Probability Distribution Functions (PDFs) for rainfall, Tmax and Tmin

There exists uncertainties in projected climate change in the 21st century due to responses in greenhouse gas concentrations within the global climate models. Rainfall and temperature PDFs show horizontal shift under RCP4.5 and RCP8.5. Similar results have been observed by Boberg et al. [72], Masanganise et al. [73] and Chisanga et al. [17]. The researchers noted that rainfall had a vertical upward or downward shift in probability. Applying the PDF on meteorological parameters (Rainfall, Tmax, Tmin) is beneficial as their utilization can communicate the likelihood of an event happening at a given interval [74]. The smooth PDFs matching the mean and ranges of statistically downscaled GCM results has been presented in the study. The PDFs shapes for Tmax, mean (Tmean), and Tmin follow the shapes of observed PDFs under RCP4.5 and RCP8.5. A study in Australia used results from 23 CMIP3 GCMs for Tmax, Tmin and rainfall under A1B scenario (CMIP3) [75]. The study used the 23 CMIP3 GCMs to generate PDFs for warming scenarios. The temperature anomaly PDF generally presented a positive skewness. Similar results have been reported in China [76]. The non-Gaussian tails in the temperature anomaly PDF were present under RCP4.5 and RCP8.5 for the current study site. The analysed rainfall and surface air temperature using PDFs can enhance understanding of the historical and future climate scenarios. The use of PDFs to visually display the projected changes is increasingly being utilized by researchers [75].

3.3. Biophysical Analysis of Maize Yield

Crop models “simulate crop growth and soil nutrient dynamic processes in order to quantify the relationships among soil nutrients, crop growth and soil water in the soil-plant-atmosphere system” [16]. Crop model provides prospects for examining management impacts on future crop yield w.r.t the baseline. They permit the proposition and selection of the optimal management and economic analysis that improve crop production and profitability [16,77]. Furthermore, crop models can be applied to evaluate the impact of climate scenarios and management on crop yields and food security. The DSSAT model’s seasonal analysis revealed that the treatment effects of SDs, maize cultivars and nitrogen fertilizer under future climate scenarios w.r.t the baseline influenced grain yield. The results show that projected changes in Tmax, Tmin, rainfall, and management will affect grain yield for the cultivars differently under future climate scenarios. Therefore, researchers have recommended adaptation strategies includes varying SDs, adopting late-maturing varieties with high thermal heat requirements [1,2,3]. These strategies may increase maize yield and resilience under future climate scenarios. This study emphasizes the urgency for tailored adaptation actions and collaborative efforts along the maize value chain to mitigate future yield losses and sustain food security.

3.4. Economic and Strategic Analysis

Nitrogen is an important macro-nutrient that affects physiological, biomass and economic maize yield [78]. Maize yield and economic profitability can be studied using climate, crop and economic modelling [6,17,33,45,77,79,80]. Crop models have been applied to appraise maize yield responses on N fertilization [81]. Studies have shown that multi-model ensemble crop models are highly recommended for quantifying uncertainty [69,77,82]. Further, multi-model ensemble simulations provide insights into climate and crop simulation model uncertainties and develop adaptation and mitigation strategies [79]. However, a single crop model has been used in this study. The DSSAT model v4.7, coupled with statistically downscaled GCMs , was used to simulate maize yields in future (2010-2039 (RCP4.5, RCP8.5), 2040-2069 (RCP4.5, RCP8.5), 2070-2099 (RCP4.5, RCP8.5)) w.r.t to the baseline to estimate the treatment effect of SDs, cultivars and N fertilizers on management practices. Crop models can used to optimize SDs and N fertilizer management for an anticipated maize yield whilst reducing soil fertility losses [83]. The seasonal and intra-seasonal variability in rainfall and the low adaptive capacity limits smallholder rain-fed agriculture across Sub-Saharan Africa (SSA) [84].
Model parameterization and calibration are the sources of model uncertainties [15]. A study by Lin et al. [85] in China using a DSSAT-CERES-Maize model and three GCMs indicated that maize yield would decrease in future depending on the climate scenario and location. Similar results are highlighted in this study (Table 5). Studies by Lin et al. [85] and Liu et al. [4] showed that the DSSAT-CERES-Maize model effectively simulates the response of maize yield to applied N fertilizer and soil water storage. The researchers concluded that an increase in temperature would shorten the number of days to maturity and yield under future climate scenarios. Similar results have been reported by Chisanga et al. [17,18,79]. Other studies revealed that maize yield can be increased by applying irrigation water and varying SDs [86]. Further studies on the impact of climate change on crop yield should focus on using multi-model crop models [79]. Using different climate scenarios and management, future maize growth and yield can be predicted using crop models. The growth and yield of common beans, cotton, groundnuts, maize, millet, sorghum, soybeans and sun-flower are influenced by changes in soil fertility, Tmax, Tmin and rainfall and SDs [27,79,87].
Different biophysical crop models such as DSSAT, APSIM and STICS have been applied in simulating impacts of climate change impact, adaptation actions, planting density, irrigation improvement and yield estimation studies in many countries [23,79,88,89,90,91,92,93]. The APSIM and DSSAT as biophysical models have been commended for integrated assessment in SSA for improved decision-making at farm level [94].
The DSSAT models can be applied to predict variations and identify trends in biophysical indicators [95,96]. Further, unsustainable or sustainable management options can be identified and evaluated. The Mean Gini Stochastic Dominance (MGSD) analysis has been used by Lomeling and Huria [96] to evaluate the gross margin and assisted in deciding on the appropriate management options. The authors concluded that the DSSAT models could be applied to forecasting future cowpea yields, gross margin successfully, and nutrient use under diverse management options assisting farmers to make knowledgeable decisions on sustainable crop productivity. The DSSAT models have been used in India for 2001-2017 to assess yield and yield variances at 5 km grid scale using high spatial resolution climatic data for Kharif rice (Oryza sativa L.) [88]. Other researchers have conducted an economic analyses utilizing the trade-off analysis multi-dimensional impact assessment tool and Monte Carlo Simulations [93,97]. Using the Monte Carlo Simulation, Kadigi et al. [93] observed that applying N fertilizer reduced the risks linked to maize mean returns in Tanzania. This study thus confirms the potential of late sowing and high nitrogen fertilization rate for increasing maize production efficiency in the stud area under future climate. For enhanced production efficiencies of maize production, the agricultural extension officers, maize farmers, and not-for-profit organizations should align agronomic practices to achieve the highest production per unit of resource expenditure.

4. Materials and Methods

4.1. Experimental Site
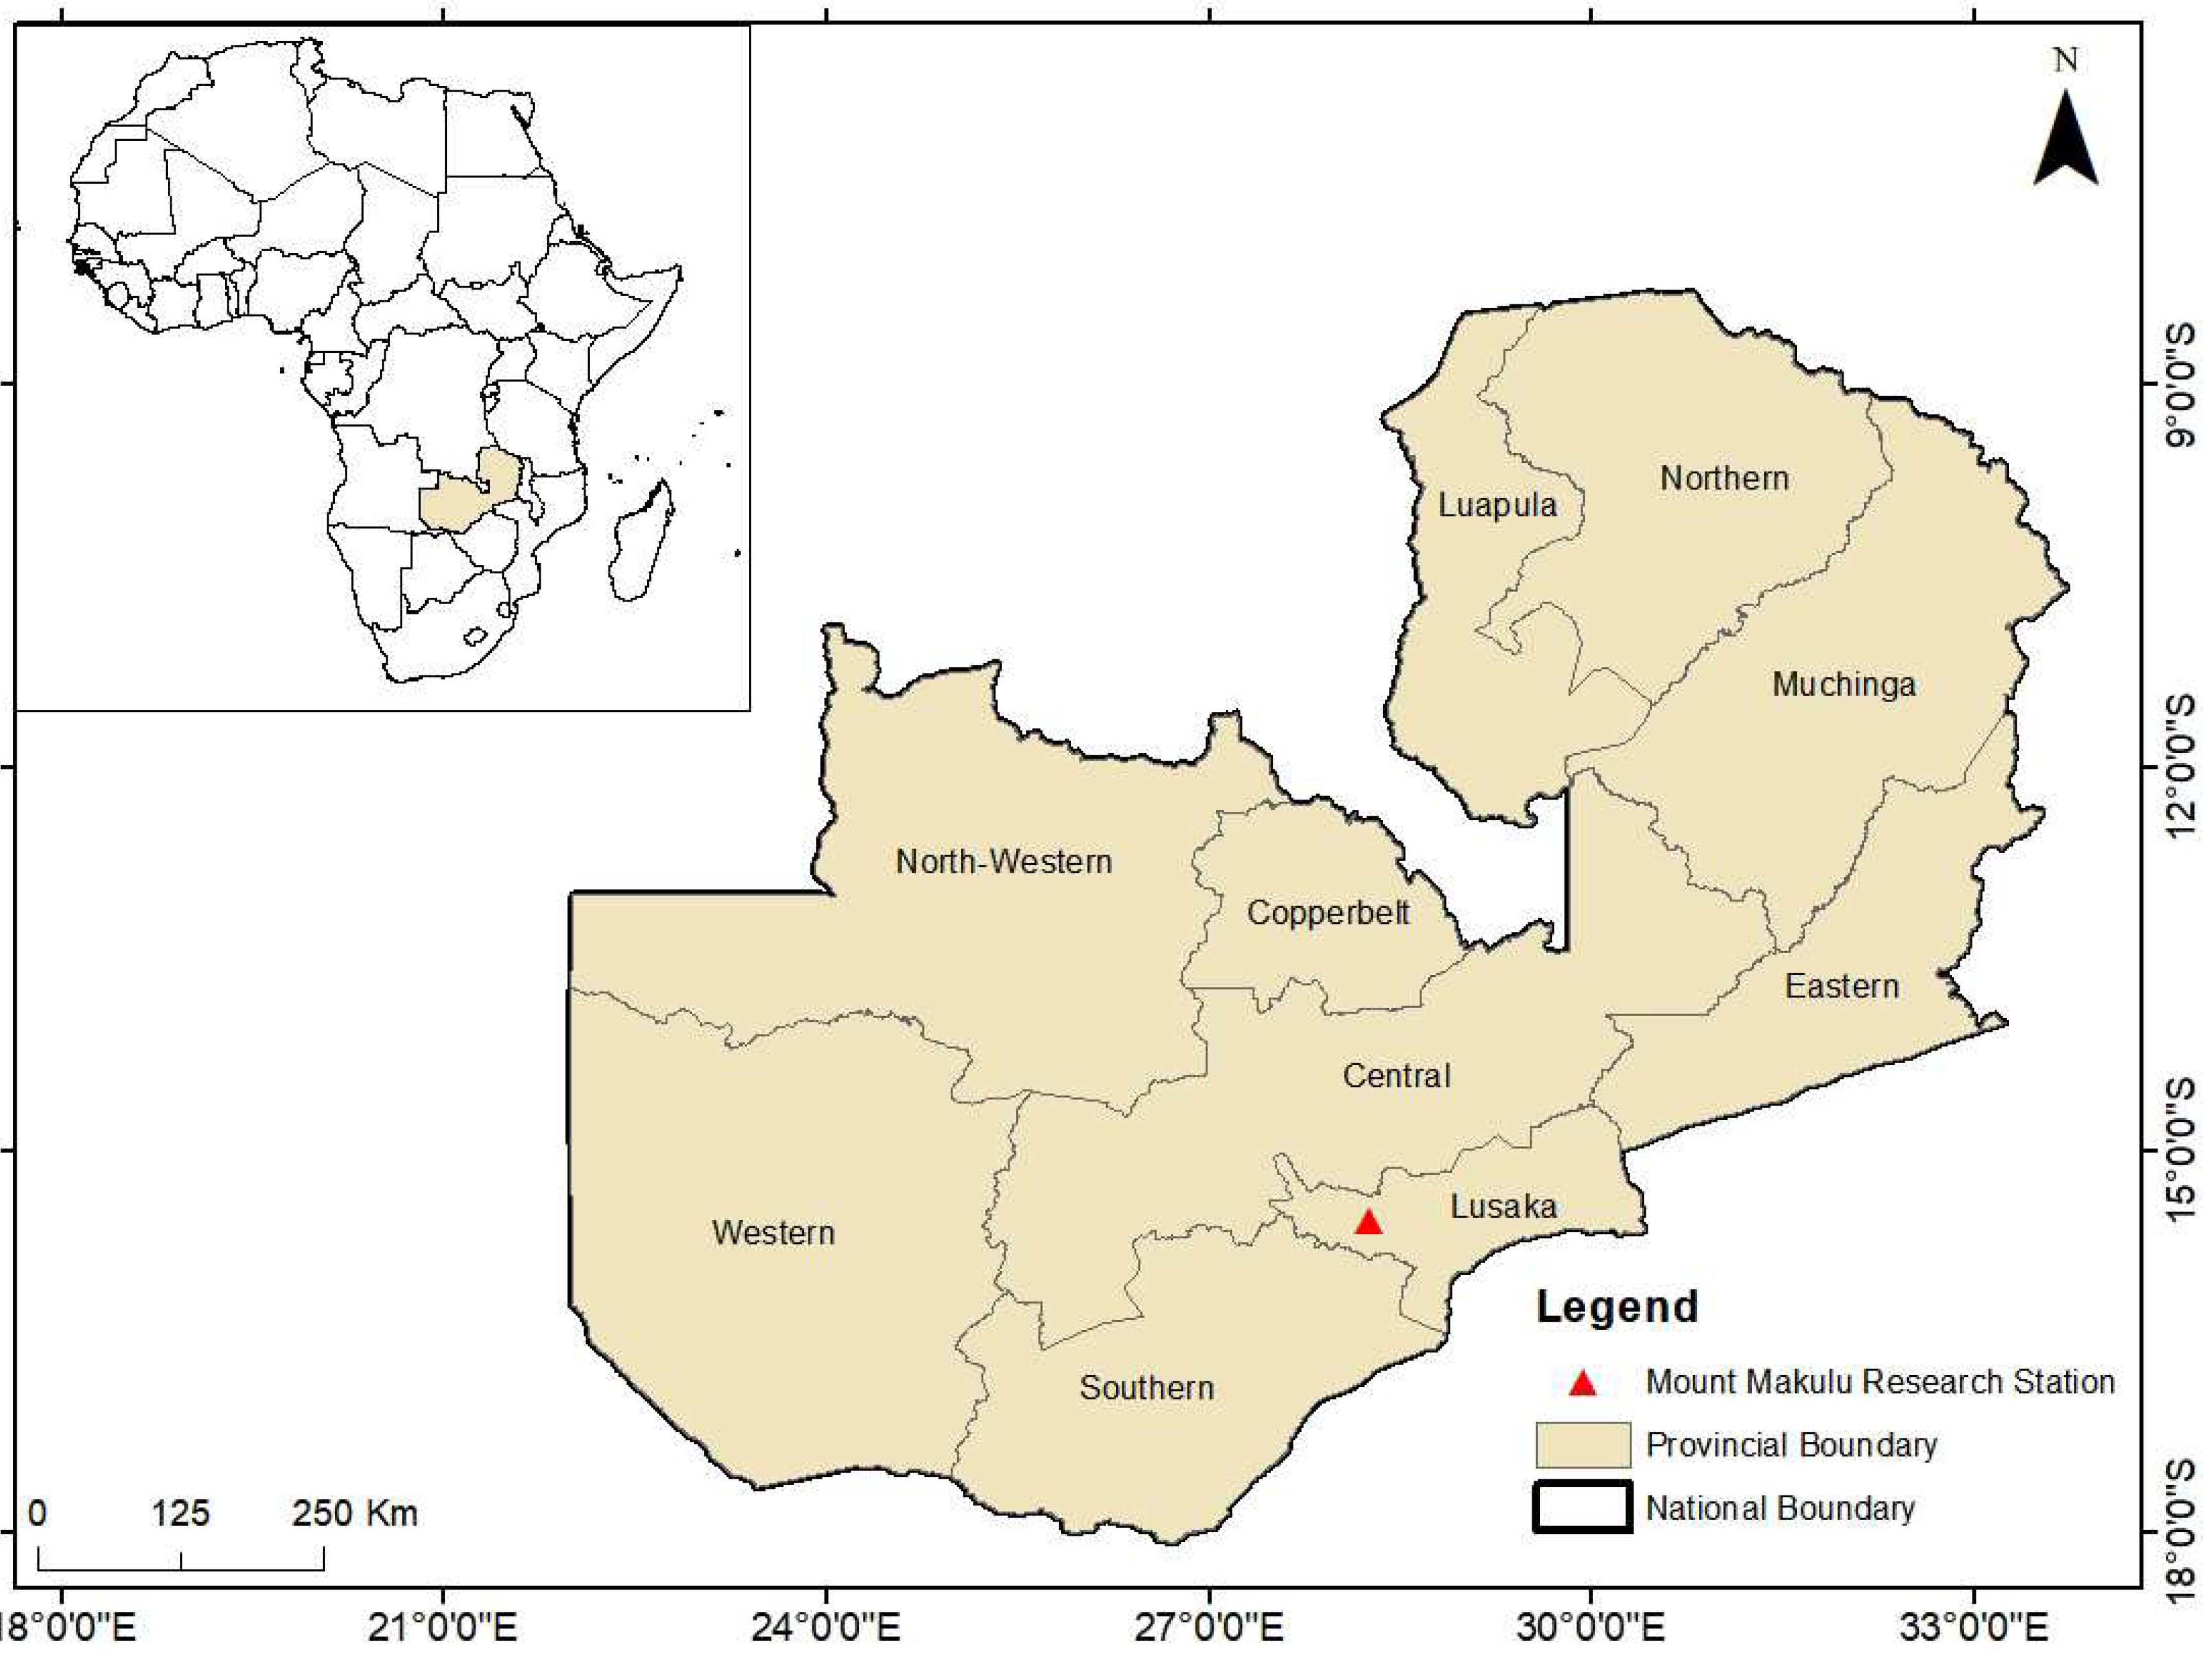
The field experiment was undertaken at Mount Makulu Research Station located at latitude, longitude and elevation of 15.550o S, 28.250oS and 1,213 m above sea level, respectively. It is located in Chilanga, 15 km south of Lusaka, Zambia as shown in Figure 1. Mount Makulu Research Station is also the headquarters of the Zambia Agriculture Research Institute (ZARI).
Figure 1. Study area map showing Mount Makulu research station and inset map shows the context of Zambia in Africa.
Preprints 97700 g001

4.2. Field Experiment

A rain-fed split-split plot design was setup at Mount Makulu having three sowing dates (SDs; SD1, SD2, SD3), maize cultivars (PHB 30G19, PHB 30B50, ZMS 606,), nitrogen fertilizer rates (N1 = 66; N2 = 132 ; N3 = 198 kg N ha-1) having three replications [19]. The main plot was the SD (SD1, SD2, SD3) at two week interval. The subplots and sub-subplots were maize cultivars and nitrogen fertilizer. The plot sizes were 6 meters with 7 rows by 5 meters. Basal dressing (10 N-20 P2O5-10 K2O) was applied at 20 (SD1), 40 (SD2) and 60 (SD3) Kg N ha-1. Urea (46% N) was applied as top dressing at 46 (SD1), 92 (SD2) and 138 (SD3) Kg N ha-1 as reported by [19]. The plots were arranged as reported by Chisanga et al. [19].
“The plots were separated from each other by a 2 meter distance to prevent cross contamination of treatments. Three seeds were sown by hand at 5 cm depth in a flat seedbed in 0.75 meter row spacing and 0.50 meter spacing between plants per station and later thinned to two plants. Initial soil conditions were sampled using a soil auger at 20 cm intervals until 100 cm depth, weighed and oven dried at 105oC” [19]. Additionally, “plant growth analysis was observed at the vegetative (emergence, V6) and reproductive (silking [R1], dough stage [R4], physiological maturity [R6]) stages and recorded when 50% and 75% of the plants reached the stages, respectively as described in” Asseng et al. [47] and Hoogenboom et al. [48]. “Biomass from all the subplots were harvested at the recommended growth stages” as reported by Chisanga et al. [5,19].
Sources of data

4.3. Climate Input Data

The climate data from 1971-2000 and 2010-2099 under two Representative Concentration Pathways (RCP4.5, RCP8.5) were downscaled using the Statistical Downscaling Portal (SDP) hosted by the Zambia Meteorological Department (ZMD). A subset of three out of the eight GCMs from the Coupled Model Inter-comparison Project (CMIP5) integrated in the Statistical Downscaling Portal (SDP) was selected and applied in this study (Table 1). Daily time series of minimum temperature, maximum temperature and precipitation were downscaled for the baseline and future climate scenarios using three GCMs. The selected GCMs are available in Cartesian latitude-longitude grid [49] and their characteristics are shown in (Table 1). The three GCMs (GFDL-ESM2M, MIROC-ESM, MPI-ESM-LR) were selected on the basis of their long history of development and evaluation, higher resolution, and established performance across multiple regions such as South-east Asia, Europe and Africa [17,50]. Further, the GCMs can simulate major climatological features such as annual cycles of temperature and precipitation across multiple regions [46,51,52,53,54,55]. The generated climate scenarios were used as inputs into the DSSAT seasonal analysis program. Each treatment was run with 30 replications.
Table 1. Coupled multi-model Inter-comparison Project Phase 5 (CMIP5) GCMs considered in this study.
Model Modeling Centre Resolution Reference
GFDL-ESM2M Geophysical Fluid Dynamics Laboratory 2.5ox2.5o [46,52]
MIROC-ESM Atmosphere and Ocean Research Institute (University of Tokyo), National Institute for Environmental Studies and Japan Agency for Marine-Earth Science and Technology 2.8o x 2.8o [46,50,56]
MPI-ESM-MR Max Planck Institute for Meteorology (MPI-M) 1.87ox1.87o [46,54,57]

4.4. Solar Radiation Input Data

Solar radiation data is an essential input into crop simulation models. It has been demonstrated that solar radiation (SRAD) dataset may be estimated correctly using site-specific maximum (Tmax) and minimum (Tmin) temperature and latitude excluding empirical coefficients [58]. The daily SRAD in MJ m-2 day-1 was generated with the Mahmood-Hubbard (MH) SRAD model proposed by Mahmood and Hubbard [59]. The sirad R package in RStudio/R Programming software was used to generate solar radiation data for Mount Makulu [60,61]. The Mahmood-Hubbard model recommends a method for estimating SRAD from temperature readings without essentially calibrating empirical coefficients [59]. Solar radiation data is an important input in crop simulation models and lack of daily solar radiation data is a significant drawback in crop simulation studies [58].

4.5. Planting Materials and Treatments

The maize cultivars (PHB 30G19, PHB 30B50, ZMS 606) are of medium maturity with the comparative relative maturity of 120-130 days [19]. Further, PHB 30G19, PHB 30B50 and ZMS 606 were selected on the basis of being planted by smallholder farmers and for their profitability. “PHB30B50 is recommended to be grown under irrigation. However, it can also be grown under rain-fed conditions. The PHB30G19 and ZMS 606 can be grown under irrigated and rain-fed conditions. PHB30G19 (white) and PHB30B50 (yellow) are produced by DuPont Pioneer. The ZMS 606 is an exceptionally good drought tolerant maize cultivar produced by ZamSeed. The selected cultivars can be grown in all the three agro-ecological regions of Zambia” [19].

4.6. Decision Support System for Agro-technology Transfer (DSSAT) Model

The DSSAT is a software programme comprising crop simulation models for over 42 crops [62,63]. The DSSAT models simulate crop growth and yield as a function of the soil-plant-atmosphere dynamics [22,26]. Further, soil water, nitrogen and carbon cycles are simulated by the models and they can be used to evaluate climate change impacts and different management practices [26,63]. DSSAT models simulate a one-dimensional water balance with vertical flow to meet the supplies for fairly simple inputs for model users.
The minimum data inputs needed to run the models includes, weather (Tmax, Tmin, rainfall, SRAD), crop data, soil and management [48]. The soil properties measured at the experimental site are shown in Table 2. SRAD is needed to simulate photosynthesis and potential evapotranspiration (PET) using the Priestley-Taylor equation [64]. The Cultivar Specific Parameters for the PHB 30G19, PHB 30B50 and ZMS 606 used in the seasonal analysis simulations are shown in Table 3.
Table 2. Chemical and physical properties of soil profile at the experimental site (Adapted from Chisanga et al. [5,19] with permission).
Depth (cm) 0-20 20-40 40-60 60-80 80-100 Analysis method
pH (water) 7.30 7.20 7.50 7.70 7.60 1:5 soil water
Total N (%) 0.031 0.042 0.054 0.061 0.036 Modified Kjeldahl method
NO3N 29.90 48.70 56.40 70.10 42.80
NH4N 18.00 29.20 33.90 42.10 25.70
P extractable (mg kg-1) 10.00 11.00 10.00 18.00 12.00 Bray 1
K (mg kg1) 1.05 0.99 1.12 0.59 0.89 Ammonium acetate
Ca (cmol(+) kg-1) 11.00 9.30 3.40 2.90 3.20 Ammonium acetate
Mg (cmol(+) kg-1) 3.50 2.70 2.30 1.00 1.30 Ammonium acetate
OC (%) 0.35 0.57 0.66 0.82 0.50 Walkley & Black method
OM (%) 0.602 0.980 1.135 1.410 0.860
CEC (cmol(+) kg-1) 15.57 13.02 6.85 4.52 5.42 Ammonium acetate
Bulk density (g cm-3) 1.43 1.41 1.41 1.46 1.36 SPAW
Silt (%) 12.80 16.80 12.80 18.80 2.80 Hydrometer method
Sand (%) 39.60 35.60 37.60 41.60 37.60
Clay (%) 47.60 47.60 49.60 39.60 59.60
Soil texture clay clay clay clay clay SPAW
LL 0.287 0.287 0.299 0.244 0.350 SPAW
DUL 0.407 0.409 0.419 0.363 0.470
SAT 0.459 0.467 0.468 0.447 0.487
SHC (mm h-1) 0.350 0.500 0.290 1.480 0.010
Table 3. Genetic coefficients for the PHB30G19, PHB30B50 and ZMS606 cultivars (Adapted from Chisanga et al. [5,19] with permission).
Parameter Explanation Units ZMS 606 PHB 30G19 PHB 30B50
P1 GDDs (based on 8oC) from emergence to end of juvenile phase ℃d 159.00 209.90 155.10
P2 Photoperiod sensitivity coefficient (01.0) 1.895 0.441 1.7630
P5 GDDs (based on 8oC) from silking to maturity ℃d 810.20 815.90 800.40
G2 Maximum possible number of kernels per plant 945.00 840.80 795.60
G3 Potential kernel growth rate (mg day-1) mg day-1 8.559 8.840 15.340
PHINT GDDs required for a leaf tip to appear(based on 8oC) ℃d 59.70 56.08 59.73

4.7. Change in Rainfall and Temperature

The historical (1971-2000) and future (2010-2039, 2040-2069, 2070-2099 [RCP4.5, RCP8.5]) climate scenarios were used in this study. The future changes in temperature and rainfall were computed using seven 30-year windows to ascertain the impacts of climate change at Mount Makulu. Future changes in rainfall, Tmax and Tmin are presented using individual GCMs and multi-model ensemble mean under both scenarios (RCP4.5, RCP8.5). The use of multi-model ensemble mean reduces uncertainties and produces a more realistic transient future climate scenarios compared to a single GCM [65]. The future absolute and percentage differences relative to the historical were computed for temperature and rainfall using Equation 1, Equation 2, Equation 3, Equation 4, Equation 5 and shown below.
2025 = V 2025 V b a s e
2055 = V 2055 V b a s e
2085 = V 2085 V b a s e
2025   ( % ) = V 2025 V b a s e × 100 V b a s e
2055   % = V 2055 V b a s e × 100 V b a s e
2085   ( % ) = V 2085 V b a s e × 100 V b a s e
Where:
Vbase is the ensemble mean for each statistic in the baseline period.
V2025, V2055, and V2085 is the ensemble mean for period of the time slice

4.8. Long-Term Simulation Experiments

A field experiment conducted at Mount Makulu was used to simulate the interactive effect of SDs, maize cultivars, and nitrogen fertilizer rates (N1 = 66; N2 = 132 ; N3 = 198 kg N ha-1) [17,19] on strategic and economic analyses. All the observed and measured data on phenology, grain and biomass yield had been used in model calibration [19]. Statistical downscaled climate datasets from three GCMs for 1971-2000, 2010-2039 (2025; RCP4.5, RCP8.5), 2040-2069 (2055; RCP4.5, RCP8.5) and 2070-2099 (2085; RCP4.5, RCP8.5) were used as input into the DSSAT v4.7 seasonal analysis program to simulate the impact of climate change on maize yield. The seasonal analysis program was used to compare the interactive effects of different SDs, maize cultivars and N fertilizers combinations under the baseline and future climate scenarios. Twenty-seven treatments were run using the Seasonal Analysis Program for the baseline (1971-2000) and future climate (2010-2039, 2040-2069, 2070-2099 [RCP4.5, RCP8.5]) scenarios. An analysis for the multimodal ensemble and 3 GCMs was performed (Table 5). However, a multi-model ensemble for the 3 GCMs was used in the Seasonal Analysis Program to run each treatment combination with 30 year datasets for baseline and future climate scenarios.

4.9. Economic Analysis

The economic analysis was performed using data shown in Table 4. The analysis is applied to the multi-model ensemble mean. The mean was a simple calculated mean [17]. A time series of distributions of net return was the DSSAT output from economic analysis. The DSSAT models have been applied to evaluate the effects of climate change on yield, economic returns and associated risks and changes in farming systems [66].
Table 4. Grain, seed and fertilizer costs and prices used in economic analysis of the multi-season crop model analysis program.
Description Unit Value (USD)
Grain price $/t 883.00
Harvest by-product $/t 0.00
Base production costs $/ha 155
N fertilizer cost $/kg 1.68
N cost / application $ 33.00
Irrigation cost $/mm 0.00
Irr cost / application $ 0.00
Seed cost $/kg 22.00
Organic amendments $/t 0.00
P fertilizer cost $/kg 0.00
P cost / application $ 0.00
K fertilizer cost $/kg 0.00
K cost / application $ 0.00

4.10. Statistics Analysis

Probability Distribution Functions (PDFs), standard deviations, means and Cumulative Distribution Functions (CDFs) were analysed to ascertain the effects of climate change, biophysical and economics on maize yield, sowing date, cultivar and N fertilizer rate. Understanding the PDFs for rainfall and temperature is important for their characterization [67]. A PDF, is a parametric method for estimating the probability of occurrence of a random value within a particular range in a dataset. The 30-year mean change of rainfall, Tmax and Tmin were computed for future climate scenarios with reference (w.r.t) to the baseline. The PDF for normal (Gaussian) distribution used in the analysis is shown using Equation 7.
P a < x < b = a b f x d x = a b 1 σ 2 π e [ ( x μ ) 2 / 2 σ 2 ] d x
Where: P(a<x<b) is the probability that x will be in the interval (a, b) in any instant of time. For example, P(-1<x<+1)=0.3 mean that there is a 30% chance that x will be between -1 and 1 for any measurement. x is the random variable. µ is the mean value and σ is the standard deviation.

4.11. Contribution to the Field Statement

The DSSAT seasonal analysis program can accurately simulate maize yield response to diverse treatment effects in future w.r.t the baseline. Crop models can be used for selecting management options that maximizes productivity of grain yield. The biophysical and economic analyses conducted using the DSSAT Seasonal Analysis Program can successfully mimic maize growth and yield under baseline and future climate scenarios using an interactive assessment of SDs, cultivars and fertility. Seasonal analysis is relevant for policymakers and stakeholders to coin comprehensible strategies for alleviating the negative impacts of climate change and strengthening adaptation actions. The biophysical and economic strategic analysis indicates that treatment with low fertility would be more economical under future climate scenarios.

Funding

This research received no funding.

Acknowledgments

The authors would like to thank Zambia Meteorological Department (ZMD) for providing the climate datasets used in modelling the impact of climate change on maize yield using the biophysical and economic analysis.

Conflicts of Interest

The authors declare no conflict of interest.

References

  1. C.B. Chisanga, M. Moombe, E. Phiri, Modelling climate change impacts on maize, CABI Rev. 2022 (2022) 11. [CrossRef]
  2. C. Zhao, B. Liu, S. Piao, X. Wang, D.B. Lobell, Y. Huang, M. Huang, Y. Yao, S. Bassu, P. Ciais, J.-L. Durand, J. Elliott, F. Ewert, I.A. Janssens, T. Li, E. Lin, Q. Liu, P. Martre, C. Müller, S. Peng, J. Peñuelas, A.C. Ruane, D. Wallach, T. Wang, D. Wu, Z. Liu, Y. Zhu, Z. Zhu, S. Asseng, Temperature increase reduces global yields of major crops in four independent estimates, Proc. Natl. Acad. Sci. 114 (2017) 9326–9331. [CrossRef]
  3. B. Parkes, D. B. Parkes, D. Defrance, B. Sultan, P. Ciais, X. Wang, C. Ben Parkes, Projected changes in crop yield mean and variability over West Africa in a world 1.5 K warmer than the pre-industrial era, Earth Syst. Dyn. 9 (2018) 119–134. [CrossRef]
  4. S. Liu, J. Yang, X. Yang, C.F. Drury, R. Jiang, W. Daniel Reynolds, Simulating maize yield at county scale in southern Ontario using the decision support system for agrotechnology transfer model, Can. J. Soil Sci. 101 (2021) 734–748. [CrossRef]
  5. C.B. Chisanga, Interactive effects of N fertilization rate, cultivars and planting date under climate change on maize (Zea mays L.) yield using crop simulation and statistical downscaling of climate models, University of Zambia, Lusaka, Zambia, 2019.
  6. Q.A. Seko, V. Jongrungrot, Economic modelling and simulation analysis of maize-based smallholder farming systems in the Senqu River Valley agroecological zone, Lesotho, Cogent Food Agric. 8 (2022) 19. [CrossRef]
  7. C.B. Chisanga, E. Phiri, C. Shepande, Effect of planting date and nitrogen application rate on maize (Zea mays L.) growth and yield in Lusaka, Zambia, Zambian J. Agric. Sci. 9 (2014) 64–70.
  8. C.B. Chisanga, Evaluation of the CERES-Maize model in simulating maize (Zea mays L.) growth, development and yield at different planting dates and nitrogen rates in a subtropical environment of Zambia, The University of Zambia, 2014.
  9. M. Buriro, T.A. Bhutto, A.W. Gandahi, I.A. Kumbhar, M.U. Shar, Effect of Sowing Dates on Growth, Yield and Grain Quality of Hybrid Maize, J. Basic Appl. Sci. 11 (2015) 553–558. [CrossRef]
  10. X. X.P. Chen, F.S. Zhang, Z.L. Cui, F. Li, J.L. Li, Optimizing Soil Nitrogen Supply in the Root Zone to Improve Maize Management, Soil Sci. Soc. Am. J. 74 (2010) 1367–1373. [CrossRef]
  11. S. Liu, J.Y. Yang, X.Y. Zhang, C.F. Drury, W.D. Reynolds, G. Hoogenboom, Modelling crop yield, soil water content and soil temperature for a soybean–maize rotation under conventional and conservation tillage systems in Northeast China, Agric. Water Manag. 123 (2013) 32–44. [CrossRef]
  12. H. LIU, J. YANG, P. HE, Y. BAI, J. JIN, C.F. Drury, Y. ZHU, X. YANG, W. LI, J. XIE, J. YANG, G. Hoogenboom, Optimizing Parameters of CSM-CERES-Maize Model to Improve Simulation Performance of Maize Growth and Nitrogen Uptake in Northeast China, J. Integr. Agric. 11 (2012) 1898–1913. [CrossRef]
  13. M. Ahmed, Fayyaz-ul-Hassan, APSIM and DSSAT models as decision support tools, in: 19th Int. Congr. Model. Simulation, Perth, 12–16 December 2011, Perth, Australia, 2011: pp. 1174–1180.
  14. B.T. Kassie, S. Asseng, C.H. Porter, F.S. Royce, Performance of DSSAT-Nwheat across a wide range of current and future growing conditions, Eur. J. Agron. 81 (2016) 27–36. [CrossRef]
  15. A.M. Manschadi, J. Eitzinger, M. Breisch, W. Fuchs, T. Neubauer, A. Soltani, Full Parameterisation Matters for the Best Performance of Crop Models: Inter-comparison of a Simple and a Detailed Maize Model, Int. J. Plant Prod. 15 (2021) 61–78. [CrossRef]
  16. H. LIU, H. LIU, Q. LEI, L. ZHAI, H. WANG, J. ZHANG, Y. ZHU, S. LIU, S. LI, J. ZHANG, X. LIU, Using the DSSAT model to simulate wheat yield and soil organic carbon under a wheat-maize cropping system in the North China Plain, J. Integr. Agric. 16 (2017) 2300–2307. [CrossRef]
  17. C.B. Chisanga, E. Phiri, V.R.N. Chinene, L.M. Chabala, Projecting maize yield under local-scale climate change scenarios using crop models: Sensitivity to sowing dates, cultivar, and nitrogen fertilizer rates, Food Energy Secur. 9 (2020) 1–17. [CrossRef]
  18. C.B. Chisanga, E. Phiri, V.R.N. Chinene, Reliability of Rain-Fed Maize Yield Simulation Using LARS-WG Derived CMIP5 Climate Data at Mount Makulu, Zambia, J. Agric. Sci. 12 (2020) 275. [CrossRef]
  19. C.B. Chisanga, E. Phiri, V.R.N. Chinene, Evaluating APSIM-and-DSSAT-CERES-Maize Models under Rainfed Conditions Using Zambian Rainfed Maize Cultivars, Nitrogen. 2 (2021) 392–414. [CrossRef]
  20. Hoogenboom, E. Luedeling, K.M. Hadgu, I. Kisekka, L.G. Martorano, Assessment of maize growth and yield using crop models under present and future climate in southwestern Ethiopia, Agric. For. Meteorol. 214 (2015) 252–265. [CrossRef]
  21. M. Ahmed, M.N. Akram, M. Asim, M. Aslam, F. Hassan, S. Higgins, C.O. Stöckle, G. Hoogenboom, Calibration and validation of APSIM-Wheat and CERES-Wheat for spring wheat under rainfed conditions: Models evaluation and application, Comput. Electron. Agric. 123 (2016) 384–401. [CrossRef]
  22. H.L. Liu, J.Y. Yang, C.F. Drury, W.D. Reynolds, C.S. Tan, Y.L. Bai, P. He, J. Jin, G. Hoogenboom, Using the DSSAT-CERES-Maize model to simulate crop yield and nitrogen cycling in fields under long-term continuous maize production, Nutr. Cycl. Agroecosystems. 89 (2011) 313–328. [CrossRef]
  23. P.G. Tovihoudji, P.B.I. Akponikpè, E.K. Agbossou, C.L. Bielders, Using the DSSAT Model to Support Decision Making Regarding Fertilizer Microdosing for Maize Production in the Sub-humid Region of Benin, Front. Environ. Sci. 7 (2019) 1–15. [CrossRef]
  24. B.K. Kogo, L. Kumar, R. Koech, P. Langat, Modelling Impacts of Climate Change on Maize (Zea mays L.) Growth and Productivity: A Review of Models, Outputs and Limitations, J. Geosci. Environ. Prot. 07 (2019) 76–95. [CrossRef]
  25. S.A. Ouda, T. Noreldin, O. Mounzer, M.T. Abdelhamid, CropSyst model for wheat irrigation water management with fresh and poor quality water, J. Water L. Dev. (2015) 1429–7426. [CrossRef]
  26. 26. J.W. Jones, G. Hoogenboom, C.H. Porter, K.J. Boote, W.D. Batchelor, L.A. Hunt, P.W. Wilkens, U. Singh, A.J. Gijsman, J.T. Ritchie, The DSSAT cropping system model, Eur. J. Agron. 18 (2003) 235–265. [CrossRef]
  27. M.A. Iqbal, Y. Shen, R. Stricevic, H. Pei, H. Sun, E. Amiri, A. Penas, S. del Rio, Evaluation of the FAO AquaCrop model for winter wheat on the North China Plain under deficit irrigation from field experiment to regional yield simulation, Agric. Water Manag. 135 (2014) 61–72. [CrossRef]
  28. Y.G. Beletse, W. Durand, C. Nhemachena, Projected Impacts of Climate Change Scenarios on the Production of Maize in Southern Africa : An Integrated Assessment Case Study of the Bethlehem District, Central Free State, South Africa, in: Handb. Clim. Chang. AGROECOSYSTEMS JThe Agric. Model Intercomp. Improv. Proj. Integr. Crop Econ. Assessments, Part 1, oint Publication with American Society of Agronomy, Crop Science Society of America, and Soil Science Society of America, London, UK, 2015: pp. 125–155.
  29. C.O. Stöckle, A.R. Kemanian, Can Crop Models Identify Critical Gaps in Genetics, Environment, and Management Interactions?, Front. Plant Sci. 11 (2020) 1–12. [CrossRef]
  30. P.K. Thornton, P.W. Wilkens, Risk assessment and food security, in: G.Y. Tsuji, G. Hoogenboom, P.K. Thornton (Eds.), Underst. Options Agric. Prod. Syst. Approaches Sustain. Agric. Dev. Vol 7, Springer, Dordrecht, 1998: pp. 329–345. [CrossRef]
  31. Ahuja, L.A. Garcia, L. Ma, A.S. Saseendrana, T.J. Trout, Modeling the impacts of climate change on irrigated corn production in the Central Great Plains, Agric. Water Manag. 110 (2012) 94–108. [CrossRef]
  32. R. Jiang, W. He, L. He, J.Y. Yang, B. Qian, W. Zhou, P. He, Modelling adaptation strategies to reduce adverse impacts of climate change on maize cropping system in Northeast China, Sci. Rep. 11 (2021) 1–13. [CrossRef]
  33. G.N. Falconnier, M. Corbeels, K.J. Boote, F. Affholder, M. Adam, D.S. MacCarthy, A.C. Ruane, C. Nendel, A.M. Whitbread, É. Justes, L.R. Ahuja, F.M. Akinseye, I.N. Alou, K.A. Amouzou, S.S. Anapalli, C. Baron, B. Basso, F. Baudron, P. Bertuzzi, A.J. Challinor, Y. Chen, D. Deryng, M.L. Elsayed, B. Faye, T. Gaiser, M. Galdos, S. Gayler, E. Gerardeaux, M. Giner, B. Grant, G. Hoogenboom, E.S. Ibrahim, B. Kamali, K.C. Kersebaum, S.-H. Kim, M. van der Laan, L. Leroux, J.I. Lizaso, B. Maestrini, E.A. Meier, F. Mequanint, A. Ndoli, C.H. Porter, E. Priesack, D. Ripoche, T.S. Sida, U. Singh, W.N. Smith, A. Srivastava, S. Sinha, F. Tao, P.J. Thorburn, D. Timlin, B. Traore, T. Twine, H. Webber, Modelling climate change impacts on maize yields under low nitrogen input conditions in sub-Saharan Africa, Glob. Chang. Biol. 26 (2020) 5942–5964. [CrossRef]
  34. A.T. Tekle, Seasonal Analysis of Maize Production Using DSSAT-CERES Model in Central Rift Valley of Ethiopia, J. Climatol. Weather Forecast. 9(291) (2021) 8.
  35. B.A. Lone, K.N. Singh, Z.A. Dar, S. Qayoom, P. Singh, A. Fayaz, S. Kumar, G. Singh, Seasonal Irrigation Analysis of Maize Using CERES Maize Model in DSSAT under Temperate Kashmir, Int. J. Pure Appl. Biosci. 5 (2017) 1229–1237. [CrossRef]
  36. B. Freduah, D. MacCarthy, M. Adam, M. Ly, A. Ruane, E. Timpong-Jones, P. Traore, K. Boote, C. Porter, S. Adiku, Sensitivity of Maize Yield in Smallholder Systems to Climate Scenarios in Semi-Arid Regions of West Africa: Accounting for Variability in Farm Management Practices, Agronomy. 9 (2019) 639. [CrossRef]
  37. D.A. Plummer, D. Caya, A. Frigon, H. Côté, M. Giguère, D. Paquin, S. Biner, R. Harvey, R. de Elia, Climate and Climate Change over North America as Simulated by the Canadian RCM, J. Clim. 19 (2006) 3112–3132. [CrossRef]
  38. M.A. IQBAL, J. EITZINGER, H. FORMAYER, A. HASSAN, L.K. HENG, A simulation study for assessing yield optimization and potential for water reduction for summer-sown maize under different climate change scenarios, J. Agric. Sci. 149 (2011) 129–143. [CrossRef]
  39. J. Masanganise, B. Chipindu, T. Mhizha, E. Mashonjowa, MODEL PREDICTION OF MAIZE YIELD RESPONSES TO CLIMATE CHANGE IN NORTH-EASTERN ZIMBABWE, African Crop Sci. J. 20 (2012) 505–515. Available online: https://tspace.library.utoronto.ca/bitstream/1807/47611/1/cs12063.pdf (accessed March 14, 2016).
  40. R. SARKAR, S. KAR, Evaluation of management strategies for sustainable rice–wheat cropping system, using DSSAT seasonal analysis, J. Agric. Sci. 144 (2006) 421–434. [CrossRef]
  41. Hoogenboom, A statistical comparison of the stochastic weather generators WGEN and SIMMETEO, Clim. Res. 24 (2003) 215–230. [CrossRef]
  42. J. Chen, F.P. Brissette, Comparison of five stochastic weather generators in simulating daily precipitation and temperature for the Loess Plateau of China, Int. J. Climatol. 34 (2014) 3089–3105. [CrossRef]
  43. D. Wallach, L.O. Mearns, M. Rivington, J.M. Antle, A.C. Ruane, Uncertainty in Agricultural Impact Assessment, in: C. Rosenzweig, D. Hillel (Eds.), Handb. Clim. Chang. Agroecosystems Agric. Model Intercomp. Improv. Proj. (AgMIP)., Imperial College Press, 2015: pp. 223–260. http://www.worldscientific.com/doi/abs/10.1142/9781783265640_0009.
  44. M. PARRY, C. ROSENZWEIG, A. IGLESIAS, G. FISCHER, M. LIVERMORE, Climate change and world food security: a new assessment, Glob. Environ. Chang. 9 (1999) S51–S67. [CrossRef]
  45. G.C. Nelson, H. Valin, R.D. Sands, P. Havlík, H. Ahammad, D. Deryng, J. Elliott, S. Fujimori, T. Hasegawa, E. Heyhoe, P. Kyle, M. Von Lampe, H. Lotze-Campen, D. Mason d’Croz, H. van Meijl, D. van der Mensbrugghe, C. Müller, A. Popp, R. Robertson, S. Robinson, E. Schmid, C. Schmitz, A. Tabeau, D. Willenbockel, Climate change effects on agriculture: Economic responses to biophysical shocks, Proc. Natl. Acad. Sci. 111 (2014) 3274–3279. [CrossRef]
  46. C. Rosenzweig, J.W. Jones, J.L. Hatfield, A.C. Ruane, K.J. Boote, P. Thorburn, J.M. Antle, G.C. Nelson, C. Porter, S. Janssen, S. Asseng, B. Basso, F. Ewert, D. Wallach, G. Baigorria, J.M. Winter, The Agricultural Model Intercomparison and Improvement Project (AgMIP): Protocols and pilot studies, Agric. For. Meteorol. 170 (2013) 166–182. [CrossRef]
  47. S. Asseng, B.A. Keating, I.R.P. Fillery, P.J. Gregory, J.W. Bowden, N.C. Turner, J.A. Palta, D.G. Abrecht, Performance of the APSIM-wheat model in Western Australia, F. Crop. Res. 57 (1998) 163–179.
  48. G. Hoogenboom, P.W. Wilkens, G.Y. Tsuji, DSSAT v3, volume 4, University of Hawaii, Honolulu, Hawaii, 1999.
  49. Ruiter, Delta-change approach for CMIP5 GCMs. Internship Report version 3, De Bilt, 2012.
  50. B.M. Msongaleli, F. Rwehumbiza, S.D. Tumbo, N. Kihupi, Impacts of Climate Variability and Change on Rainfed Sorghum and Maize: Implications for Food Security Policy in Tanzania, J. Agric. Sci. 7 (2015) 124–142. [CrossRef]
  51. V. Brovkin, L. Boysen, V.K. Arora, J.P. Boisier, P. Cadule, L. Chini, M. Claussen, P. Friedlingstein, V. Gayler, B.J.J.M. van den Hurk, G.C. Hurtt, C.D. Jones, E. Kato, N. de Noblet-Ducoudré, F. Pacifico, J. Pongratz, M. Weiss, Effect of Anthropogenic Land-Use and Land-Cover Changes on Climate and Land Carbon Storage in CMIP5 Projections for the Twenty-First Century, J. Clim. 26 (2013) 6859–6881. [CrossRef]
  52. J.P. Dunne, J.G. John, A.J. Adcroft, S.M. Griffies, R.W. Hallberg, E. Shevliakova, R.J. Stouffer, W. Cooke, K.A. Dunne, M.J. Harrison, J.P. Krasting, S.L. Malyshev, P.C.D. Milly, P.J. Phillipps, L.T. Sentman, B.L. Samuels, M.J. Spelman, M. Winton, A.T. Wittenberg, N. Zadeh, GFDL’s ESM2 Global Coupled Climate–Carbon Earth System Models. Part I: Physical Formulation and Baseline Simulation Characteristics, J. Clim. 25 (2012) 6646–6665. [CrossRef]
  53. J.P. Dunne, L.W. Horowitz, A.J. Adcroft, P. Ginoux, I.M. Held, J.G. John, J.P. Krasting, S. Malyshev, V. Naik, F. Paulot, E. Shevliakova, C.A. Stock, N. Zadeh, V. Balaji, C. Blanton, K.A. Dunne, C. Dupuis, J. Durachta, R. Dussin, P.P.G. Gauthier, S.M. Griffies, H. Guo, R.W. Hallberg, M. Harrison, J. He, W. Hurlin, C. McHugh, R. Menzel, P.C.D. Milly, S. Nikonov, D.J. Paynter, J. Ploshay, A. Radhakrishnan, K. Rand, B.G. Reichl, T. Robinson, D.M. Schwarzkopf, L.T. Sentman, S. Underwood, H. Vahlenkamp, M. Winton, A.T. Wittenberg, B. Wyman, Y. Zeng, M. Zhao, The GFDL Earth System Model Version 4.1 (GFDL-ESM 4.1): Overall Coupled Model Description and Simulation Characteristics, J. Adv. Model. Earth Syst. 12 (2020). [CrossRef]
  54. M.A. Giorgetta, J. Jungclaus, C.H. Reick, S. Legutke, J. Bader, M. Böttinger, V. Brovkin, T. Crueger, M. Esch, K. Fieg, K. Glushak, V. Gayler, H. Haak, H.-D. Hollweg, T. Ilyina, S. Kinne, L. Kornblueh, D. Matei, T. Mauritsen, U. Mikolajewicz, W. Mueller, D. Notz, F. Pithan, T. Raddatz, S. Rast, R. Redler, E. Roeckner, H. Schmidt, R. Schnur, J. Segschneider, K.D. Six, M. Stockhause, C. Timmreck, J. Wegner, H. Widmann, K.-H. Wieners, M. Claussen, J. Marotzke, B. Stevens, Climate and carbon cycle changes from 1850 to 2100 in MPI-ESM simulations for the Coupled Model Intercomparison Project phase 5, J. Adv. Model. Earth Syst. 5 (2013) 572–597. [CrossRef]
  55. W.A. Müller, J.H. Jungclaus, T. Mauritsen, J. Baehr, M. Bittner, R. Budich, F. Bunzel, M. Esch, R. Ghosh, H. Haak, T. Ilyina, T. Kleine, L. Kornblueh, H. Li, K. Modali, D. Notz, H. Pohlmann, E. Roeckner, I. Stemmler, F. Tian, J. Marotzke, A Higher-resolution Version of the Max Planck Institute Earth System Model (MPI-ESM1.2-HR), J. Adv. Model. Earth Syst. 10 (2018) 1383–1413. [CrossRef]
  56. S. Asseng, F. Ewert, C. Rosenzweig, J.W. Jones, J.L. Hatfield, A.C. Ruane, K.J. Boote, P.J. Thorburn, R.P. Rötter, D. Cammarano, N. Brisson, B. Basso, P. Martre, P.K. Aggarwal, C. Angulo, P. Bertuzzi, C. Biernath, A.J. Challinor, J. Doltra, S. Gayler, R. Goldberg, R. Grant, L. Heng, J. Hooker, L.A. Hunt, J. Ingwersen, R.C. Izaurralde, K.C. Kersebaum, C. Müller, S. Naresh Kumar, C. Nendel, G. O’Leary, J.E. Olesen, T.M. Osborne, T. Palosuo, E. Priesack, D. Ripoche, M.A. Semenov, I. Shcherbak, P. Steduto, C. Stöckle, P. Stratonovitch, T. Streck, I. Supit, F. Tao, M. Travasso, K. Waha, D. Wallach, J.W. White, J.R. Williams, J. Wolf, Uncertainty in simulating wheat yields under climate change, Nat. Clim. Chang. 3 (2013) 627–632. [CrossRef]
  57. T.J. Raddatz, C.H. Reick, W. Knorr, J. Kattge, E. Roeckner, R. Schnur, K.-G. Schnitzler, P. Wetzel, J. Jungclaus, Will the tropical land biosphere dominate the climate–carbon cycle feedback during the twenty-first century?, Clim. Dyn. 29 (2007) 565–574. [CrossRef]
  58. J.S. Bojanowski, M. Donatelli, A.K. Skidmore, A. Vrieling, An auto-calibration procedure for empirical solar radiation models, Environ. Model. Softw. 49 (2013) 118–128. [CrossRef]
  59. R. Mahmood, K.G. Hubbard, Effect of time of temperature observation and estimation of daily solar radiation for the northern Great Plains, USA, Agron. J. 94 (2002) 723–733. [CrossRef]
  60. J.S. Bojanowski, sirad: Functions for Calculating Daily Solar Radiation and Evapotranspiration, (2016) 33. Available online: https://cran.r-project.org/package=sirad.
  61. G.J. Roerink, J.S. Bojanowski, A.J.W. de Wit, H. Eerens, I. Supit, O. Leo, H.L. Boogaard, Evaluation of MSG-derived global radiation estimates for application in a regional crop model, Agric. For. Meteorol. 160 (2012) 36–47. [CrossRef]
  62. G. Hoogenboom, C.H. Porter, K.J. Boote, V. Shelia, P.W. Wilkens, U. Singh, J.W. White, S. Asseng, J.I. Lizaso, L.P. Moreno, W. Pavan, R. Ogoshi, L.A. Hunt, G.Y. Tsuji, J.W. Jones, The DSSAT crop modeling ecosystem, in: K.J. Boote (Ed.), Adv. Crop Model. a Sustain. Agric., Burleigh Dodds Science Publishing, Cambridge, United Kingdom, 2019: pp. 173–216. [CrossRef]
  63. G. Hoogenboom, C.H. Porter, V. Shelia, K.J. Boote, U. Singh, J.W. White, L.A. Hunt, R. Ogoshi, J.I. Lizaso, J. Koo, S. Asseng, A. Singels, L.P. Moreno, J.W. Jones, Decision Support System for Agrotechnology Transfer (DSSAT) Version 4.7.5, (2019). https://dssat.net.
  64. C.H.B. Priestley, R.J. Taylor, On the assessment of surface heat flux and evaporation using large-scale parameters, Mon. Wheater Rev. 100 (1972) 81–92. [CrossRef]
  65. Z. Hao, Q. Ju, W. Jiang, C. Zhu, Characteristics and scenarios projection of climate change on the tibetan plateau, Sci. World J. (2013) 9. [CrossRef]
  66. A.R.R. Ngwira, J.B. Aune, C. Thierfelder, DSSAT modelling of conservation agriculture maize response to climate change in Malawi, Soil Tillage Res. 143 (2014) 85–94. [CrossRef]
  67. T. Khan, Y. Wang, The Probability Distribution of Maximum Temperature to Assess the Suitable Statistical Models: Take the North-East and Southern Regions of Pakistan, Res. Sq. (2021) 22. [CrossRef]
  68. G. Maúre, I. Pinto, M. Ndebele-Murisa, M. Muthige, C. Lennard, G. Nikulin, A. Dosio, A. Meque, The southern African climate under 1.5 °C and 2 °C of global warming as simulated by CORDEX regional climate models, Environ. Res. Lett. 13 (2018) 9. [CrossRef]
  69. J.E. Cairns, J. Hellin, K. Sonder, J.L. Araus, J.F. MacRobert, C. Thierfelder, B.M. Prasanna, Adapting maize production to climate change in sub-Saharan Africa, Food Secur. 5 (2013) 345–360. [CrossRef]
  70. GRZ, Final National Adaptation Plan for Zambia, (2023) 137.
  71. Hoogenboom, E. Luedeling, K.M. Hadgu, I. Kisekka, L.G. Martorano, Assessment of maize growth and yield using crop models under present and future climate in southwestern Ethiopia, Agric. For. Meteorol. 214 (2015) 252–265. [CrossRef]
  72. F. Boberg, P. Berg, P. Thejll, W.J. Gutowski, J.H. Christensen, Improved confidence in climate change projections of precipitation evaluated using daily statistics from the PRUDENCE ensemble, Clim. Dyn. 32 (2009) 1097–1106. [CrossRef]
  73. J. Masanganise, M. Magodora, T. Mapuwei, K. Basira, An assessment of CMIP5 global climate model performance using probability density functions and a match metric method, Sci. Insights An Int. J. 4 (2014) 1–8.
  74. Kay, Introduction and Review of Statistics, in: Oper. Amplif. Noise, Elsevier, Amsterdam, The Netherlands, 2012: pp. 1–11. [CrossRef]
  75. I.G. Watterson, Calculation of probability density functions for temperature and precipitation change under global warming, J. Geophys. Res. 113 (2008) 1–13. [CrossRef]
  76. G. Wu, Y. Tian, F. Gong, J. Du, C. Shi, Variations in the probability distribution function of air temperature anomalies in winter and summer from 1961 to 2016 over China, Int. J. Climatol. (2021) 1–13. [CrossRef]
  77. A.C. Ruane, C. Rosenzweig, S. Asseng, K.J. Boote, J. Elliott, F. Ewert, J.W. Jones, P. Martre, S.P. McDermid, C. Müller, A. Snyder, P.J. Thorburn, An AgMIP framework for improved agricultural representation in integrated assessment models, Environ. Res. Lett. 12 (2017) 125003. [CrossRef]
  78. K. Azeem, S. Shah, N. Ahmad, S.T. Shah, F. Khan, Y. Arafat, F. Naz, I. Azeem, M. Ilyas, Physiological indices, biomass and economic yield of maize influenced by humic acid and nitrogen levels, Russ. Agric. Sci. 41 (2015) 115–119. [CrossRef]
  79. C.B. Chisanga, M. Moombe, E. Phiri, Modelling climate change impacts on maize, CABI Rev. 17 (2022) 11. [CrossRef]
  80. G. Mandrini, D.S. Bullock, N.F. Martin, Modeling the economic and environmental effects of corn nitrogen management strategies in Illinois, F. Crop. Res. 261 (2021) 13. [CrossRef]
  81. L.A. Puntel, J.E. Sawyer, D.W. Barker, P.J. Thorburn, M.J. Castellano, K.J. Moore, A. VanLoocke, E.A. Heaton, S. V. Archontoulis, A Systems Modeling Approach to Forecast Corn Economic Optimum Nitrogen Rate, Front. Plant Sci. 9 (2018) 15. [CrossRef]
  82. B. Sultan, M. Gaetani, Agriculture in West Africa in the Twenty-First Century: Climate Change and Impacts Scenarios, and Potential for Adaptation, Front. Plant Sci. 7 (2016) 1–20. [CrossRef]
  83. H. Liu, J. Yang, P. He, Y. Bai, J. Jin, C.F. Drury, Y. Zhu, X. Yang, W. Li, J. Xie, J. Yang, G. Hoogenboom, Optimizing Parameters of CSM-CERES-Maize Model to Improve Simulation Performance of Maize Growth and Nitrogen Uptake in Northeast China, J. Integr. Agric. 11 (2012) 1898–1913. [CrossRef]
  84. M. Waongo, P. Laux, H. Kunstmann, Adaptation to climate change: The impacts of optimized planting dates on attainable maize yields under rainfed conditions in Burkina Faso, Agric. For. Meteorol. 205 (2015) 23–39. [CrossRef]
  85. Y. Lin, Z. Feng, W. Wu, Y. Yang, Y. Zhou, C. Xu, Potential Impacts of Climate Change and Adaptation on Maize in Northeast China, Agron. J. 109 (2017) 1476–1490. [CrossRef]
  86. P. Rugira, J. Ma, L. Zheng, C. Wu, E. Liu, Application of DSSAT CERES-Maize to Identify the Optimum Irrigation Management and Sowing Dates on Improving Maize Yield in Northern China, Agronomy. 11 (2021) 16. [CrossRef]
  87. NSW, Maize growth and development, NSW Department of Primary Industries, State of New South Wales, 2009. (accessed , 2016). Available online: https://www.dpi.nsw.gov.au/__data/assets/pdf_file/0007/516184/Procrop-maize-growth-and-development.pdf (accessed July 8, 2016).
  88. P. Arumugam, A. Chemura, B. Schauberger, C. Gornott, Near Real-Time Biophysical Rice (Oryza sativa L.) Yield Estimation to Support Crop Insurance Implementation in India, Agronomy. 10 (2020) 19. [CrossRef]
  89. Singh, N.S. Raghuwanshi, C. Chatterjee, J. Froebrich, Spatial variability of climate change impacts on yield of rice and wheat in the Indian Ganga Basin, Sci. Total Environ. 468–469 (2013) S132–S138. [CrossRef]
  90. S. Priya, R. Shibasaki, National spatial crop yield simulation using GIS-based crop production model, Ecol. Modell. 136 (2001) 113–129. [CrossRef]
  91. D. Sudharsan, J. Adinarayana, D.R. Reddy, G. Sreenivas, S. Ninomiya, M. Hirafuji, T. Kiura, K. Tanaka, U.B. Desai, S.N. Merchant, Evaluation of weather-based rice yield models in India, Int. J. Biometeorol. 57 (2013) 107–123. [CrossRef]
  92. W. Malik, R. Isla, F. Dechmi, DSSAT-CERES-maize modelling to improve irrigation and nitrogen management practices under Mediterranean conditions, Agric. Water Manag. 213 (2019) 298–308. [CrossRef]
  93. I.L. Kadigi, J.W. Richardson, K.D. Mutabazi, D. Philip, S.K. Mourice, W. Mbungu, J.-C. Bizimana, S. Sieber, The effect of nitrogen-fertilizer and optimal plant population on the profitability of maize plots in the Wami River sub-basin, Tanzania: A bio-economic simulation approach, Agric. Syst. 185 (2020) 102948. [CrossRef]
  94. C. Rosenzweig, J. Jones, J. Antle, J. Hatfield, Protocols for AgMIP Regional Integrated Assessments Version 6.0, (2015) 62.
  95. W.T. Bowen, P.K. Thornton, G. Hoogenboom, The simulation of cropping sequences using DSSAT, in: Syst. Approaches Sustain. Agric. Dev., Springer, Dordrecht, 1998: pp. 313–327. [CrossRef]
  96. D. Lomeling, S.J. Huria, Using the DSSAT-CROPGRO model to simulate gross margin and N-leaching of cowpea fertigated with human urine, Arch. Agric. Environ. Sci. 5 (2020) 1–10. [CrossRef]
  97. R. Mulwa, K.P.C. Rao, S. Gummadi, M. Kilavi, Impacts of climate change on agricultural household welfare in Kenya, Clim. Res. 67 (2016) 11. Available online: https://www.jstor.org/stable/24896549.
Disclaimer/Publisher’s Note: The statements, opinions and data contained in all publications are solely those of the individual author(s) and contributor(s) and not of MDPI and/or the editor(s). MDPI and/or the editor(s) disclaim responsibility for any injury to people or property resulting from any ideas, methods, instructions or products referred to in the content.
Copyright: This open access article is published under a Creative Commons CC BY 4.0 license, which permit the free download, distribution, and reuse, provided that the author and preprint are cited in any reuse.
Prerpints.org logo

Preprints.org is a free preprint server supported by MDPI in Basel, Switzerland.

Subscribe

© 2024 MDPI (Basel, Switzerland) unless otherwise stated