Submitted:
30 January 2024
Posted:
31 January 2024
You are already at the latest version
Abstract
Keywords:
1. Introduction
2. Materials and Methods
2.1. Fruit Sampling
2.2. Drying Procedures
2.3. Extraction and determination of total anthocyanins, total phenolics and antioxidant capacity
2.4. Determination of Total Soluble Solids Content, Dry Matter Content, pH and Ash Content
2.5. Statistical Analysis
3. Results and Discussion
3.1. Chemical Properties of Fresh and Dried Blackberry Fruits
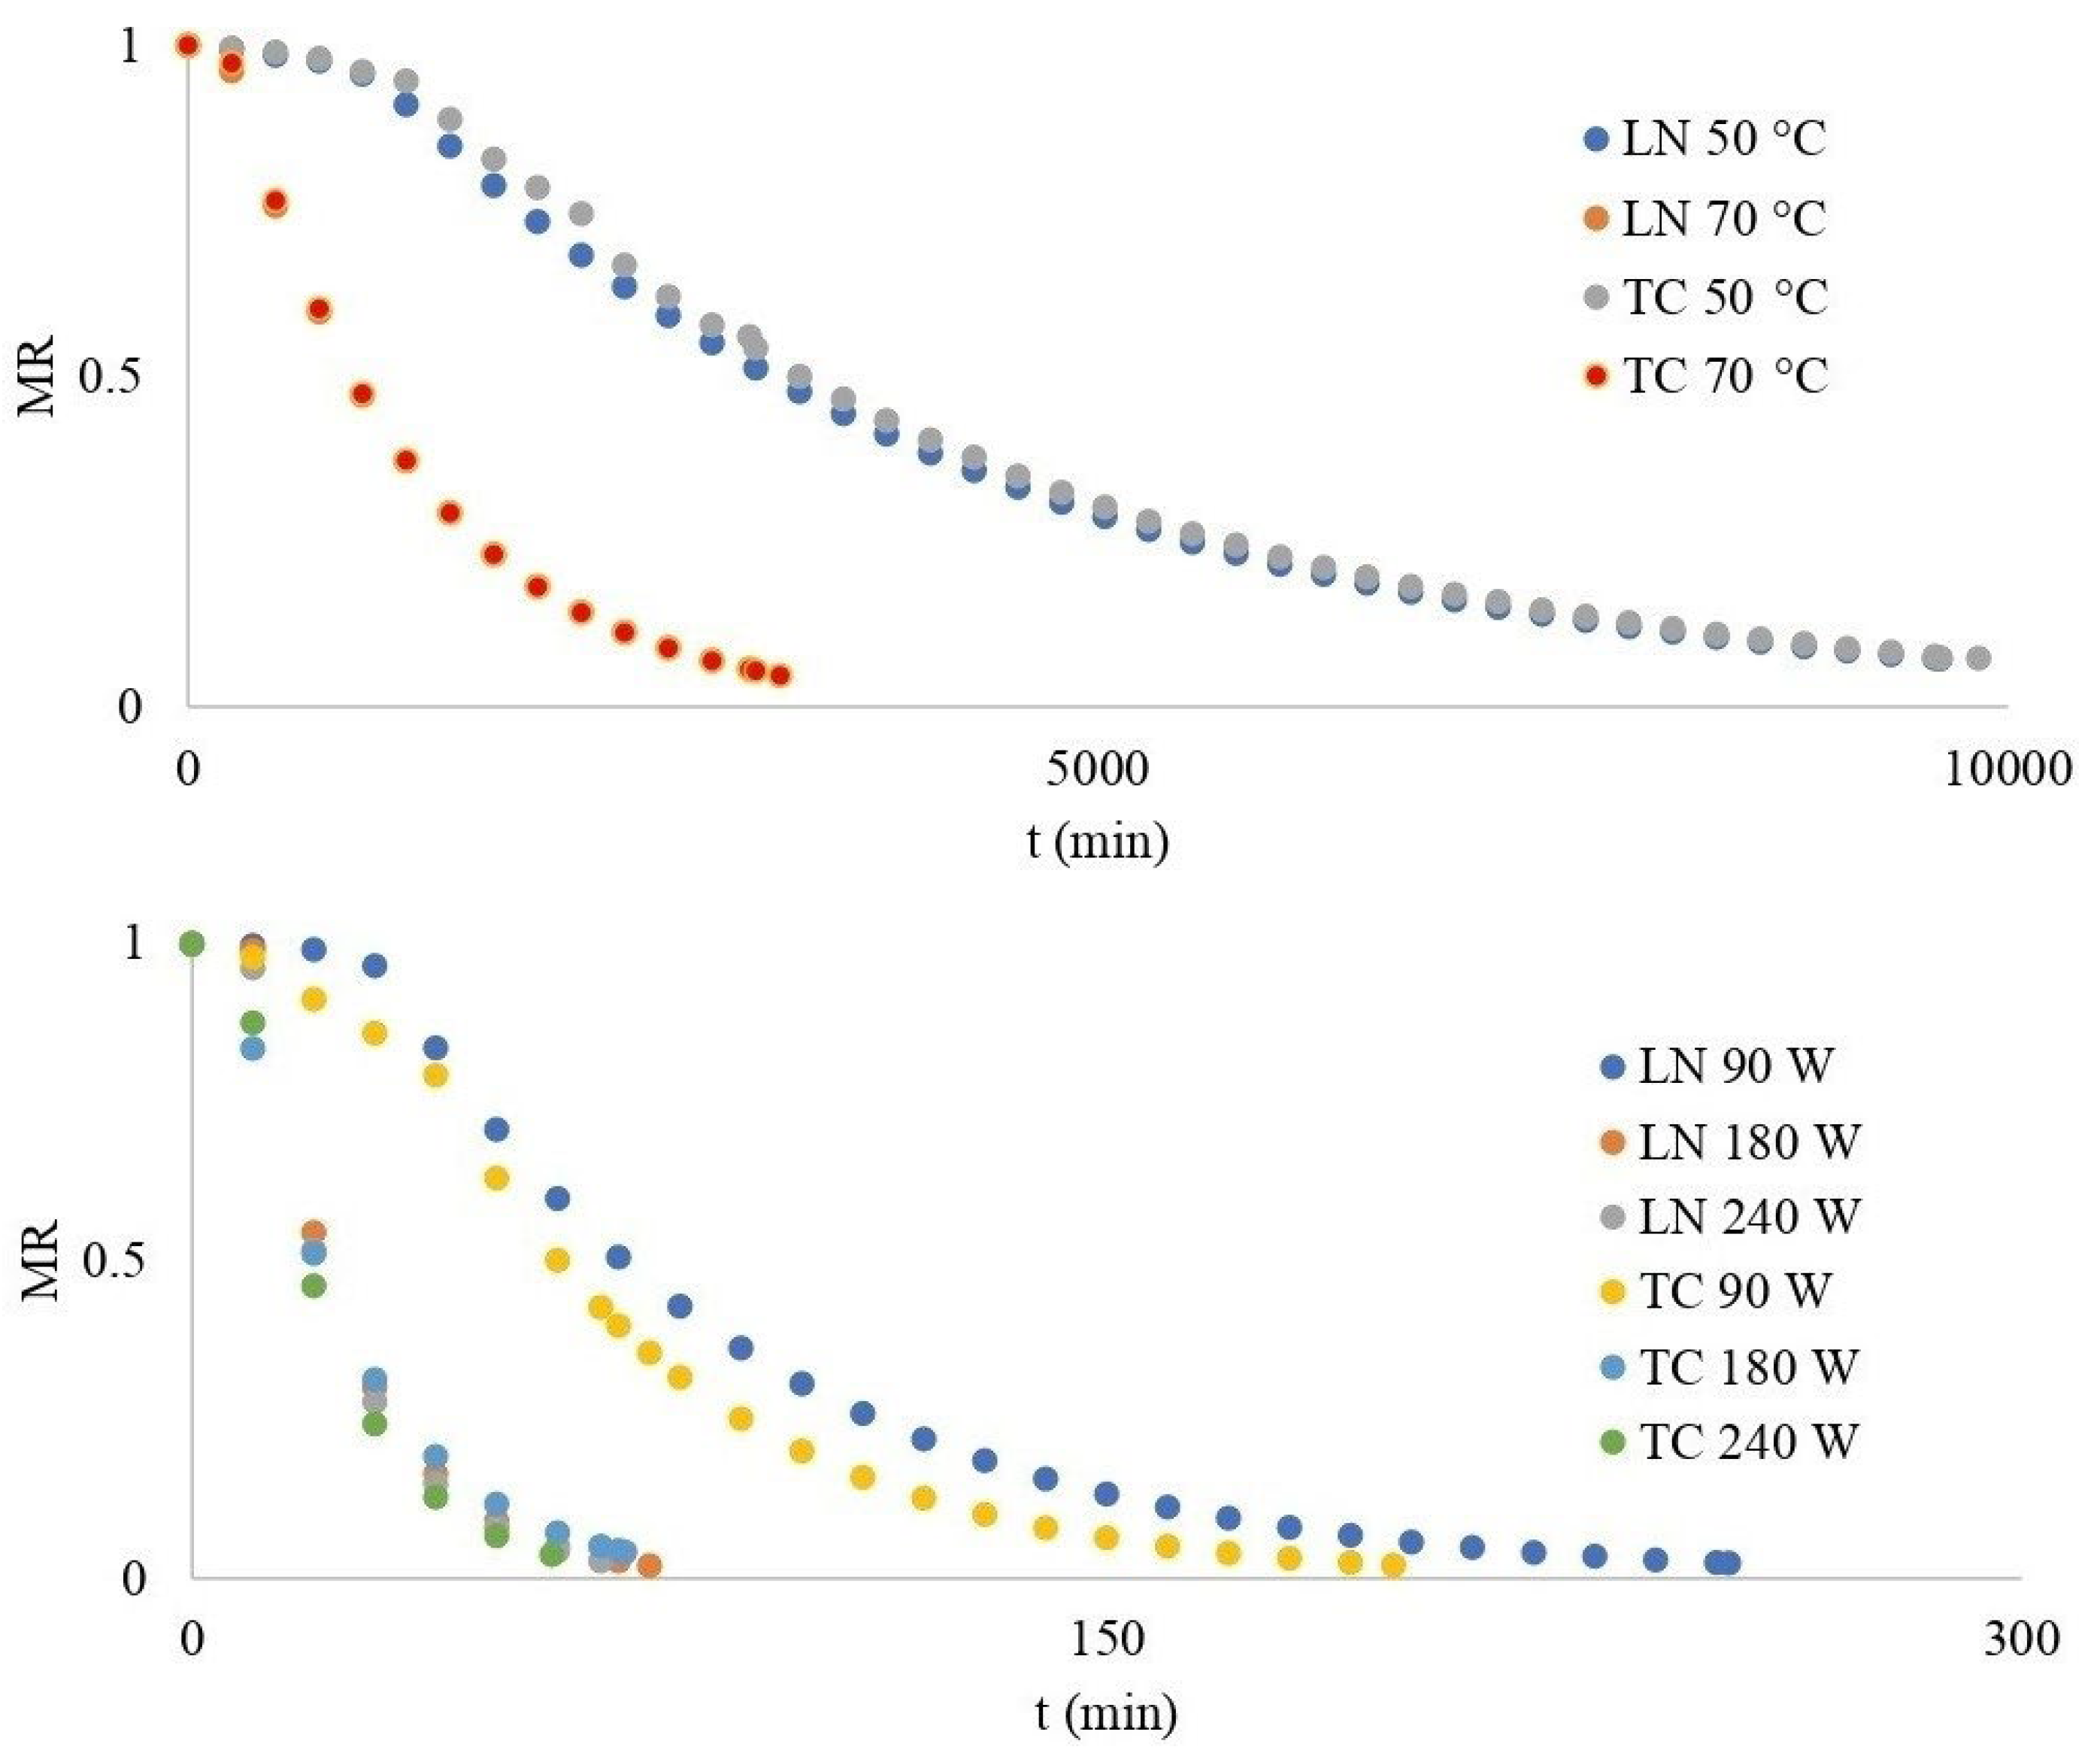
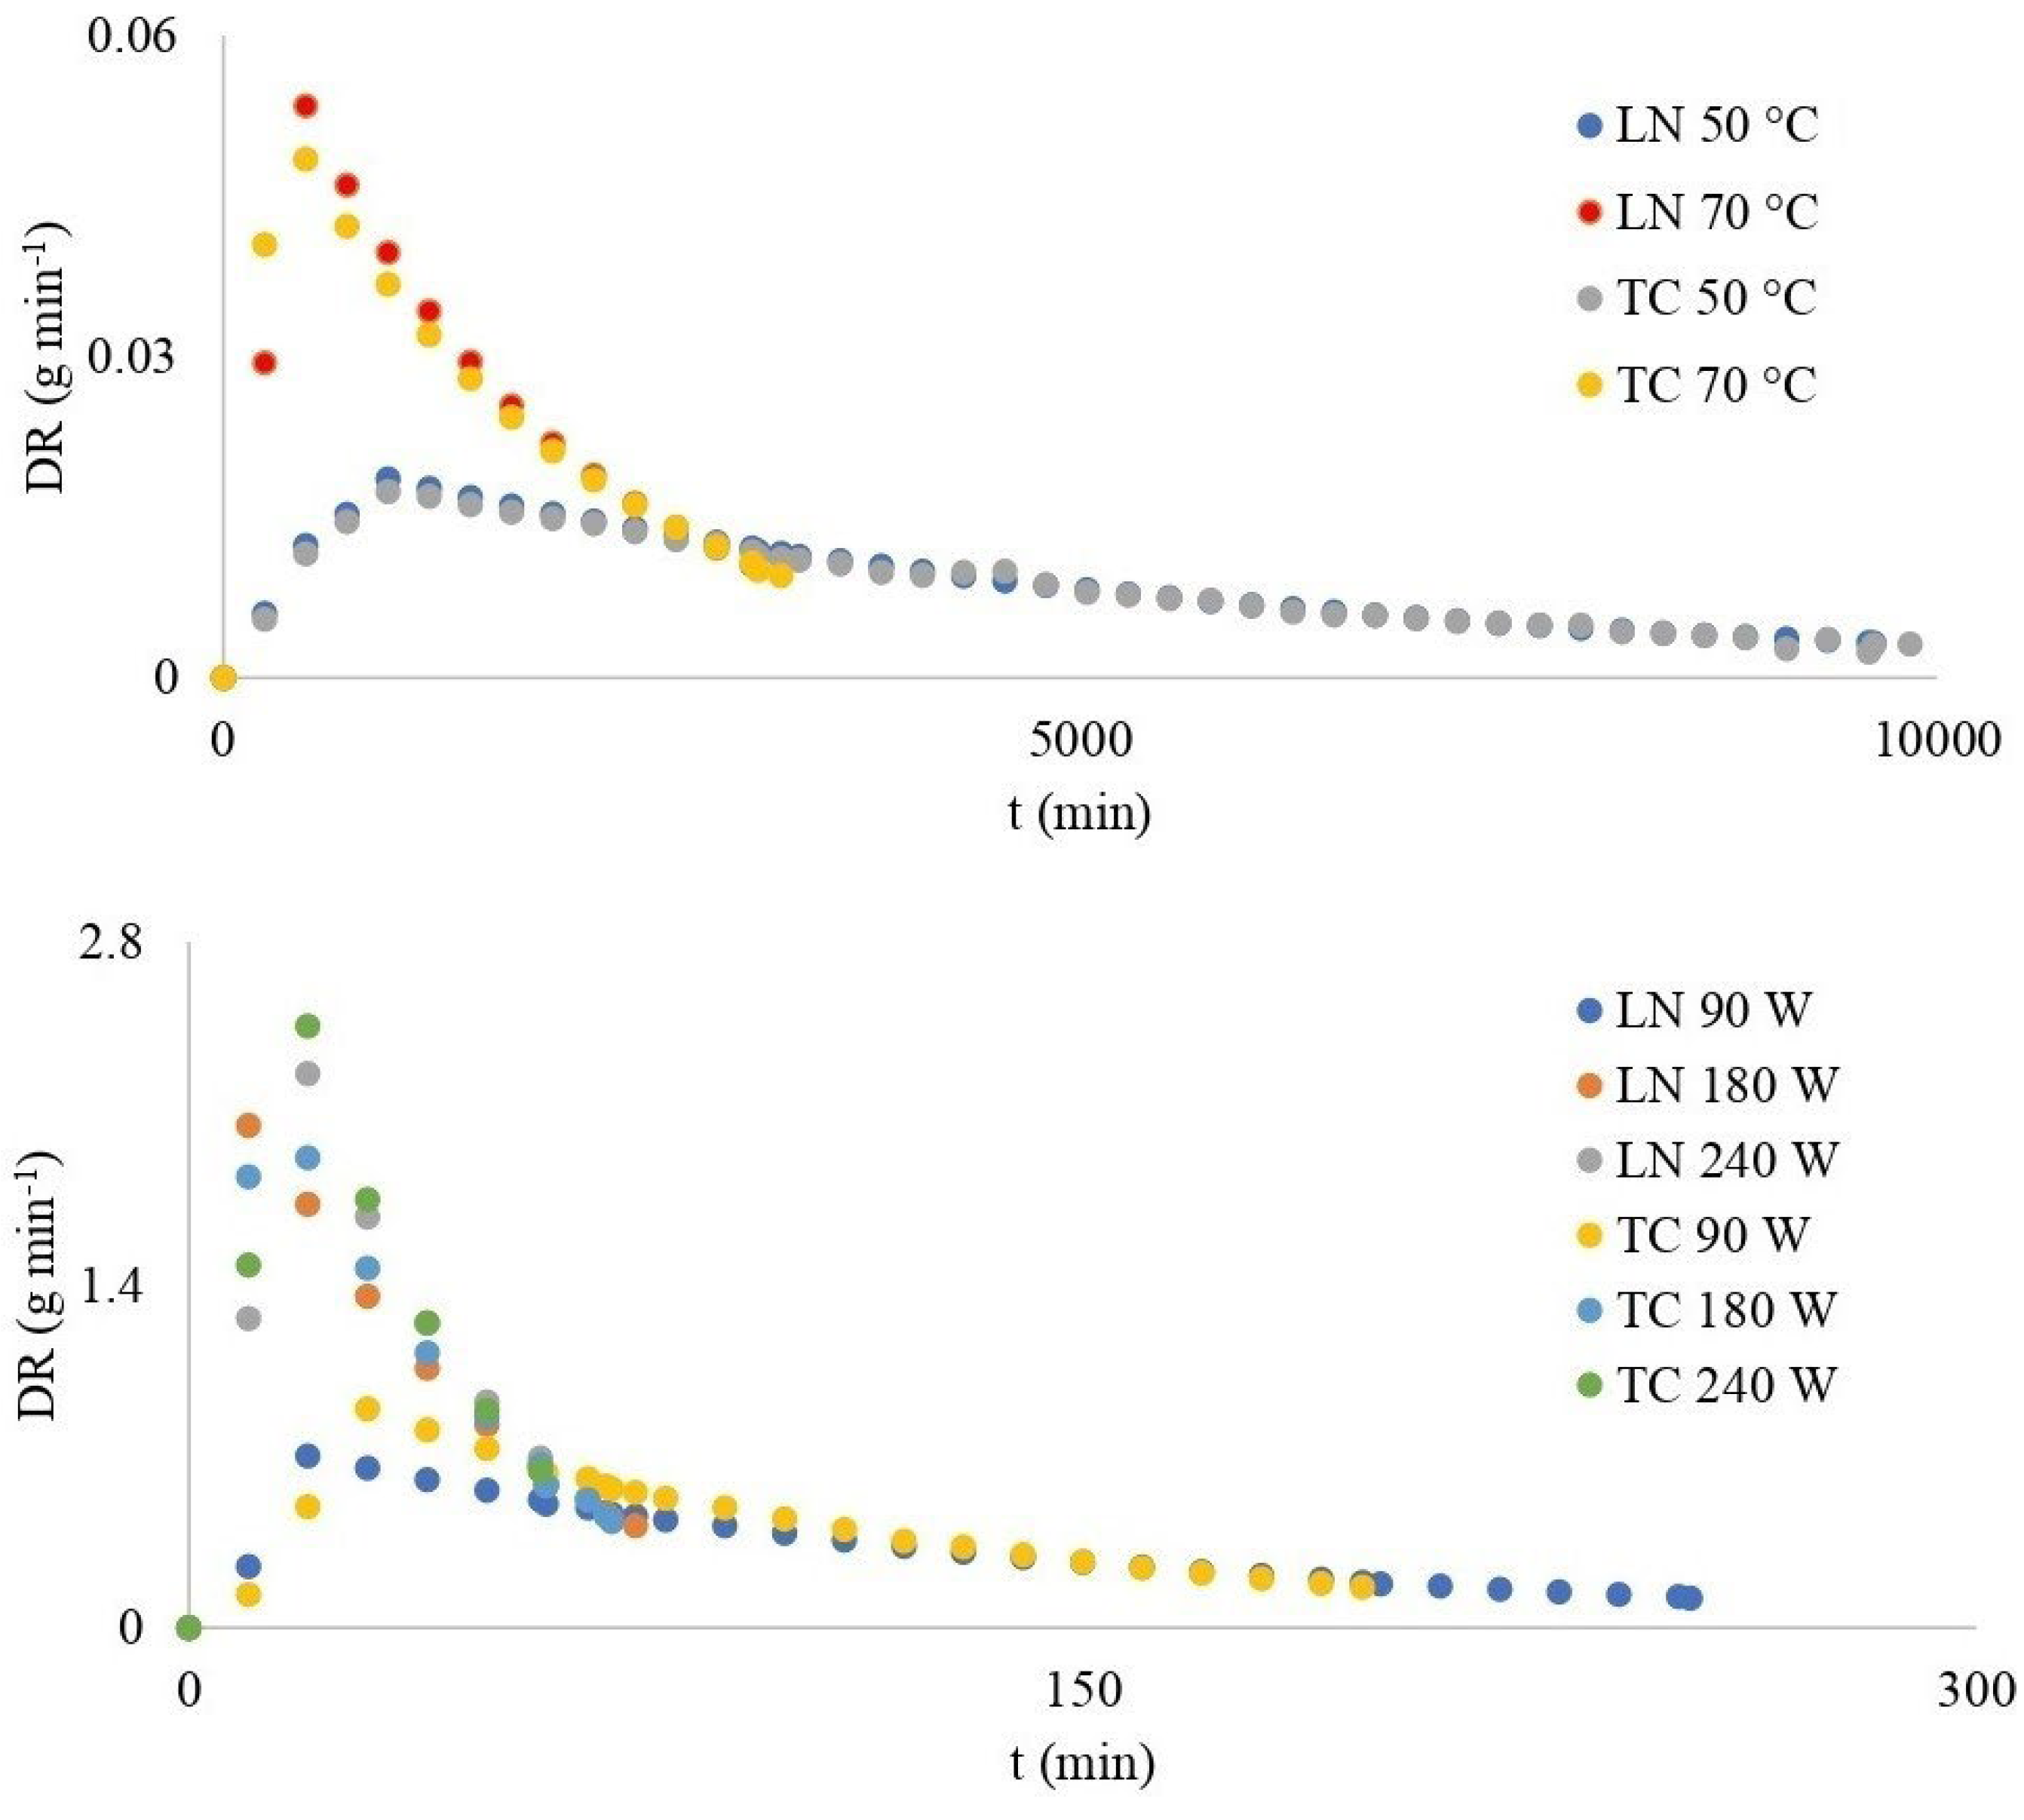
3.2. Thin-Layer Convective and Microwave Drying of Blackberries
3.3. Determination of Effective Moisture Diffusivity and Energy of Activation
3.4. Determination of Energy Consumption
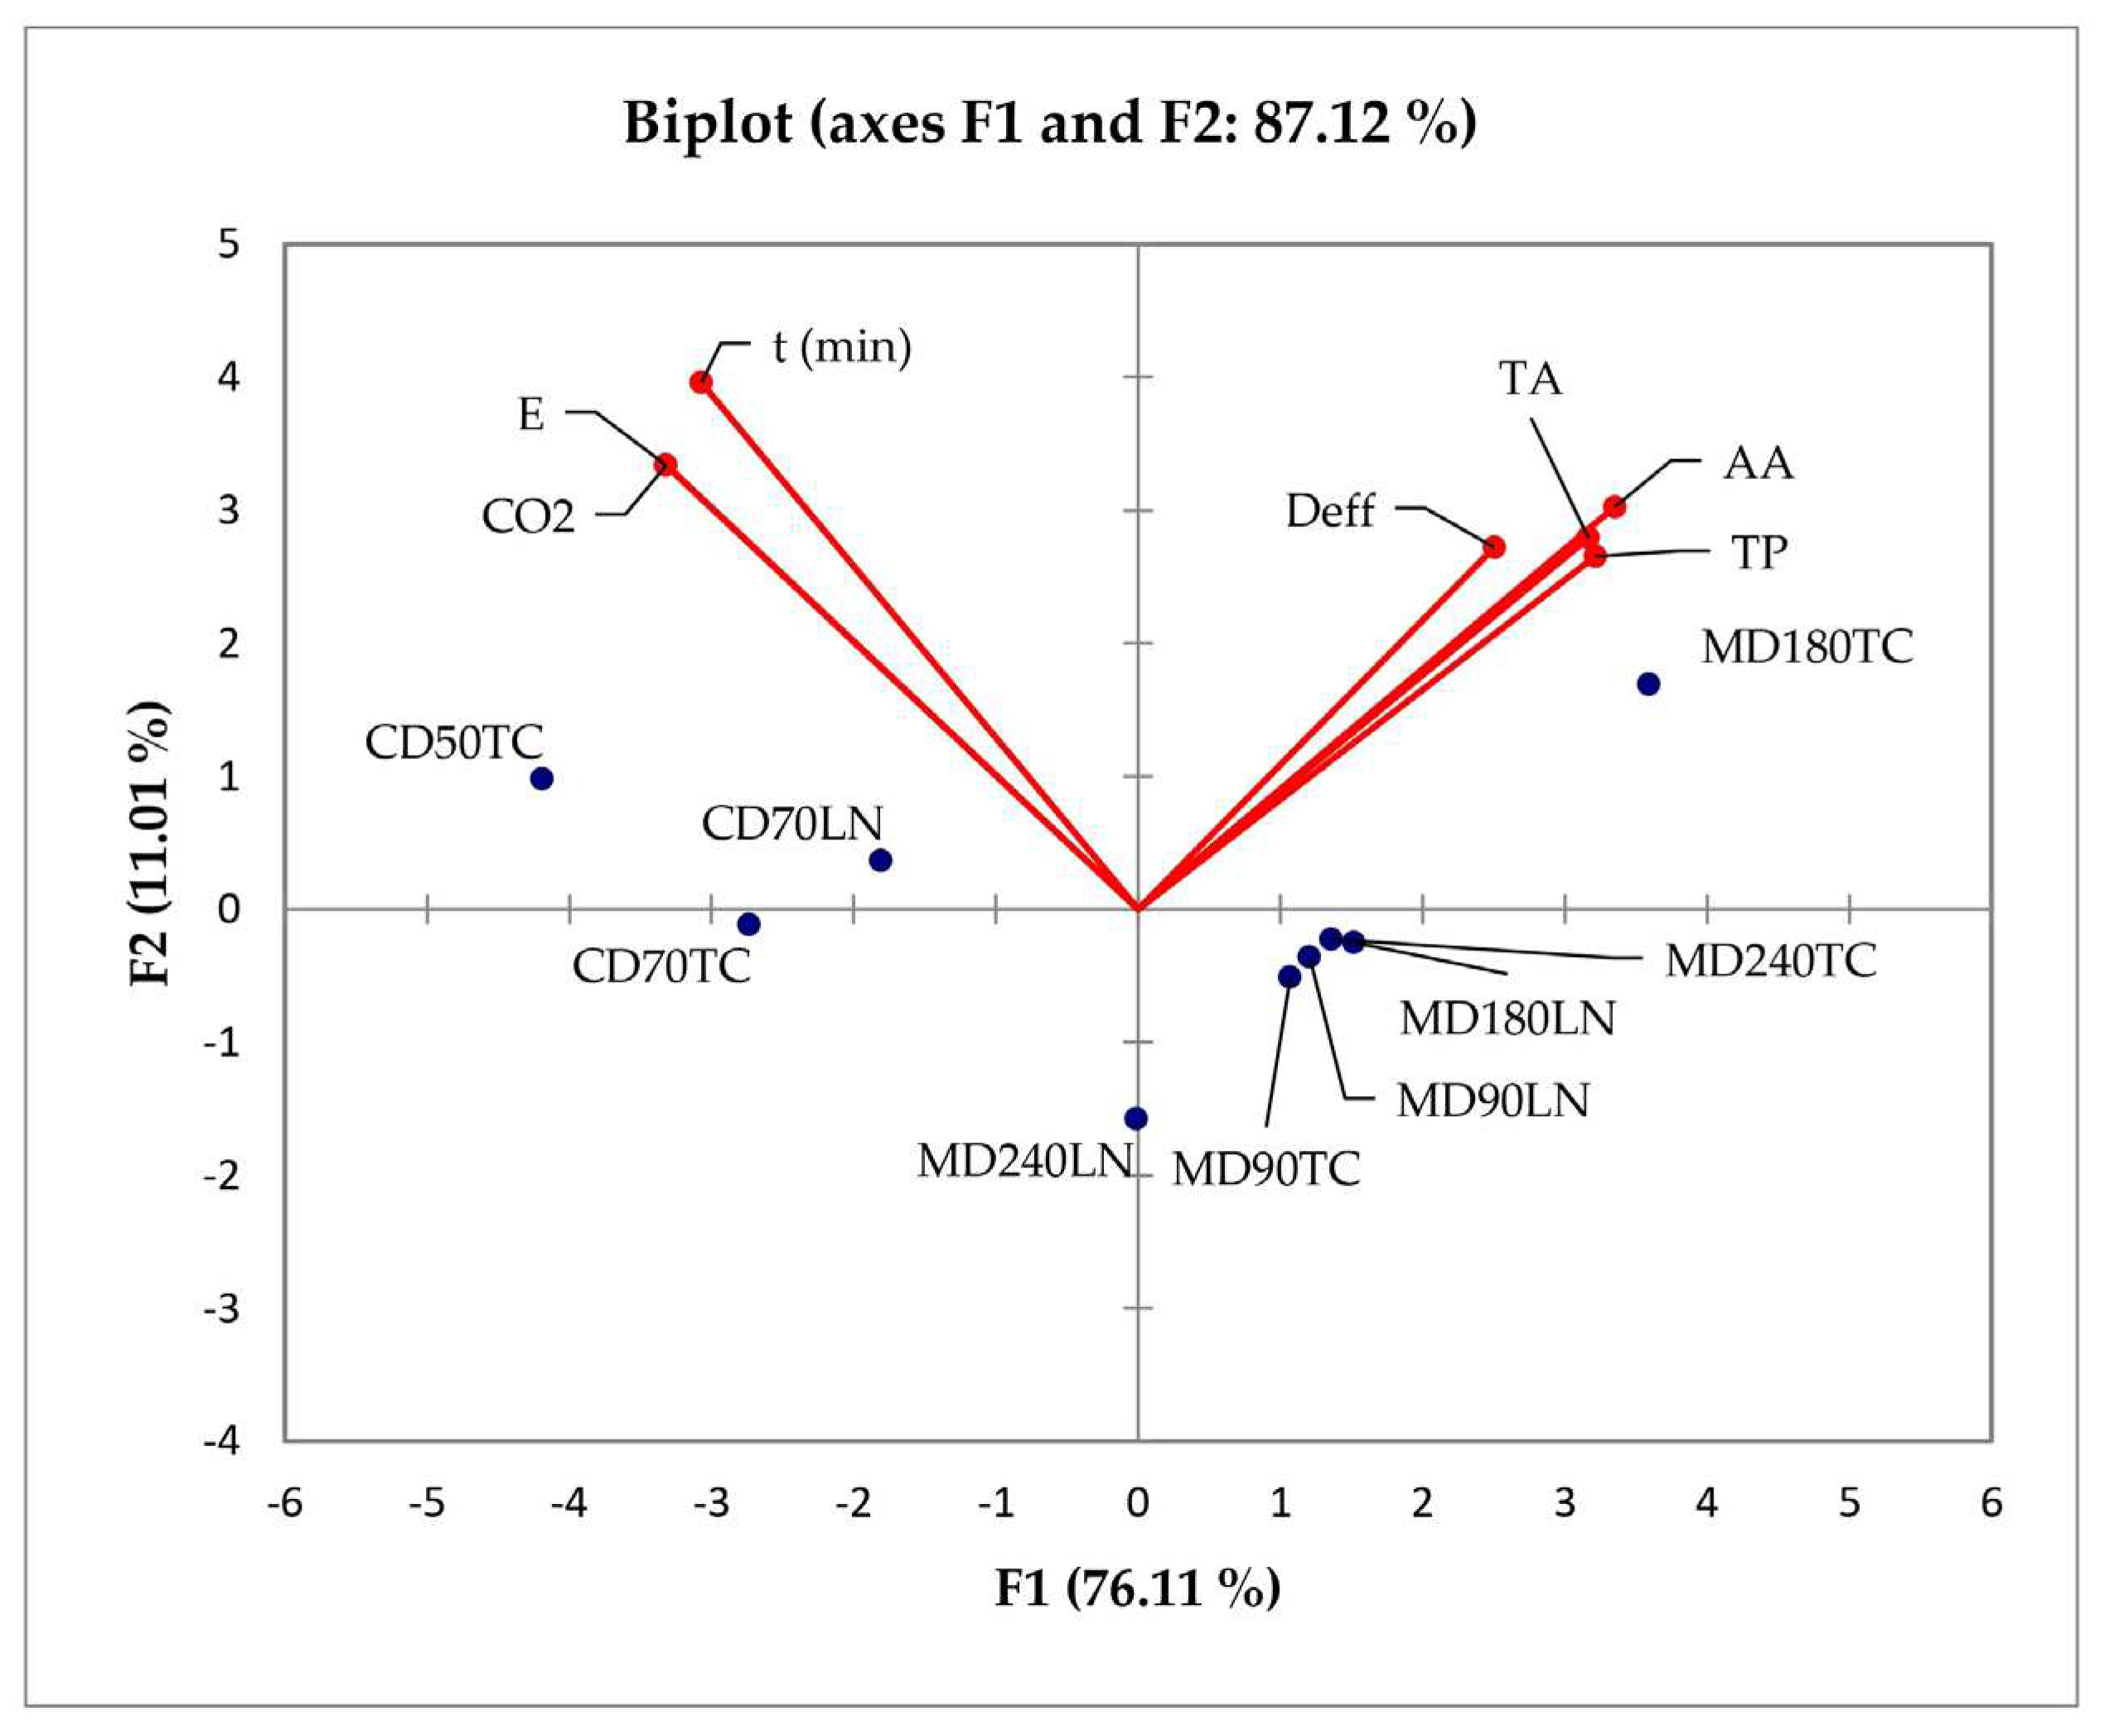
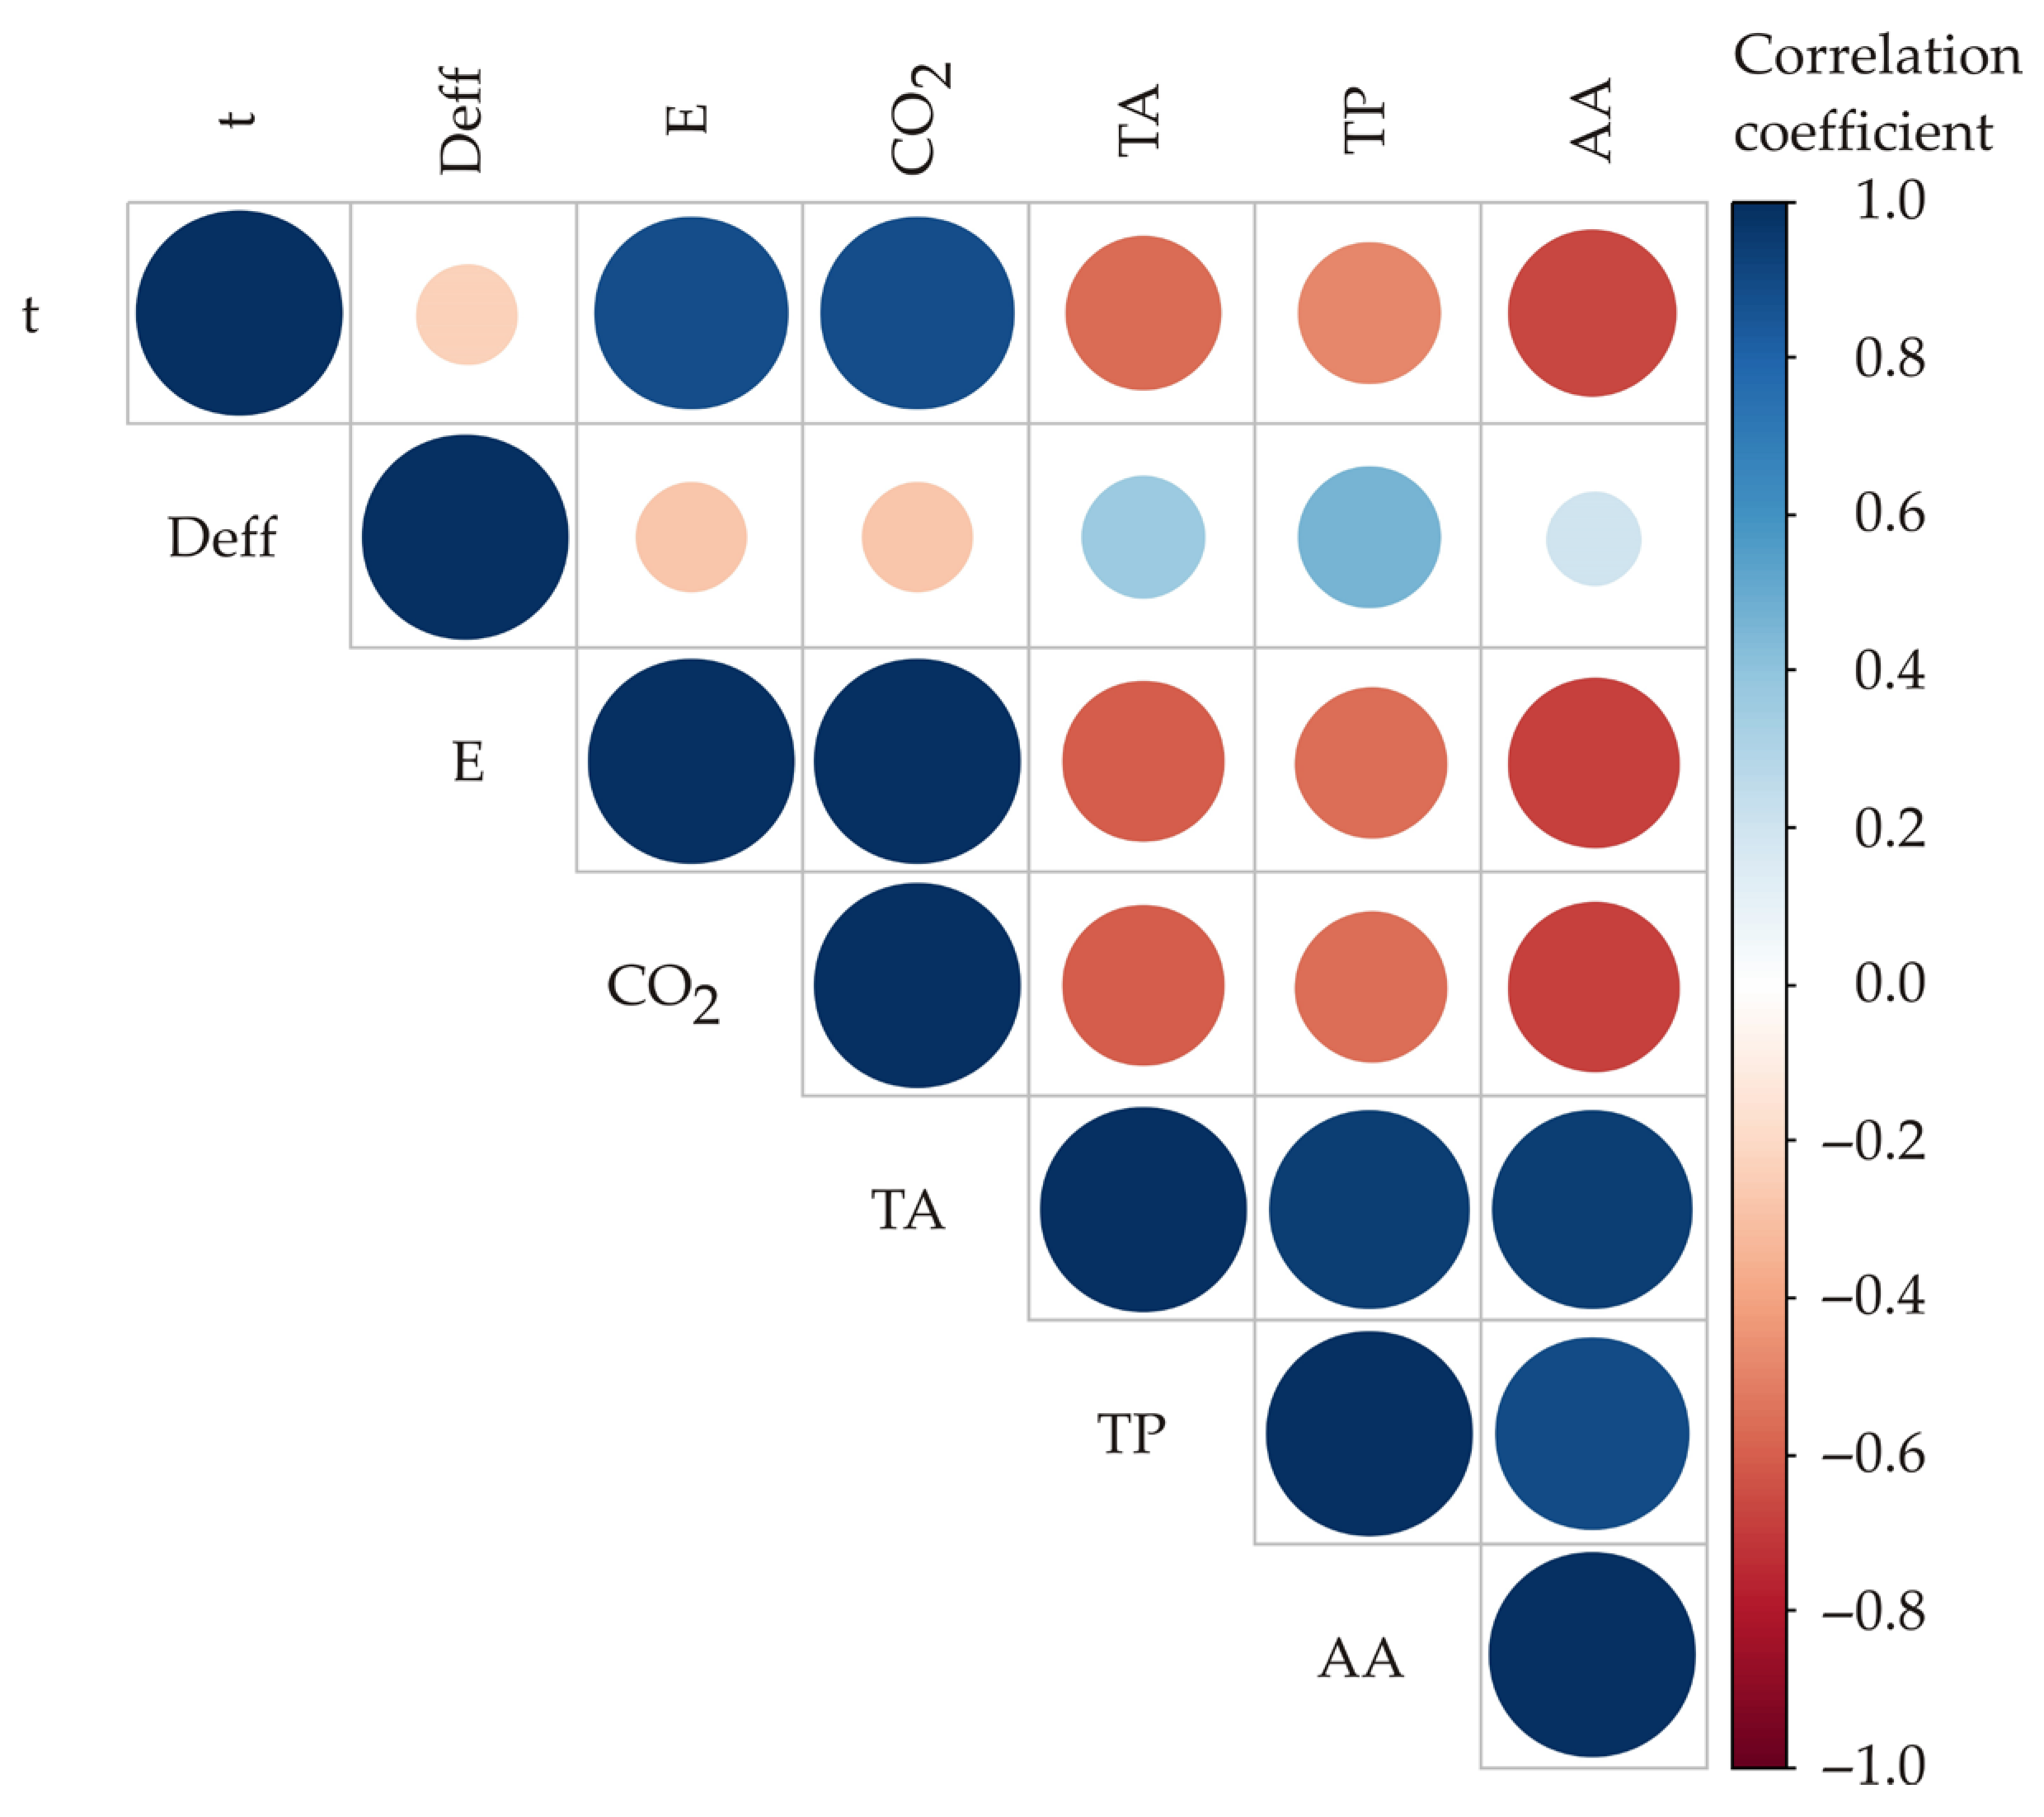
3.4. Statistical Analysis
Author Contributions
Funding
Data Availability Statement
Conflicts of Interest
References
- Kaume, L.; Howard, L.R. , Devareddy, L. The blackberry fruit: A review on its composition and chemistry, metabolism and bioavailability, and health Benefits. J. Agric. Food Chem. 2012, 60, 5716–5727. [Google Scholar] [CrossRef]
- Lee, J. Blackberry fruit quality components, composition, and potential health benefits. In Blackberries and their hybrids; Hall, H.K., Funt, R.C., Eds.; CABI: Wallingford, UK, 2017. [Google Scholar]
- Shi, H.; Yu, L.L. Dried berries: Phytochemicals and health benefits of blackberries and black currants. In Dried fruits: Phytochemicals and health effects; Alasalvar, C., Shahidi, F., Eds.; Wiley-Blackwell: Hoboken, New Jersey, US, 2012; p. 5574. [Google Scholar]
- Menon, A.; Stojceska, V.; Tassou, S.A. A systematic review on the recent advances of the energy efficiency improvements in non-conventional food drying technologies. Trends Food Sci. Technol. 2020, 100, 67–76. [Google Scholar] [CrossRef]
- Orsat, V.; Changrue, V.; Raghavan, G.S.V. Microwave drying of fruits and vegetables. Stewart Postharvest Rev. 2006, 6, 4–9. [Google Scholar] [CrossRef]
- Radojčin, M.; Pavkov, I.; Bursać Kovaćević, D.; Putnik, P.; Wiktor, A.; Stamenković, Z.; Kešelj, K.; Gere, A. Effect of selected drying methods and emerging drying intensification technologies on the quality of dried fruit: A review. Processes 2021, 9, 132. [Google Scholar] [CrossRef]
- Calín-Sánchez, Á.; Lipan, L.; Cano-Lamadrid, M.; Kharaghani, A.; Masztalerz, K.; Carbonell-Barrachina, Á.A.; Figiel, A. Comparison of traditional and novel drying techniques and its effect on quality of fruits, vegetables and aromatic herbs. Foods 2020, 9, 1261. [Google Scholar] [CrossRef] [PubMed]
- Nićetin, M.; Pezo, L.; Pergal, M.; Lončar, B.; Filipović, V.; Knežević, V.; Demir, H.; Filipović, J.; Manojlović, D. Celery root phenols content, antioxidant capacities and their correlations after osmotic dehydration in molasses. Foods 2022, 11, 1945. [Google Scholar] [CrossRef] [PubMed]
- Lončar, B.; Filipović, V.; Nićetin, M.; Knežević, V.; Filipović, J.; Pezo, L.; Šuput, D. Mass transfer rate and osmotic treatment efficiency of peaches. Acta Univ. Sapientiae Aliment. 2022, 15, 1–10. [Google Scholar] [CrossRef]
- Woods, F.M.; Dozier, W.A.D.Jr.; Ebel, R.C.; Thomas, R.H.; Nesbitt, M.; Wilkins, B.S.; Himelrick, D.G. Fruit quality and antioxidant properties in Alabama-grown blackberries during fruit maturation. Int. J. Fruit Sci. 2007, 6, 67–85. [Google Scholar] [CrossRef]
- Zia-Ul-Haq, M.; Riaz, M.; De Feo, V.; Jaafar, H.Z.E.; Moga, M. Rubus fruticosus L.: Constituents, biological activities and health related uses. Molecules 2014, 19, 10998–11029. [Google Scholar] [CrossRef] [PubMed]
- Memete, A.R.; Sărac, I.; Teusdea, A.C.; Budău, R.; Bei, M.; Vicas, S.S. Bioactive compounds and antioxidant capacity of several blackberry (Rubus spp.) fruits cultivars grown in Romania. Horticulturae 2023, 9, 556. [Google Scholar] [CrossRef]
- Enaru, B.; Drețcanu, G.; Pop, T.D.; Stǎnilǎ, A.; Diaconeasa, Z. Anthocyanins: Factors affecting their stability and degradation. Antioxidants 2021, 10, 1967. [Google Scholar] [CrossRef]
- Lachowicz, S.; Michalska, A.; Lech, K.; Majerska, J.; Oszmiański, J.; Figiel, A. Comparison of the effect of four drying methods on polyphenols in saskatoon berry. LWT - Food Sci. Technol. 2019, 111, 727–736. [Google Scholar] [CrossRef]
- Petković, M.; Filipović, V.; Lončar, B.; Filipović, J.; Miletić, N.; Malešević, Z.; Jevremović, D. A Comparative analysis of thin‒layer microwave and microwave/convective dehydration of chokeberry. Foods 2023, 12, 1651. [Google Scholar] [CrossRef]
- Eminoğlu, M.B.; Yegül, U.; Sacilik, K. Drying characteristics of blackberry fruits in a convective hot-air dryer. HortScience 2019, 54, 1546–1550. [Google Scholar] [CrossRef]
- Pantelić, V.; Miletić, N.; Milovanović, V.; Đurović, I.; Petković, M.; Lukyanov, A.; Filipović, V. Energy usage and raspberry convective and microwave drying parameters. In Proceedings of the 1st International Symposium on Biotechnology, Čačak, Serbia, 17–18 March 2023; pp. 451–456. [Google Scholar] [CrossRef]
- AOAC. Official Method of Analysis, Association of Official Analytical Chemists, No 934.01, 16th ed.; AOAC: Arlington, VA, USA, 1995. [Google Scholar]
- Petković, M.; Miletić, N.; Kurćubić, V.; Lukyanov, A.; Ðurović, I.; Filipović, V.; Mladenović, V. Energy consumption and dehydration parameters of microwave drying of carrot. Acta Agric. Serb. 2022, 27, 137–142. [Google Scholar] [CrossRef]
- Doymaz, I. Drying kinetics of white mulberry. J. Food Eng. 2004, 61, 1546–1550. [Google Scholar] [CrossRef]
- Azimi-Nejadian, H.; Hoseini, S.S. Study the effect of microwave power and slices thickness on drying characteristics of potato. Heat Mass Transf. 2019, 55, 2921–2930. [Google Scholar] [CrossRef]
- Taghinezhad, E.; Kaveh, M. Modeling and optimization of specific energy consumption and green house gas emissions during drying of organic blackberry with different pretreatments by response surface methodology. IJBSE 2020, 51, 351–369. [Google Scholar] [CrossRef]
- Tao, Y.; Li, D.; Siong Chai, W.; Show, P.L.; Yang, X.; Manickam, S.; Guangjie, X.; Han, Y. Comparison between airborne ultrasound and contact ultrasound to intensify air drying of blackberry: Heat and mass transfer simulation, energy consumption and quality evaluation. Ultrason. Sonochem. 2021, 72, 105410. [Google Scholar] [CrossRef]
- Taghinezhad, E.; Kaveh, M.; Khalife, E.; Chen, G. Drying of organic blackberry in combined hot air-infrared dryer with ultrasound pretreatment. Dry. Technol. [CrossRef]
- Ćurčić, L.; Lončar, B.; Pezo, L.; Stojić, N.; Prokić, D.; Filipović, V.; Pucarević, M. Chemometric approach to pesticide residue analysis in surface water. Water 2022, 14, 4089. [Google Scholar] [CrossRef]
- Malešević, Z.; Govedarica-Lučić, A.; Bošković, I.; Petković, M.; Đukić, D.; Đurović, V. Influence of different nutrient sources and genotypes on the chemical quality and yield of lettuce. Arch. Tech. Scie. 2023, 29, 49–56. [Google Scholar] [CrossRef]
- Filipović, V.; Lončar, B.; Knežević, V.; Nićetin, M.; Filipović, J.; Petković, M. Modeling the effect of selected microorganisms’ exposure to molasses’s high‒osmolality environment. Appl. Sci. 2023, 13, 1207. [Google Scholar] [CrossRef]
- Sozzi, A.; Zambon, M.; Mazza, G.; Salvatori, D. Fluidized bed drying of blackberry wastes: Drying kinetics, particle characterization and nutritional value of the obtained granular solids. Powder Technol. 2021, 385, 37–49. [Google Scholar] [CrossRef]


| Cultivar | Dry matter content (%) | Soluble solid content (%) | pH | Ash content (%) |
|---|---|---|---|---|
| Loch Ness | 15.3 ± 0.1 | 9.7 ± 0.1 | 3.40 ± 0.15 | 0.34± 0.04 |
| Triple Crown | 15.2 ± 0.1 | 9.8 ± 0.1 | 3.61 ± 0.10 | 0.30 ± 0.05 |
| ANOVA | ns | ns | ns | ns |
| Total anthocyanins (mg/100 g dm) | Total phenolics (mg/100 g dm) |
Antioxidant capacity (mmol TE/100 g dm) | |||||
|---|---|---|---|---|---|---|---|
| Loch Ness |
Triple Crown | Loch Ness |
Triple Crown | Loch Ness |
Triple Crown | ||
| Fresh | 503.9 ±16.7a | 331.0 ± 9.4b | 1280.0 ± 150.5a | 796.0 ± 151.7b | 7.49 ± 0.94a | 4.86 ± 0.84b | |
| CD* | 50 °C | 1.3 ±0.2g | 0.9 ±0.1g | 149.8 ± 18.0h | 79.3 ±3.0i | 0.64 ± 0.03fg | 0.43 ± 0.08g |
| 70 °C | 16.7 ± 1.7ef | 5.8 ± 0.3fg | 229.6 ± 0.6f | 53.1 ± 6.2i | 0.95 ± 0.00ef | 0.82 ± 0.07efg | |
| MD* | 90 W | 46.3 ± 1.9d | 52.5 ± 2.5d | 296.3 ± 25.7e | 255.8 ±0.1f | 1.51 ± 0.13d | 1.20 ± 0.09de |
| 180W | 51.8 ± 1.6d | 83.5 ± 4.4c | 418.4 ± 6.6d | 502.2 ± 25.7c | 1.45 ± 0.06d | 2.35 ± 0.19c | |
| 240 W | 17.2 ± 1.4ef | 19.9 ± 1.5e | 196.0 ± 19.4g | 246.1 ±2.4f | 0.95 ± 0.01ef | 1.48 ± 0.10d | |
| ANOVA | *** | *** | *** | ||||
| Drying time (min) |
Deff (m2s-1) |
Ea** |
E (kWh) |
CO2 (kg) |
|||||||
|---|---|---|---|---|---|---|---|---|---|---|---|
| Loch Ness | Triple Crown | Loch Ness |
Triple Crown |
Loch Ness |
Triple Crown | Loch Ness |
Triple Crown |
Loch Ness |
Triple Crown | ||
| CD | 50 °C | 9629 ± 41b | 10156 ± 94a | 7.09×10⁻¹¹ ± 6.02×10⁻¹² e | 7.77×10⁻¹¹ ± 5.83×10⁻¹² e | 54.45 ± 2.54a | 54.45 ± 1.94a | 6.75 ± 0.21b | 7.36± 0.26a | 6.74 ± 0.30b | 7.34 ± 0.26a |
| 70 °C | 3086 ± 37d | 3255 ± 47c | 2.36×10⁻¹⁰ ± 2.32×10⁻¹¹e | 2.59×10⁻¹⁰ ± 2.16×10⁻¹¹ e | 5.61 ± 0.28d | 6.11 ± 0.18c | 5.59 ± 0.28d | 6.1 ±0.18c | |||
| MD | 90 W | 252 ± 13e | 197 ± 11e | 3.98×10⁻⁹ ± 2.94×10⁻¹⁰ d | 5.94×10⁻⁹ ± 1.88×10⁻¹⁰ c | 16.66 ±1.63a* | 12.06 ± 0.71a* | 0.38 ± 0.02e | 0.30 ±0.02e | 0.38 ± 0.02e | 0.29 ± 0.02e |
| 180W | 75 ± 8f | 71 ± 7f | 1.42×10⁻⁸ ± 6.86×10⁻¹⁰ b | 1.43×10⁻⁸ ± 4.05×10⁻¹⁰ b | 0.23 ± 0.01e | 0.19 ±0.01e | 0.23 ± 0.01e | 0.19 ± 0.02e | |||
| 240 W | 67 ± 7f | 59 ± 5f | 1.48×10⁻⁸ ± 1.10×10⁻⁹ b | 1.66×10⁻⁸ ± 9.48× 10⁻¹⁰ a | 0.23 ± 0.02e | 0.21 ± 0.01e | 0.23 ± 0.02e | 0.21 ± 0.01e | |||
| ANOVA | *** | *** | *** | *** | *** | ||||||
Disclaimer/Publisher’s Note: The statements, opinions and data contained in all publications are solely those of the individual author(s) and contributor(s) and not of MDPI and/or the editor(s). MDPI and/or the editor(s) disclaim responsibility for any injury to people or property resulting from any ideas, methods, instructions or products referred to in the content. |
© 2024 by the authors. Licensee MDPI, Basel, Switzerland. This article is an open access article distributed under the terms and conditions of the Creative Commons Attribution (CC BY) license (http://creativecommons.org/licenses/by/4.0/).


