Submitted:
30 January 2024
Posted:
31 January 2024
You are already at the latest version
Abstract
Keywords:
1. Introduction
2. Materials and Methods
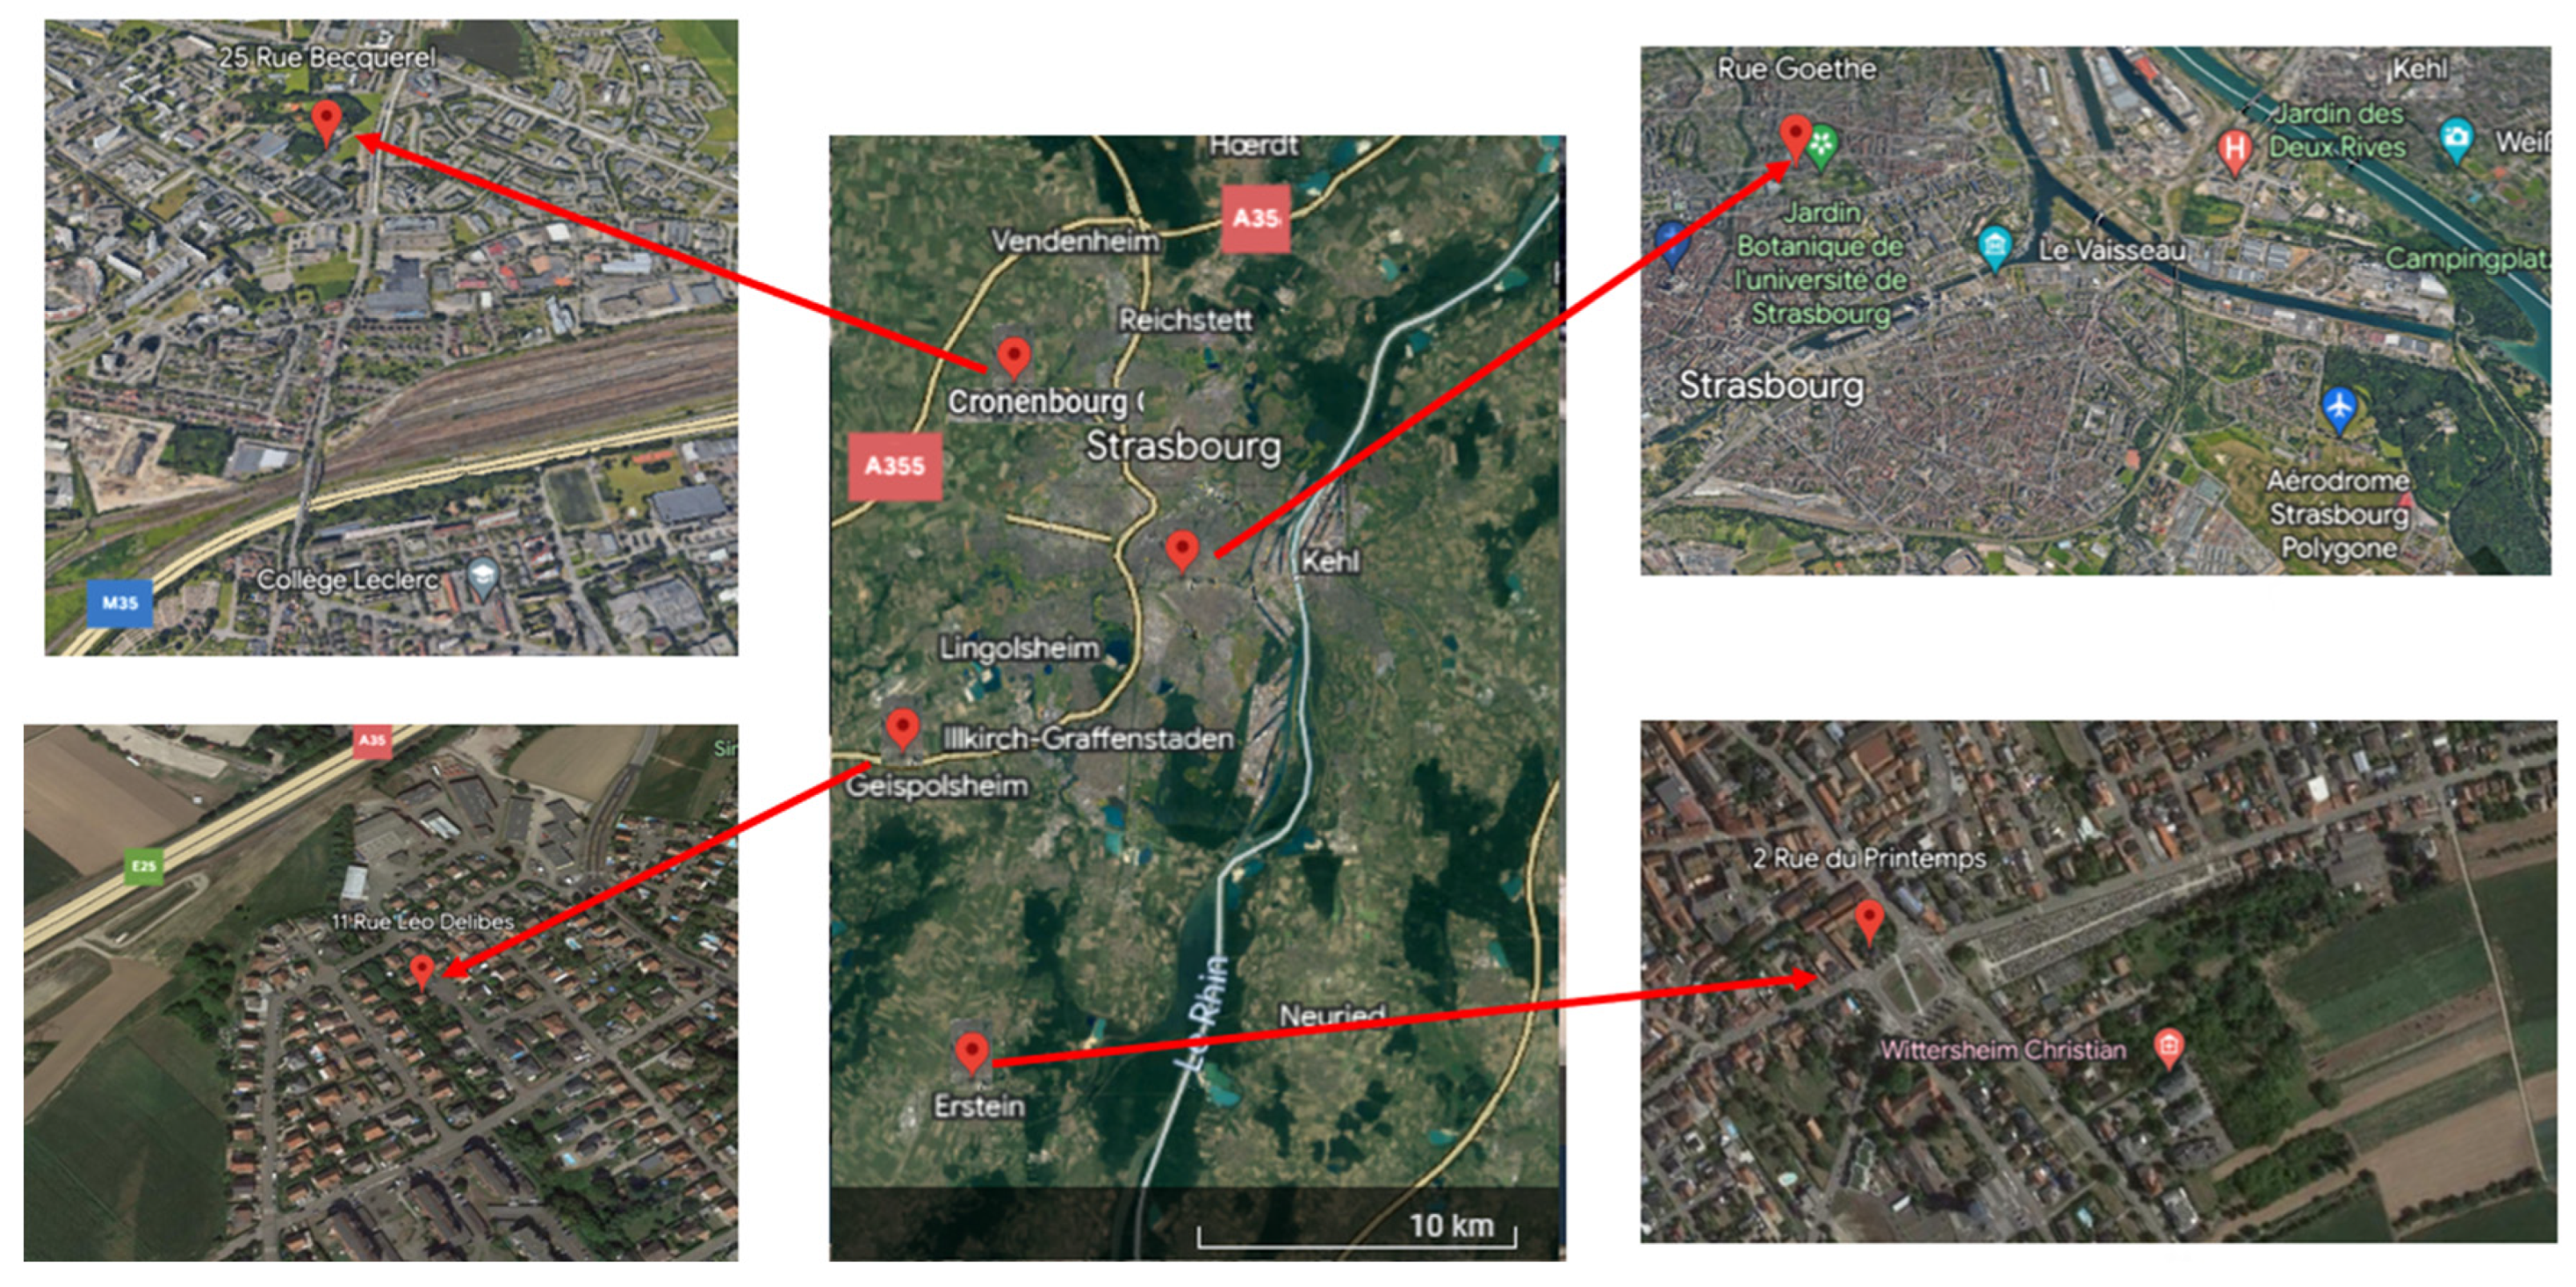
2.1. Study Sites
2.1. Sampling Campaign
2.2. Analytical Procedure of Fogwater Samples
2.1.1. Samples Treatment
2.1.2. Extraction Procedure
2.1.3. Chromatographic Analysis
3. Results and Discussion
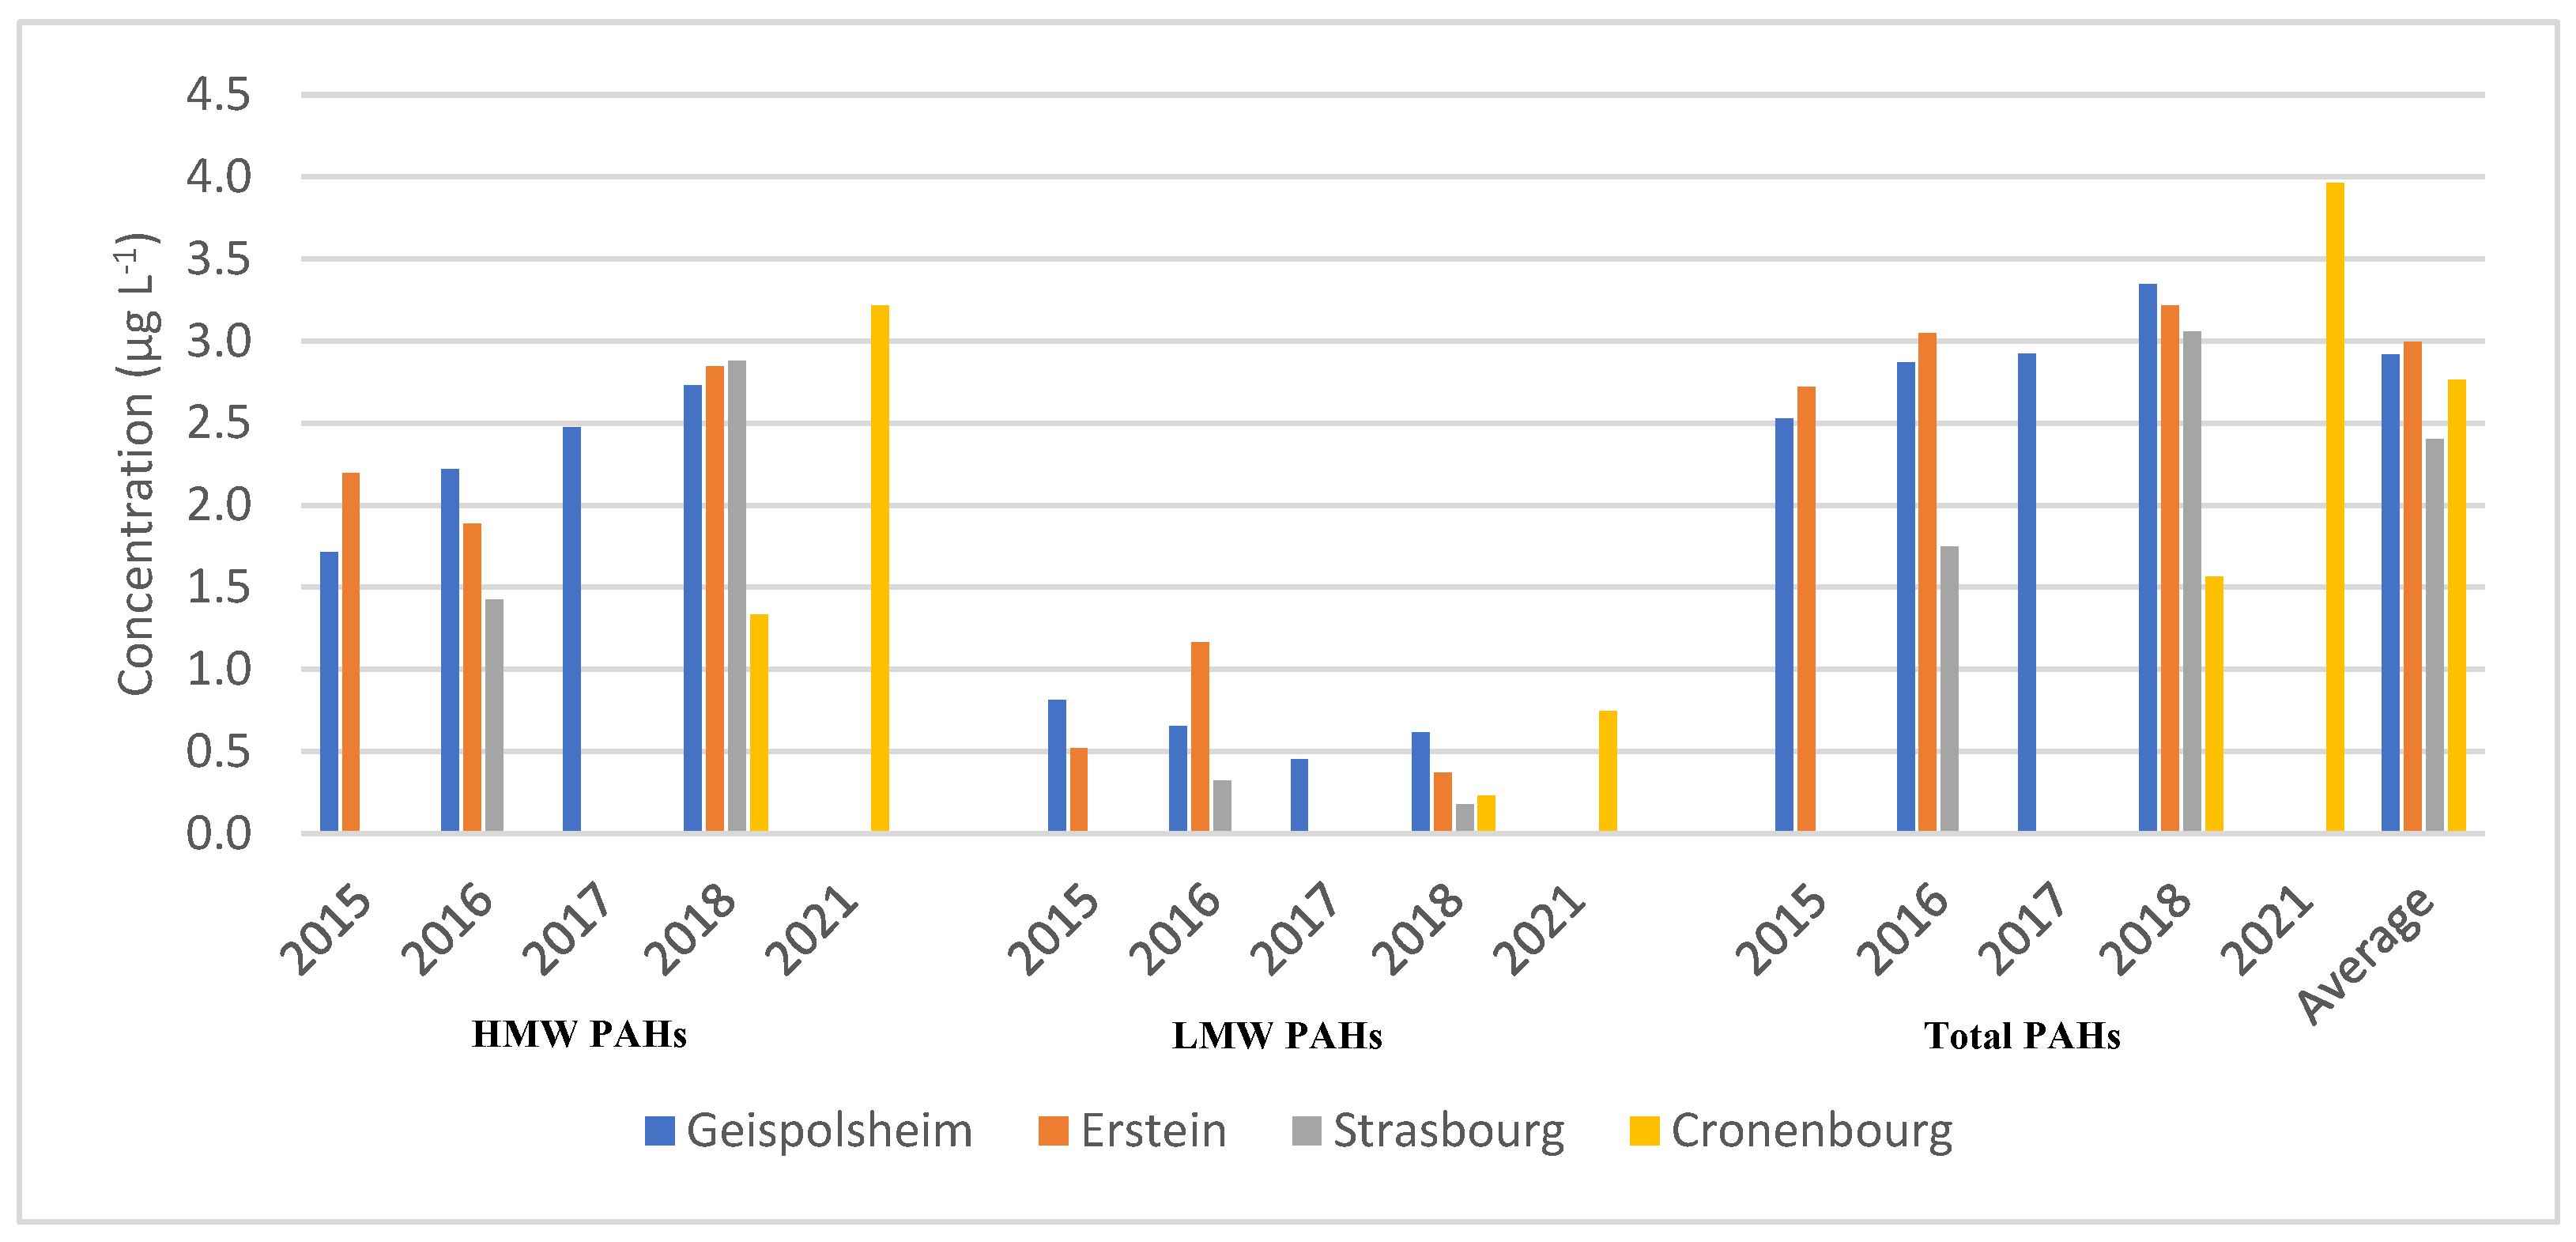
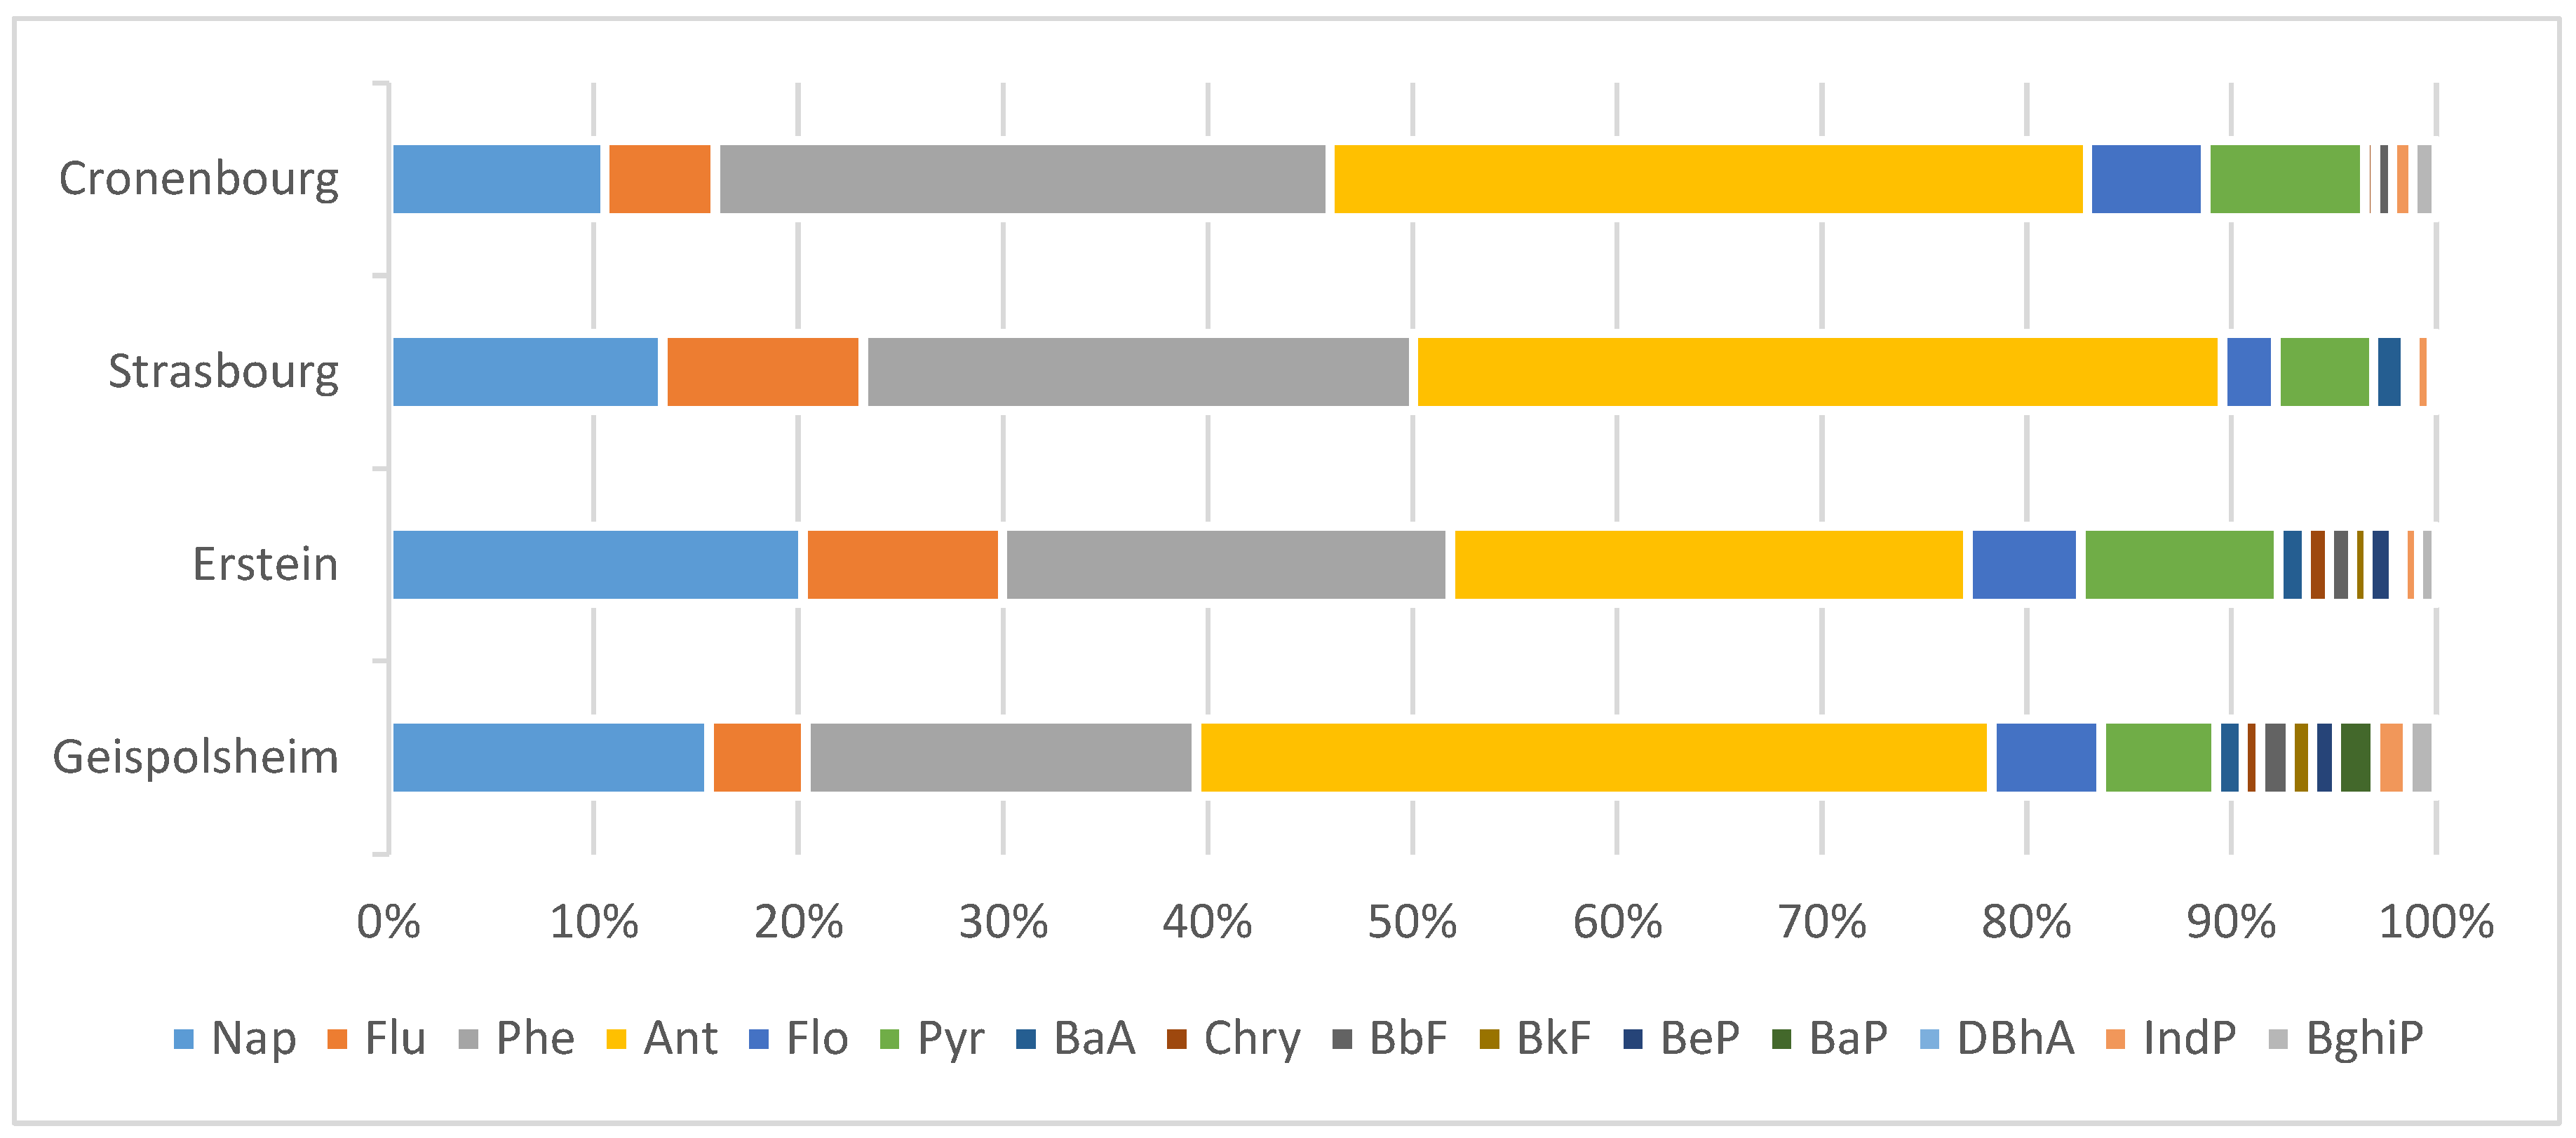
3.1. PAHs Analysis in Fogwater
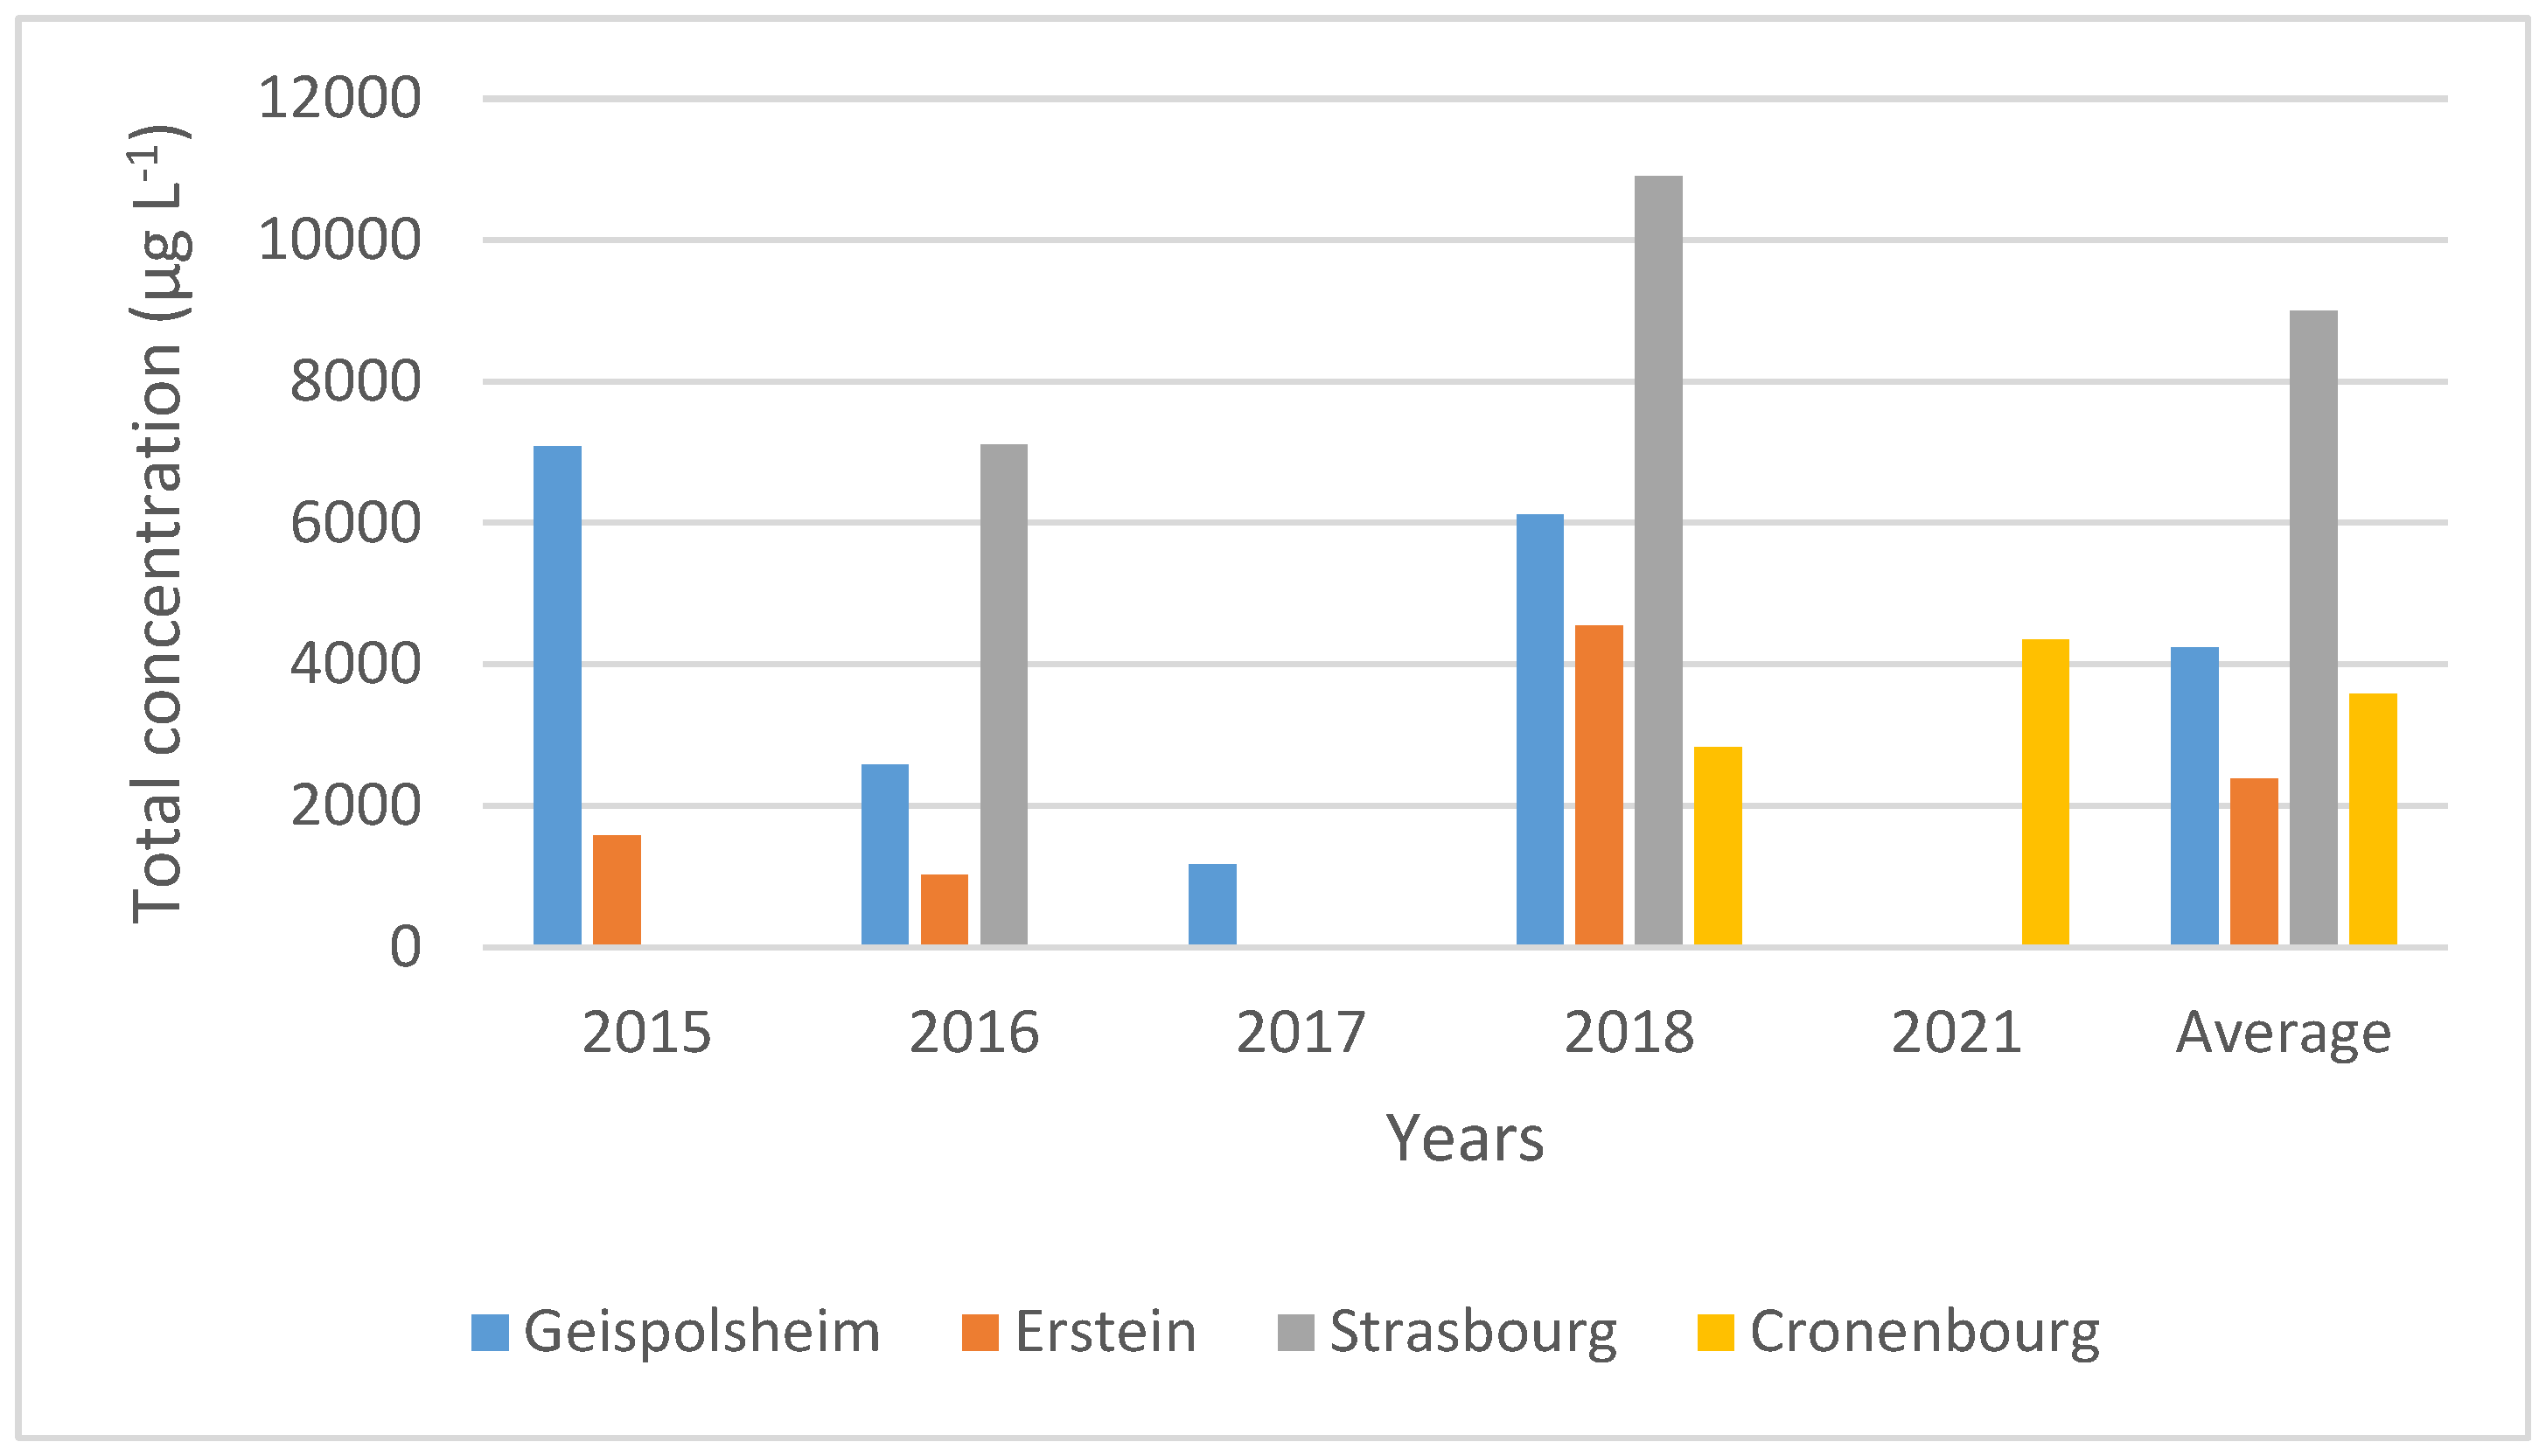
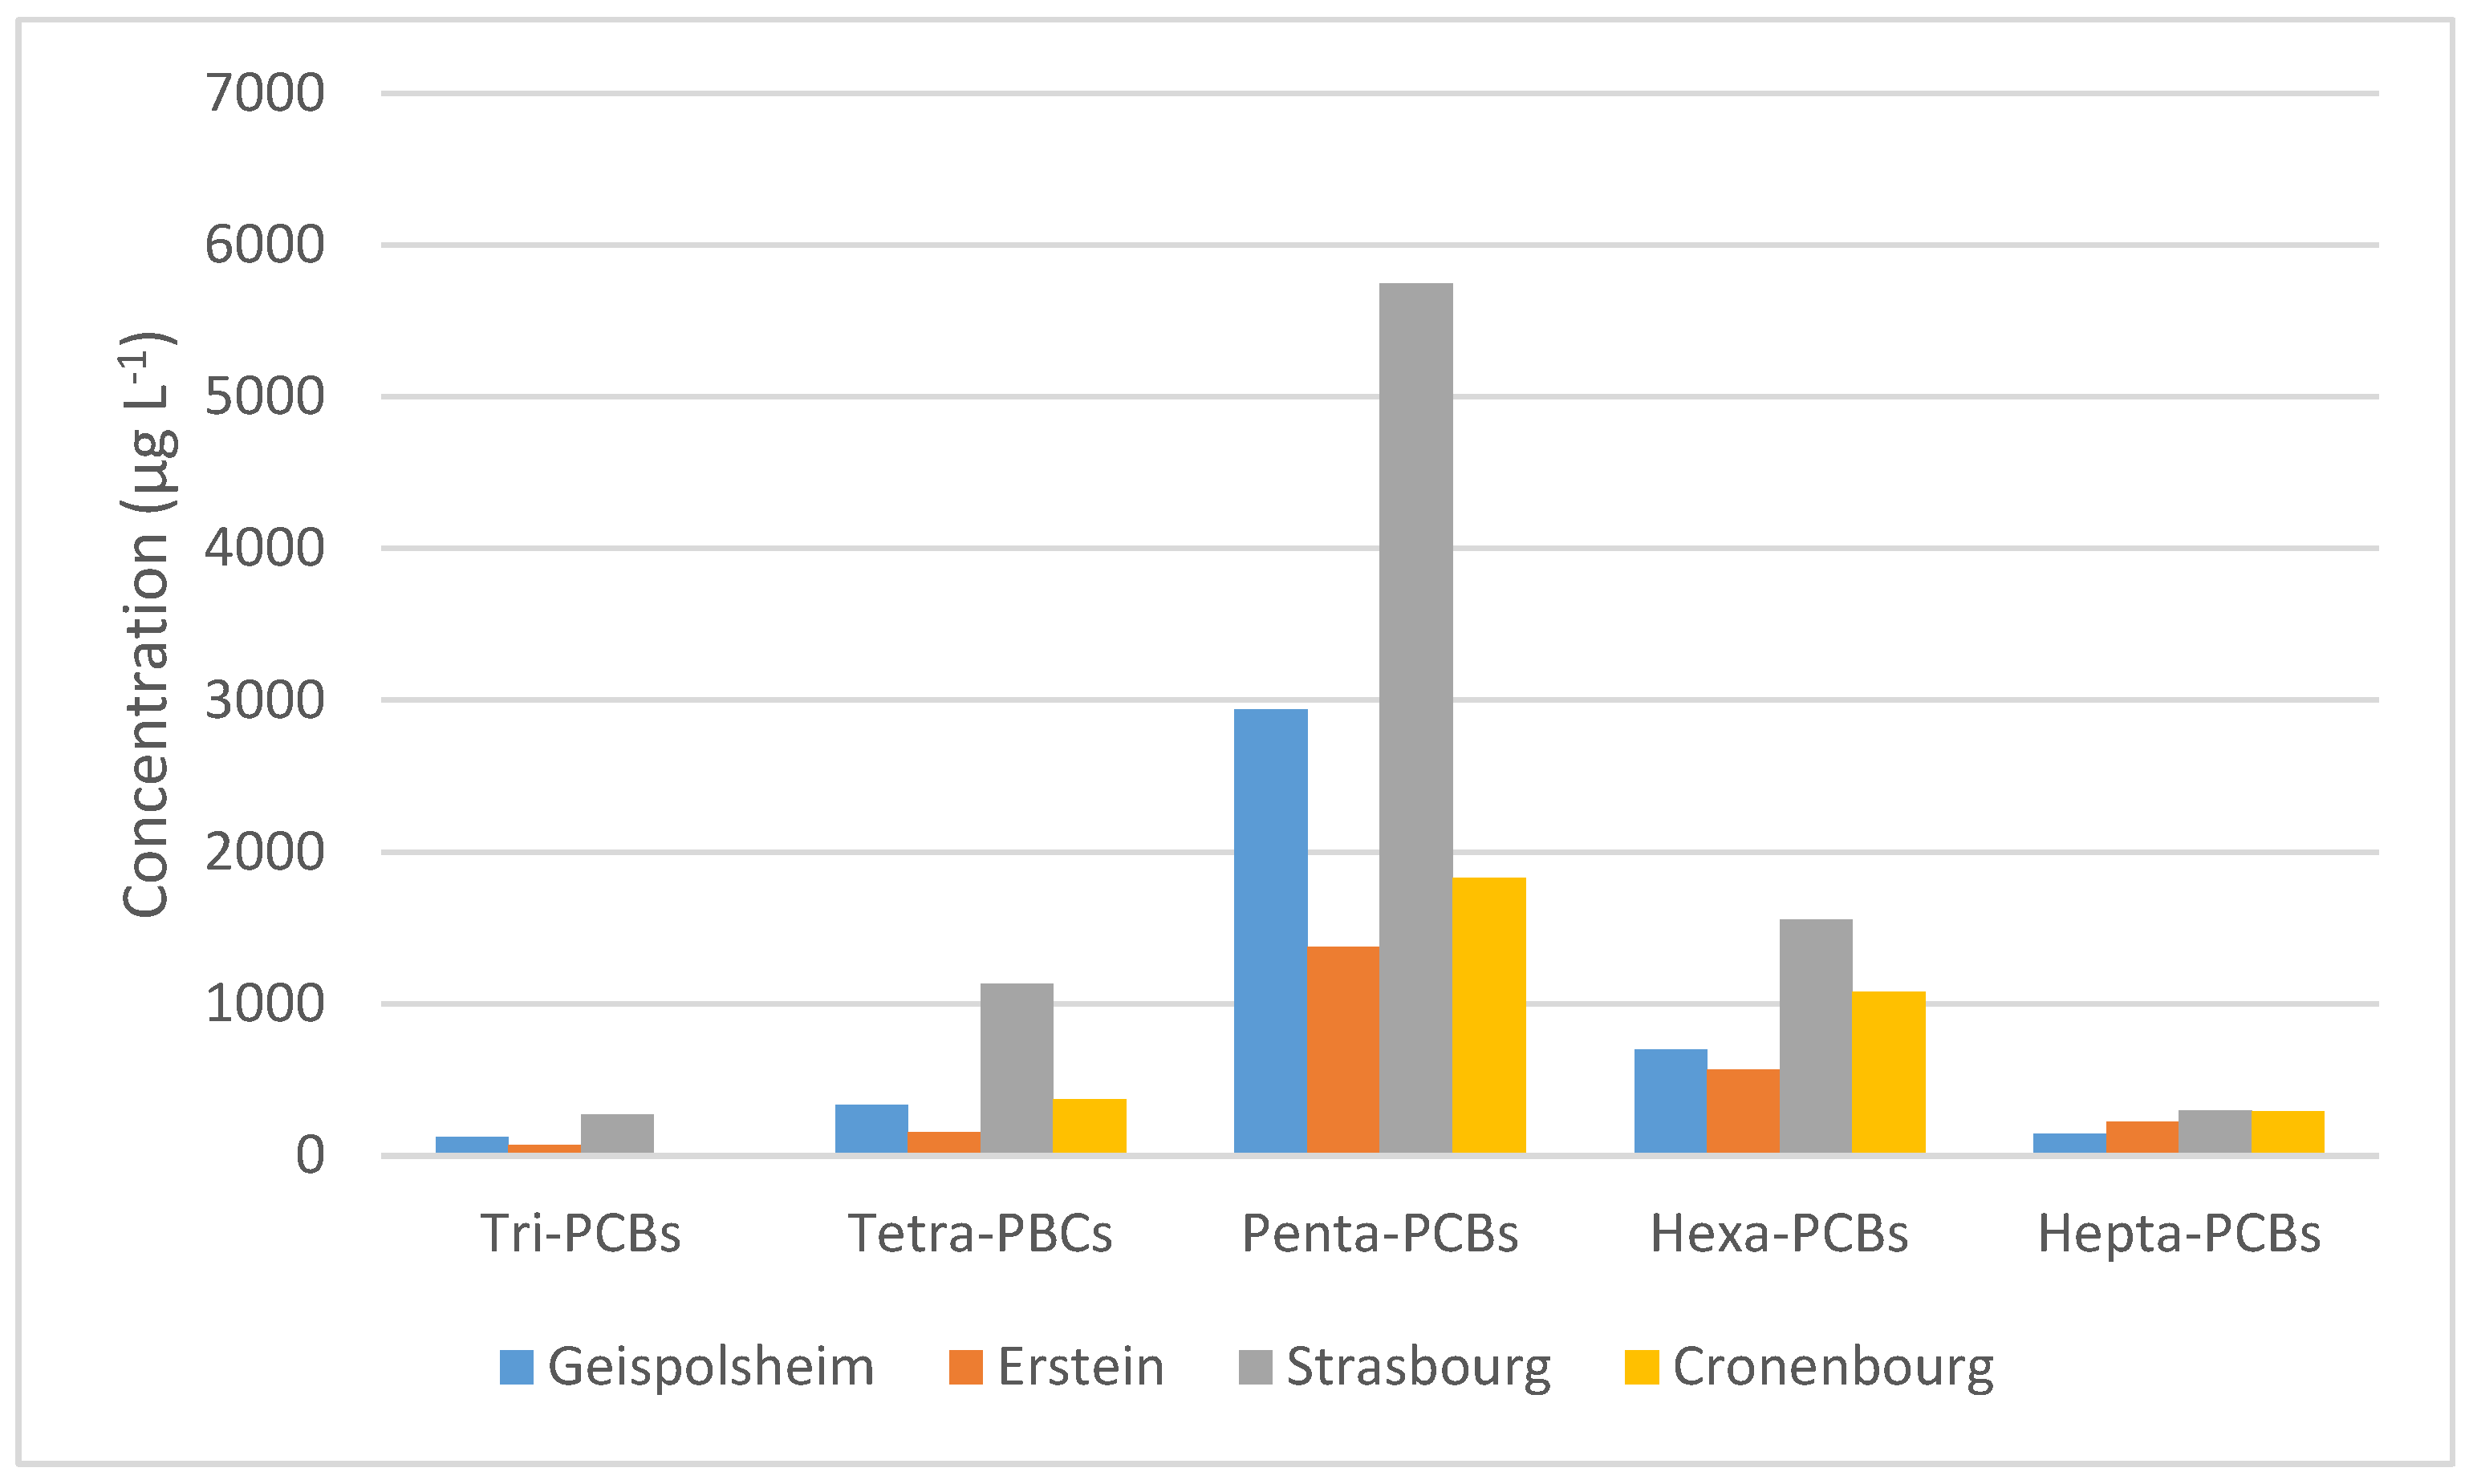
3.2. PCBs Analysis in Fogwater
4. Comparison with Previous Studies
Author Contributions
Funding
Data Availability Statement
Conflicts of Interest
References
- Roach, W. T. Back to Basics: Fog: Part 1 — Definitions and Basic Physics. Weather 1994, 49, 411–415. [Google Scholar] [CrossRef]
- Pérez-Díaz, J.; Ivanov, O.; Peshev, Z.; Álvarez-Valenzuela, M.; Valiente-Blanco, I.; Evgenieva, T.; Dreischuh, T.; Gueorguiev, O.; Todorov, P.; Vaseashta, A. Fogs: Physical Basis, Characteristic Properties, and Impacts on the Environment and Human Health. Water 2017, 9, 807. [Google Scholar] [CrossRef]
- Khoury, D.; Millet, M.; Jabali, Y.; Delhomme, O. Fog Water: A General Review of Its Physical and Chemical Aspects. Environments 2023, 10, 224. [Google Scholar] [CrossRef]
- Ervens, B.; Wang, Y.; Eagar, J.; Leaitch, W. R.; Macdonald, A. M.; Valsaraj, K. T.; Herckes, P. Dissolved Organic Carbon (DOC) and Select Aldehydes in Cloud and Fog Water: The Role of the Aqueous Phase in Impacting Trace Gas Budgets. Atmospheric Chem. Phys. 2013, 13, 5117–5135. [Google Scholar] [CrossRef]
- Facchini, M. C.; Fuzzi, S.; Zappoli, S.; Andracchio, A.; Gelencsér, A.; Kiss, G.; Krivácsy, Z.; Mészáros, E.; Hansson, H.; Alsberg, T.; Zebühr, Y. Partitioning of the Organic Aerosol Component between Fog Droplets and Interstitial Air. J. Geophys. Res. Atmospheres 1999, 104, 26821–26832. [Google Scholar] [CrossRef]
- Fuzzi, S.; Facchini, M. C.; Orsi, G.; Ferri, D. Seasonal Trend of Fog Water Chemical Composition in the Po Valley. Environ. Pollut. 1992, 75, 75–80. [Google Scholar] [CrossRef] [PubMed]
- Mazzoleni, L. R.; Ehrmann, B. M.; Shen, X.; Marshall, A. G.; Collett, J. L. Water-Soluble Atmospheric Organic Matter in Fog: Exact Masses and Chemical Formula Identification by Ultrahigh-Resolution Fourier Transform Ion Cyclotron Resonance Mass Spectrometry. Environ. Sci. Technol. 2010, 44, 3690–3697. [Google Scholar] [CrossRef]
- Yin, H.; Ye, Z.; Yang, Y.; Yuan, W.; Qiu, C.; Yuan, H.; Wang, M.; Li, S.; Zou, C. Evolution of Chemical Composition of Fogwater in Winter in Chengdu, China. J. Environ. Sci. 2013, 25, 1824–1832. [Google Scholar] [CrossRef]
- Kim, H.; Collier, S.; Ge, X.; Xu, J.; Sun, Y.; Jiang, W.; Wang, Y.; Herckes, P.; Zhang, Q. Chemical Processing of Water-Soluble Species and Formation of Secondary Organic Aerosol in Fogs. Atmos. Environ. 2019, 200, 158–166. [Google Scholar] [CrossRef]
- Herckes, P.; Valsaraj, K. T.; Collett, J. L. A Review of Observations of Organic Matter in Fogs and Clouds: Origin, Processing and Fate. Atmospheric Res. 2013, 132–133, 434–449. [Google Scholar] [CrossRef]
- Seinfeld, J.H.; Pandis, S.N. Atmos. Chemistry and Physics: From Air Pollution to Climate Change, 3rd ed.; Wiley: Hoboken, NJ, USA, 2016. [Google Scholar]
- Khoury, D.; Millet, M.; Jabali, Y.; Delhomme, O. Analytical Procedure for the Concomitant Analysis of 242 Polar and Non-Polar Organic Compounds of Different Functional Groups in Fog Water. Microchem. J. 2023, 185, 108235. [Google Scholar] [CrossRef]
- Fernández-González, R.; Yebra-Pimentel, I.; Martínez-Carballo, E.; Simal-Gándara, J.; Pontevedra-Pombal, X. Atmospheric Pollutants in Fog and Rain Events at the Northwestern Mountains of the Iberian Peninsula. Sci. Total Environ. 2014, 497–498, 188–199. [Google Scholar] [CrossRef] [PubMed]
- T. Zacharia, J. Degradation Pathways of Persistent Organic Pollutants (POPs) in the Environment. In Persistent Organic Pollutants; Kudom Donyinah, S., Ed.; IntechOpen, 2019. [CrossRef]
- Castro-Jiménez, J., Eisenreich, S. J., & Vives, I. Persistent organic pollutants (POPs) in the European atmosphere: An updated overview. European Commission Joint Research Centre, 2007.
- Meeker, J. D. Exposure to Environmental Endocrine Disruptors and Child Development. Arch. Pediatr. Adolesc. Med. 2012, 166. [Google Scholar] [CrossRef] [PubMed]
- Wang, J.-Z.; Nie, Y.-F.; Luo, X.-L.; Zeng, E. Y. Occurrence and Phase Distribution of Polycyclic Aromatic Hydrocarbons in Riverine Runoff of the Pearl River Delta, China. Mar. Pollut. Bull. 2008, 57, 767–774. [Google Scholar] [CrossRef]
- Pathiratne, K. A. S.; De Silva, O. C. P.; Hehemann, D.; Atkinson, I.; Wei, R. Occurrence and Distribution of Polycyclic Aromatic Hydrocarbons (PAHs) in Bolgoda and Beira Lakes, Sri Lanka. Bull. Environ. Contam. Toxicol. 2007, 79, 135–140. [Google Scholar] [CrossRef]
- Barhoumi, B.; Beldean-Galea, M. S.; Al-Rawabdeh, A. M.; Roba, C.; Martonos, I. M.; Bălc, R.; Kahlaoui, M.; Touil, S.; Tedetti, M.; Driss, M. R.; Baciu, C. Occurrence, Distribution and Ecological Risk of Trace Metals and Organic Pollutants in Surface Sediments from a Southeastern European River (Someşu Mic River, Romania). Sci. Total Environ. 2019, 660, 660–676. [Google Scholar] [CrossRef]
- Jianrong, C.; Yanjun, L.; Sujie, Y. The Concentrations and Sources of PAHs and PCBs in Soil from an Oil Field and Estuary in the Yellow River Delta, China. Front. Environ. Sci. 2022, 10, 1028299. [Google Scholar] [CrossRef]
- Vane, C. H.; Kim, A. W.; Beriro, D. J.; Cave, M. R.; Knights, K.; Moss-Hayes, V.; Nathanail, P. C. Polycyclic Aromatic Hydrocarbons (PAH) and Polychlorinated Biphenyls (PCB) in Urban Soils of Greater London, UK. Appl. Geochem. 2014, 51, 303–314. [Google Scholar] [CrossRef]
- Motelay-Massei, A.; Ollivon, D.; Garban, B.; Teil, M. J.; Blanchard, M.; Chevreuil, M. Distribution and Spatial Trends of PAHs and PCBs in Soils in the Seine River Basin, France. Chemosphere 2004, 55, 555–565. [Google Scholar] [CrossRef] [PubMed]
- Cetin, B.; Yurdakul, S.; Gungormus, E.; Ozturk, F.; Sofuoglu, S. C. Source Apportionment and Carcinogenic Risk Assessment of Passive Air Sampler-Derived PAHs and PCBs in a Heavily Industrialized Region. Sci. Total Environ. 2018, 633, 30–41. [Google Scholar] [CrossRef] [PubMed]
- Merhaby, D.; Rabodonirina, S.; Net, S.; Ouddane, B.; Halwani, J. Overview of Sediments Pollution by PAHs and PCBs in Mediterranean Basin: Transport, Fate, Occurrence, and Distribution. Mar. Pollut. Bull. 2019, 149, 110646. [Google Scholar] [CrossRef]
- Shahpoury, P.; Lammel, G.; Holubová Šmejkalová, A.; Klánová, J.; Přibylová, P.; Váňa, M. Polycyclic Aromatic Hydrocarbons, Polychlorinated Biphenyls, and Chlorinated Pesticides in Background Air in Central Europe – Investigating Parameters Affecting Wet Scavenging of Polycyclic Aromatic Hydrocarbons; preprint; Aerosols/Field Measurements/Troposphere/Chemistry (chemical composition and reactions), 2014. [CrossRef]
- Carratalá, A.; Moreno-González, R.; León, V. M. Occurrence and Seasonal Distribution of Polycyclic Aromatic Hydrocarbons and Legacy and Current-Use Pesticides in Air from a Mediterranean Coastal Lagoon (Mar Menor, SE Spain). Chemosphere 2017, 167, 382–395. [Google Scholar] [CrossRef]
- Li, X.; Li, P.; Yan, L.; Chen, J.; Cheng, T.; Xu, S. Characterization of Polycyclic Aromatic Hydrocarbons in Fog–Rain Events. J. Environ. Monit. 2011, 13, 2988. [Google Scholar] [CrossRef]
- Li, P.; Wang, Y.; Li, Y.; Wang, Z.; Zhang, H.; Xu, P.; Wang, W. Characterization of Polycyclic Aromatic Hydrocarbons Deposition in PM2.5 and Cloud/Fog Water at Mount Taishan (China). Atmos. Environ. 2010, 44, 1996–2003. [Google Scholar] [CrossRef]
- Ehrenhauser, F. S.; Khadapkar, K.; Wang, Y.; Hutchings, J. W.; Delhomme, O.; Kommalapati, R. R.; Herckes, P.; Wornat, M. J.; Valsaraj, K. T. Processing of Atmospheric Polycyclic Aromatic Hydrocarbons by Fog in an Urban Environment. J. Environ. Monit. 2012, 14, 2566. [Google Scholar] [CrossRef]
- ATSDR. Toxicology profile for polyaromatic hydrocarbons. Book toxicology profile for polyaromatic hydrocarbons. 2005. [Google Scholar]
- Olivella, M. À. Polycyclic Aromatic Hydrocarbons in Rainwater and Surface Waters of Lake Maggiore, a Subalpine Lake in Northern Italy. Chemosphere 2006, 63, 116–131. [Google Scholar] [CrossRef] [PubMed]
- Erickson, M. D.; Kaley, R. G. Applications of Polychlorinated Biphenyls. Environ. Sci. Pollut. Res. 2011, 18, 135–151. [Google Scholar] [CrossRef] [PubMed]
- Millet, M.; Sanusi, A.; Wortham, H. Chemical Composition of Fogwater in an Urban Area: Strasbourg (France). Environ. Pollut. 1996, 94, 345–354. [Google Scholar] [CrossRef] [PubMed]
- Herckes, P.; Wortham, H.; Mirabel, P.; Millet, M. Evolution of the Fogwater Composition in Strasbourg (France) from 1990 to 1999. Atmospheric Res. 2002, 64, 53–62. [Google Scholar] [CrossRef]
- Demoz, B. B.; Collett, J. L.; Daube, B. C. On the Caltech Active Strand Cloudwater Collectors. Atmospheric Res. 1996, 41, 47–62. [Google Scholar] [CrossRef]
- Khoury, D.; Millet, M.; Weissenberger, T.; Delhomme, O.; Jabali, Y. Chemical Composition of Fogwater Collected at Four Sites in North- and Mount-Lebanon during 2021. Atmospheric Pollution Research 2024, 15, 101958. [Google Scholar] [CrossRef]
- De Luca, G.; Furesi, A.; Leardi, R.; Micera, G.; Panzanelli, A.; Costantina Piu, P.; Sanna, G. Polycyclic Aromatic Hydrocarbons Assessment in the Sediments of the Porto Torres Harbor (Northern Sardinia, Italy). Mar. Chem. 2004, 86, 15–32. [Google Scholar] [CrossRef]
- Larsen, R. K.; Baker, J. E. Source Apportionment of Polycyclic Aromatic Hydrocarbons in the Urban Atmosphere: A Comparison of Three Methods. Environ. Sci. Technol. 2003, 37, 1873–1881. [Google Scholar] [CrossRef]
- Delhomme, O.; Rieb, E.; Millet, M. POLYCYCLIC AROMATIC HYDROCARBONS ANALYZED IN RAINWATER COLLECTED ON TWO SITES IN EAST OF FRANCE (STRASBOURG AND ERSTEIN). Polycycl. Aromat. Compd. 2008, 28 (4–5), 472–485. [Google Scholar] [CrossRef]
- Atmo grand est, atmo-grandest.eu. 2019 .
- Yang, X.; Wang, L.; Zhang, A.; Liu, X.; Bidegain, G.; Zong, H.; Guan, C.; Song, M.; Qu, L.; Huang, W.; Yuan, X. Levels, Sources and Potential Risks of Polychlorinated Biphenyls and Organochlorine Pesticides in Sediments of Qingduizi Bay, China: Does Developing Mariculture Matter? Front. Mar. Sci. 2019, 6, 602. [Google Scholar] [CrossRef]
- Babut, M.; Miege, C.; Villeneuve, B.; Abarnou, A.; Duchemin, J.; Marchand, P.; Narbonne, J. F. Correlations between Dioxin-like and Indicators PCBs: Potential Consequences for Environmental Studies Involving Fish or Sediment. Environ. Pollut. 2009, 157, 3451–3456. [Google Scholar] [CrossRef]
- Van Den Berg, M.; Birnbaum, L. S.; Denison, M.; De Vito, M.; Farland, W.; Feeley, M.; Fiedler, H.; Hakansson, H.; Hanberg, A.; Haws, L.; Rose, M.; Safe, S.; Schrenk, D.; Tohyama, C.; Tritscher, A.; Tuomisto, J.; Tysklind, M.; Walker, N.; Peterson, R. E. The 2005 World Health Organization Reevaluation of Human and Mammalian Toxic Equivalency Factors for Dioxins and Dioxin-Like Compounds. Toxicol. Sci. 2006, 93, 223–241. [Google Scholar] [CrossRef]
- Capel, P. D.; Leuenberger, C.; Giger, W. Hydrophobic Organic Chemicals in Urban Fog. Atmospheric Environ. Part Gen. Top. 1991, 25, 1335–1346. [Google Scholar] [CrossRef]
| Chromatographic conditions | |
|---|---|
| Device | GC-MS/MS (TraceTM, ITQTM 700) |
| Separation column | XLB (50% phenyl/ 50% methylsiloxane) (30 m length, 0.25 mm diameter, 0.25 μm film thickness) |
| Injection parameters | |
| DCM Rinsing | 2 Rinsing with 1µL (pre-run and post-run) |
| Injection volume | 1 µL |
| Injection type | Splitless mode |
| Injector temperature | 250°C |
| Purge | 50 mL.min-1 after t = 2 min |
| Gas saver | 15 mL.min-1 after t = 5 min |
| Chromatographic parameters | |
| Carrier gas | Helium (purity >99.99%) |
| Carrier gas flow | Constant at 1 mL.min-1 |
| Pressure | ≈10.253 psi (à t=0 et T= 90°C) |
| Oven temperature programming | 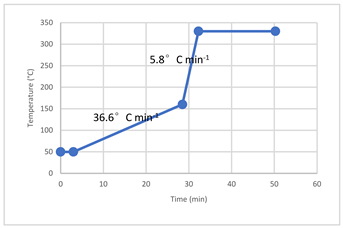 |
| Mass spectrometer parameters | |
| Transfer line temperature | 300 °C |
| Electron energy | 70 eV |
| Source temperature | 210 °C |
| Acquisition mode | MRM |
| ANT/(ANT+PHE) | ||||
|---|---|---|---|---|
| Geispolsheim | Erstein | Strasbourg | Cronenbourg | |
| 2015 | 0.50±0.2 | 0.40 | ||
| 2016 | 0.56±0.18 | 0.46±0.15 | 0.46 | |
| 2017 | 0.72 | |||
| 2018 | 0.65±0.1 | 0.65±0.13 | 0.60±0.12 | 0.56±0.28 |
| 2021 | 0.52±0.12 | |||
| AVERAGE | 0.6±0.09 | 0.51±0.13 | 0.53±0.09 | 0.54±0.02 |
| FLU/(FLU+PYR) | ||||
| Geispolsheim | Erstein | Strasbourg | Cronenbourg | |
| 2015 | 0.41±0.18 | 0.63 | ||
| 2016 | 0.73±0.22 | 0.47±0.28 | 0.51 | |
| 2017 | 0.36 | |||
| 2018 | 0.74±0.10 | 0.72±0.13 | 0.86±0.06 | 0.60±0.02 |
| 2021 | 0.42±0.15 | |||
| AVERAGE | 0.56±0.2 | 0.60±0.12 | 0.68±0.24 | 0.52±0.12 |
| FLO/(FLO+PYR) | ||||
| Geispolsheim | Erstein | Strasbourg | Cronenbourg | |
| 2015 | 0.58±0.1 | 0.38 | ||
| 2016 | 0.52±0.13 | 0.49±0.21 | 0.39 | |
| 2017 | 0.42 | |||
| 2018 | 0.55±0.12 | 0.36±0.11 | 0.5±0.11 | 0.36±0.18 |
| 2021 | 0.48±0.12 | |||
| AVERAGE | 0.52±0.07 | 0.41±0.07 | 0.45±0.07 | 0.42±0.08 |
| Site | Mount Taishan (China) | Shanghai (China) |
Northwestern Mountains (Spain) | G | E | STG | CR |
|---|---|---|---|---|---|---|---|
| Compounds | [28] | [27] | [13] | This study | This study | This study | This study |
| Nap | n.a | 376(2-1448) | n.a | 534(11-1367) | 412(255-1141) | 333(158-556) | 314(66-554) |
| Flu | 17(5-63) | 66(3-520) | 18(n.d-134) | 112(38-307) | 173(22-559) | 58(11-88) | 180(12-328) |
| Acy | 24(n.d-62) | 13(n.d-27) | n.a | n.a | n.a | n.a | n.a |
| Ace | 28(3-53) | 30(n.d-114) | n.a | n.a | n.a | n.a | n.a |
| Phe | 80(21-222) | 138(3-1043) | n.a | 546(145-1920) | 750(298-2432) | 626(252-1219) | 1064(206-1770) |
| Ant | 13(2-25) | 172(3-1281) | n.a | 1076(152-3181) | 851(137-3566) | 996(263-2600) | 1175(114-1315) |
| Flo | 42(19-95) | 34(n.d-178) | n.a | 179(23-356) | 217(57-496) | 226(114-460) | 150(103-178) |
| Pyr | 12(1-45) | 34(n.d-133) | 24(n.d-70) | 115(n.d-262) | 298(n.d-1259) | 97(24-197) | 273(63-553) |
| BaA | 13(4-51) | 41(n.d-189) | 0.1(n.d-1.2) | 46(n.d-364.1) | 61(n.d-91) | 46(n.d-57) | n.d |
| Chry | 9(3-35) | 19(n.d-86) | 1(n.d-15) | 27(n.d-72) | 52(n.d-73) | n.d | 57(n.d-67) |
| BeP | 9(n.d -47) | 2(n.d-9) | n.a | 68(n.d-79) | 57(n.d-80) | n.d | n.d |
| BbF | 23(1-102) | 4(n.d-22) | 0.9(n.d-10) | 51(n.d-69) | 52(n.d-86) | n.d | 46(n.d-56) |
| BkF | 6(n.d -38) | 6(n.d-17) | 0.6(n.d-2.1) | 67 (n.d-79) | 30(n.d-45) | n.d | n.d |
| BaP | 6(n.d -27) | n.d | 0.7(n.d-1.7) | 97(n.d-170) | 41(n.d-56) | 22(n.d-43) | n.d |
| Total | 273(90-975) | 982(30-6670) | 45(8-216) | 2959(451-5866) | 2994(520-6725) | 2404(985-5132) | 2765(578-5097) |
| Site | PCBs | Reference |
|---|---|---|
| Zürich (Switzerland) | (7000-22000) | [44] |
| Northwestern Mountains (NW Spain) | (n.d-319) | [13] |
| Geispolsheim (France)a | (137-12058) | This study |
| Erstein (France)b | (434-5787) | This study |
| Strasbourg (France)c | (5383-15515) | This study |
| Cronenbourg (France)d | (934-4979) | This study |
Disclaimer/Publisher’s Note: The statements, opinions and data contained in all publications are solely those of the individual author(s) and contributor(s) and not of MDPI and/or the editor(s). MDPI and/or the editor(s) disclaim responsibility for any injury to people or property resulting from any ideas, methods, instructions or products referred to in the content. |
© 2024 by the authors. Licensee MDPI, Basel, Switzerland. This article is an open access article distributed under the terms and conditions of the Creative Commons Attribution (CC BY) license (http://creativecommons.org/licenses/by/4.0/).


