Submitted:
31 January 2024
Posted:
31 January 2024
You are already at the latest version
Abstract
Keywords:
1. Introduction
2. Synthetic Approaches
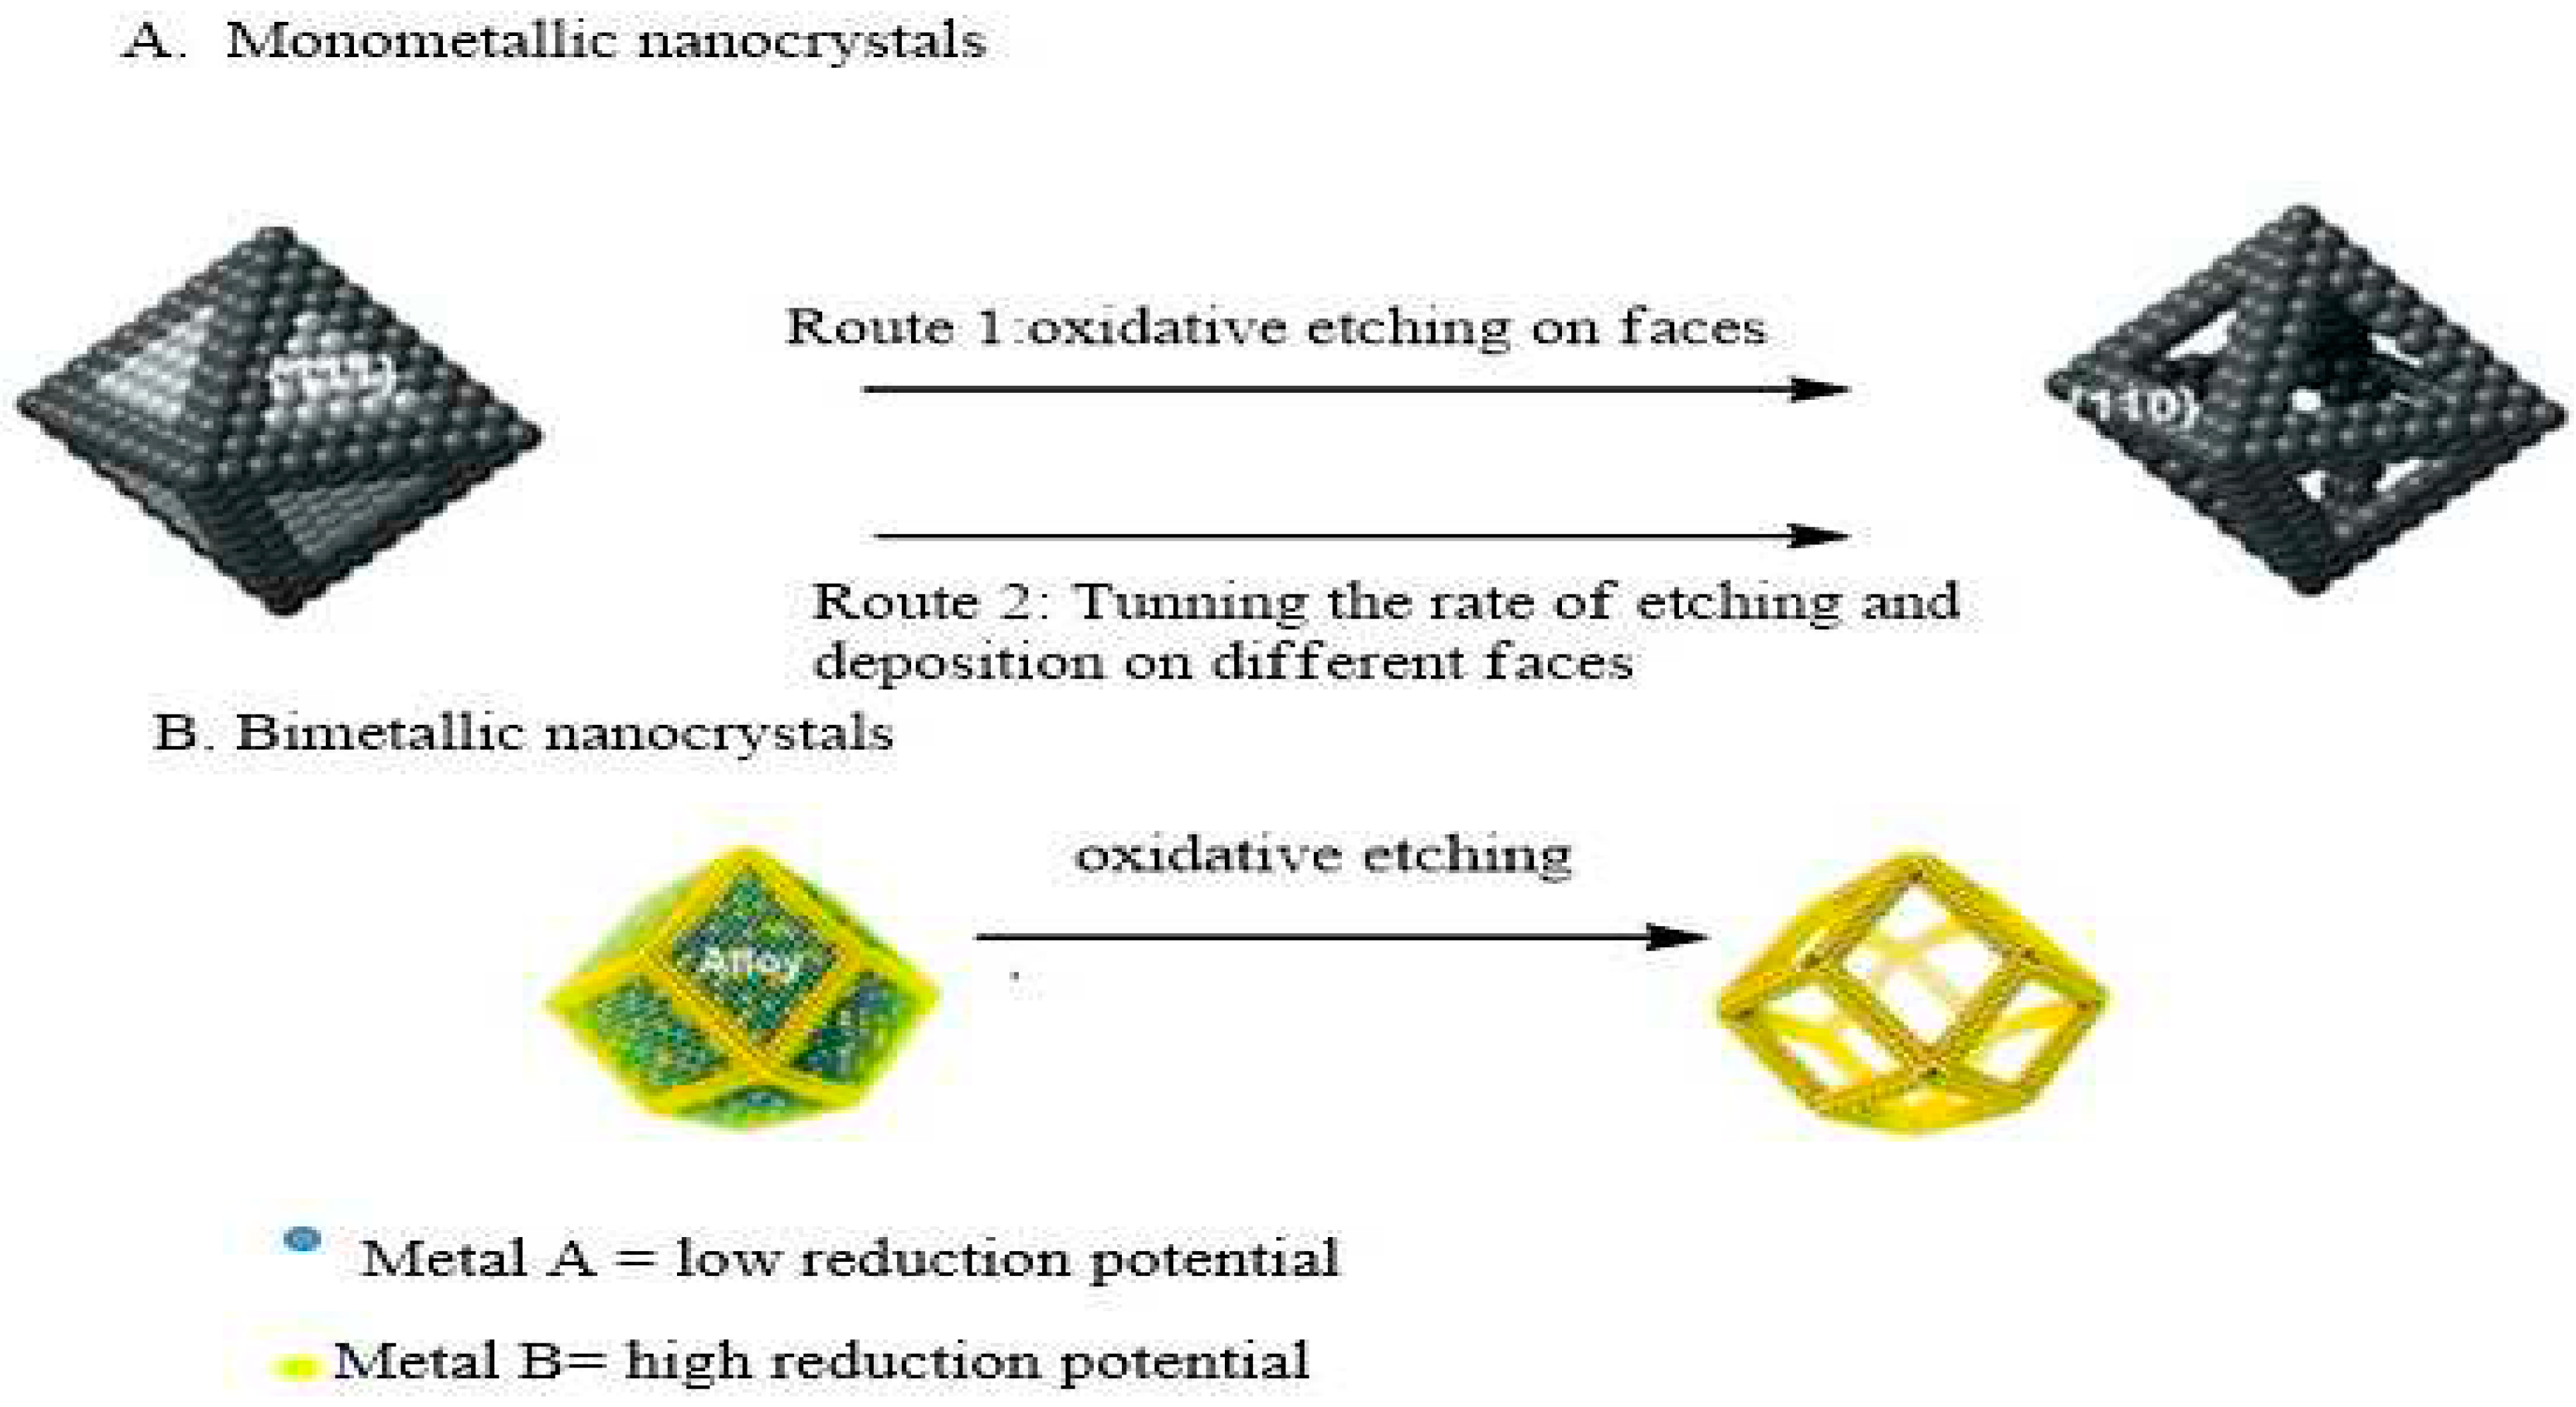
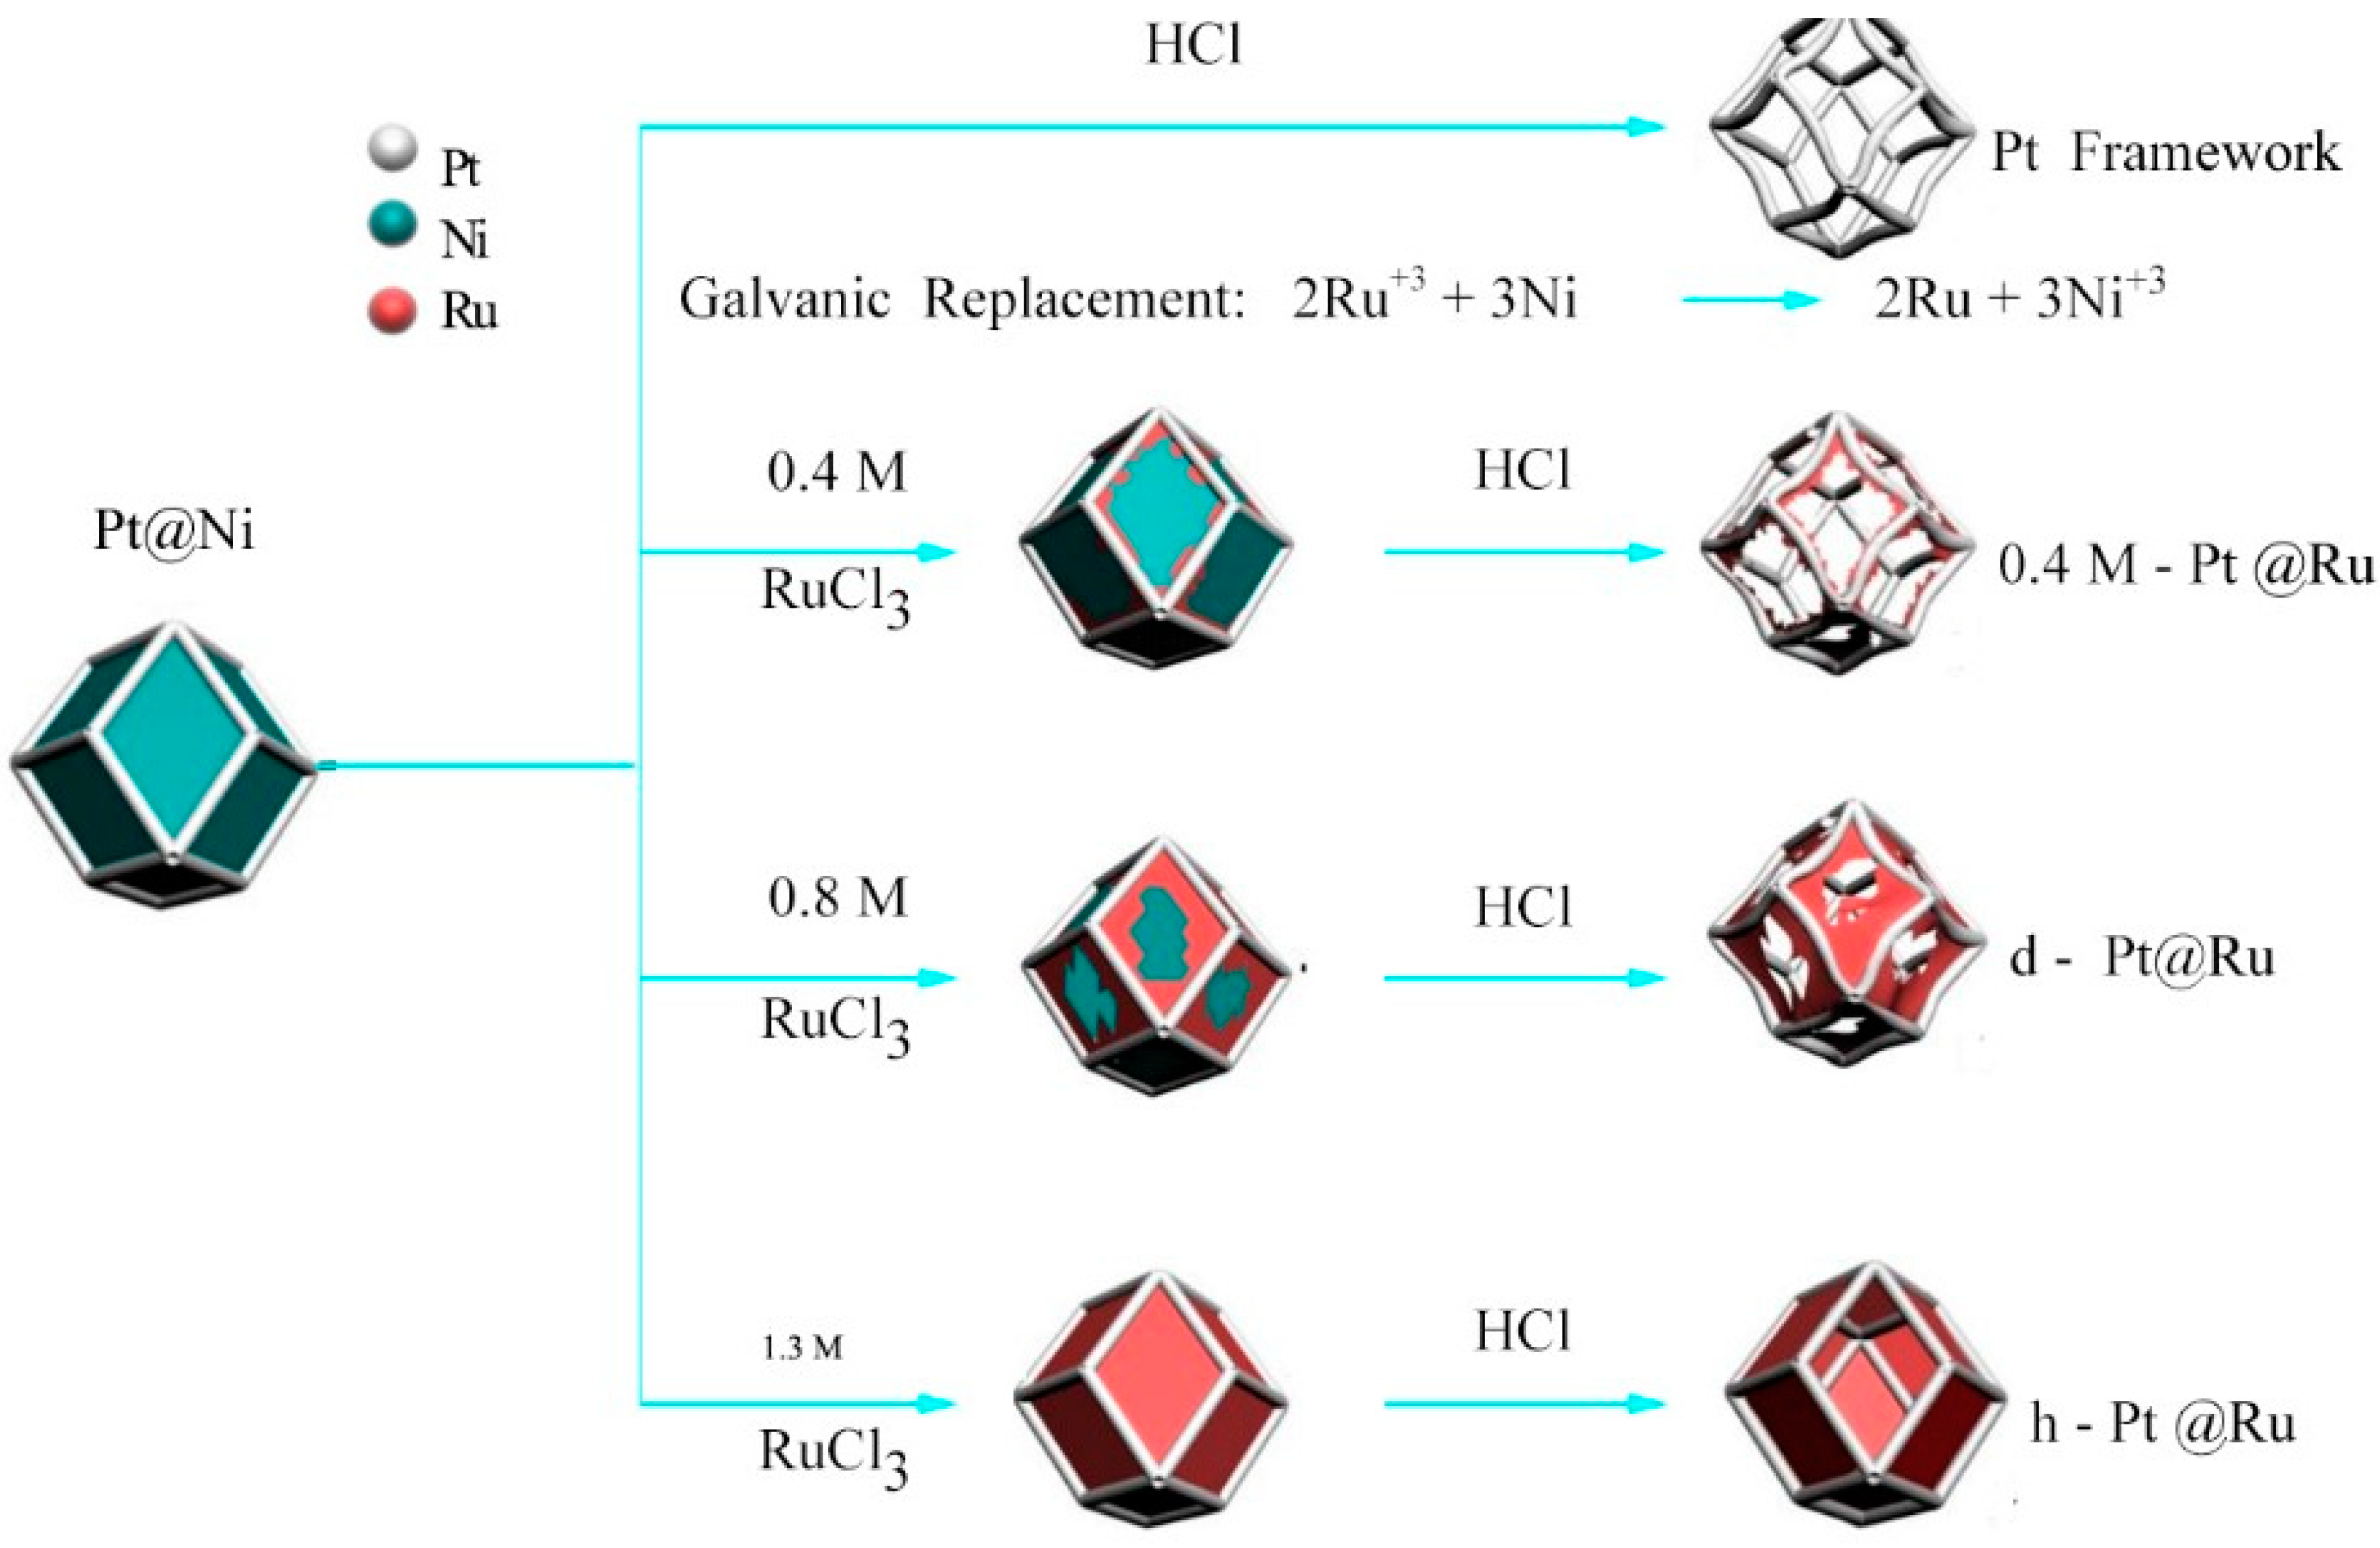
2.1. Face Selected Carving of Solid Nanocrystals
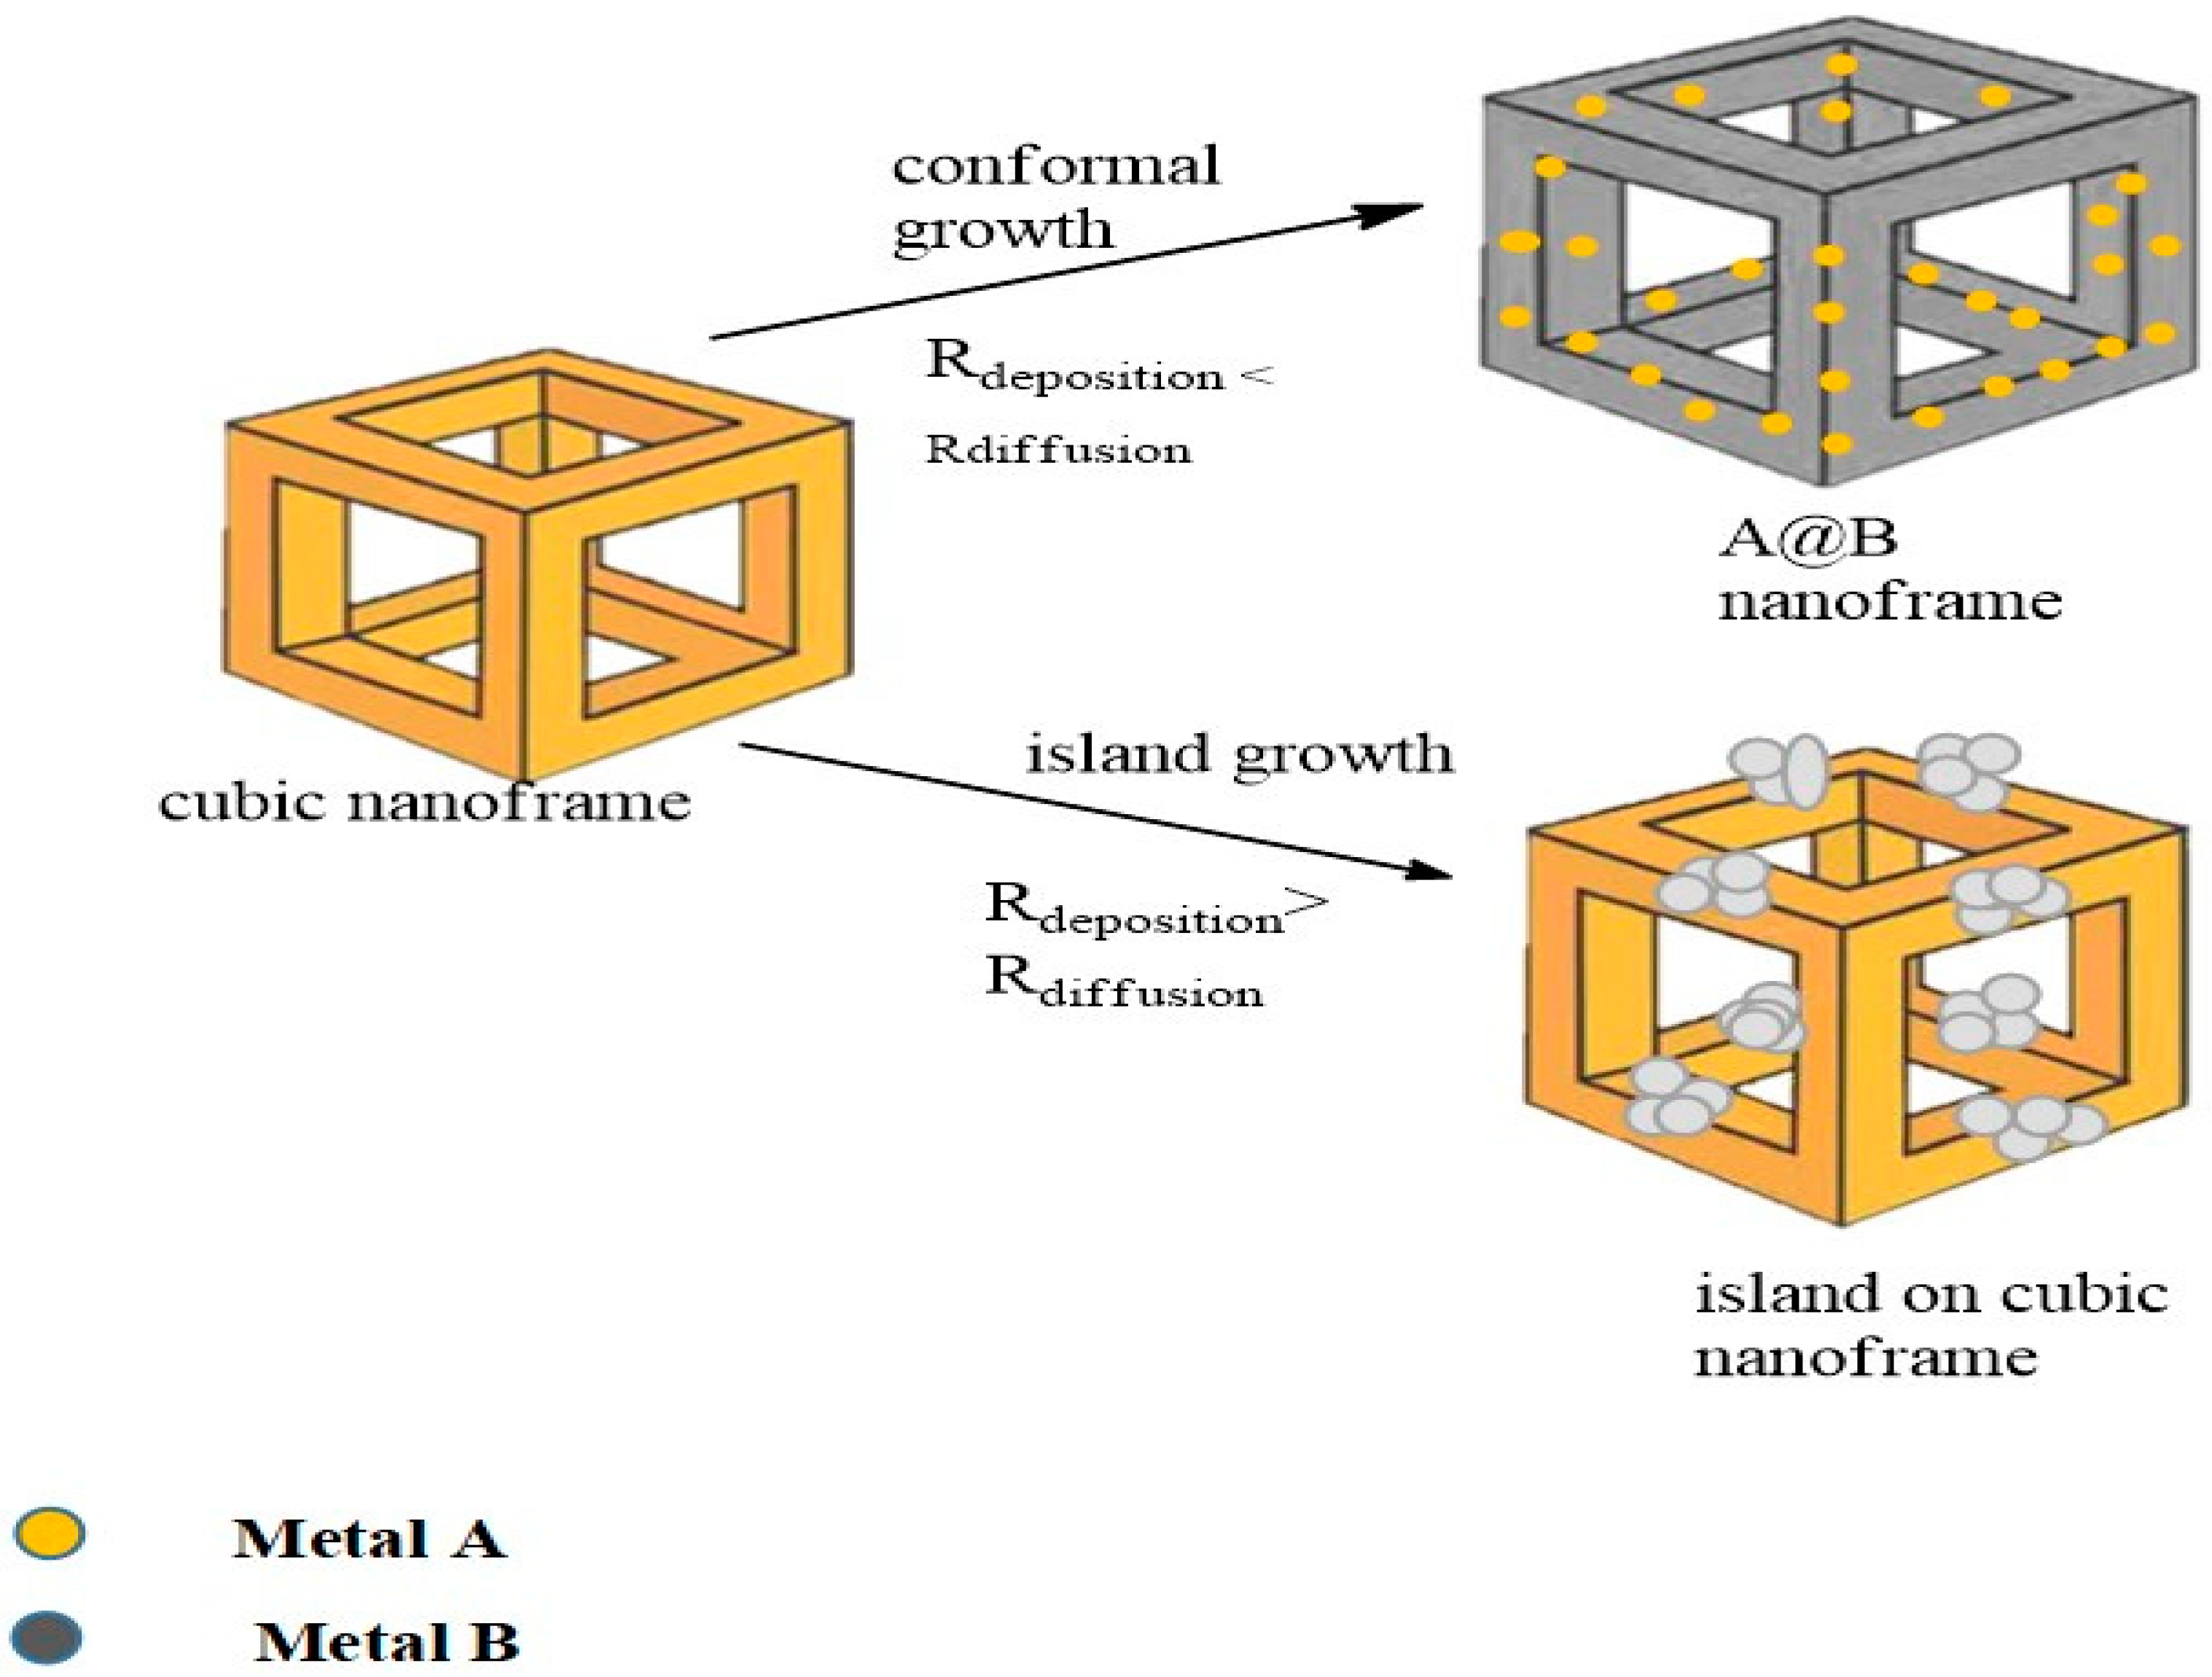
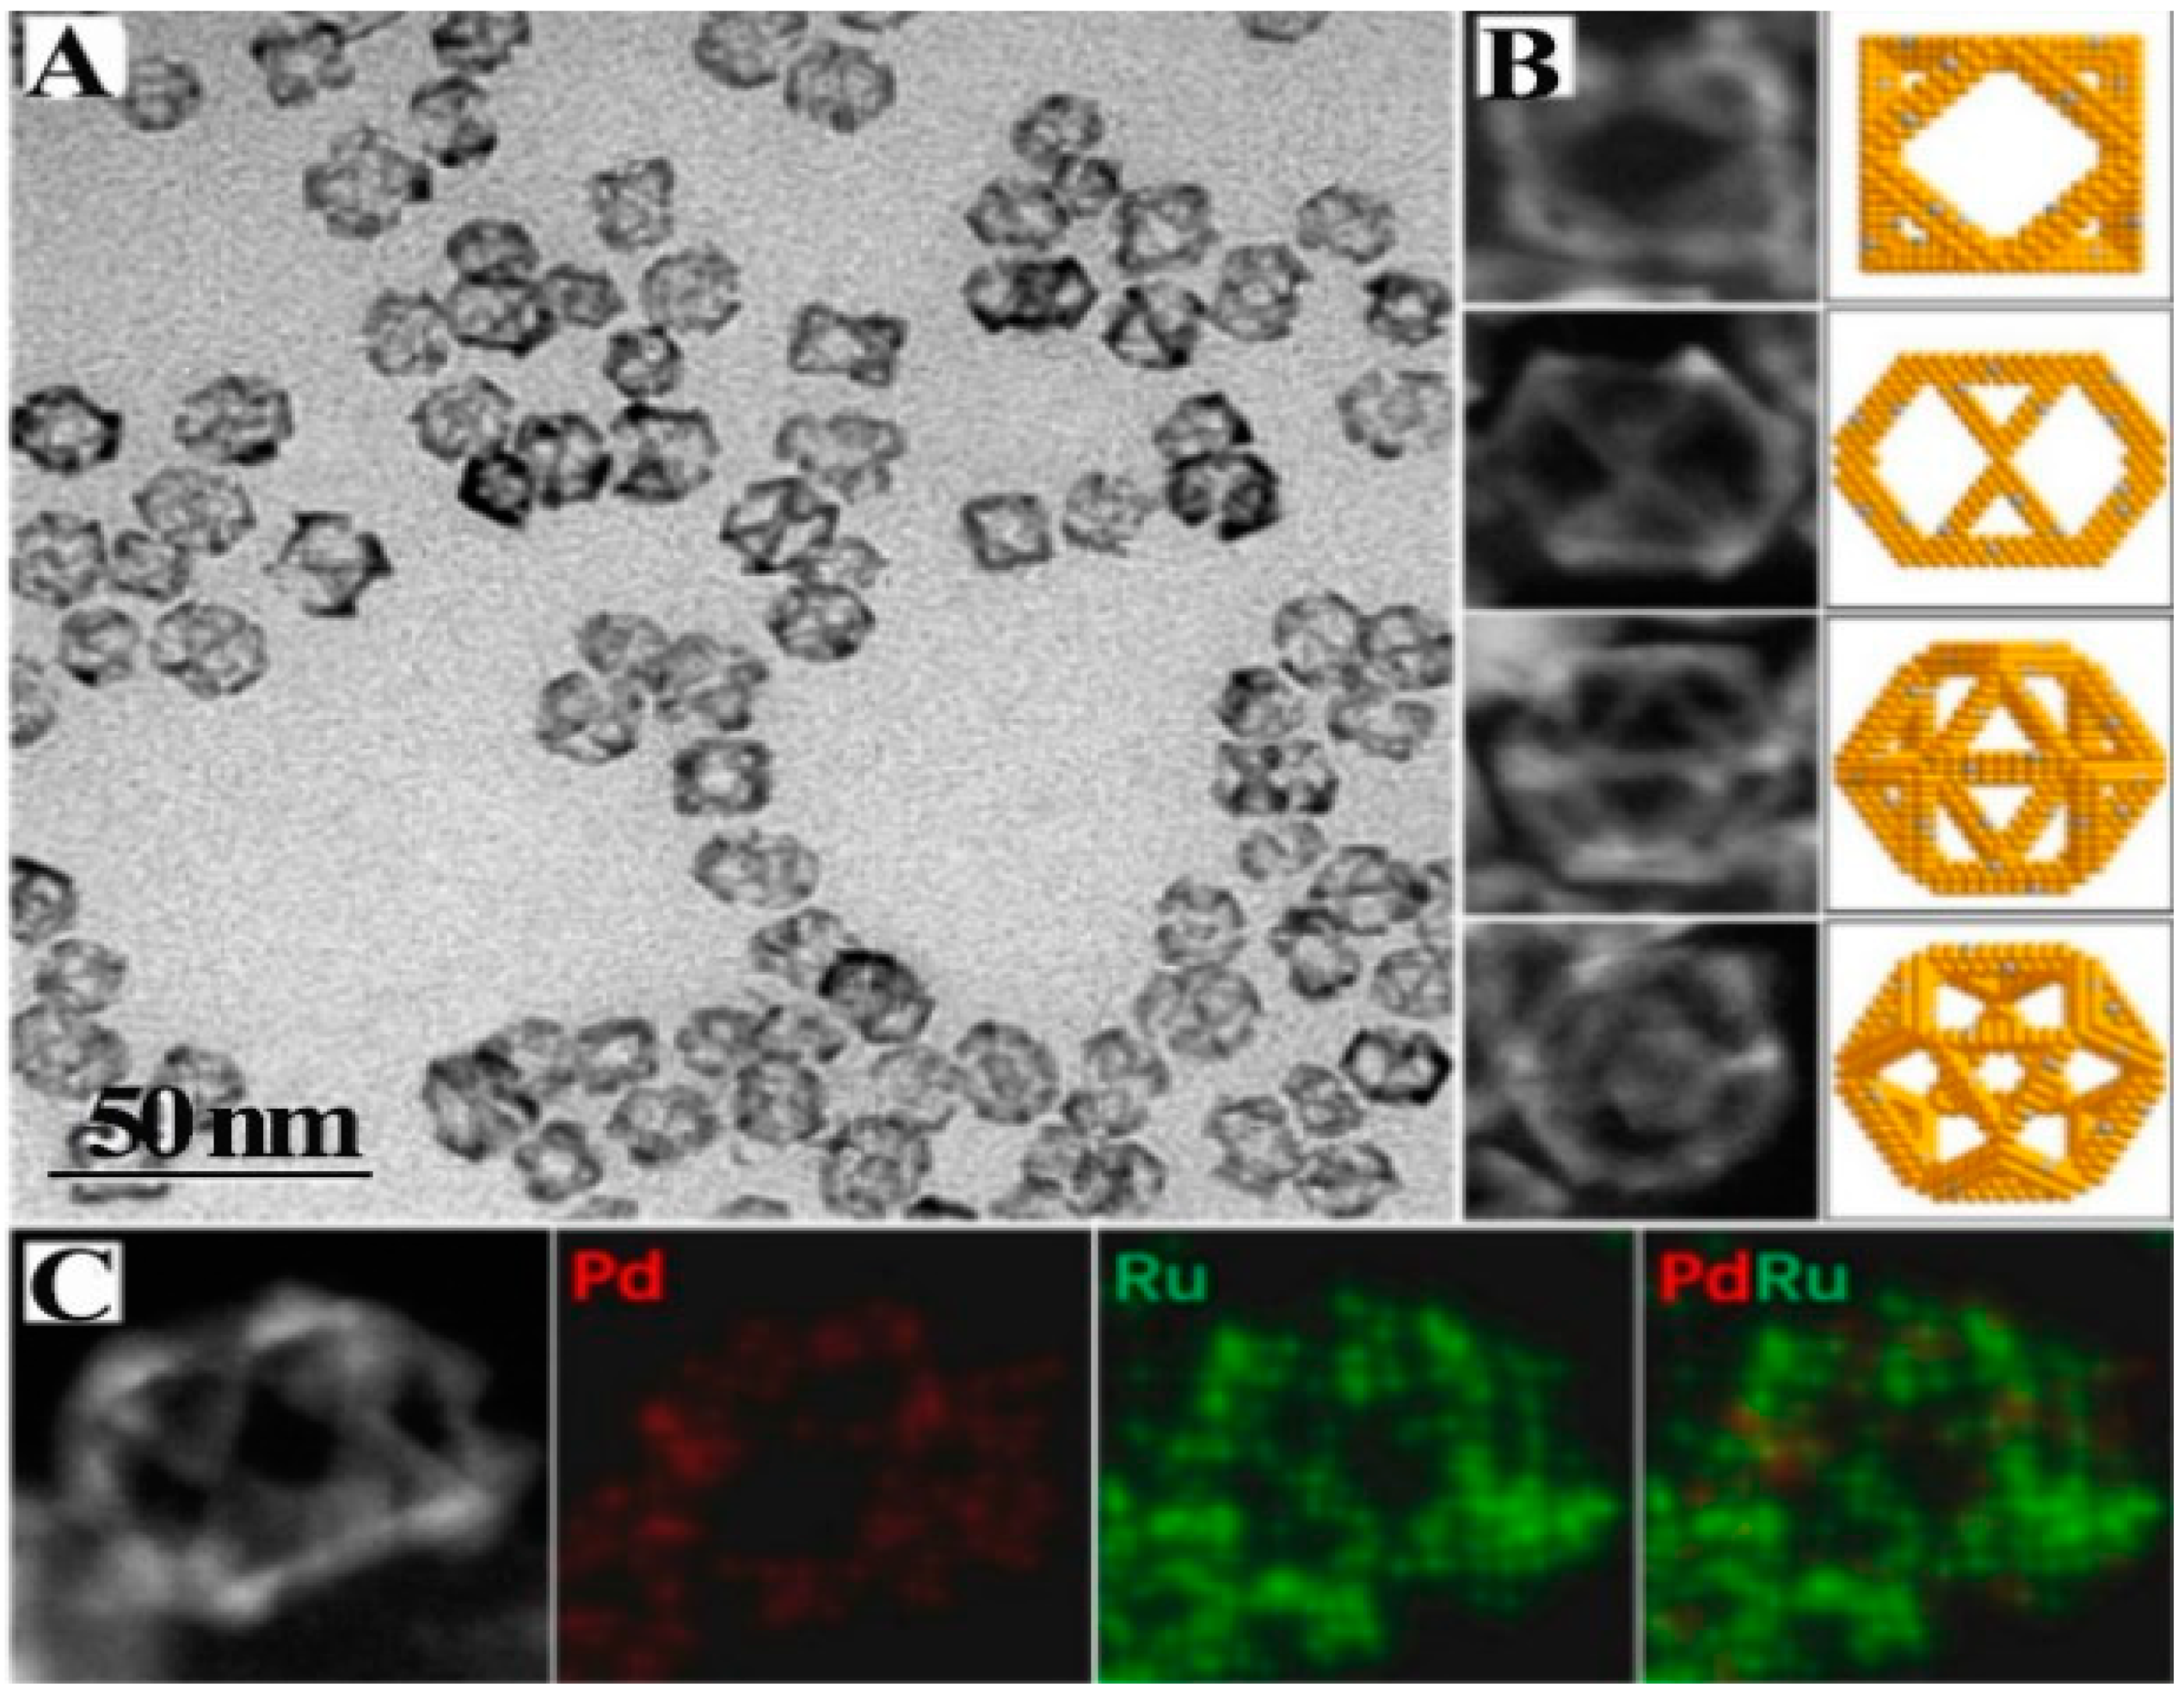
2.2. Edge Selected Deposition of Different Metals on Template
2.3. De-Alloying of Hollow Alloy Nanocrystals
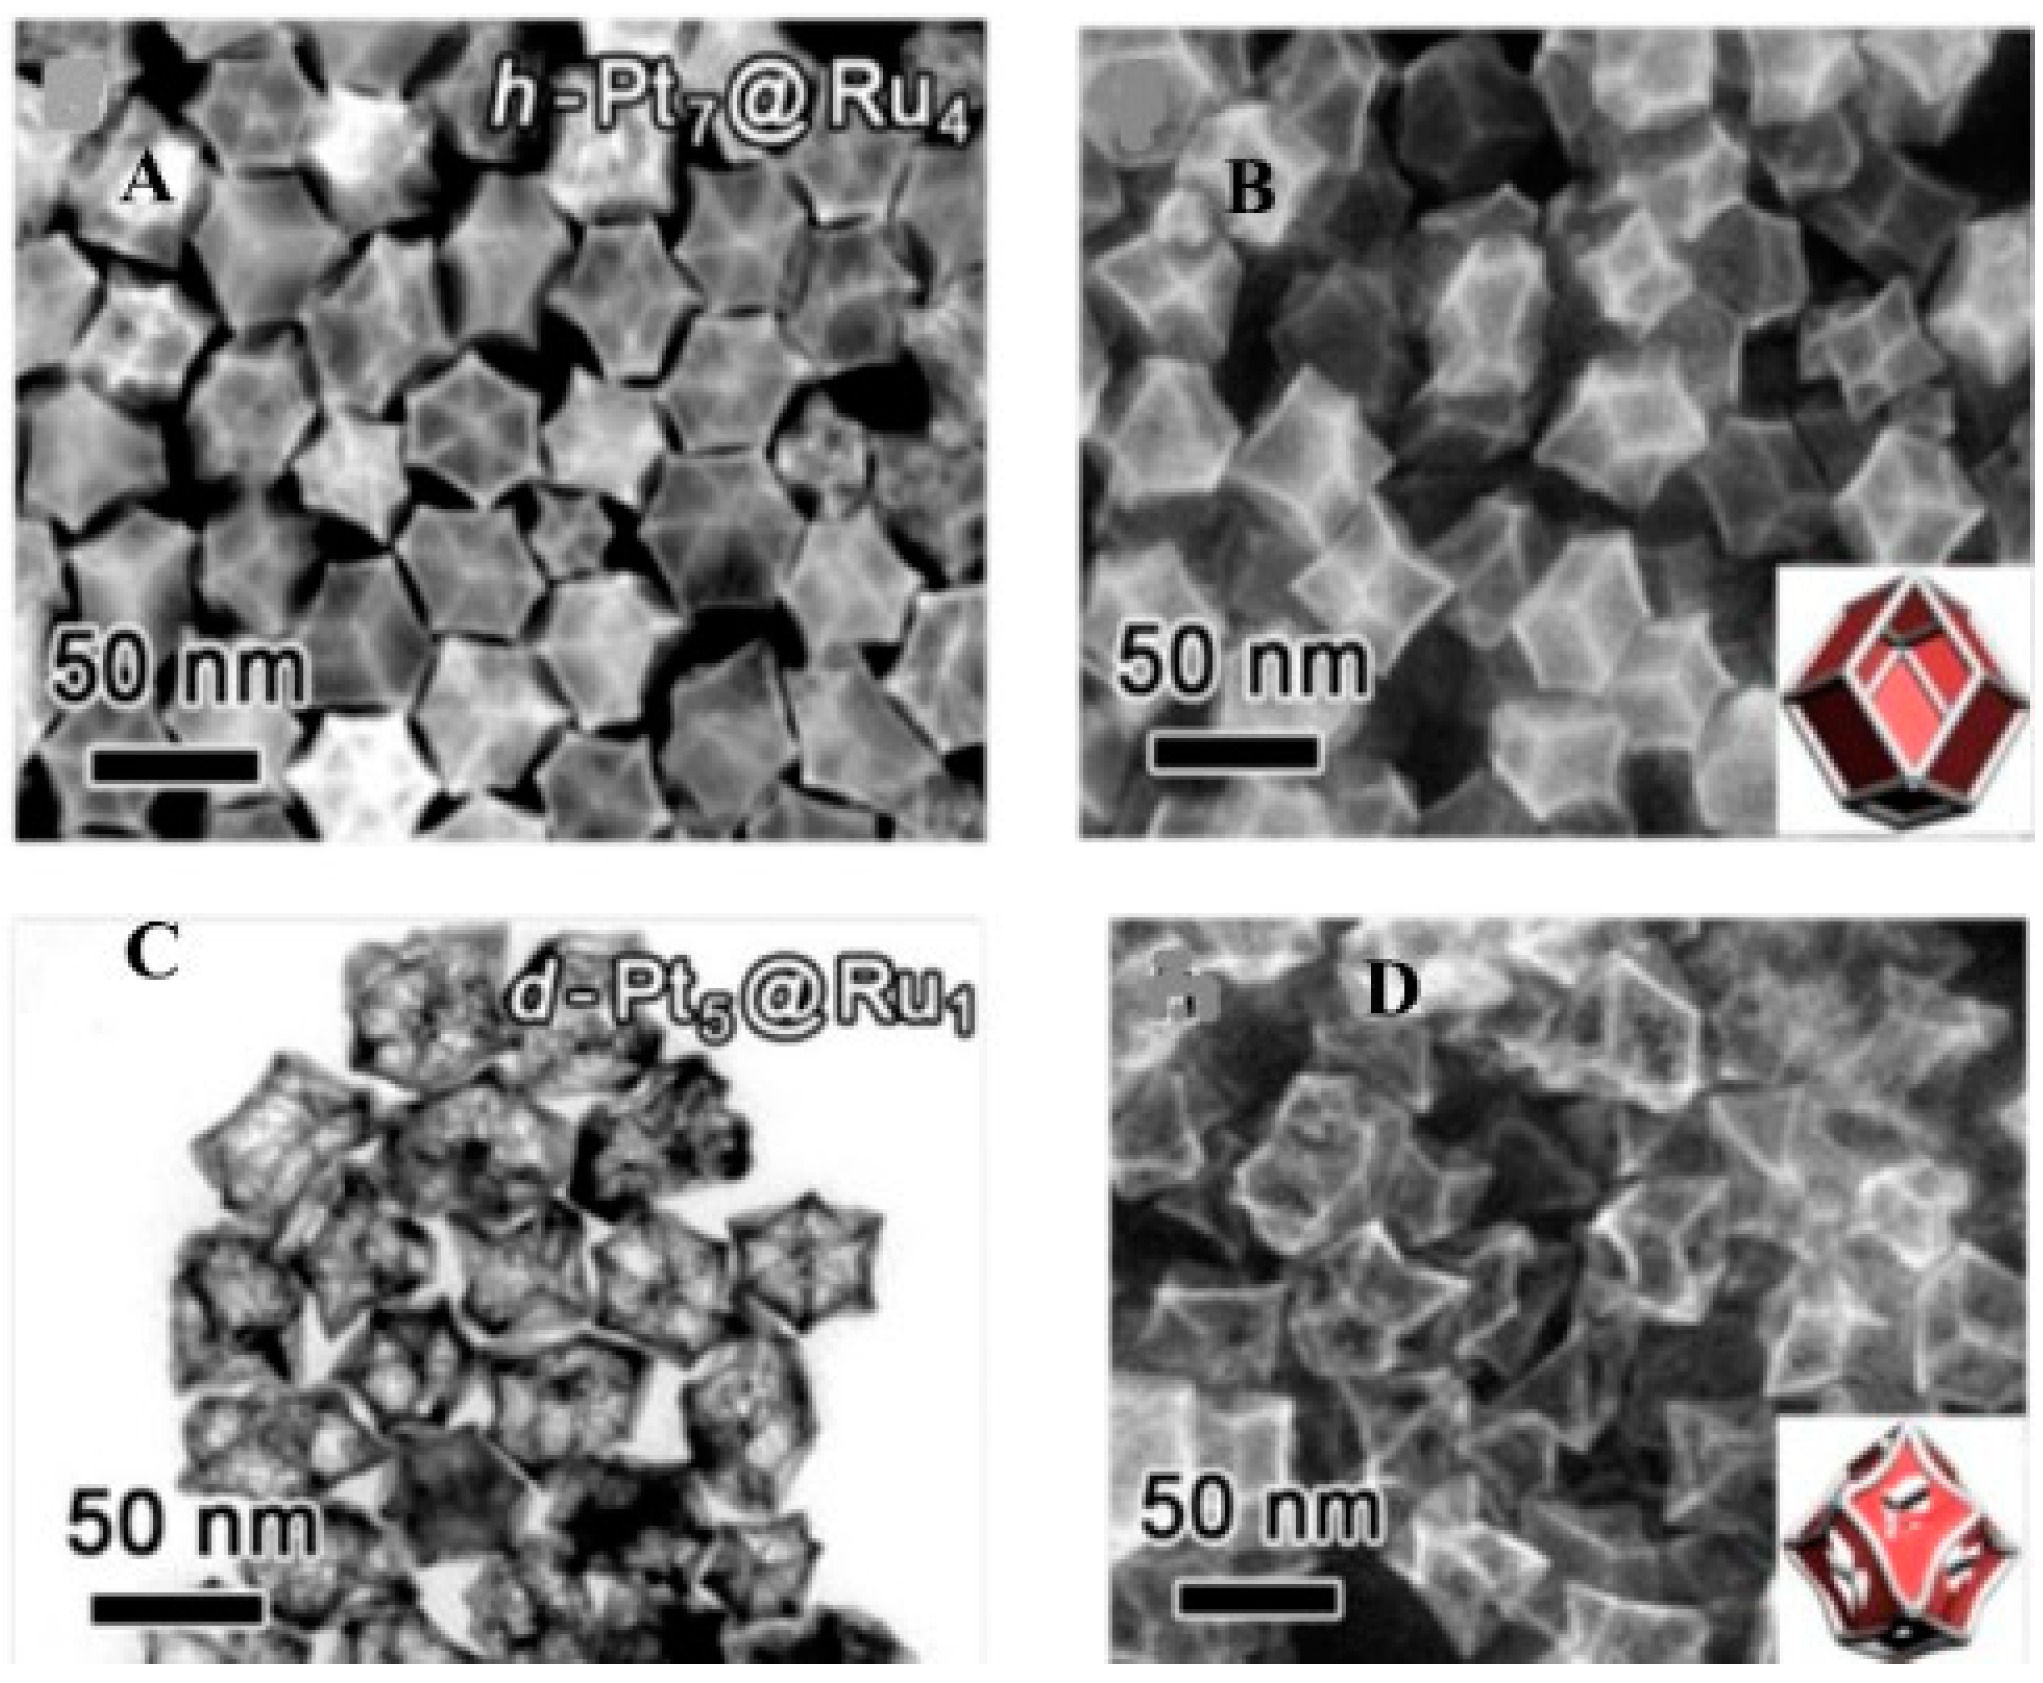
2.4. Nanoframe-Directed Deposition
2.5. One-Pot Synthesis
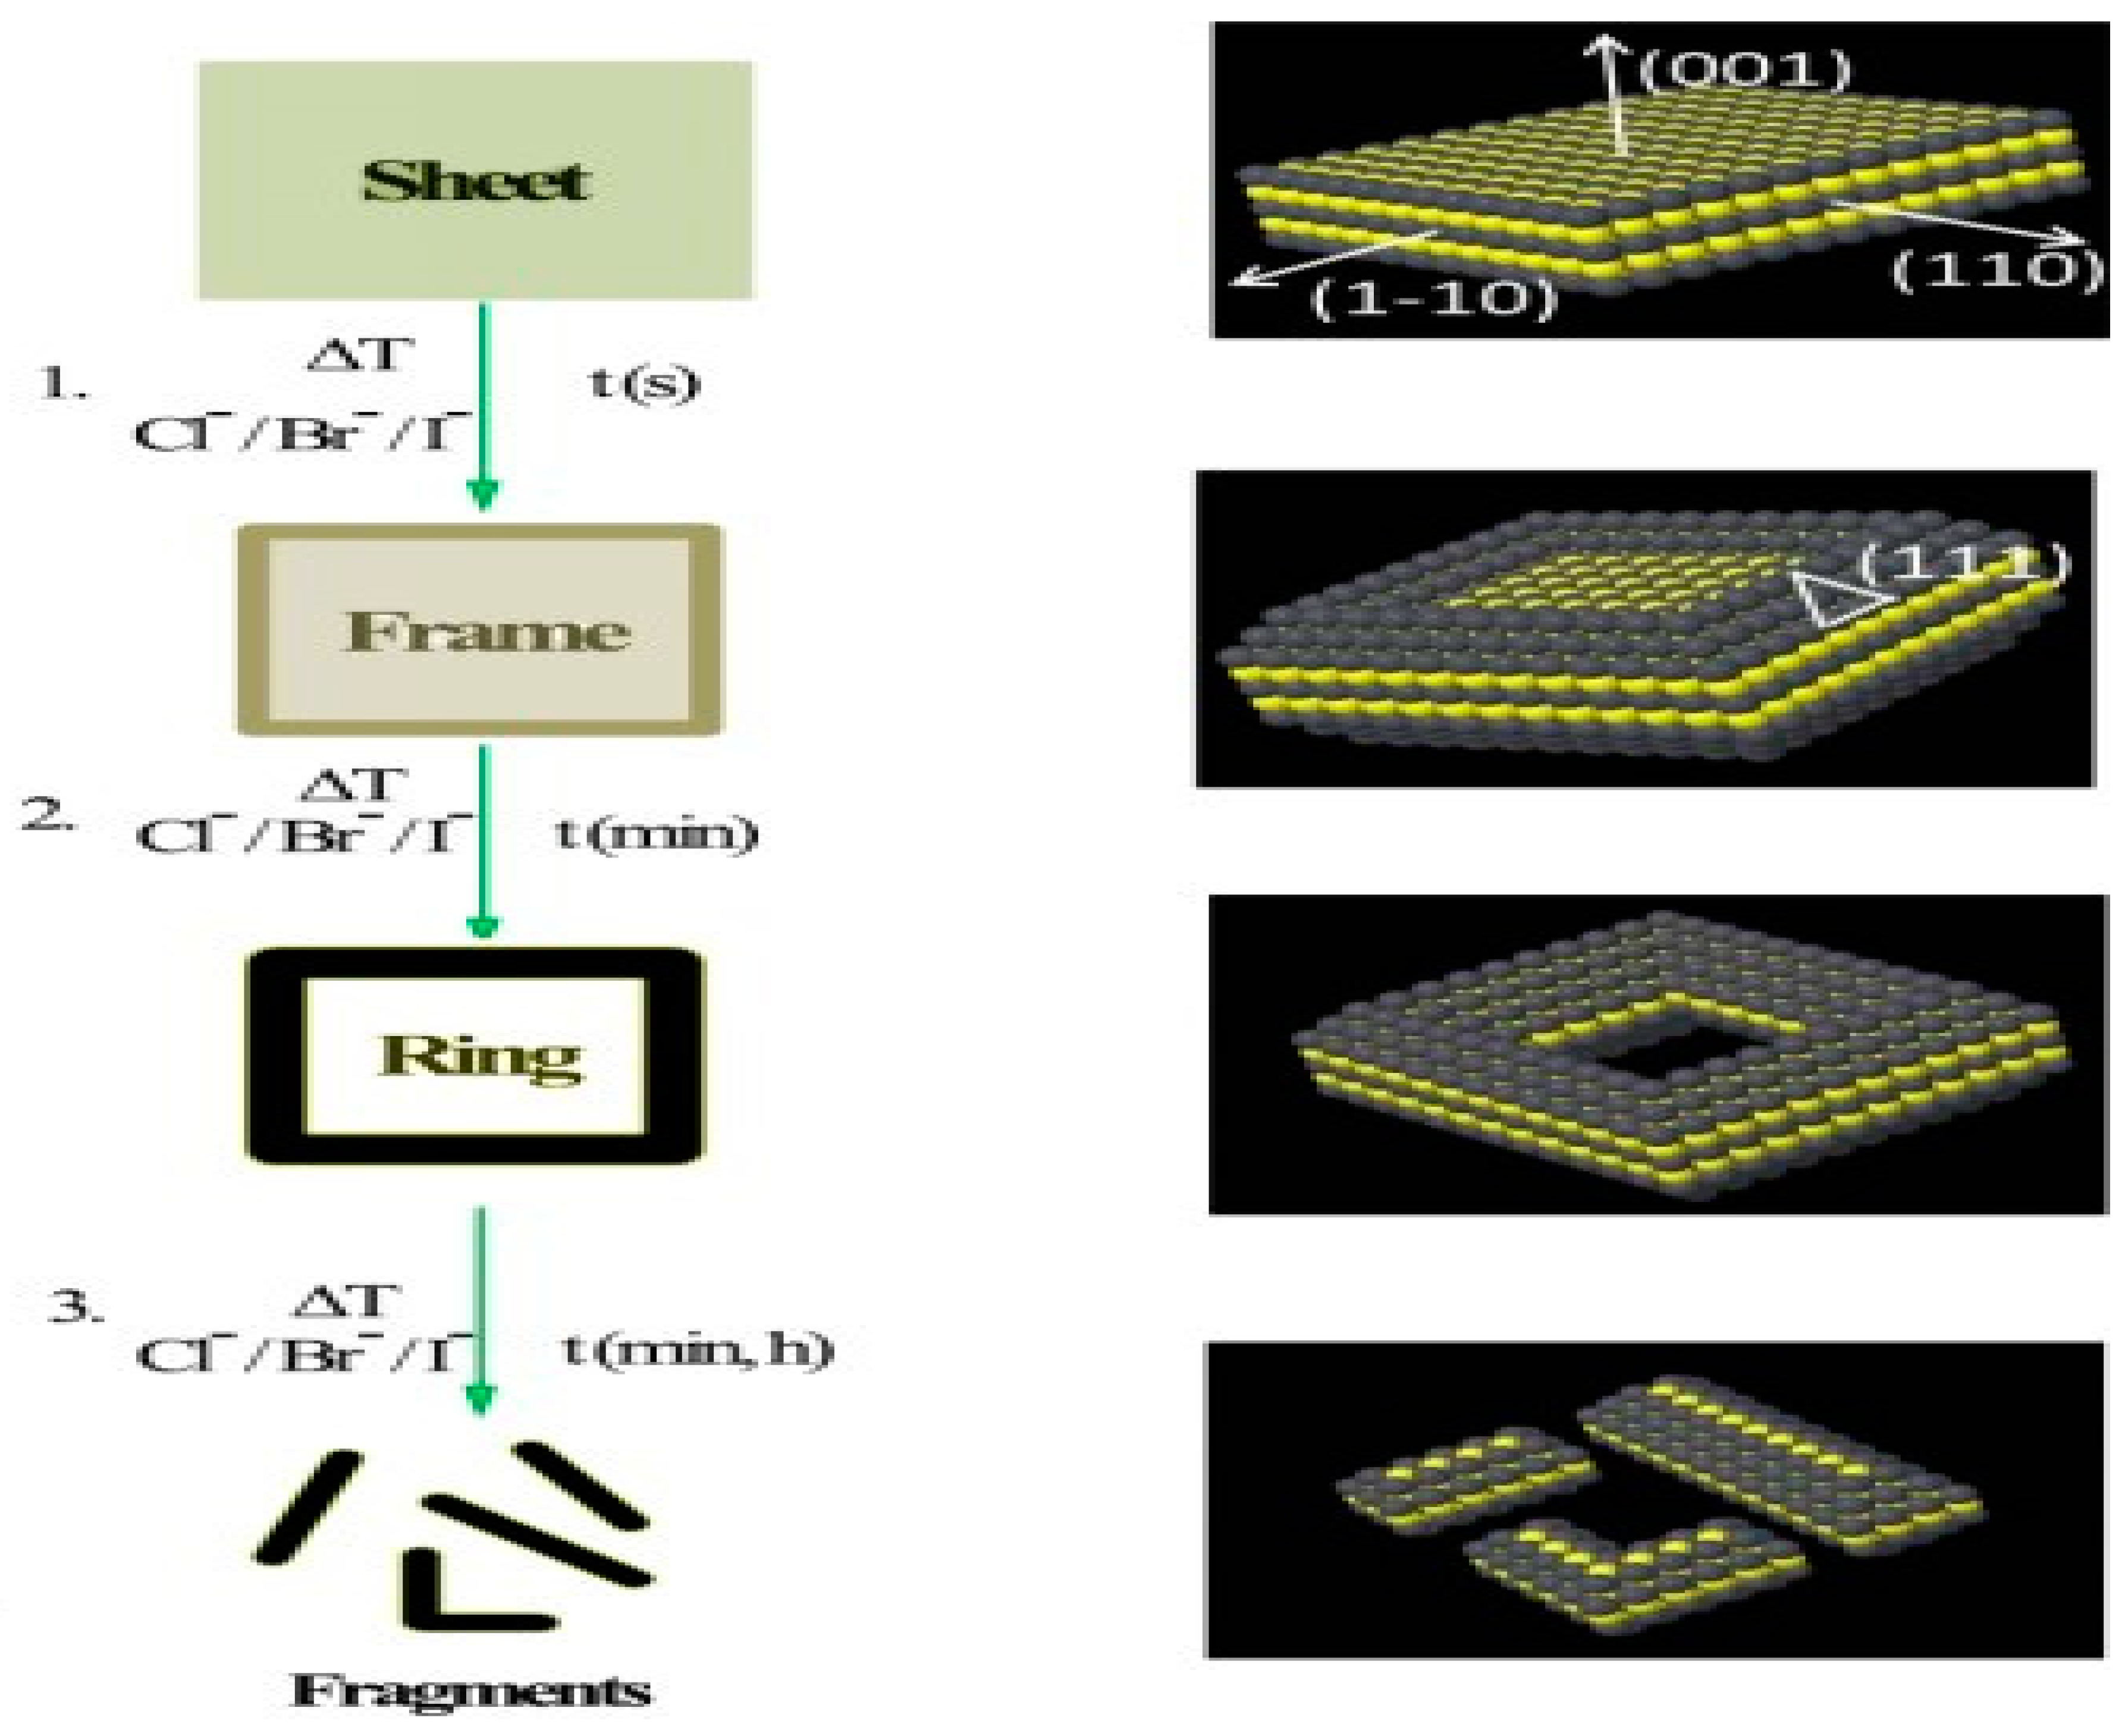
| Synthetic approach used | Metal | morphology | references |
|---|---|---|---|
| Nanocrystal face selected carving | Pt-Cu-Co | Rhombic dodecahedron | [30] |
| Pt-Ni-Sn | Rhombic dodecahedron | [53] | |
| Au@Pd | cubical | [54] | |
| Deposition of different metals on the template by preferentially edge-selection | Ru-Pd | Octahedroncuboctahedron | [55], |
| Ir-Cu | Rhombic dodecahedron | [51] | |
| Ag-Au-Pt | cube | [56] | |
| Hollow nanocrystal’s dealloying | Ir-Cu-Au | Rhombic dodecahedron | [51] |
| Pd-Au | Cube truncated octahedron | [57] | |
| Pt-Au | Cube truncated octahedron | [57] | |
| Template-assisted arrangement of nanoscale building blocks | Au | Triangle, tripod | [58] |
| Directed deposition of nanoframe | Pt-Au@Au | Double-layered triangle, ring, hexagon | [48] |
| Pt-Ni@MOF | Rhombic dodecahedron | [50] | |
2.6. Thermal Reductions
2.7. Oxidative Etching

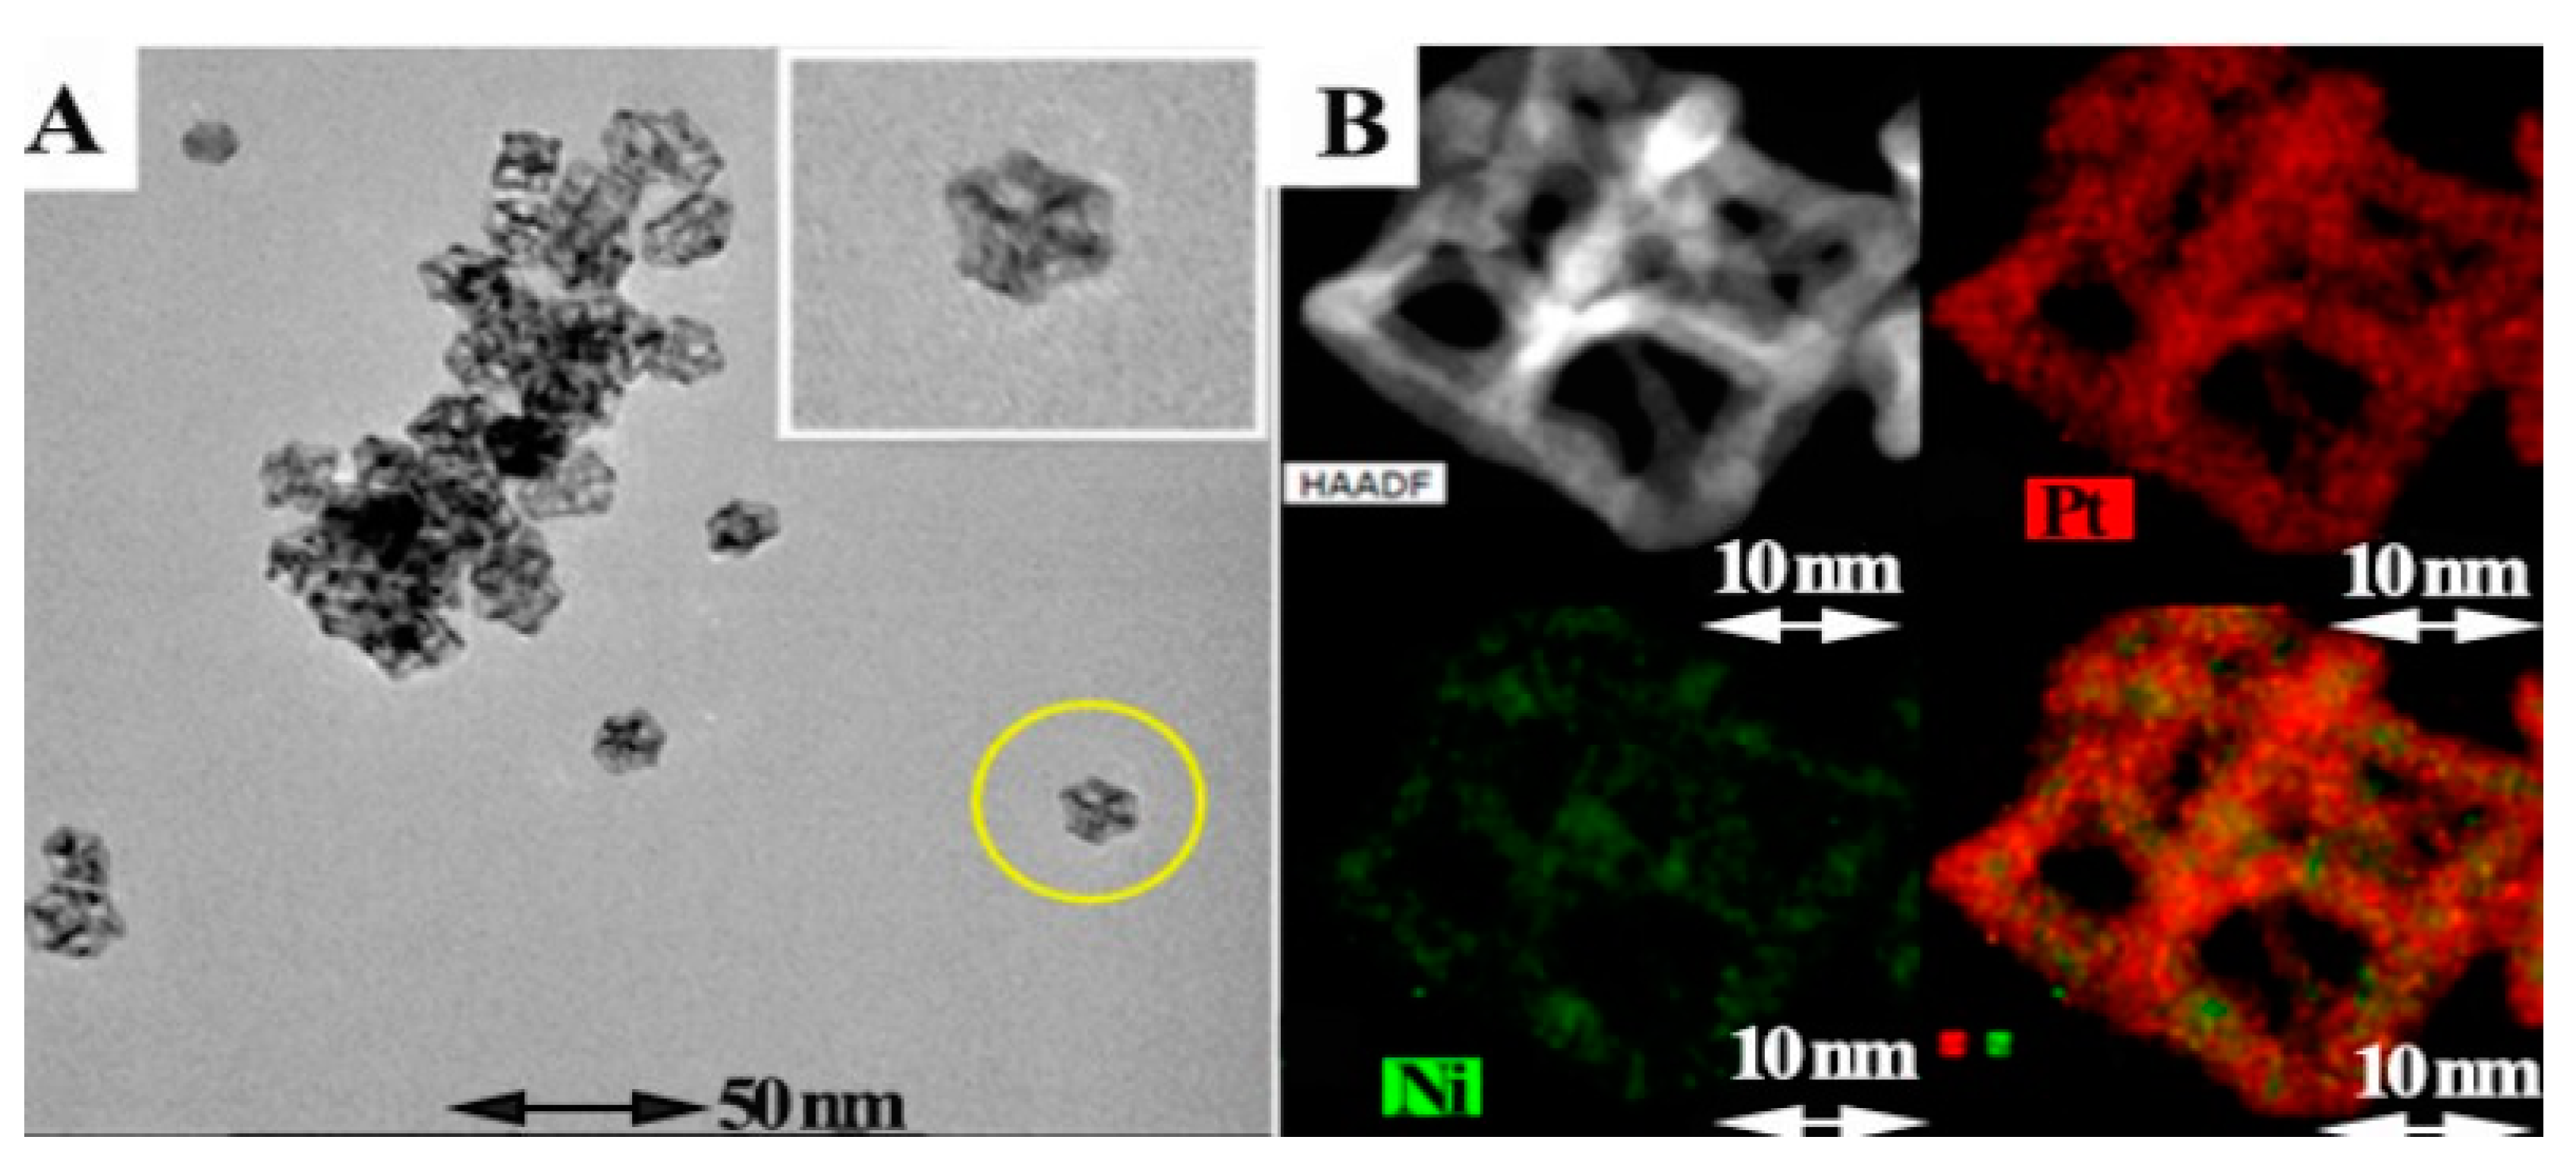
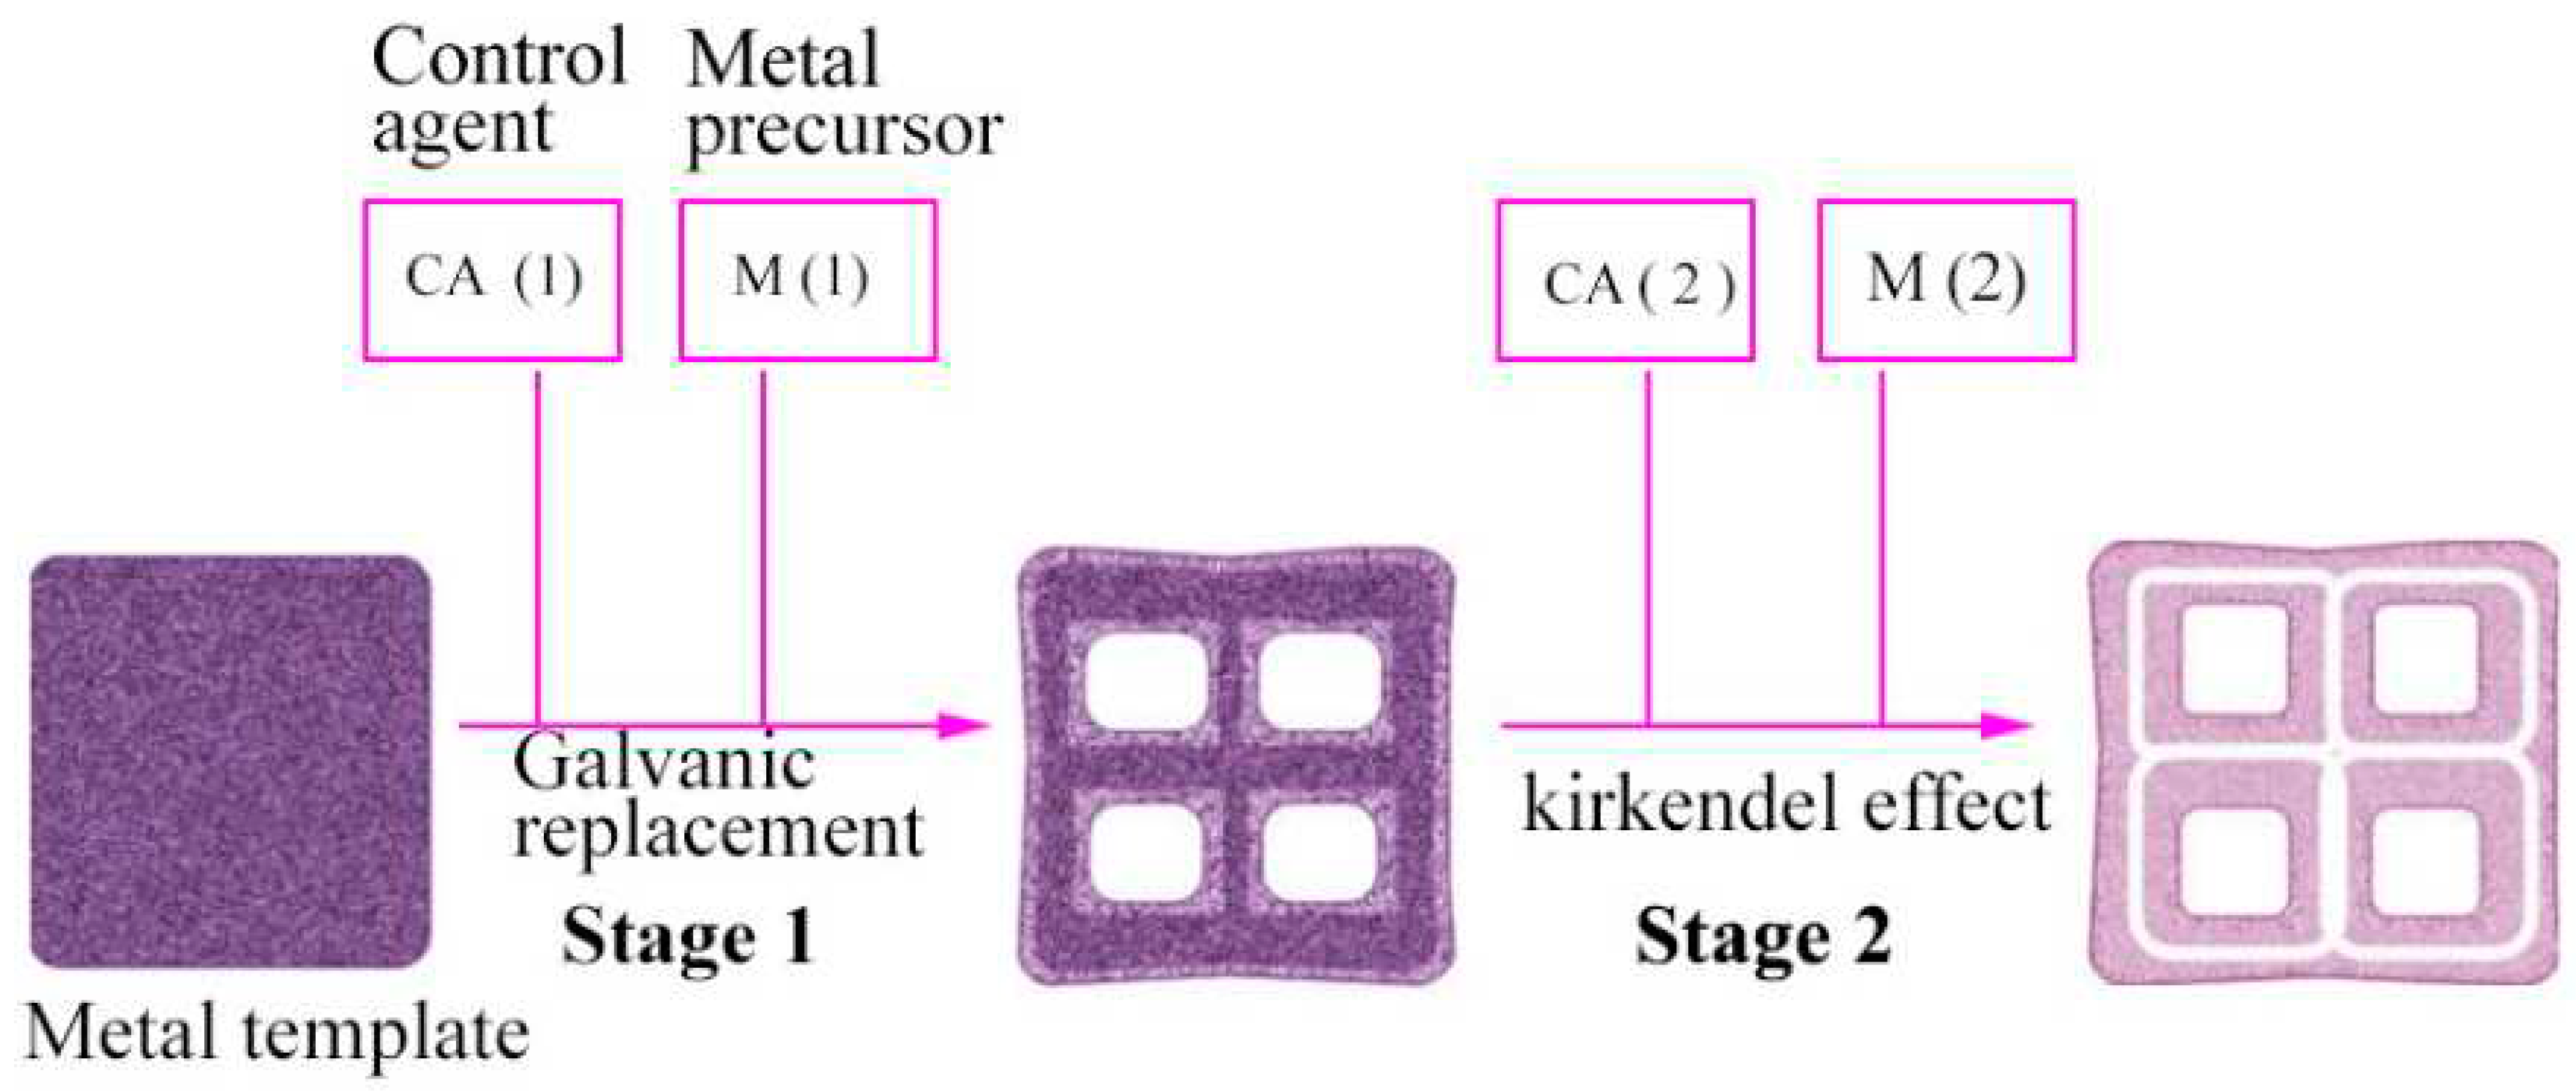
2.8. Galvanic Replacement Reaction
2.9. Kirkendall Effect
2.10. Photocatalytic Template Synthesis
2.11. Self-Assembly of Nanoparticles
2.12. Solvo-Thermal Synthesis
3. Different Metal Nano-Frames
3.1. Metal Nanoframe
3.2. Alloy Metal Nanoframe
3.3. Doped Metal Nanoframes
4. Applications
4.1. Electro Catalytic Performance
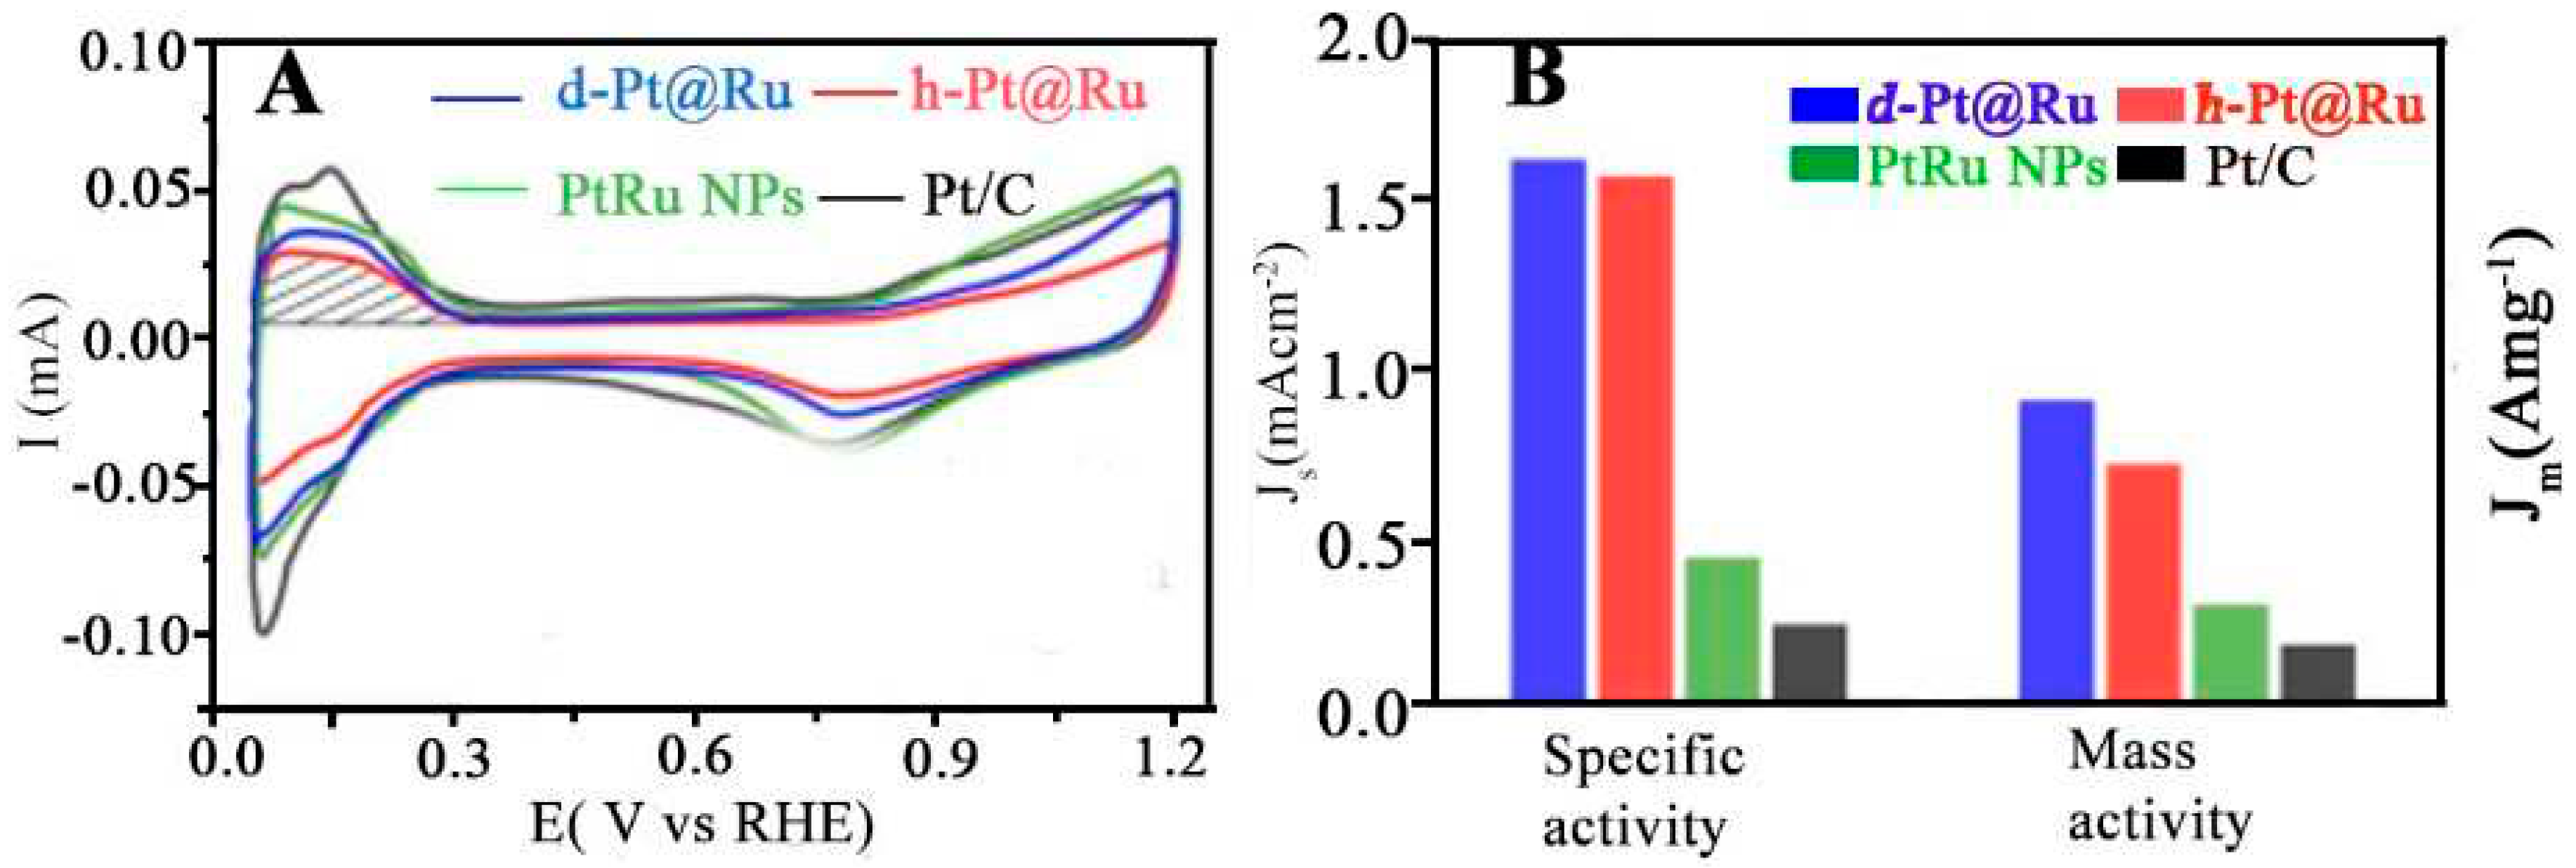
4.1.1. MOR
4.1.2. EOR
4.1.3. ORR
4.1.4. HER
4.1.5. Formic Acid Oxidation Reaction (FAOR)
4.1.6. Overall Water Splitting
4.1.7. GOR
4.2. Biomedical Applications
4.2.1. Healing of Liver Injury
4.2.2. Detection of Tumor Cells
4.2.3. Synergistic Photo Thermal and Chemo Dynamic Therapy
4.3. Theranostic Application
4.4. Industrial Applications (Dye removal)
4.4.1. Methyl Red
4.4.2. Methylene Blue
| Catalyst | Catalyst (g/L) |
Irradiation Time (min) |
Wavelength (nm) |
Degradation % |
References |
| MnFe2O4 | 0.3 | 120 | Visible | 15.1 | [98] |
| MgFe2O4 | 0.6 | 180 | 400-700nm | 26.0 | [99] |
| ZnFe2O4 | 0.6 | 360 | 400-700nm | 32.0 | [99] |
| CaFe2O4 | 1.0 | 360 | ›420nm | 28.0 | [100] |
| BaFe12O19 | 1.0 | 360 | 420-700nm | 26.0 | [101] |
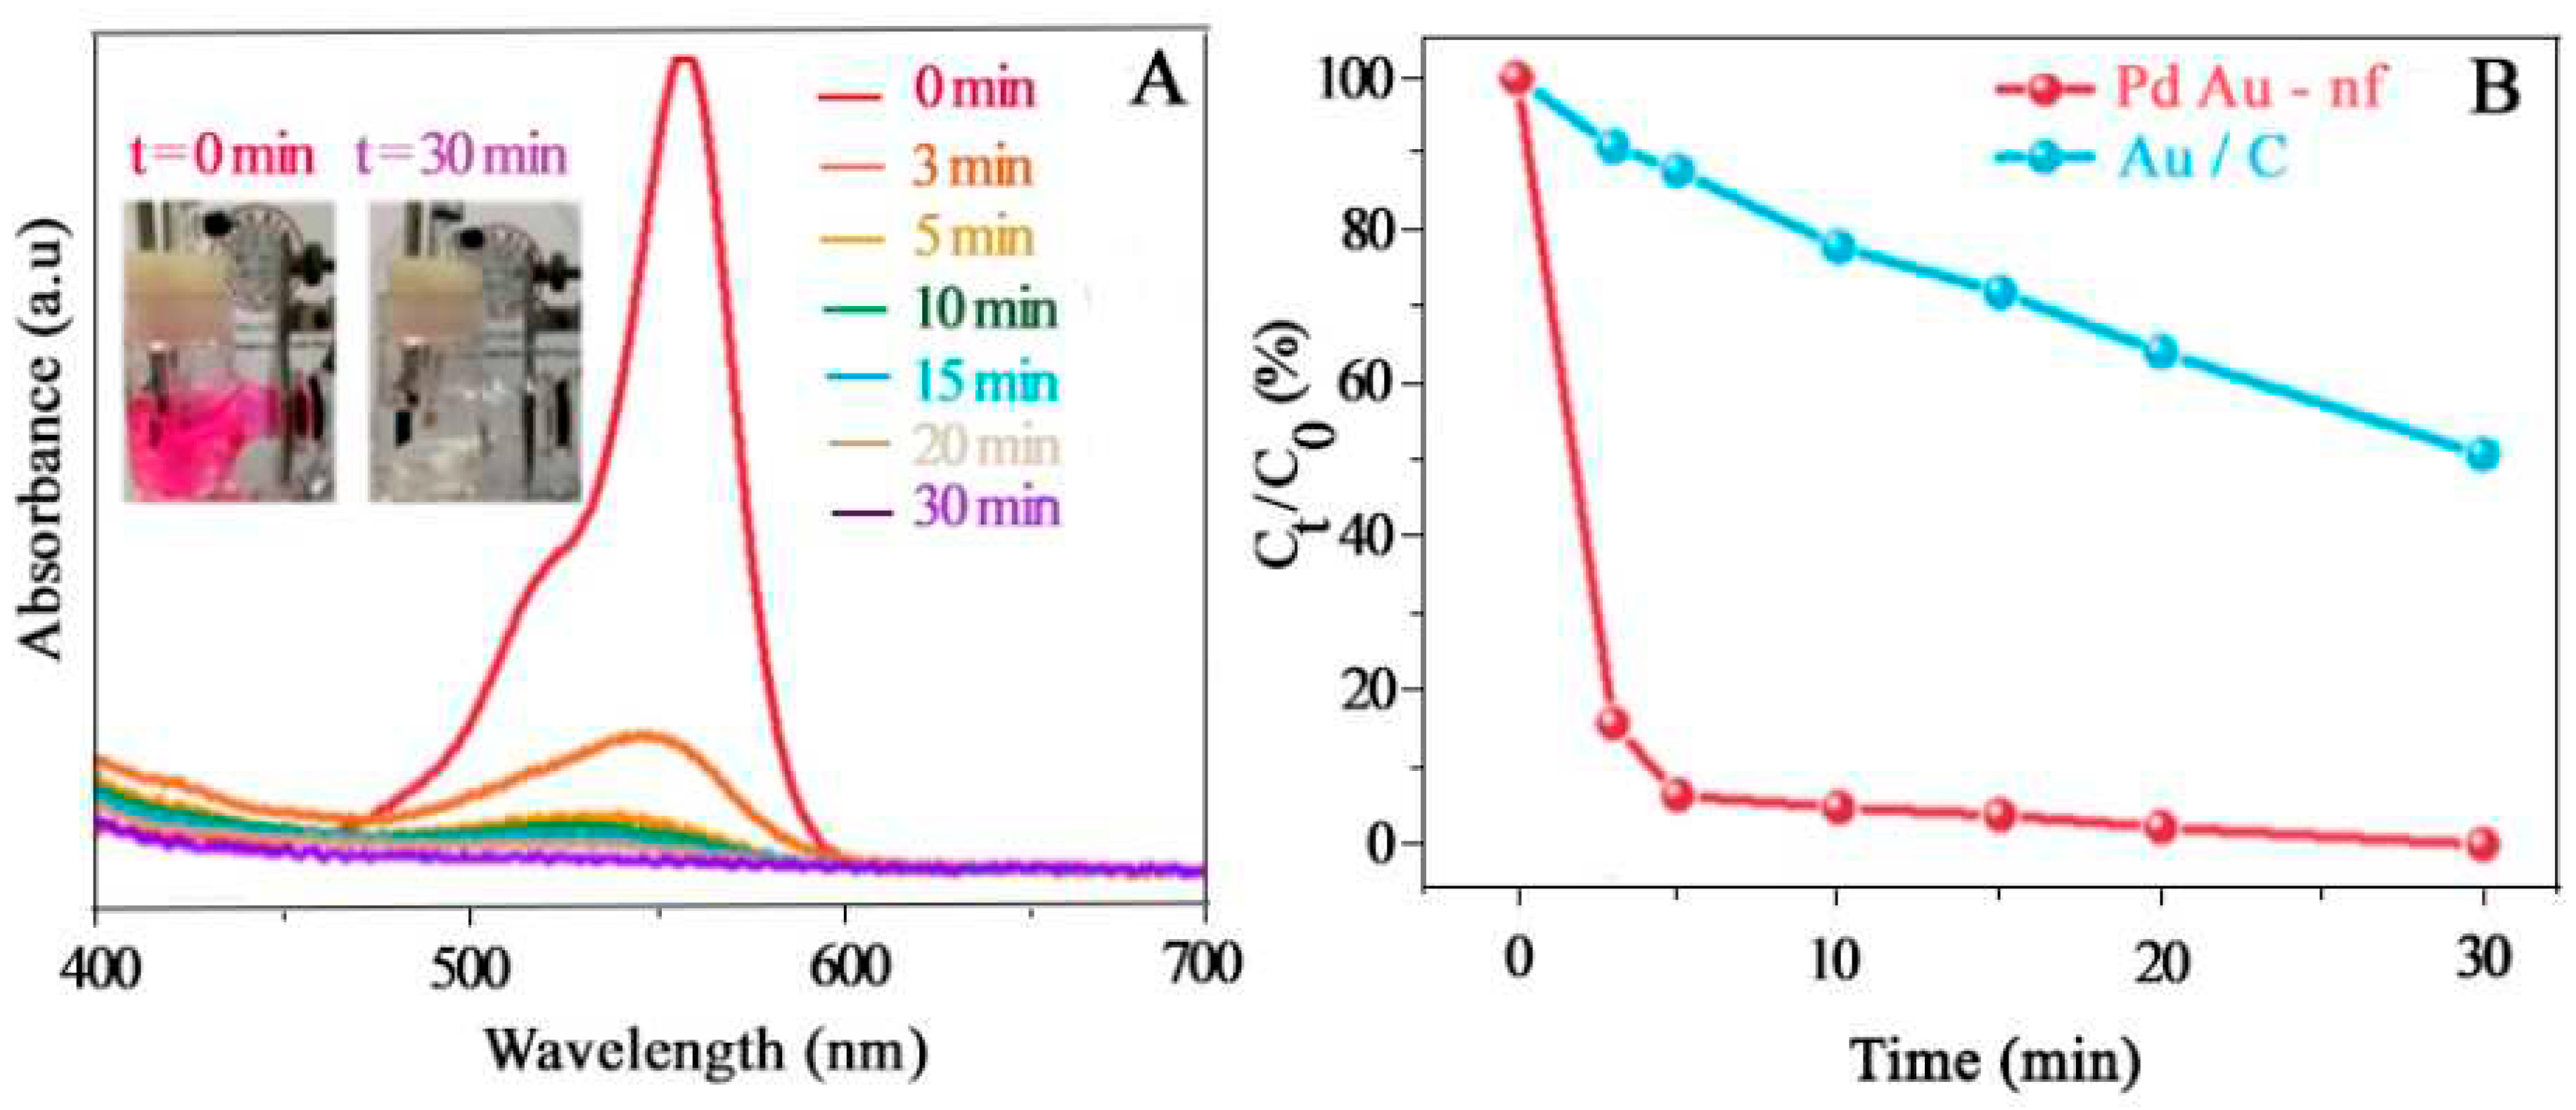
| COPC-NFs | 0.3 | 30 | 808nm | 43.9 | Present work |
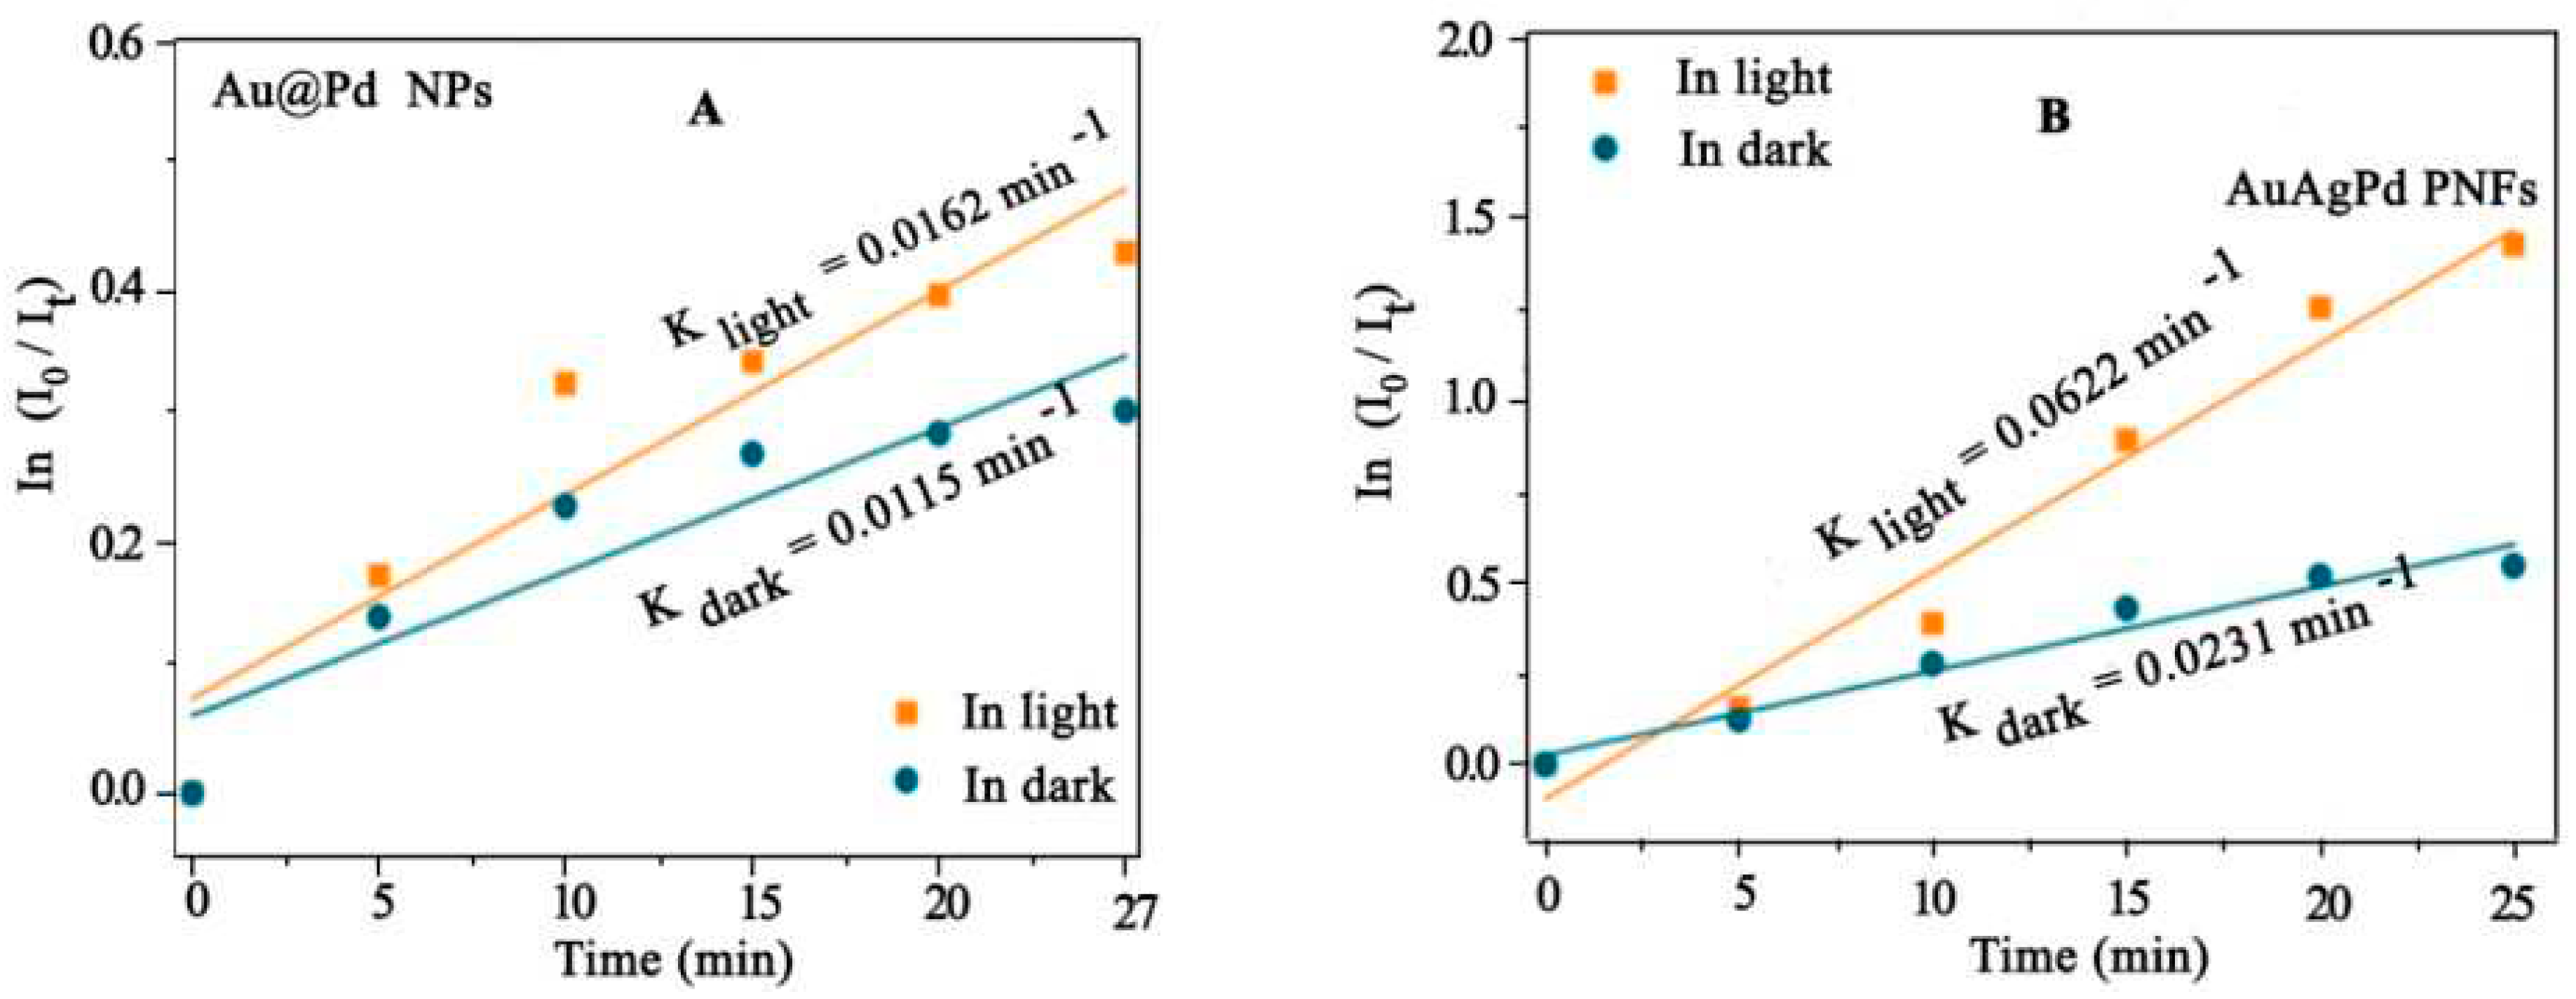
4.4.3. 4-Nitro Phenol
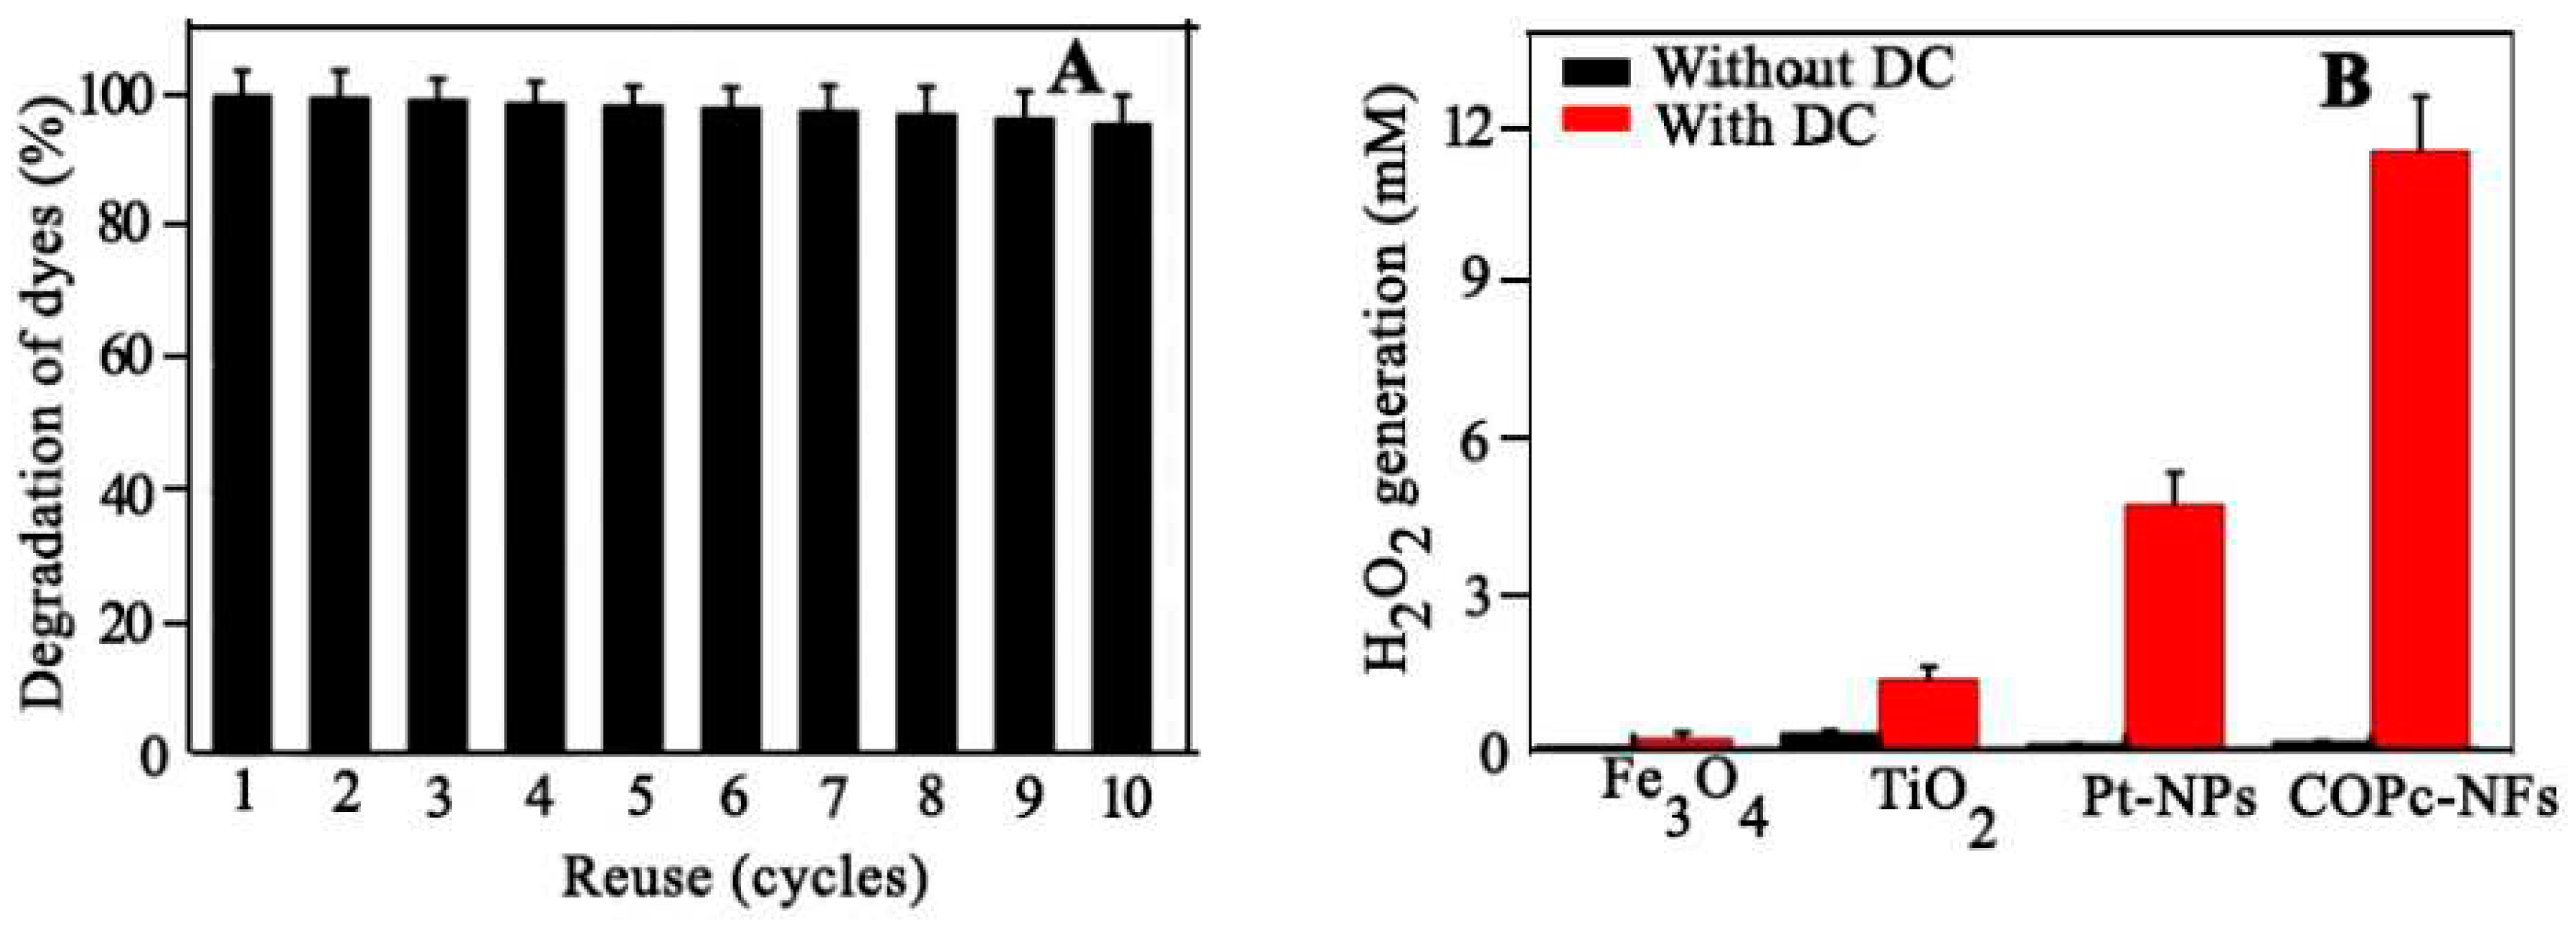
4.5. Electro Fenton Application: H2O2 Production in Acids
4.6. Electrical Batteries
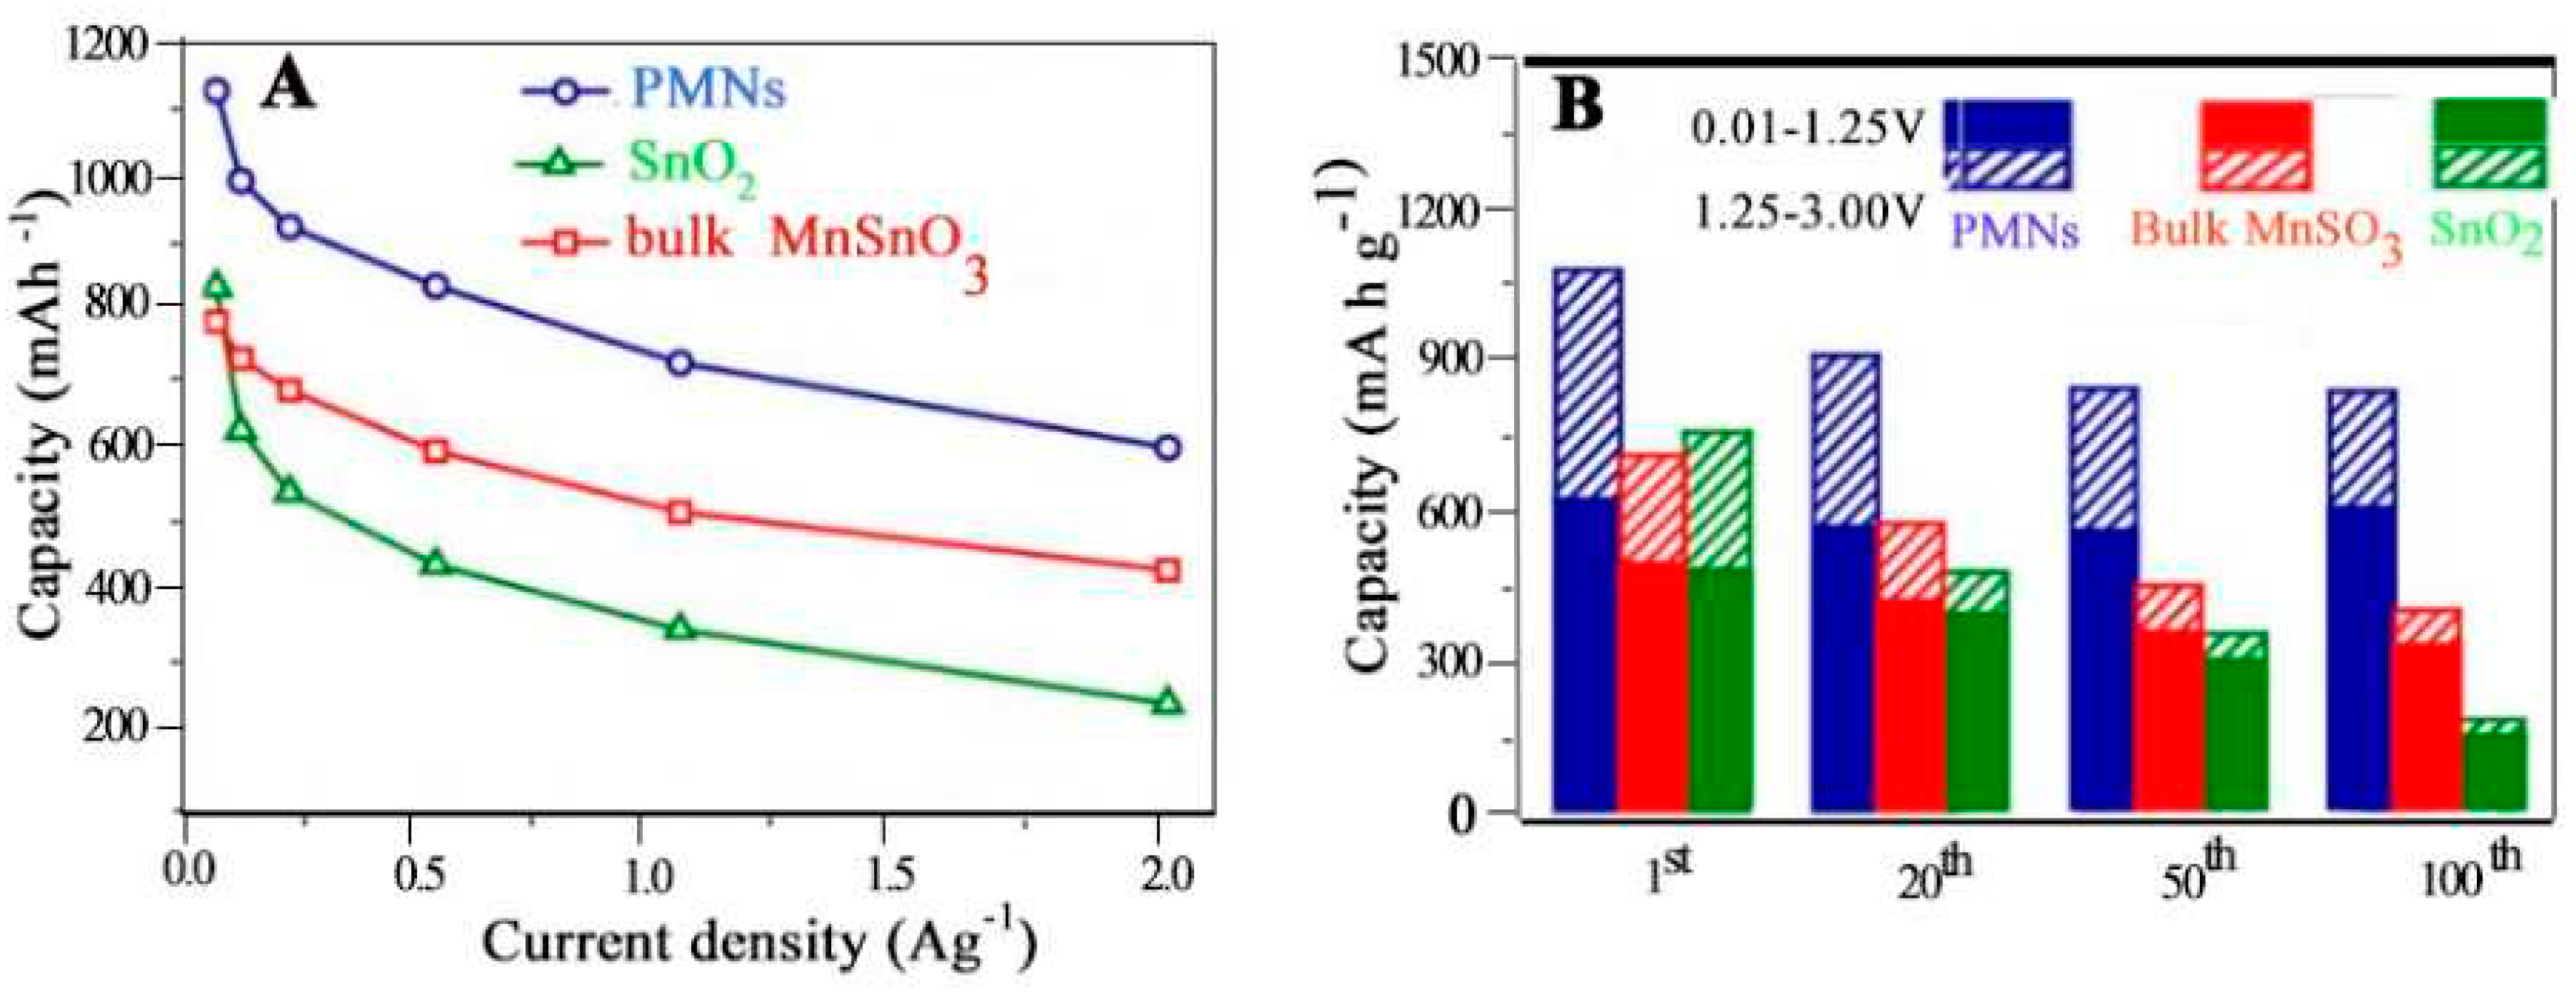
4.6.1. Lithium-Ion Battery Anodes
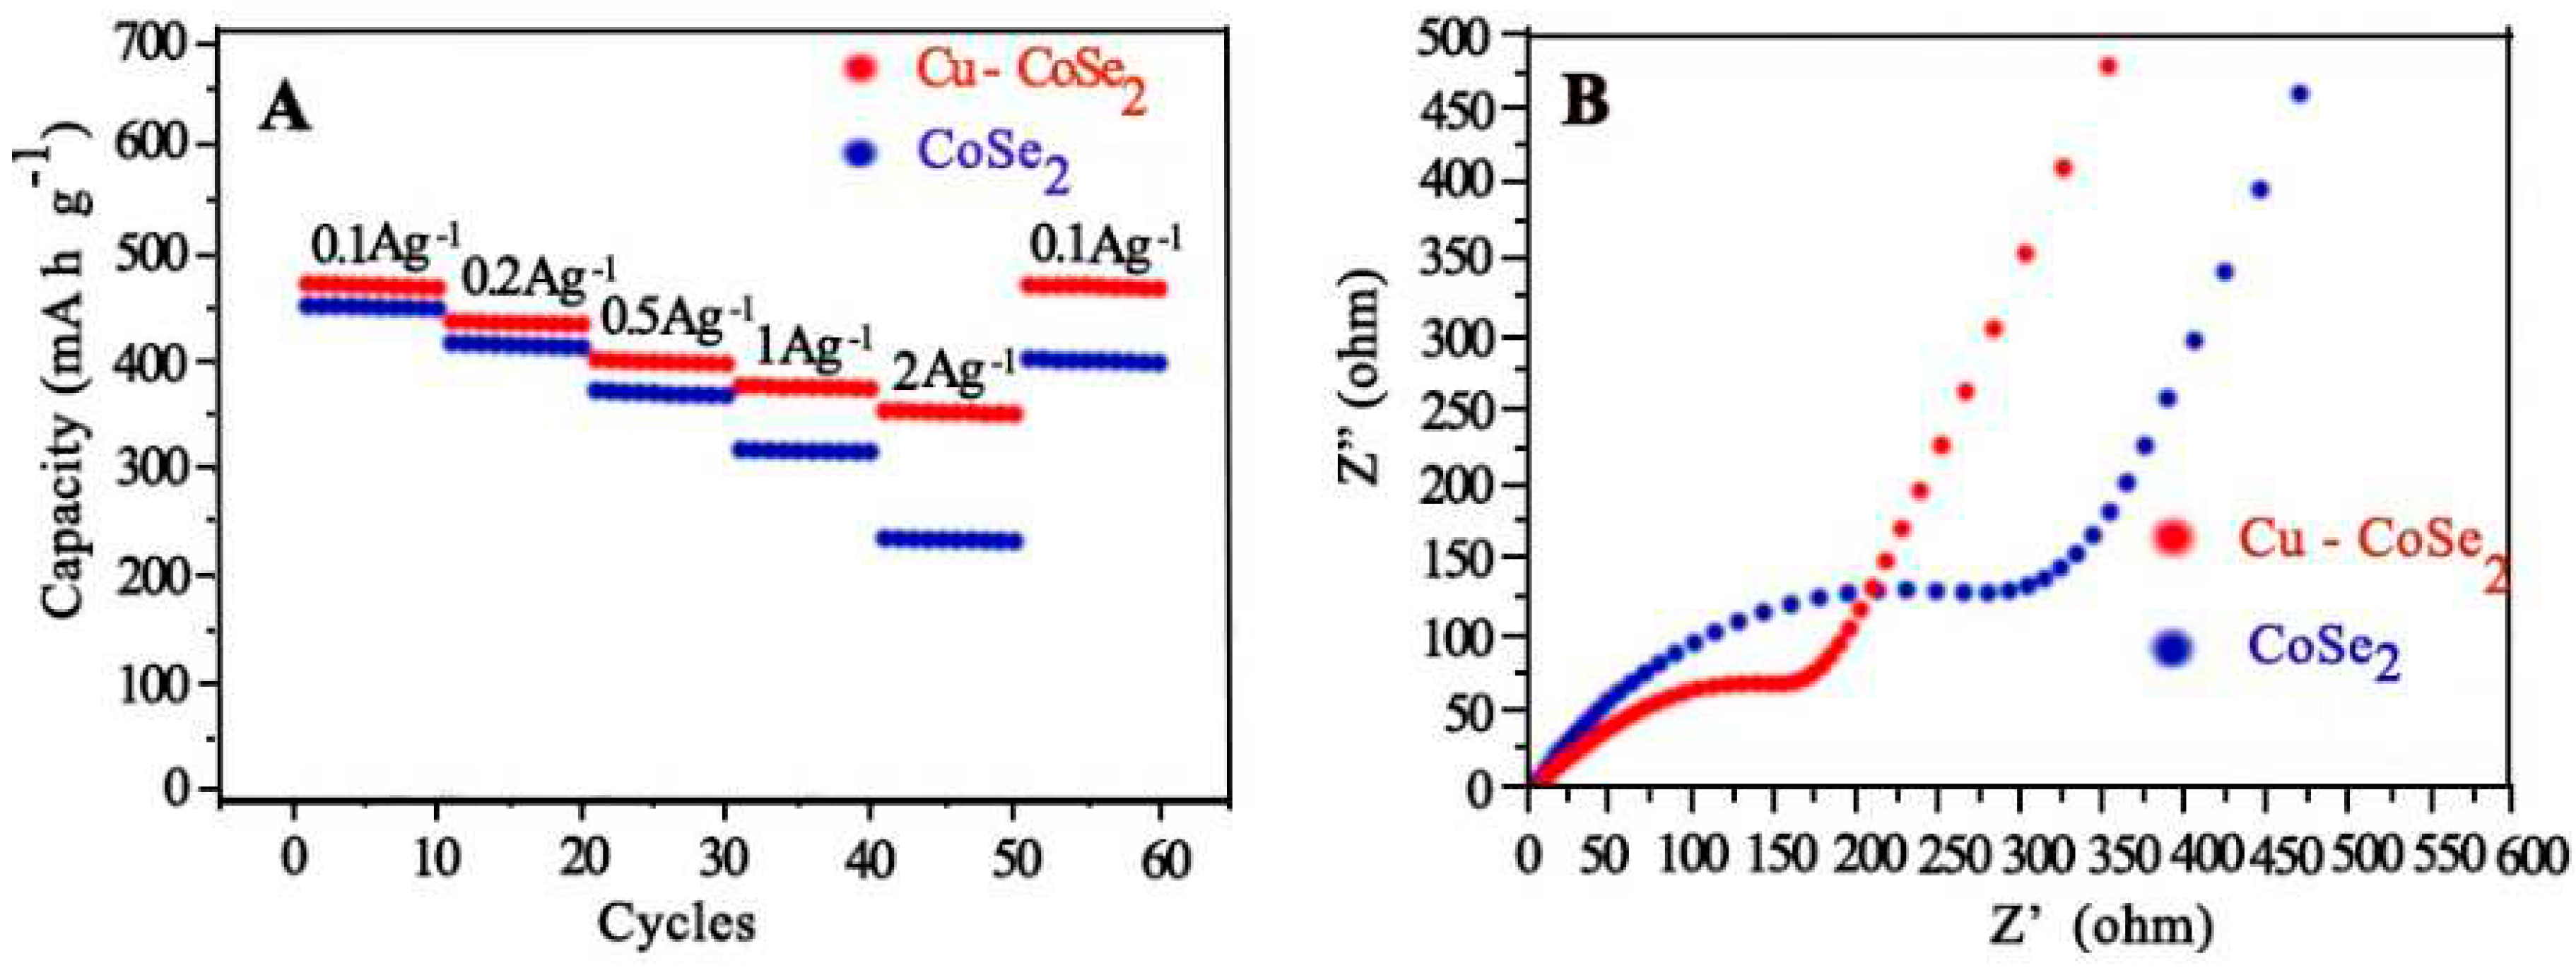
4.6.2. Na-Ion Batteries
4.7. Energy Storage Devices
4.7.1. Li-S Cells
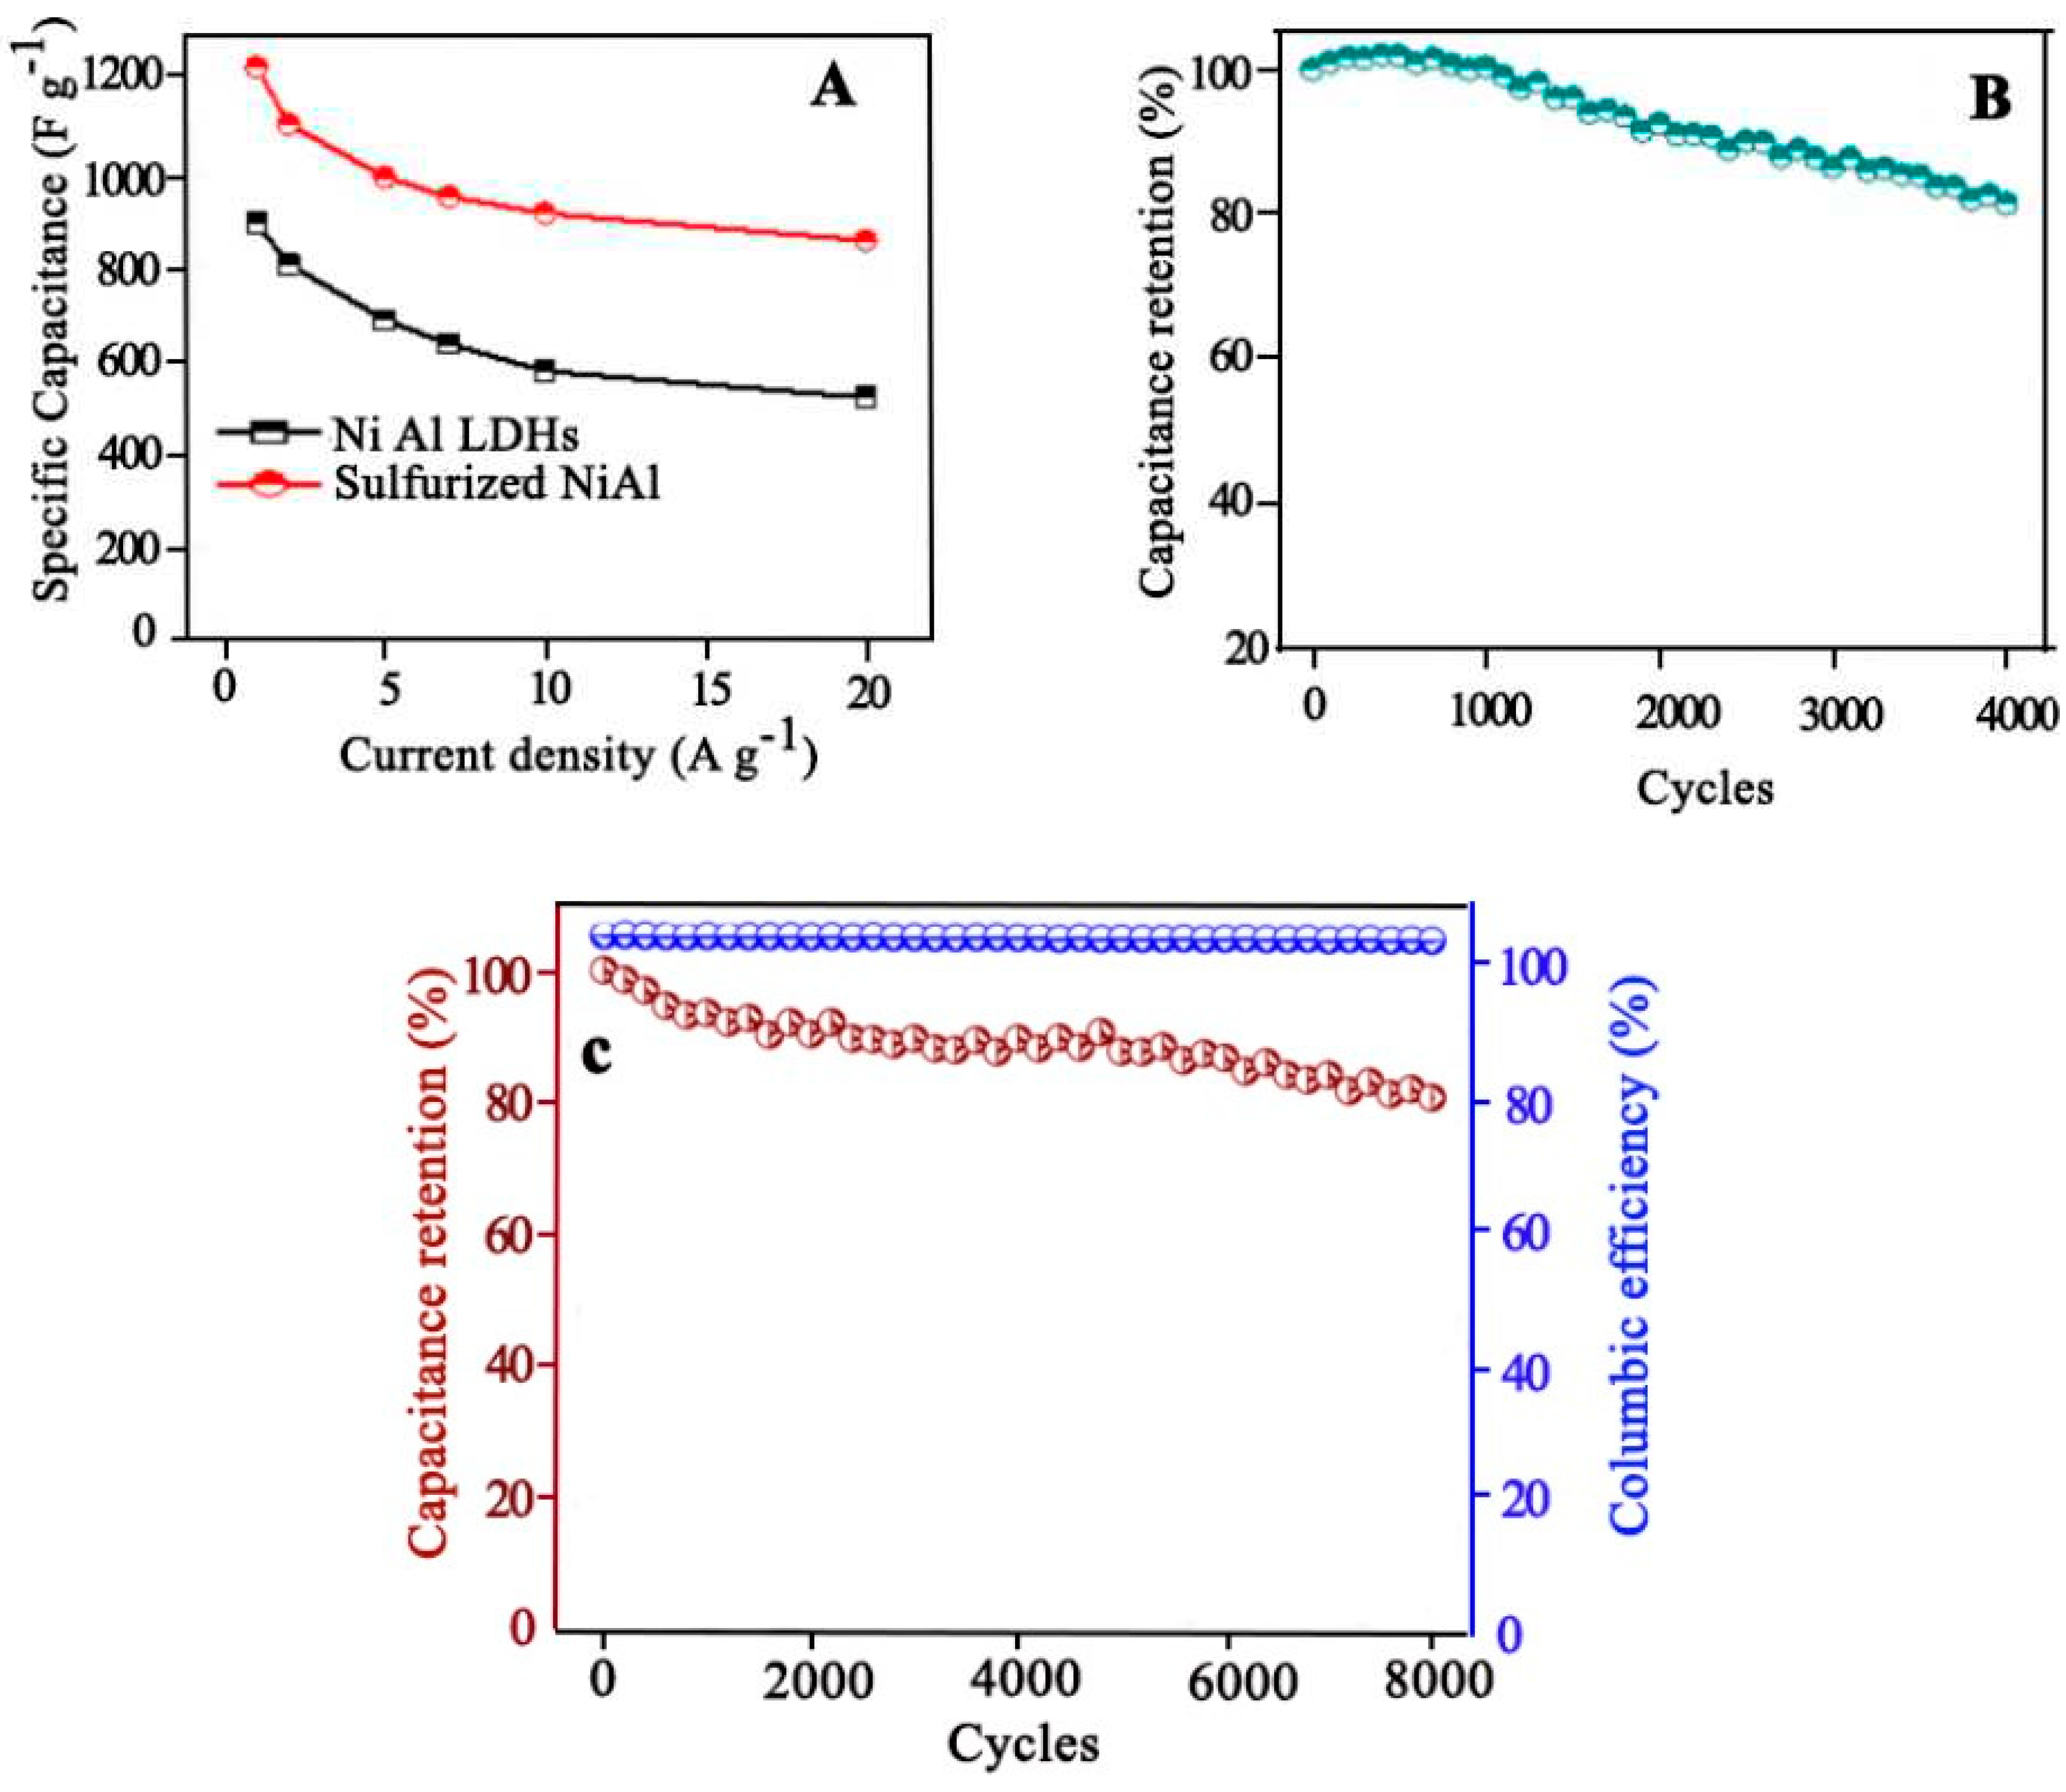
4.7.2. Supercapacitor Electrodes
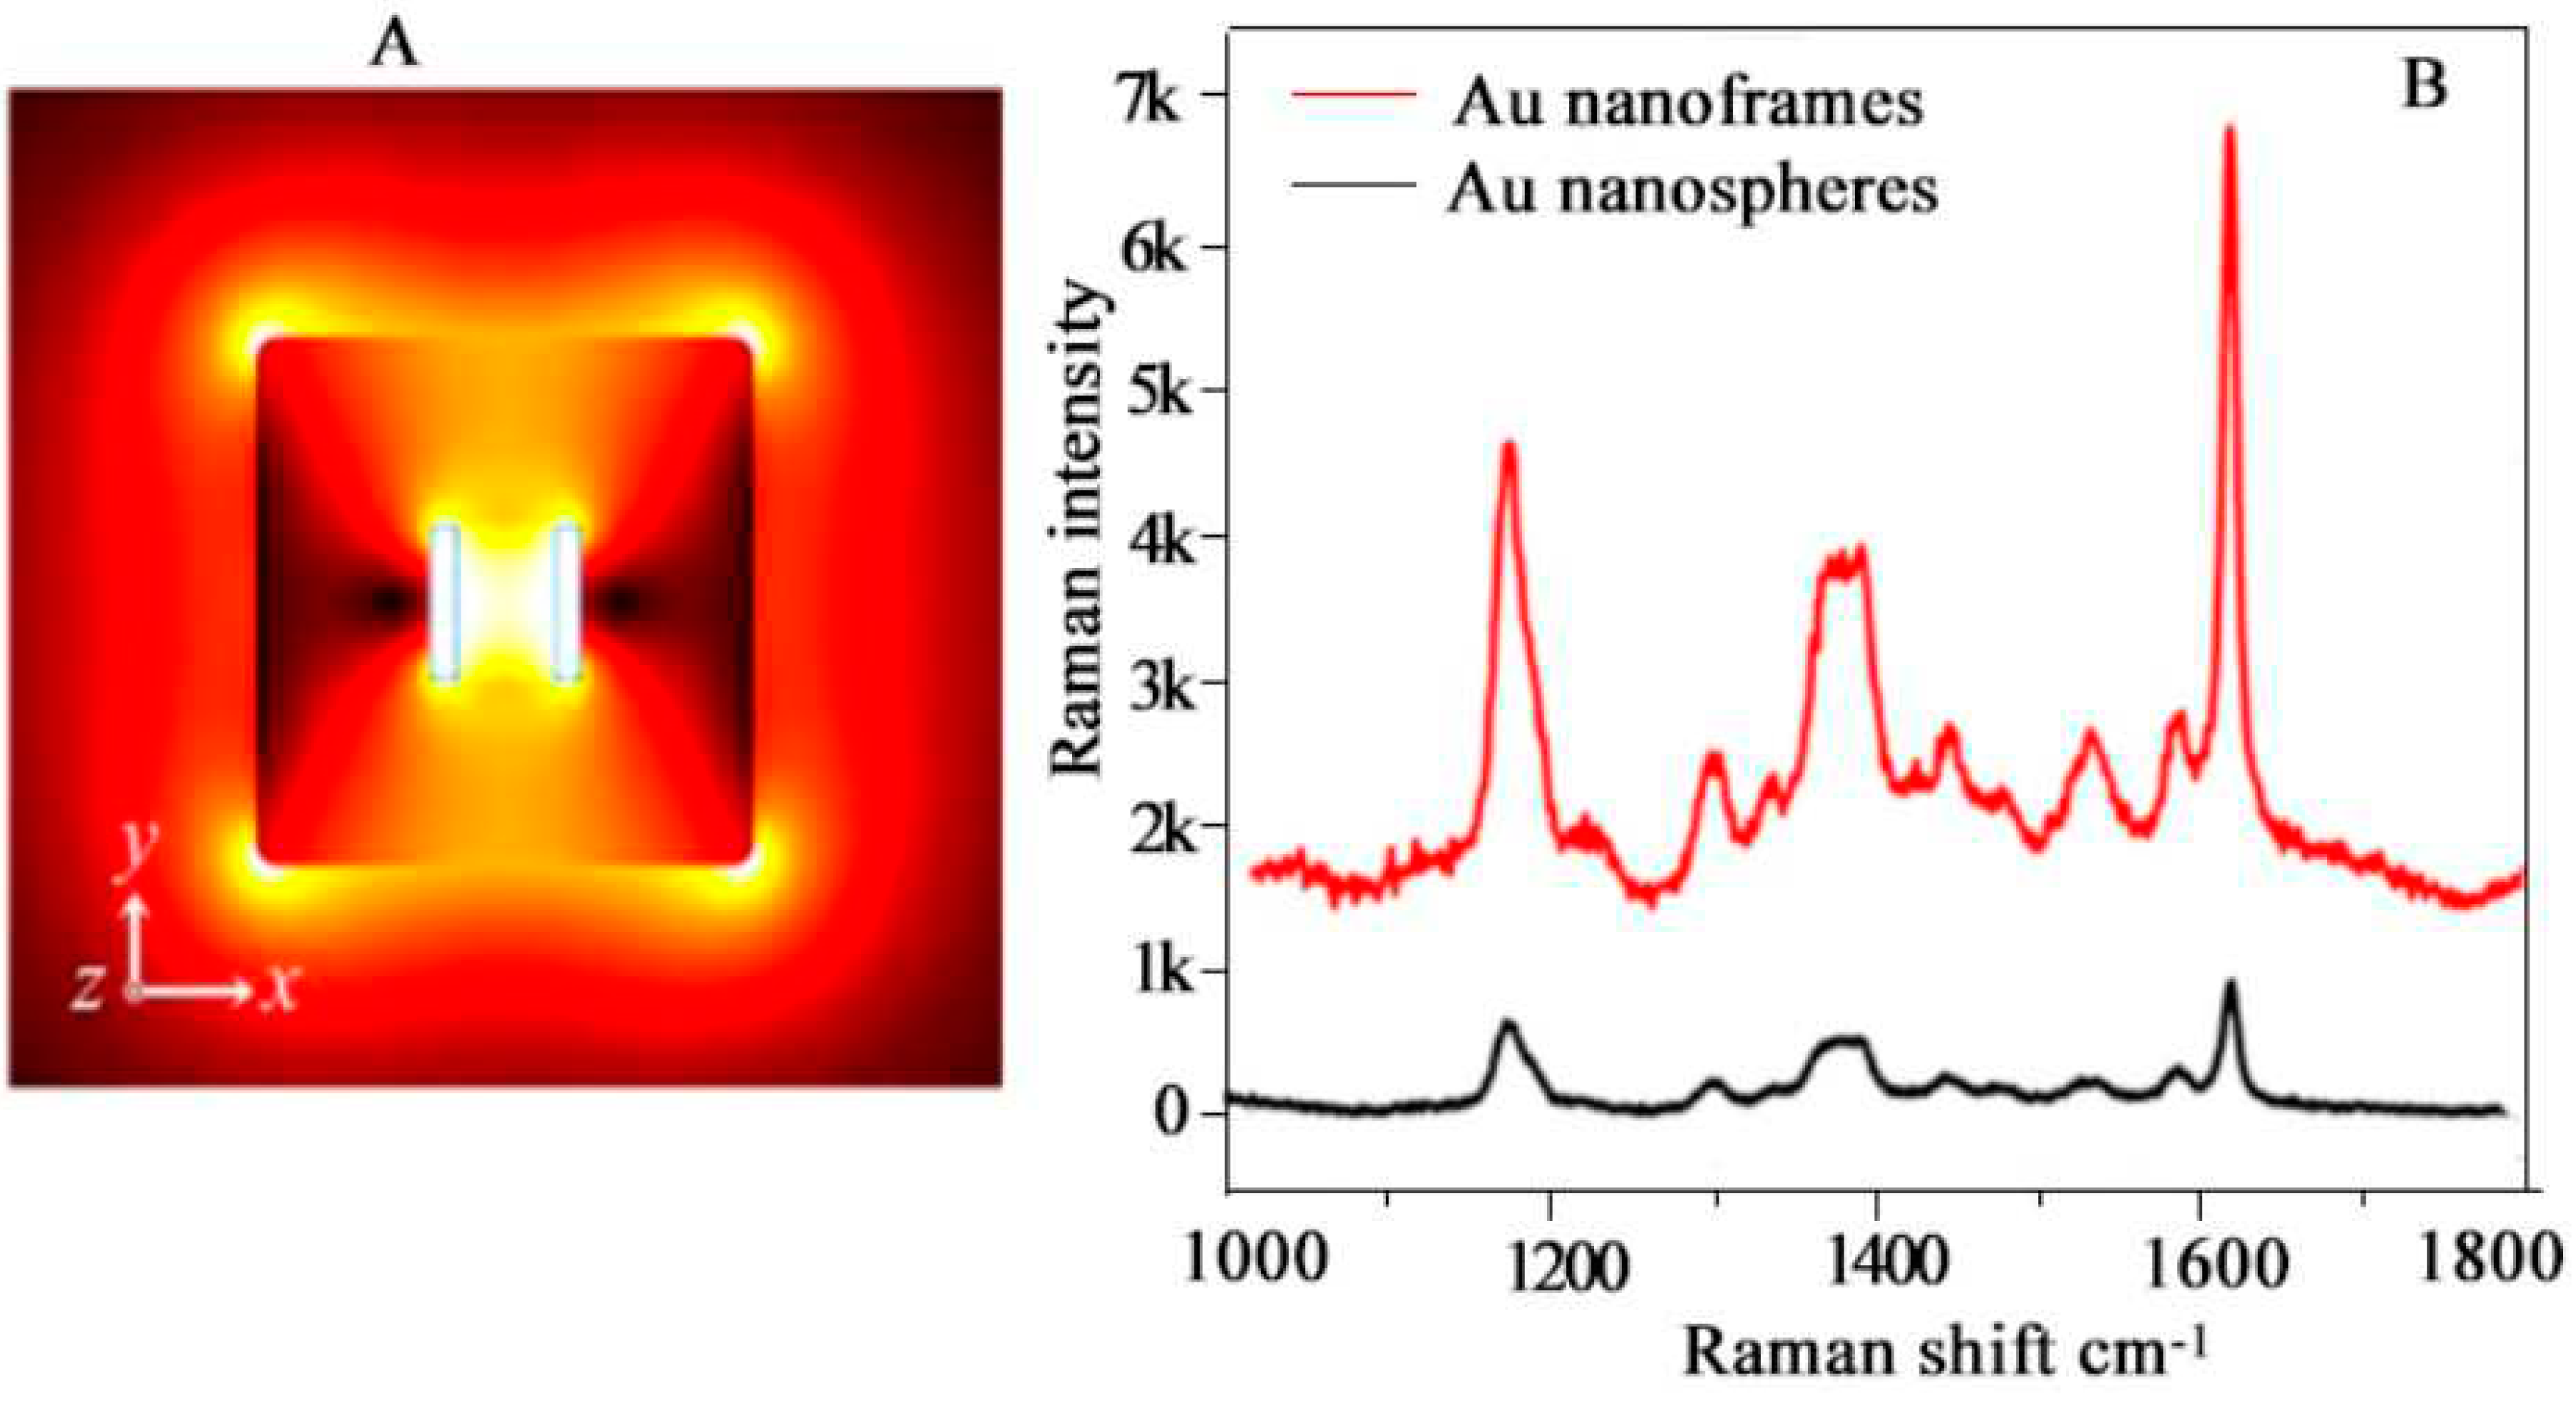
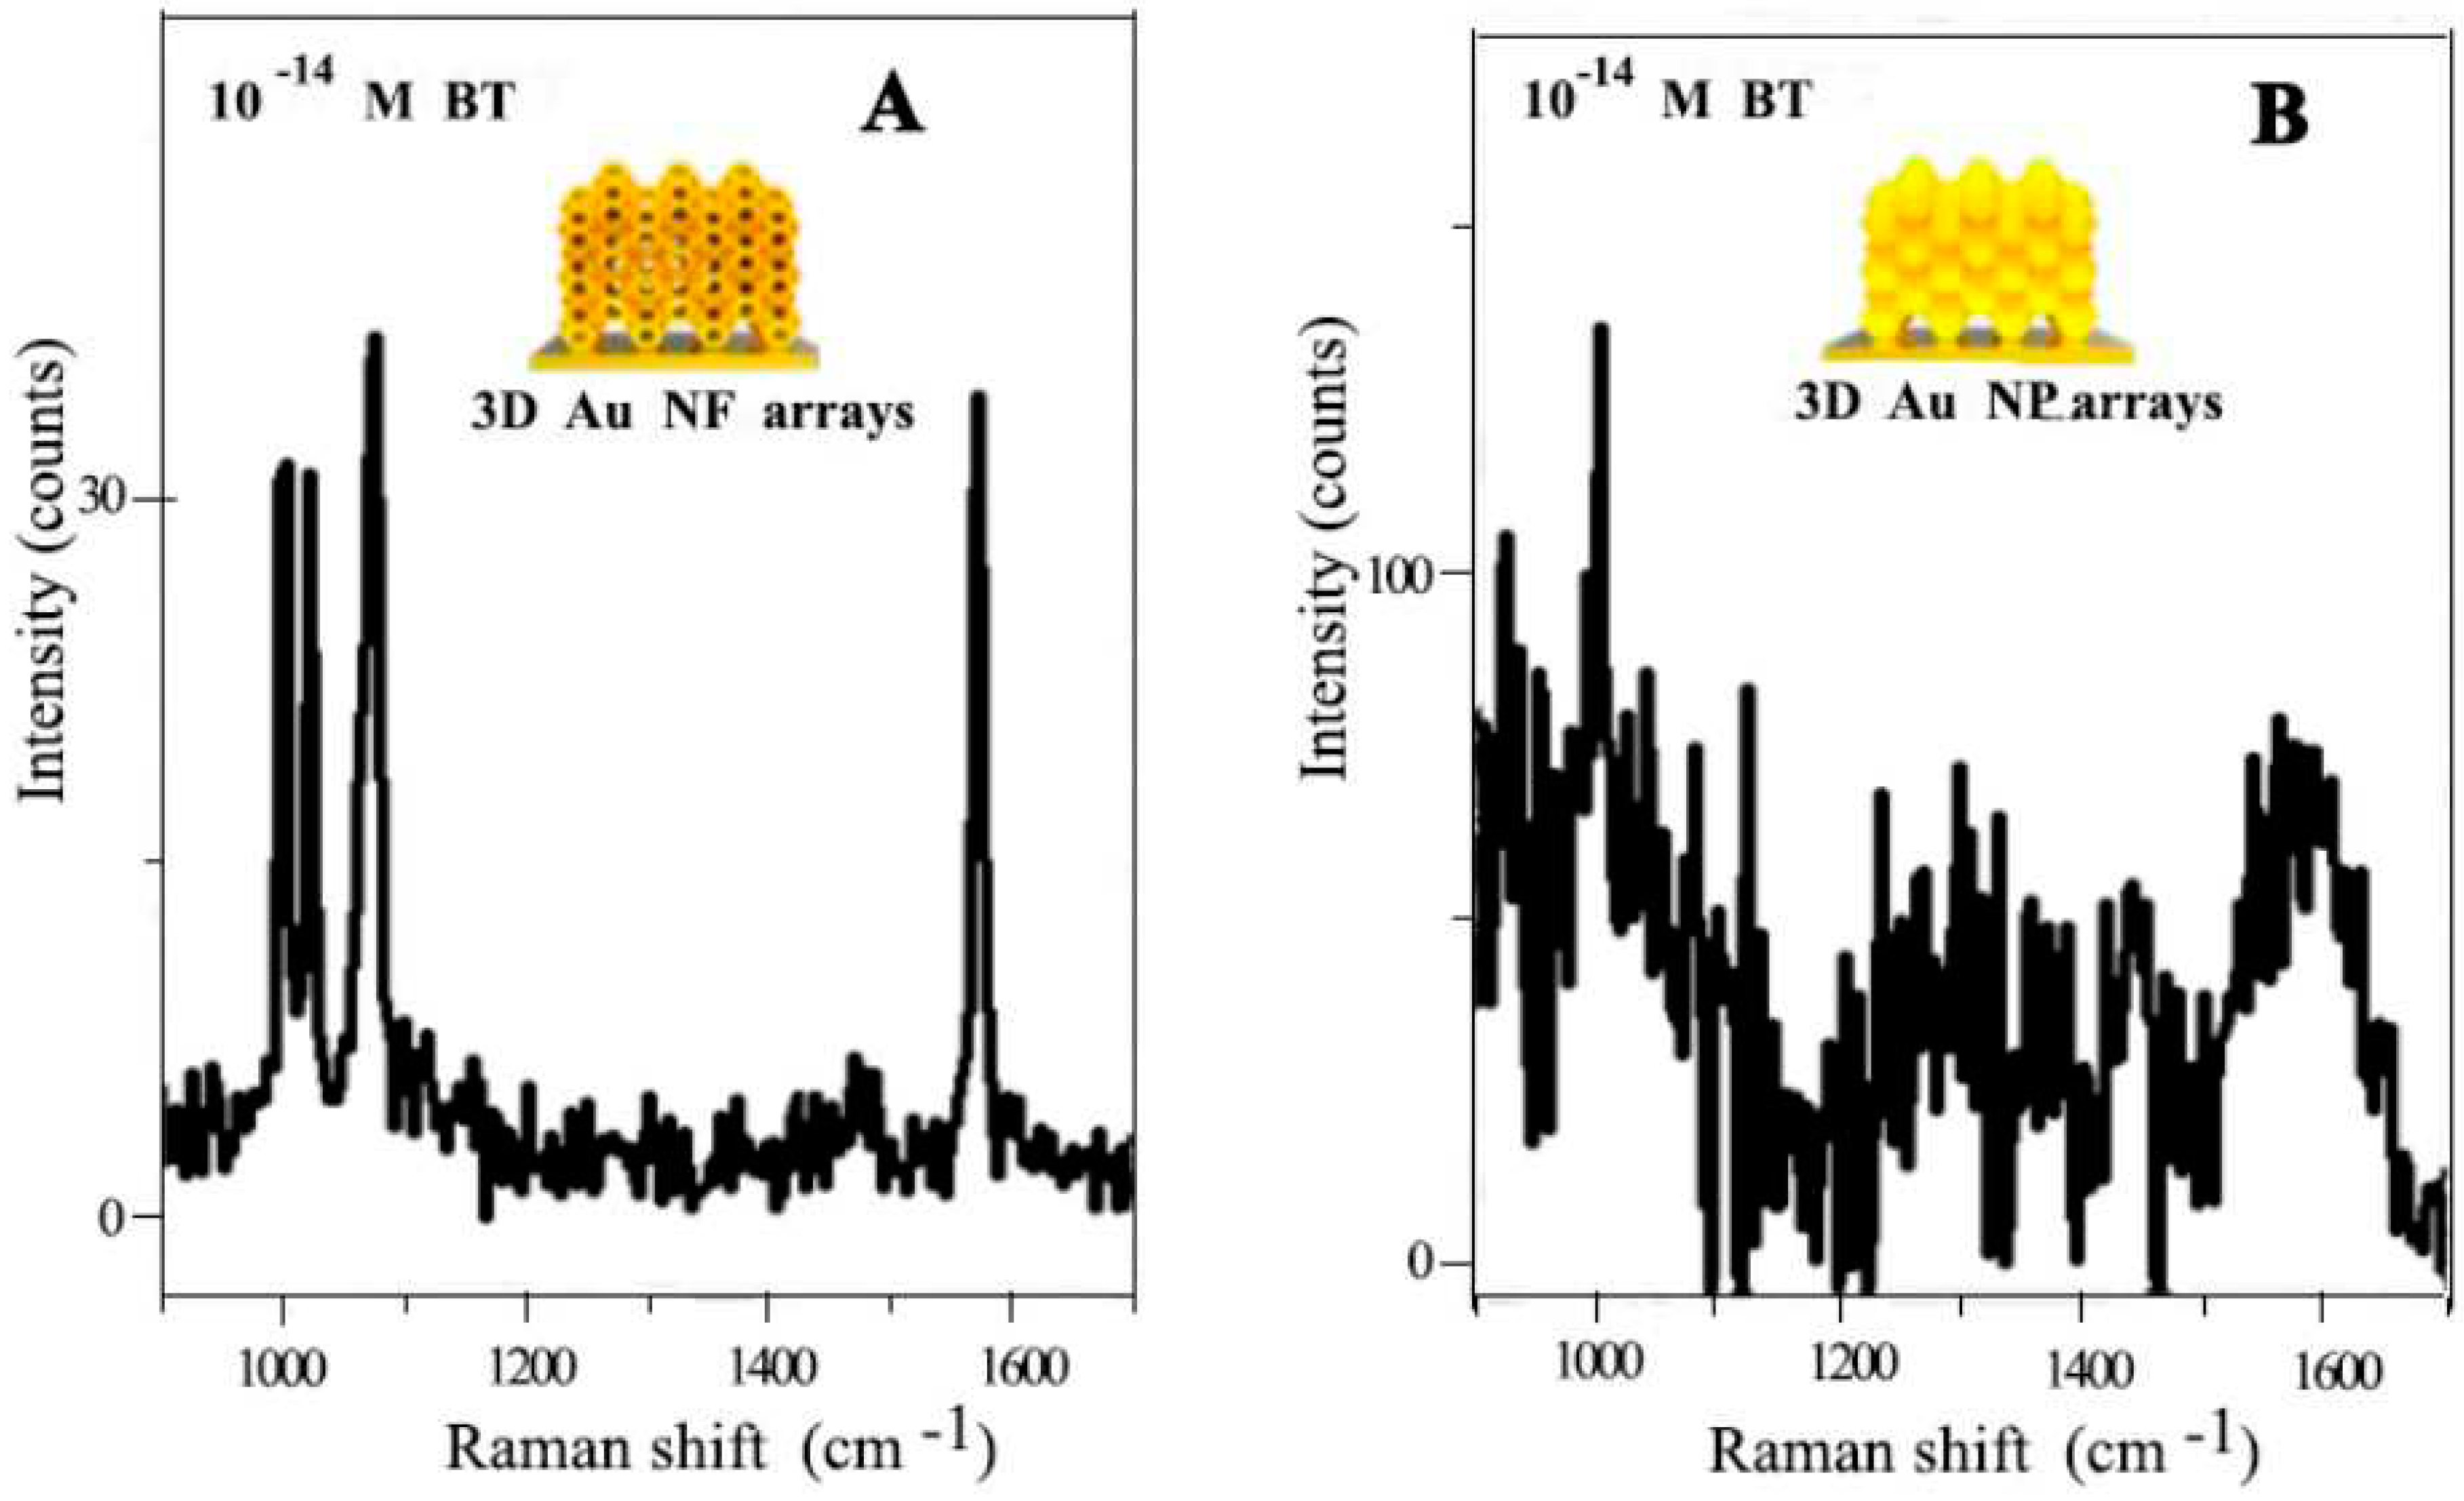
4.8. Surface-Enhanced Resonance Spectroscopy (SERS)
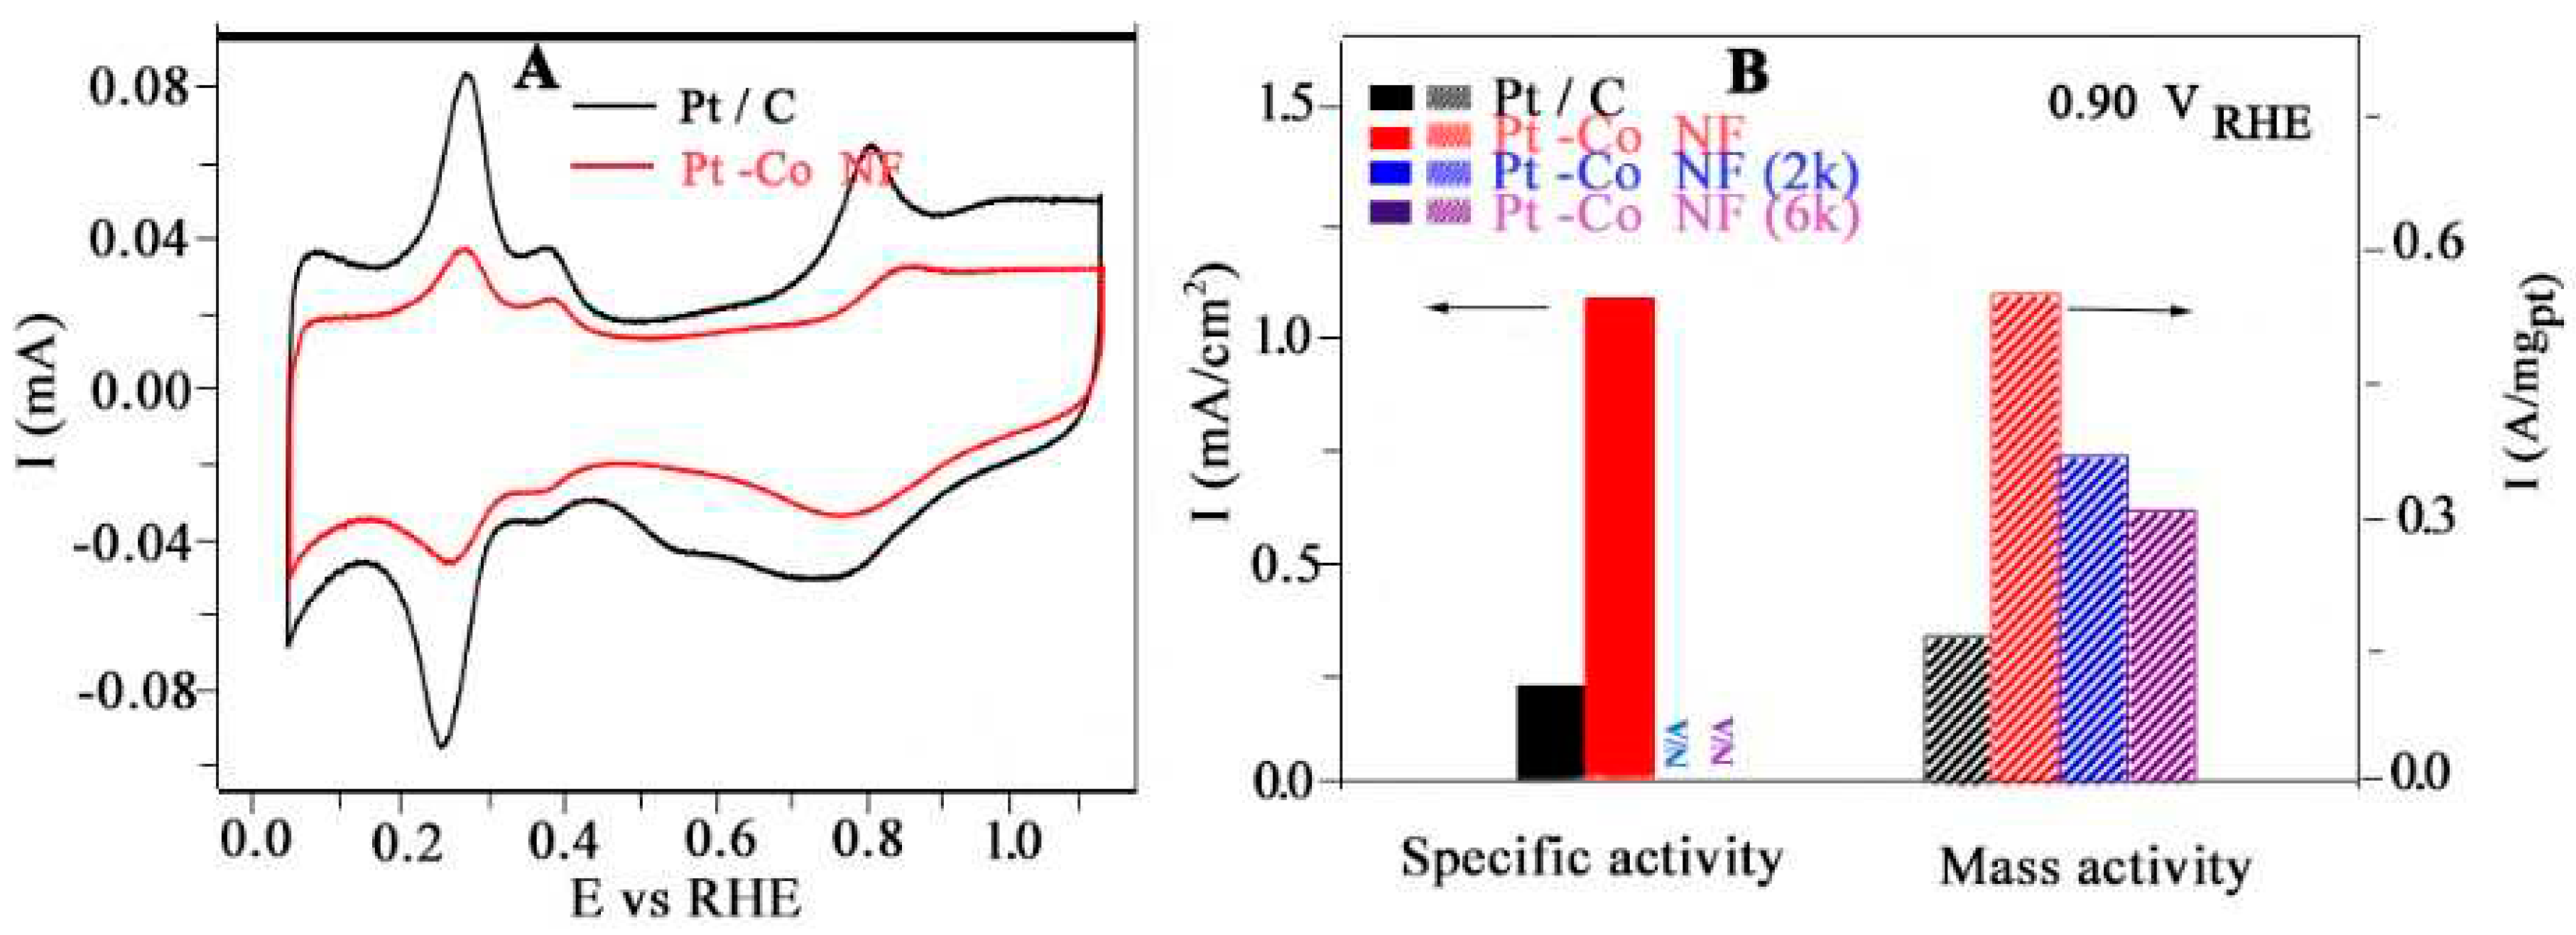
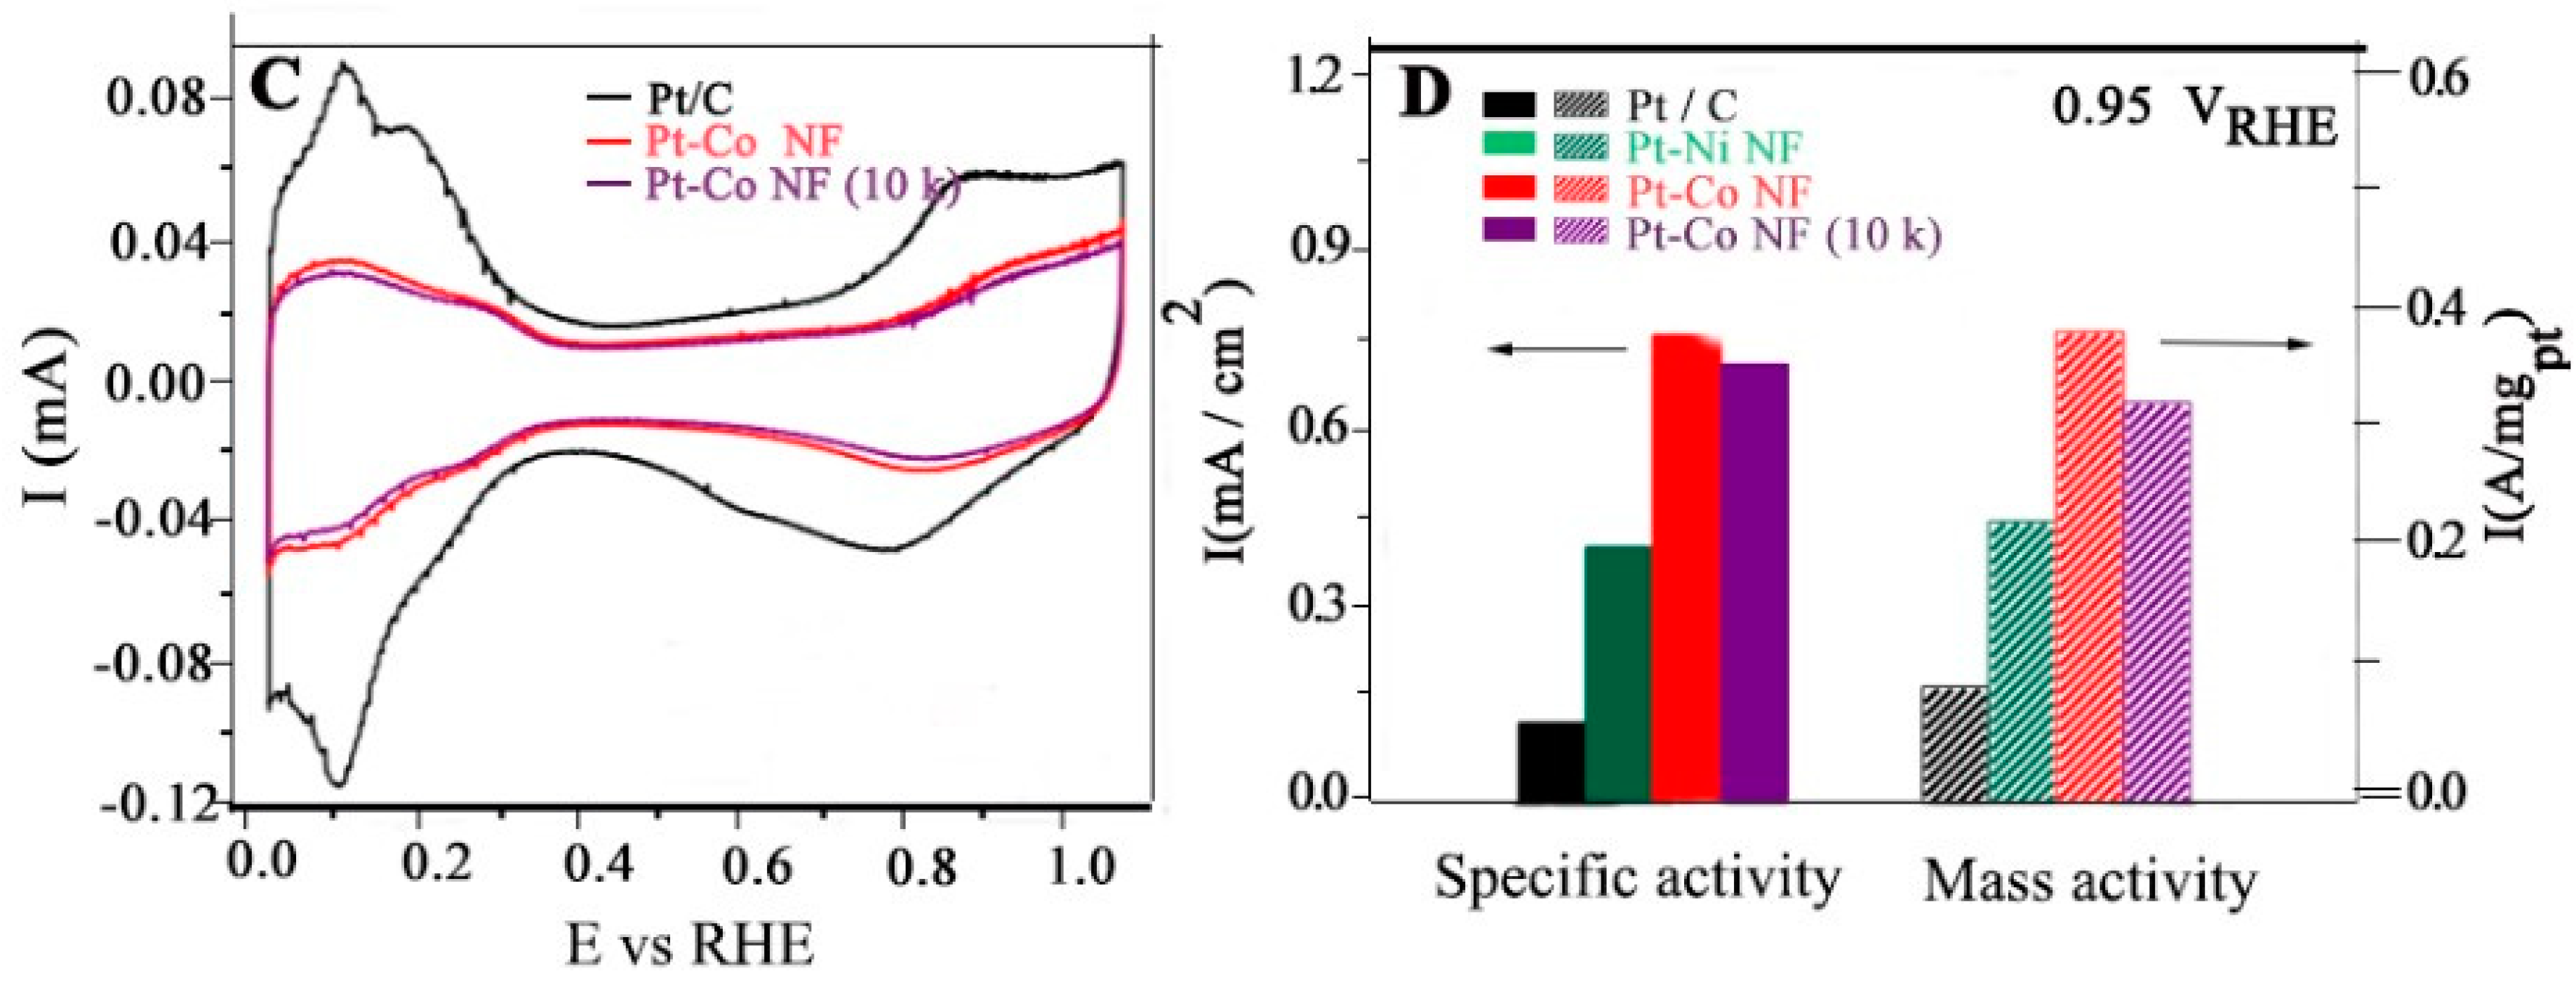
4.9. Fuel Cell Electrolysis
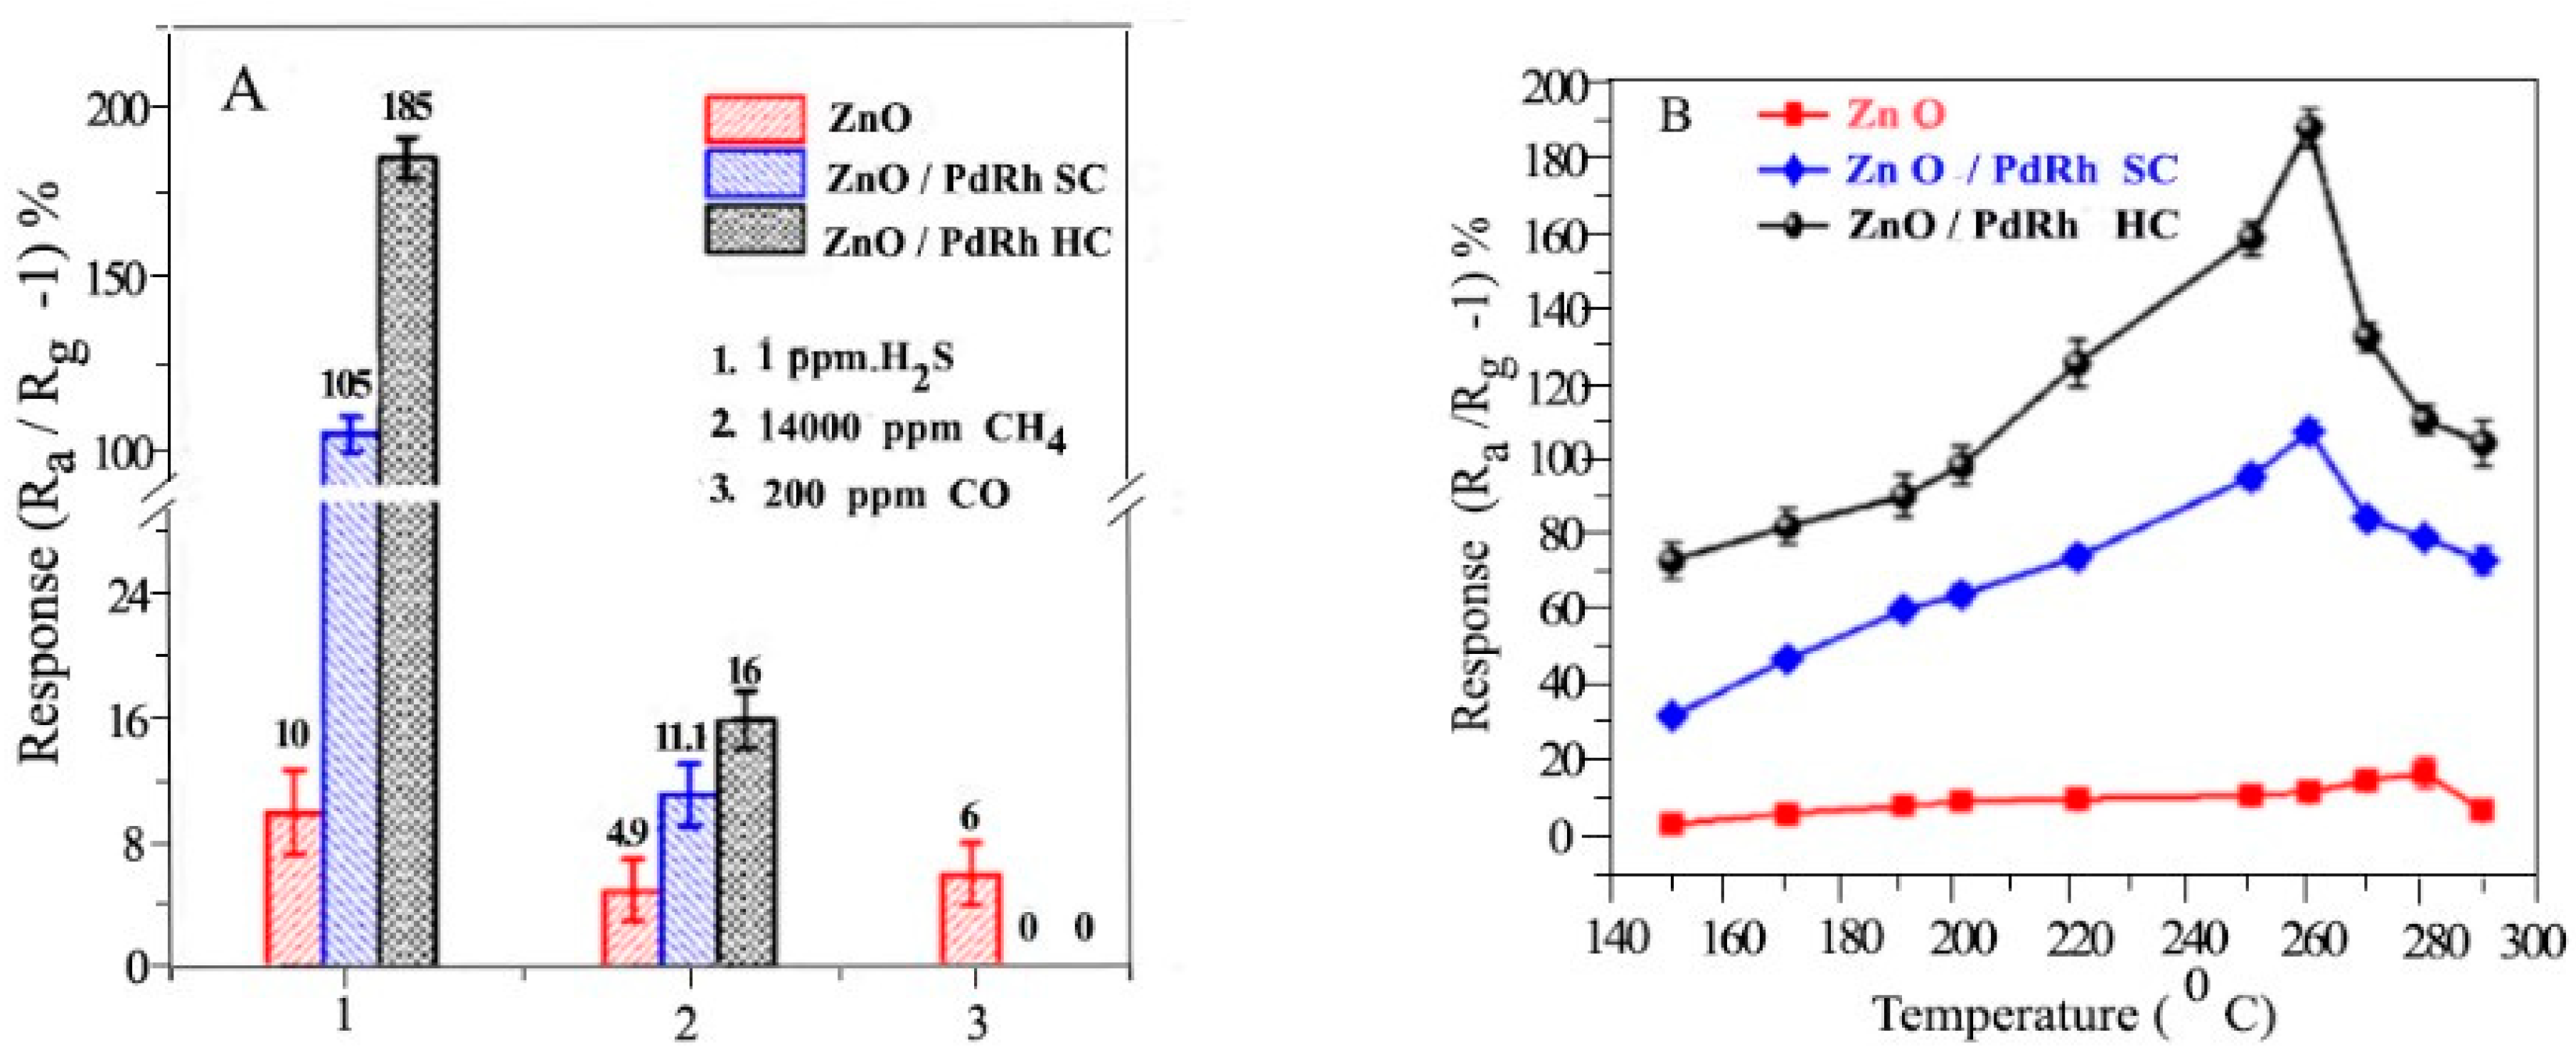
4.10. Sensing of Gaseous Molecules
4.10.1. VOCs and CWA (Chemical Warfare Agent)
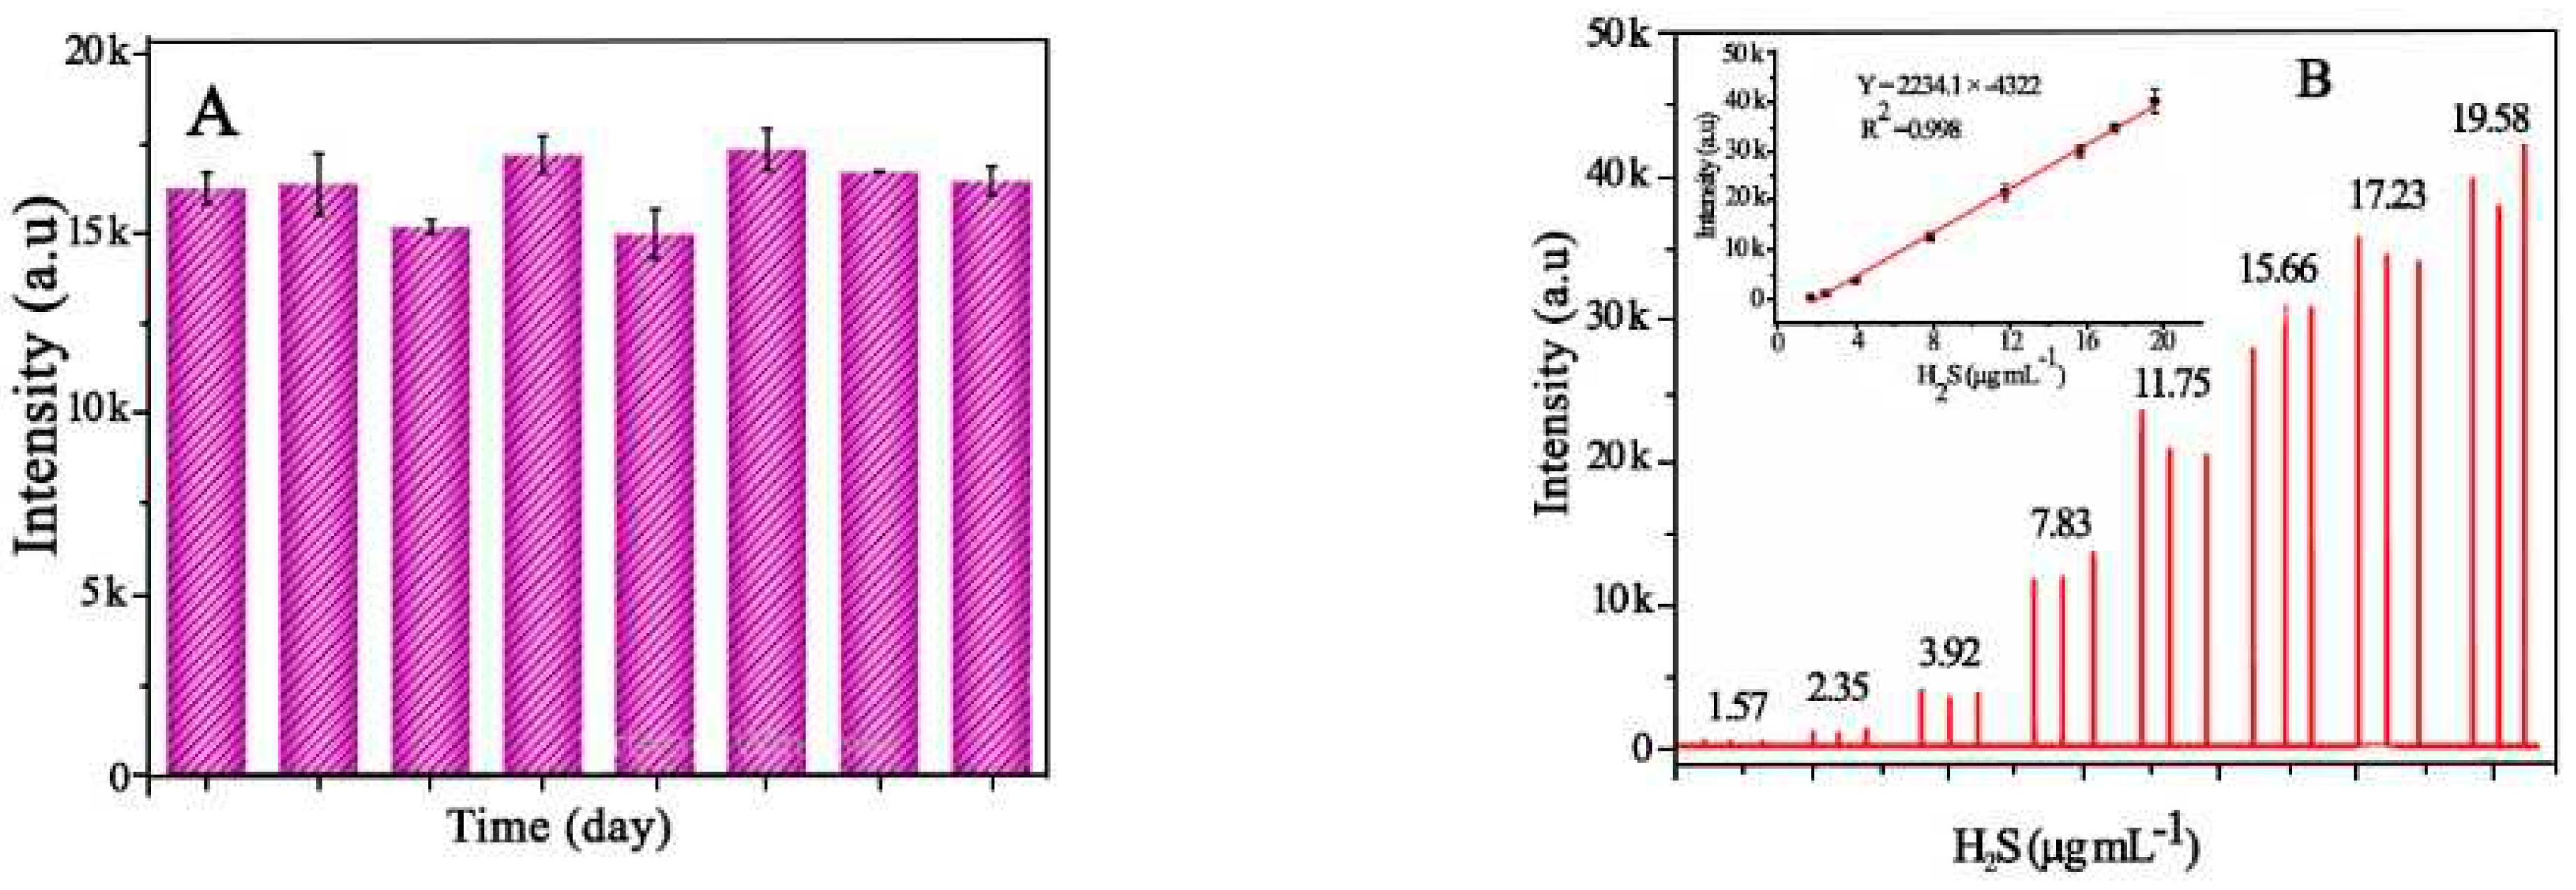
4.10.2. H2S
| Sensing materials |
Temperature (OC) |
Response/recovery time |
LOD | References | |
| Metal free | BN | 245 | 0.1/0.2 s | 0.52µgmL-1 | [124] |
| F-SiC | 298 | 0.6/1.0 | 3ppm | [125] | |
| Metal oxide | Fe2O3 | 320 | 15/120 | 3ppm | [126] |
| MnO2 | 224 | 0.3/0.4 | 0.28µgmL-1 | [127] | |
| Metal-Carbon complex | Mn3O4/g- C3N4 |
184 | 0.6/0.6 | 0.13µgml-1 | [128] |
| Fe2O3/g-C3N4 | 183 | 0.1/0.6 | 0.5µgmL-1 | [129] | |
| Metal-doped porous carbon nanomaterial | Fe doped Porous carbon |
215 | 0.1/0.6 | 0.13µGmL-1 | Present work |
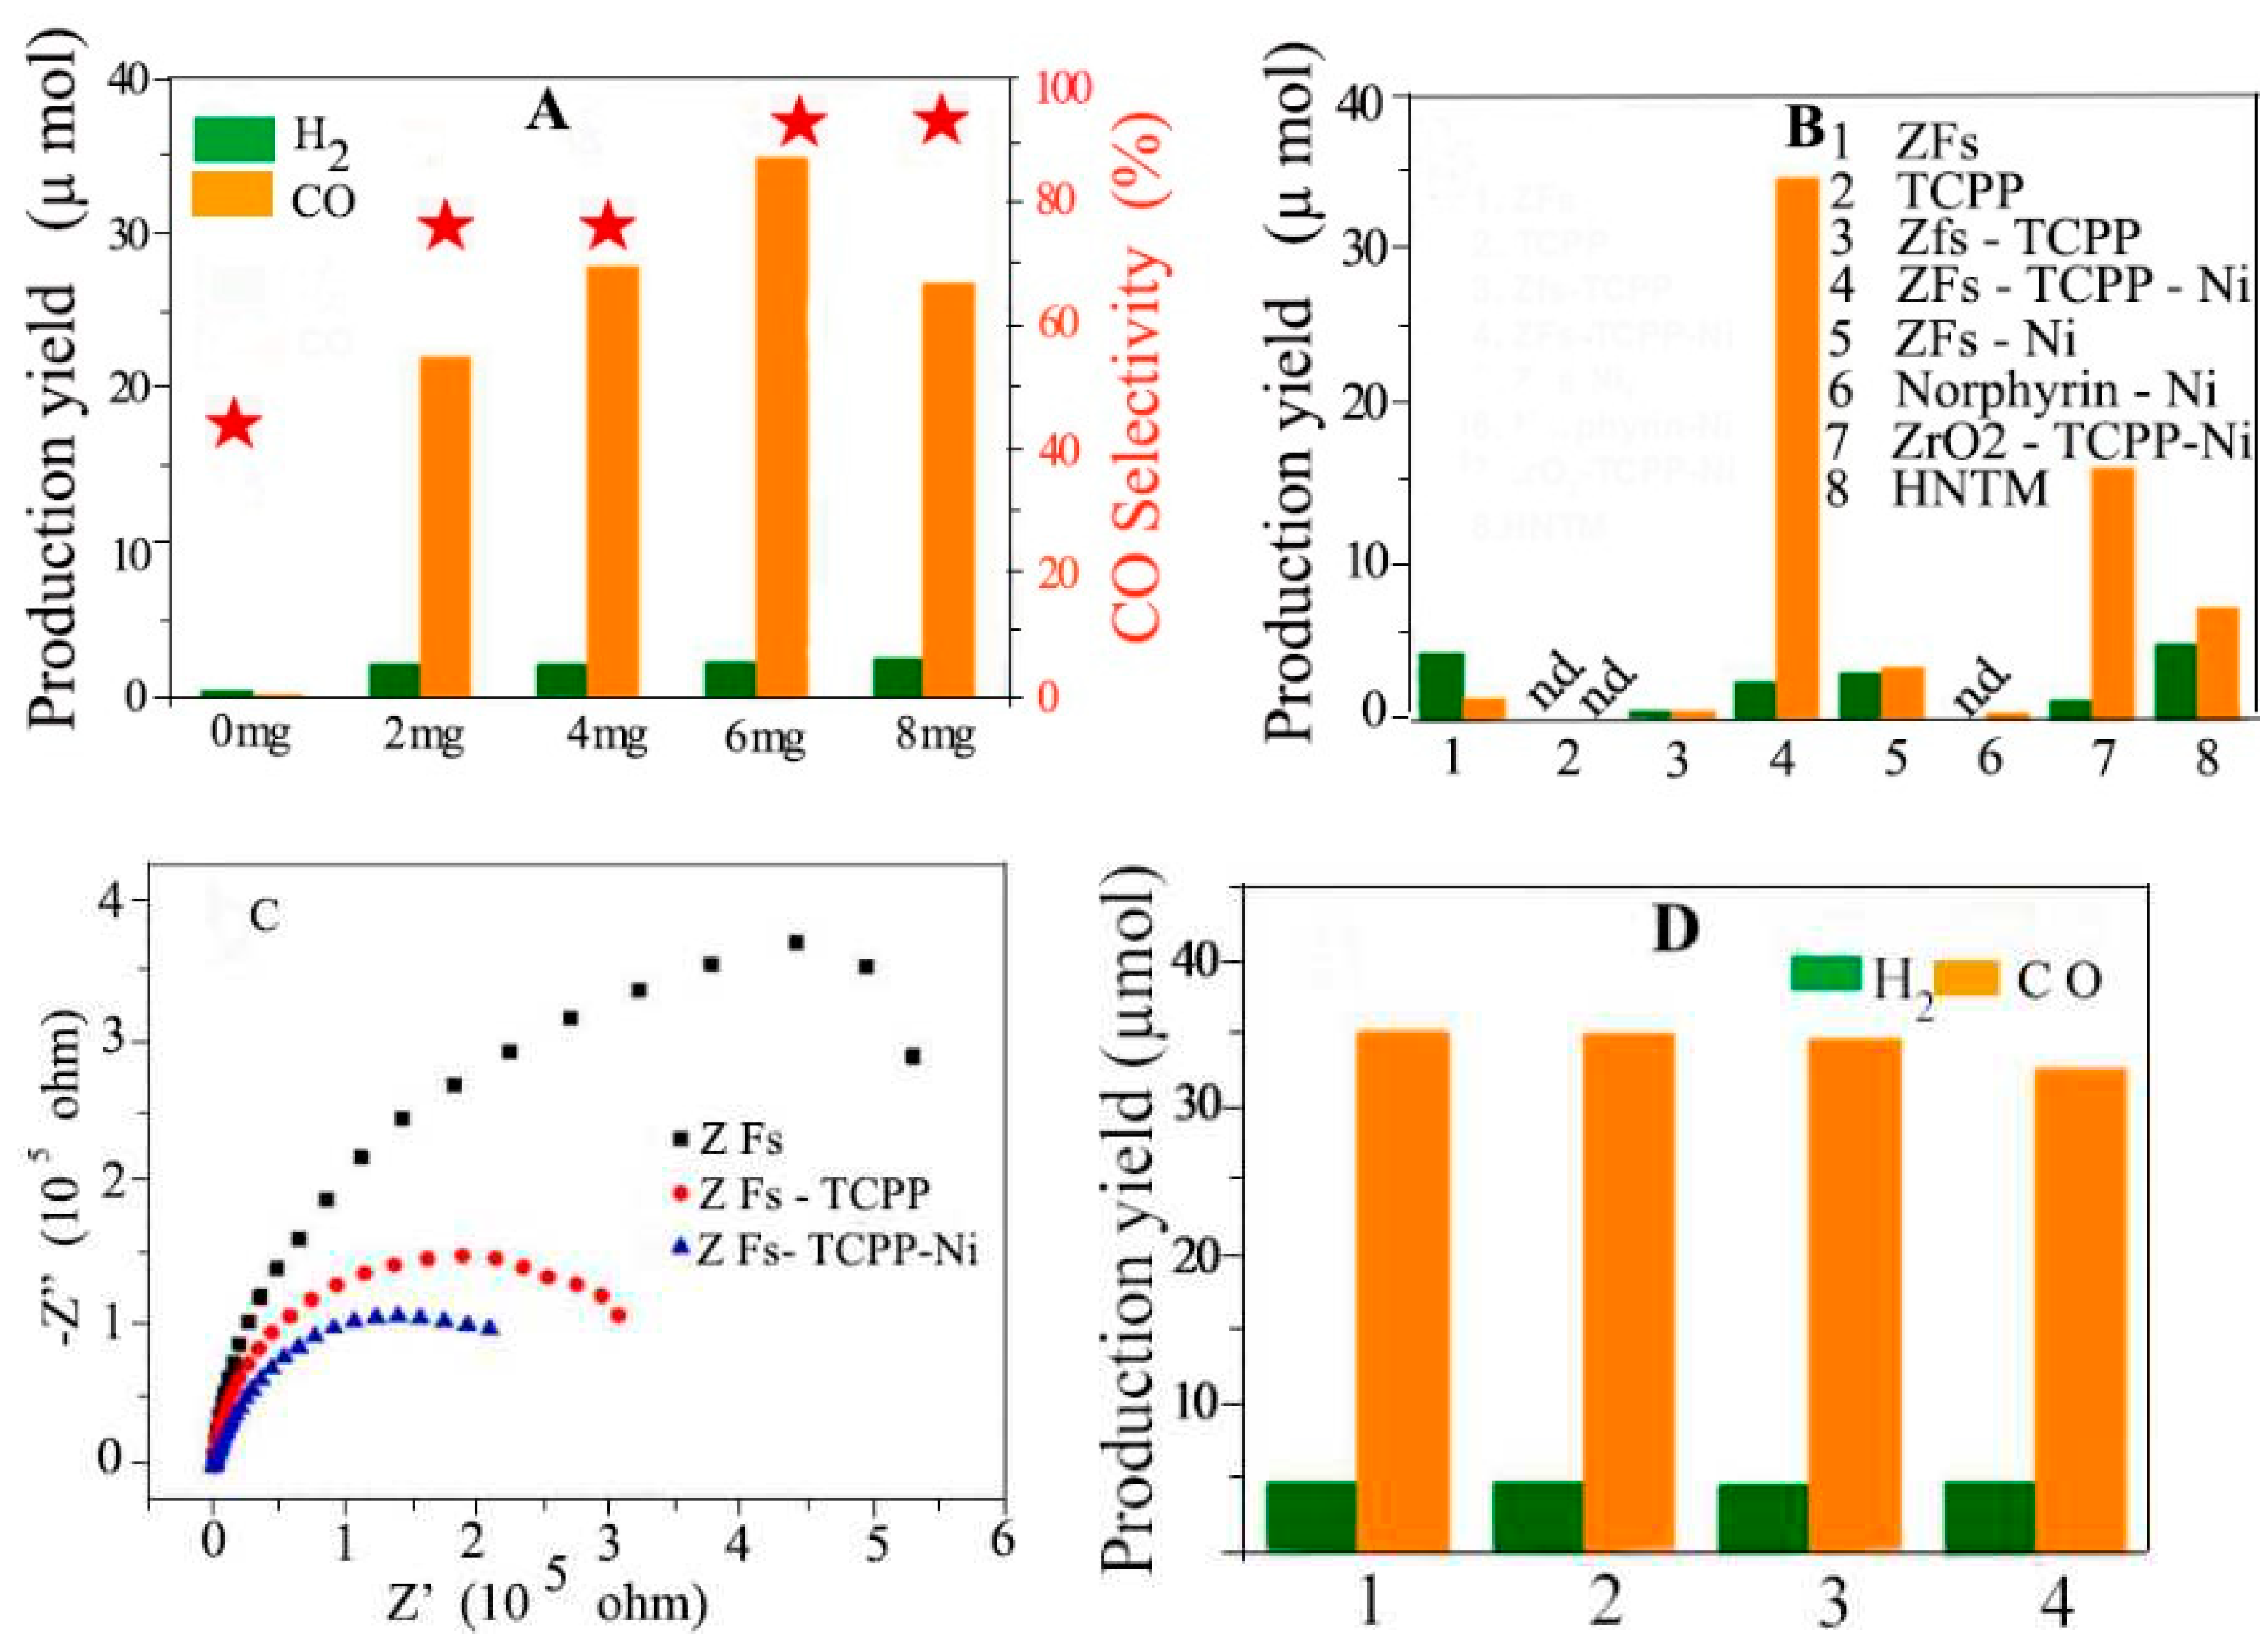
4.11. Reduction of CO2
4.11.1. Photocatalytic
4.11.2. Electro Catalytic
4.12. Hydrogen Enrichment and Molecular Sieving
4.13. Spectator of Co+2 Ions
4.14. Biomass Upgrading
|
catalyst |
Conversion % | Yield % | |||
| Heptane | Octane | octanol | others | ||
| NiZrO2-C | 54.2 | 38.7 | 6.6 | 3.2 | 5.6 |
| NiZrO2-H | 86.4 | 70.3 | 6.9 | 2.6 | 6.3 |
| NiZrO2-F | 100.0 | 86.0 | 6.0 | 2.1 | 2.1 |
|
Catalyst |
Conversion % | Yield % | |||
| Heptane | Octane | Octanol | Others | ||
| NiZrO2-C | 48.1 | 38.6 | 5.8 | 1.5 | 2.2 |
| NiZrO2-H | 80.3 | 69.5 | 7.8 | 1.3 | 1.7 |
| NiZrO2-F | 100.0 | 89.3 | 7.1 | 1.2 | 2.4 |
4.15. Antibacterial Performance
4.16. Nano Probes for Bio Sensing
4.16.1. HCG
4.16.2. Glucose in Human Tears
4.17. Hydrogen Production
4.17.1. Photothermal Catalytic
4.17.2. Solar-Driven H2 Production
5. Conclusions
6. Future Directions
- The thickness of ridges can be controlled by tunning the breadth of the metal being deposited on the template surface which in turn can be achieved by the adjustment of the relative amount of both.
- Till now production of NFs is just limited to a very small scale i-e milligrams. Attention should be given in future work to enhance their production to meet industrial demands
References
- Lee, K.Y., et al., Novel surfactant-free multi-branched gold stars characterized by inverse photocurrent. Journal of Materials Chemistry A, 2013. 1(44): p. 13890-13895. [CrossRef]
- Liu, X. and D. Astruc, From galvanic to anti-galvanic synthesis of bimetallic nanoparticles and applications in catalysis, sensing, and materials science. Advanced Materials, 2017. 29(16): p. 1605305. [CrossRef]
- Ridelman, Y., et al., Metallic nanobowls by galvanic replacement reaction on heterodimeric nanoparticles. Small, 2012. 8(5): p. 654-660. [CrossRef]
- Collins, G., E. McCarty, and J.D. Holmes, Controlling alloy formation and optical properties by galvanic replacement of sub-20 nm silver nanoparticles in organic media. CrystEngComm, 2015. 17(36): p. 6999-7005. [CrossRef]
- Yamamoto, Y., et al., Formation mechanism of plasmonic silver nanohexagonal particles made by galvanic displacement reaction. RSC advances, 2016. 6(37): p. 31454-31461. [CrossRef]
- Hangarter, C.M., et al., Nanopeapods by galvanic displacement reaction. Angewandte Chemie International Edition, 2010. 49(39): p. 7081-7085. [CrossRef]
- Parisi, J., L. Su, and Y. Lei, In situ synthesis of silver nanoparticle decorated vertical nanowalls in a microfluidic device for ultrasensitive in-channel SERS sensing. Lab on a Chip, 2013. 13(8): p. 1501-1508. [CrossRef]
- Mohl, M., et al., Formation of CuPd and CuPt bimetallic nanotubes by galvanic replacement reaction. The Journal of Physical Chemistry C, 2011. 115(19): p. 9403-9409. [CrossRef]
- Liu, J., et al., Fabrication of DNA-templated Te and Bi2Te3 nanowires by galvanic displacement. Langmuir, 2013. 29(35): p. 11176-11184. [CrossRef]
- Mohl, M., et al., Synthesis of catalytic porous metallic nanorods by galvanic exchange reaction. The Journal of Physical Chemistry C, 2010. 114(1): p. 389-393. [CrossRef]
- Tan, Y.-N., et al., Mechanistic Study on the Bis(p-sulfonatophenyl)phenylphosphine Synthesis of Monometallic Pt Hollow Nanoboxes Using Ag*−Pt Core−Shell Nanocubes as Sacrificial Templates. The Journal of Physical Chemistry C, 2007. 111(38): p. 14084-14090. [CrossRef]
- He, P., X.Y. Yu, and X.W. Lou, Carbon-incorporated nickel–cobalt mixed metal phosphide nanoboxes with enhanced electrocatalytic activity for oxygen evolution. Angewandte Chemie International Edition, 2017. 56(14): p. 3897-3900. [CrossRef]
- Wang, C., et al., Nanoboxes endow non-noble-metal-based electrocatalysts with high efficiency for overall water splitting. Journal of Materials Chemistry A, 2021. 9(2): p. 857-874. [CrossRef]
- Cheng, X., et al., Bimetallic metal-organic frameworks nanocages as multi-functional fillers for water-selective membranes. Journal of Membrane Science, 2018. 545: p. 19-28. [CrossRef]
- Xu, Y., et al., Synthesis of bimetallic NixCo1-xP hollow nanocages from metal-organic frameworks for high performance hybrid supercapacitors. Electrochimica Acta, 2018. 285: p. 192-201. [CrossRef]
- Huang, M., et al., MOF-derived bi-metal embedded N-doped carbon polyhedral nanocages with enhanced lithium storage. Journal of Materials Chemistry A, 2017. 5(1): p. 266-274. [CrossRef]
- Zhu, J., et al., Enlarge the biologic coating-induced absorbance enhancement of Au-Ag bimetallic nanoshells by tuning the metal composition. Spectrochimica Acta Part A: Molecular and Biomolecular Spectroscopy, 2018. 189: p. 571-577. [CrossRef]
- Rodrigues, T.S., et al., Probing the catalytic activity of bimetallic versus trimetallic nanoshells. Journal of Materials Science, 2015. 50(16): p. 5620-5629. [CrossRef]
- Kisukuri, C.M., et al., Bimetallic Nanoshells as Platforms for Metallo-and Biometallo-Catalytic Applications. ChemCatChem, 2016. 8(1): p. 171-179. [CrossRef]
- Godinez-Salomon, F., et al., Bimetallic two-dimensional nanoframes: high activity acidic bifunctional oxygen reduction and evolution electrocatalysts. ACS Applied Energy Materials, 2020. 3(3): p. 2404-2421. [CrossRef]
- Li, J., X. Sun, and D. Qin, Ag-Enriched Ag-Pd Bimetallic Nanoframes and Their Catalytic Properties. ChemNanoMat, 2016. 2(6): p. 494-499. [CrossRef]
- Cheng, D., et al., Simulating Synthesis of Metal Nanorods, Nanoplates, and Nanoframes by Self-Assembly of Nanoparticle Building Blocks. The Journal of Physical Chemistry C, 2009. 113(10): p. 3986-3997. [CrossRef]
- Fang, Z., et al., Rational design of metal nanoframes for catalysis and plasmonics. Small, 2015. 11(22): p. 2593-2605. [CrossRef]
- Xie, S., et al., Synthesis of Pd-Rh core–frame concave nanocubes and their conversion to Rh cubic nanoframes by selective etching of the Pd cores. Angewandte Chemie International Edition, 2012. 51(41): p. 10266-10270. [CrossRef]
- Nosheen, F., et al., One-pot fabrication of single-crystalline octahedral Pt–Cu nanoframes and their enhanced electrocatalytic activity. Nanoscale, 2013. 5(9): p. 3660-3663. [CrossRef]
- Niu, H.-J., et al., One-pot solvothermal synthesis of three-dimensional hollow PtCu alloyed dodecahedron nanoframes with excellent electrocatalytic performances for hydrogen evolution and oxygen reduction. Journal of colloid and interface science, 2019. 539: p. 525-532. [CrossRef]
- Kao, C.-R., et al., Insights into Transformation of Icosahedral PdRu Nanocrystals into Lattice-Expanded Nanoframes with Strain Enhancement in Electrochemical Redox Reactions. Chemistry of Materials, 2022. 34(5): p. 2282-2291. [CrossRef]
- Kim, J., et al., Synthesis and Single-Particle Surface-Enhanced Raman Scattering Study of Plasmonic Tripod Nanoframes with Y-Shaped Hot-Zones. Nano Letters, 2020. 20(6): p. 4362-4369. [CrossRef]
- Luo, S. and P.K. Shen, Concave Platinum–Copper Octopod Nanoframes Bounded with Multiple High-Index Facets for Efficient Electrooxidation Catalysis. ACS Nano, 2017. 11(12): p. 11946-11953. [CrossRef]
- Kwon, T., et al., Vertex-reinforced PtCuCo ternary nanoframes as efficient and stable electrocatalysts for the oxygen reduction reaction and the methanol oxidation reaction. Advanced Functional Materials, 2018. 28(13): p. 1706440. [CrossRef]
- Liu, Y., et al., Template-assisted synthesis of single-crystalline Mn3O4 nanoframes and hollow octahedra. Solid state sciences, 2012. 14(10): p. 1462-1466. [CrossRef]
- Okazaki, K.-i., et al., Fabrication of nanoframe structures by site-selective assembly of gold nanoparticles on silver cubes in an ionic liquid. Chemistry letters, 2011. 40(1): p. 84-86. [CrossRef]
- Negondeni, J. and T. Ngwenya, Synthesizing Pt-Ni/C Nanoframes electrocatalyst using the solvothermal and in-house developed method for PEM fuel cells. Suid-Afrikaans Tydskrif vir Natuurwetenskap en Tegnologie/South African Journal of Science and Technology, 2021. 40(1): p. 262-266. [CrossRef]
- Chen, X.-L., et al., Uric acid supported one-pot solvothermal fabrication of rhombic-like Pt35Cu65 hollow nanocages for highly efficient and stable electrocatalysis. Journal of colloid and interface science, 2019. 540: p. 486-494. [CrossRef]
- Snyder, J., et al., Oxygen reduction in nanoporous metal–ionic liquid composite electrocatalysts. Nature materials, 2010. 9(11): p. 904-907. [CrossRef]
- Snyder, J., et al., Structure/processing/properties relationships in nanoporous nanoparticles as applied to catalysis of the cathodic oxygen reduction reaction. Journal of the American Chemical Society, 2012. 134(20): p. 8633-8645. [CrossRef]
- Chen, C., et al., Highly crystalline multimetallic nanoframes with three-dimensional electrocatalytic surfaces. Science, 2014. 343(6177): p. 1339-1343. [CrossRef]
- Xie, S., et al., Catalysis on faceted noble-metal nanocrystals: both shape and size matter. Current Opinion in Chemical Engineering, 2013. 2(2): p. 142-150. [CrossRef]
- Yang, T.-H., et al., Noble-metal nanoframes and their catalytic applications. Chemical Reviews, 2020. 121(2): p. 796-833. [CrossRef]
- Wang, Z., et al., Synthesis of Pd nanoframes by excavating solid nanocrystals for enhanced catalytic properties. ACS nano, 2017. 11(1): p. 163-170. [CrossRef]
- Han, L., et al., Alloy Cu 3 Pt nanoframes through the structure evolution in Cu-Pt nanoparticles with a core-shell construction. Scientific reports, 2014. 4(1): p. 1-6. [CrossRef]
- Oh, A., et al., Skeletal octahedral nanoframe with cartesian coordinates via geometrically precise nanoscale phase segregation in a Pt@ Ni core–shell nanocrystal. ACS nano, 2015. 9(3): p. 2856-2867. [CrossRef]
- Yang, T.H., et al., Surface capping agents and their roles in shape-Controlled synthesis of colloidal metal nanocrystals. Angewandte Chemie International Edition, 2020. 59(36): p. 15378-15401. [CrossRef]
- Qin, Y., et al., Fine-Tuning Intrinsic Strain in Penta-Twinned Pt–Cu–Mn Nanoframes Boosts Oxygen Reduction Catalysis. Advanced Functional Materials, 2020. 30(11): p. 1910107. [CrossRef]
- Park, J., et al., Platinum cubic nanoframes with enhanced catalytic activity and durability toward oxygen reduction. ChemSusChem, 2016. 9(19): p. 2855-2861. [CrossRef]
- Zhang, L., et al., Platinum-based nanocages with subnanometer-thick walls and well-defined, controllable facets. Science, 2015. 349(6246): p. 412-416. [CrossRef]
- Lu, X., et al., Fabrication of cubic nanocages and nanoframes by dealloying Au/Ag alloy nanoboxes with an aqueous etchant based on Fe(NO3)3 or NH4OH. Nano Lett., 2007. 7(6): p. 1764. [CrossRef]
- Yoo, S., et al., Two-dimensional nanoframes with dual rims. Nature communications, 2019. 10(1): p. 1-8. [CrossRef]
- Gilroy, K.D., et al., Shape-controlled synthesis of colloidal metal nanocrystals by replicating the surface atomic structure on the seed. Advanced Materials, 2018. 30(25): p. 1706312. [CrossRef]
- Li, Z., et al., Platinum–nickel frame within metal-organic framework fabricated in situ for hydrogen enrichment and molecular sieving. Nature communications, 2015. 6(1): p. 1-8. [CrossRef]
- Pei, J., et al., Ir–Cu nanoframes: one-pot synthesis and efficient electrocatalysts for oxygen evolution reaction. Chemical communications, 2016. 52(19): p. 3793-3796. [CrossRef]
- Kull, S., et al., Synthesis of Single-Crystalline Lead Sulfide Nanoframes and Nanorings. Chemistry of Materials, 2019. 31(15): p. 5646-5654. [CrossRef]
- Gruzeł, G., et al., Conversion of bimetallic PtNi 3 nanopolyhedra to ternary PtNiSn nanoframes by galvanic replacement reaction. Nanoscale, 2019. 11(12): p. 5355-5364. [CrossRef]
- Yang, L., et al., Construction of light-harvesting system for enhanced catalytic performance of Pd nanoframes toward Suzuki coupling reaction. Journal of Materials Chemistry A, 2017. 5(21): p. 10150-10153. [CrossRef]
- Ye, H., et al., Ru nanoframes with an fcc structure and enhanced catalytic properties. Nano letters, 2016. 16(4): p. 2812-2817. [CrossRef]
- Ahn, J. and D. Qin, Fabrication of Nanoscale Cage Cubes by Drilling Orthogonal, Intersected Holes through All Six Side Faces of Ag Nanocubes. Chemistry of Materials, 2019. 31(21): p. 9179-9187. [CrossRef]
- Hajfathalian, M., et al., A Wulff in a cage: the confinement of substrate-based structures in plasmonic nanoshells, nanocages, and nanoframes using galvanic replacement. ACS nano, 2016. 10(6): p. 6354-6362. [CrossRef]
- Liu, W., et al., Self-Assembly of Heterogeneously Shaped Nanoparticles into Plasmonic Metamolecules on DNA Origami. Chemistry–A European Journal, 2017. 23(57): p. 14177-14181. [CrossRef]
- Godínez-Salomón, F., et al., Metallic Two-Dimensional Nanoframes: Unsupported Hierarchical Nickel–Platinum Alloy Nanoarchitectures with Enhanced Electrochemical Oxygen Reduction Activity and Stability. ACS applied materials & interfaces, 2017. 9(22): p. 18660-18674. [CrossRef]
- Godínez-Salomón, F., et al., Self-Supported Hydrous Iridium–Nickel Oxide Two-Dimensional Nanoframes for High Activity Oxygen Evolution Electrocatalysts. ACS Catalysis, 2018. 8(11): p. 10498-10520. [CrossRef]
- Zhao, M., et al., Ruthenium nanoframes in the face-centered cubic phase: facile synthesis and their enhanced catalytic performance. ACS nano, 2019. 13(6): p. 7241-7251. [CrossRef]
- Wang, Y., et al., Composition-Dependent Oxygen Reduction Reaction Activity of Pt-Surfaced PtNi Dodecahedral Nanoframes. ACS Applied Energy Materials, 2020. 3(1): p. 768-776. [CrossRef]
- Bai, X., et al., Tunable Hollow Pt@Ru Dodecahedra via Galvanic Replacement for Efficient Methanol Oxidation. ACS Applied Materials & Interfaces, 2020. 12(20): p. 23046-23050. [CrossRef]
- Nosheen, F., et al., Noble metal based alloy nanoframes: syntheses and applications in fuel cells. Frontiers in Chemistry, 2019. 7: p. 456. [CrossRef]
- EdEdgar González, 2* Jordi Arbiol,3,4 Víctor F. Puntes1,2,4,5†gar González,1,2* Jordi Arbiol,3,4 Víctor F. Puntes1,2,4,5†, Carving at the Nanoscale: Sequential Galvanic Exchange and Kirkendal Growth at Room Temperature. science, 2011. 334: p. 1377. [CrossRef]
- Shi, H., et al., Photocatalytic template synthesis of Pt nanocages with enhanced electrocatalytic performance. ECS Electrochemistry Letters, 2015. 4(8): p. 38. [CrossRef]
- Zhang, X.-F., et al., Solvothermal synthesis of monodisperse PtCu dodecahedral nanoframes with enhanced catalytic activity and durability for hydrogen evolution reaction. ACS Applied Energy Materials, 2018. 1(9): p. 5054-5061. [CrossRef]
- Huang, X.-Y., et al., L-proline assisted solvothermal preparation of Cu-rich rhombic dodecahedral PtCu nanoframes as advanced electrocatalysts for oxygen reduction and hydrogen evolution reactions. Electrochimica Acta, 2019. 299: p. 89-97. [CrossRef]
- Luo, S., et al., Atomic-Scale Preparation of Octopod Nanoframes with High-Index Facets as Highly Active and Stable Catalysts. Advanced Materials, 2017. 29(8). [CrossRef]
- Li, Y., et al., Ag Nanoframes Deposited on Au Films Generate Optical Cavities for Surface-Enhanced Raman Scattering. ACS Applied Nano Materials, 2020. 3(6): p. 5116-5122. [CrossRef]
- Godínez-Salomón, F., et al., Metallic Two-Dimensional Nanoframes: Unsupported Hierarchical Nickel–Platinum Alloy Nanoarchitectures with Enhanced Electrochemical Oxygen Reduction Activity and Stability. ACS Applied Materials & Interfaces, 2017. 9(22): p. 18660-18674. [CrossRef]
- Kao, C.-R., et al., Insights into Transformation of Icosahedral PdRu Nanocrystals into Lattice-Expanded Nanoframes with Strain Enhancement in Electrochemical Redox Reactions. Chemistry of Materials, 2022. [CrossRef]
- Ye, H., et al., Ru Nanoframes with an fcc Structure and Enhanced Catalytic Properties. Nano Lett., 2016. 16: p. 2812. [CrossRef]
- Zhang, L., et al., Low Interface Energies Tune the Electrochemical Reversibility of Tin Oxide Composite Nanoframes as Lithium-Ion Battery Anodes. ACS Applied Materials & Interfaces, 2018. 10(43): p. 36892-36901. [CrossRef]
- Zhang, Y., et al., Mesoporous Silica-Coated Silver Nanoframes as Drug-Delivery Vehicles for Chemo/Starvation/Metal Ion Multimodality Therapy. Langmuir, 2020. 36(23): p. 6345-6351. [CrossRef]
- Huang, C., et al., Copper Isolated Sites on N-Doped Carbon Nanoframes for Efficient Oxygen Reduction. ACS Sustainable Chemistry & Engineering, 2020. 8(37): p. 14030-14038. [CrossRef]
- Wang, Z., et al., The controllable growth of PtCuRh rhombic dodecahedral nanoframes as efficient catalysts for alcohol electrochemical oxidation. Journal of Materials Chemistry A, 2019. 7(31): p. 18619-18625. [CrossRef]
- Ji, L., et al., CoP Nanoframes as Bifunctional Electrocatalysts for Efficient Overall Water Splitting. ACS Catalysis, 2020. 10(1): p. 412-419. [CrossRef]
- Lian, Y., et al., Carved nanoframes of cobalt–iron bimetal phosphide as a bifunctional electrocatalyst for efficient overall water splitting. Chemical science, 2019. 10(2): p. 464-474. [CrossRef]
- Ji, L., et al., Heterointerface Engineering of Ni2P–Co2P Nanoframes for Efficient Water Splitting. Chemistry of Materials, 2021. 33(23): p. 9165-9173. [CrossRef]
- Wang, A.J., et al., Bimetallic Alloyed PtCu Nanocubic Frames with Three-Dimensional Molecular Accessible Surfaces for Boosting Oxygen Reduction and Glycerol Oxidation Reactions. ChemCatChem, 2018. 10(15): p. 3319-3326. [CrossRef]
- Chen, M., et al., Platinum nanoworms self-assemble on β-cyclodextrin polymer inclusion complexes functionalized reduced graphene oxide as enhanced catalyst for direct methanol fuel cells. Journal of Power Sources, 2014. 265: p. 110-117. [CrossRef]
- Wang, L., et al., Near-IR-Absorbing Gold Nanoframes with Enhanced Physiological Stability and Improved Biocompatibility for In Vivo Biomedical Applications. ACS Applied Materials & Interfaces, 2017. 9(4): p. 3873-3884. [CrossRef]
- Liu, S., et al., NIR II Light-Response Au Nanoframes: Amplification of a Pressure-and Temperature-Sensing Strategy for Portable Detection and Photothermal Therapy of Cancer Cells. Analytical Chemistry, 2021. 93(42): p. 14307-14316. [CrossRef]
- Hashemi, P., et al., Well-orientation strategy for direct immobilization of antibodies: development of the immunosensor using the boronic acid-modified magnetic graphene nanoribbons for ultrasensitive detection of lymphoma cancer cells. Analytical Chemistry, 2020. 92(16): p. 11405-11412. [CrossRef]
- Tang, Y.-H., et al., Mannosyl electrochemical impedance cytosensor for label-free MDA-MB-231 cancer cell detection. Biosensors and Bioelectronics, 2018. 116: p. 100-107. [CrossRef]
- Baird, Z., et al., Tumor cell detection by mass spectrometry using signal ion emission reactive release amplification. Analytical chemistry, 2016. 88(14): p. 6971-6975. [CrossRef]
- Zhang, X., et al., Gold nanoparticles labeling with hybridization chain reaction amplification strategy for the sensitive detection of HepG2 cells by inductively coupled plasma mass spectrometry. Biosensors and Bioelectronics, 2016. 86: p. 736-740. [CrossRef]
- Yu, T., et al., Highly sensitive colorimetric cancer cell detection based on dual signal amplification. ACS applied materials & interfaces, 2016. 8(7): p. 4434-4441. [CrossRef]
- Shan, B., et al., Near-Infrared II Plasmonic Au@ Au–Ag Dot-in-Cubic Nanoframes for In Vivo Surface-Enhanced Raman Spectroscopic Detection and Photoacoustic Imaging. Advanced Functional Materials, 2021. 31(29): p. 2103186. [CrossRef]
- Zhai, J., et al., Concave octahedral PtCu nanoframes mediated synergetic photothermal and chemodynamic tumor therapy. Chemical Engineering Journal, 2022. 442: p. 136172. [CrossRef]
- Ramanathan, S., et al., Theranostic applications of nanoparticles in neurodegenerative disorders. International journal of nanomedicine, 2018. 13: p. 5561. [CrossRef]
- Karampelas, I.H., et al., Plasmonic Nanoframes for Photothermal Energy Conversion. The Journal of Physical Chemistry C, 2016. 120(13): p. 7256-7264. [CrossRef]
- Vu, X.H., et al., Tunable LSPR of silver/gold bimetallic nanoframes and their SERS activity for methyl red detection. RSC Advances, 2021. 11(24): p. 14596-14606. [CrossRef]
- Yan, Y., et al., Concave octopus-like PtCu nanoframe mediated photo-electro Fenton catalysis for fast organic dyestuff elimination. Nanoscale Advances, 2022. 4(13): p. 2782-2786. [CrossRef]
- Su, T.-y., et al., ZIF-derived metal/N-doped porous carbon nanocomposites: efficient catalysts for organic transformations. Catalysis Science & Technology, 2022. [CrossRef]
- Ganjali, F., et al., Functionalized hybrid magnetic catalytic systems on micro-and nanoscale utilized in organic synthesis and degradation of dyes. Nanoscale Advances, 2022. [CrossRef]
- Hou, X., et al., Synthesis and characterizations of spinel MnFe2O4 nanorod by seed–hydrothermal route. Journal of Alloys and Compounds, 2010. 491(1-2): p. 258-263. [CrossRef]
- Chen, C.-H., Y.-H. Liang, and W.-D. Zhang, ZnFe2O4/MWCNTs composite with enhanced photocatalytic activity under visible-light irradiation. Journal of Alloys and Compounds, 2010. 501(1): p. 168-172. [CrossRef]
- Dom, R., et al., Synthesis of solar active nanocrystalline ferrite, MFe2O4 (M: Ca, Zn, Mg) photocatalyst by microwave irradiation. Solid State Communications, 2011. 151(6): p. 470-473. [CrossRef]
- Valero-Luna, C., S. Palomares-Sanchéz, and F. Ruíz, Catalytic activity of the barium hexaferrite with H2O2/visible light irradiation for degradation of Methylene Blue. Catalysis Today, 2016. 266: p. 110-119. [CrossRef]
- Du, Y., et al., Trace Amounts of Co3O4 Nano-Particles Modified TiO2 Nanorod Arrays for Boosted Photoelectrocatalytic Removal of Organic Pollutants in Water. Nanomaterials, 2021. 11(1): p. 214. [CrossRef]
- a, Y.K., et al., Stepwise synthesis of polyhedral AuAgPd nanoframes plasmon-enhanced catalytic reduction of 4-nitrophenol material letters, 2022. 325: p. 132808. [CrossRef]
- a, Y.K., et al., Polyvinyl Alcohol/Silver nanoparticles film prepared via pulsed laser ablation: An eco-friendly nano-catalyst for 4-nitrophenol degradation. Journal of Molecular Structure, 2020. 1212: p. 128125. [CrossRef]
- Zhao, X., et al., Bimetallic PdAu Nanoframes for Electrochemical H2O2 Production in Acids. ACS Materials Letters, 2021. 3(7): p. 996-1002. [CrossRef]
- Bai, J., et al., ZnO/CoO and ZnCo2O4 Hierarchical Bipyramid Nanoframes: Morphology Control, Formation Mechanism, and Their Lithium Storage Properties. ACS Applied Materials & Interfaces, 2015. 7(41): p. 22848-22857. [CrossRef]
- Fang, Y., et al., Synthesis of CuS@ CoS2 double-shelled nanoboxes with enhanced sodium storage properties. Angewandte Chemie, 2019. 131(23): p. 7821-7825. [CrossRef]
- Fang, Y., et al., Synthesis of copper-substituted CoS2@ CuxS double-shelled nanoboxes by sequential ion exchange for efficient sodium storage. Angewandte Chemie International Edition, 2020. 59(7): p. 2644-2648. [CrossRef]
- Zhang, L., et al., Synthesizing Cu-doped CoSe2 nanoframe cubics for Na-ion batteries electrodes. Colloids and Surfaces A: Physicochemical and Engineering Aspects, 2021. 628: p. 127379. [CrossRef]
- Chen, L., et al., Interlayer design based on carbon materials for lithium–sulfur batteries: a review. Journal of Materials Chemistry A, 2020. 8(21): p. 10709-10735. [CrossRef]
- Cui, J., et al., Layered double hydroxides and their derivatives for lithium–sulfur batteries. Journal of Materials Chemistry A, 2020. 8(45): p. 23738-23755. [CrossRef]
- Wang, R., et al., ZIF-Derived Carbon Nanoframes as a Polysulfide Anchor and Conversion Mediator for High-Performance Lithium–Sulfur Cells. ACS Applied Materials & Interfaces, 2021. 13(18): p. 21544-21555. [CrossRef]
- Ahmed, F., et al., Porous nanoframes of sulfurized NiAl layered double hydroxides and ternary bismuth cerium sulfide for supercapacitor electrodes. Advanced Composites and Hybrid Materials, 2022: p. 1-15. [CrossRef]
- Shinde, N.M., et al., Polycrystalline and mesoporous 3-D Bi2O3 nanostructured negatrodes for high-energy and power-asymmetric supercapacitors: superfast room-temperature direct wet chemical growth. ACS applied materials & interfaces, 2018. 10(13): p. 11037-11047. [CrossRef]
- Kim, S.J., et al., Freestanding binder-free electrodes with nanodisk-needle-like MnCuCo-LTH and Mn1Fe2S2 porous microthorns for high-performance quasi-solid-state supercapacitors. ACS Applied Materials & Interfaces, 2022. 14(10): p. 12523-12537. [CrossRef]
- Fu, F., et al., Lamellar hierarchical lignin-derived porous carbon activating the capacitive property of polyaniline for high-performance supercapacitors. Journal of Colloid and Interface Science, 2022. 617: p. 694-703. [CrossRef]
- Yan, M., et al., Construction of a hierarchical NiCo2S4@ PPy core–shell heterostructure nanotube array on Ni foam for a high-performance asymmetric supercapacitor. ACS applied materials & interfaces, 2016. 8(37): p. 24525-24535. [CrossRef]
- Zhang, L., et al., Gold Nanoframes by Nonepitaxial Growth of Au on AgI Nanocrystals for Surface-Enhanced Raman Spectroscopy. Nano Letters, 2015. 15(7): p. 4448-4454. [CrossRef]
- Go, S., et al., Ring-in-a-Triangle Nanoframes: Integrating with Intra- and Interhotspots for Highly Amplified Near-Field Focusing. Nano Letters, 2022. 22(4): p. 1734-1740. [CrossRef]
- Chen, S., et al., High-Performance Pt–Co Nanoframes for Fuel-Cell Electrocatalysis. Nano Letters, 2020. 20(3): p. 1974-1979. [CrossRef]
- Kim, D., et al., Quantitative Surface-Enhanced Raman Spectroscopy Analysis through 3D Superlattice Arrays of Au Nanoframes with Attomolar Detection. Analytical Chemistry, 2020. 92(2): p. 1972-1977. [CrossRef]
- Luo, N., et al., High-Sensitive MEMS Hydrogen Sulfide Sensor made from PdRh Bimetal Hollow Nanoframe Decorated Metal Oxides and Sensitization Mechanism Study. ACS Applied Materials & Interfaces, 2020. 12(50): p. 56203-56215. [CrossRef]
- Zhou, Q., S. Yan, and L. Zhang, Fe-doped MOF-derived N-rich porous carbon nanoframe for H2S cataluminescence sensing. Luminescence, 2022. [CrossRef]
- Bian, Y., et al., Porous boron nitride: a novel metal-free cataluminescence material for high performance H2S sensing. Sensors and Actuators B: Chemical, 2021. 332: p. 129512. [CrossRef]
- Wu, L., et al., Metal-free cataluminescence gas sensor for hydrogen sulfide based on its catalytic oxidation on silicon carbide nanocages. Analytical chemistry, 2017. 89(24): p. 13666-13672. [CrossRef]
- Zhang, Z., et al., A highly selective chemiluminescent H2S sensor. Sensors and Actuators B: Chemical, 2004. 102(1): p. 155-161. [CrossRef]
- Pu, S., et al., Recent advances in chemiluminescence and cataluminescence for the detection of volatile sulfur compounds. Applied Spectroscopy Reviews, 2021: p. 1-27. [CrossRef]
- Hu, Y., et al., Dielectric barrier discharge plasma-assisted fabrication of g-C3N4-Mn3O4 composite for high-performance cataluminescence H2S gas sensor. Sensors and Actuators B: Chemical, 2017. 239: p. 1177-1184. [CrossRef]
- Zeng, B., et al., Fabrication of α-Fe2O3/g-C3N4 composites for cataluminescence sensing of H2S. Sensors and Actuators B: Chemical, 2015. 211: p. 370-376. [CrossRef]
- Liang, S., et al., Biomimetic inspired porphyrin-based nanoframes for highly efficient photocatalytic CO2 reduction. Chemical Engineering Journal, 2021. 411: p. 128414. [CrossRef]
- Chen, X., et al., Metal–organic framework-derived mesoporous carbon nanoframes embedded with atomically dispersed Fe–Nx active sites for efficient bifunctional oxygen and carbon dioxide electroreduction. Applied Catalysis B: Environmental, 2020. 267: p. 118720. [CrossRef]
- Lee, H., et al., Bimetallic Au/Ag nanoframes as spectator for Co2+ ion. Journal of industrial and engineering chemistry, 2017. 48: p. 235-241. [CrossRef]
- Wang, H., et al., Mesoporous ZrO2 Nanoframes for Biomass Upgrading. ACS Applied Materials & Interfaces, 2017. 9(32): p. 26897-26906. [CrossRef]
- Zhang, H., et al., Size-Tunable Yolk–Shell Gold–Silver Nanostructures for Photothermal Treatment of Multidrug-Resistant Bacteria. ACS Applied Nano Materials, 2022. [CrossRef]
- Dreaden, E.C., et al., The golden age: gold nanoparticles for biomedicine. Chemical Society Reviews, 2012. 41(7): p. 2740-2779. [CrossRef]
- Liu, P., et al., Versatile Phenol-Incorporated Nanoframes for In Situ Antibacterial Activity Based on Oxidative and Physical Damages. Advanced Functional Materials, 2022. 32(17): p. 2110635. [CrossRef]
- Hilal, H., et al., Three-dimensional nanoframes with dual rims as nanoprobes for biosensing. Nature communications, 2022. 13(1): p. 1-10. [CrossRef]
- Liu, X.-L., et al., Tuning plasmon resonance of gold nanostars for enhancements of nonlinear optical response and Raman scattering. The Journal of Physical Chemistry C, 2014. 118(18): p. 9659-9664. [CrossRef]
- Chiu, W.-T., et al., Electrocatalytic activity enhancement of Au NPs-TiO2 electrode via a facile redistribution process towards the non-enzymatic glucose sensors. Sensors and Actuators B: Chemical, 2020. 319: p. 128279. [CrossRef]
- Madriz, L., et al., Photocatalysis and photoelectrochemical glucose oxidation on Bi2WO6: Conditions for the concomitant H2 production. Renewable Energy, 2020. 152: p. 974-983. [CrossRef]
- Yang, Y., et al., Flexible Carbon-Fiber/Semimetal Bi Nanosheet Arrays as Separable and Recyclable Plasmonic Photocatalysts and Photoelectrocatalysts. ACS Applied Materials & Interfaces, 2020. 12(22): p. 24845-24854. [CrossRef]
- Wang, C., et al., Direct Plasmon-Accelerated Electrochemical Reaction on Gold Nanoparticles. ACS Nano, 2017. 11(6): p. 5897-5905. [CrossRef]
- Tian, Y., et al., Alloyed AuPt nanoframes loaded on h-BN nanosheets as an ingenious ultrasensitive near-infrared photoelectrochemical biosensor for accurate monitoring glucose in human tears. Biosensors and Bioelectronics, 2021. 192: p. 113490. [CrossRef]
- Toi, P.T., et al., Highly Electrocatalytic, Durable, and Stretchable Nanohybrid Fiber for On-Body Sweat Glucose Detection. ACS Applied Materials & Interfaces, 2019. 11(11): p. 10707-10717. [CrossRef]
- Koskun, Y., et al., Highly sensitive glucose sensor based on monodisperse palladium nickel/activated carbon nanocomposites. Analytica Chimica Acta, 2018. 1010: p. 37-43. [CrossRef]
- Wang, L., et al., One-step electrodeposition of AuNi nanodendrite arrays as photoelectrochemical biosensors for glucose and hydrogen peroxide detection. Biosensors and Bioelectronics, 2019. 142: p. 111577. [CrossRef]
- 1, I.A. and M.A.A., 2, Muhammad Khalid 1,2 and Andrey V. Savkin 3,*, A Comprehensive Review of Recent Advances inSmart Grids: A Sustainable Future with RenewableEnergy Resources. energies, 2020. 13: p. 1-41. [CrossRef]
- Shena, Q., et al., Construction of CdSe polymorphic junctions with coherent interface forenhanced photoelectrocatalytic hydrogen generation. Applied Catalysis B: Environmental, 2021. 282: p. 119552. [CrossRef]
- Yong Li a, b., et al., A 3D C@TiO2 multishell nanoframe for simultaneous photothermal catalytic hydrogen generation and organic pollutant degradation. Journal of Colloid and Interface Science, 2022. 609(535-546). [CrossRef]
- Ye, S., et al., Unassisted Photoelectrochemical Cell with Multimediator Modulation for Solar Water Splitting Exceeding 4% Solar-to-Hydrogen Efficiency. Journal of the American Chemical Society, 2021. 143(32): p. 12499-12508. [CrossRef]
- Domen*, Q.W.a.K., Particulate Photocatalysts for Light-Driven Water Splitting: Mechanisms, Challenges, and Design Strategies. American Chemical Society, 2020. 120(2): p. 919-985. [CrossRef]
- Tong Chen, L.L., Cheng Hu, Hongwei Huang *, Recent advances on Bi2WO6-based photocatalysts for environmental and energy applications. Chinese Journal of Catalysis, 2021. 42: p. 1413-1438. [CrossRef]
- Junmin Huang, J.C., Wangxi Liu, Jingwen Zhang, Junying Chen *, Yingwei Li #, Copper-doped zinc sulfide nanoframes with three-dimensional photocatalytic surfaces for enhanced solar driven H2 production. chinese journal of catalysis, 2022. 43: p. 782-792. [CrossRef]







Disclaimer/Publisher’s Note: The statements, opinions and data contained in all publications are solely those of the individual author(s) and contributor(s) and not of MDPI and/or the editor(s). MDPI and/or the editor(s) disclaim responsibility for any injury to people or property resulting from any ideas, methods, instructions or products referred to in the content. |
© 2024 by the authors. Licensee MDPI, Basel, Switzerland. This article is an open access article distributed under the terms and conditions of the Creative Commons Attribution (CC BY) license (http://creativecommons.org/licenses/by/4.0/).


