1. Introduction
At present days, one of the main problems managing the electric grid is the energy imbalance that occurs due to the mismatching between power generation and energy consumption. Despite the power generation can be established according to energy use standards, the variability of the energy consumption in short periods like a daily cycle makes unfeasible to match power generation and energy consumption.
Some tries to achieve a good balancing method between power generation and energy consumption have been developed in past times, either using specific strategies for small devices [
1] variable renewable energy sources (VRE) [
2,
3,
4,
5,
6], biomass facilities [
7] or assisted systems [
8] applying anthropogenic influence on the energy consumption rate [
9], analyzing the formation of heat islands [
9,
10], or using thermal storage systems [
11]. Different methodologies have been applied either to the domestic sector [
12], or to entire countries [
13]
A good solution to match power generation and energy consumption is the use of energy storage systems [
14]; however, the great amount of energy that is managed by the electric grid forces the use of giant storage systems, which are difficult to manage and very costly. On the other hand, the large covering area of the grid distribution requires an excessive number of storage systems to avoid energy losses if the distance between the storage system and the distribution point is large.
Based on these premises, the design of a power generation to energy consumption balance system requires the following characteristics: easy access from the distribution point, short distance from the grid, large capacity to absorb peaks of energy consumption, and good capacity of managing the energy exchange between grid and storage system.
A feasible solution that fulfils almost all requirements is the use of the Electric Vehicles (EV’s) batteries as storage system, since the EV’s are widely distributed, the EV’s fleet is large enough and increases constantly, EV are currently parked in the nearby of consumption centers like residential buildings, commercial centers, industrial facilities, hospitals, institutional buildings, etc., and the control system of the EV’s battery is already prepared to manage the current and energy exchange between the EV and the grid (V2G system).
The use of the EV fleet as energy reservoir to absorb the excess of energy from the grid has been studied by different authors reflecting the advantages and drawbacks of the V2G system for grid balancing [
15,
16,
17,
18,
19,
20], especially the impact that the EV may have on the grid stabilization [
21,
22,
23]. The hybridization of V2G systems with VRE facilities has also been studied and analyzed [
24], as well as its integration in the management of smart grids (SG) [
25,
26,
27]. The studies have also been extended to micro-grids to evaluate the viability of this methodology in a wider range of applications [
28].
In this paper we study the option of using the batteries of the electric vehicle fleet in developed countries to compensate the energy imbalance of the grid due to the mismatching between power generation and energy consumption; this methodology represents a serious advance in the goal of avoiding energy imbalance making use of existing resources and promoting the implementation of a technology respectful with the environment, especially in congested areas like big cities and very populated zones.
The paper is structured in the following sections:
- a)
Methodology. This section describes the procedure that has been adopted to develop the optimization process for the grid energy imbalance
- b)
Energy reservoir. In this section he capacity of energy storage that the electric vehicle fleet has is studied
- c)
Battery capacity. An analysis of the battery capacity as a function of its characteristics and operating conditions is made
- d)
Simulation methodology. This section describes the simulation process carried out to estimate the capacity of energy balance that a fleet of electric vehicles has, related to the power generation
- e)
Energy balance modeling. The capacity of the battery block, considering the entire fleet of electric vehicles as a unit, as well as the capacity of energy exchange between the EV’s and the grid is analyzed and modelled
- f)
Simulation model. The results of the simulation for the proposed model are presented in this section
2. METHODOLOGY
The proposed method is based on the analysis of the ratio of energy consumption to constant power generation. Energy consumption is assumed to evolve according to the standards of modern society in developed countries, but it can be modified to adopt other values, currently lowers, corresponding to developing countries or regions where the human development index (HPI) is low. Since there is a close relation between the HDI and the energy use [
29,
30,
31,
32], the selected scenario for the application of the methodology may largely influence the analysis of the study and the results [
33,
34].
Since the power penetration of the electric vehicle market differs from well-developed countries to non-developed countries, or even developing ones [
35,
36,
37,
38], mainly due to the high cost of EV’s, we have considered only well-developed countries to validate the study.
Power generation has been assumed to maintain constant for a specific period of time; this assessment is based on the premise that the power plants are currently designed to operate at the optimum point for a specific power generation. If the amount of generated power increases or diminishes, the efficiency lowers; therefore, any change in the power generation delivering results in a lowering of the global efficiency (
Figure 1).
Power generation can be restraint if a Distributed Generation (DG) system is included; this is becoming a current practice nowadays with the implementation of renewable energy power plants and renewable energy local producers that inject energy on the grid. This procedure, which operates under power flow nonlinear constraints [
40] could make to change the concept of a rigid power generation structure based on conventional power plants like the one that has been operating until now. Furthermore, the increasing implementation of renewable energies in the power matrix of many countries, especially the developed ones, creates a new panorama that offers a variable portfolio of solutions to the energy imbalance; one of them can be the use of variable power flow frequency to adapt the power generation to the energy demand [
41]. This is a very interesting alternative and can be applied to present study if necessary.
The level of power generation has been determined based on real data, as shown in
Figure 2. The representative value has been obtained averaging the selected countries; in our study this selection corresponds to Canada, France, Germany, Spain and United Kingdom, since we have focused the study in countries of Western Europe, with similar characteristics of Human Development Index (HDI) [
42,
43,
44,
45], values like the case of China and United States have been discarded to avoid a distortion in the average representative value.
On the contrary, energy generation has been considered variable because of the human habits and modern way of living, with high levels of energy consumption in some times of the day (peak hours) followed by a severe decline in the meantime (valley hours). This variability is the responsible of the energy imbalance. The daily distribution of the energy consumption has been averaged for hundreds of situations, to obtain a standard reproduction of the real behavior of the modern society. The selected cases have been chosen in a relatively close range of energy consumption to avoid high distortion between the cases and to reduce standard deviation in the calculated averaged value. Like for the power generation, the cases of China and United States have been discarded (
Figure 1).
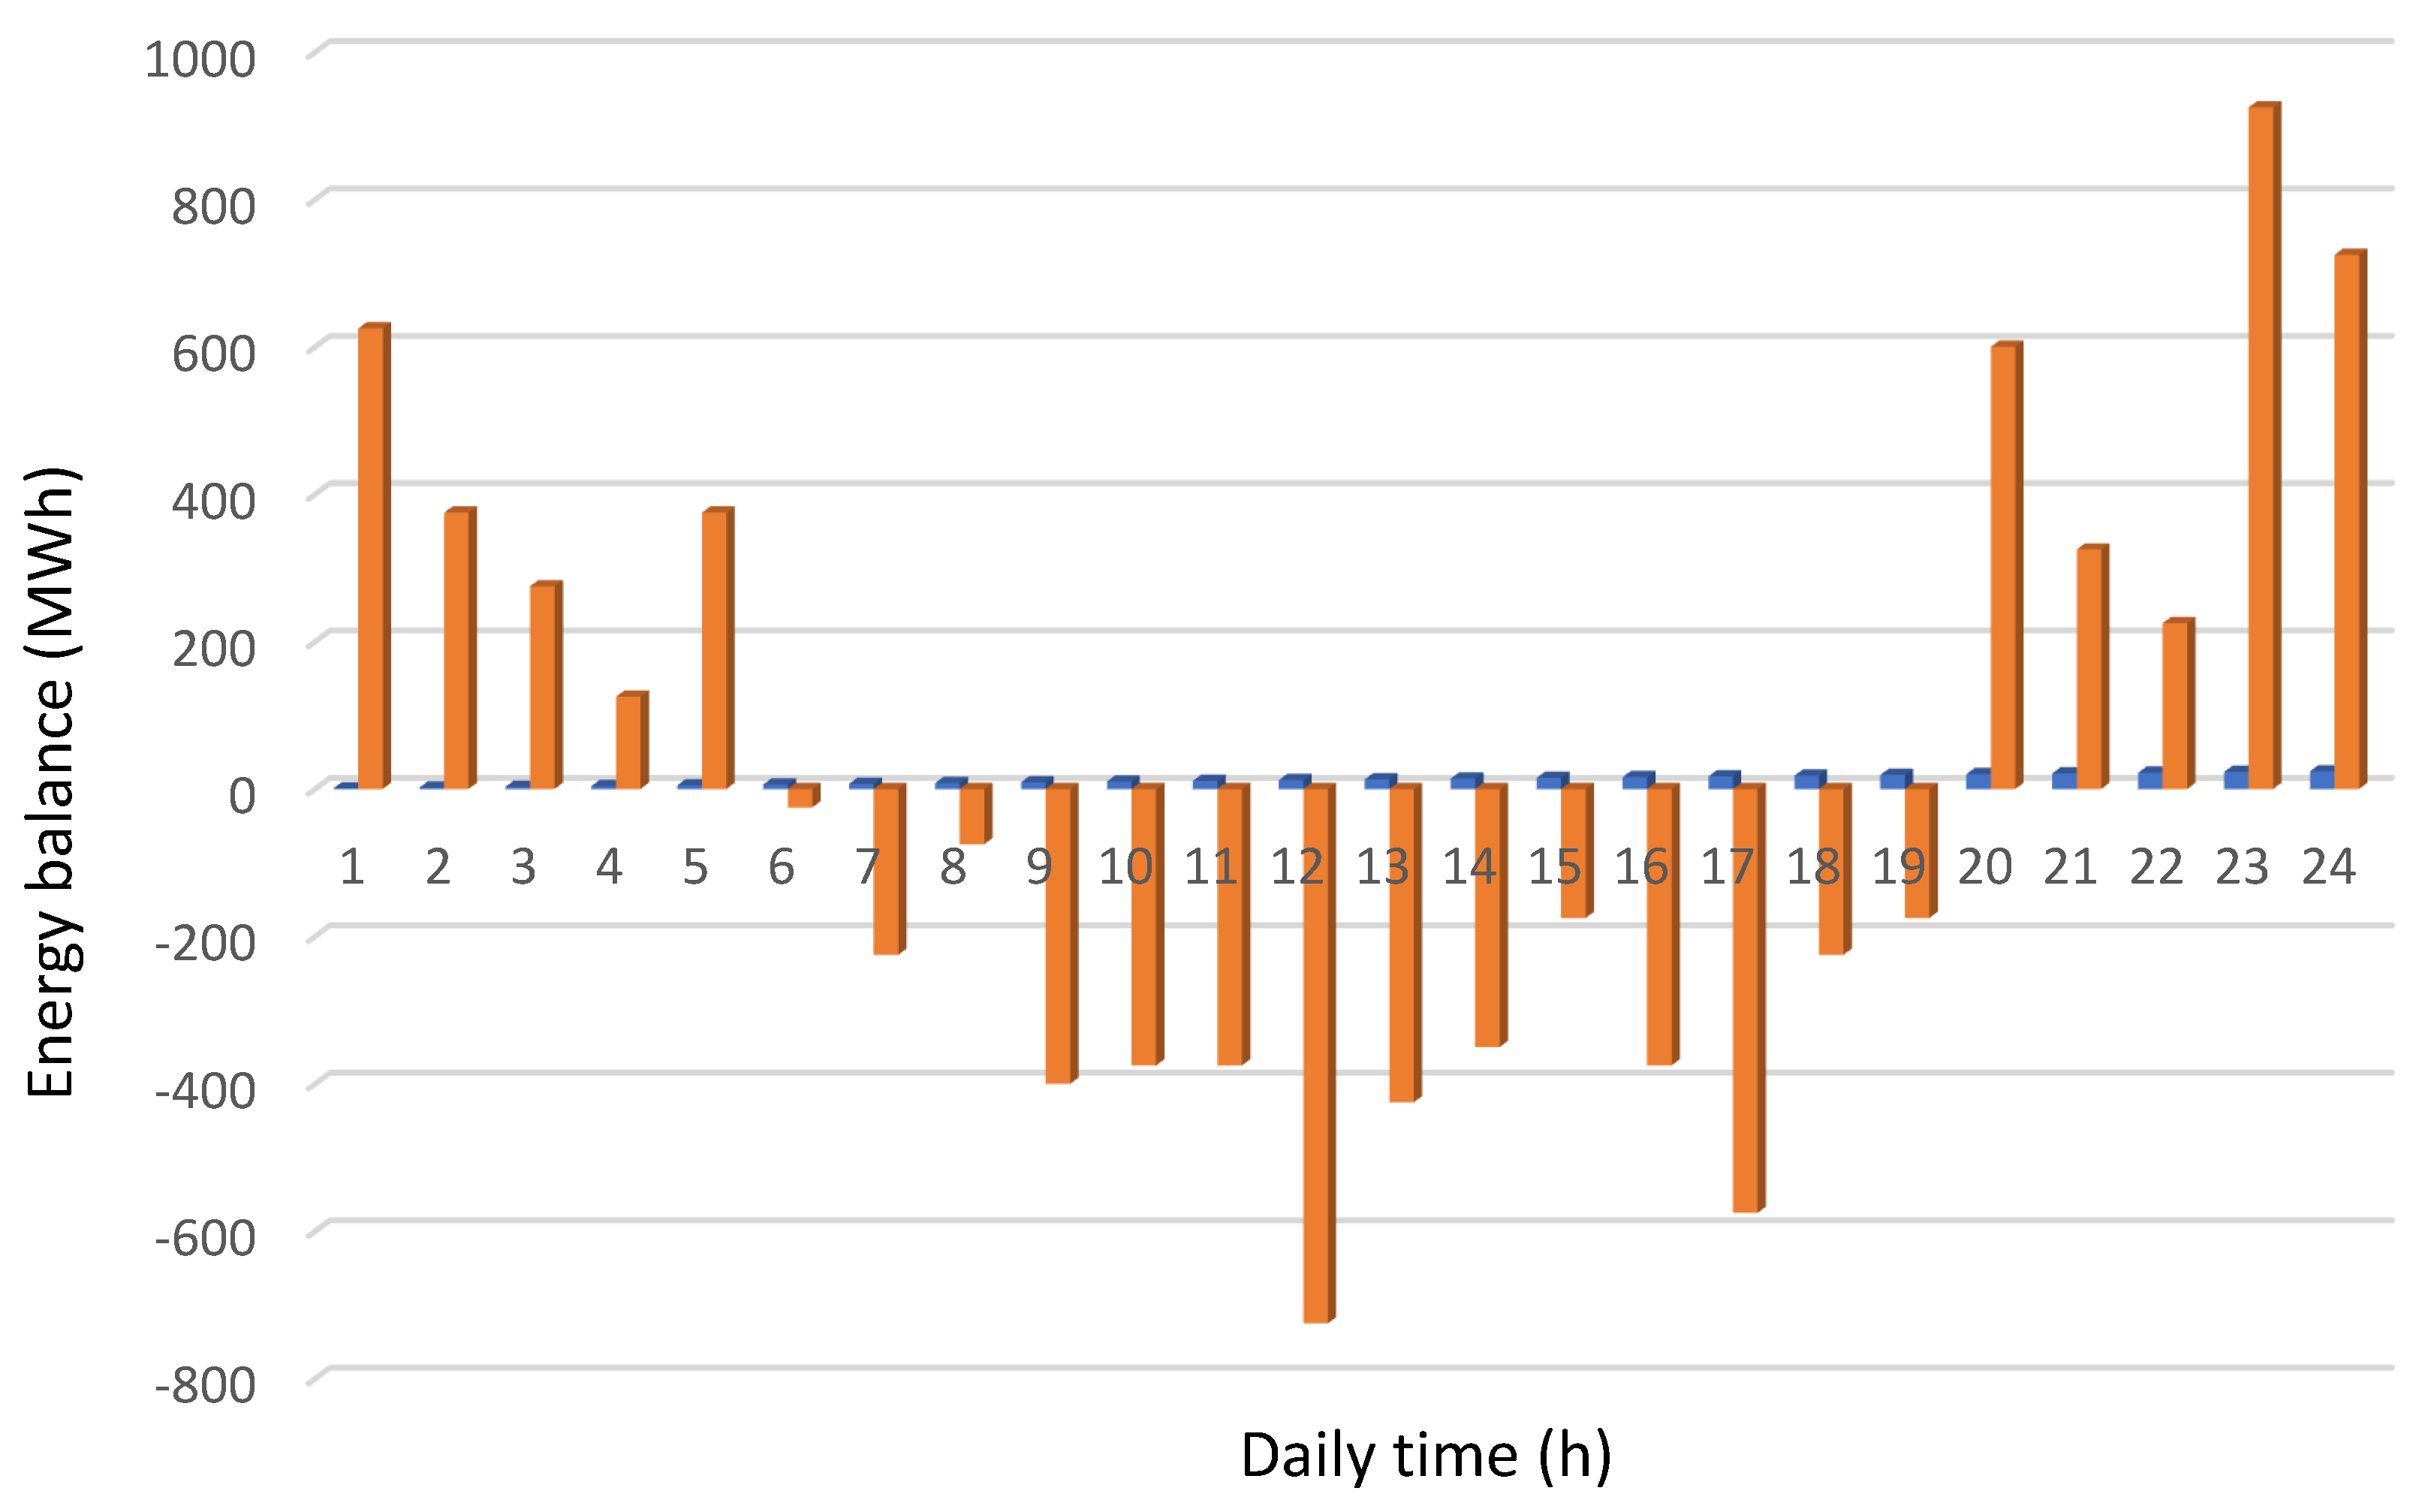
Once the power generation level and the daily distribution profile of energy consumption have been established, an hourly balance is set, thus obtaining the excess or lack of energy as for the selected case is concerned (see
Figure 3).
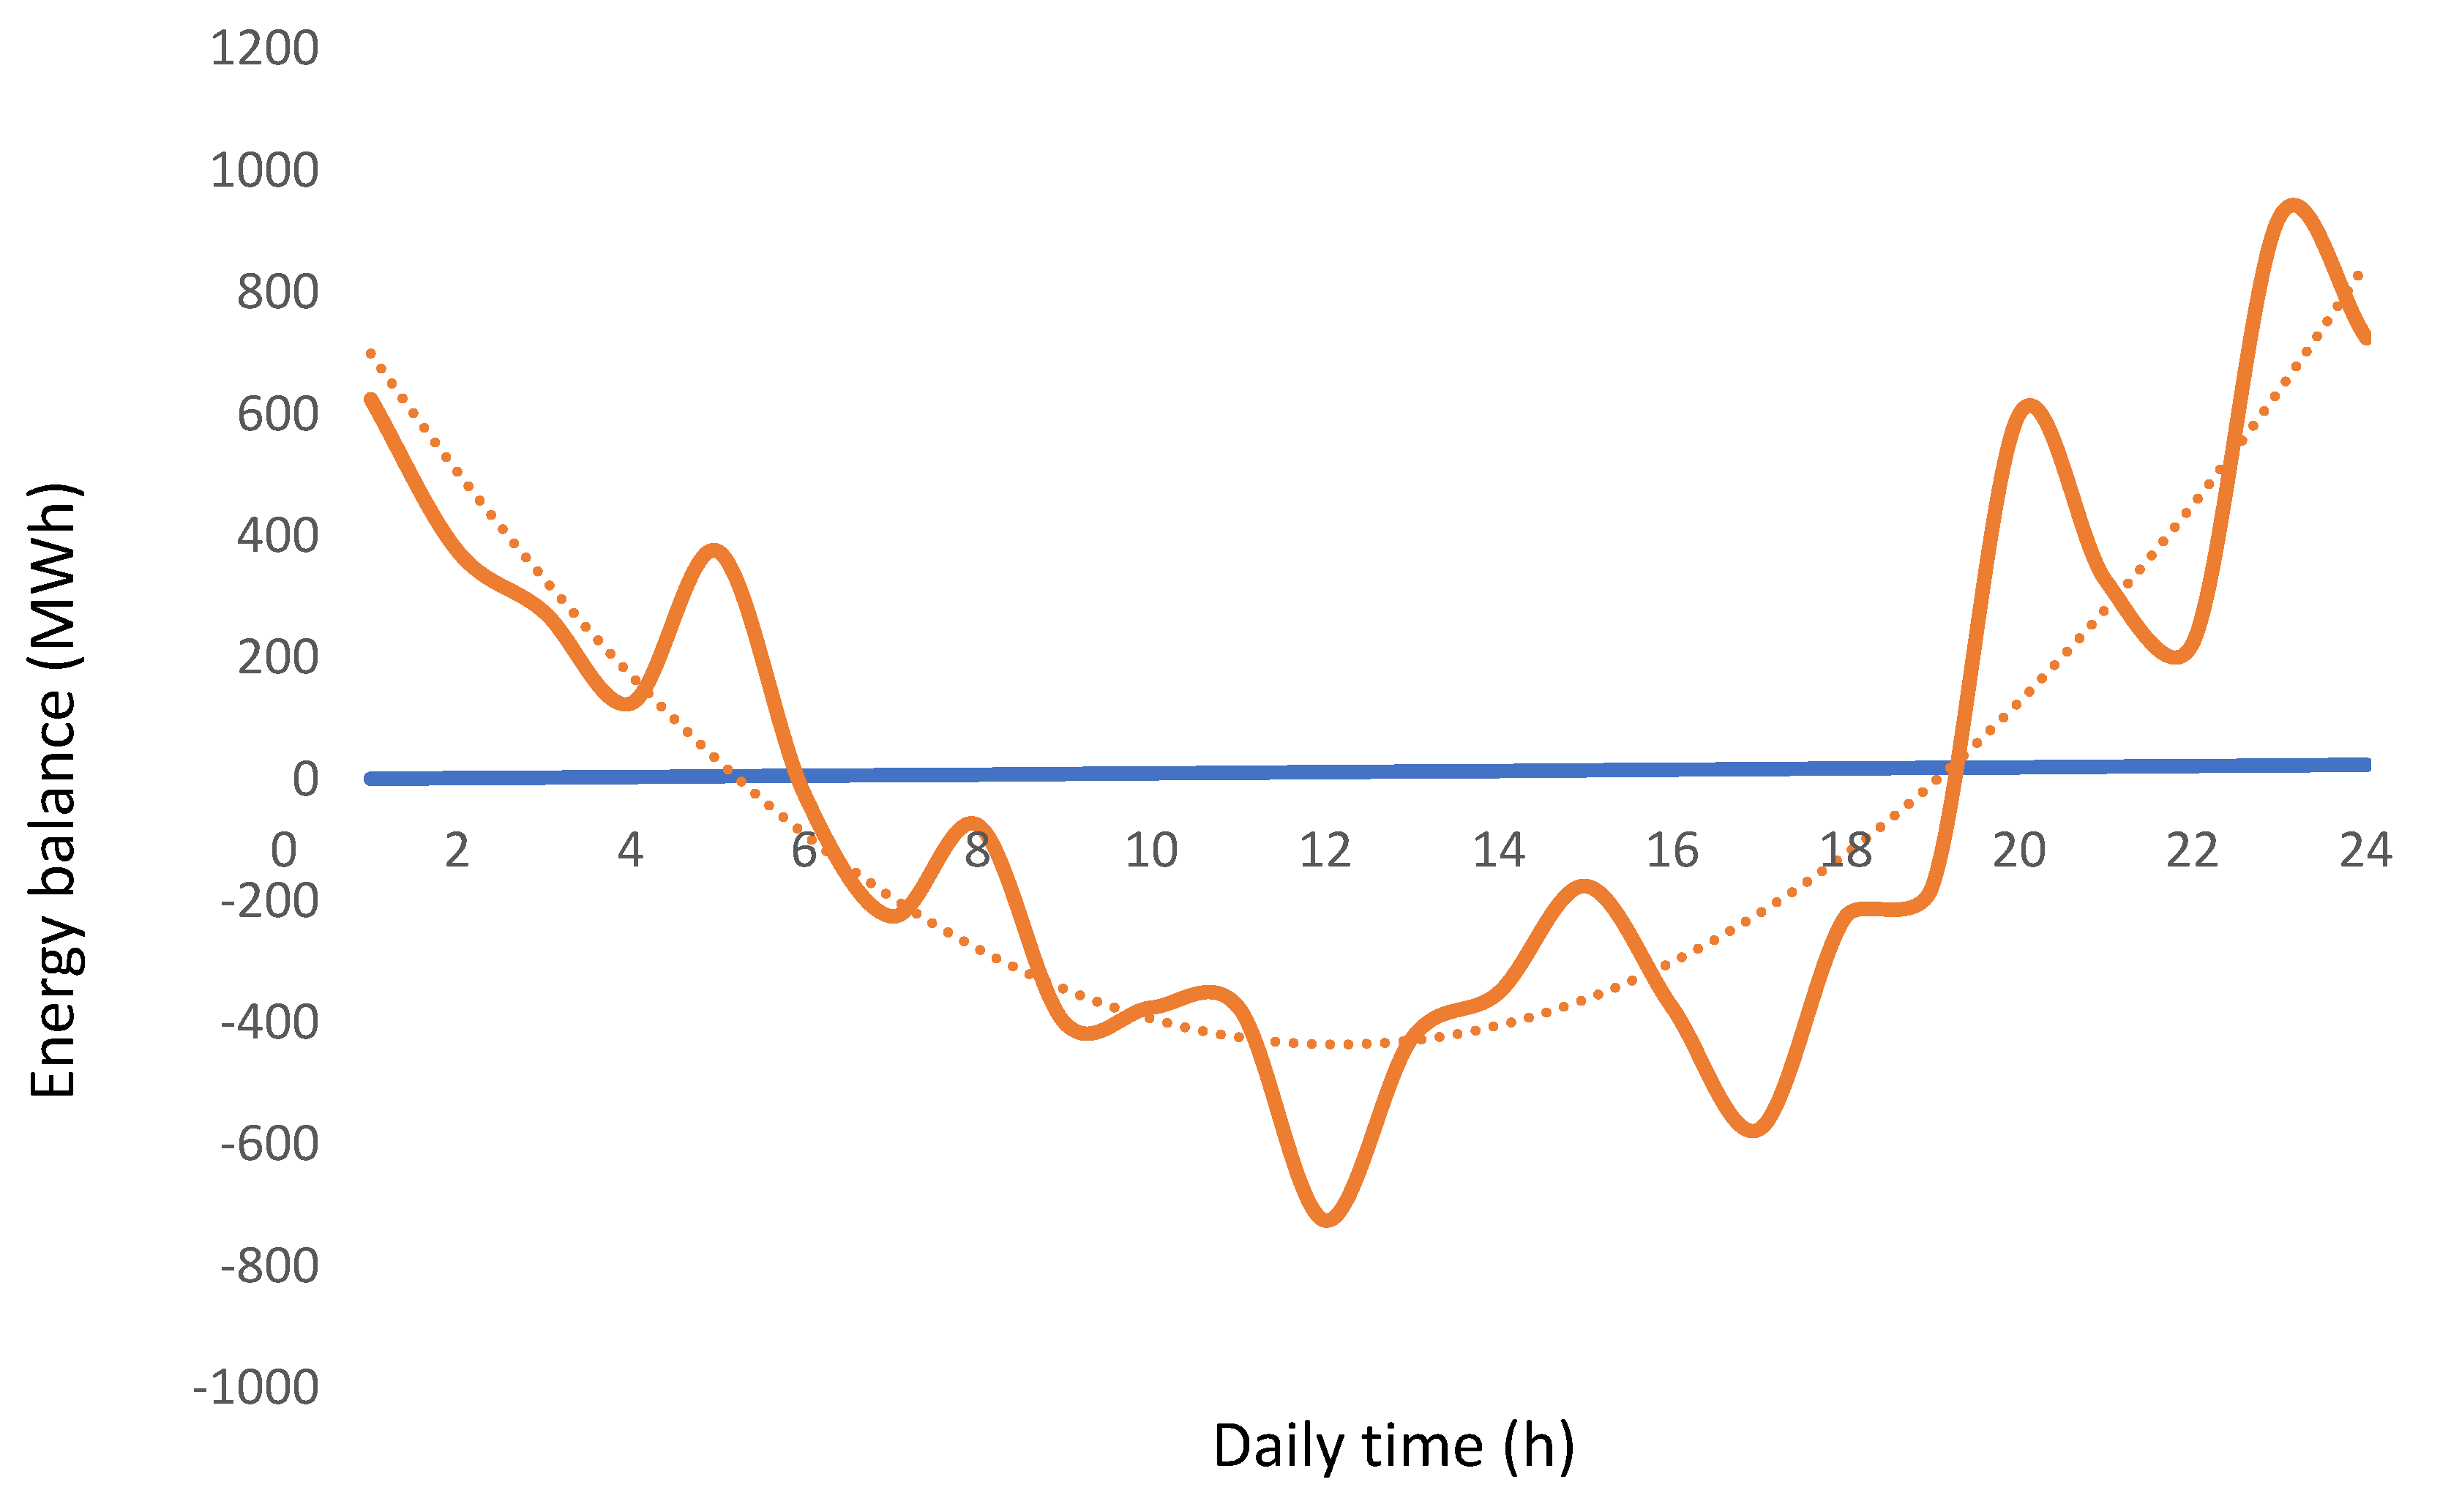
We notice, from the analysis of
Figure 3, that the energy balance can be correlated to a polynomial function of second order as represented in
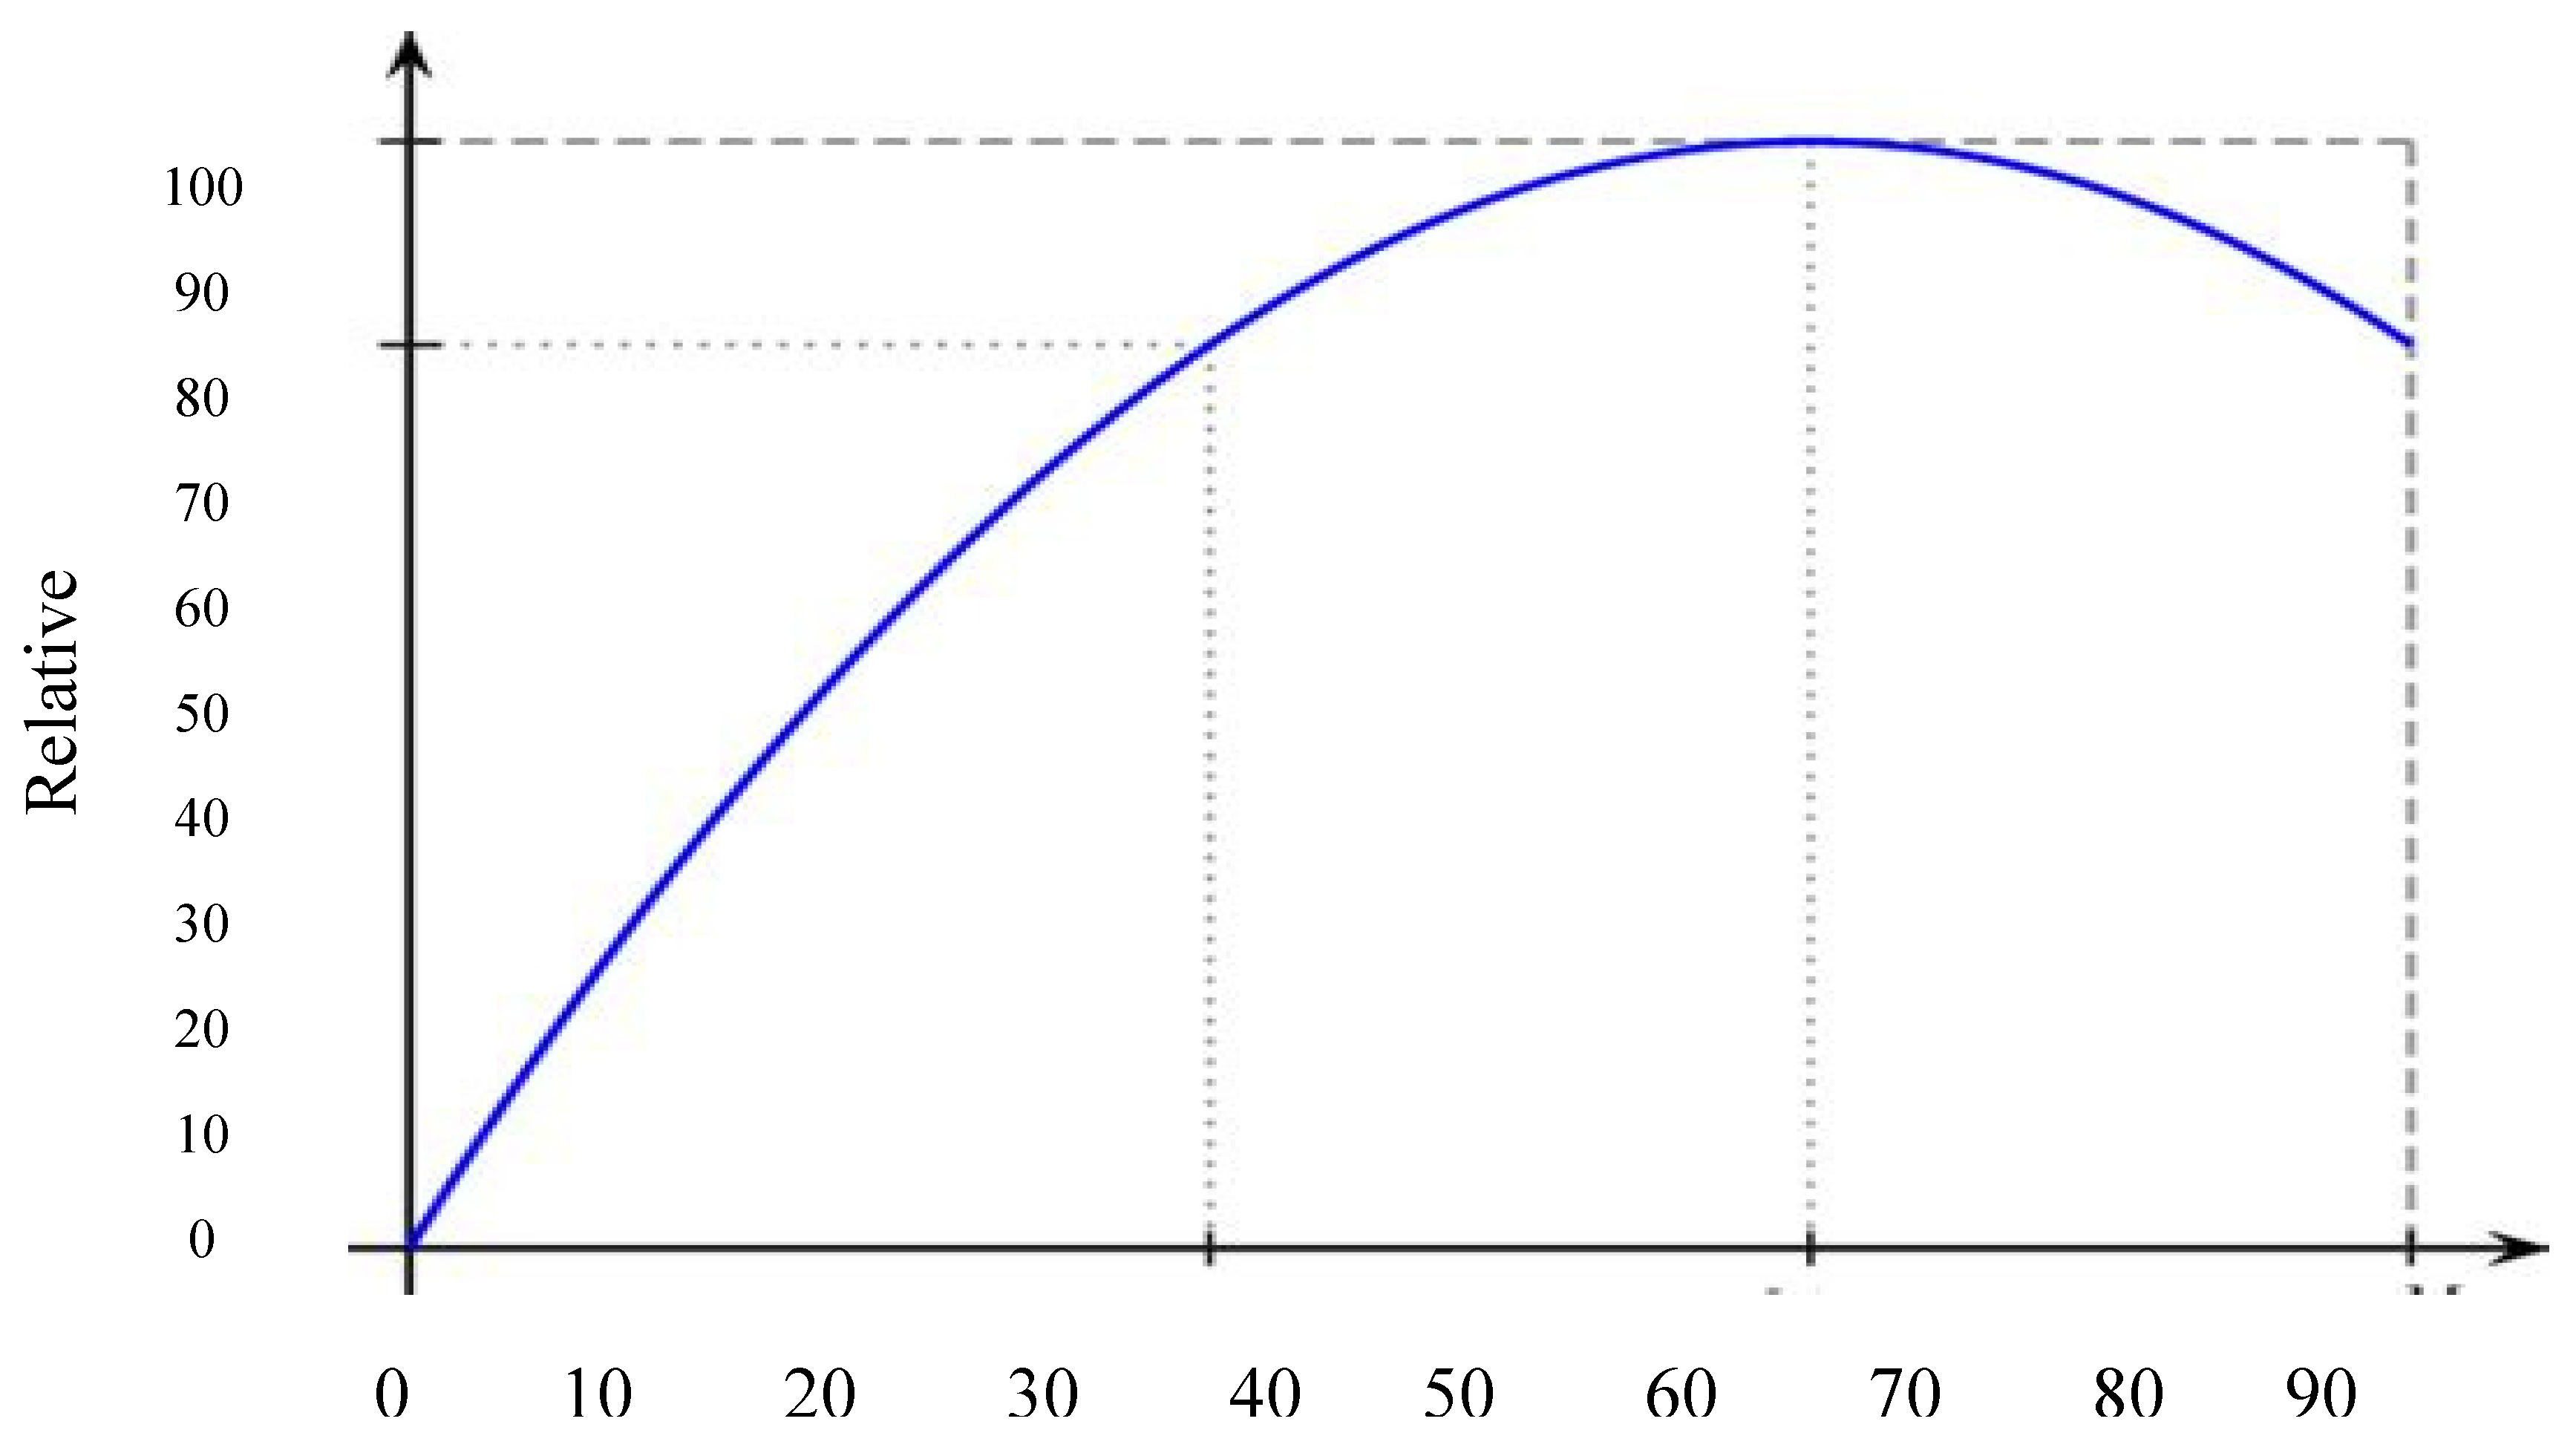
Figure 4. The correlation function is of the type:
Which for the represented case of
Figure 4 shows a rather good correlation, higher than 81%.
The correlation represents a useful tool to estimate the hourly daily energy balance.
To compensate either the excess or the lack of energy resulting from the application of the energy balance process, the applied methodology consists of using an energy reservoir that can be used as a damp. The reservoir can be any electric storage system, but secondary batteries of the lithium-ion type have been chosen.
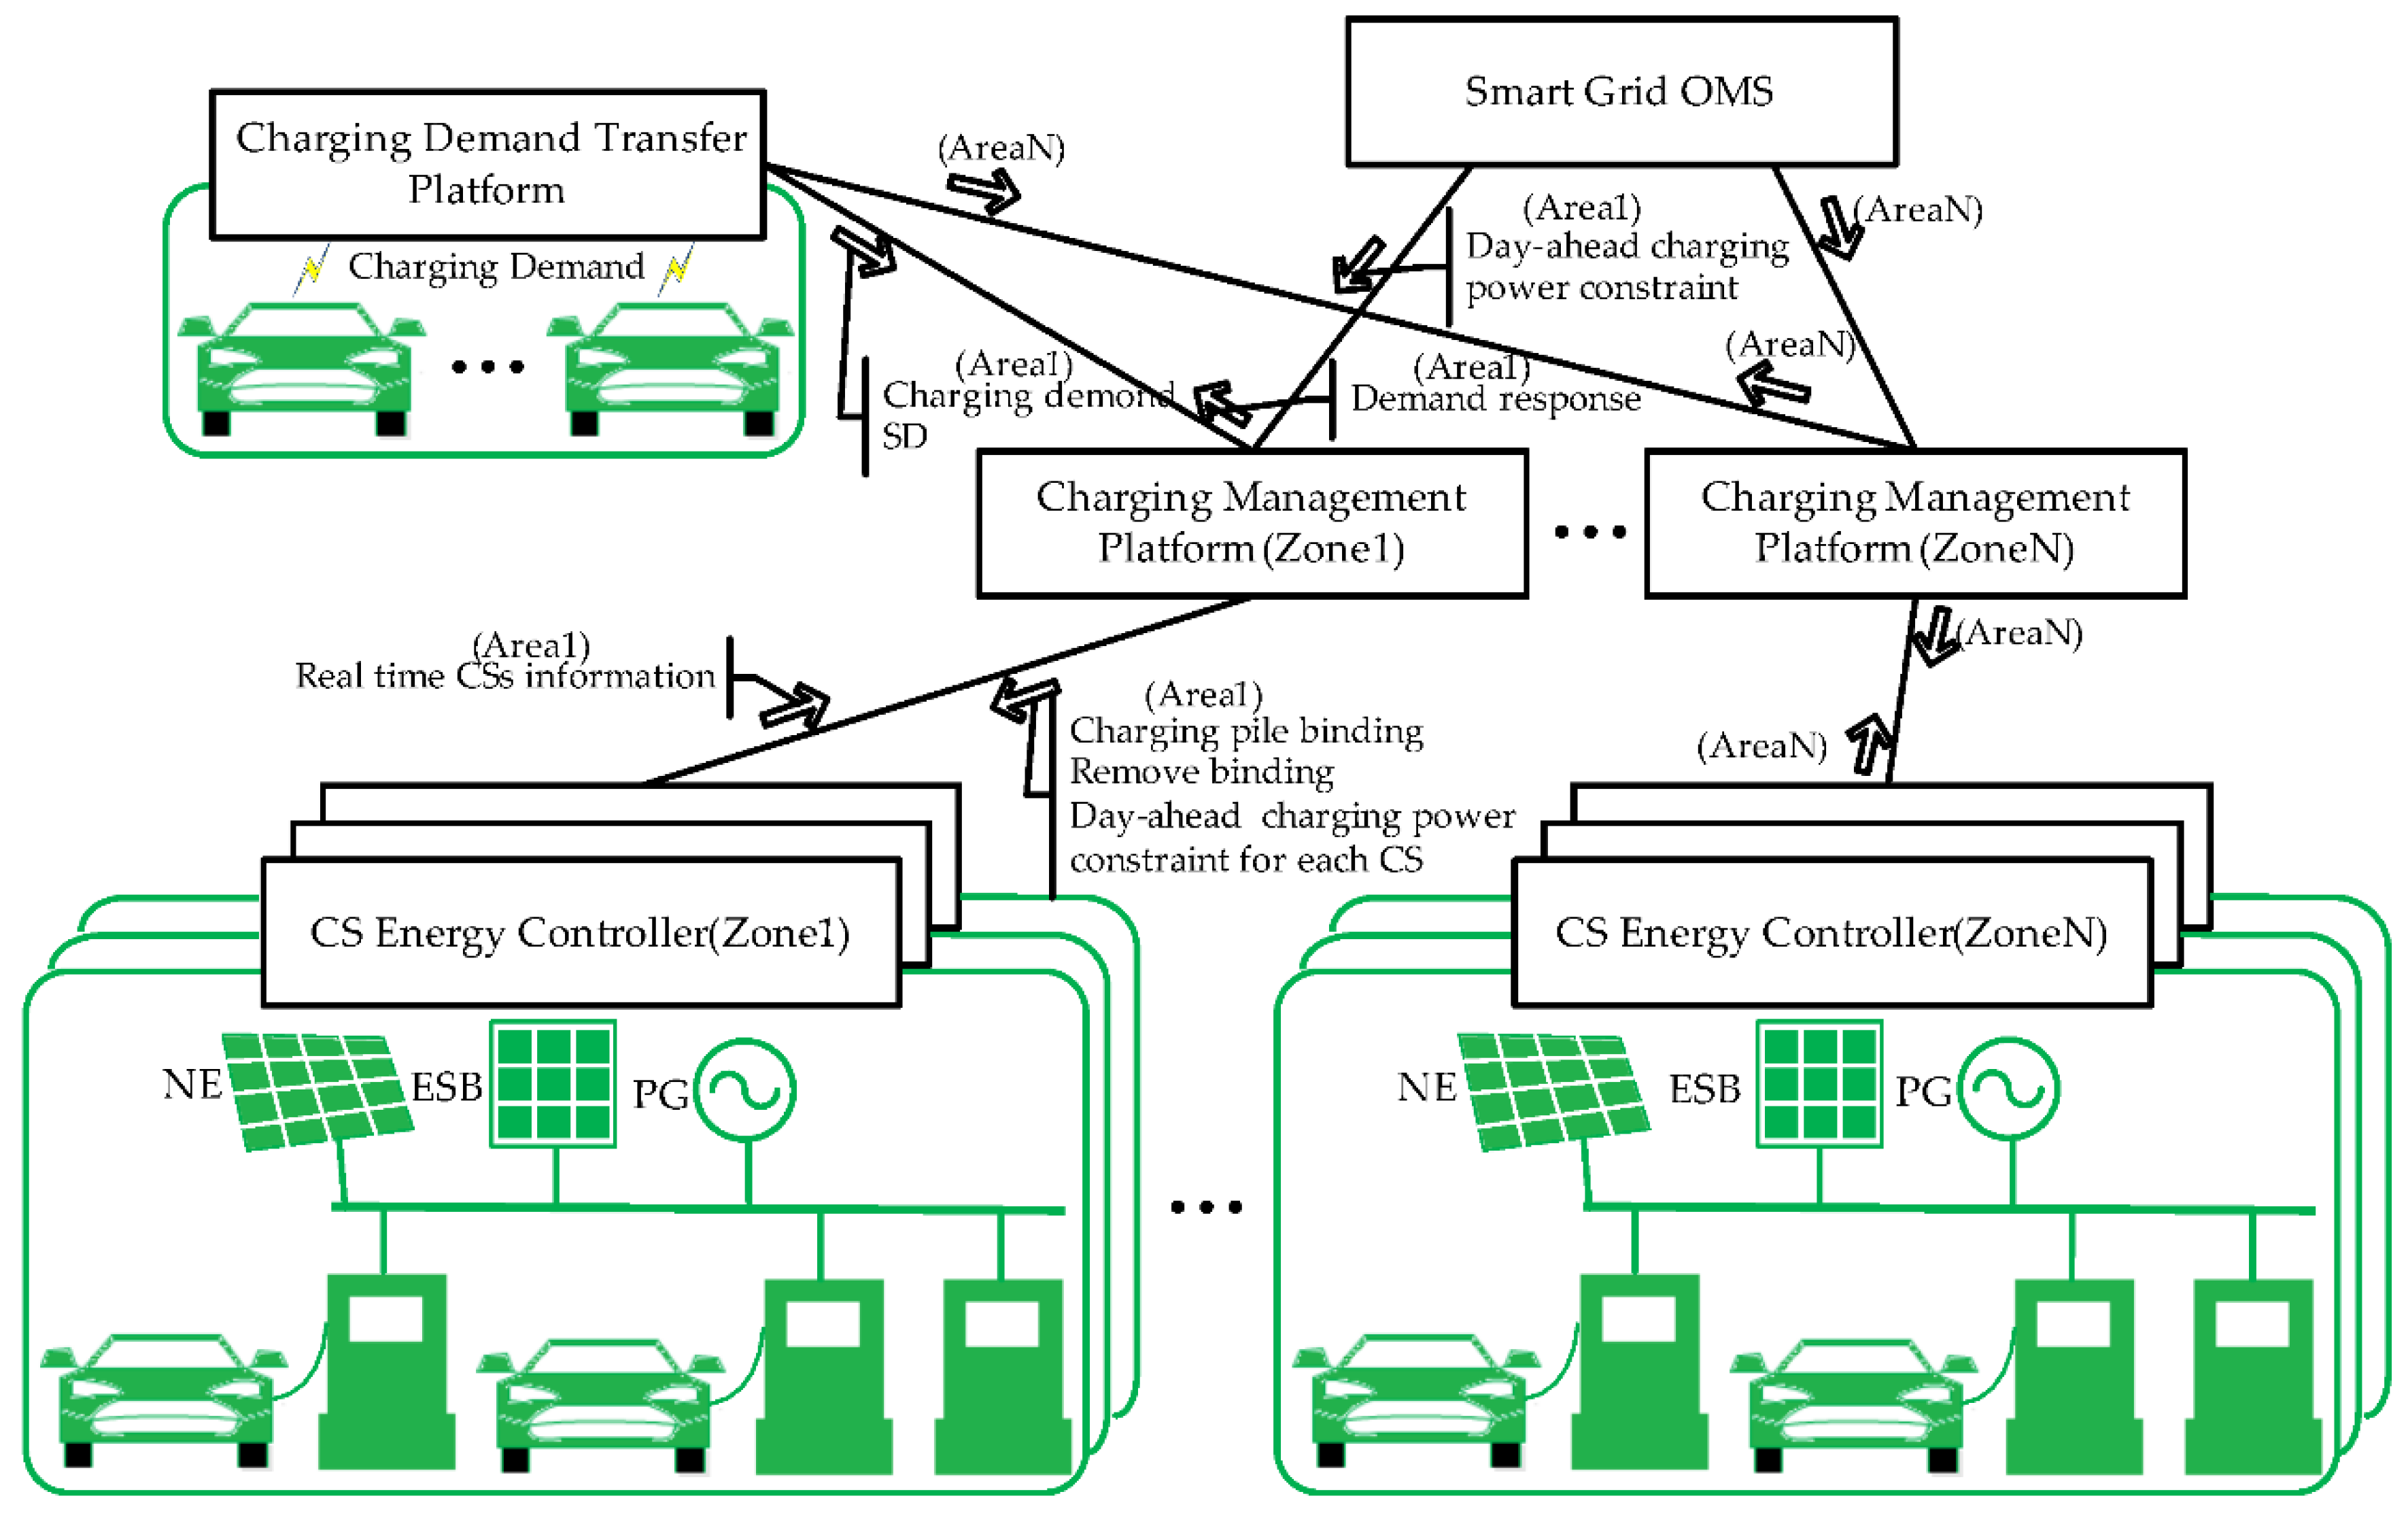
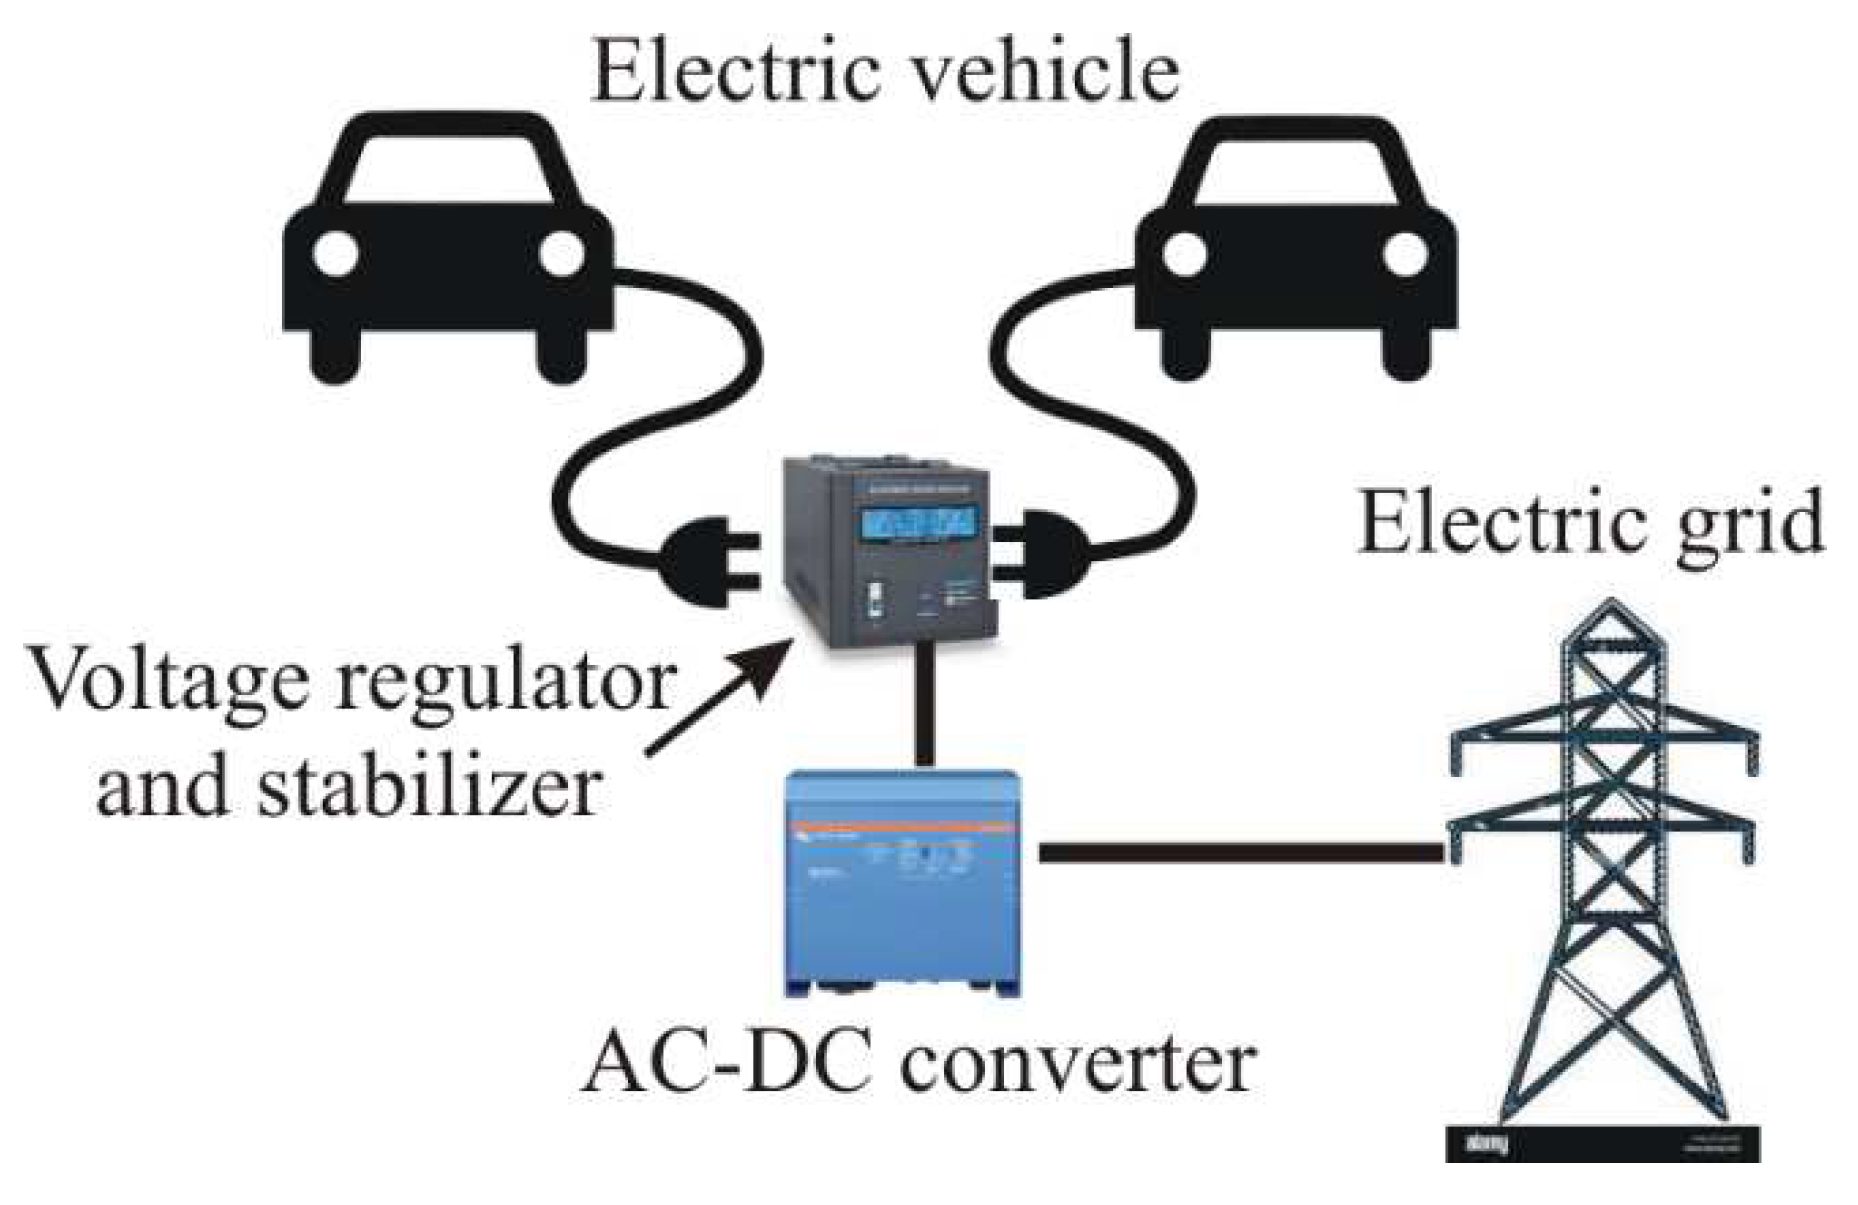
Because the size of the battery bank depends on the amount of energy that must be compensated, we have selected a modular system whose size can be modified at any time without disturbing the current operation of the battery bank and of the grid itself; this system is the electric vehicle fleet whose main characteristic is the availability of an easy access, the feasibility of exchange current during the time the vehicle is not running and the modular structure, since we can use more or less number of elements (electric vehicle batteries) through the corresponding wiring network (
Figure 5).
Figure 5 shows the electric vehicle recharging network with the different options of energy sources, renewables or grid; in our case it is the grid the only option no matter which source of energy is used for current supply. Depending on how much power or energy must be exchanged between the grid and the EV network, one or more of the charging zones would be activated; furthermore, the activation of the zone does not mean that all recharging points are in use, only the necessary ones.
CS and OMS account for Charging Station and Operation Management System.
3. ENERGY RESERVOIR
Lithium-ion batteries have the advantage of standing for very low self-discharge, high energy density, good rate of current exchange, and availability of being discharged up to the 100% of their capacity [
47,
48]; this makes this type of energy reservoir a very useful system to “absorb” the excess of energy when generation is higher than consumption, or to deliver the required amount of energy when the process is reversed, consumption greater than generation [
49,
50,
51,
52].
Energy exchange between electric vehicle batteries and the grid is currently known as
Vehicle To Grid (V2G) system, and it may become a serious option for energy balance in the future [
53,
54,
55,
56,
57,
58]. Despite the lack of an appropriate network of recharging points, there are different worldwide cases where the electric vehicle batteries are being used for grid energy balance [
59,
60,
61].
Considering the energy balance is given by the difference between power generation and energy consumption, working on hourly basis, we can establish:
Where
G is the associated energy to the power generation, and
Q is the real energy consumption.
Since the grid operates at alternate current, 110 VAC for the American market, and 220 VAC for the European one, and because the electric vehicle batteries use continuous current, an AC/DC converter is mandatory; the insertion of this device introduces an energy loss that depends on the efficiency of the AC/DC converter [
62,
63,
64].
Although currently taken as a reference parameter, the efficiency of an AC/DC converter depends on the load factor [
65,
66,
67,
68,
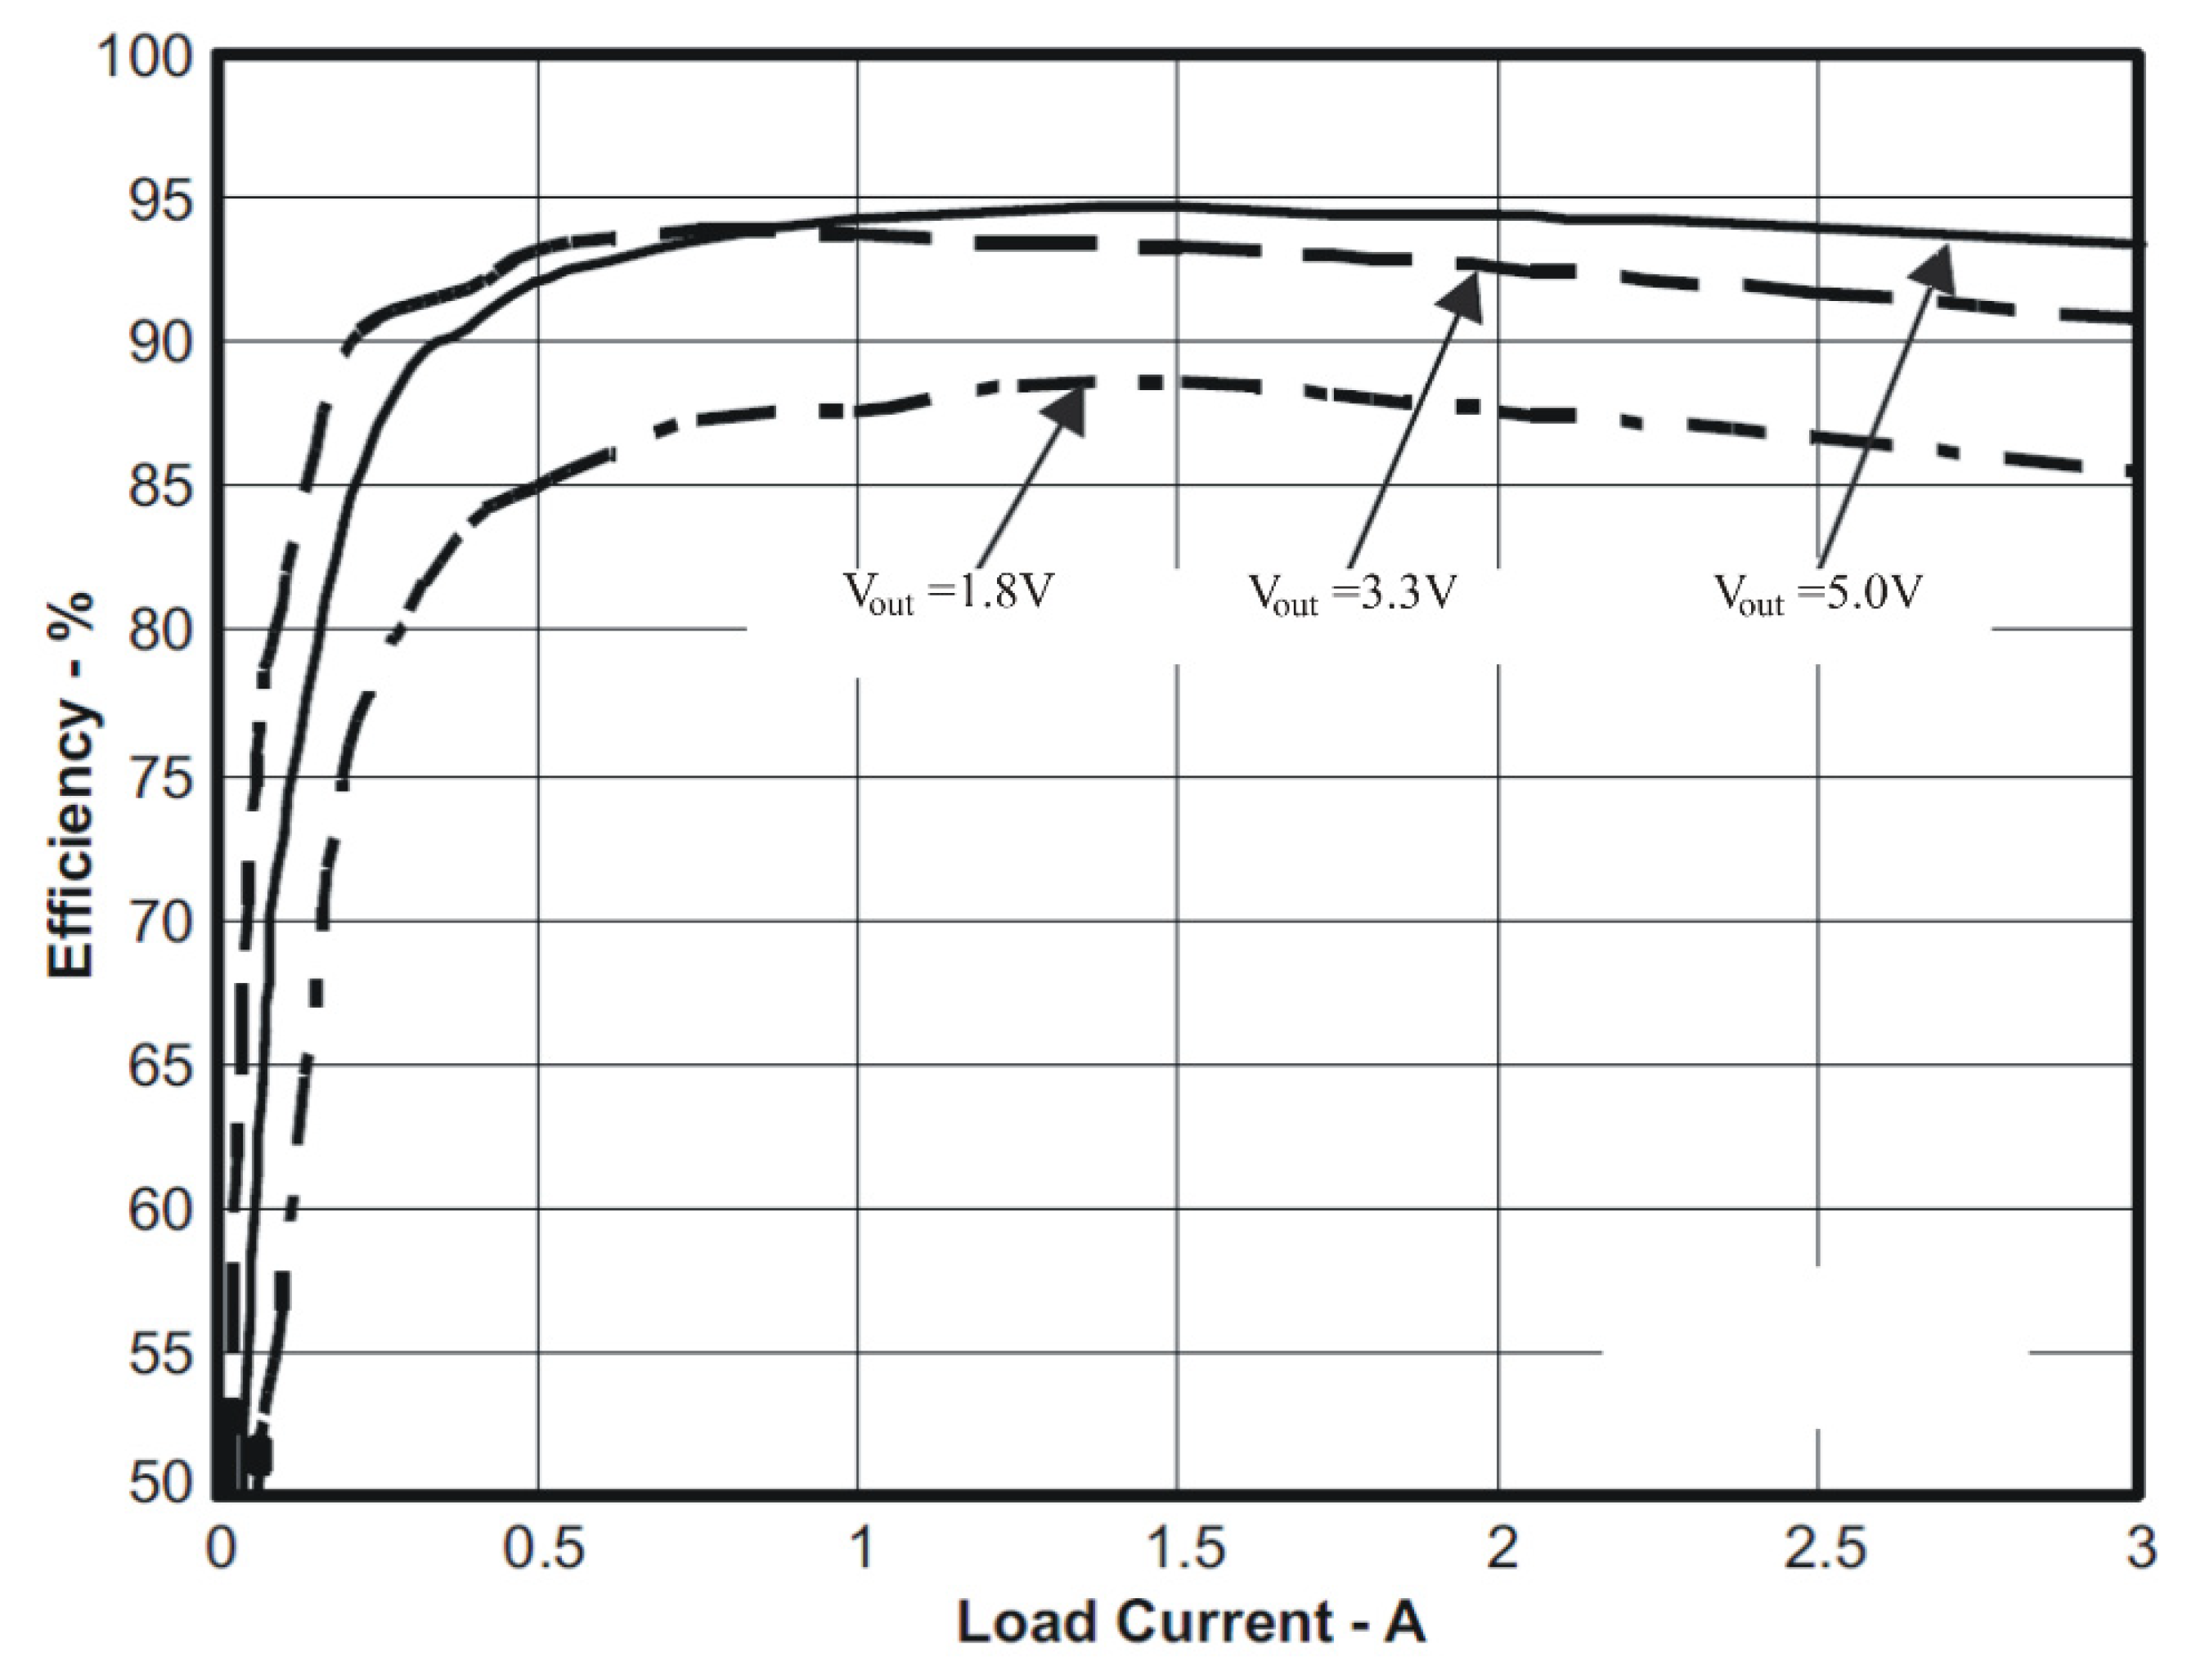
69]. The efficiency, however, remains rather constant for a wide range of load factor no matter which is the operating voltage (
Figure 6).
From
Figure 6, we can observe the efficiency of the converter is constant within the range 0.5-3 A, what represents a load factor of 17% to 100%. We should mention that is not frequent to operate an AC-DC converter below 20%, what assures the constancy of the converter’s efficiency within the operation range. It can also be observed that the converter’s efficiency increases with the operating voltage.
Assuming we operate either in the American or European market, the operational voltage is 110 VAC or 230 VAC, therefore, the efficiency of the AC-DC converter, according to what is shown in
Figure 6, is 87.5% or 92.5%. The efficiency value of the AC-DC converter is of great importance, since the energy transfer from the grid to the electric vehicles batteries is affected by this efficiency; the lower the efficiency the greater the energy losses.
4. BATTERY CAPACITY
Applying equation 2, and taking into account the efficiency of the AC-DC converter, we can determine the capacity of the battery block, considering the electric vehicles batteries as a whole. In such a case, we have:
Where
ηcv represents the efficiency of the AC-DC converter and
Vbat is the operational voltage of the electric vehicle battery.
Because the EV manufacturers may use different operational voltage, it is required to insert a voltage regulator between the AC-DC converter and the EV battery to adapt the electric vehicle battery voltage to a uniform value; the voltage regulator also operates as voltage stabilizer. A scheme of the layout of the system is represented in
Figure 7.
Because the voltage regulator operates with an efficiency lower than 100%, equation 3 should be reformulated as:
Where
ηreg is the efficiency of the voltage regulator unit.
Combining equations 1, 2 and 4:
Where coefficients
a, b and
c depend on the energy balance distribution, which is specific for every case.
Battery capacity as a block is the sum of the capacity of every single electric vehicle capacity. Nevertheless, the capacity of an electric vehicle depends on the brand and model; therefore, it is necessary to identify the value for every single electric vehicle battery that is used as energy reservoir [
70]. Despite the large variety of capacity of the electric vehicles from different brands and models, the industry uses standardization according to the segment of the electric vehicle, utility vehicles, SUV, high range and sports [
71]. This classification only concerns to light vehicles but not to trucks, buses or similar.
Using the most frequent battery capacity the car manufacturers mount on electric vehicles, we obtain the following reference values:
Battery block capacity of the electric vehicle fleet depends not only on the capacity of every single type of battery, but also on the number of electric vehicles of the fleet, therefore, we can express the global capacity as:
Where
Ci is the capacity of every single battery and
fi is the number of elements with the specific capacity
Ci.
Battery capacity is affected by the degradation the battery suffers from use; despite the aging (degradation) of a battery heavily depends on the type of use, there are some studies that have tried to modelling the degradation of the battery and how it affects to the capacity [
72,
73]. The degradation has not been considered in this study for simplicity; nevertheless, if the State-of-Health (SOH) of the battery is either known or estimated from a model, the capacity of the battery can be expressed in the following way:
Where
Cag accounts for the degraded battery, and
fSOH is the correction factor due to the aging or degradation of the battery that can be obtained from a model.
5. SIMULATION METHODOLOGY
Electric vehicle fleet has been simulated based on statistical approach to a real situation. Number of vehicles with specific battery capacity of those mentioned in
Table 1 has been estimated using statistical portfolio [
74].
Different situations arise as for the energy balance is concerned; we have selected for our study the ones that correspond to the next cases:
- a)
Null daily energy balance. In this case the power generation matches the energy consumption over the entire day. In this situation there is no extra power available on the average daily usage basis
- b)
Positive daily energy balance. This situation corresponds to the case where the power generation exceeds the energy consumption, therefore we can use the excess to recharge the battery block either partially or totally
- c)
Negative daily energy balance. In this case the power generation is not enough to cover the energy demand, and there is a permanent shortage of energy based on the average daily use
Analyzing the three proposed cases we face the following situation:
In a null daily energy balance the V2G system is not mandatory for a daily global compensation; moreover, the use of a V2G system generates a negative effect on the daily balance due to the energy losses associated to the charge/discharge battery efficiency during the current exchange. The energy losses cause a negative unbalance given by:
Where the super index
null accounts for the null daily energy balance case, and the sign minus indicates the variation of the energy balance is negative. The battery efficiency during charge or discharge process has been considered identical; in case is not, equation 7 must be expressed as:
Super-indexes dch and ch account for discharge and charge processes.
Equation 9 implies battery ageing is null over an entire cycle, otherwise the ageing effects should be included resulting in a negative energy balance as in equation 10, where
ηag is the battery ageing factor.
Nevertheless, from a global point of view, the use of a V2G system in null daily energy balance situation may have positive effects is applied at the appropriate time; indeed, a null daily energy balance does not mean the generation always matches the energy demand during the day. Current situation, as shown in
Figure 4, indicates there is a positive or negative imbalance that is compensated over the entire day with a null result. The compensation mechanism implies either the use of a storage system or the variation of the power generation to always match energy demand. The use of a storage system suffers from the same problems that of a V2G, while the variation of power generation redounds on a loss of efficiency since the power plants are designed to operate at optimum conditions, say maximum efficiency, for a constant output power; therefore, there is an energy loss associated to the lowering of power generation efficiency.
In terms of energy efficiency, it is necessary to compare energy losses due to the lowering of efficiency in a power plant because of the increase or decrease in the output power with the energy losses associated to the use of a V2G system, prevailing the method that generates lower energy losses. The comparison can be expressed as:
Where
Δηi is the reduction of efficiency in the power plant due to the variation of power generation.
Considering that the energy exchange between the battery and grid,
Δξbat, and the sum of energy variation in the power plant over an entire day,
ΣΔξg,i, are equal, we have:
To determine whether the above ratio is greater or lower than one, we can simplify equation 12 assuming a constant effective value of the power plant efficiency variation that maintains the product
Δξg,iΔηi over the whole day; in such a case, equation 12 is transformed into:
Because battery efficiency and the ageing factor are of high value, the two terms of the parenthesis are higher than one, so the ratio is lower than ¼, what means the energy losses associated to the use of the V2G system represents less than 25% of the ones when the power generation changes to match energy demand; therefore, a V2G system is beneficial for the null daily energy balance case.
In positive daily energy balance, the excess of power generation can be used to recharge the electric vehicle batteries beyond the compensation level. In this case, the electric vehicles operate based on V2G system plus a “free” extra energy source represented by the excess of power generation; consequently, the global efficiency of the system increases and the performance of the V2G is improved. Mathematically:
Where
Δξg,bat accounts for the excess of power generation transferred to the electric vehicle battery block.
Equation 14 shows that the use of the V2G in a positive daily energy balance reduces the exchange of energy between the grid and the electric vehicle battery block, thus improving the performance of the global system.
The use of a V2G system in the negative daily energy balance case cannot compensate the shortage of energy in a daily cycle unless the electric vehicle fleet suffers from a continuous decline in the state of charge of the batteries, what affects the operation of the electric vehicles, reducing progressively the autonomy and the service operation; therefore, it is not feasible to obtain a full but only a partial compensation in the energy exchange between the grid and the battery block.
According to the developed analysis the simulation method has been based on the premises set up for the three proposed cases, considering that the energy unbalance can be fully compensated in the two first cases and only partially compensated in the last one.
The method uses a set up value for the power generation based on the data provided by official organisms or grid management institutions and averaged over the time of the study sample [
75,
76,
77,
78]. The value is also averaged for the different sources of energy to avoid random variations due to sudden drops in generation stoppages because of scheduled maintenance tasks [
79], stoppages of the power generation plant caused by unexpected breakdowns [
80] or power outages due to maintenance issues [
81].
The method has been applied to a local zone of reduced size, but it can also be applied to larger areas like regions or countries, even more extended geographical zones.
6. ENERGY BALANCE MODELLING
We have operated based on a daily cycle, setting up two hourly zones, from 7 pm to 6 am, where there is an excess of power generation as for the energy demand, and from 6 am to 7 pm when the energy demand exceeds the power generation. It has been assumed that energy flows from grid to battery reservoir in the first hourly zone, and in the opposite way in the second period.
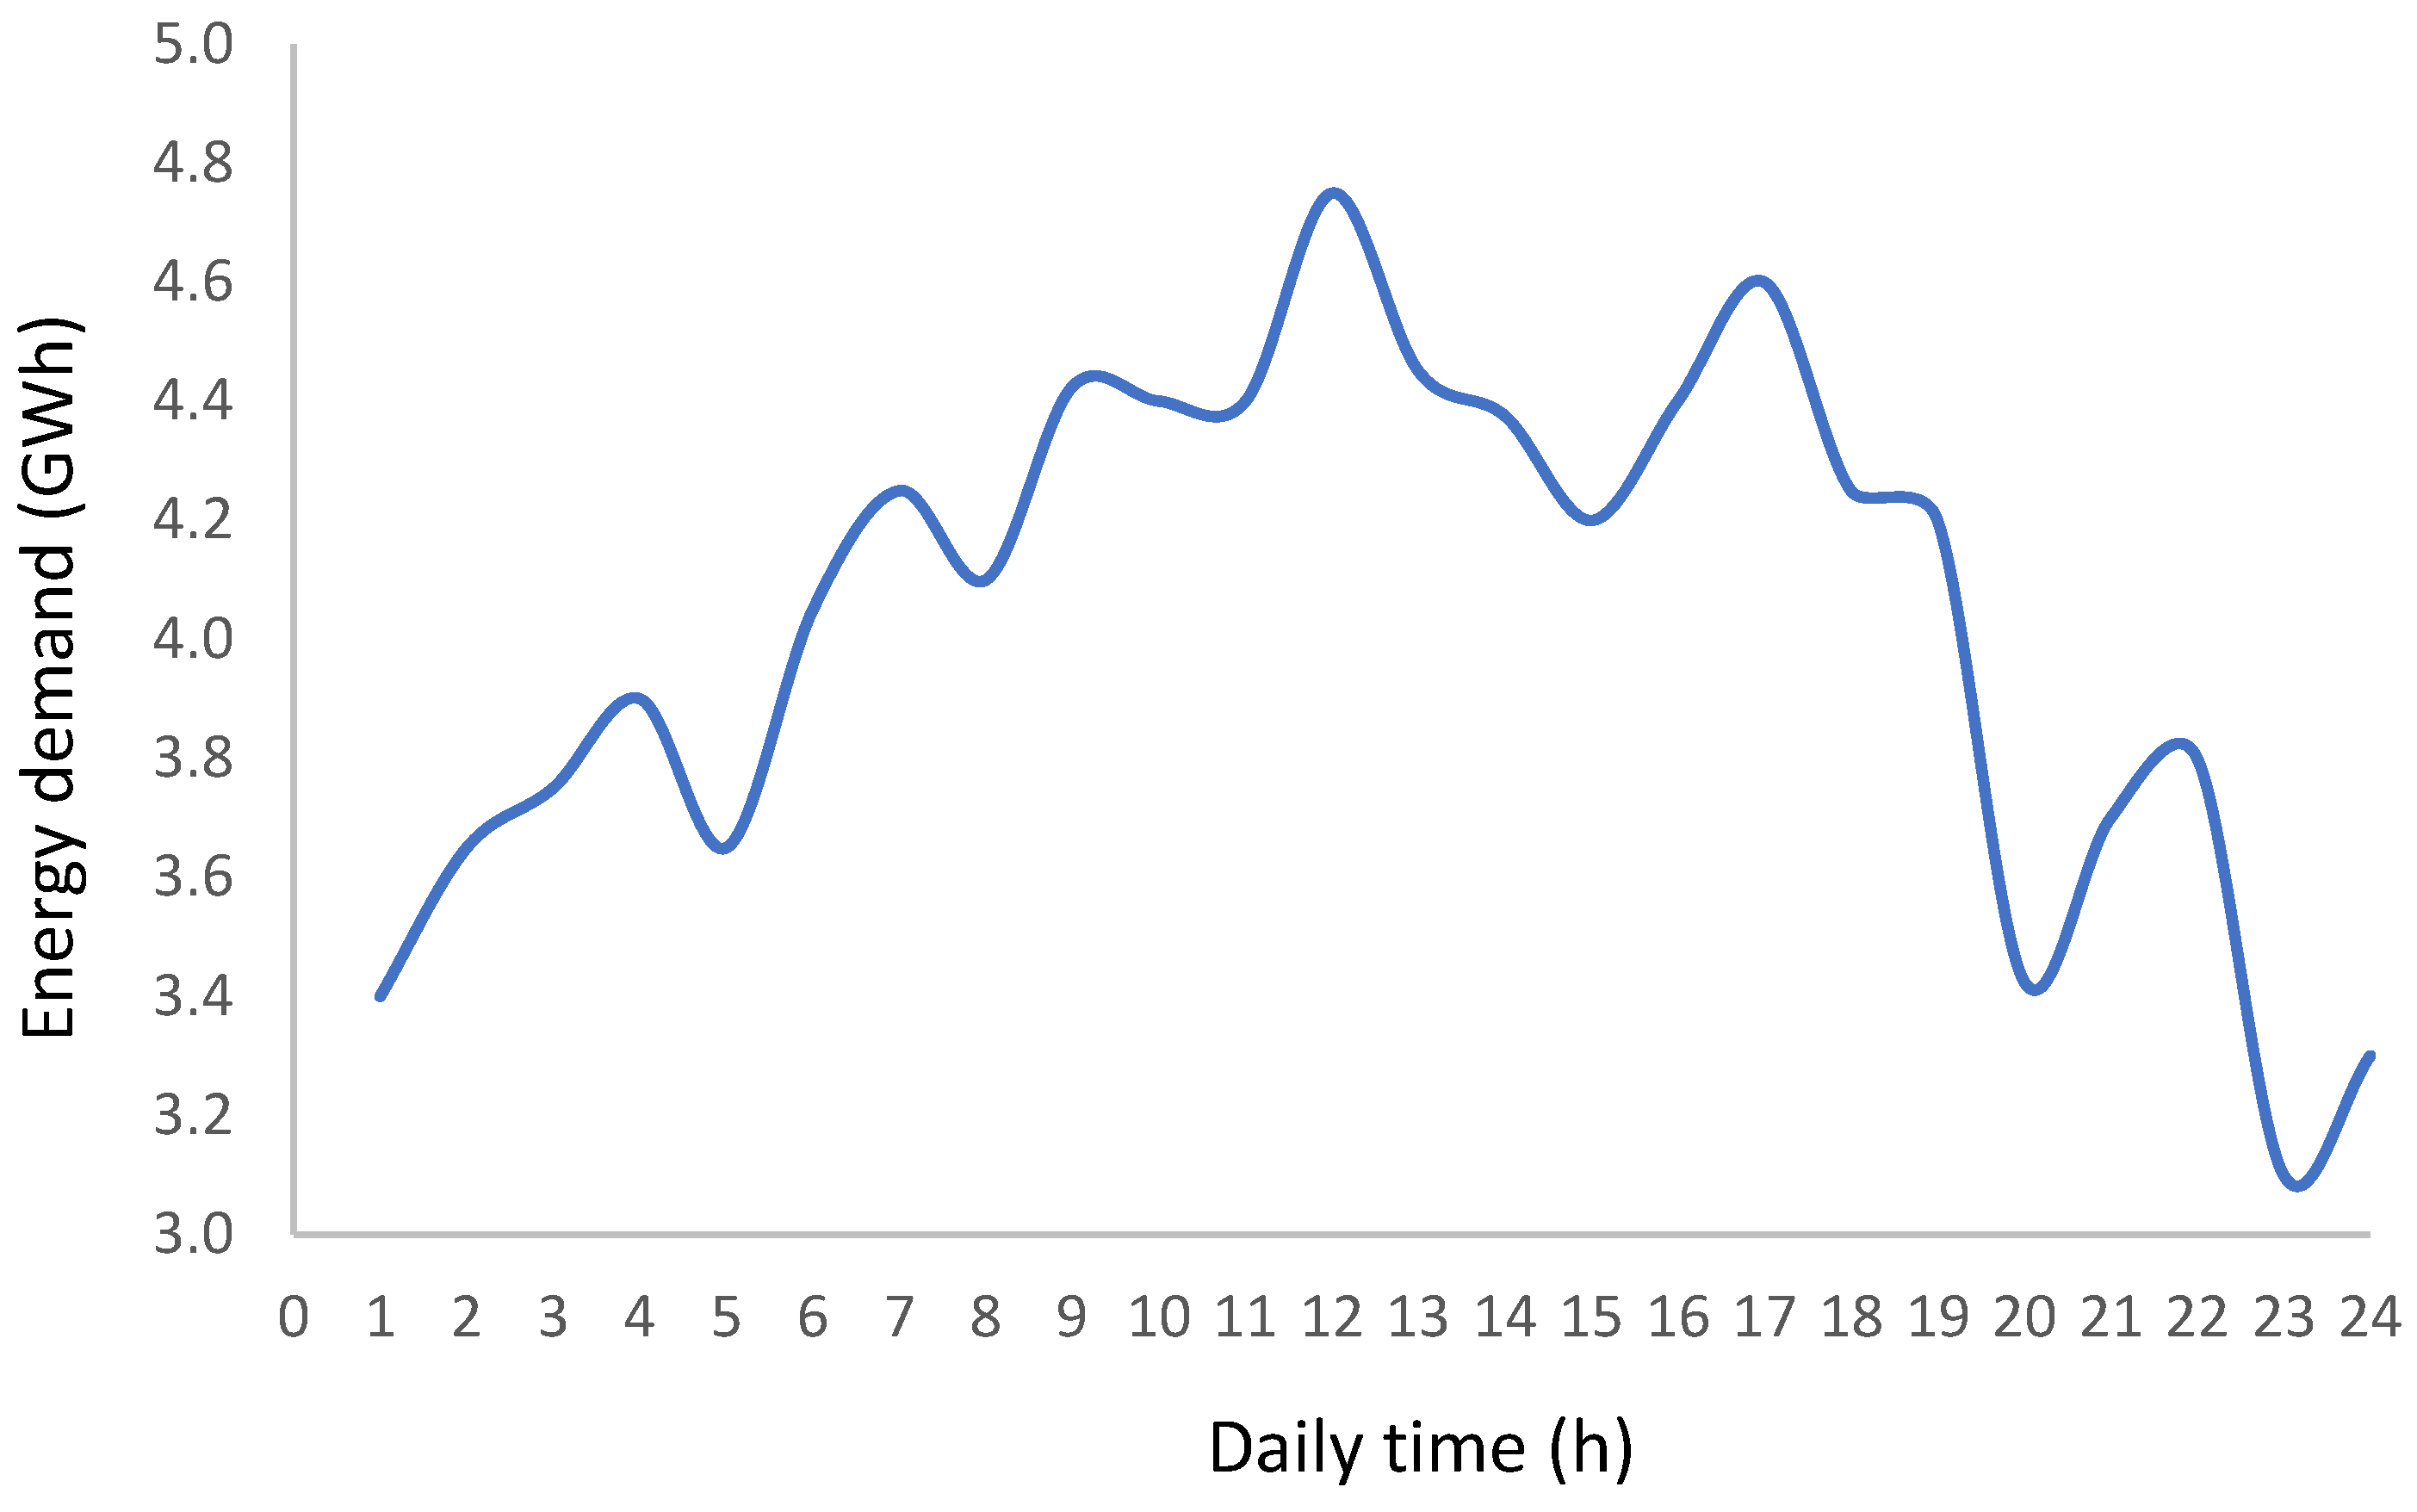
We have selected an average value of power generation of 4.025 GWh that remains constant over the entire day. The energy demand varies from a minimum 3.1 GWh at 11 pm to a maximum of 4.75 GWh at midday. Energy demand includes all sectors of the society, say residential, commercial, and industrial.
Figure 8 shows the daily hourly distribution of energy demand; the energy balance of the simulation case has been represented in
Figure 1.
7. Battery block capacity
Standardized values of electric battery capacity used by most of the car manufacturers have been used as reference for determining the battery block capacity.
Table 2 shows the most frequent values of battery capacity mounted in electric vehicles by car manufacturers.
The batteries have grouped according to five different segments, A to E, and the battery capacity has been averaged for the selected electric vehicle models; the resulting value of the averaging process is indicated in
Table 3.
It can be noticed that the average values of the battery capacity taken for the simulation and the ones used as reference (
Table 1) match within an accuracy higher than 96%.
Since more than a single vehicle of each energy capacity category is involved, it is required to know the percentage of vehicles for every category, thus we can obtain the global energy capacity of the automobile electric fleet. The estimated percentage distribution is shown in
Table 4. The values shown in
Table 4 depend on the social structure of the society used a reference for the analysis, if the social structure changes the percentage distribution does as well accordingly.
8. Availability of capacity exchange
Depending on the use of the electric vehicle the availability of the battery for the energy exchange with the grid varies. Once again, it is impossible to reproduce all electric vehicle owner’s behavior, therefore, a simple approach to realistic situation is required; this approach classifies the owners’ behavior in different categories according to owners’ habits. We have considered three main categories, people that moves daily from home to work and stay at home the time they are not working, people that make a detour at the exit of the working time before coming back home and stay at home the rest of the day, and people that go out at night after a working day, but they do not make any detour on the way back home.
Table 5 shows the proposed distribution of availability time for the V2G system fir the three considered categories and for different working sectors.
Additionally, we must take into account the percentage distribution of people related to the type of working, since it influences the availability of energy exchange through the time the electric vehicle is stopped. The distribution is shown in
Table 6.
9. SIMULATION MODEL
The simulation model considers the following parameters:
Percentage of people associated to any of the proposed type of work (
Table 5)
Percentage of people associated to any of the proposed daily habits for every type of work (
Table 5)
Percentage of every capacity of the batteries (
Table 3)
Percentage distribution of batteries for the electric vehicle fleet (
Table 4)
The simulation has been developed for different number of electric vehicles, corresponding to a variable population, and different percentage of electric vehicles over the entire vehicle fleet.
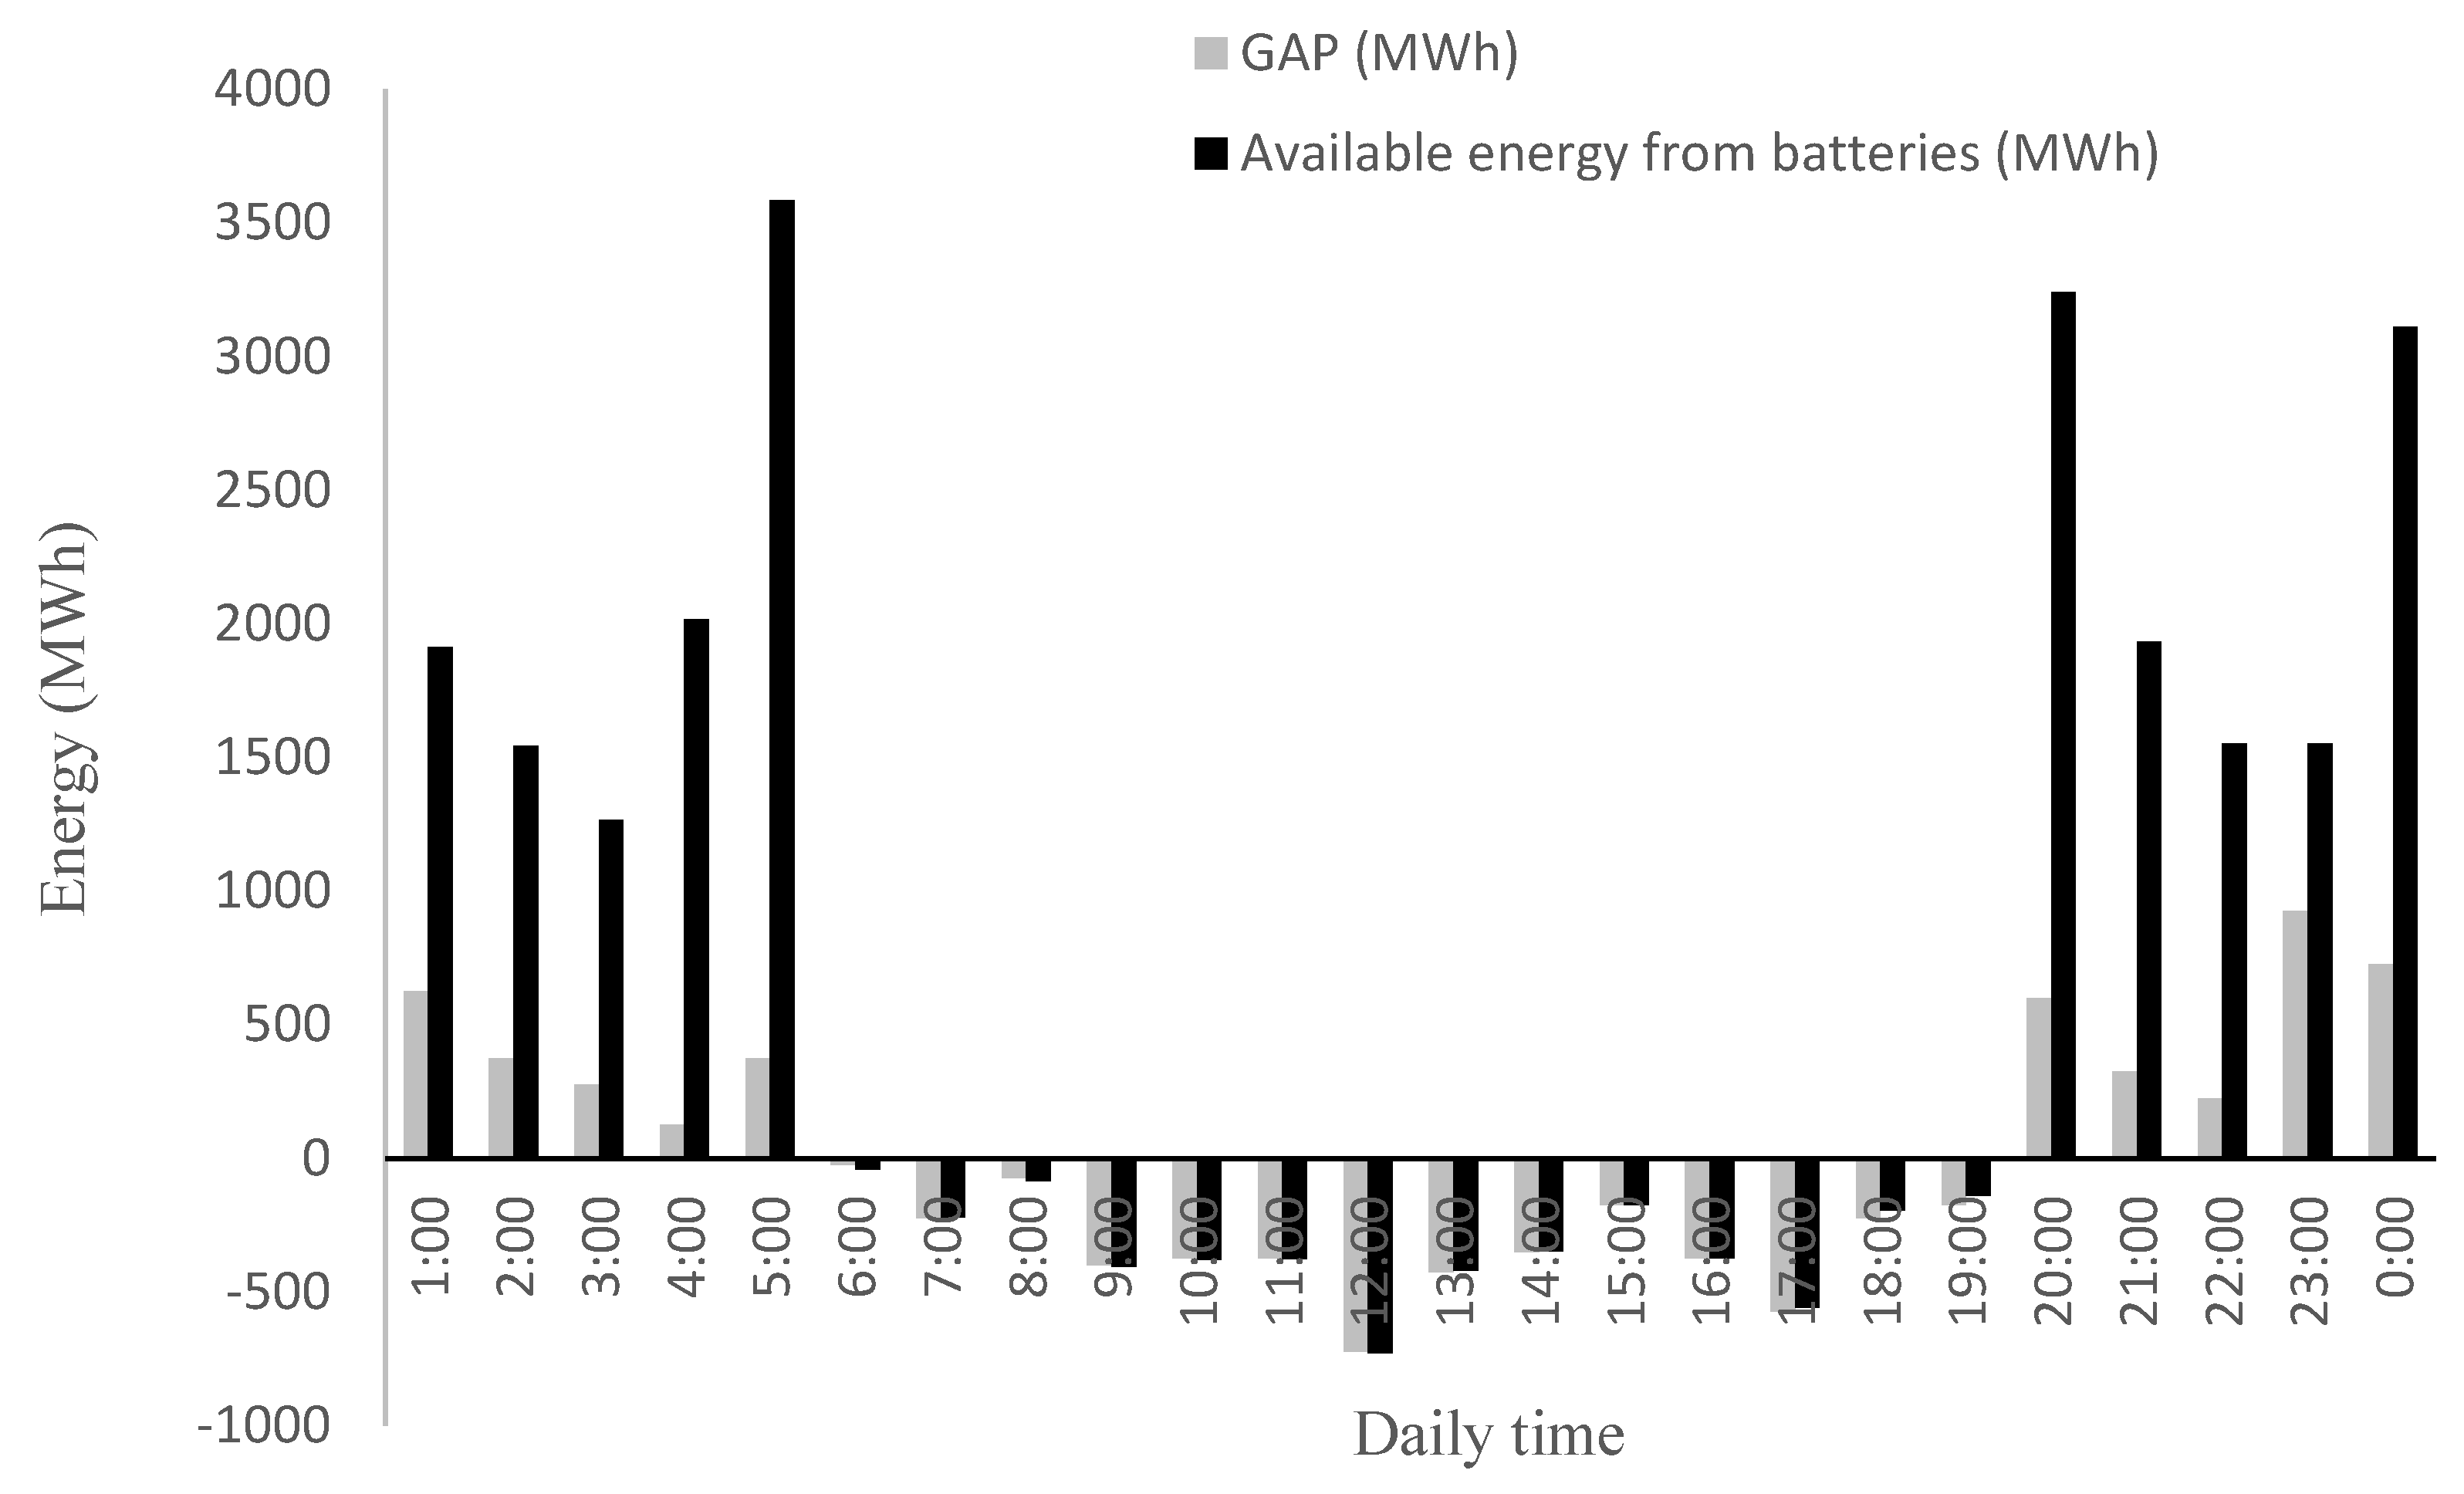
The results of the simulation can be seen in
Figure 10,
Figure 11,
Figure 12 and
Figure 13. The simulation process has been carried out for a large population of about 55 million people.
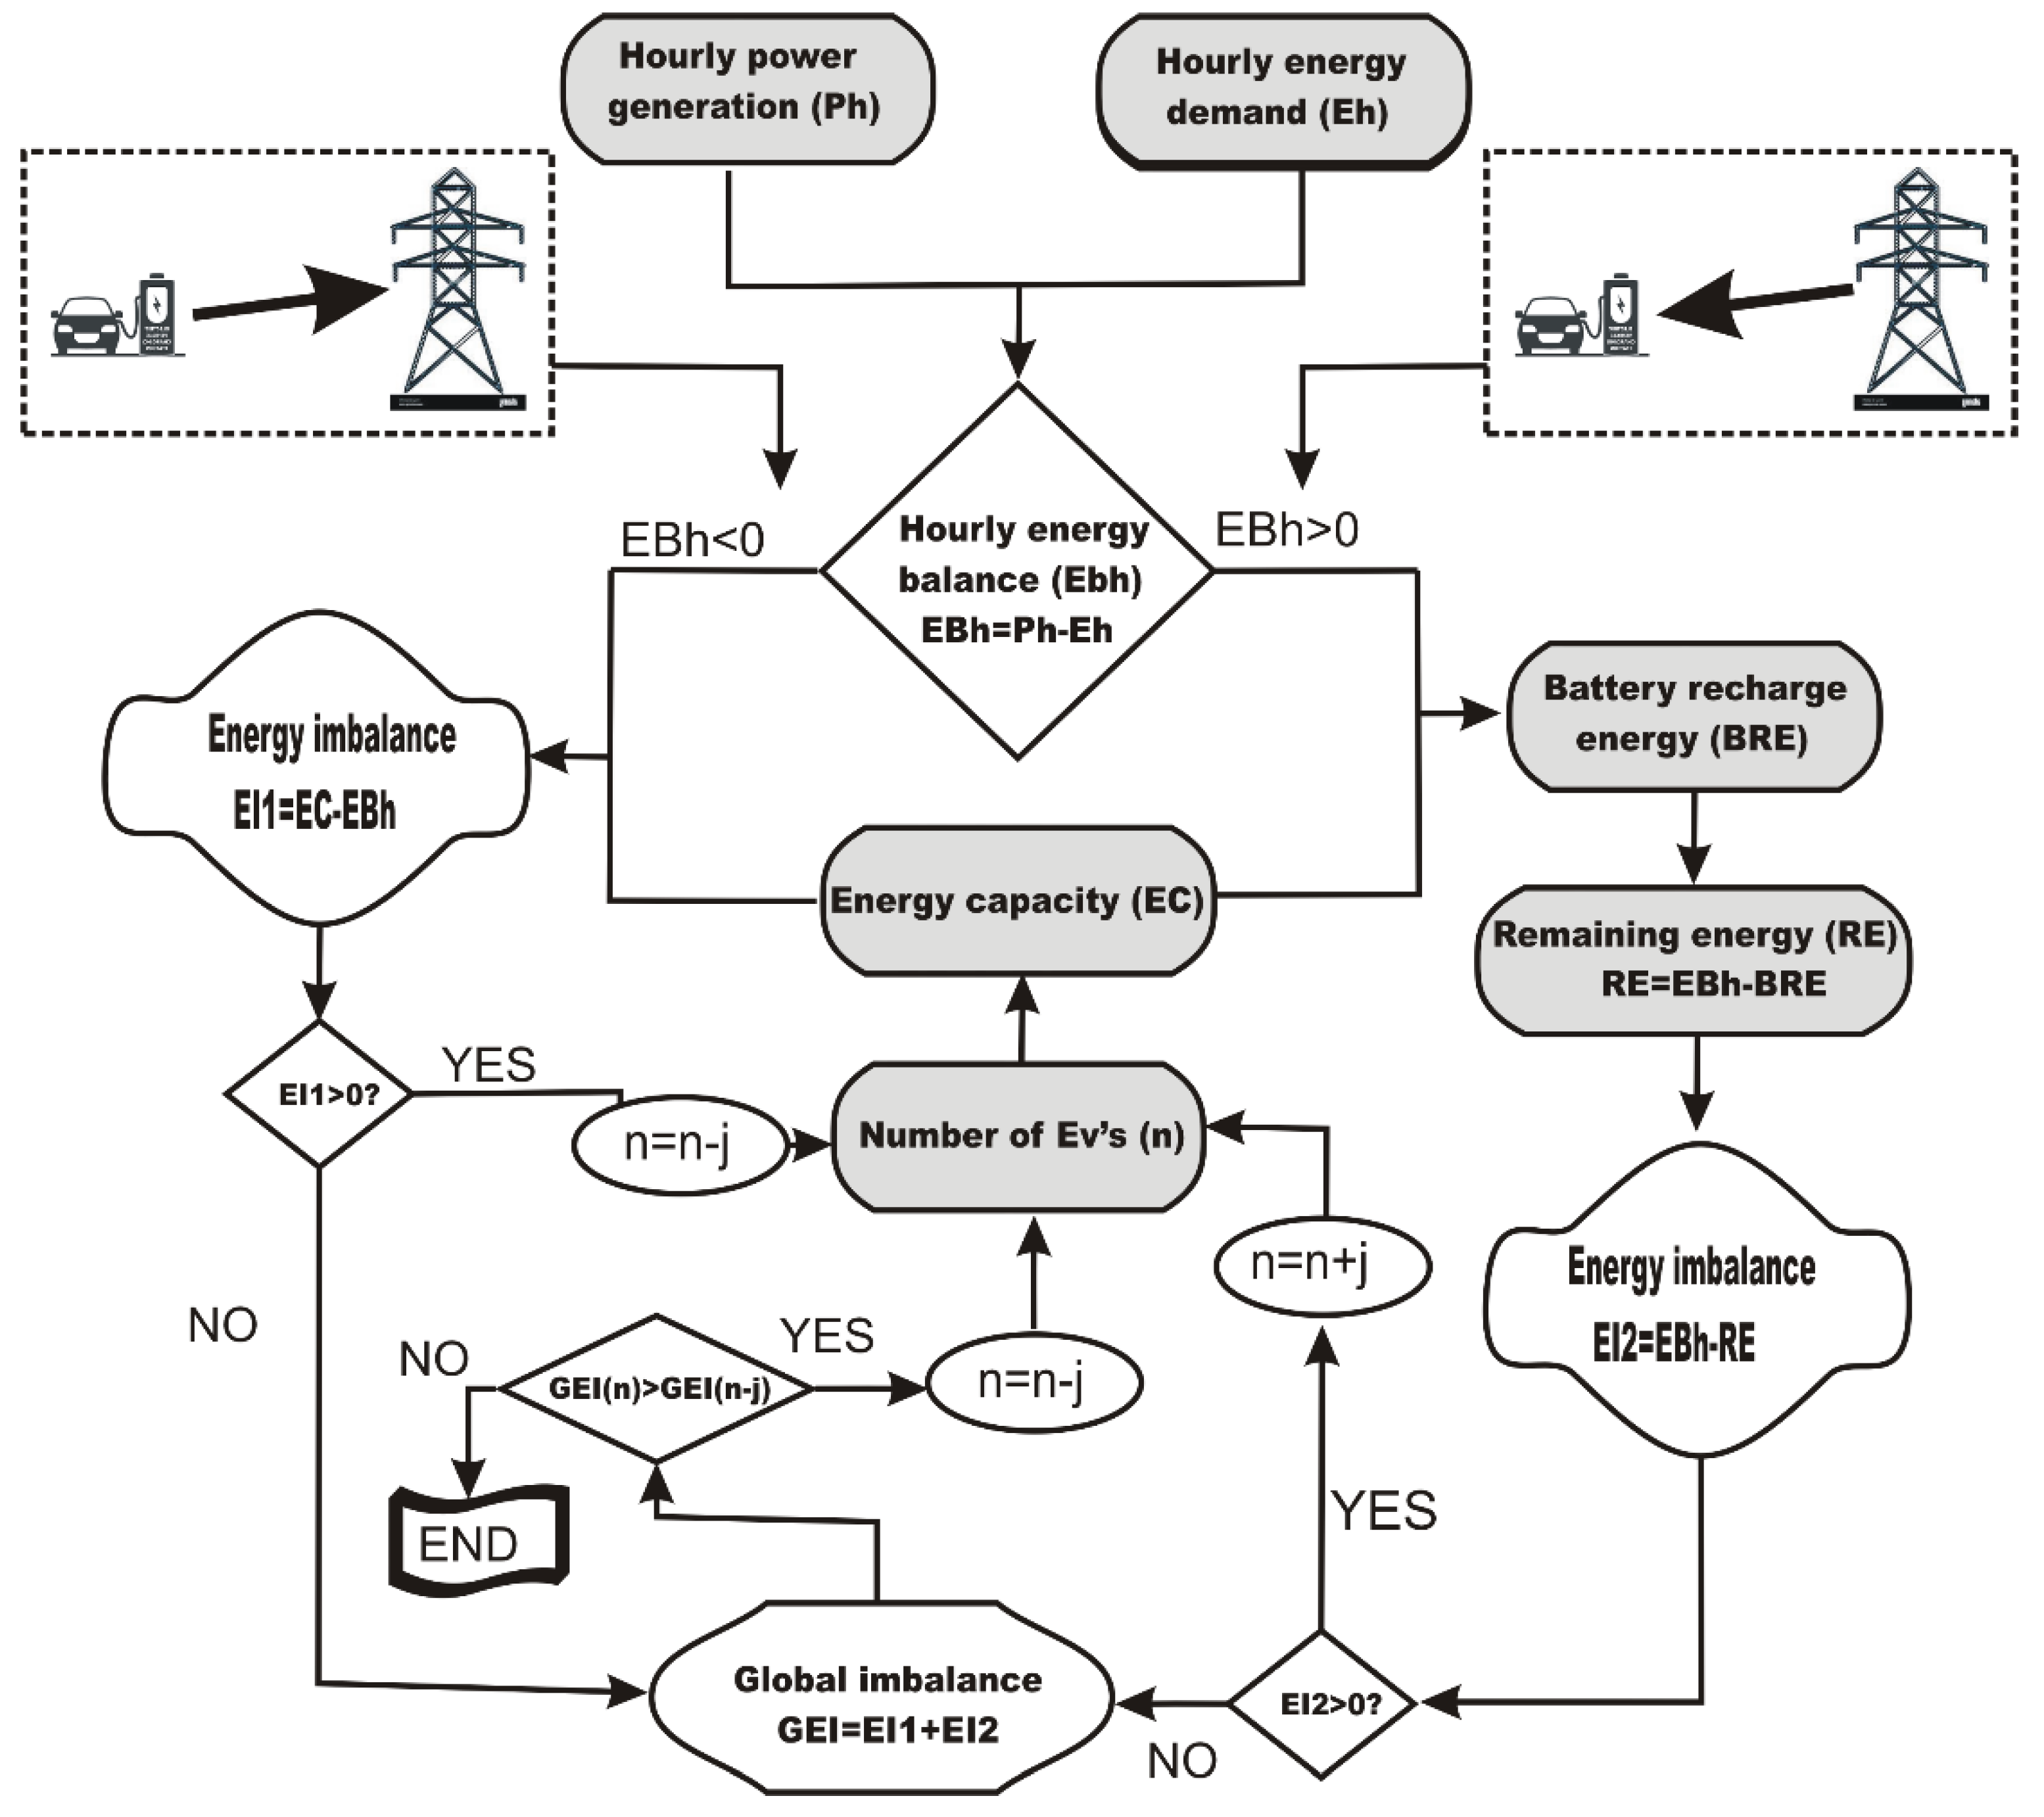
To make easier the comprehension of the simulation process a flowchart that defines the followed protocol is presented.
The structure that appears in the flowchart shows the calculation of the energy imbalance for the case there is an excess or default of power generation as for the energy demand. The amount of the imbalance is compared to the battery block energy capacity provided by the electric vehicle fleet. If the result is positive, the required energy to recharge the battery block is deduced from the balance; otherwise, it remains unchanged.
Once the imbalance is calculated, the program asks if the results is positive or negative; in the former case, the number of electric vehicles is reduced or increased, depending on the result of the hourly energy balance, and the loop is run again. In case the imbalance results negative, the global imbalance is calculated. Global imbalance is the result of the addition of the two partial imbalances from the positive and negative hourly energy balance. The result of the global imbalance is compared to the one from the previous step of the loop; if the comparison results positive the number of electric vehicles is changed and the loop continues, if the result of the comparison is negative the program ends and the number of vehicles is considered the optimum that minimizes the global imbalance.
Figure 9.
Flowchart of the simulation process.
Figure 9.
Flowchart of the simulation process.
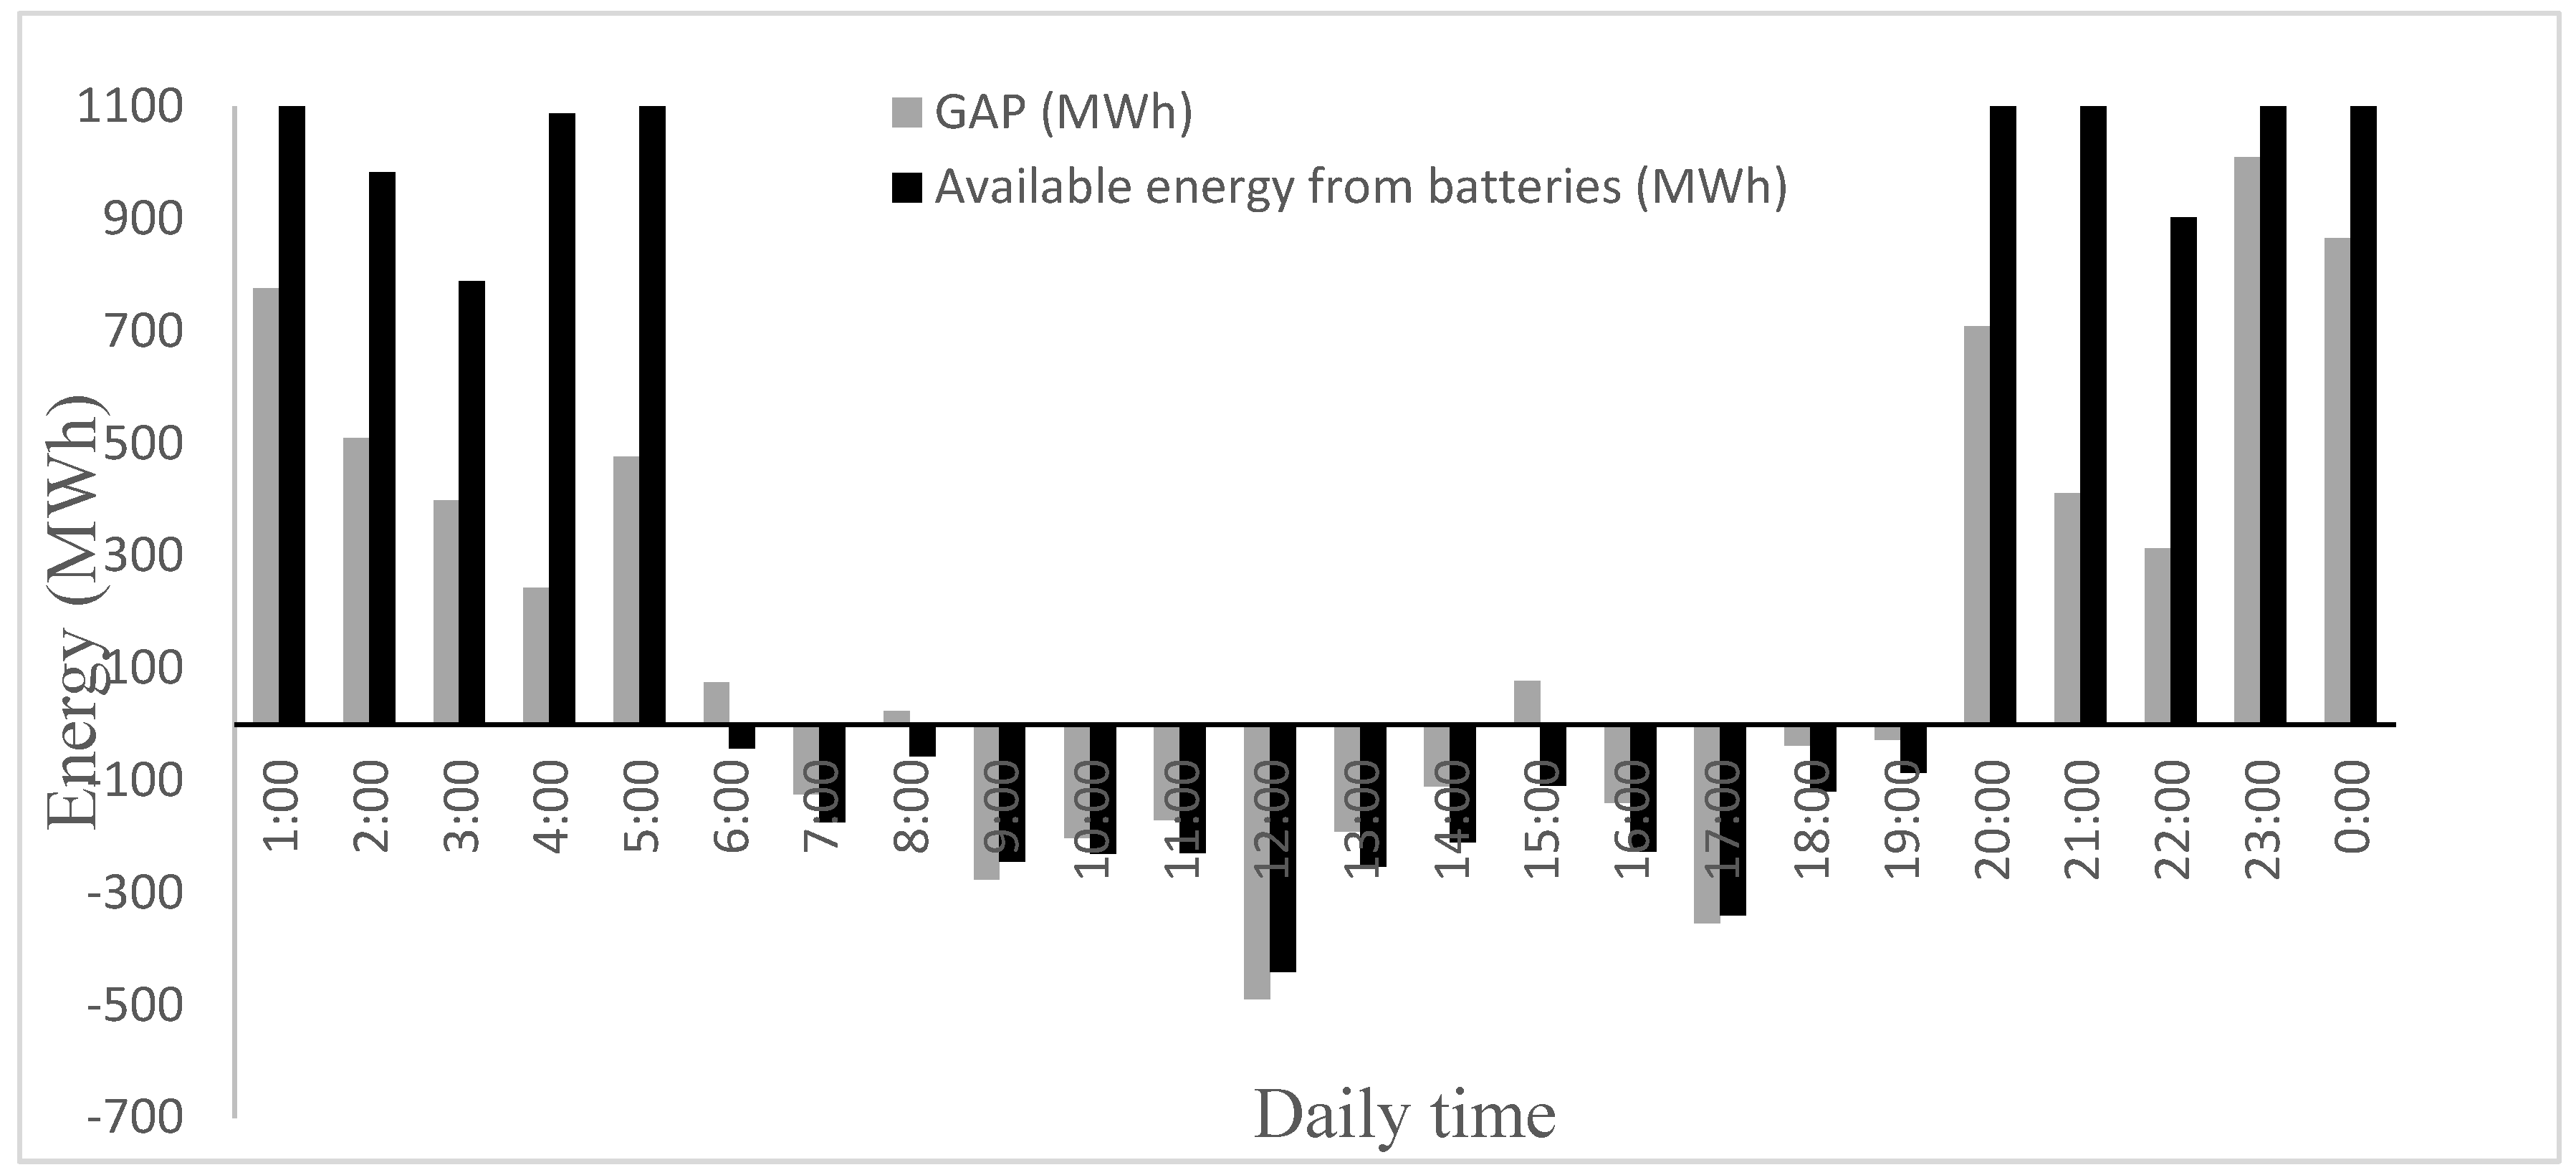
Simulation 1: High ratio of electric vehicle fleet
Figure 10.
Available energy and energy gap for high ratio of electric vehicle fleet.
Figure 10.
Available energy and energy gap for high ratio of electric vehicle fleet.
Figure 10 shows the results of the simulation for a large population and high proportion of electric vehicles over the entire vehicle fleet. In this case the number of batteries used for the simulation has been 464000, what corresponds to an electric vehicle ratio of 1:3 and a vehicle to people ratio of 1:4.
It can be noticed that there are two differentiated situations for the two considered periods of the day; during daytime, from 6 h (6 am) to 20 h (8 pm), the energy unbalance (gap) between power generation and energy demand is fully compensated by the battery block of the electric vehicle fleet. Nevertheless, during nighttime, from 20 h (8 pm) to 6 h (6 am), there is an excess of available energy from the batteries, what indicates the number of batteries is oversized.
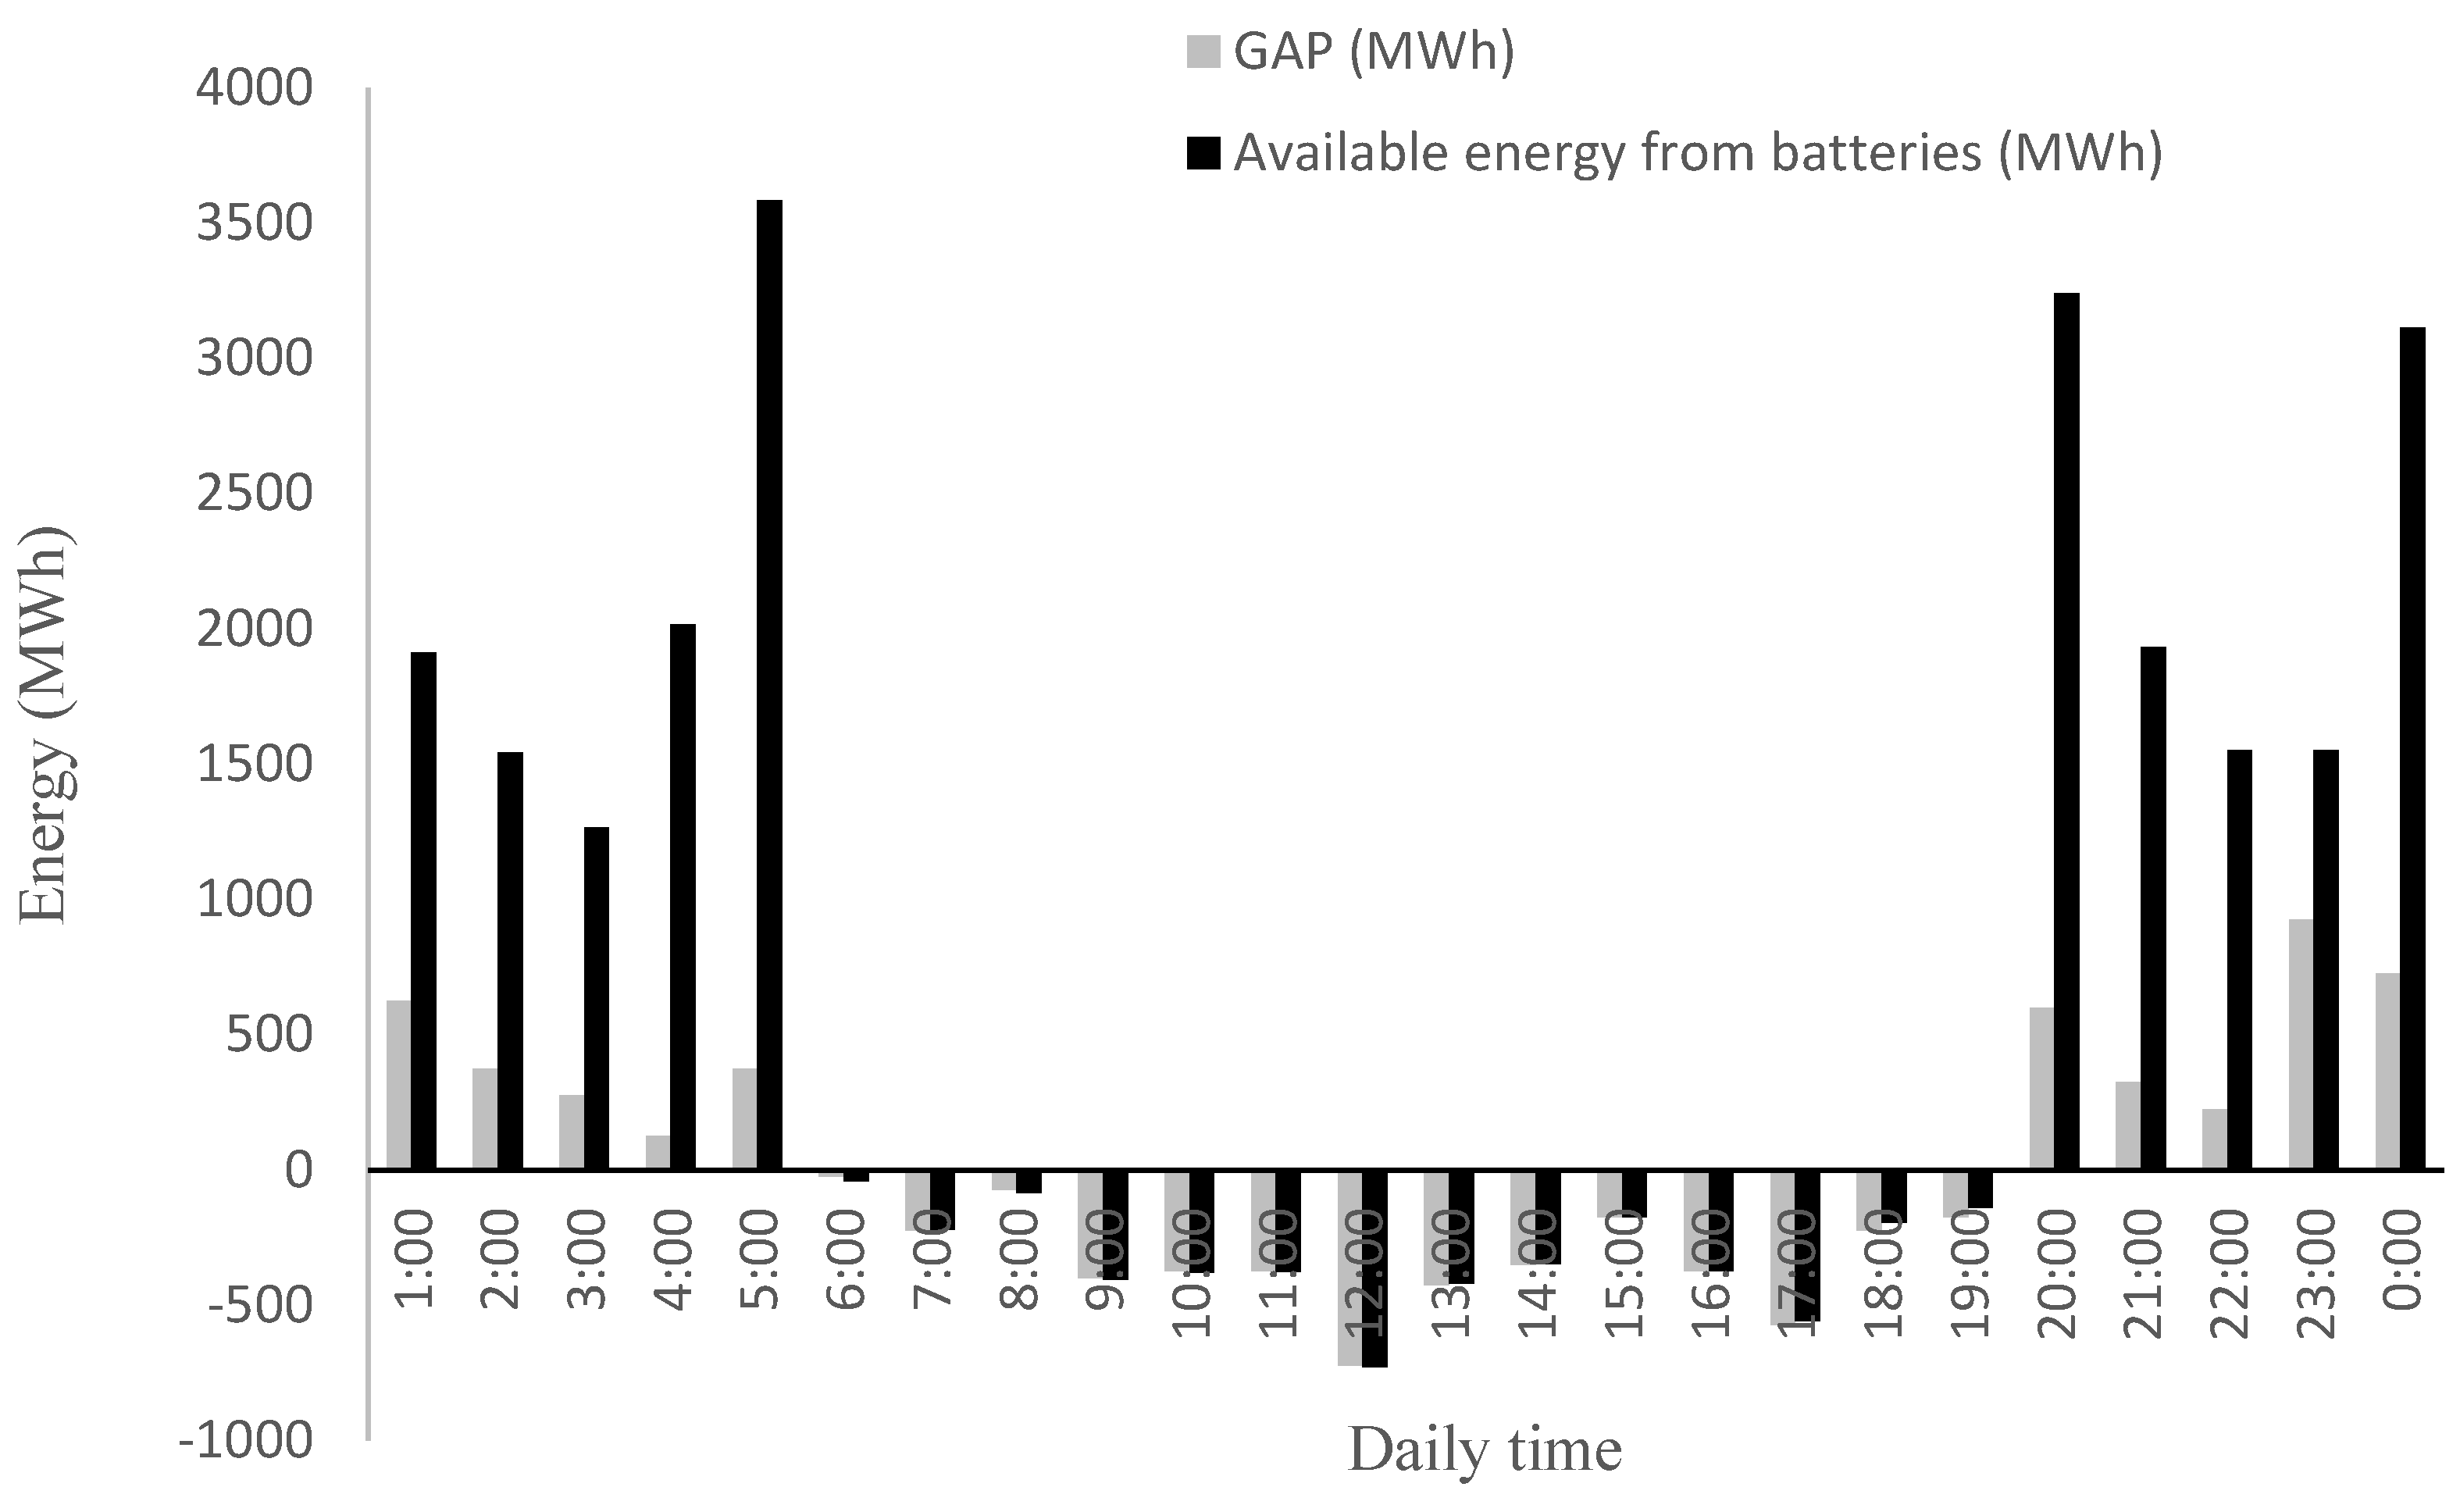
Simulation 2: Low ratio of electric vehicle fleet
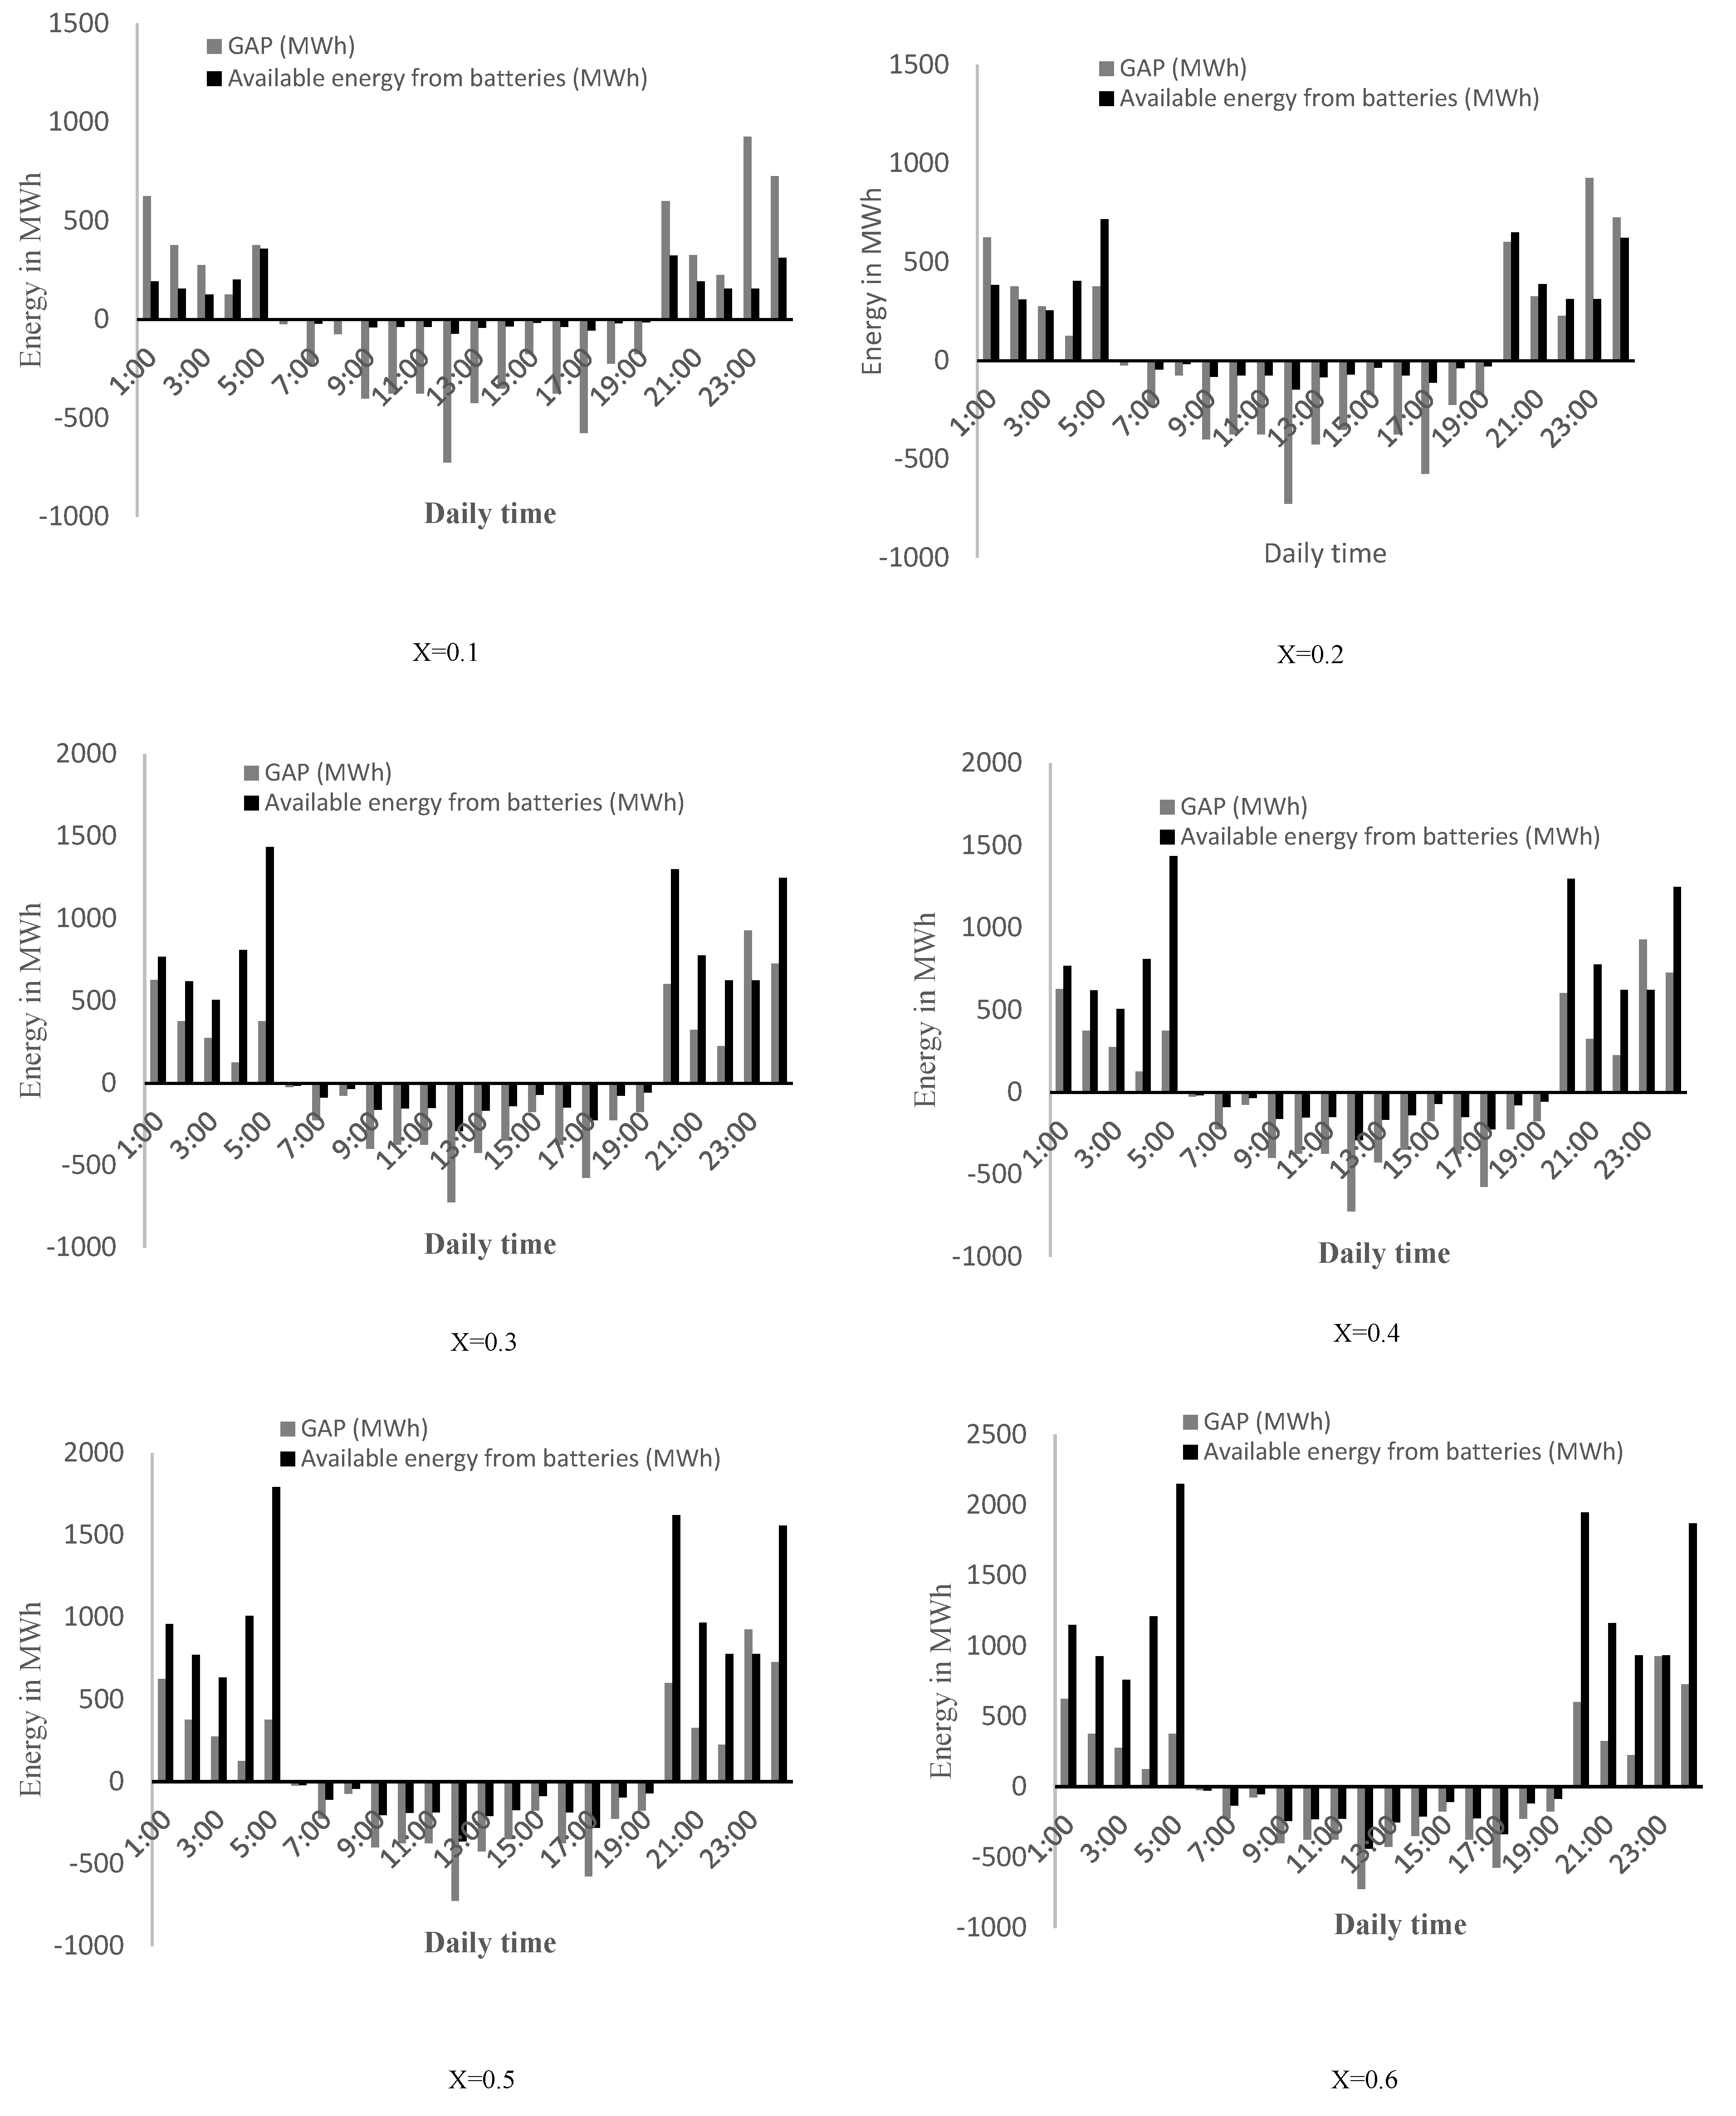
The simulation number 2 maintains the number of people and the vehicle to people ratio but reduces the electric vehicle ratio to only 7% instead of 33% like in the previous simulation. The results of this new simulation can be seen in
Figure 11.
The analysis of the results indicates that the number of batteries has been selected correctly, since at nighttime the available energy and the gap match at all times; however, the energy unbalance is not compensated at daytime, a consequence of the reduction in the number of batteries.
Figure 11.
Available energy and energy gap for low ratio of electric vehicle fleet.
Figure 11.
Available energy and energy gap for low ratio of electric vehicle fleet.
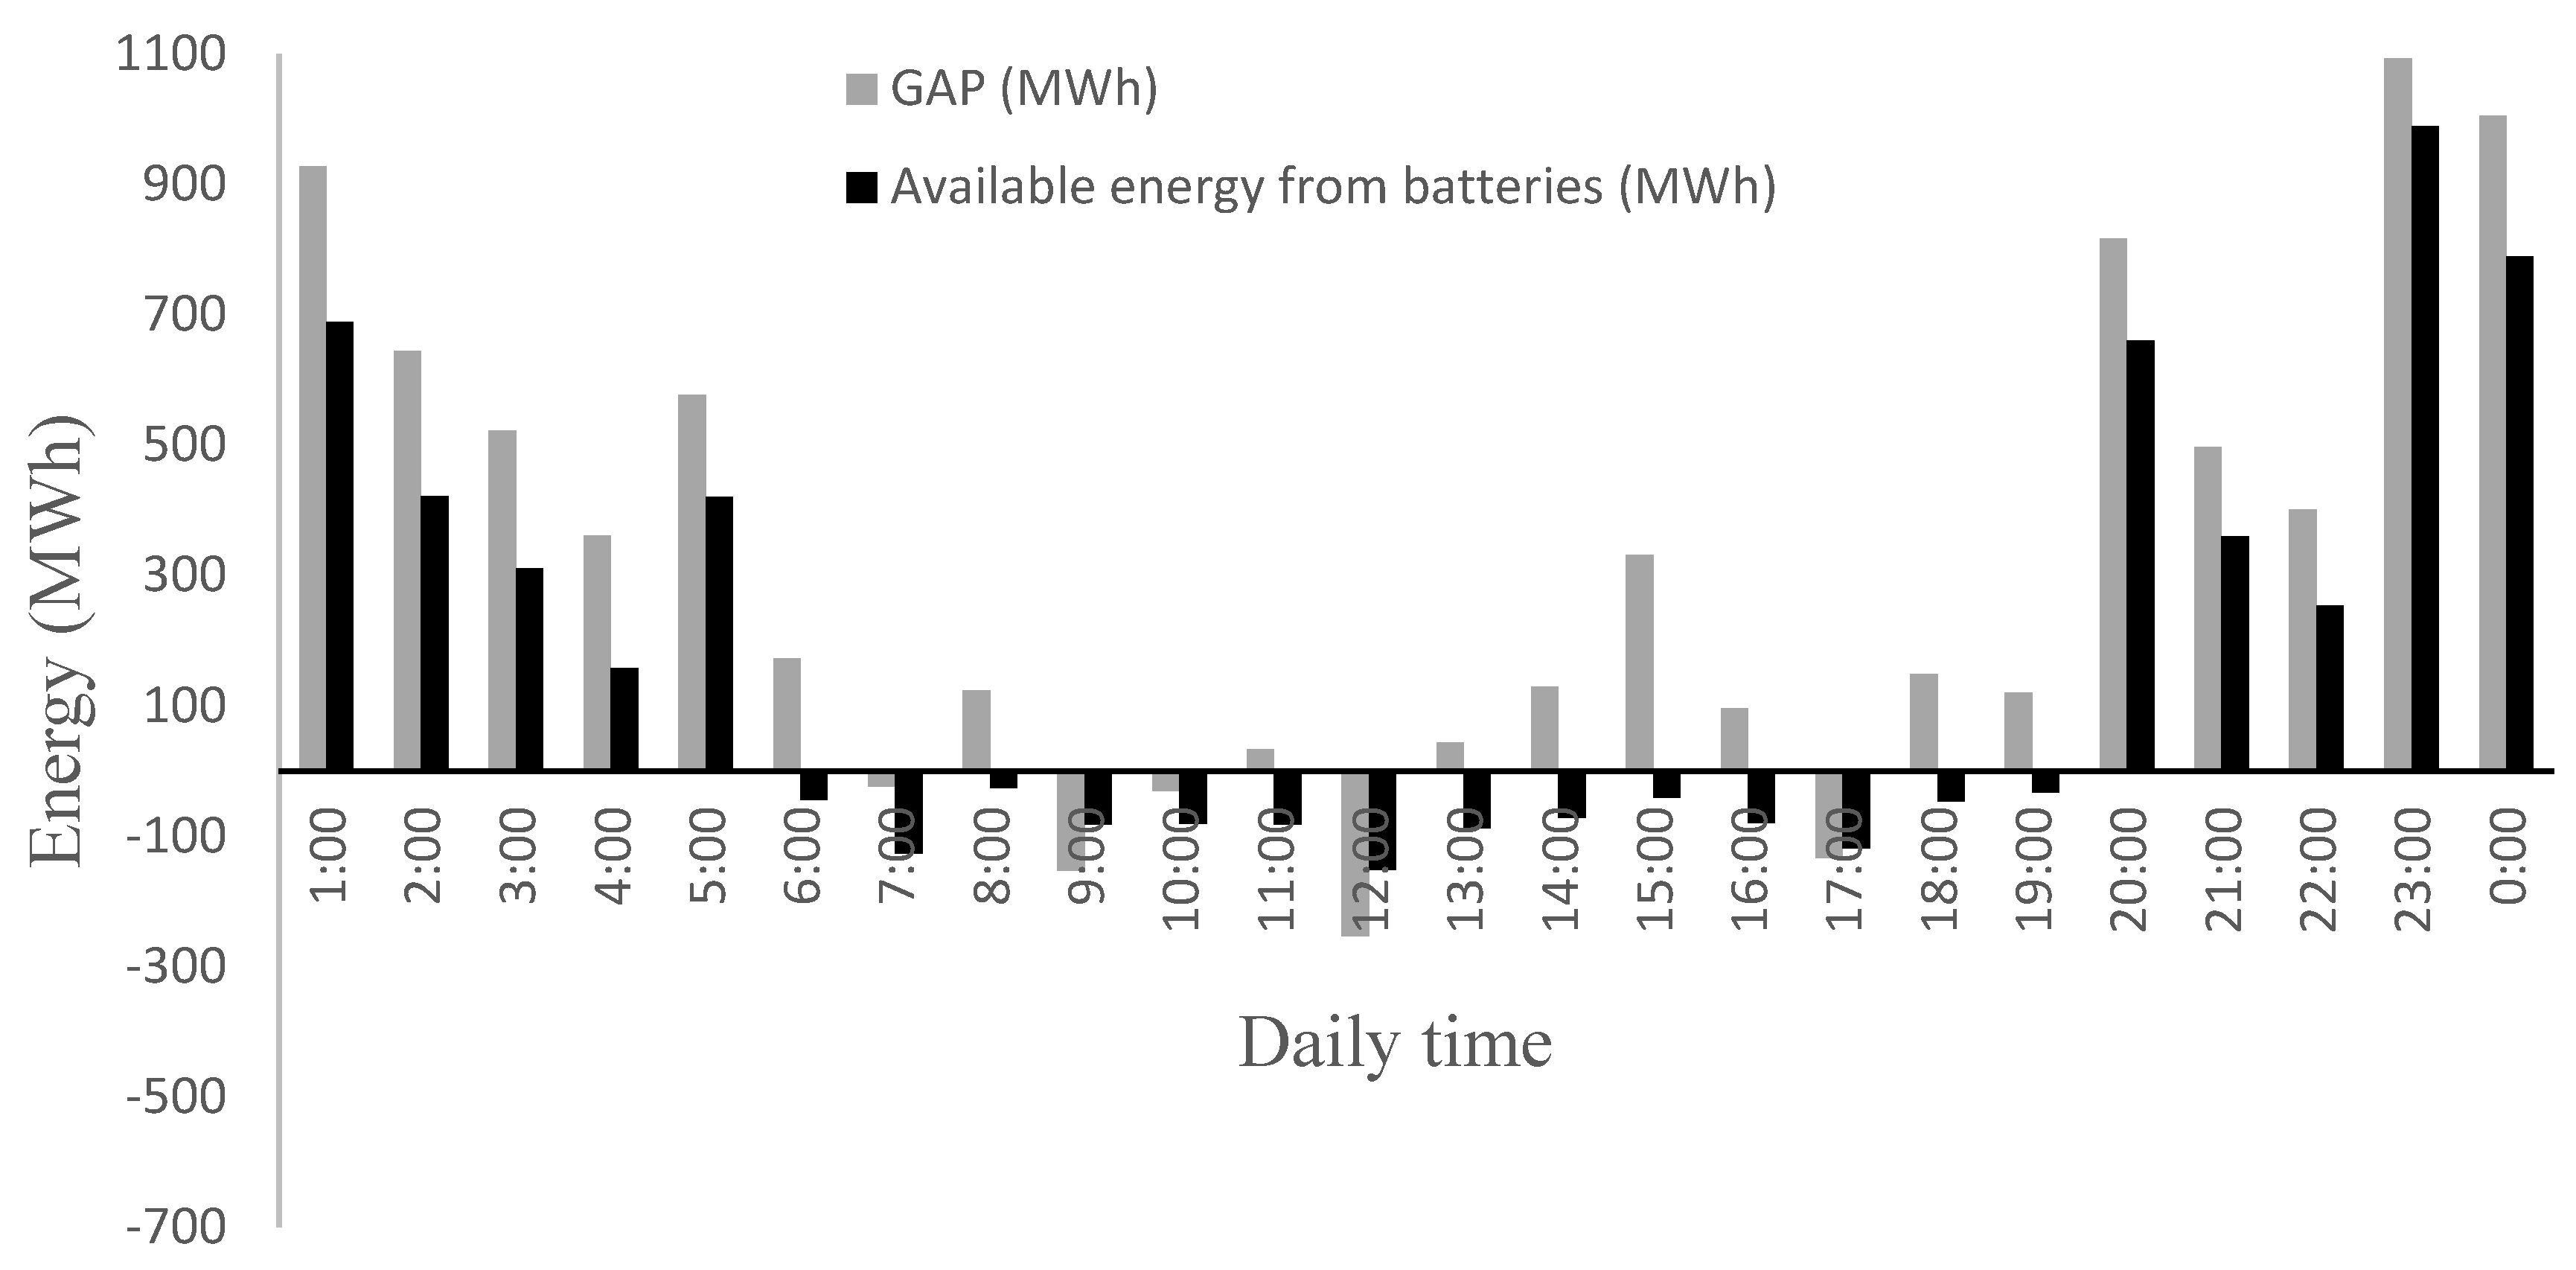
Simulation 3: Medium ratio of electric vehicle fleet
Since the high ratio of electric vehicle fleet requires an oversized number of batteries to compensate the energy unbalance during daytime, and the low ratio provokes an under-compensation effect of the energy unbalance when the battery block is correctly sized, we have tried with an intermediate configuration adopting a medium ratio of the electric vehicle fleet. In this case (
Figure 12), there is not hourly compensation during daytime, with hourly intervals where there is an excess of power generation while in other the opposite situation occurs with negative unbalance. Although the global balance over the daytime period results in a null value, the available energy from the battery block does not compensate for the positive or negative energy unbalance, what indicates the battery block is undersized because the available energy from the batteries is always below the energy balance, be it positive or negative.
Figure 12.
Available energy and energy gap for medium ratio of electric vehicle fleet.
Figure 12.
Available energy and energy gap for medium ratio of electric vehicle fleet.
During nighttime the situation is quite similar with the available energy from the battery block below the energy gap, thus indicating the number of batteries is undersized.
Simulation 4: Medium-high ratio of electric vehicle fleet
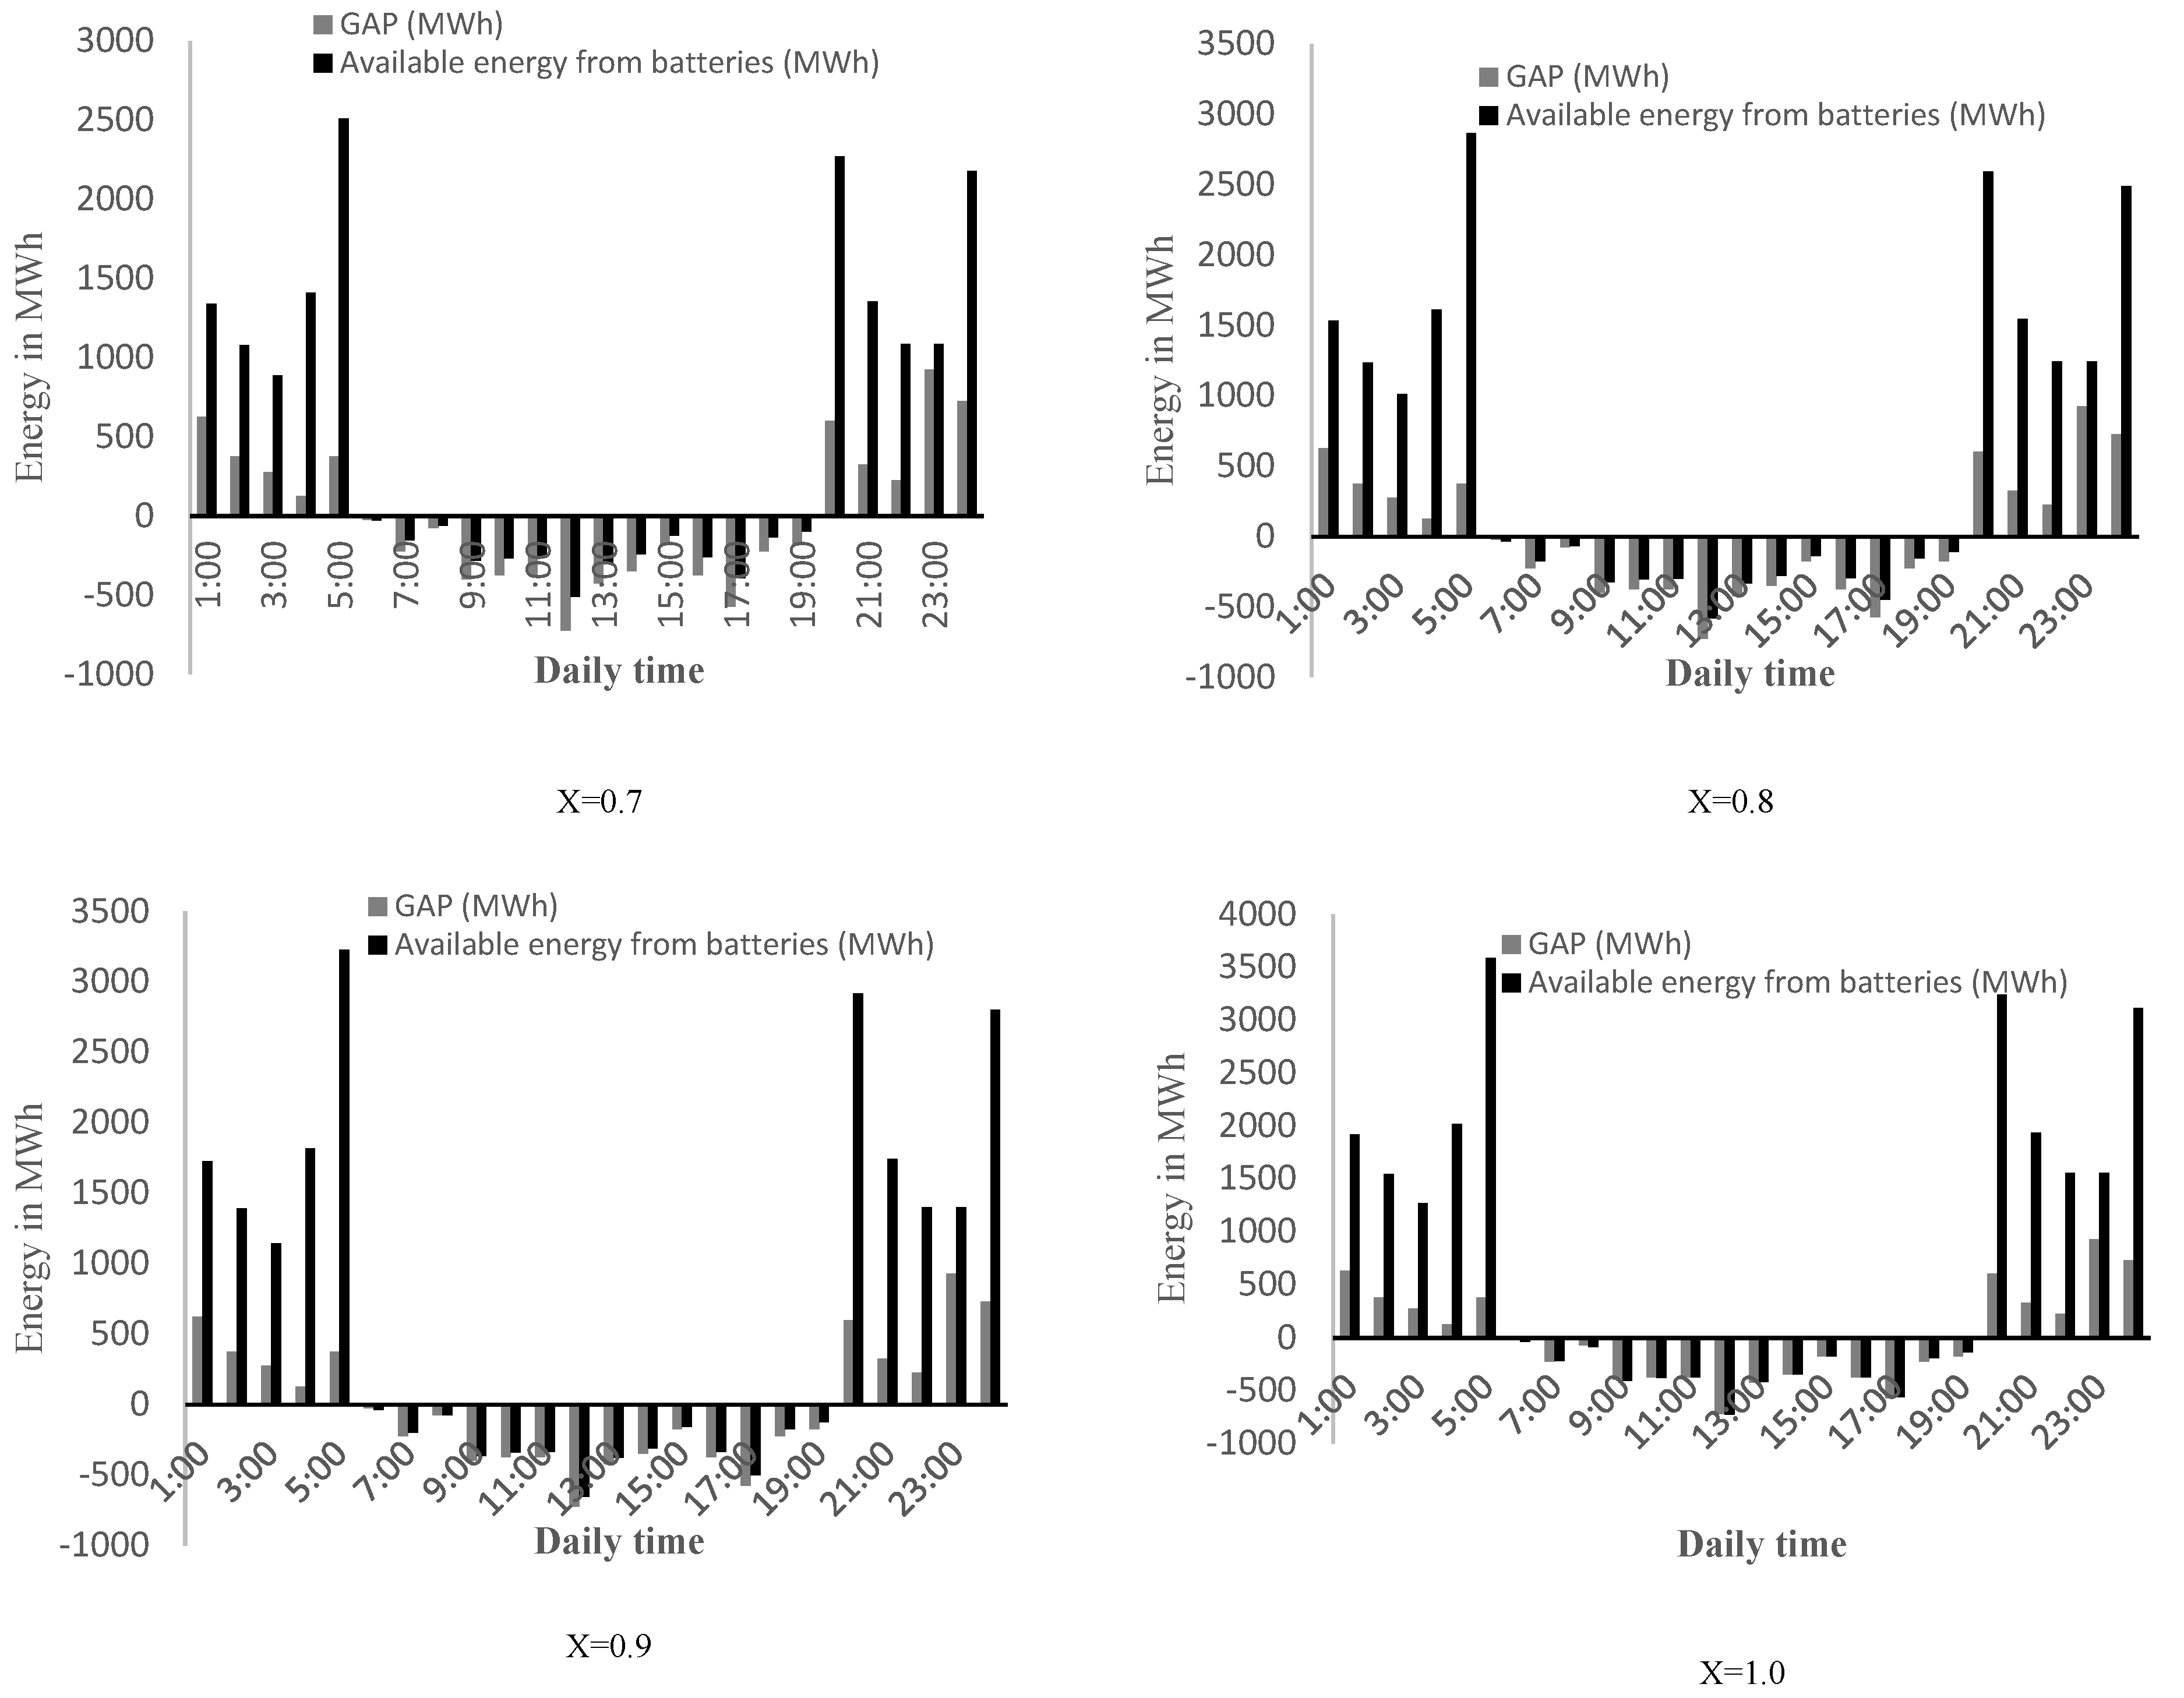
A second approach to the optimum configuration has been carried out considering an intermediate value of the number of batteries between the medium and high ratio of electric vehicle fleet. The results of this last simulation have been presented in
Figure 13.
Figure 13.
Available energy and energy gap for medium-high ratio of electric vehicle fleet.
Figure 13.
Available energy and energy gap for medium-high ratio of electric vehicle fleet.
Analyzing the results of the simulation we observe that the energy gap and the available energy from batteries matches for all hours during nighttime as in the case of the simulation for high ratio of electric vehicle fleet. On the other hand, during daytime the energy gap is lower than the available energy from batteries, what indicates the number of batteries is oversize; however, although positive, the difference between the gap and the available energy is lower than in the case of high ratio, a sign that the new configuration optimizes the number of batteries as for the energy balance is concerned.
Additional simulations
To optimize the configuration of the battery block system, we have used intermediate values of the ratio of electric vehicle fleet between the high and medium ratio; the new value of the ratio is given by:
Where
rm and
rh are the ratio of electric vehicle fleet for the medium and high values, and
x is the fraction of the simulation, which varies in 0.1 steps.
Figure 14.
Simulation of the daily evolution of the energy balance for different ratios of the electric vehicle fleet.
Figure 14.
Simulation of the daily evolution of the energy balance for different ratios of the electric vehicle fleet.
It can be observed from the analysis of the different simulations that the energy balance during the daytime period (7 am to 7 pm) improves with the ratio factor, r, with an optimum situation for r=1.0. Nevertheless, during nighttime (7 pm to 7 am), as the ratio factor increases the available energy from the batteries separate from the energy balance gap, what means the electric vehicle fleet is more and more oversized. Therefore, an intermediate configuration where the overall daily minimum difference between available energy from the batteries and energy balance gap occurs should be considered the optimum configuration.
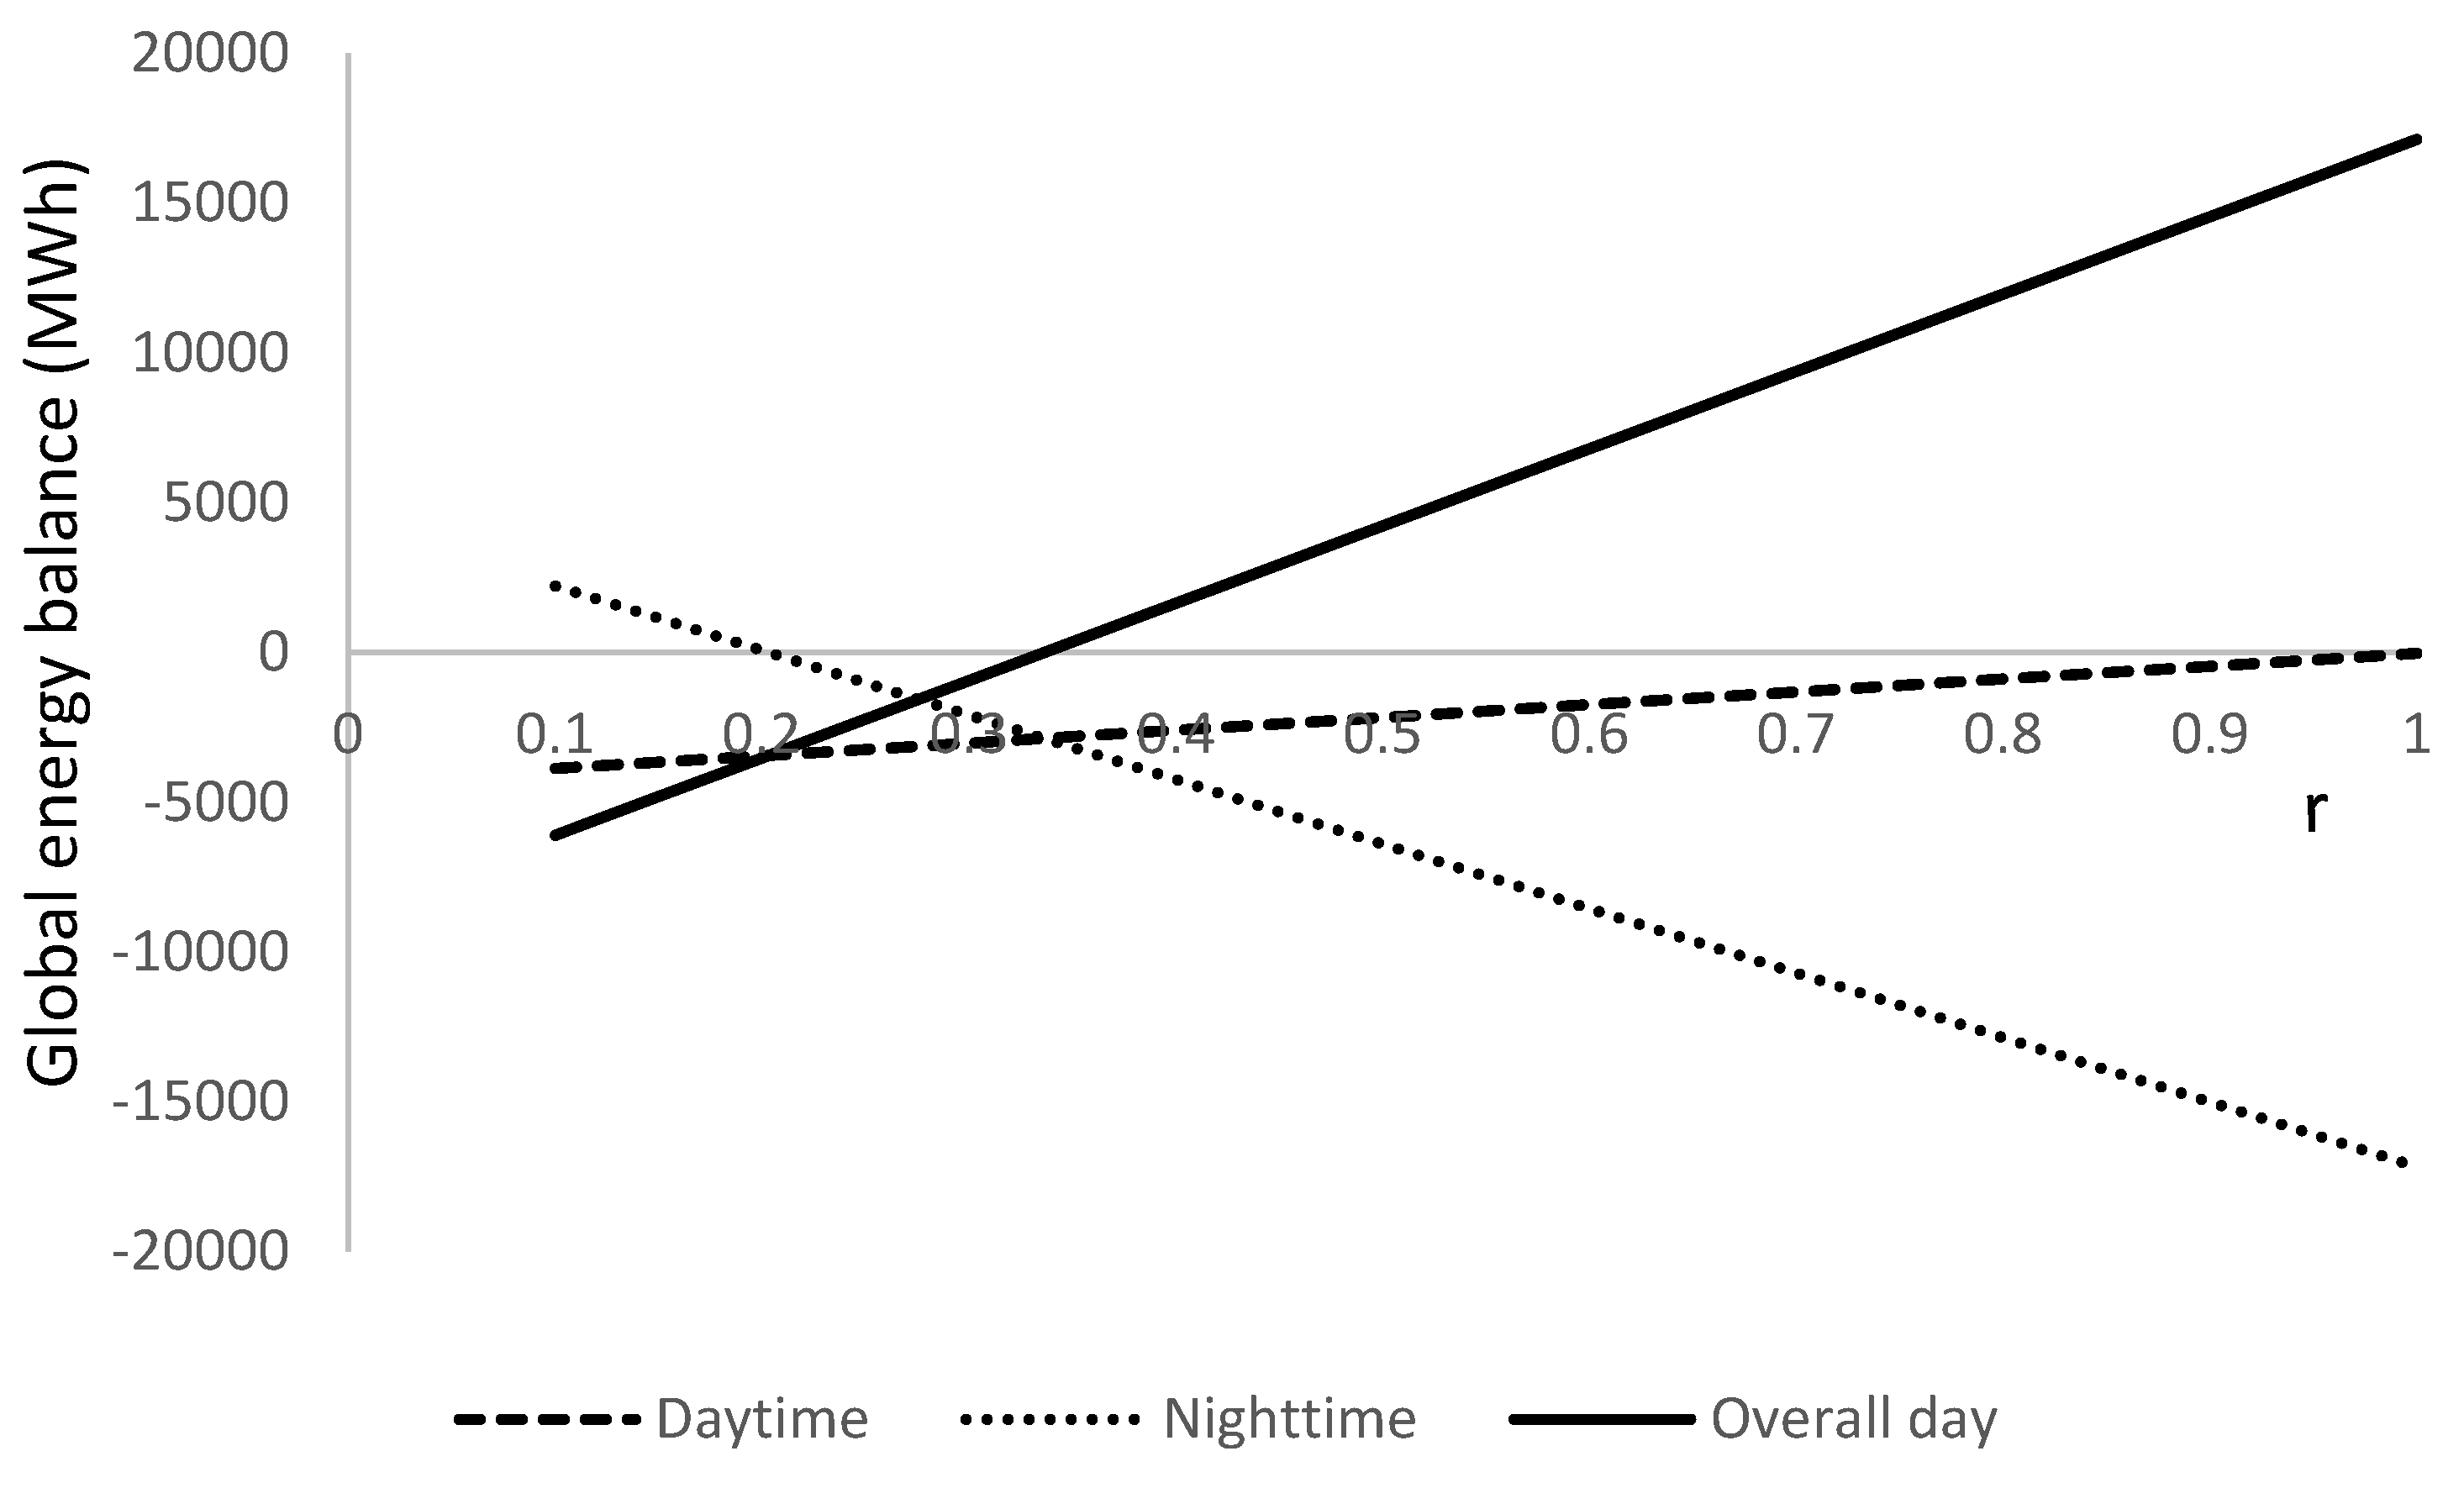
Representing the evolution of the difference between the energy balance gap and the available energy from the batteries for the daytime, nighttime and overall day period, we obtain (
Figure 15):
Analyzing the different cases, we notice the optimum configuration corresponds to a ratio of r=0.34
The so obtained r-value shows there is not possible to cover up all energy balance requirements, since the electric vehicles require energy to move; if we try to cover the energy unbalance during daytime the number of electric vehicles is oversized as reflects the simulation case for r=1.0. On the contrary, if we try to match available energy from batteries and energy unbalance (gap) during nighttime, the energy unbalance during daytime increases, as it can be seen for the simulation case of r=0.2. The intermediate value of r=0.34 provides an optimum solution where there is no null energy balance during daytime neither at nighttime, but results in the best overall daily value.
10. Economic analysis
Implementing the proposed system represents a significant investment because of the electric connecting network building. This network requires a broad electric wiring to transport current from grid to vehicle fleet and vice versa, plus a sophisticated control system to manage the current flow back and forth from the grid.
The cost, however, is not comparable to the investment in energy storage units. Two solutions arise for the energy storage distribution: low number of big storage centers of large capacity or high number of smaller storage units of low capacity.
Big storage centers reduce the cost per stored energy unit (€/kWh, $/kWh) but forces to cover large distances to reach all areas, especially the most distant ones. This configuration increases energy losses and cost of the supplied energy. Low capacity storage units are suiTable for spreading distribution, which reduces the transportation distance but increases the cost per stored energy unit.
To develop a complete economic analysis is complicated since it depends on the V2G configuration, the covered area, the global energy balance, the alternative storage system type, the electric grid geographical distribution, the vehicle fleet, etc.
Storage centers may be replaced by redistribution of the energy excess, carrying the energy from places where generation exceeds consumption to those with energy shortage. Even if it looks a simple and economic solution, the energy losses due to transportation represent a higher cost than building a V2G network, especially if energy unbalance is large.
11. CONCLUSIONS
The energy balance between power generation and energy demand for daily cycle has been studied and simulated. The study has been developed for a standard situation where there is a lack of power generation during daytime and an excess during nighttime, with a null value of global energy balance for the overall daily period.
The energy compensation for the excess or lack of power generation, as for the energy demand is concerned, is based on a V2G system, where the batteries of the electric vehicles play the role of an energy damp. The study has shown the feasibility of the proposed system.
The carried out simulation takes into account a variable ratio of the electric vehicle fleet related to the global number of circulating vehicles; the ratio has been taken from a minimum value of 0.1, accounting for a 10% of electric vehicles over the entire vehicle fleet, to a maximum of 1.0 that represents a full electric vehicle fleet. The simulation has proved that is not feasible to compensate the energy unbalance for a daily cycle unless the electric vehicles are stopped the entire day, which results non practical.
The different developed cases for the simulation process changing the ratio of the electric vehicle fleet has shown that there is an optimum configuration where the overall daily energy unbalance is minimum; this configuration corresponds to a ratio 0f 0.34, what means that 34% of the vehicles fleet must be electric.
The energy unbalance for the optimum configuration, according to the simulation results, represents only a 1.13% of the global energy exchange of the V2G system. This very low value proves the validity of the method and the feasibility of adopting the V2G system as a damp for the daily energy balance.
The simulation has been based on the average values of power generation and energy demand for large and medium size populations, from about 5.5 to 0.6 million people. A ratio of 1 vehicle per family of four persons and 1 electric vehicle out of 3 has been considered, although this ratio can be modified easily, and the simulation process continues to being valid.
The paper represents the first action to the goal of modelling the energy balance using a V2G system. Despite the simulation has produced excellent results, future work will be devoted to validate the process in as many real cases as possible for the different configurations included in the study.
Author Contributions
Conceptualization, Carlos Armenta-Déu; Methodology, Carlos Armenta-Déu and Laura Demas; Software, Laura Demas; Validation, Carlos Armenta-Déu; Formal analysis, Carlos Armenta-Déu; Investigation, Laura Demas; Data curation, Laura Demas; Writing – original draft, Laura Demas; Writing – review & editing, Carlos Armenta-Déu; Supervision, Carlos Armenta-Déu.
Funding
This research received no external funding.
Conflicts of Interest
The authors declare no conflict of interest.
List of acronyms
| CS |
Charging Station |
| DG |
Distributed Generation |
| EV |
Electric Vehicle |
| HDI |
Human Development Index |
| OMS |
Operation Management System |
| SG |
Smart Grid |
| SOH |
State Of Health |
| V2G |
Vehicle to Grid |
| VAC |
Alternate Current Voltage |
| VRE |
Variable Renewable Energy Sources |
References
- Kamper, A.; Eßer, A. Strategies for decentralised balancing power. In Biologically-Inspired Optimisation Methods; Springer: Berlin, Heidelberg, 2009; pp. 261–289. [Google Scholar]
- Hirth, L.; Ziegenhagen, I. Balancing power and variable renewables: Three links. Renew. Sustain. Energy Rev. 2015, 50, 1035–1051. [Google Scholar] [CrossRef]
- Stadler, I. Power grid balancing of energy systems with high renewable energy penetration by demand response. Util. Policy 2008, 16, 90–98. [Google Scholar] [CrossRef]
- Soini, V. Wind power intermittency and the balancing power market: Evidence from Denmark. Energy Econ. 2021, 100, 105381. [Google Scholar] [CrossRef]
- Zsiborács, H.; Pintér, G.; Vincze, A.; Birkner, Z.; Baranyai, N.H. Grid balancing challenges illustrated by two European examples: Interactions of electric grids, photovoltaic power generation, energy storage and power generation forecasting. Energy Rep. 2021, 7, 3805–3818. [Google Scholar] [CrossRef]
- Liu, Z.; Lin, M.; Wierman, A.; Low, S.H.; Andrew, L.L. Geographical load balancing with renewables. ACM SIGMETRICS Perform. Eval. Rev. 2011, 39, 62–66. [Google Scholar] [CrossRef]
- Panos, E.; Kannan, R. The role of domestic biomass in electricity, heat and grid balancing markets in Switzerland. Energy 2016, 112, 1120–1138. [Google Scholar] [CrossRef]
- Mueller, S.; Tuth, R.; Fischer, D.; Wille-Haussmann, B.; Wittwer, C. Balancing fluctuating renewable energy generation using cogeneration and heat pump systems. Energy Technol. 2014, 2, 83–89. [Google Scholar] [CrossRef]
- Shahmohamadi, P.; Che-Ani, A.I.; Maulud, K.N.A.; Tawil, N.M.; Abdullah, N.A.G. The impact of anthropogenic heat on formation of urban heat island and energy consumption balance. Urban Stud. Res. 2011, 2011. [Google Scholar] [CrossRef]
- Shahmohamadi, P.; Che-Ani, A.I.; Ramly, A.; Maulud, K.N.A.; Mohd-Nor, M.F.I. Reducing urban heat island effects: A systematic review to achieve energy consumption balance. Int. J. Phys. Sci. 2010, 5, 626–636. [Google Scholar]
- Gils, H. C. (2015). Balancing of intermittent renewable power generation by demand response and thermal energy storage.
- Ikegami, T., Iwafune, Y., & Ogimoto, K. (2010, October). Optimum operation scheduling model of domestic electric appliances for balancing power supply and demand. In 2010 International Conference on Power System Technology (pp. 1-8). IEEE.
- Mudakkar, S.R.; Zaman, K.; Shakir, H.; Arif, M.; Naseem, I.; Naz, L. Determinants of energy consumption function in SAARC countries: Balancing the odds. Renew. Sustain. Energy Rev. 2013, 28, 566–574. [Google Scholar] [CrossRef]
- Olk, C.; Sauer, D.U.; Merten, M. Bidding strategy for a battery storage in the German secondary balancing power market. J. Energy Storage 2019, 21, 787–800. [Google Scholar] [CrossRef]
- Yu, R.; Zhong, W.; Xie, S.; Yuen, C.; Gjessing, S.; Zhang, Y. Balancing power demand through EV mobility in vehicle-to-grid mobile energy networks. IEEE Trans. Ind. Inform. 2015, 12, 79–90. [Google Scholar] [CrossRef]
- Ikegami, T., Ogimoto, K., Yano, H., Kudo, K., & Iguchi, H. (2012, March). Balancing power supply-demand by controlled charging of numerous electric vehicles. In 2012 IEEE International Electric Vehicle Conference (pp. 1-8). IEEE.
- Huang, C.J.; Liu, A.F.; Hu, K.W.; Chen, L.C.; Huang, Y.K. A load-balancing power scheduling system for virtual power plant considering emission reduction and charging demand of moving electric vehicles. Meas. Control 2019, 52, 687–701. [Google Scholar] [CrossRef]
- Druitt, J.; Früh, W.G. Simulation of demand management and grid balancing with electric vehicles. J. Power Sources 2012, 216, 104–116. [Google Scholar] [CrossRef]
- Kahlen, M., Ketter, W., & van Dalen, J. (2014). Balancing with electric vehicles: A profiTable business model.
- Kahlen, M.T.; Ketter, W.; van Dalen, J. Electric vehicle virtual power plant dilemma: Grid balancing versus customer mobility. Prod. Oper. Manag. 2018, 27, 2054–2070. [Google Scholar] [CrossRef]
- Habib, S.; Kamran, M.; Rashid, U. Impact analysis of vehicle-to-grid technology and charging strategies of electric vehicles on distribution networks–a review. J. Power Sources 2015, 277, 205–214. [Google Scholar] [CrossRef]
- Rizvi, S. A. A., Xin, A., Masood, A., Iqbal, S., Jan, M. U., & Rehman, H. (2018, October). Electric vehicles and their impacts on integration into power grid: a review. In 2018 2nd IEEE Conference on Energy Internet and Energy System Integration (EI2) (pp. 1-6). IEEE.
- Nunes, P.; Brito, M.C. Displacing natural gas with electric vehicles for grid stabilization. Energy 2017, 141, 87–96. [Google Scholar] [CrossRef]
- Tuffner, F. K., & Kintner-Meyer, M. C. (2011). Using electric vehicles to meet balancing requirements associated with wind power (No. PNNL-20501). Pacific Northwest National Lab.(PNNL), Richland, WA (United States).
- Galus, M. D., Vayá, M. G., Krause, T., & Andersson, G. (2019). The role of electric vehicles in smart grids. Advances in Energy Systems: The Large-scale Renewable Energy Integration Challenge, 245-264.
- Rigas, E.S.; Ramchurn, S.D.; Bassiliades, N. Managing electric vehicles in the smart grid using artificial intelligence: A survey. IEEE Trans. Intell. Transp. Syst. 2014, 16, 1619–1635. [Google Scholar] [CrossRef]
- Morais, H.; Sousa, T.; Vale, Z.; Faria, P. Evaluation of the electric vehicle impact in the power demand curve in a smart grid environment. Energy Convers. Manag. 2014, 82, 268–282. [Google Scholar] [CrossRef]
- Gruosso, G.; Ruiz, F.O. Electric Vehicle Fleets as Balancing Instrument in Micro-Grids. Energies 2021, 14, 7616. [Google Scholar] [CrossRef]
- Yumashev, A.; Ślusarczyk, B.; Kondrashev, S.; Mikhaylov, A. Global indicators of sustainable development: Evaluation of the influence of the human development index on consumption and quality of energy. Energies 2020, 13, 2768. [Google Scholar] [CrossRef]
- Jain, M.; Nagpal, A. Relationship between environmental sustainability and human development index: A case of selected South Asian nations. Vision 2019, 23, 125–133. [Google Scholar] [CrossRef]
- Korsakienė, R.; Breivytė, I.; Wamboye, E. Sustainable development and human development index. J. Secur. Sustain. Issues 2011, 1, 103–112. [Google Scholar]
- Neumayer, E. The human development index and sustainability—a constructive proposal. Ecol. Econ. 2001, 39, 101–114. [Google Scholar] [CrossRef]
- Papadaskalopoulos, D.; Strbac, G.; Mancarella, P.; Aunedi, M.; Stanojevic, V. Decentralized participation of flexible demand in electricity markets—Part II: Application with electric vehicles and heat pump systems. IEEE Trans. Power Syst. 2013, 28, 3667–3674. [Google Scholar] [CrossRef]
- Chakir, A.; Abid, M.; Tabaa, M.; Hachimi, H. Demand-side management strategy in a smart home using electric vehicle and hybrid renewable energy system. Energy Rep. 2022, 8, 383–393. [Google Scholar] [CrossRef]
- Mali, B.; Shrestha, A.; Chapagain, A.; Bishwokarma, R.; Kumar, P.; Gonzalez-Longatt, F. Challenges in the penetration of electric vehicles in developing countries with a focus on Nepal. Renew. Energy Focus 2022, 40, 1–12. [Google Scholar] [CrossRef]
- Goel, S.; Sharma, R.; Rathore, A.K. A review on barrier and challenges of electric vehicle in India and vehicle to grid optimisation. Transp. Eng. 2021, 4, 100057. [Google Scholar] [CrossRef]
- Dik, A.; Omer, S.; Boukhanouf, R. Electric Vehicles: V2G for Rapid, Safe, and Green EV Penetration. Energies 2022, 15, 803. [Google Scholar] [CrossRef]
- Meszaros, F.; Shatanawi, M.; Ogunkunbi, G.A. Challenges of the electric vehicle markets in emerging economies. Period. Polytech. Transp. Eng. 2021, 49, 93–101. [Google Scholar] [CrossRef]
- Available online: https://www.researchgate.net/profile/P_Pardalos/publication/224598439/Figure/download/fig1/AS:669029337423885@1536520432890/Efficiency-curve-of-a-power-plant-over-the-continuum-of-operation-and-with-respect-to-the.png.
- P. Scarabaggio, R. Carli and M. Dotoli, “Noncooperative Equilibrium-Seeking in Distributed Energy Systems Under AC Power Flow Nonlinear Constraints,” in IEEE Transactions on Control of Network Systems, vol. 9, no. 4, pp. 1731–1742, Dec. 2022. [CrossRef]
- M. Yao, D. K. Molzahn and J. L. Mathieu, “An Optimal Power-Flow Approach to Improve Power System Voltage Stability Using Demand Response,” in IEEE Transactions on Control of Network Systems, vol. 6, no. 3, pp. 1015–1025, Sept. 2019. [CrossRef]
- Human Development Index. Available online: https://en.wikipedia.org/wiki/Human_Development_Index.
- Human Development Reports. United Nations Development Programme. Available online: https://hdr.undp.org/datacenter/human-development-index#/indicies/HDI.
- Human Development Index. World Trends in Freedom of Expression and Media Development. UNESCO. Available online: https://www.unesco.org/en/world-media-trends/human-development-index-hdi.
- Max Roser (2014) - “Human Development Index (HDI)”. Published online at OurWorldInData.org. Available online: https://ourworldindata.org/human-development-index.
- Available online: https://ourworldindata.org/grapher/electricity-generation?tab=Table&time=earliest..2020.
- Manthiram, A. An outlook on lithium ion battery technology. ACS Cent. Sci. 2017, 3, 1063–1069. [Google Scholar] [CrossRef] [PubMed]
- Dos Reis, G.; Strange, C.; Yadav, M.; Li, S. Lithium-ion battery data and where to find it. Energy AI 2021, 5, 100081. [Google Scholar] [CrossRef]
- Bibak, B.; Tekiner-Moğulkoç, H. A comprehensive analysis of Vehicle to Grid (V2G) systems and scholarly literature on the application of such systems. Renew. Energy Focus 2021, 36, 1–20. [Google Scholar] [CrossRef]
- Shariff, S. M., Iqbal, D., Alam, M. S., & Ahmad, F. (2019, October). A state of the art review of electric vehicle to grid (V2G) Technology. In IOP Conference Series: Materials Science and Engineering (Vol. 561, No. 1, p. 012103). IOP Publishing.
- Mendes, P.R.; Isorna, L.V.; Bordons, C.; Normey-Rico, J.E. Energy management of an experimental microgrid coupled to a V2G system. J. Power Sources 2016, 327, 702–713. [Google Scholar] [CrossRef]
- Turton, H.; Moura, F. Vehicle-to-grid systems for sustainable development: An integrated energy analysis. Technol. Forecast. Soc. Change 2008, 75, 1091–1108. [Google Scholar] [CrossRef]
- Zhou, Z.; Sun, C.; Shi, R.; Chang, Z.; Zhou, S.; Li, Y. Robust energy scheduling in vehicle-to-grid networks. IEEE Netw. 2017, 31, 30–37. [Google Scholar] [CrossRef]
- Musio, M., Lombardi, P., & Damiano, A. (2010, September). Vehicles to grid (V2G) concept applied to a virtual power plant structure. In The XIX International Conference on Electrical Machines-ICEM 2010 (pp. 1-6). IEEE.
- Xiao, H., Huimei, Y., Chen, W., & Hongjun, L. (2014, June). A survey of influence of electrics vehicle charging on power grid. In 2014 9th IEEE Conference on Industrial Electronics and Applications (pp. 121-126). IEEE.
- Tan, K.M.; Ramachandaramurthy, V.K.; Yong, J.Y. Integration of electric vehicles in smart grid: A review on vehicle to grid technologies and optimization techniques. Renew. Sustain. Energy Rev. 2016, 53, 720–732. [Google Scholar] [CrossRef]
- Mwasilu, F.; Justo, J.J.; Kim, E.K.; Do, T.D.; Jung, J.W. Electric vehicles and smart grid interaction: A review on vehicle to grid and renewable energy sources integration. Renew. Sustain. Energy Rev. 2014, 34, 501–516. [Google Scholar] [CrossRef]
- Chtioui, H., & Boukettaya, G. (2020). Vehicle-to-grid management strategy for smart grid power regulation. In 2020 6th IEEE International Energy Conference (ENERGYCon) (pp. 988-993). IEEE.
- Pillai, J.R.; Bak-Jensen, B. Integration of vehicle-to-grid in the western Danish power system. IEEE Trans. Sustain. Energy 2010, 2, 12–19. [Google Scholar] [CrossRef]
- Huda, M.; Koji, T.; Aziz, M. Techno economic analysis of vehicle to grid (V2G) integration as distributed energy resources in Indonesia power system. Energies 2020, 13, 1162. [Google Scholar] [CrossRef]
- Hodge, B. M. S., Huang, S., Shukla, A., Pekny, J. F., & Reklaitis, G. V. (2010). The effects of vehicle-to-grid systems on wind power integration in California. In Computer Aided Chemical Engineering (Vol. 28, pp. 1039-1044). Elsevier.
- Bellar, M.D.; Wu, T.S.; Tchamdjou, A.; Mahdavi, J.; Ehsani, M. A review of soft-switched DC-AC converters. IEEE Trans. Ind. Appl. 1998, 34, 847–860. [Google Scholar] [CrossRef]
- Ertan, H. B., Doğru, E., & Yilmaz, A. (2012, May). Comparison of efficiency of two dc-to-ac converters for grid connected solar applications. In 2012 13th International Conference on Optimization of Electrical and Electronic Equipment (OPTIM) (pp. 879-886). IEEE.
- Mohammed SA, Q.; Jung, J.W. A State-of-the-Art Review on Soft-Switching Techniques for DC–DC, DC–AC, AC–DC, and AC–AC Power Converters. IEEE Trans. Ind. Inform. 2021, 17, 6569–6582. [Google Scholar] [CrossRef]
- Katagiri, K., Nakagawa, S., Kado, Y., & Wada, K. (2017, November). Analysis on load-factor dependence of triple active bridge converter's transmission efficiency for autonomous power networks. In TENCON 2017-2017 IEEE Region 10 Conference (pp. 2177-2181). IEEE.
- Cho, Y.W.; Kwon, J.M.; Kwon, B.H. Single power-conversion AC--DC converter with high power factor and high efficiency. IEEE Trans. Power Electron. 2013, 29, 4797–4806. [Google Scholar] [CrossRef]
- Mallik, A.; Khaligh, A. Maximum efficiency tracking of an integrated two-staged AC–DC converter using variable DC-link voltage. IEEE Trans. Ind. Electron. 2018, 65, 8408–8421. [Google Scholar] [CrossRef]
- Lu, D.D.C.; Iu, H.H.C.; Pjevalica, V. A single-stage AC/DC converter with high power factor, regulated bus voltage, and output voltage. IEEE Trans. Power Electron. 2008, 23, 218–228. [Google Scholar] [CrossRef]
- Georgakas, K., & Safacas, A. (2005, June). Power factor correction and efficiency investigation of AC-DC converters using forced commutation techniques. In Proceedings of the IEEE International Symposium on Industrial Electronics, 2005. ISIE 2005. (Vol. 2, pp. 583-588). IEEE.
- Affanni, A.; Bellini, A.; Franceschini, G.; Guglielmi, P.; Tassoni, C. Battery choice and management for new-generation electric vehicles. IEEE Trans. Ind. Electron. 2005, 52, 1343–1349. [Google Scholar] [CrossRef]
- Useable battery capacity of full electric vehicles. Electric Vehicle Database. Useable battery capacity of full electric vehicles cheatsheet - EV Database (ev-database.org) [Accessed online: 07/12/2022].
- Scarabaggio, P.; Carli, R.; Cavone, G.; Dotoli, M. Smart Control Strategies for Primary Frequency Regulation through Electric Vehicles: A Battery Degradation Perspective. Energies 2020, 13, 4586. [Google Scholar] [CrossRef]
- Yan, G., Liu, D., Li, J. et al. A cost accounting method of the Li-ion battery energy storage system for frequency regulation considering the effect of life degradation. Prot Control Mod Power Syst 3, 4 (2018). [CrossRef]
- Predicted average battery capacities in EVs worldwide 2017-2025. Statista Research Department. March, 2, 2021 Our research and content philosophy | Statista [Accesed online: 07/12/2022].
- Paul Zummo. America’s Electricity Generating Capacity. 2022 Update. Policy Research and Analysis. Powering Strong Communities. American Power Public Association. March 2022.
- Bruna Alves, US electricity generation – Statistics & Facts. Energy & Environment, Energy. Statista, Nov 18, 2022.
- Bruna Alves, Electricity generation in the UK– Statistics & Facts. Energy & Environment, Energy. Statista, Feb 24, 2022.
- Electricity Power Annual 2021. U.S. Energy Information Administration (EIA), Statistical and Analytical Agency, Department of Energy (DOE). www.eia.gov.
- Ankur Pathak, Operation and Maintenance of Power Plants, SCRIBD, Operation and Maintenance of Power Plant | PDF | Boiler | Hertz (scribd.com) [Accessed online: 12/12/2022].
- The Importance of Maintenance in Power Distribution Systems, Process Barron, Southern Field, Environmental Elements, January 3, 2019 https://southernfield.com/ [Accessed online: 19/12/2022].
- Warren de Guzman, Power outages seen not due to lack of capacity but maintenance issues, ABS-CBS News, June 14, 2021.
|
Disclaimer/Publisher’s Note: The statements, opinions and data contained in all publications are solely those of the individual author(s) and contributor(s) and not of MDPI and/or the editor(s). MDPI and/or the editor(s) disclaim responsibility for any injury to people or property resulting from any ideas, methods, instructions or products referred to in the content. |
© 2024 by the authors. Licensee MDPI, Basel, Switzerland. This article is an open access article distributed under the terms and conditions of the Creative Commons Attribution (CC BY) license (http://creativecommons.org/licenses/by/4.0/).
