1. Introduction
Climate change (CC) is now
“unequivocal” and causing instability in the water cycle, such as changing rainfall patterns and increasing the frequency and intensity of weather extremes [
1]. These changes will have a substantial effect on agronomy, food production, the ecosystem, biodiversity, stream flow, flooding, energy security, and human and animal health [
2]. The impacts will be greater in the case of Bangladesh because it is one of the most vulnerable countries to the CC due to its geographical location, extreme variability of climate, high population density, and dependence on agriculture [
3]. The country is already experiencing the adverse effects of CC [
4], and it has been projected that approximately 30 million people will be forced to relocate by the year 2050 [
5]. Under such circumstances, the government of Bangladesh has acknowledged the seven global targets of the Sendai Framework for Disaster Risk Reduction (SFDRR) to prevent new risks and reduce existing ones. The government also formulated a comprehensive development plan, the Bangladesh Delta Plan (BDP-2100) in 2018, focusing on economic growth, environmental conservation, and enhanced climate resilience as an integrated and pragmatic approach to alleviate the vulnerability due to the escalating effects of CC. To ensure successful implementation of BDP-2100, CC impact assessments are inevitable. However, there is currently a lack of evidence-based information and poor preparedness in responding to the challenges of CC and Disaster Risk Reduction (DRR) activities in the Sangu river basin. Therefore, this study aims to address this gap by providing evidence-based information through CC impact assessment and providing a qualitative decision index to the policymakers for the successful implementation of BDP-2100.
However, numerous studies have investigated future climate projections in the other river basins in Bangladesh, i.e., the Ganges-Meghna-Brahmaputra (GMB) basin [
6,
7], the Brahmaputra River basin [
8,
9]. To evaluate the impact of CC, multi-model ensemble approaches were employed in these studies. The use of ensemble mean may include a General Circulation Model (GCM) that may exhibit poor performance at the regional and local scale. Hence, individual GCM analysis, as opposed to multi-model ensemble analysis, may improve the transparency of uncertainty management [
10]. But individual GCM selection requires special evaluation strategies because the performance of GCMs is poor at the regional- and basin-scale compared to the global- and continental-scale [
11]. Therefore, to employ GCMs with higher reliability, less uncertainty and to address model climate sensitivity, a unique benchmark and scoring system [
12] have been applied in this study. This scoring system evaluates the performance of precipitation, sea surface temperature, sea-level pressure, air temperature, outgoing longwave radiation, meridional wind, zonal wind, and geo-potential height with historical reference data and hence requires handling big datasets.
The management and analysis of large datasets demand a robust system. The Data Integration and Analysis System (DIAS) is a comprehensive data analysis tool that integrates data and models from a diverse range of subjects and disciplines and offering advanced analysis capabilities [
13]. Accordingly, DIAS has archived data from various sources, including the Japanese 55-year Reanalysis (JRA-55), coupled-model inter-comparison project phase 5 (CMIP5), and other reanalysis data in the CMIP5 Data Analysis System (CMIP5-DIAS). In this study, CMIP5-DIAS was employed to overcome the technological challenge of handling big datasets and to evaluate the performance of GCMs on regional- and local-scale.
Generally, daily precipitation simulated by the GCM tends to be more frequent but less intense than actual precipitation [
14,
15]. This phenomenon leads to poor seasonal simulation, underestimating of extreme events, and high-frequency wet day inaccuracy in comparison to observed precipitation. Consequently, the use of GCM-simulated precipitation without eliminating the biases will lead to unreliable impact assessments [
16]. This is why, after evaluating the performance of GCMs at the regional scale, bias correction is necessary for further reduction of uncertainty. To eliminate the biases, CMIP5-DIAS incorporates a three-step bias correction method [
12] with observed data. Therefore, the bias correction method of CMIP5-DIAS was utilized in this study for reliable CC impact assessment.
The selection of a physically based water and energy budget based hydrological model (i.e., seamless model) is crucial to incorporate various hydrological components such as peak and low estimations, inundation, soil moisture, and evapotranspiration under different global warming projections. However, a linear regression of rainfall and streamflow was employed for the projection of future streamflow in the GMB basin [
6,
17]. The extrapolation of regression equations for future streamflow projections is unreliable for the CC impact assessment due to the non-linear nature of hydrological processes [
7]. In recent years, semi-distributed hydrological models were employed for the projection of future streamflow in several rivers in Bangladesh, such as the Brahmaputra River [
9,
18], the Arial Khan River [
19], and the Teesta River [
20]. The Water and Energy Budget-based Rainfall-Runoff-Inundation (WEB-RRI) model [
21] is a recently developed Distributed Hydrological Model (DHM) that includes physical formulations for evapotranspiration fluxes, soil and vegetation interception, and soil moisture dynamics. Consequently, the WEB-RRI model provides more precise estimates of flood onset timing, peak flows, low flows, and inundation extent. Additionally, it is capable of accurately assessing flood- and drought-related risk under water cycle variability and CC scenarios since it accepts more inputs from various sources. Thus, the WEB-RRI model was employed in this study to simulate long-term past and future GCM outputs seamlessly and to provide evidence-based information to the policymakers.
This study effectively addresses the scientific, engineering, and technological challenges associated with CC impact assessment through the incorporation of cutting-edge models and technologies. The current study possesses certain advantages over studies of a similar nature in Bangladesh. Firstly, a comprehensive methodology has been applied for GCM selection and bias correction. Secondly, a water and energy budget-based DHM has been used to develop a seamless simulation of the hydrological responses in the basin. Thirdly, while most studies only project the rainfall and streamflow, this study has projected the evapotranspiration and inundation as well. Fourthly, a qualitative decision index has been provided to the policymakers to facilitate the successful implementation of BDP-2100. Lastly, this study has been conducted in the Chittagong Hill Tracts (CHTs) river system of Bangladesh, which is distinct from the majority of studies conducted in Bangladesh.
The structure of this research study is as follows:
Section 2 explains materials and methods, including a brief description of the study area.
Section 3 describes the results and discussion with a qualitative decision index for the policymakers. Finally, Section 4 provides a conclusion.
2. Materials and Methods
2.1. Study Area
Bangladesh is characterized by a low-lying deltaic plain along with the Ganges, Brahmaputra and Meghna (GBM) basin and the Chittagong Hill Tracts (CHTs) River system. The physiography of the CHTs differs greatly from the rest of the country, which in turn makes the rivers flowing through this region special in their own nature. This hilly region is characterized by hillslopes extending from east to west, and thus the rivers flow through the hills from east to west.
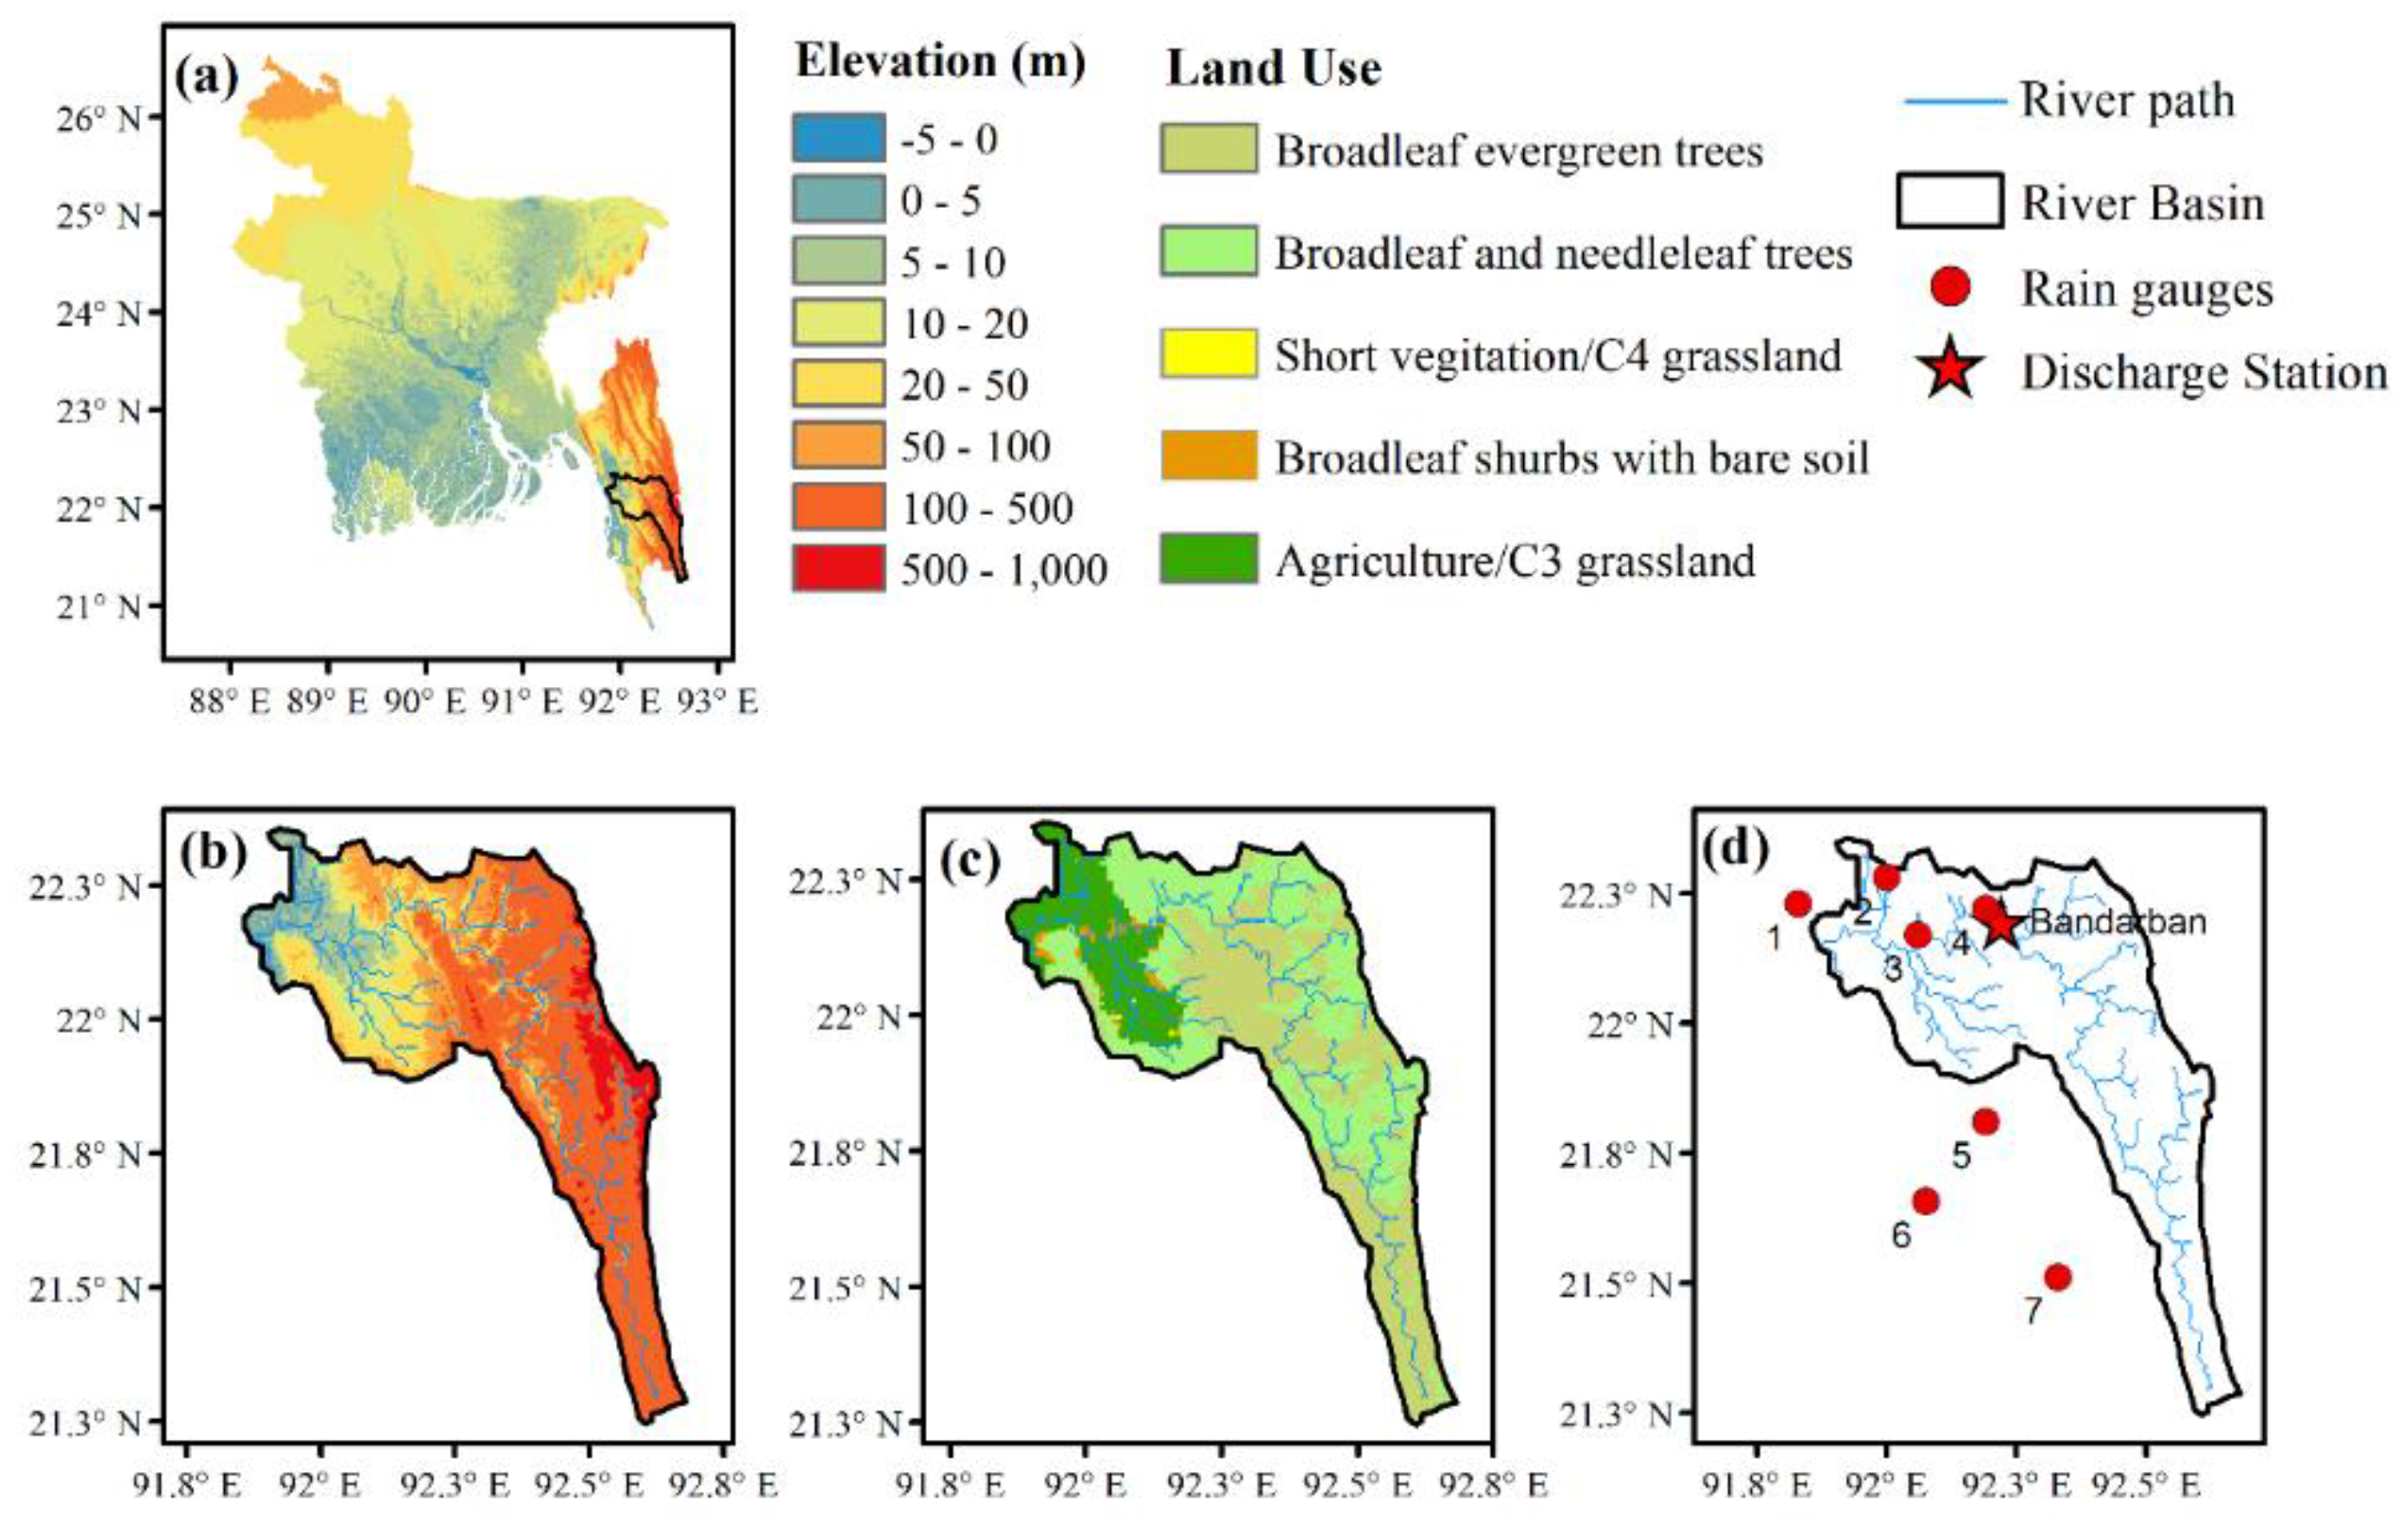
The Sangu River basin (
Figure 1a,b) is located in the CHTs (one of the six “hotspots” defined in BDP-2100) and is highly susceptible to natural hazards such as storm surge, tropical cyclone, flash flood, and landslides [
22,
23,
24]. On the other hand, the region is economically significant, contributing 12% to the national GDP and more than 60% of the total revenue of the country [
25]. In addition, it is situated in Chittagong, the commercial capital city of Bangladesh. Therefore, flash floods in the basin have a substantial adverse impact on the national economy [
26]. Floods in 2015 and 2019 affected approximately 1,800,000 and 50,000 people, respectively [
27]. In addition to the flood hazard, CHTs is a low-to-medium drought-prone region in Bangladesh, and the river flow during the dry season is decreasing, causing severe problems with water availability for domestic and agricultural purposes [
28].
The study area exhibits distinct seasonal variation and a reversal of the wind circulation between summer and winter. The monsoon is the most prominent season, prevailing from June to October with heavy rainfall. The cooler and drier winter starts at the end of November and prevails until the beginning of February. The annual average temperature is 29°C, and annual rainfall ranges from 2540 to 3810 mm [
27]. Sangu is not a Himalayan river, so it depends solely on rainfall; fortunately, the watershed lies in territory with significant annual rainfall. Rainfall-runoff occurring within the basin is the only source of flow for the Sangu River, and numbers of charas and waterfalls keep the river alive during the dry season.
2.2. Methodology
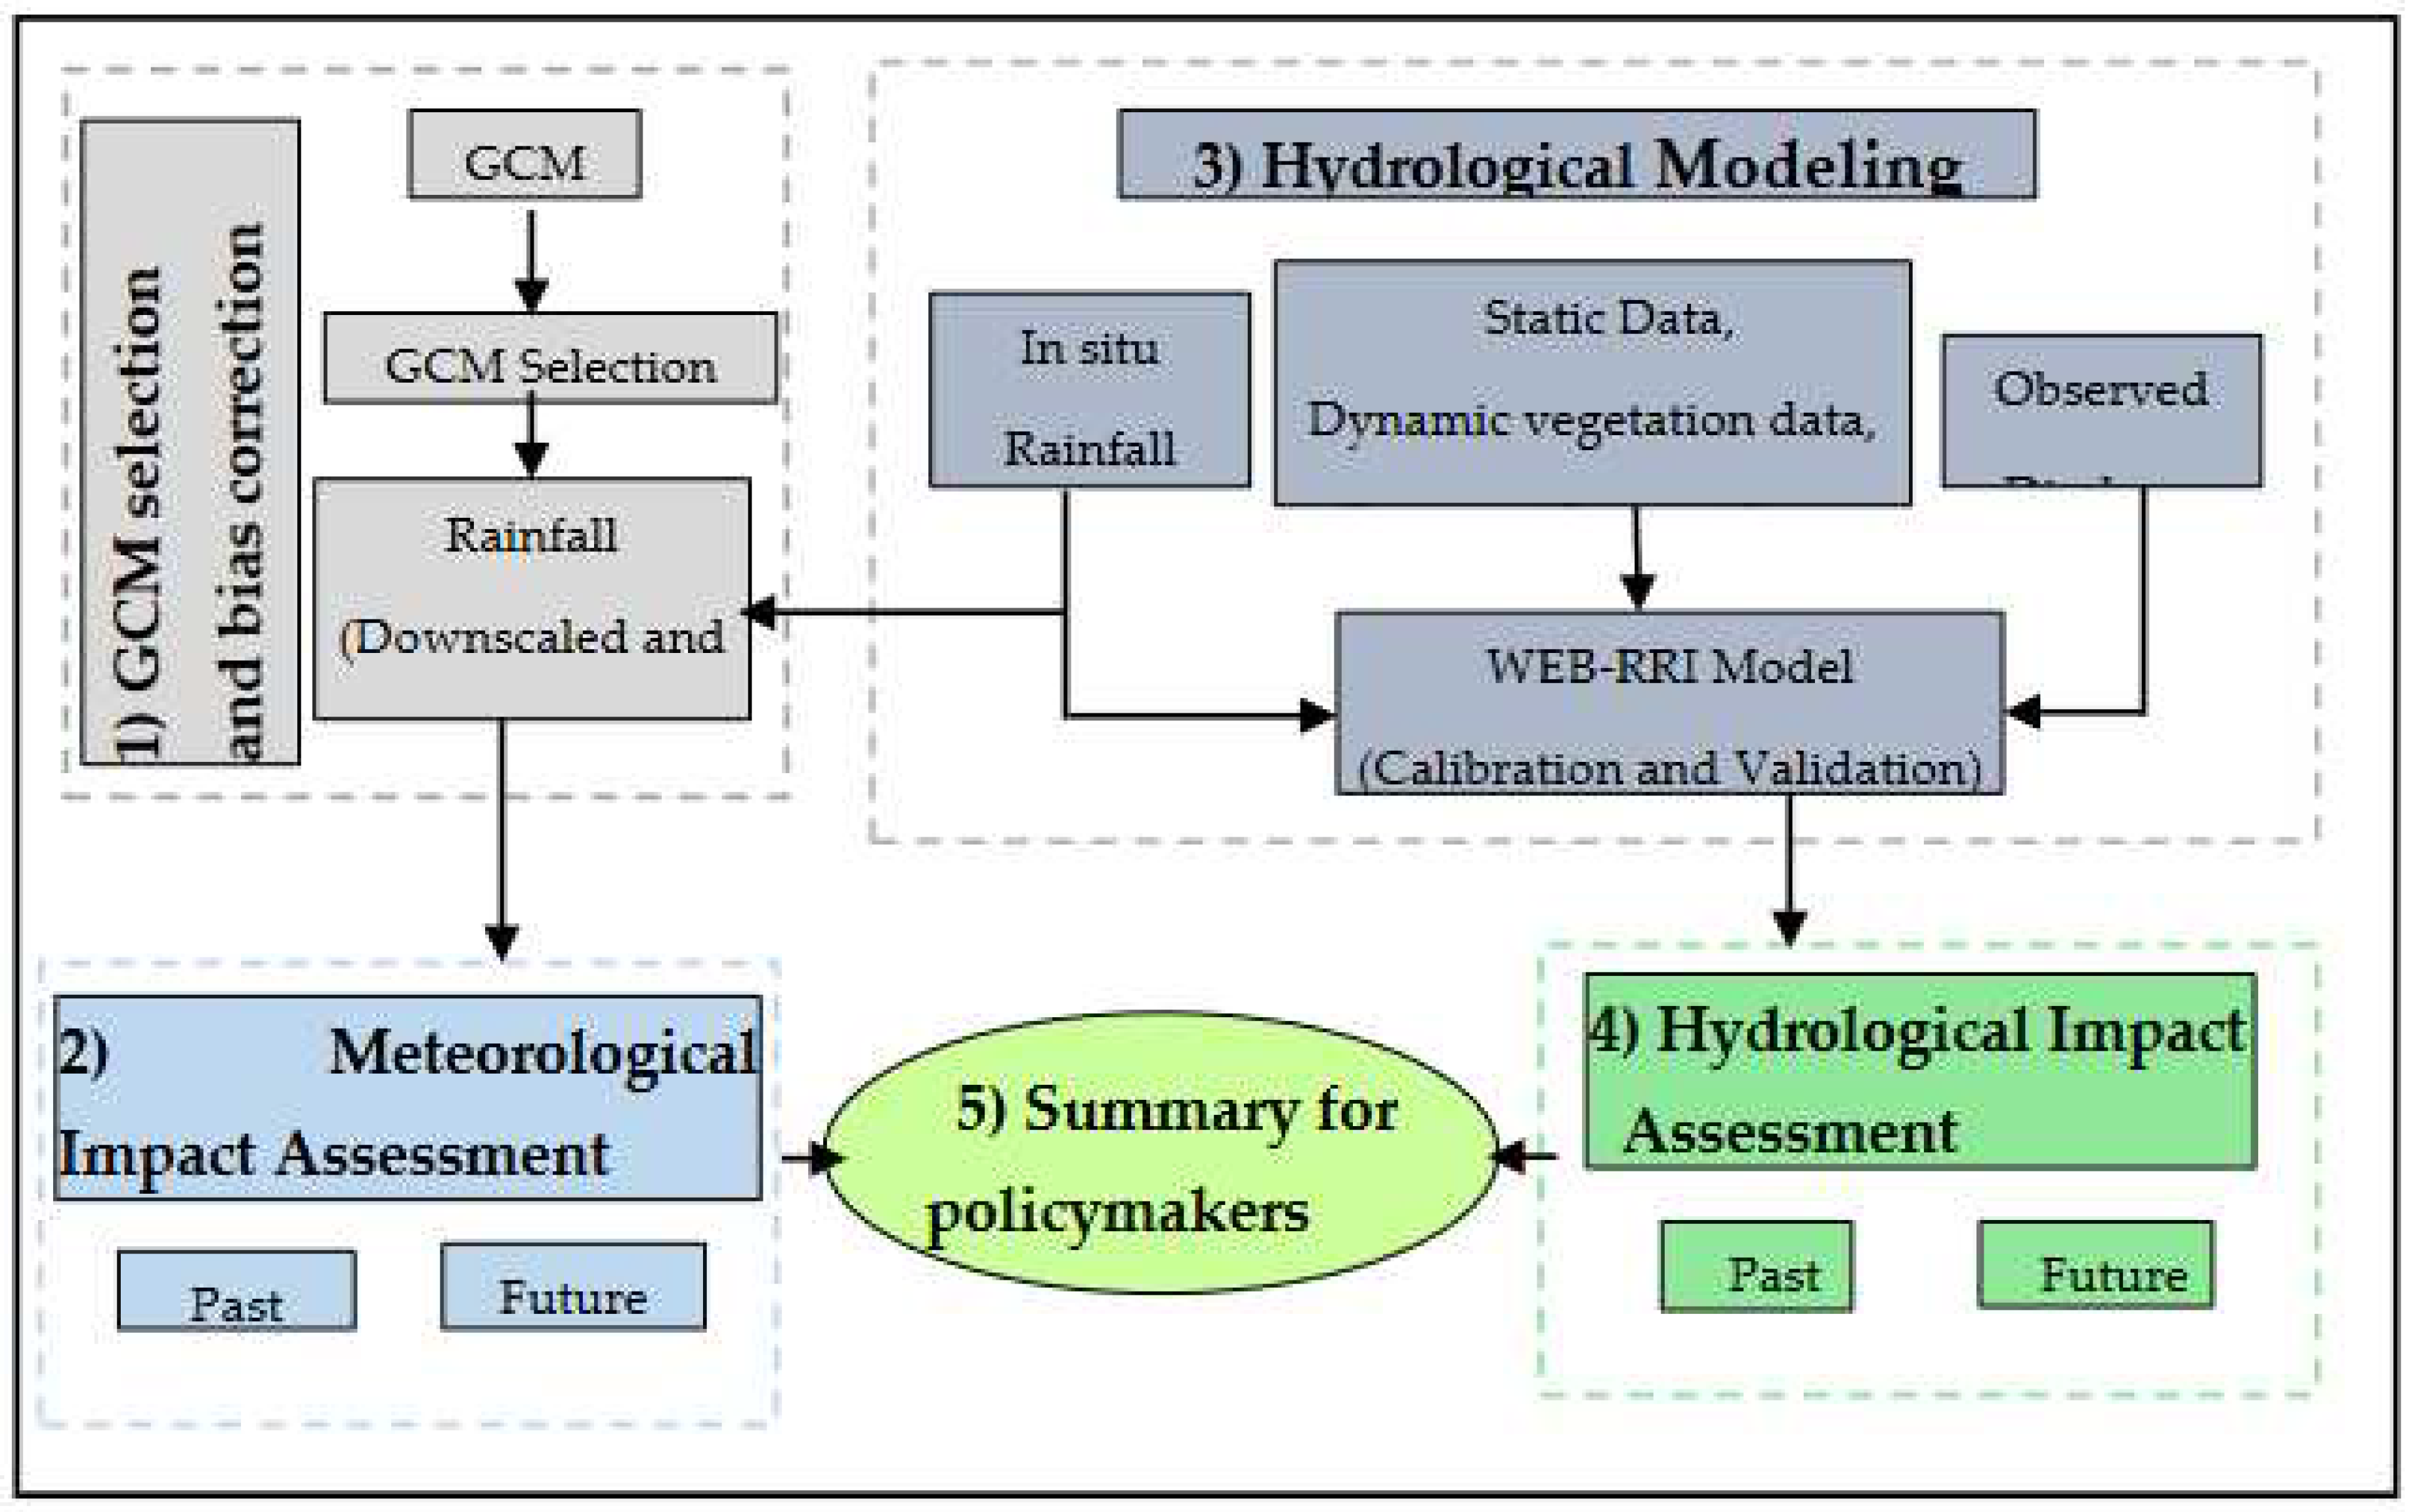
The approach employed in this study to assess the impact of CC in the Sangu River basin is depicted in
Figure 2. First, we selected the GCMs in a comprehensive manner and statistically corrected the rainfall biases of the selected GCMs. The bias-corrected rainfall was utilized to evaluate the meteorological effects of CC in the basin. A DHM was used to calibrate and validate the discharge data, and the calibrated and validated model was then used to analyze the hydrological impact in the basin. The methodology has been described in detail below.
2.2.1. GCM Selection
The process of choosing GCMs that are capable of accurately representing a particular climatic region is a crucial aspect of multimodal research. This is due to the fact that GCMs exhibit significant levels of uncertainty when it comes to reconstructing historical meteorological features, and their efficacy can vary considerably across different climatic zones [
29]. Consequently, this study employed a comprehensive methodology to select suitable GCMs at the basin scale. The suitability of GCMs was assessed by analyzing their ability to accurately replicate meteorological variables, including precipitation (P), sea surface temperature (SST), sea-level pressure (SLP), air temperature (Tair), outgoing longwave radiation (OLR), meridional wind (MW), zonal wind (ZW), and geo-potential height (GPH) with historical reference data at regional scale. The statistical indices spatial correlation (Scorr) and root mean square error (RMSE) were utilized to determine how well GCMs can capture climatic parameters that influence rainfall in the study area.
The mean monthly Scorr and RMSE were employed to calculate the score for each GCM. In cases where the Scorr of a particular GCM exceeded the average Scorr of all GCMs, the Scorr index was considered to be 1. Conversely, if the Scorr of a GCM was below the mean, the Scorr index was considered to be 0. If the RMSE of a specific GCM was found to be lower than the average RMSE of all GCMs, the RMSE index was assigned a value of 1. Conversely, if the RMSE of the GCM was higher than the mean RMSE of all GCMs, the RMSE index was assigned a value of 0. Moreover, it was considered that the total index attained a value of 1 when the summation of the Scorr index and the RMSE index exceeded 1. If the sum of the Scorr index and the RMSE index was less than 1, the total index was considered to be -1. If neither of the conditions were met, the total index was considered to be 0. Finally, total indexes of all meteorological variables (i.e. precipitation, temperature, wind etc.) were added together to obtain grand total score. GCMs with a higher grand total score may provide a more precise representation of regional climate compared to those with a lower grand total score.
2.2.2. Bias Correction of Precipitation
This research aims to investigate the impact of CC at the basin scale. Hence, it is crucial to adjust the biases of the selected GCMs prior to using them on a basin scale. Otherwise, GCM precipitation will produce untrustworthy results since daily precipitation in GCMs occurs more often and with lower intensity than ground rainfall [
15,
16,
30].
The present study employed CMIP5-DIAS for the purpose of reducing biases. The CMIP5-DIAS system employs a statistical bias correction function that utilizes historical rainfall data in a three-step process to eliminate biases. The extreme-rainfall correction, normal-rainfall correction, and no-rain days correction are employed by utilizing generalized pareto distribution, gamma distribution, and statistical ranking order, respectively [
12].
2.2.3. Indices of extreme precipitation and drought
This study employs four precipitation indices, namely CWD, CDD, R50mm, and R100mm, to examine rainfall extremes and drought.
Table 1 displays the definitions of the indices. The definition has been taken from the WMO workshop [
31]. This definition has been widely adopted and applied in numerous studies [
32,
33,
34].
2.2.4. Hydrological modeling
The Water and Energy Budget-based Rainfall-Runoff-Inundation (WEB-RRI) model, which has been developed recently, is capable of computing various hydrological parameters such as evapotranspiration, soil moisture variation, peak flood discharge, base flow, and inundation characteristics [
21]. Therefore, the WEB-RRI model was used in this study to estimate evapotranspiration, high flows, low flows, and inundation extent under CC. Rasmy et al. (2019) provided a detailed explanation of the governing equations used in the WEB-RRI model in their article.
2.3. Data and Model Development
2.3.1. Data for GCM evaluation and selection
The Data Integration and Analysis System (DIAS) archives four climate projection scenarios (RCP2.6, RCP4.5, RCP6.0, and RCP8.5), 44 GCM models from various institutions and experiments, and historical data from different organizations. Global observation and re-analysis products from 1980–2005 were used from different datasets to select GCMs. Precipitation, Outgoing Longwave Radiation and Sea Surface Temperature were collected from the Global Precipitation Climatology Project (GPCP), the National Oceanic and Atmospheric Administration (NOAA), and the Hadley Centre, respectively [
35,
36,
37]. Other data was collected from JRA-55 [
38].
The climate of Bangladesh is primarily dominated by the El-Nino-Southern Oscillation (ENSO) and the Indian Ocean Dipole (IOD) [
39,
40]. To include the effects of IOD and ENSO, regional- and local-domain were considered in the selection process of GCMs. The local domain (20°N-27°N, 87°E-95°E) was considered for precipitation, and the regional domain (45°E-140°E, 15°S-35°N) was considered for the other seven meteorological variables (T
air, OLR, SLP, ZW, MW, SST, and GPH).
The grand total score was computed according to
Section 2.2.1. The precipitation index score was given priority in selecting the appropriate GCMs. Thus, the models that exhibited higher grand scores and a precipitation index of 1 were chosen. At the outset, a total of eight models (with a grand total score ≥ 6) were chosen (as shown in
Table 2). However, it should be noted that two of these models do not have any future data available. (GFDL-CM2.1, MPI-ESM-P). The precipitation index value for CNRM-CM5 is zero. The CNRM-CM5 model was excluded due to inadequate representation of precipitation. Finally, the present study selected five models, namely ACCESS1.0, CESM1 (CAM5), CMCC-CMS, MPI-ESM-LR, and MPI-ESM-MR, to incorporate model climate sensitivity.
2.3.2. Data for Bias Correction and Hydrological Modeling
(i) Rainfall: Daily rainfall data was obtained from the Bangladesh Water Development Board (BWDB). The rainfall data was collected for seven rain-gauge stations (
Figure 1d).
Table 3 shows the salient features for the rain-gauge stations.
(ii) Elevation and hydrographic data: USGS (United States Geological Survey) HydroSHEDS (Hydrological data and maps based on Shuttle Elevation Derivatives at multiple Scales) provide 3 arc-second, 15 arc-second, and 30 arc-second topography data. Considering the model’s running time and to get detail information on the basin, 15 arc-second DEM (Digital Elevation Model) data was used in this study.
(iii) Land use: The 9 km spatial resolution soil and 1 km spatial resolution land use data are obtained from the Food and Agriculture Organization (FAO) and USGS, respectively. The linear interpolation approach is employed to resample both datasets to model grids. The SiB2 model reclassifies data from the US Geological Survey on land use and vegetation types [
41].
Figure 1 displays the spatial distribution of static data utilized in WEB-RRI modeling, such as DEM and land-use type.
(iv) Dynamic vegetation data: Precipitation interception plays an important role in hydrological modelling. To include the effect of precipitation interception, WEB-RRI uses the Fraction of Photo-synthetically Active Radiation (FPAR) and the leaf area index (LAI). The NASA Earth Observation Data and Information System provides LAI and FPAR at a spatial resolution of 1 km. The LAI and FPAR were resampled to the model grid size.
(v) Hydrological model forcing data: The JRA-55 [
38] included meteorological forcing data. For wind speed, air temperature, specific humidity, and surface pressure, the JRA-55 data are available with a 3-hour temporal resolution, a 0.125° spatial resolution, and a 0.56° spatial resolution for downward radiations. These data were interpolated to a model grid resolution of 250 m and a model temporal resolution of 1 h using a linear interpolation approach.
(vi) Discharge: Daily discharge data at Bandarban (22.20°N, 92.22°E) gauge station had been collected from BWDB for the calibration and validation of the WEB-RRI model.
2.3.3. Data for Inundation
The Sangu river basin does not have any inundation data. As a result, the inundation was analyzed using MODIS surface reflectance products (MOD09A1). The MODIS data are available with a geographical resolution of 500 meters and a temporal resolution of 8 days. Inundation extents in the basin were computed using the Modified Land Surface Water Index (MLSWI) [
42]. The MLSWI was defined as
2.3.4. Data for Evapotranspiration (ET)
MOD16A2 (version 6.1) was utilized in this research to estimate basin average ET. The MOD16 data product's algorithm is based on the Penman-Monteith equation, which incorporates MODIS remotely sensed data products such as plant property dynamics, albedo, and land cover. Application for Extracting and Exploring Analysis Ready Samples (AρρEEARS) of the USGS was utilized to estimate basin average ET.
2.3.5. Model performance indices
The performance of discharge was assessed using the Root Mean Square Error (RMSE), Mean Bias Error (MBE), and Nash-Sutcliffe Efficiency Coefficient (NSE). The definition of the indices are
Where O is the observed discharge, is the mean observed data, S is the model-simulated discharge, and N refers to the total number of datasets.
To evaluate the performance of the model inundation extent, the Critical Success Index (CSI) was used. The perfect score for CSI is 1. The grids with an inundation depth greater than 0.3 m have been treated as having an inundation extent. The definition of CSI is
Where ∩ is the intersection area between the model and observation inundation extent, and ∪ is the union area between the model and observation inundation extent.
2.3.6. Population data:
Population data was downloaded from the Socioeconomic Data and Applications Center (SEDAC) [
43]. Due to the absence of predicted population data in the Sangu River basin, historical observed population data were utilized to project the number of affected people in the future.
2.3.7. Qualitative Decision Index
The meteorological and hydrological quantitative results of GCMs have uncertainty. Therefore, the IPCC employs a confidence level framework to conduct a qualitative evaluation of the GCMs output. In this study, the IPCC AR6 likelihood scale has been utilized as a qualitative index. The likelihood scales are as follows: virtually certain with a probability of 99–100%, very likely with a probability of 90–100%, likely with a probability of 66–100%, as likely as not with a probability of 33–66%, unlikely with a probability of 0–33%, very unlikely with a probability of 0–10%, and exceptionally unlikely with a probability of 0–1% [
44]. As per the report, it is recommended to present the assessed likelihood typeset in italics, such as
very likely.
3. Results and Discussion
This study assesses the effects of climate change (CC) on precipitation, streamflow, flooding, and evapotranspiration using three temporal sequences: past (1980–2005), near-future (2025–2050), and far-future (2075–2100) under the RCP8.5 scenario. This section also provides evidence-based information to the policymakers by identifying CC signals, climate sensitivity, and a qualitative likelihood index for the hydro-meteorological variables.
3.1. Meteorological Assessment
3.1.1. Effect of climate change on annual rainfall
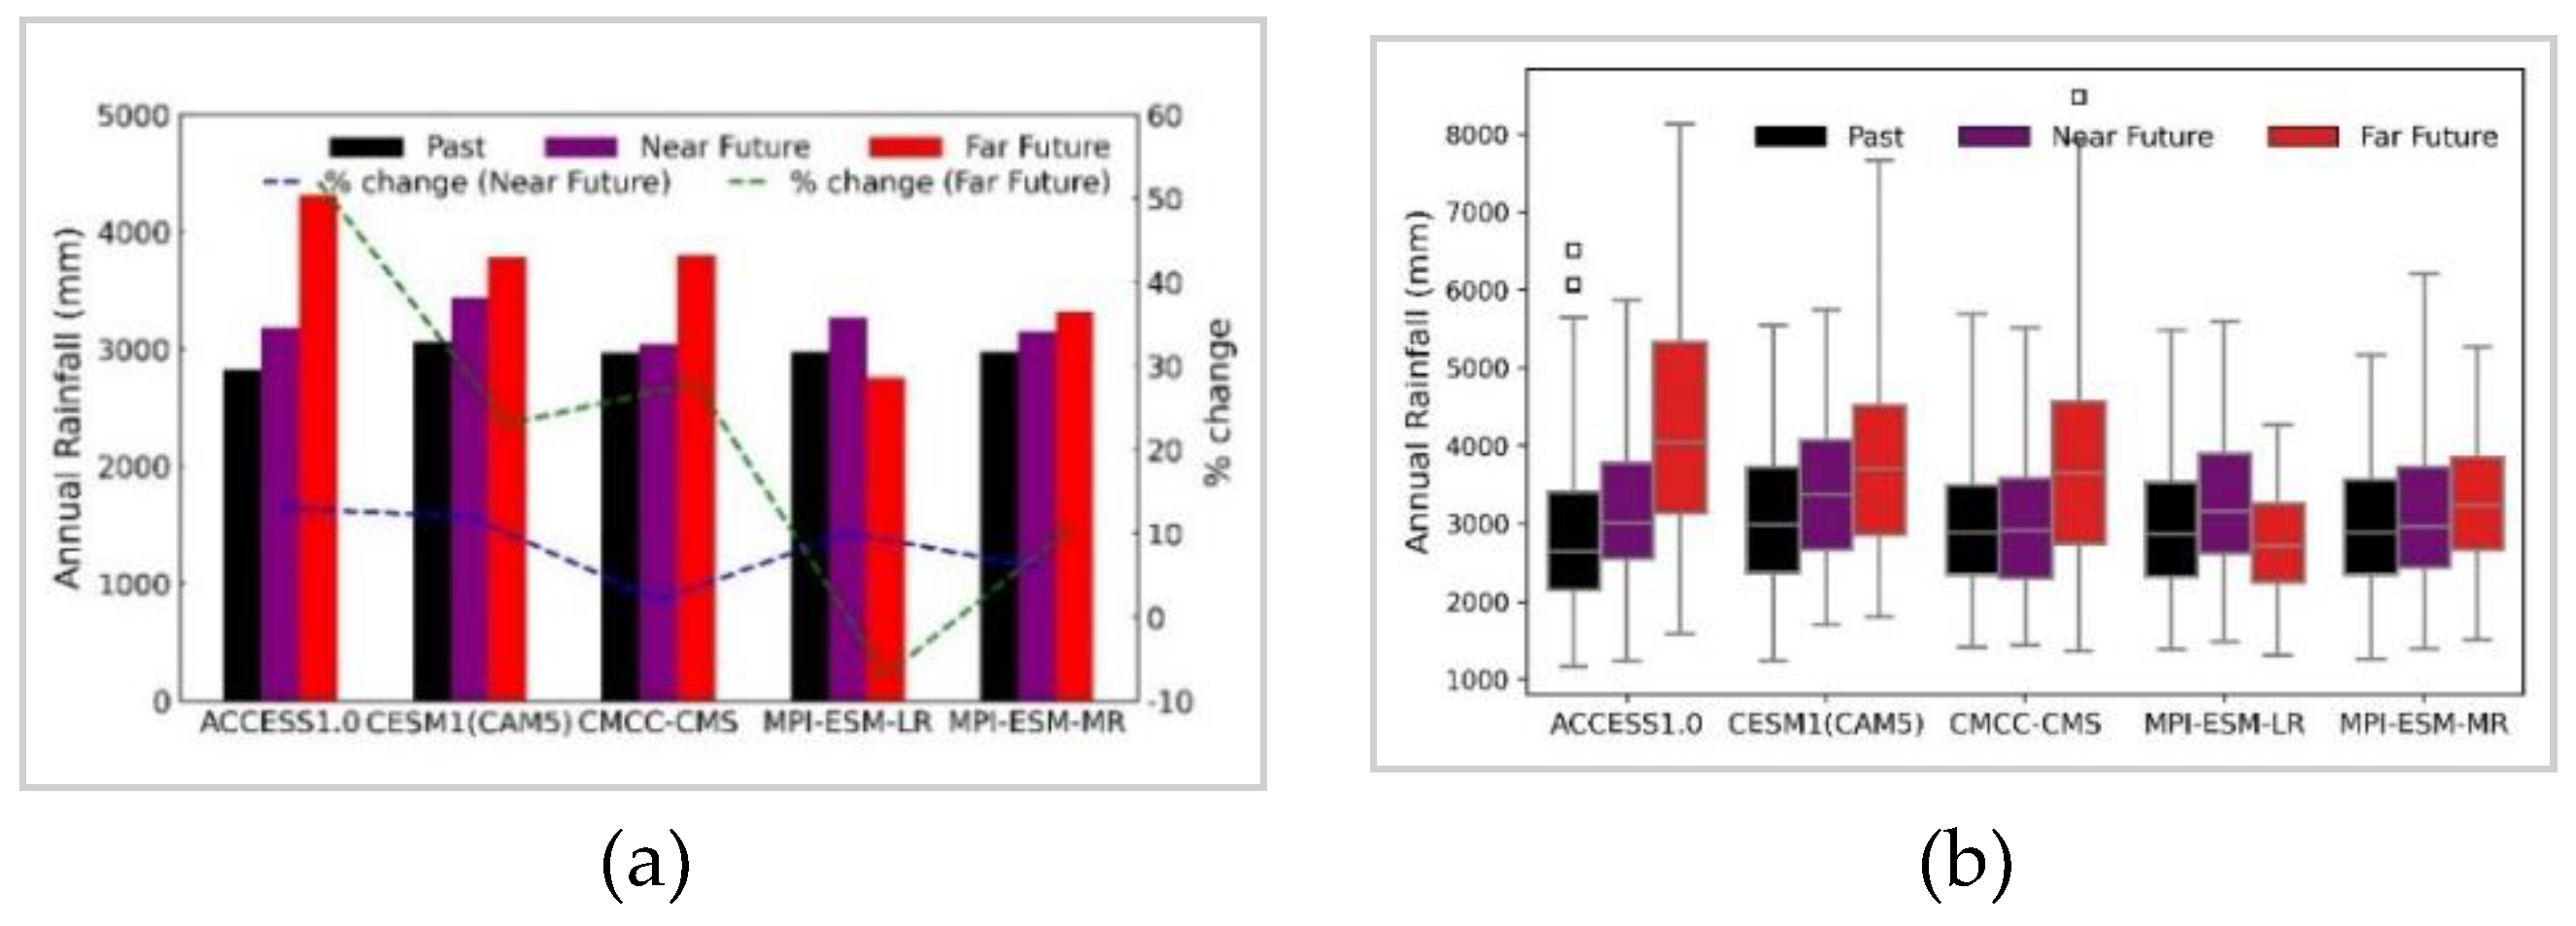
The effect of CC on the mean annual rainfall is depicted in
Figure 3a for each selected GCM, and the percentage change in the mean annual rainfall has been presented in
Table 4. All selected GCMs project an increasing trend in the near-future. On the other hand, four GCMs project an increasing trend in the far-future among the five selected GCMs. ACCESS1.0 projects the highest increasing trend for both the near-future and far-future. The lowest increasing trend is projected by CMCC-CMS and MPI-ESM-MR in the near-future and far-future, respectively. However, MPI-ESM-LR projects a decreasing trend in the far-future. The misrepresentation of topography due to the very coarse resolution of GCMs, model physics, etc. could be the reason for projecting less rainfall in the far-future by MPI-ESM-LR, this exceptional projection has been described in
Section 3.1.4.
Figure 3b illustrates that, with high inter-annual variability, the projected annual rainfall in both rainy and dry years shows an increasing trend for both the near-future and far-future except MPI-ESM-LR in the far-future. The results are consistent with previous studies conducted in Bangladesh [
9,
20,
45]. For example, the mean annual rainfall is projected to increase by 16.3%, 19.8%, and 29.6% in the Brahmaputra, Ganges, and Meghna basins, respectively [
7].
3.1.2. Effect of climate change on seasonal rainfall
Bangladesh has four climatic seasons: pre-monsoon (March–May), monsoon (June–September), post-monsoon (October–November), and winter (December–February) [
46]. In order to comprehend how CC affects seasonal rainfall, past, near-future, and far-future monthly rainfall for each selected GCM is analyzed and presented in
Figure 4.
Table 4 shows the percentage change in the mean seasonal rainfall. In the pre-monsoon season, three GCMs (CESM1(CAM5), CMCC-CMS, and MPI-ESM-LR) project an increasing trend in the near-future, whereas CMCC-CMS, MPI-ESM-LR, and MPI-ESM-MR project a decreasing trend in the far-future. In monsoon, all selected GCMs project an increasing trend in the near-future; however, only MPI-ESM-LR projects a decreasing trend in far-future, while the other four GCMs project an increasing trend in the far-future. ACCESS1.0 projects the highest increasing trend for both the near-future and far-future, whereas CMCC-CMS and CESM1(CAM5) project the lowest increasing trend during the monsoon in the near-future and far-future, respectively. As annual rainfall is dominated by monsoon rainfall in Bangladesh, a similar trend is observed for annual rainfall (described in
Section 3.1.1).
In the post-monsoon season, three GCMs (ACCESS1.0, CMCC-CMS, and MPI-ESM-LR) project a decreasing trend in the near-future, whereas ACCESS1.0, CESM1(CAM5), and MPI-ESM-LR project an increasing trend in the far-future. In winter, ACCESS1.0, CESM1(CAM5), and CMCC-CMS in the near-future, and ACCESS1.0, CMCC-CMS, and MPI-ESM-LR in the far-future project a decreasing trend. Therefore, monsoon rainfall is likely to increase in the future; however, the rainfall during the other three seasons has a high degree of uncertainty.
3.1.3. Effect of climate change on rainfall extremes and droughts
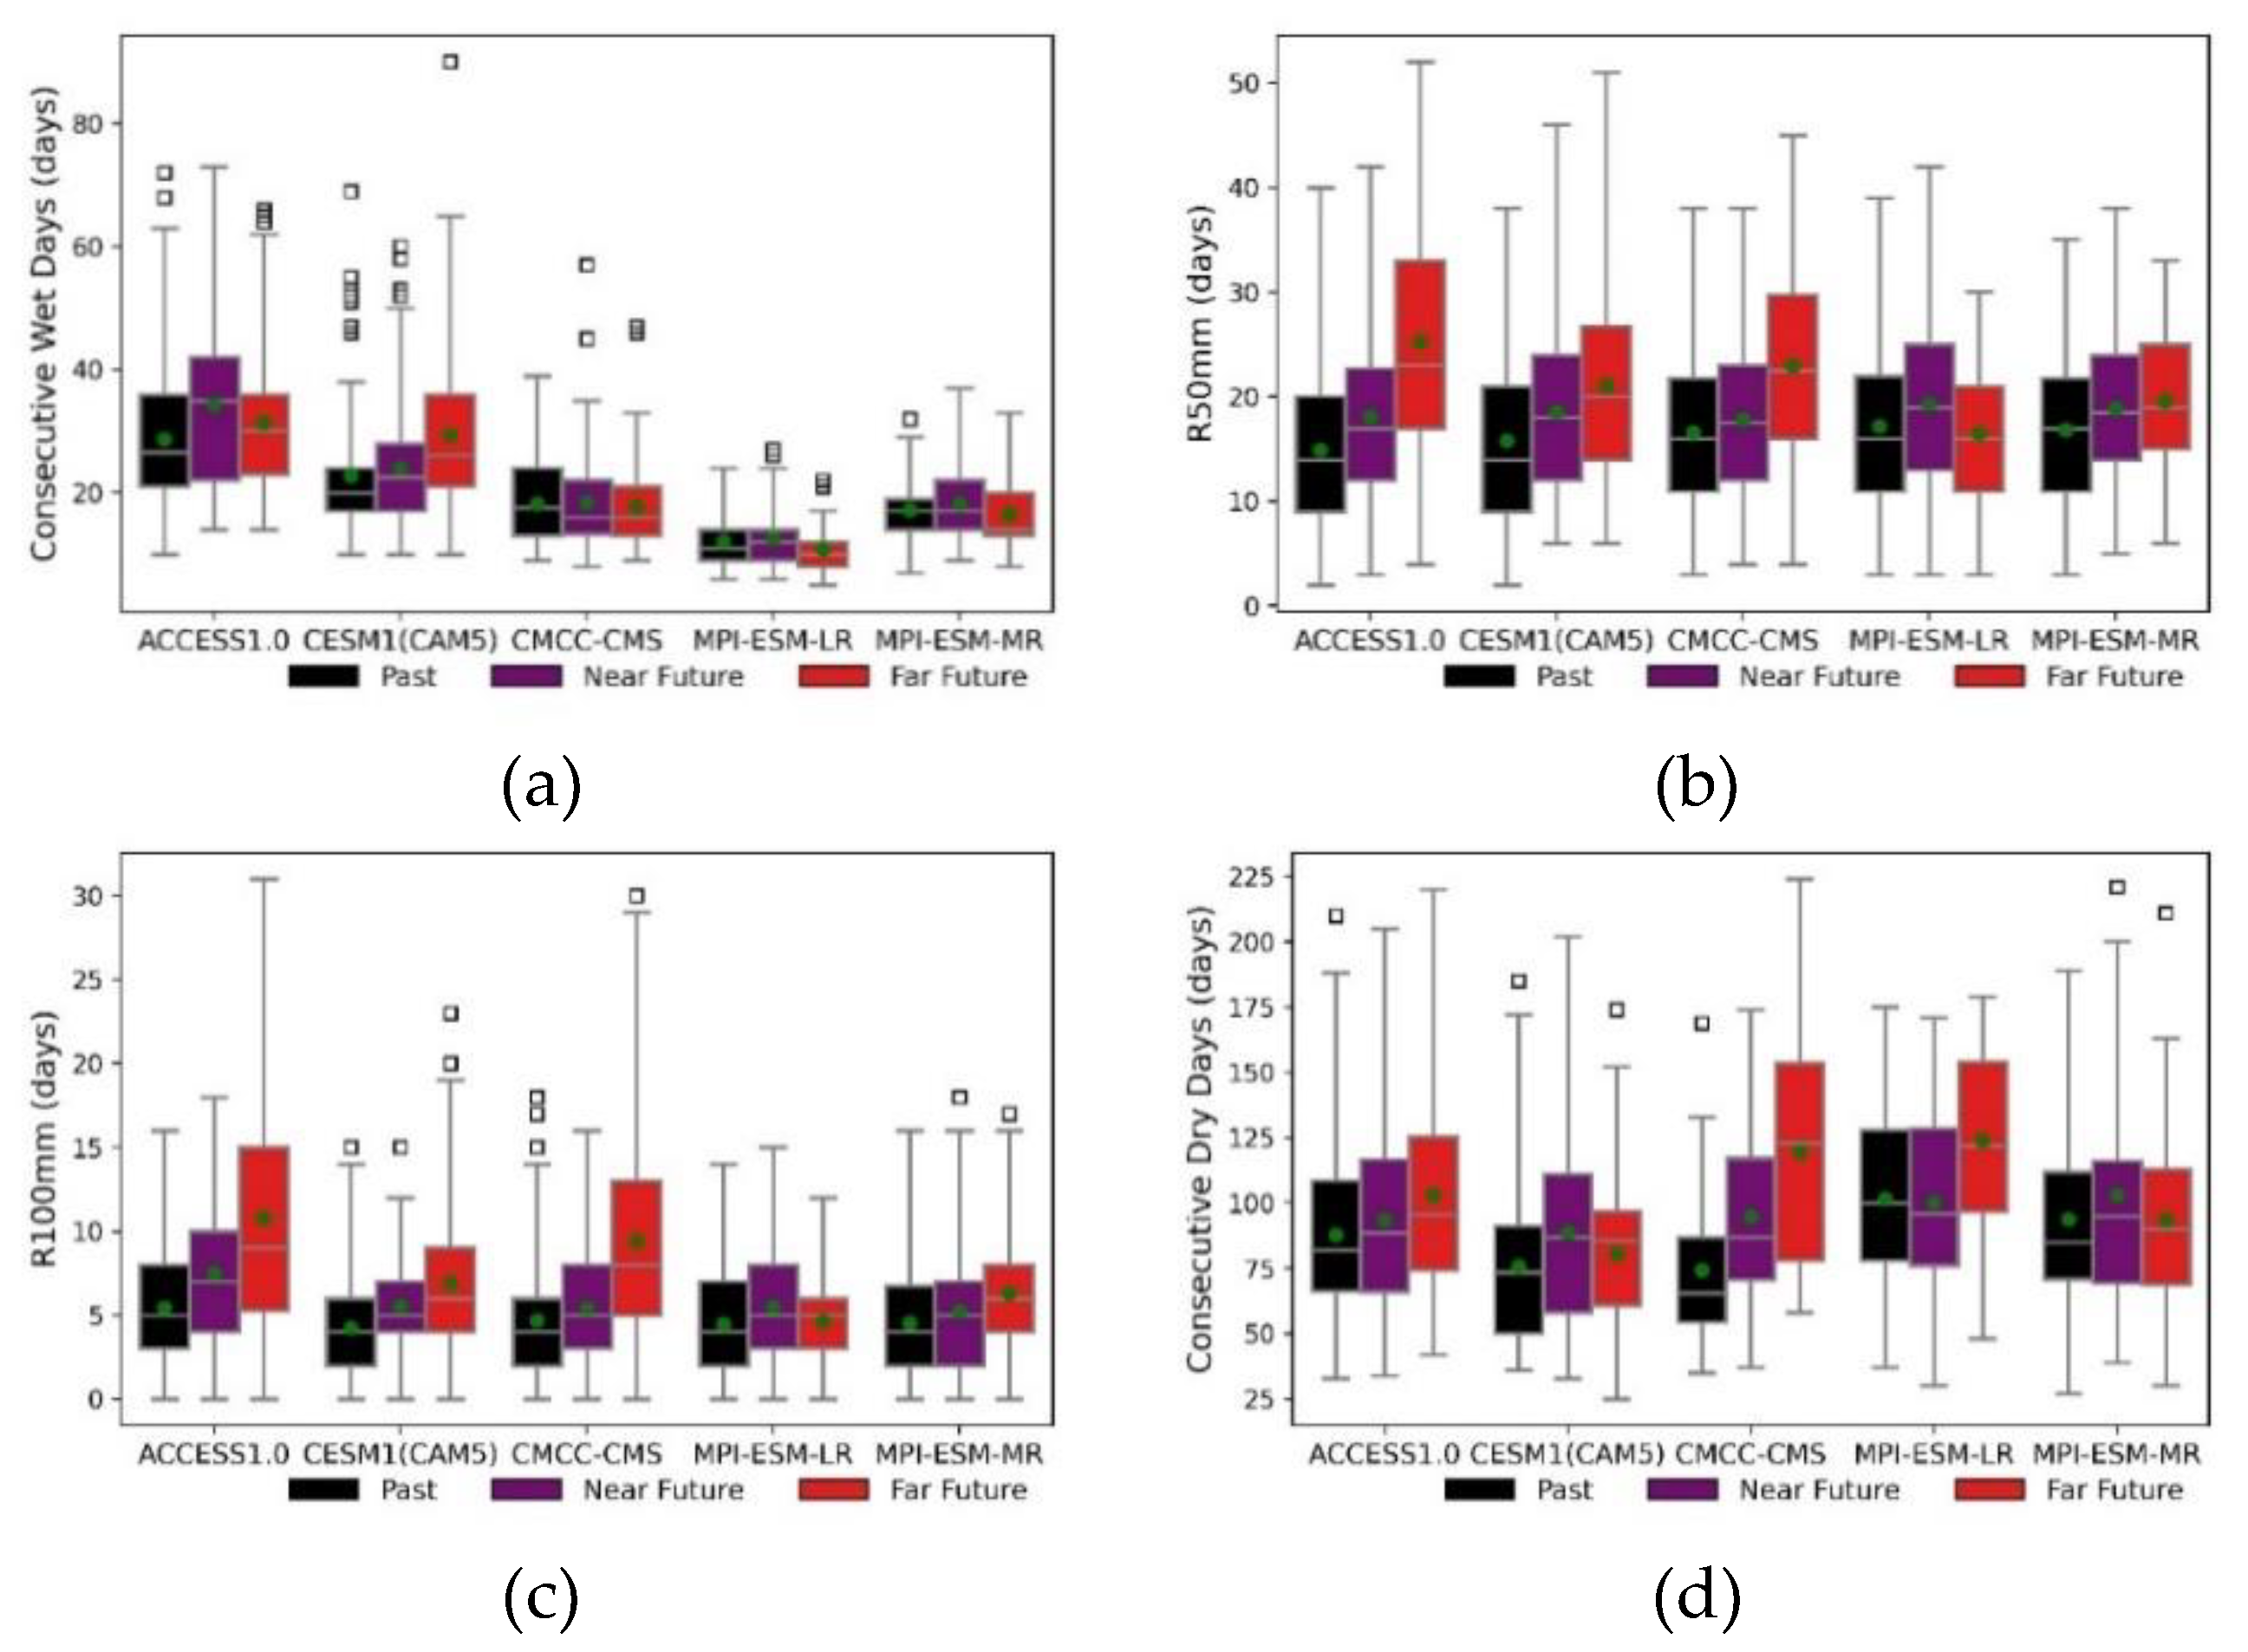
This study utilized four distinct rainfall indices, namely CWD, CDD, R50mm, and R100mm, to examine both rainfall extremes and droughts. Based on the findings presented in
Figure 5a and
Table 4, it can be observed that the mean of CWD in two GCMs, namely ACCESS1.0 and CESM1(CAM5), project an increasing trend. Conversely, the remaining GCMs do not display any notable changes. Thus, in order to evaluate the extreme event, we proceed to analyse the R50mm and R100mm.
The results presented in
Figure 5b and
Table 4 indicate that, in the near-future, all of the chosen GCMs exhibit an upward trend for R50mm. In the far future, four out of the five selected GCMs project an increasing trend for R50mm. However, MPI-ESM-LR projects a marginally decreasing trend (4%) in the far-future. On the other hand, R100mm projects an increasing trend for all selected GCMs in both the near-future and far-future (
Figure 5c). Though MPI-ESM-LR projects a decreasing trend of annual rainfall and monsoon rainfall in far-future, the model also projects an increasing trend for R100mm. Consequently, it is
virtually certain that the annual number of days with daily rainfall greater than 100mm will increase in the future.
The mean CDD of four GCMs projects an increasing trend for both the near-future and far-future among the five selected GCMs (
Figure 5d and
Table 4). Though MPI-ESM-LR and MPI-ESM-MR project a decreasing trend of mean CDD for the near-future and far-future respectively, the decreasing trend is marginal (within 1% for both models). CMCC-CMS projects the highest increasing trend for both the near-future and the far-future. Therefore, the mean of CDD is
likely to increase in both the near-future and far-future.
As a consequence, extreme floods will occur more frequently during the monsoon, while droughts will occur more frequently during the winter. These intensified floods and droughts will have detrimental effects on human life, the ecosystem, agricultural productivity, transportation, and the tourism industry.
3.1.4. Uncertainty of MPI models
MPI-ESM-LR projects a decreasing trend for mean annual rainfall and mean monsoon rainfall in the far-future, as described in
Section 3.1.1 and 3.1.2.
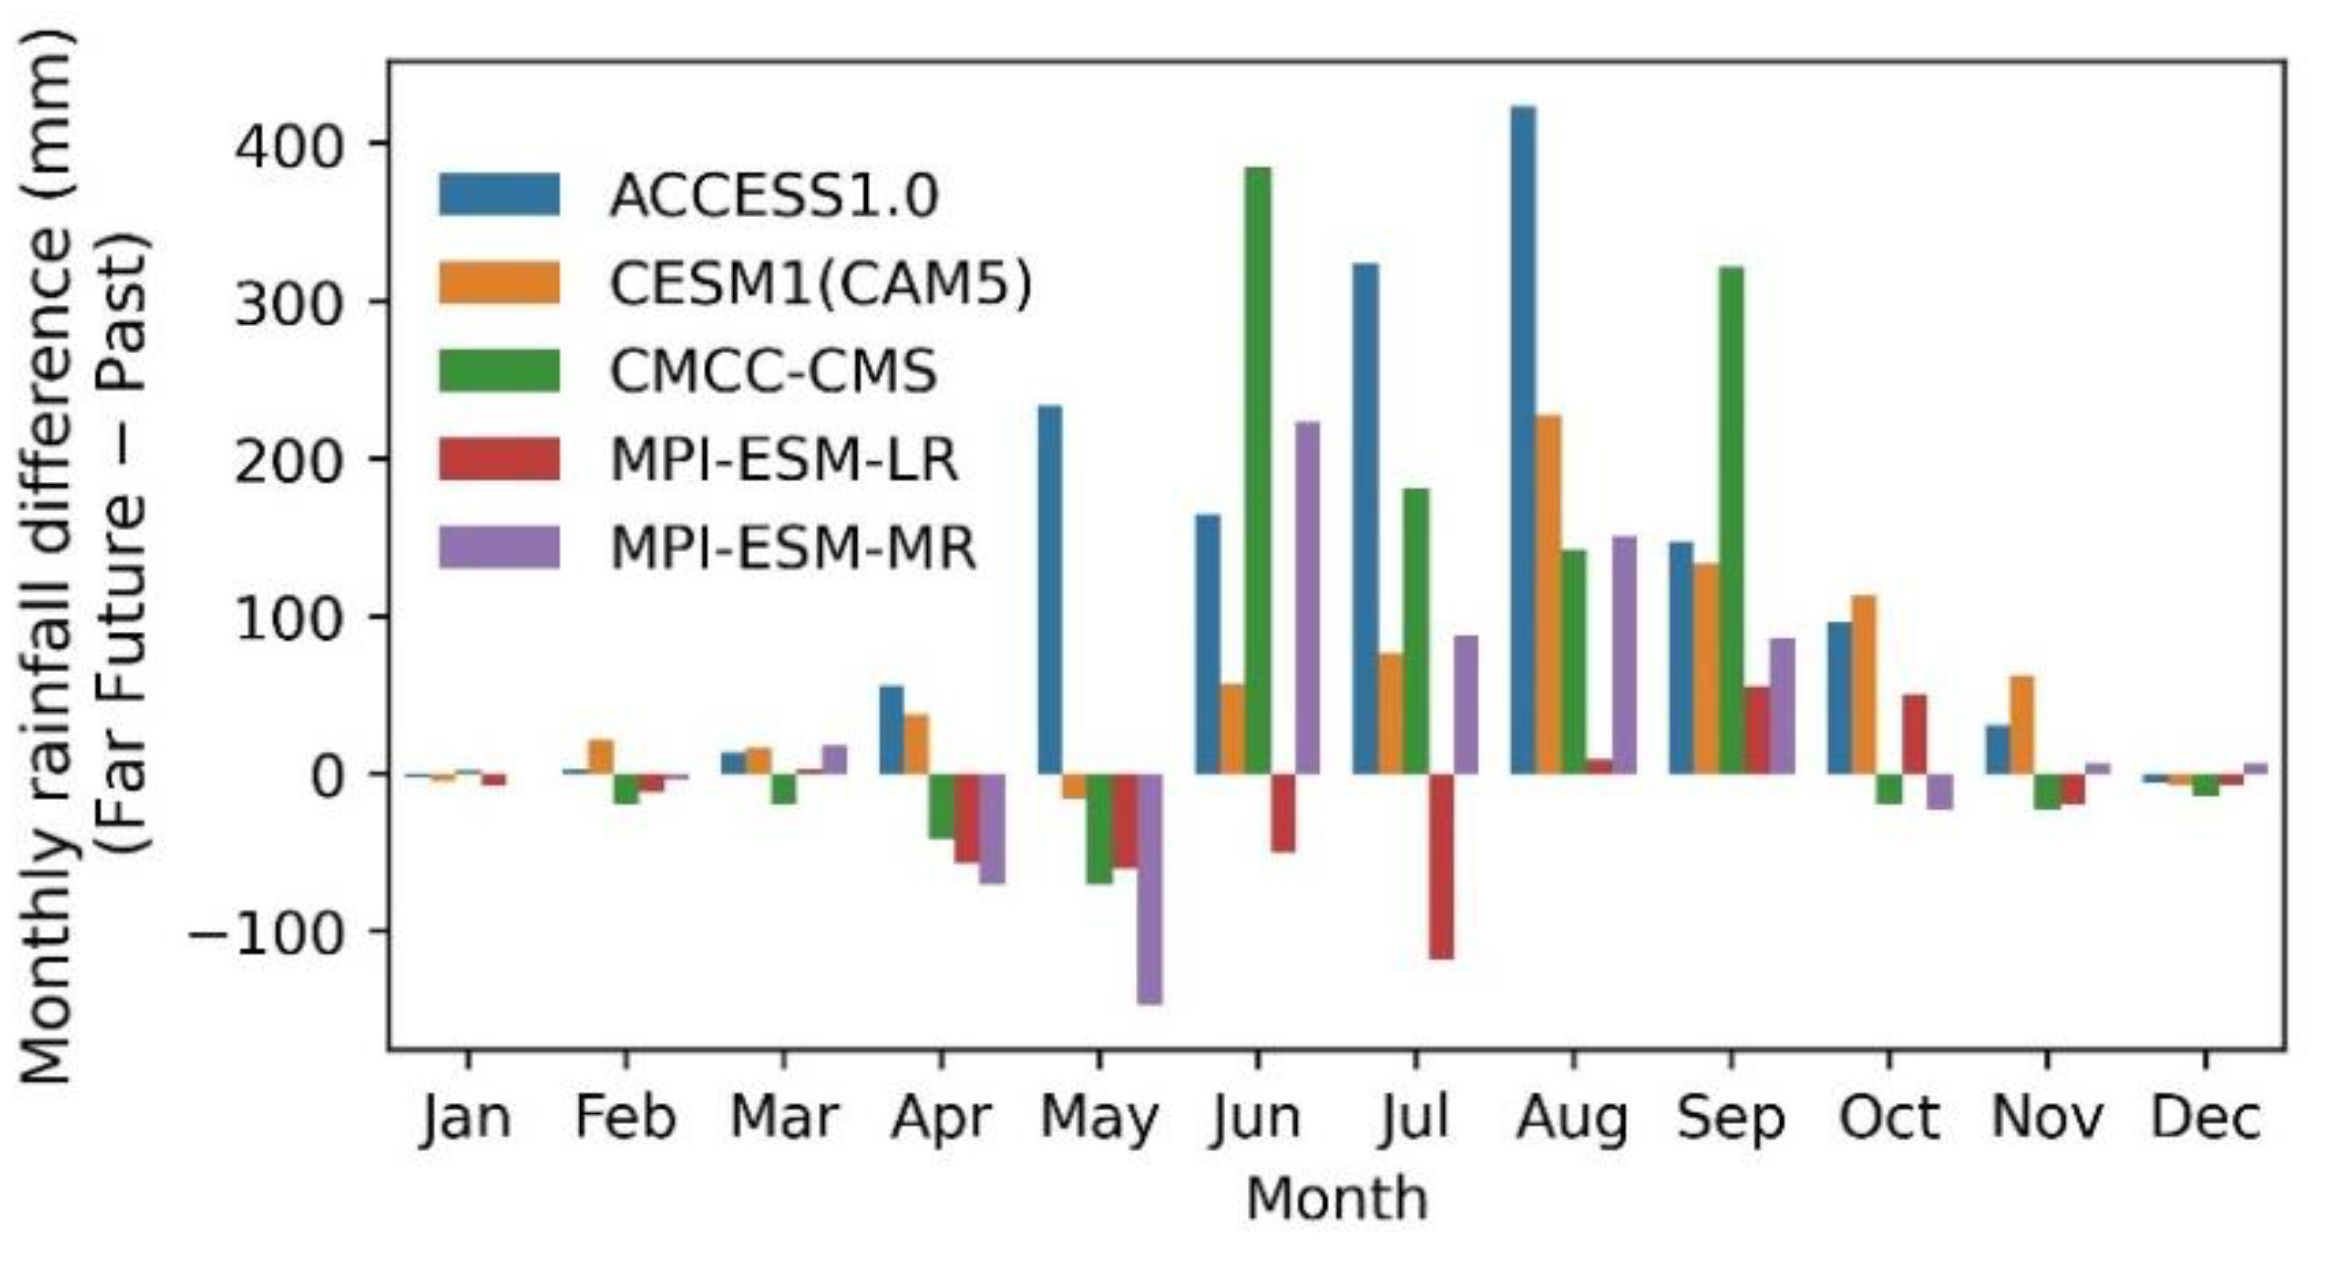
Figure 6 demonstrates that only MPI-ESM-LR projects a decrease in monthly rainfall in the months of June and July in the far-future. The Figure also reveals that the monthly rainfall difference in July (118 mm) is about two and a half times greater than the monthly rainfall difference in June (50 mm). In order to comprehend why MPI-ESM-LR projects a decreasing trend while the other four selected GCMs project an increasing trend in July, we evaluated the wind and pressure fields, which have been described in the following paragraphs.
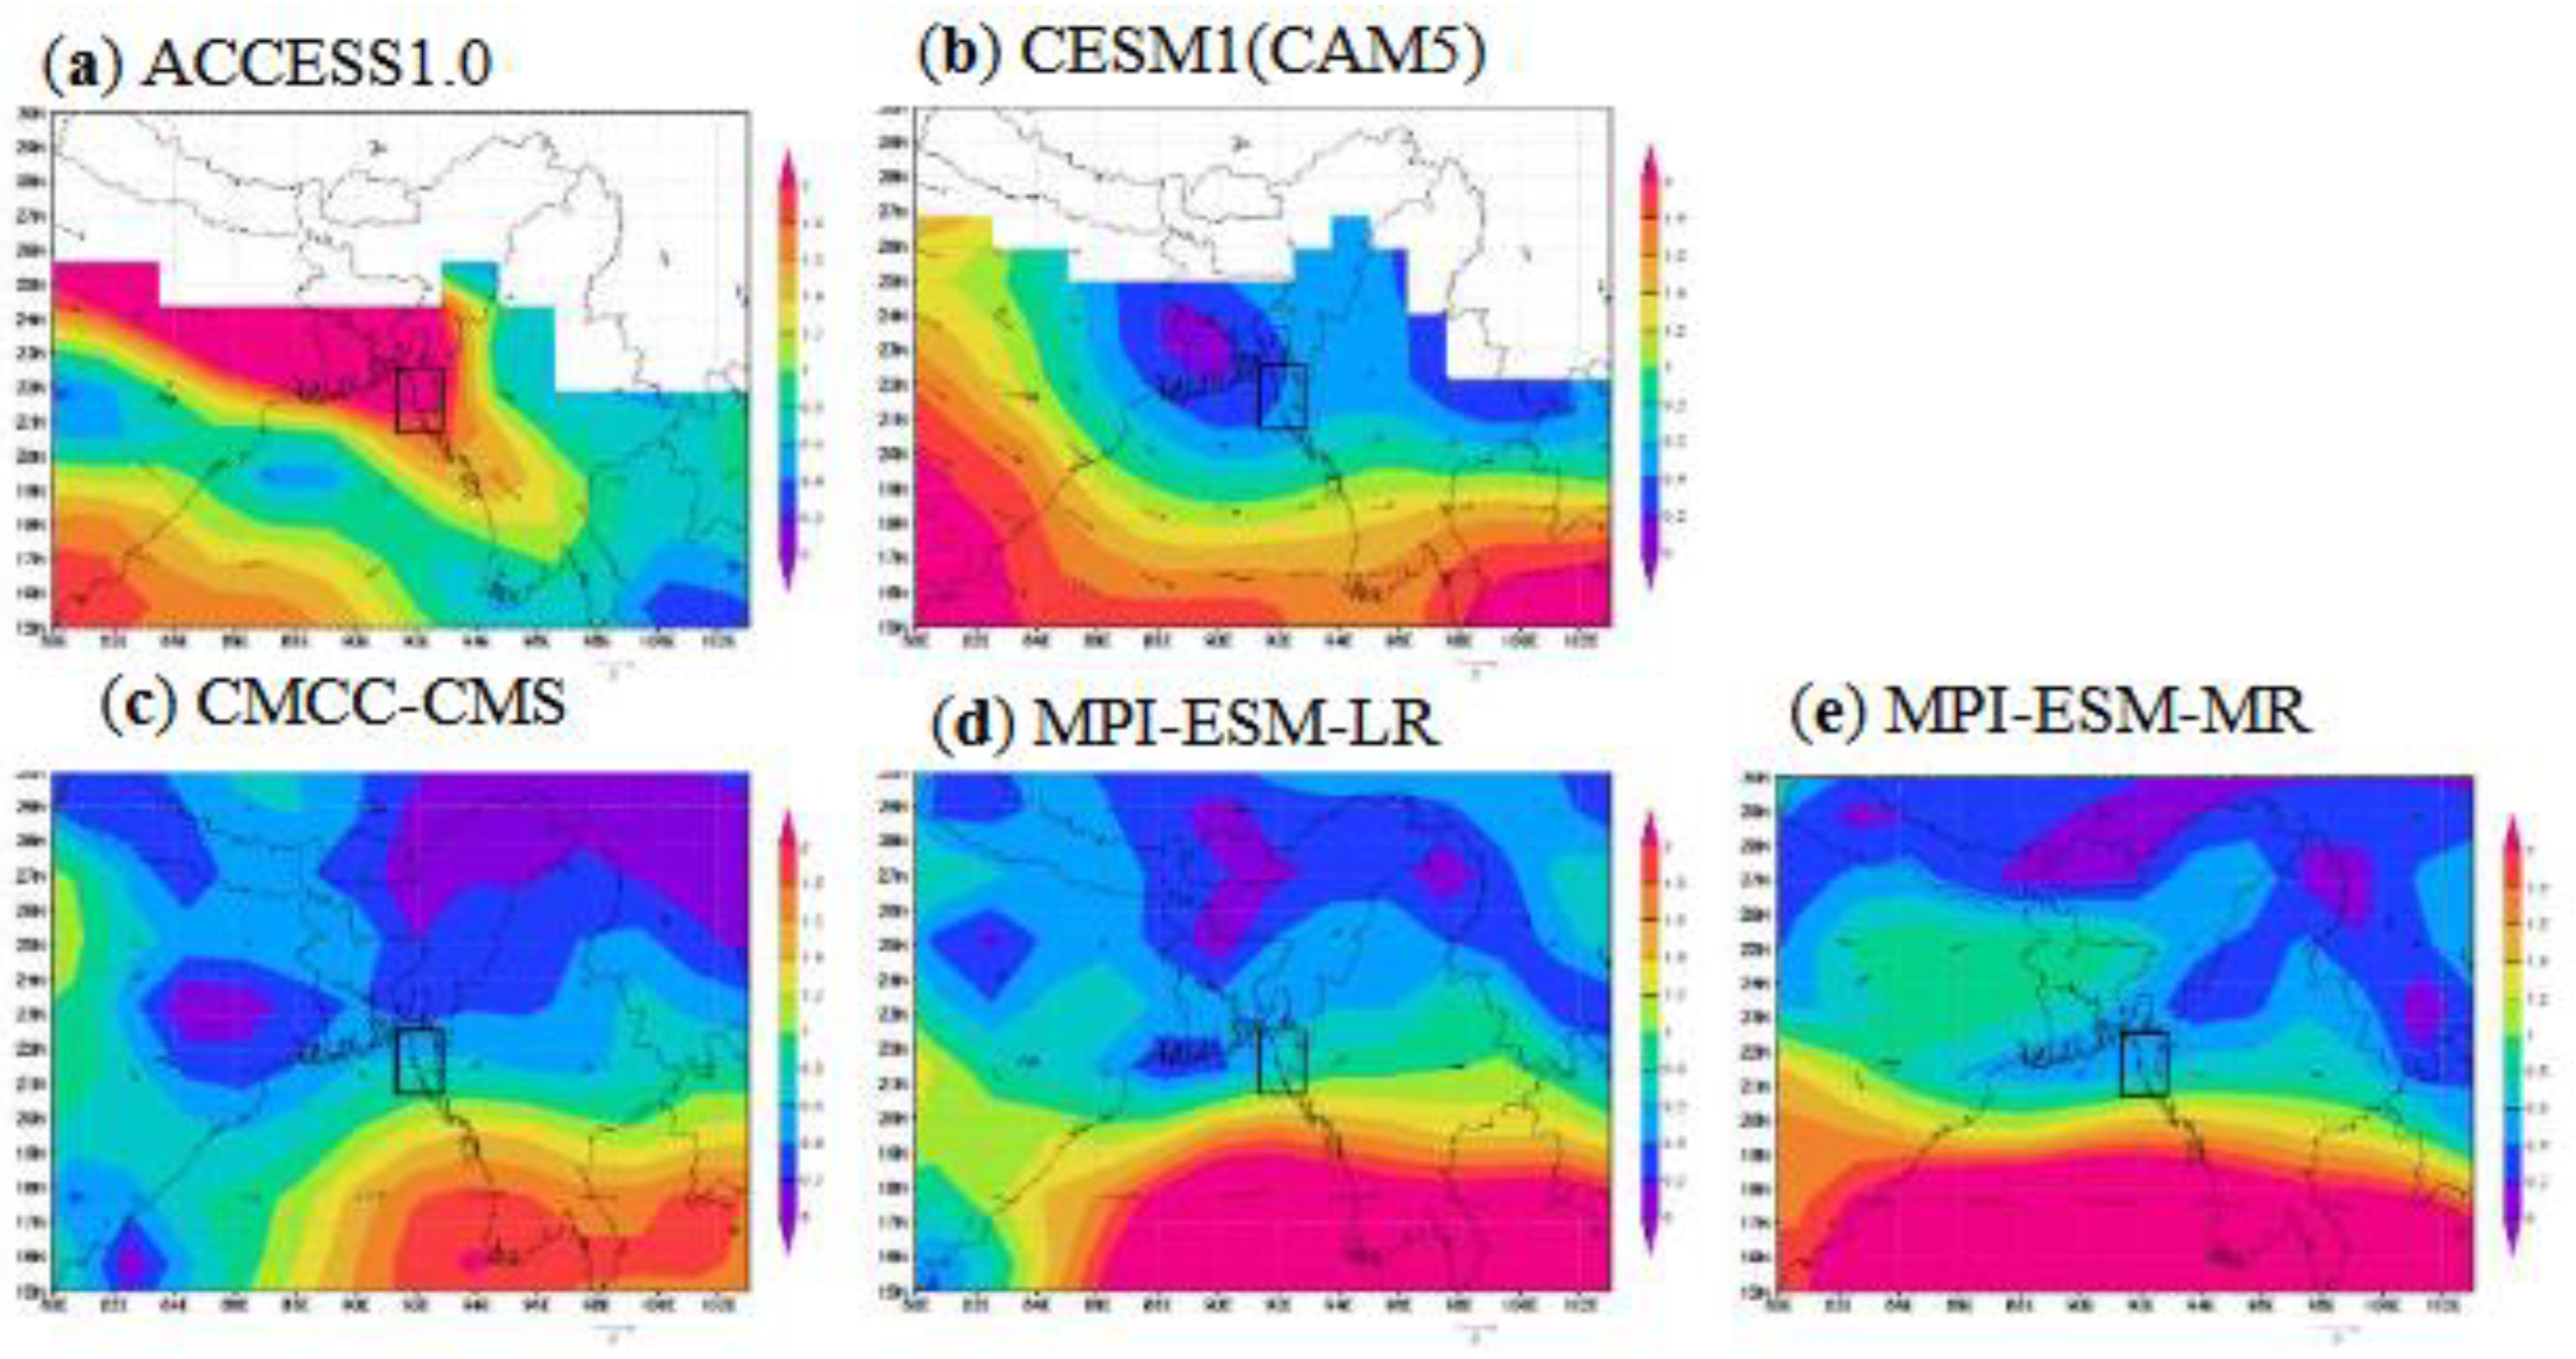
Figure 7 depicts the wind direction and the wind speed ratio (far-future divided by past) for the month of July.
Figure 7a demonstrates that ACCESS1.0 exhibits a higher wind projection (with a ratio greater than 1) in July for the far-future time period, as compared to the past. More wind transports more water vapor, resulting in increased rainfall. Therefore, ACCESS1.0 projects an increasing trend of rainfall in the far-future. On the other hand, though CESM1(CAM5) and CMCC-CMS project less wind (the ratio of far-future wind to past wind is less than 1), the wind direction is from east to west. The wind that blows from east to west transports moisture from the Bay of Bengal and the Arabian Sea, thereby increasing the rainfall in Bangladesh. Consequently, the two models also projected an increase in rainfall.
The two models (MPI-ESM-LR and MPI-ESM-MR) of the Max Planck Institute project less wind (the ratio of far-future wind to past wind is less than 1), and the wind also blows from west to east on the northern region (23°N to 29°N) of the basin (basin areas are within the black rectangle in
Figure 7), whereas wind blows from east to west on the southern region (15°N to 21°N) of the basin. Therefore, for further understanding of the decreasing trend of rainfall by the MPI-ESM-LR model and the increasing trend of rainfall by the MPI-ESM-MR model, we analyzed the pressure fields of the MPI models.
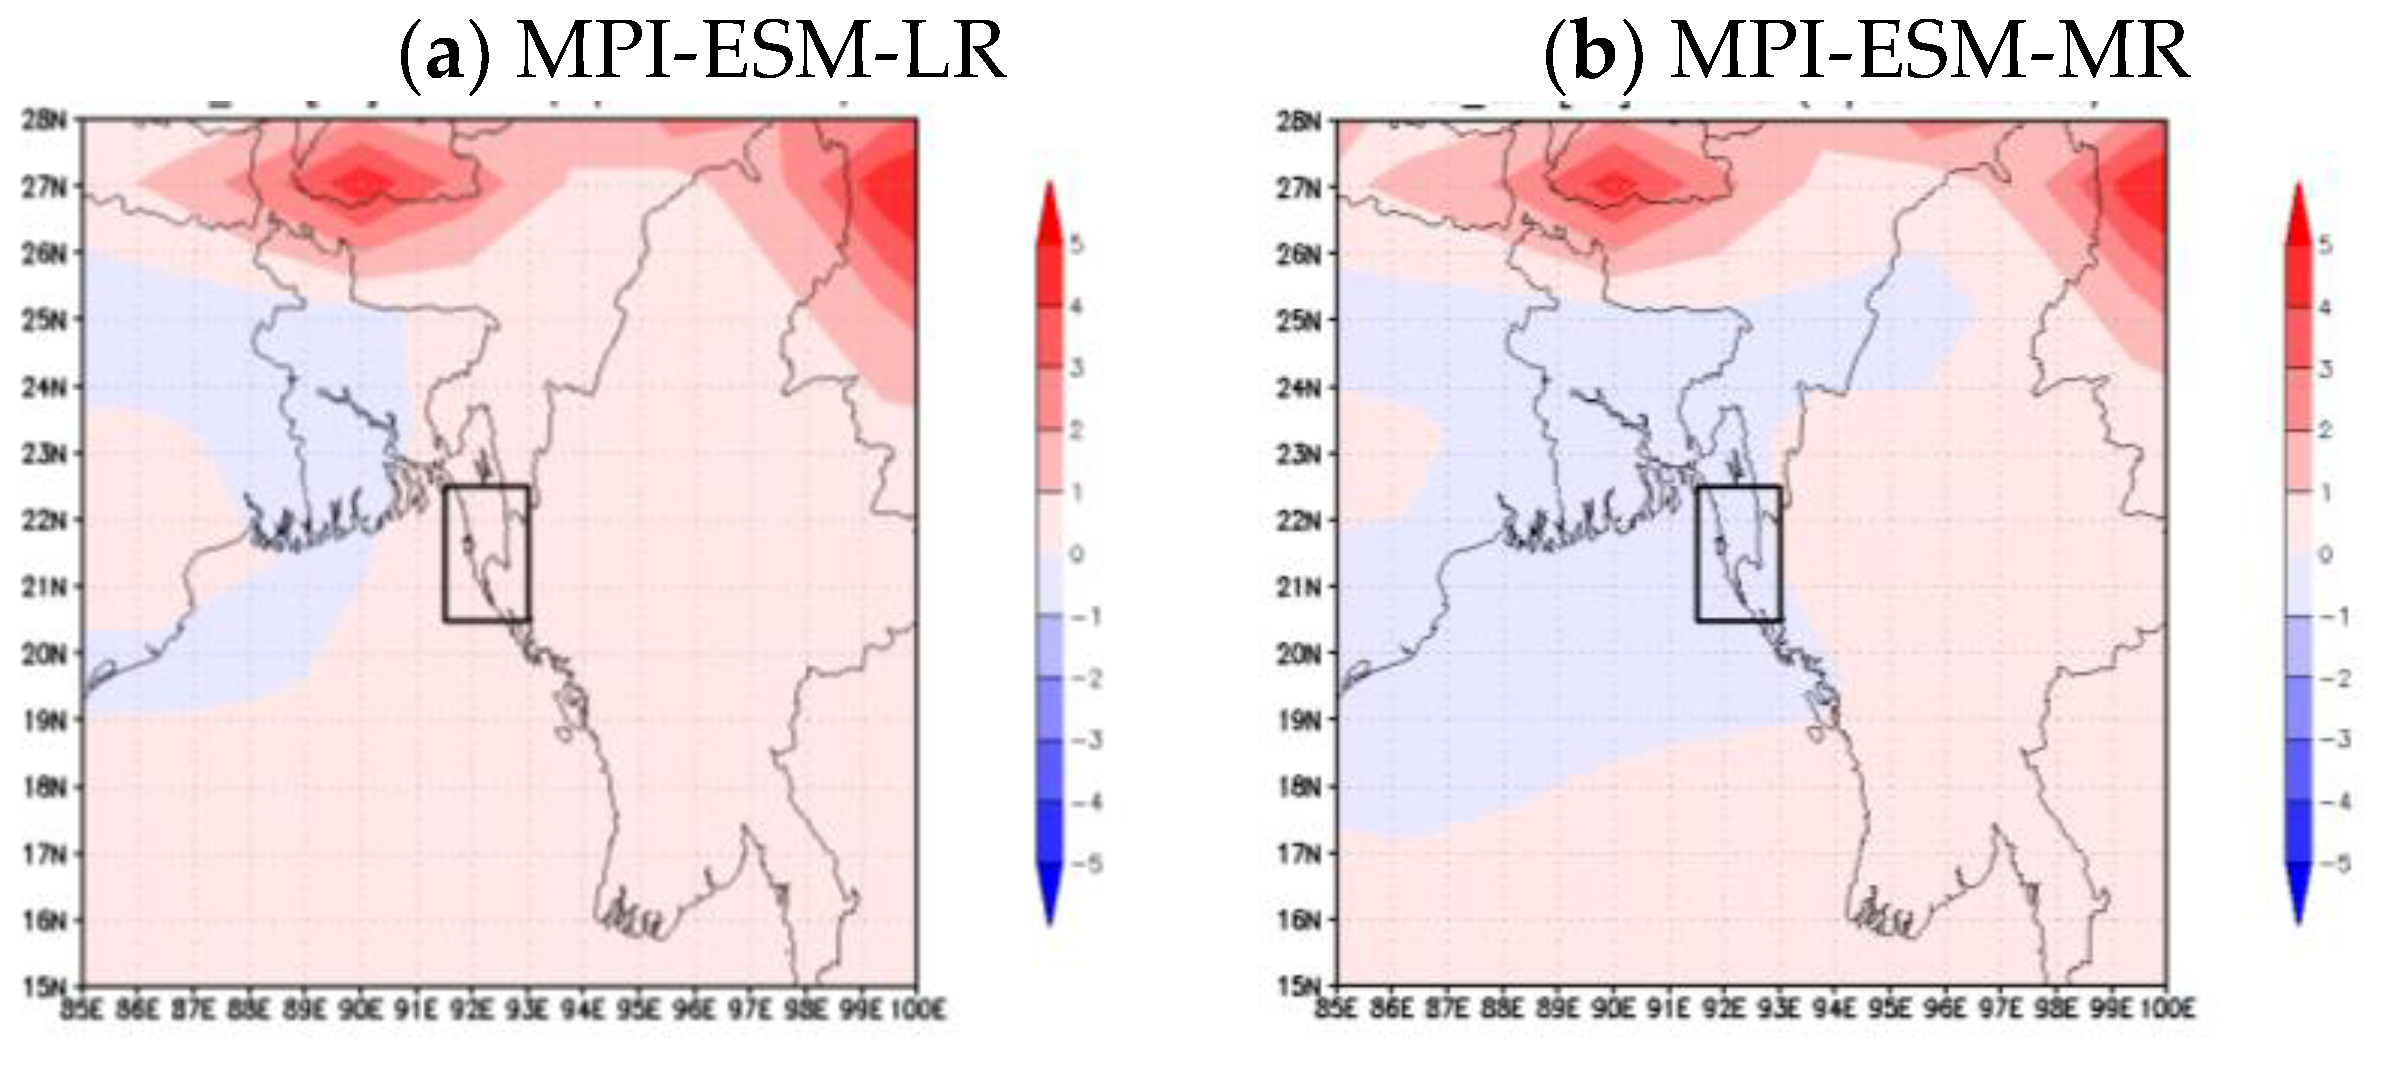
Figure 8 shows the difference in atmospheric pressure between the far-future and the past for the MPI-ESM-LR and MPI-ESM-MR models. Significant variation exists in the distribution of the difference in air pressure between the two models. In MPI-ESM-LR, the far-future pressure field is positive. It is thought that the presence of a high-pressure field close the ground surface in the basin will result in a divergence field and will not increase rainfall. On the other hand, MPI-ESM-MR projects a low atmospheric pressure field in the basin. The low pressure field generates a convergence field, leading to an increase in rainfall. Therefore, in July, MPI-ESM-LR projects less rainfall in the far-future than in the past, whereas MPI-ESM-MR projects more rainfall in the far-future.
3.2. Model Performance
3.2.1. Discharge calibration and validation
The static and dynamic data (described in
Section 2.3) for the WEB-RRI model were prepared at the resolution of the model grid. Daily observed rainfall data from 1980 to 2005 was interpolated at model grid and 1-hour temporal resolution using the Thiessen method. The model was calibrated and validated using daily observed discharge data at Bandarban station (
Figure 1d).
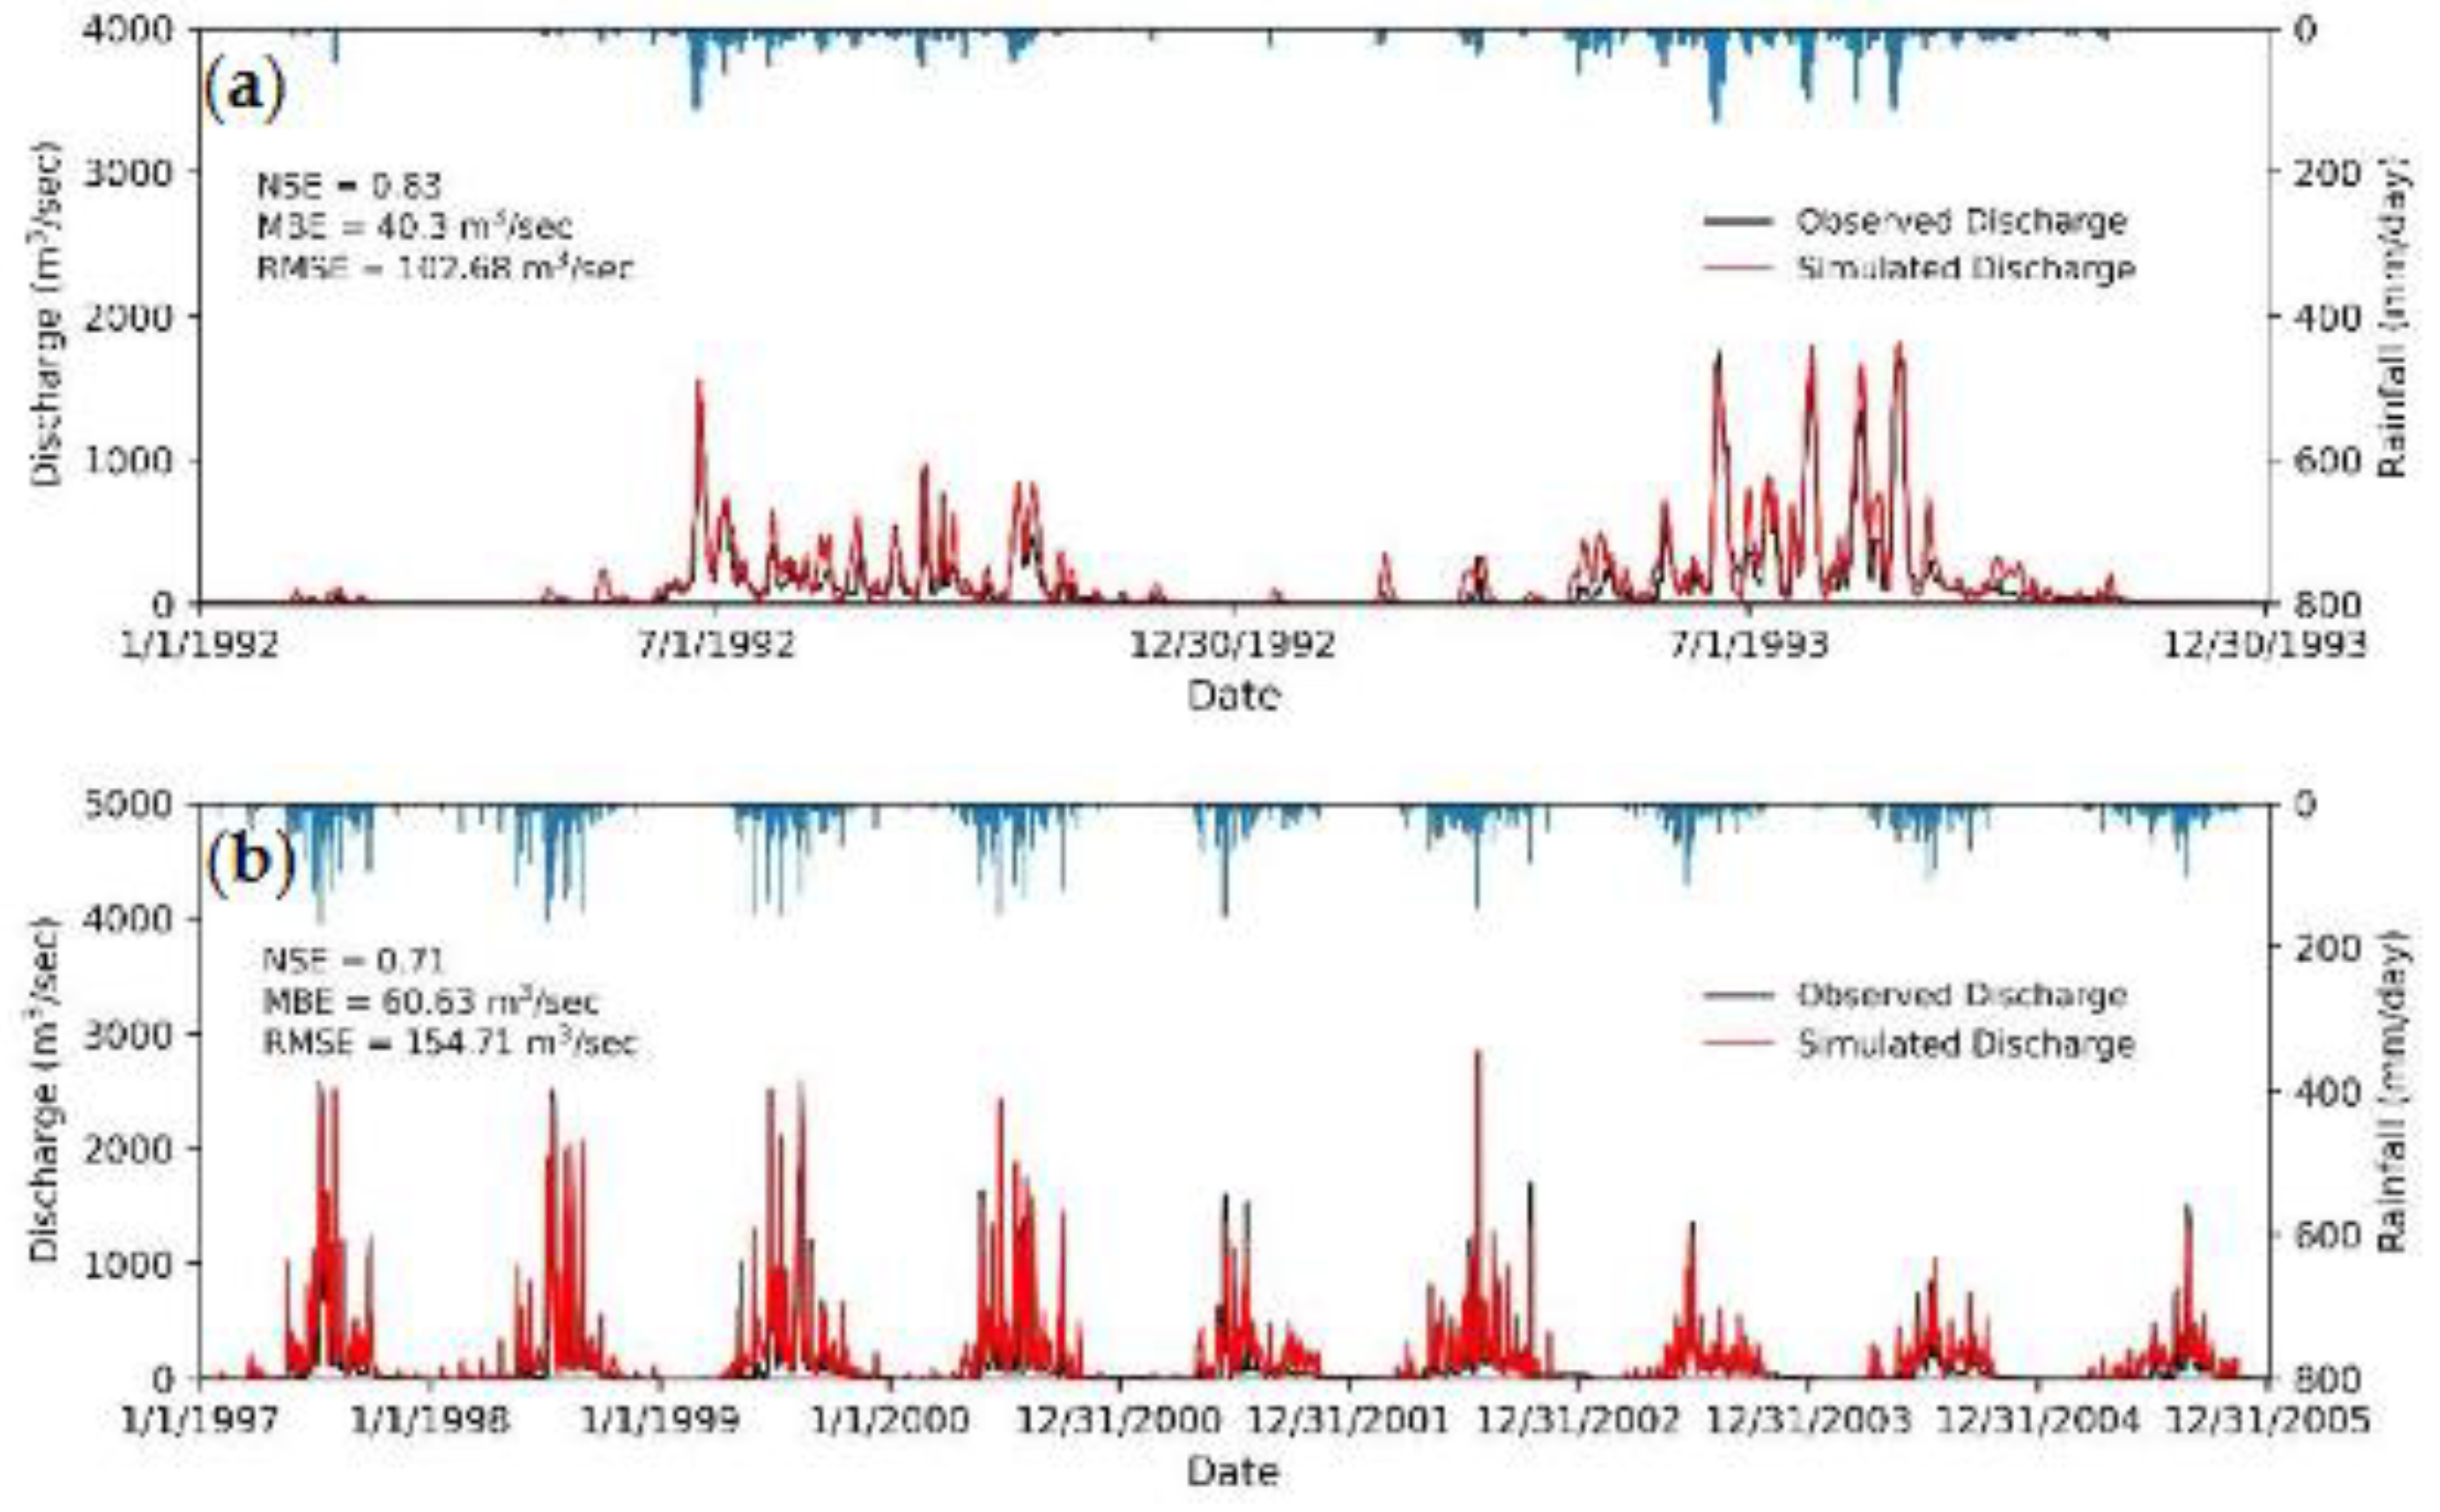
The model was calibrated for the years 1992–1993. The calibrated model could produce both base and peak discharge with NSE equal to 0.83 (
Figure 9a).
Table 5 displays the calibrated parameters. The same parameters were employed to validate the daily discharge at the same location from 1997 to 2005. The NSE for validation was 0.71 (
Figure 9b). The results obtained from the performance indices and
Figure 9 demonstrate that the model exhibits proficiency in simulating the maximum discharge, timing of the maximum discharge, and base flow. Consequently, the simulated model was employed to evaluate the hydrological responses in the Sangu River basin under CC.
3.2.2. Inundation validation
Bangladesh is a floodplain deltaic country, where the flood duration typically lasts for a few weeks, and in some cases, up to a month [
47]. However, the Sangu river basin is situated in the Chittagong Hilly tracts, where the flood duration ranges from two to five days [
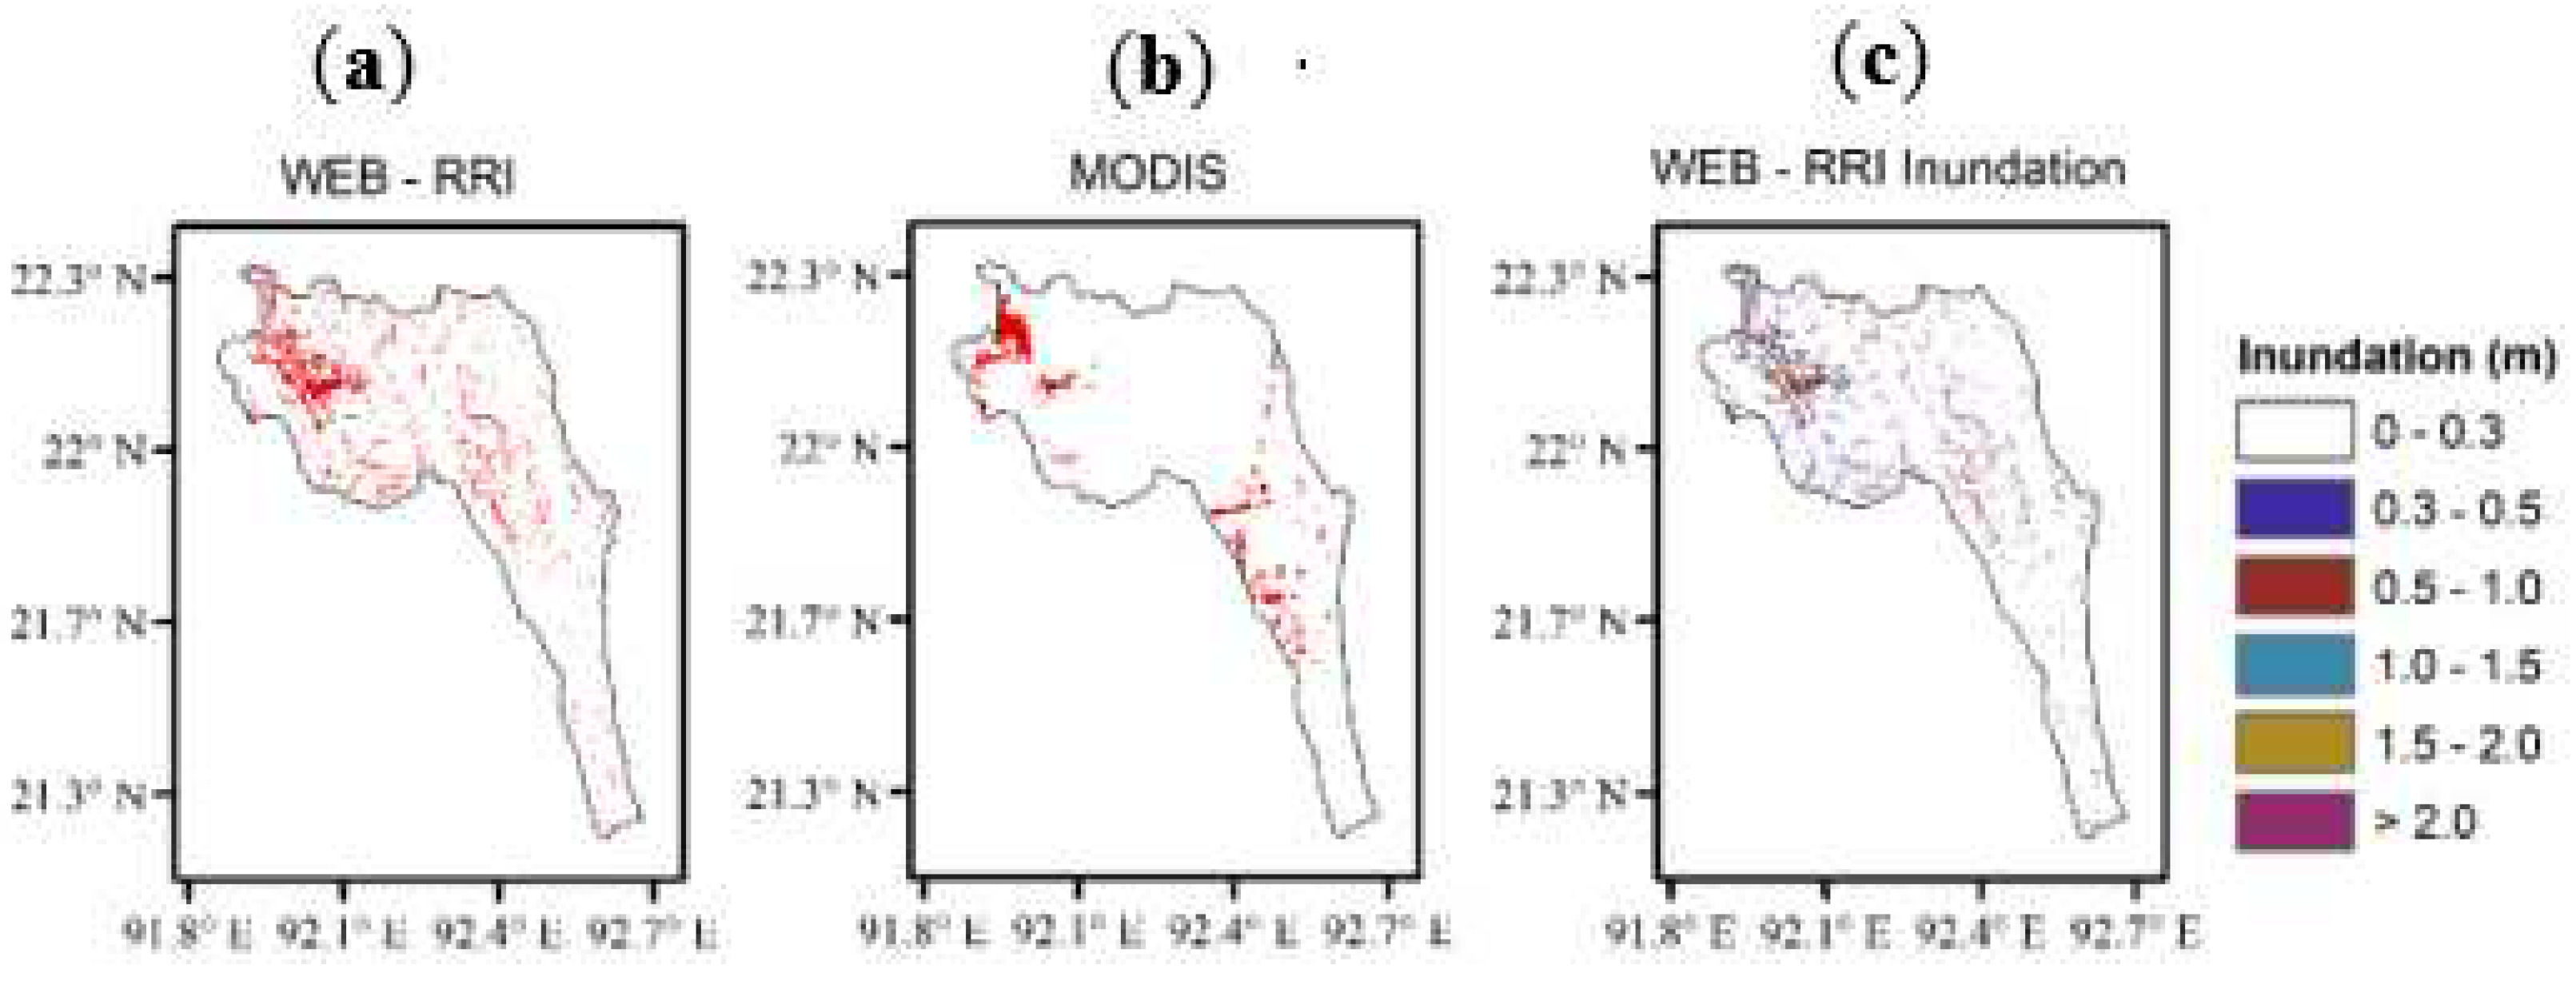
27]. Due to the short duration of the flood period in the basin, obtaining satellite-based inundation data that is free of cloud cover is a challenging task. Moreover, the unavailability of ground-based inundation data in the basin further compounds this issue. Therefore, the flood event of 2015 was analyzed using 8-day composite MODIS surface reflectance products (MOD09A1). The study utilized MODIS data (MOD09A1.A2015209) ranging from July 28th to August 4th, 2015 to conduct a comparative analysis between the MODIS inundation extent and the simulated inundation extent derived from WEB-RRI.
Figure 10 displays the comparison of the simulated inundation extent of WEB-RRI with the MLSWI of MODIS.
Flood depths of each grid greater than 0.3 m were considered as inundation for the WEB-RRI model. The MODIS inundation extent was obtained using the MLSWI method. Band 1 and Band 7 were used, and a threshold value of 0.4 was chosen for MLSWI analysis. The CSI value was about 0.12. The reason for the low CSI value is the time difference between the actual flood and MODIS data. In the 2015 flood, seven days (June 26, July 26-27, August 1, 2, and 20) were above the danger level at the Bandarban gauge station [
48], but the MODIS data was from July 28 to August 4. Another reason for getting a low value is the CSI formulation itself. The non-inundated areas are not taken into account by the CSI; only the inundated areas are taken into account as defined in
Section 2.3.5.
3.2.3. Evapotranspiration validation
The WEB-RRI model has the ability to compute four distinct components of ET fluxes (i.e., soil evaporation, evaporation from ground intercepted water, evaporation from vegetation interception water, and transpiration). The ability to compute the different components of evapotranspiration (ET) confers great advantages for taking decisions about agriculture and land use under CC. To evaluate the performance of WEB-RRI simulated ET at basin scale, MODIS-observed 8-daily ET has been utilized in this study. Since MODIS ET data are on an 8-day basis, the averaged 8-day ET has been computed from the WEB-RRI simulated ET.
Figure 11 presents a comparison between basin averaged MODIS-observed 8-daily ET and 8-day averaged WEB-RRI simulated ET from the years 2009 to 2016.
Figure 11 illustrates the 8-day temporal variation of ET, indicating that both MODIS ET and WEB-RRI simulated ET exhibit fluctuations ranging from 1 mm/day to 6 mm/day. The Figure also represents that the pattern and fluctuation of WEB-RRI simulated ET are very similar to MODIS ET. MODIS ET and WEB-RRI simulated ET have a Pearson correlation coefficient (CC) of 0.64, and the RMSE is 1.10 mm/day. As a result, WEB-RRI demonstrates exceptional proficiency in computing ET fluxes within the Sangu river basin.
3.3. Hydrological impact assessment
3.3.1. Climate change impact on mean annual discharge
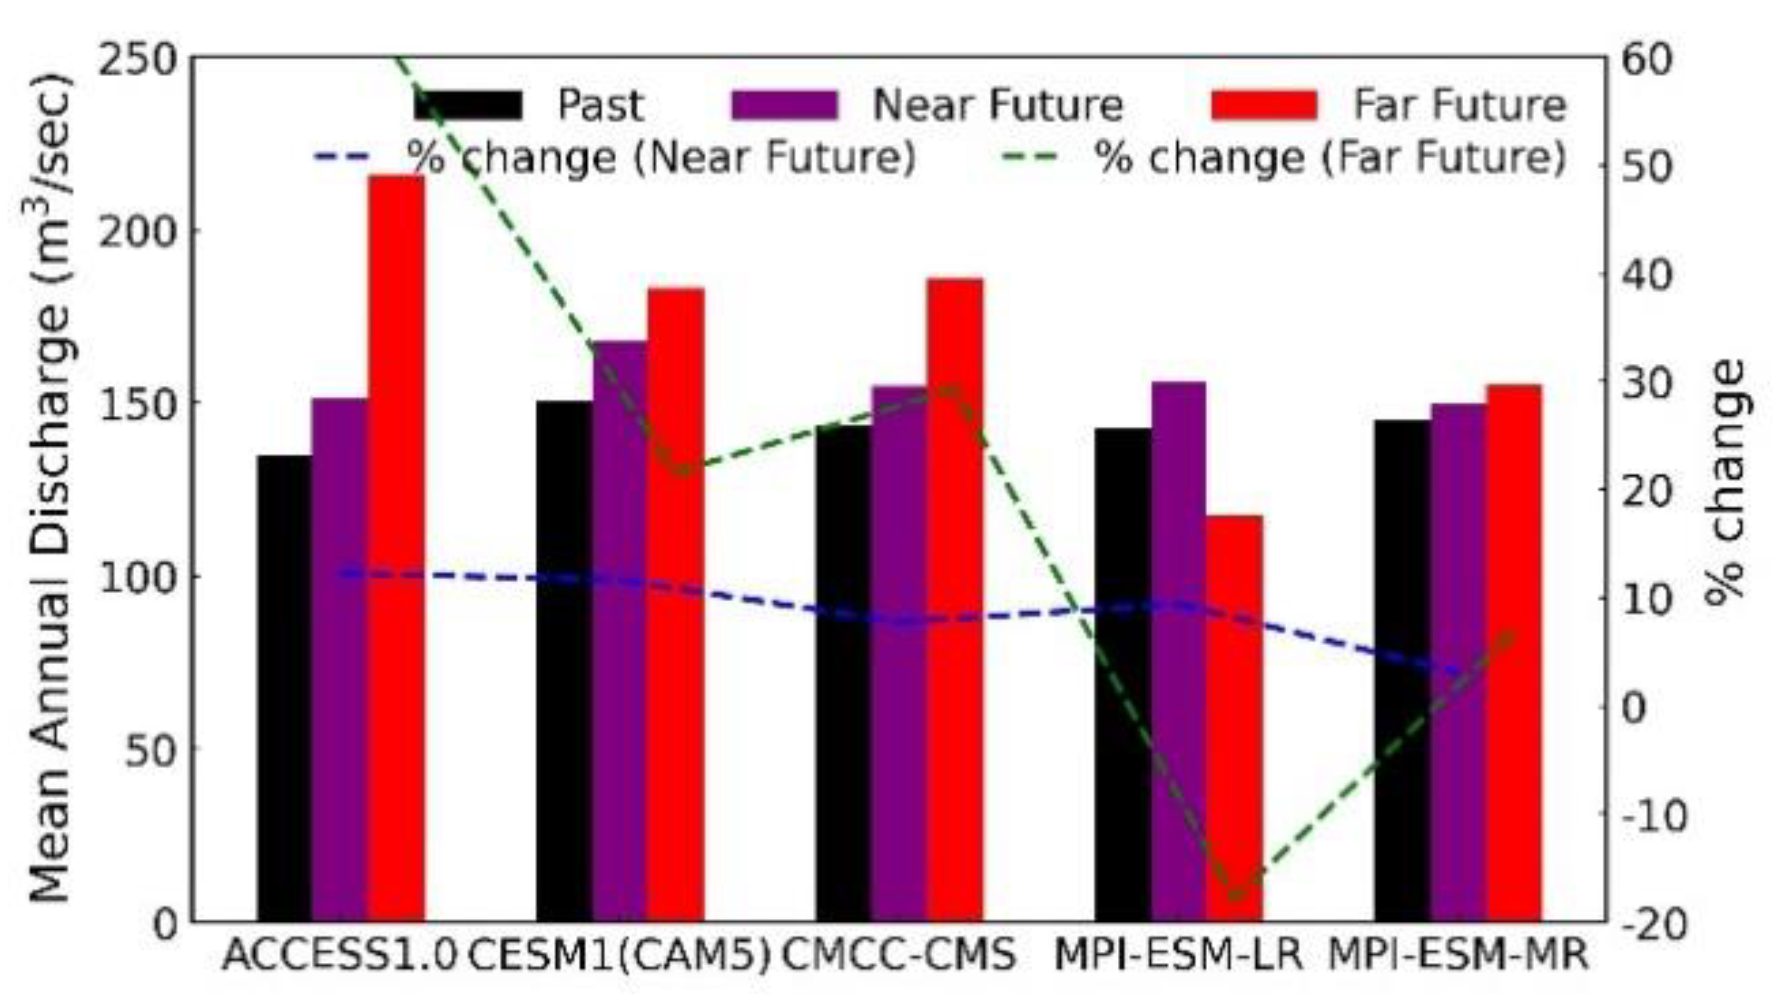
The effect of CC on the mean annual discharge is shown in
Figure 12 for each selected GCM and the percentage change in the mean annual discharge has been presented in
Table 6.
All selected GCMs project an increasing trend in the near-future. On the other hand, four of the five selected GCMs project an increasing trend in the far-future. ACCESS1.0 projects the highest increasing trend for both the near-future and far-future. The lowest increasing trend is projected by MPI-ESM-MR in both near-future and far-future. However, MPI-ESM-LR projects a decreasing trend in the far-future. A similar trend was found for mean basin average annual rainfall in the basin.
3.3.2. Climate change impact on annual daily maximum and annual daily minimum discharge
Figure 13 depicts the annual daily maximum discharge and annual daily minimum discharge for the past, near-future, and far-future.
Figure 13a and
Table 6 demonstrate that the projected mean annual daily maximum discharge for all selected GCMs exhibits an increasing trend in the near-future. On the other hand, the mean annual daily maximum discharge in the far-future projects an increasing trend for the four GCMs but a decreasing trend for the MPI-ESM-LR. Therefore, the mean annual daily maximum discharge in the Sangu river basin is
virtually certain to increase in the near-future and
likely to increase in the far-future. The projection of an increasing trend in the annual daily maximum discharge in the basin is due to the rise in discharge during the monsoon season, as well as the increase in R50mm and R100mm in the basin.
Figure 13b and
Table 6 demonstrate that the mean annual daily minimum discharge for all selected GCMs trends to decrease in the near-future and the far-future. Therefore, the mean annual daily minimum discharge in the Sangu River is
virtually certain to decrease in both the near-future and far-future. Consequently, it is anticipated that there will be an increase in the frequency of floods during the monsoon season, while water scarcity is expected to prevail during the dry periods.
3.3.3. Climate change impact on seasonal flow
As described in
Section 3.1.2, Bangladesh has four climatic seasons: pre-monsoon (March–May), monsoon (June–September), post-monsoon (October–November), and winter (December–February). The impact of CC on each season was evaluated by analyzing and presenting the monthly discharge of selected GCMs, as depicted in
Figure 14.
Table 6 displays the percentage change in mean seasonal discharge for each selected GCM in the near-future and far-future. During the pre-monsoon season, three models (CESM1(CAM5), CMCC-CMS, and MPI-ESM-LR) project an increasing trend of seasonal flow in the near-future (10–25%), while CMCC-CMS, MPI-ESM-LR, and MPI-ESM-MR project a decreasing trend in the far-future (28–37%). Keeping consistent with the annual discharge, all selected GCMs in the near-future and with the exception of MPI-ESM-LR in the far-future, project an increasing trend of the seasonal discharge during the monsoon period. ACCESS1.0 projects the highest increasing trend by 20% and 59% in the near-future and far-future, respectively. During the post-monsoon period, four models (ACCESS1.0, CMCC-CMS, MPI-ESM-LR, and MPI-ESM-MR) in the near-future, but only two models (CMCC-CMS and MPI-ESM-MR) in the far-future projected decreasing trend. In winter, three GCMs (ACCESS1.0, CESM1(CAM5), and CMCC-CMS) in the near-future and four GCMs (ACCESS1.0, CMCC-CMS, MPI-ESM-LR, and MPI-ESM-MR) in the far-future project a decreasing trend of seasonal discharge.
The seasonal discharge of all selected GCMs project a similar trend to the seasonal discharge, except for MPI-ESM-MR in the near-future during post-monsoon and in the far-future during winter. The model projects that seasonal rainfall will increase by 7% during post-monsoon in the near-future and by 9% during winter in the far-future, but seasonal discharge will decrease by 6% during post-monsoon in the near-future and by 3% during winter in the far-future. The increasing trend of ET (will describe in
Section 3.3.6) in both the near-future and far-future could be one reason for projecting the opposite trend of seasonal discharge to the seasonal rainfall. The other four GCMs also project the seasonal discharge, whether it has a relatively less increasing trend or a relatively high decreasing trend than the seasonal rainfall during the post-monsoon and winter.
3.3.4. Climate change impact on high flow and low flow
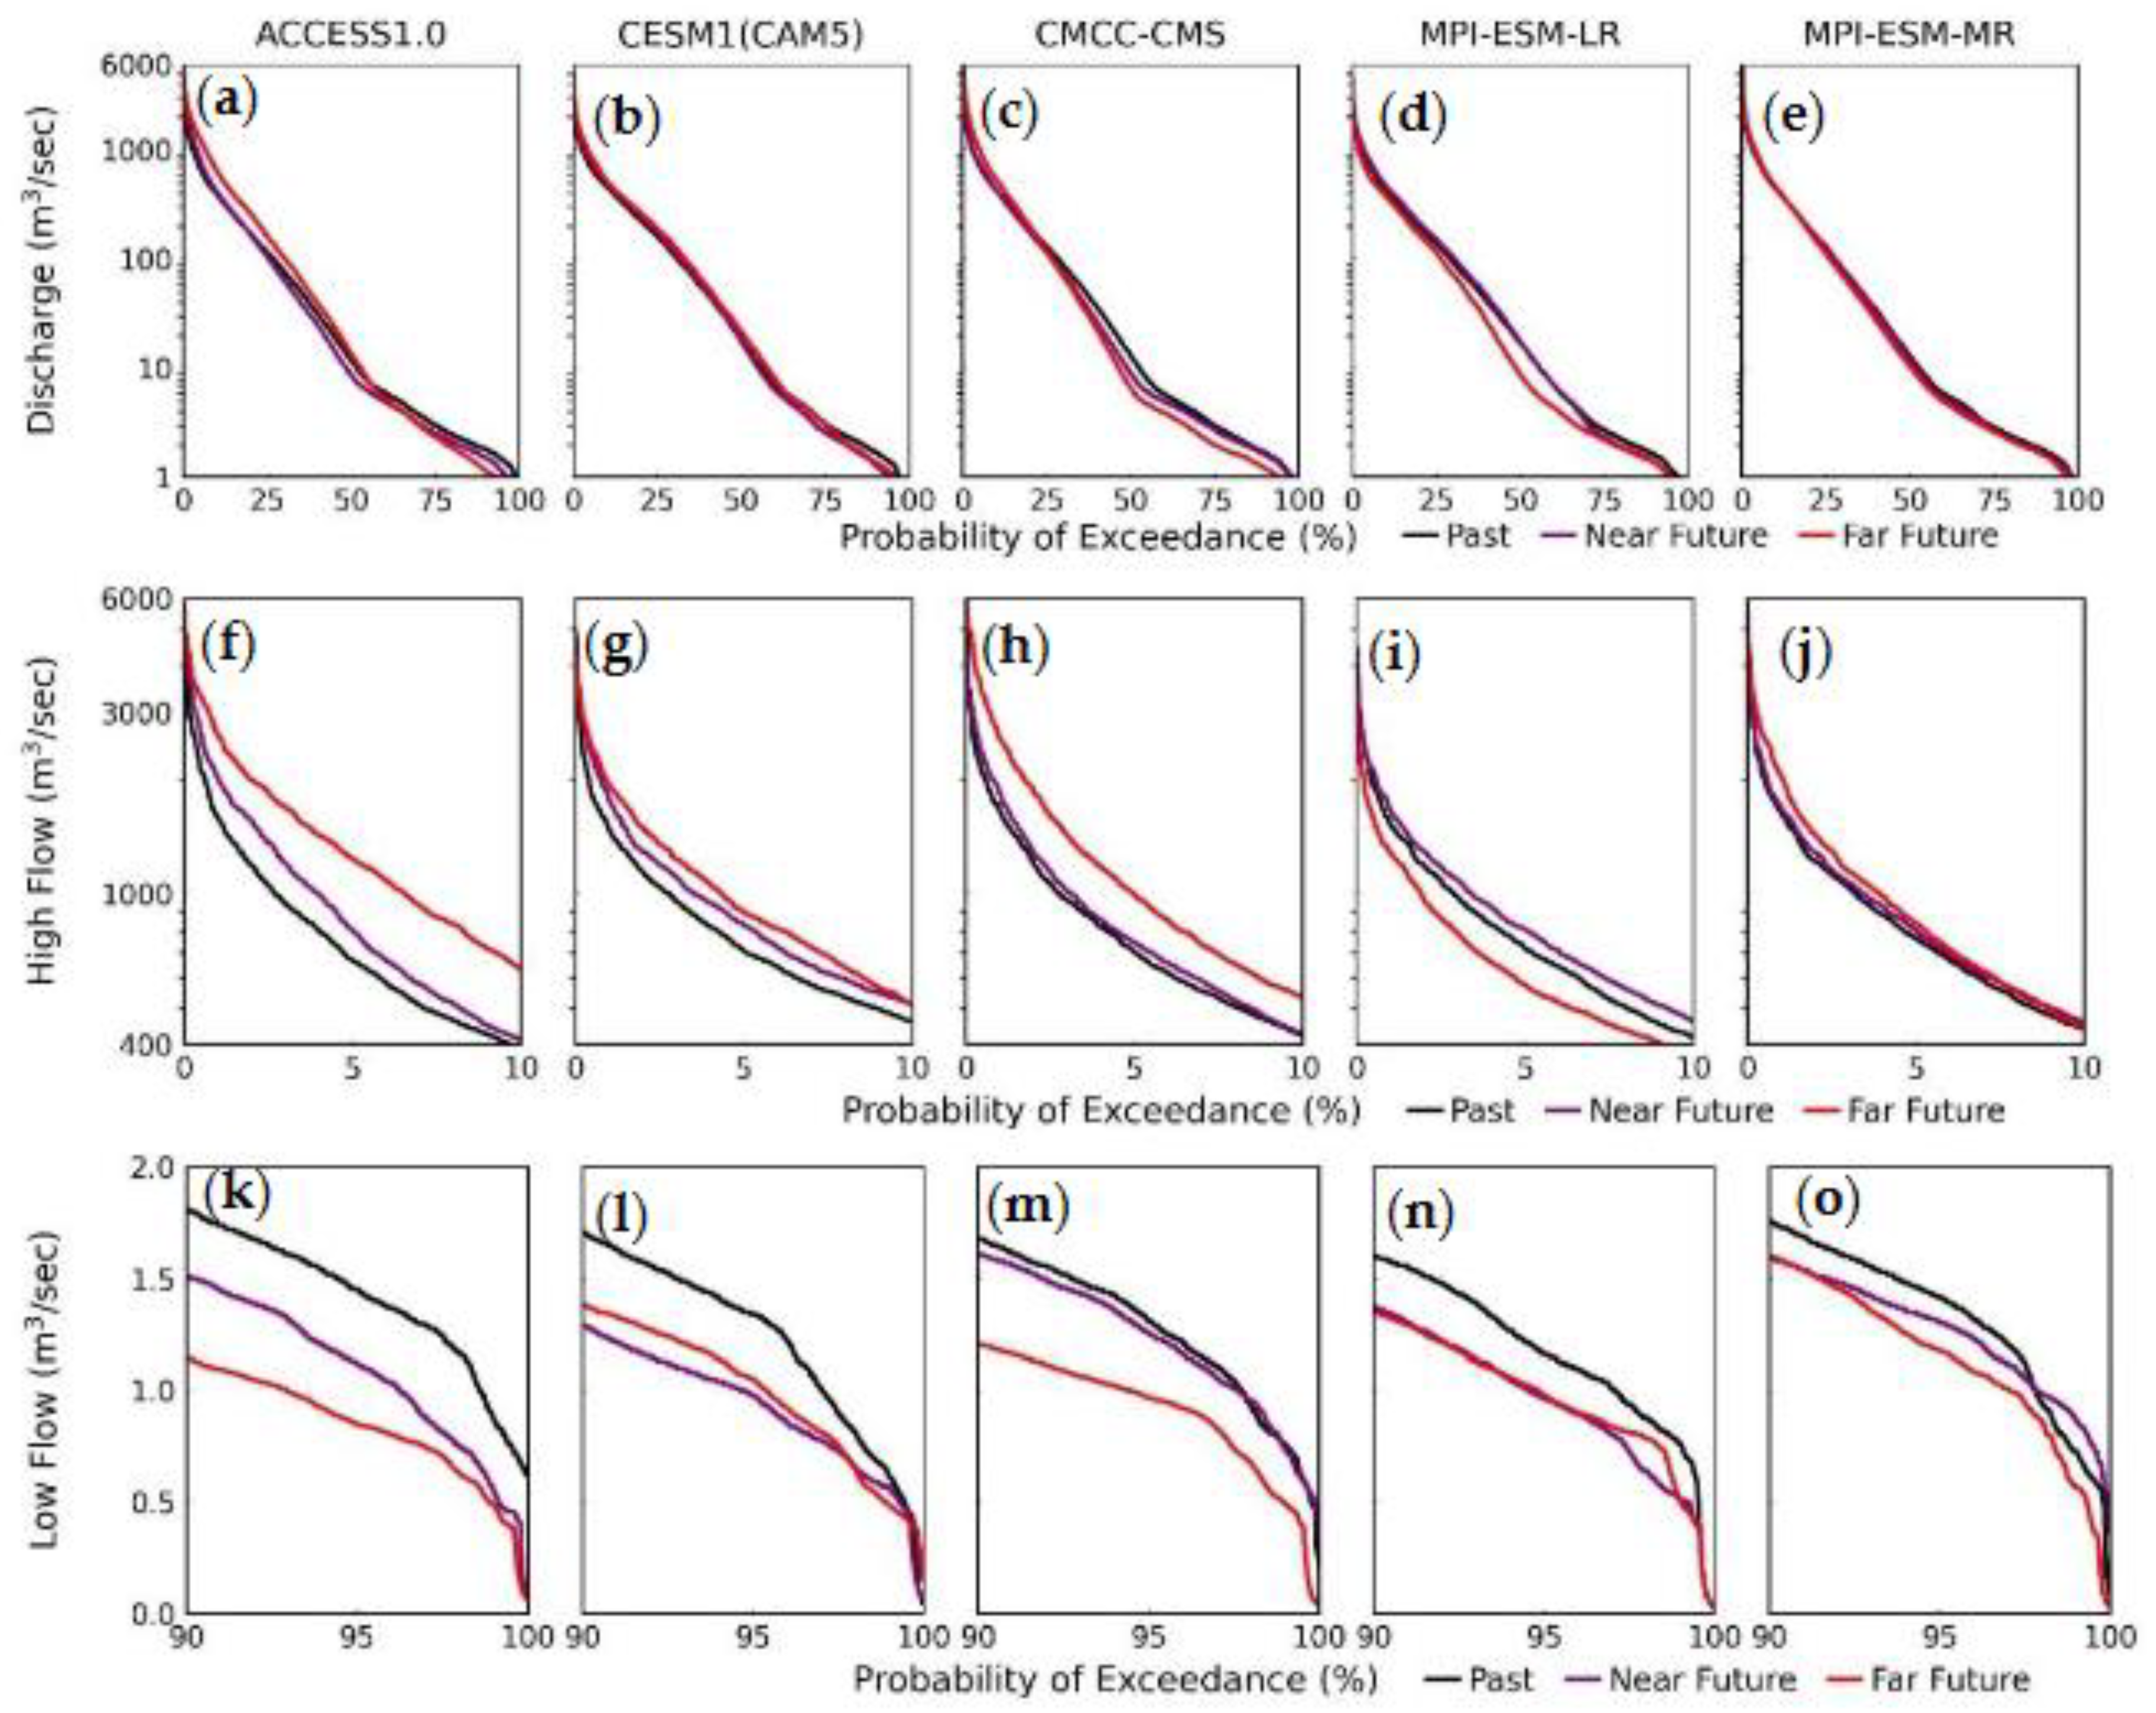
Figure 15a-e displays the flow-duration curve (FDC) for all selected GCMs in the past, near-future, and far-future. The FDCs display a very steep gradient with a probability of exceedance of less than 10% for all selected GCMs in the past, near-future, and far-future. As a result, the duration of the floods that occur in the basin is relatively short. On the other hand, for all selected GCMs for the past, near-future, and far-future, the flow less than 10 m
3/sec corresponds to a 50% probability of exceedance, indicating that approximately a half of the year of the river discharge is less than 10 m
3/sec.
Figure 15f-j show high flows (probability of exceedance ≤ 10%) for the past, near-future, and far-future for all selected GCMs. The Figure shows that high flows project an increasing trend for all selected GCMs in the near-future. High flow in the far-future is also projected to show an increasing trend, except for MPI-ESM-LR, which also projects a decreasing trend for annual maximum discharge and mean flow during the monsoon. ACCESS1.0, CESM1(CAM5), and MPI-ESM-LR project a significantly higher increasing trend, whereas the other two GCMs (CMCC-CMS and MPI-ESM-MR) project a marginally increasing trend for near-future. In the far-future, ACCESS1.0, CESM1(CAM5), and CMCC-CMS project a significantly higher increasing trend , while MPI-ESM-MR projects a marginally increasing trend. MPI-ESM-LR projects a significantly decreasing trend in the far-future. Therefore, high flow projects an increasing trend with a likelihood level of
virtually certain in the near-future and
likely in the far-future.
Figure 15k-o show low flows (90% ≤ probability of exceedance ≤ 100%) for the past, near-future, and far-future for all selected GCMs. The Figure depicts that all selected GCMs project a decreasing trend for both the near-future and far-future. ACCESS1.0, CESM1(CAM5), and MPI-ESM-LR project a significantly decreasing trend, while the other two GCMs (CMCC-CMS and MPI-ESM-MR) project a marginally decreasing trend in the near-future. On the other hand, all selected GCMs project a significantly decreasing trend for low flow in the far-future. Therefore, it is
virtually certain that low flow will decrease in the both near-future and far-future.
3.3.5. Climate change impact on inundation and affected population
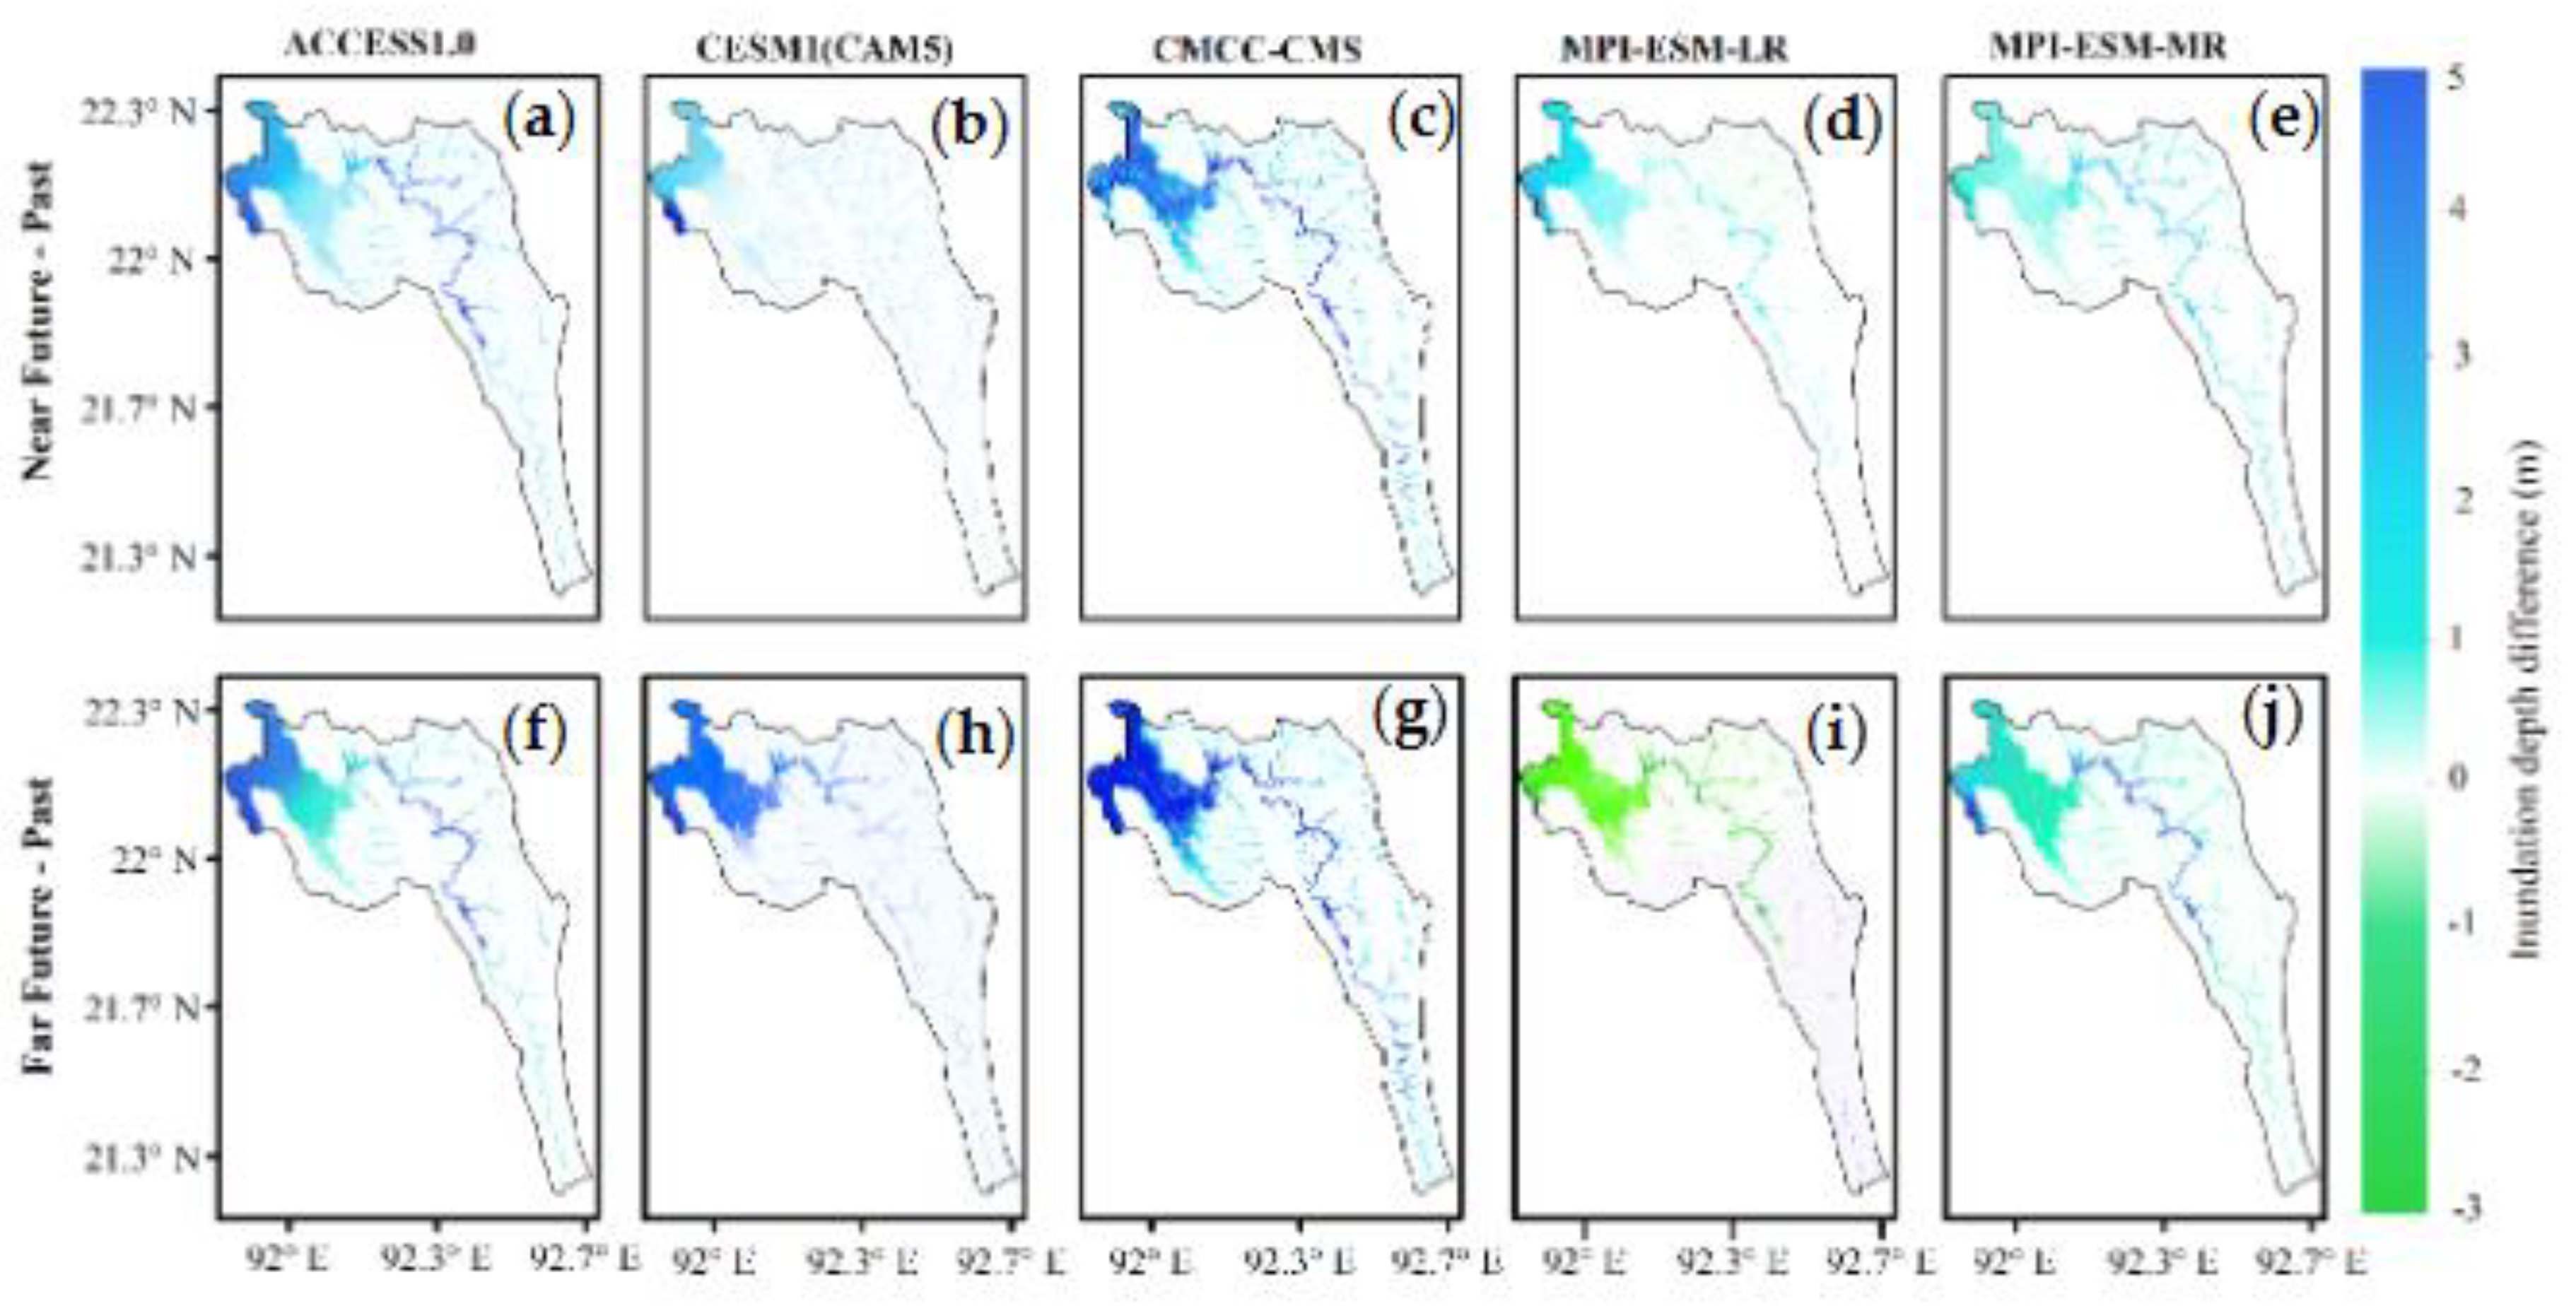
Figure 16 shows all times maximum inundation difference for the near-future and far-future from the past for all selected GCMs. The maximum inundation of all time was computed at each grid for the past, near-future, and far-future for all selected GCMs, and the difference of the near-future and far-future from the past was analyzed.
Figure 16a-e show the inundation difference for the near-future from the past, and all selected GCMs project an increasing trend in inundation depth. ACCESS1.0 and CMCC-CMS project a significantly increasing trend, whereas the other three GCMs (CESM1(CAM), MPI-ESM-LR, and MPI-ESM-MR) project a marginally increasing trend. With the exception of MPI-ESM-LR, all selected GCMs project an increasing trend of inundation depth in the far-future (
Figure 16f-j). As discussed in the previous sections, the MPI-ESM-LR also projects a decreasing trend for annual maximum discharge, monsoon seasonal discharge, and the high flow in far-future. These are the reasons for the projected decrease in inundation of MPI-ESM-LR in the far-future. Similar to the near-future, ACCESS1.0 and CMCC-CMS project a significantly increasing trend for inundation depth difference in the far-future.
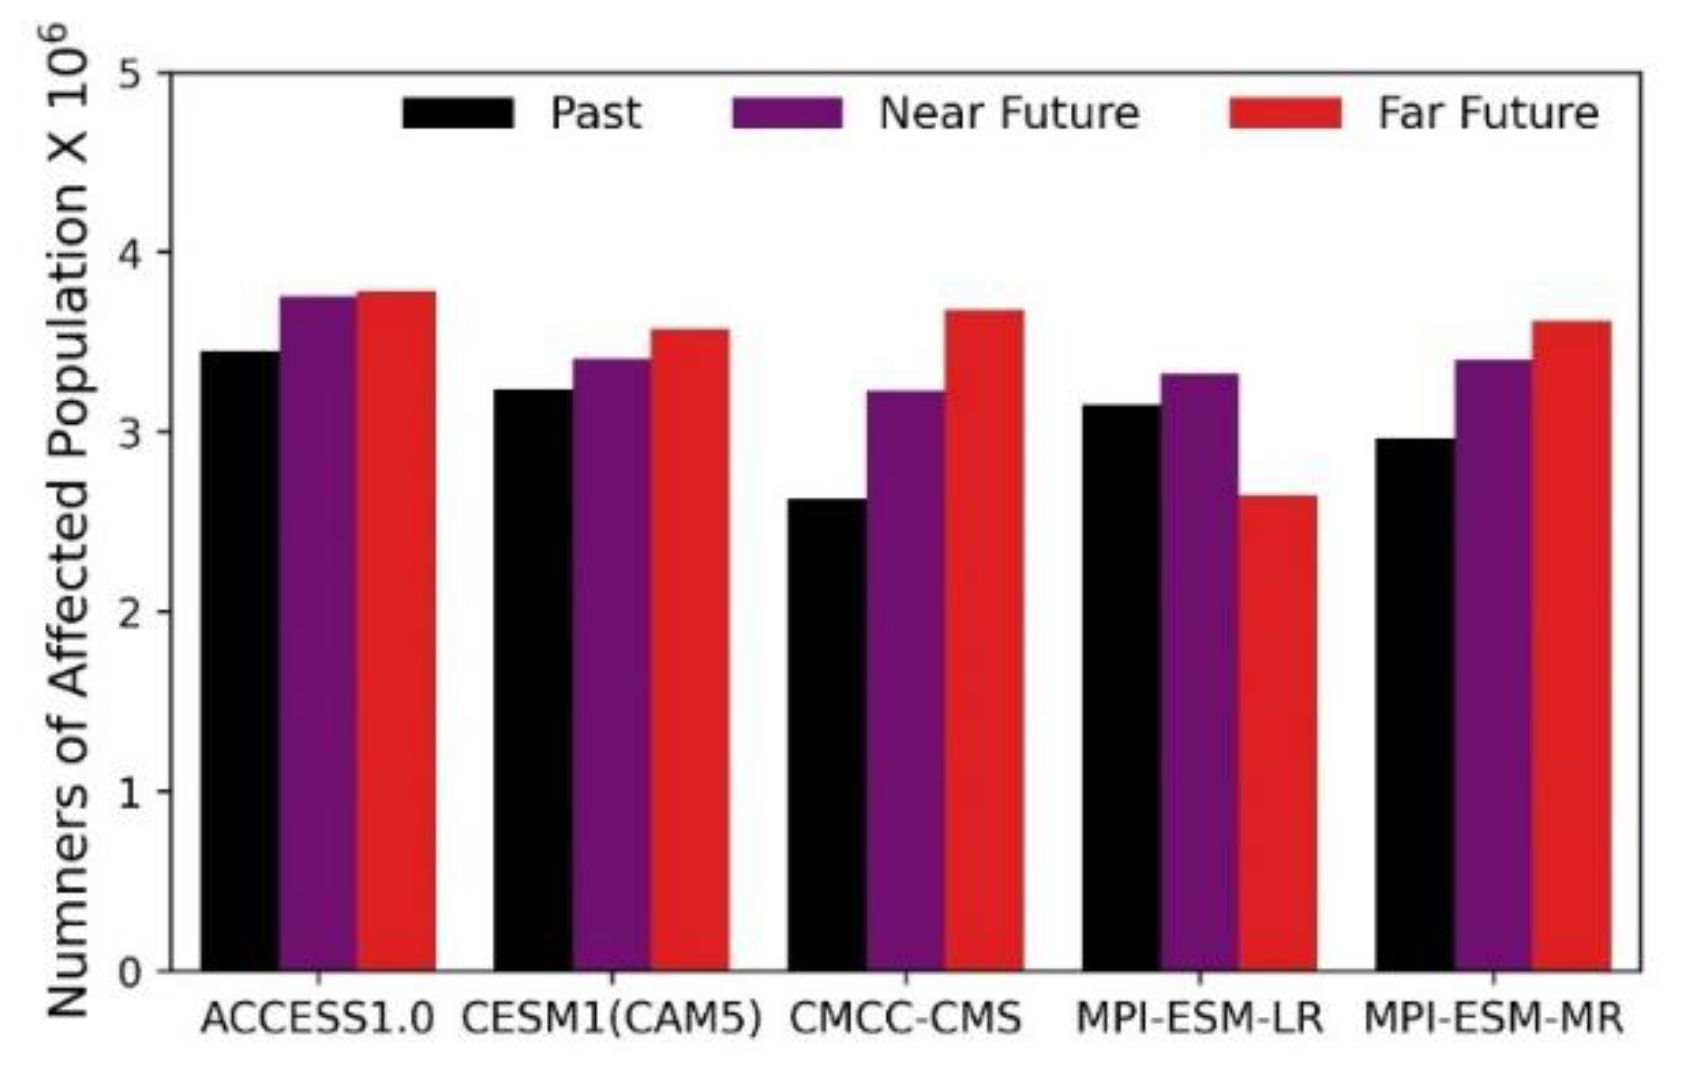
To assess the impact of the increasing trend of inundation, it is important to estimate the projected number of affected people in the basin due to CC. The WEB-RRI simulated inundation and present population were used to estimate the projected affected population in the past, near-future, and far-future. As described in
Section 3.2.2, WEB-RRI simulated inundation can represent the flooding of the Sangu river basin with a threshold value of 0.30 m. Therefore, flooding depths greater than 0.30 m have been used to compute the number of affected people.
Figure 17 shows that the projected number of affected people tends to increase for all selected GCMs in the near-future, and the number of affected people in the far-future is projected to increase except for MPI-ESM-LR. The projected percentage change of affected people in the near-future are 9%, 5%, 23%, 5%, and 15% for ACCESS1.0, CESM1(CAM5), CMCC-CMS, MPI-ESM-LR, and MPI-ESM-MR, respectively. The projected percentage change of affected people in the far-future are 10%, 10%, 40%, -16%, and 22% for ACCESS1.0, CESM1(CAM5), CMCC-CMS, MPI-ESM-LR, and MPI-ESM-MR, respectively.
3.3.6. Climate change impact on Evapotranspiration
Figure 18 shows the monthly ET of all selected GCMs, and the percentage change in seasonal ET is presented in
Table 6. From the Figure and the Table, it is shown that ACCESS1.0 and CESM1(CAM5) project an increasing trend throughout the year for both near-future and far-future. CMCC-CMS projects an increasing trend during the monsoon, post-monsoon, and winter for both the near-future and far-future, but the model projects a decreasing trend during the pre-monsoon for both the near-future and far-future. MPI-EMS-LR projects an increasing trend throughout the year in the near-future. In the far-future, the model projects an increasing trend during monsoon and post-monsoon but projects a decreasing trend during pre-monsoon and winter. With the exception of pre-monsoon in the far-future, MPI-EMS-MR projects an increasing trend for all seasons for both the near-future and far-future.
In order to comprehend the impact of CC on agriculture, we examined the impact of CC on transpiration. Agricultural productivity increases with an increasing transpiration process. This is due to the fact that a higher transpiration rate leads to an increase in photosynthesis, ultimately resulting in increased crop yields. Several studies have demonstrated a direct correlation between crop yield and transpiration [
49,
50,
51].
Figure 19 shows that the projected monthly transpiration tends to increase in the future. The percentage change in transpiration during four different seasons has been shown in
Table 6. The projected transpiration is tend to decrease during the pre- monsoon in the far-future for MPI-EMS-LR. The ET of this particular model also projects the highest decreasing trend during the pre-monsoon in the far-future. Other seasons project an increasing trend both in the near-future and far-future. Thus, it can be inferred that an increase in transpiration will lead to a corresponding increase in crop productivity under optimal conditions in the future.
3.4. Summary of basin scale assessment for policymakers
Table 7 presents the likelihood of outcomes for meteorological and hydrological parameters. Future annual rainfall and discharge are
virtually certain to increase in the near-future and
likely to increase in the far-future, indicating more water availability in the basin in the future. The likelihood of future extreme rainfall and discharge indicates that floods will increase in both frequency and intensity in the future. The likelihood of future meteorological and hydrological droughts indicate that there will be a shortage of water during dry seasons in the future. According to the IPCC AR6 for policymakers, a combination of non-structural and structural measures has reduced mortality with medium confidence [
44]. In addition, effective adaptation strategies such as agricultural development, agroforestry, and community-based adaptation, minimize climate risk with medium confidence [
44]. Therefore, policymakers can consider both soft and hard countermeasures in order to effectively execute the BDP-2100 and reduce the disaster risks. Ultimately, it is suggested that natural-based remedies, including the restoration and preservation of forests and wetlands, the advancement of environmentally-friendly urban areas, and the protection of ecosystems, be implemented.
5. Conclusions
The present study employed an integrated methodology and incorporated contemporary scientific and technological advancements, including the DIAS data archiving and bias-correction system and WEB-RRI modeling, to obtain evidence-based information in the study area. The methodology comprises several stages, including the selection of GCMs based on their regional and local performance, a three-step bias correction technique, meteorological assessment, uncertainty clarification of the selected GCMs, development of the WEB-RRI model for seamless simulation of hydrological components, hydrological assessment including inundation extent and evapotranspiration, and a qualitative decision index for the policymakers.
The study findings reveal that both annual rainfall and discharge are virtually certain to increase in the near-future and likely to increase in the far-future. Monsoon rainfall and discharge also reveal similar results, indicating that monsoon is the dominant season of the region. The projected intense rainfall and high flows show an increasing trend, indicate a rising likelihood of flooding in the basin. Therefore, proactive measures are necessary to alleviate potential future risks. Conversely, meteorological droughts are likely and hydrological droughts are virtually certain to increase in both the near-future and far-future indicating a water scarcity in the basin during the dry period. Additionally, annual daily maximum discharge shows an increasing trend, while annual daily minimum discharge shows a deceasing trend. These trends suggest that the likelihood of floods and droughts disasters in the basin will escalate.
The findings indicate that there will be an abundance of water in the monsoon season and a deficit of water in the dry season. Consequently, water balance is required to reserve water during the monsoon and utilize it during the dry season. The construction of water storage structures, such as dams and reservoirs, can serve as a means of addressing both floods and droughts occurrences within the basin, which are presently absent. Furthermore, the implementation of non-structural measures, such as the adoption of an early warning system, the cultivation of short duration rice varieties, the alteration of crop patterns, and the changing of the crop calendar, can effectively minimize the likelihood of disaster risks and optimize the advantages.
However, this study still has some limitations, which can be addressed in future research. A statistical bias correction has been performed in this study, which cannot represent spatial and temporal connectivity. To do that, dynamic downscaling can be done in the future. Only the RCP8.5 scenario has been used in this study, and other scenarios can be considered in a future study. Urbanization changes the characteristics of watersheds, which are not included in this study. Therefore, land use change can be incorporated into future studies.
Author Contributions
Conceptualization, M.K.H., M.R. and T.K.; methodology, M.K.H., M.R., T.K. and K.T.; software, M.K.H., M.R. and K.T.; data curation, M.K.H.; writing—original draft preparation, M.K.H.; writing—review and editing, M.R. and T.K.; visualization, M.K.H. and K.T.; supervision, M.R. and T.K.; funding acquisition, M.R. and T.K. All authors have read and agreed to the published version of the manuscript.
Funding
This research received no external funding.
Data Availability Statement
All GCM data are available at CMIP5-DIAS. Observed rainfall used for bias correction is also available in the CMIP5-DIAS.
Acknowledgments
We acknowledge the government of Bangladesh, the International Centre for Water Hazard and Risk Management (ICHARM), the National Graduate Institute for Policy Studies (GRIPS), the Public Works Research Institute (PWRI), and the Japan International Cooperation Agency (JICA) for supporting this study. The University of Tokyo deserves special recognition for contributing the IPCC/AR5-CMIP5 climate dataset. We would like to express our gratitude to NASA, FAO, and JMA for providing the necessary data for the calibration and validation of hydrological models. We express gratitude towards the anonymous reviewers for their valuable feedback and suggestions that contributed towards enhancing the quality of this manuscript.
Conflicts of Interest
The authors declare no conflict of interest.
References
- IPCC Climate Change 2022: Impacts, Adaptation, and Vulnerability. Contribution of Working Group II to the Sixth Assessment Report of the Intergovernmental Panel on Climate Change; 2022.
- Muluneh, M.G. Impact of Climate Change on Biodiversity and Food Security: A Global Perspective—a Review Article. Agric. Food Secur. 2021, 10, 36. [Google Scholar] [CrossRef]
- Amhed, A.U. Bangladesh: Climate Change Impacts and Vulnerability; Dhaka, 2006.
- Rimi, R.H.; Haustein, K.; Allen, M.; Barbour, E. Risks of Pre-Monsoon Extreme Rainfall Events of Bangladesh: Is Anthropogenic Climate Change Playing a Role? Bull. Am. Meteorol. Soc. 2019, 100, S61–S65. [Google Scholar] [CrossRef]
- McAdam, J.; Saul, B. Displacement with Dignity: International Law and Policy Responses to Climate Change Migration and Security in Bangladesh. 2010.
- Mirza, M.M.Q.; Warrick, R.A.; Ericksen, N.J. The Implications of Climate Change on Floods of the Ganges, Brahmaputra and Meghna Rivers in Bangladesh. Clim. Change 2003, 57, 287–318. [Google Scholar] [CrossRef]
- Masood, M.; Yeh, P.J.-F.; Hanasaki, N.; Takeuchi, K. Model Study of the Impacts of Future Climate Change on the Hydrology of Ganges–Brahmaputra–Meghna Basin. Hydrol. Earth Syst. Sci. 2015, 19, 747–770. [Google Scholar] [CrossRef]
- Mohammed, K.; S, I.; T, I.; L, A.; SK, B.; JU, K. Impact of High-End Climate Change on Floods and Low Flows of the Brahmaputra River. J. Hydrol. Eng. 2017, 22, 4017041. [Google Scholar] [CrossRef]
- Alam, S.; Ali, M.M.; Rahaman, A.Z.; Islam, Z. Multi-Model Ensemble Projection of Mean and Extreme Streamflow of Brahmaputra River Basin under the Impact of Climate Change. J. Water Clim. Chang. 2021, 12, 2026–2044. [Google Scholar] [CrossRef]
- Zappa, G.; Shepherd, T.G. Storylines of Atmospheric Circulation Change for European Regional Climate Impact Assessment. J. Clim. 2017, 30, 6561–6577. [Google Scholar] [CrossRef]
- Rasmy, M.; Koike, T.; Lawford, P.; Hara, M.; Fujita, M.; Kimura, F. Assessment of Future Water Resources in the Tone River Basin Using a Combined Dynamical-Statistical Downscaling Approach. J. Japan Soc. Civ. Eng. 2015, 71, I_73–I_78. [Google Scholar] [CrossRef] [PubMed]
- Nyunt, C.T.; Koike, T.; Yamamoto, A. Statistical Bias Correction for Climate Change Impact on the Basin Scale Precipitation in Sri Lanka, Philippines, Japan and Tunisia. Hydrol. Earth Syst. Sci. Discuss. 2016, 2016, 1–32. [Google Scholar] [CrossRef]
- Kawasaki, A.; Yamamoto, A.; Koudelova, P.; Acierto, R.A.; Nemoto, T.; Kitsuregawa, M.; Koike, T. Data Integration and Analysis System (DIAS) Contributing to Climate Change Analysis and Disaster Risk Reduction. Data Sci. J. 2017, 16. [Google Scholar] [CrossRef]
- Dai, A. Precipitation Characteristics in Eighteen Coupled Climate Models. J. Clim. 2006, 19, 4605–4630. [Google Scholar] [CrossRef]
- Sun, Y.; Solomon, S.; Dai, A.; Portmann, R.W. How Often Does It Rain? J. Clim. 2006, 19, 916–934. [Google Scholar] [CrossRef]
- Feddersen, H.; Andersen, U. A Method for Statistical Downscaling of Seasonal Ensemble Predictions. Tellus A Dyn. Meteorol. Oceanogr. 2005, 57, 398–408. [Google Scholar] [CrossRef]
- Immerzeel, W. Historical Trends and Future Predictions of Climate Variability in the Brahmaputra Basin. Int. J. Climatol. 2008, 28, 243–254. [Google Scholar] [CrossRef]
- Hossain, S.; Mazumder, L.; Magumdar, T. Climate Change Impacts on the Hydrology of the Brahmaputra River Basin. Climate 2022, 11. [Google Scholar] [CrossRef]
- Roy, B.; Khan, M.S.M.; Islam, A.K.M.S.; Mohammed, K.; Khan, M.J.U. Climate-Induced Flood Inundation for the Arial Khan River of Bangladesh Using Open-Source SWAT and HEC-RAS Model for RCP8.5-SSP5 Scenario. SN Appl. Sci. 2021, 3, 648. [Google Scholar] [CrossRef]
- Khan, I.; Mostafa Ali, D. Potential Changes to the Water Balance of the Teesta River Basin Due to Climate Change. Am. J. Water Resour. 2019, 7, 95–105. [Google Scholar]
- Rasmy, M.; Sayama, T.; Koike, T. Development of Water and Energy Budget-Based Rainfall-Runoff-Inundation Model (WEB-RRI) and Its Verification in the Kalu and Mundeni River Basins, Sri Lanka. J. Hydrol. 2019, 579, 124163. [Google Scholar] [CrossRef]
- Maksudur Rahman, M.; Haughton, G.; Jonas, A.E.G. The Challenges of Local Environmental Problems Facing the Urban Poor in Chittagong, Bangladesh: A Scale-Sensitive Analysis. Environ. Urban. 2010, 22, 561–578. [Google Scholar] [CrossRef]
- Khan, Y.A.; Lateh, H.; Baten, M.A.; Kamil, A.A. Critical Antecedent Rainfall Conditions for Shallow Landslides in Chittagong City of Bangladesh. Environ. Earth Sci. 2012, 67, 97–106. [Google Scholar] [CrossRef]
- Ali, A. Climate Change Impacts and Adaptation Assessment in Bangladesh. Clim. Res. 1999, 12, 109–116. [Google Scholar] [CrossRef]
- Shahriar, S.A.; Siddique, M.A.M.; Rahman, S.M.A. Climate Change Projection Using Statistical Downscaling Model over Chittagong Division, Bangladesh. Meteorol. Atmos. Phys. 2021, 133, 1409–1427. [Google Scholar] [CrossRef]
- Adnan, M.S.G.; Dewan, A.; Zannat, K.E.; Abdullah, A. The Use of Watershed Geomorphic Data in Flash Flood Susceptibility Zoning: A Case Study of the Karnaphuli and Sangu River Basins of Bangladesh. Nat. Hazards 2019, 99, 425–448. [Google Scholar] [CrossRef]
- Zzaman, R.; Nowreen, S.; Billah, M.; Islam, A. Flood Hazard Mapping of Sangu River Basin in Bangladesh Using Multi-criteria Analysis of Hydro-geomorphological Factors. J. Flood Risk Manag. 2021, 14. [Google Scholar] [CrossRef]
- Mondol, M.A.H.; Ara, I.; Das, S.C. Meteorological Drought Index Mapping in Bangladesh Using Standardized Precipitation Index during 1981–2010. Adv. Meteorol. 2017, 2017, 4642060. [Google Scholar] [CrossRef]
- Suzuki-Parker, A.; Kusaka, H.; Takayabu, I.; Dairaku, K.; Ishizaki, N.; Ham, S. Contributions of GCM/RCM Uncertainty in Ensemble Dynamical Downscaling for Precipitation in East Asian Summer Monsoon Season. Sci. online Lett. Atmos. 2018, 14, 97–104. [Google Scholar] [CrossRef]
- Sharma, D.; Das Gupta, A.; Babel, M.S. Spatial Disaggregation of Bias-Corrected GCM Precipitation for Improved Hydrologic Simulation: Ping River Basin, Thailand. Hydrol. Earth Syst. Sci. 2007, 11, 1373–1390. [Google Scholar] [CrossRef]
- Karl, T.R.; Nicholls, N.; Ghazi, A. CLIVAR/GCOS/WMO Workshop on Indices and Indicators for Climate Extremes Workshop Summary BT - Weather and Climate Extremes: Changes, Variations and a Perspective from the Insurance Industry. In; Karl, T.R., Nicholls, N., Ghazi, A., Eds.; Springer Netherlands: Dordrecht, 1999; pp. 3–7 ISBN 978-94-015-9265-9.
- Luo, X.; Fan, X.; Li, Y.; Ji, X. Bias Correction of a Gauge-Based Gridded Product to Improve Extreme Precipitation Analysis in the Yarlung Tsangpo--Brahmaputra River Basin. Nat. Hazards Earth Syst. Sci. 2020, 20, 2243–2254. [Google Scholar] [CrossRef]
- Singh, D.; Jain, S.; Gupta, R.D.; Kumar, S.; Rai, S.P. Analyses of Observed and Anticipated Changes in Extreme Climate Events in the Northwest Himalaya. Climate 2016, 2225–1154. [Google Scholar] [CrossRef]
- Zhang, M.; Yaning, C.; Shen, Y.; Li, B. Tracking Climate Change in Central Asia through Temperature and Precipitation Extremes. J. Geogr. Sci. 2019, 29, 3–28. [Google Scholar] [CrossRef]
- Adler, R.F.; Huffman, G.J.; Chang, A.; Ferraro, R.; Xie, P.-P.; Janowiak, J.; Rudolf, B.; Schneider, U.; Curtis, S.; Bolvin, D.; et al. The Version-2 Global Precipitation Climatology Project (GPCP) Monthly Precipitation Analysis (1979–Present). J. Hydrometeorol. 2003, 4, 1147–1167. [Google Scholar] [CrossRef]
- Liebmann, B. Description of a Complete (Interpolated) Outgoing Longwave Radiation Dataset. Bull. Am. Meteorol. Soc. 1996, 77, 1275–1277. [Google Scholar]
- Rayner, N.A.; Parker, D.E.; Horton, E.B.; Folland, C.K.; Alexander, L. V; Rowell, D.P.; Kent, E.C.; Kaplan, A. Global Analyses of Sea Surface Temperature, Sea Ice, and Night Marine Air Temperature since the Late Nineteenth Century. J. Geophys. Res. Atmos. 2003, 108. [Google Scholar] [CrossRef]
- Kobayashi, S.; Ota, Y.; Harada, Y.; Ebita, A.; Motiya, M.; Onoda, H.; Onogi, K.; Kamahori, H.; Kobayashi, C.; Endo, H.; et al. The JRA-55 Reanalysis: General Specifications and Basic Characteristics. J. Meteorol. Soc. Japan. Ser. II 2015, 93, 5–48. [Google Scholar] [CrossRef]
- Islam, M.N.; Parvez, M. Predicting the El Niño and La Niño Impact on the Coastal Zones at the Bay of Bengal and the Likelihood of Weather Patterns in Bangladesh. Model. Earth Syst. Environ. 2020, 6. [Google Scholar] [CrossRef]
- Wahiduzzaman, M. Major Floods and Tropical Cyclones over Bangladesh: Clustering from ENSO Timescales. Atmosphere (Basel). 2021, 12. [Google Scholar] [CrossRef]
- Sellers, P.J.; Tucker, C.J.; Collatz, G.J.; Los, S.O.; Justice, C.O.; Dazlich, D.A.; Randall, D.A. A Revised Land Surface Parameterization (SiB2) for Atmospheric GCMS. Part II: The Generation of Global Fields of Terrestrial Biophysical Parameters from Satellite Data. J. Clim. 1996, 9, 706–737. [Google Scholar] [CrossRef]
- Kwak, Y.; Arifuzzanman, B.; Iwami, Y. Prompt Proxy Mapping of Flood Damaged Rice Fields Using MODIS-Derived Indices. Remote Sens. 2015, 7, 15969–15988. [Google Scholar] [CrossRef]
- SEDAC Center for International Earth Science Information Network - CIESIN - Columbia University. Gridded Population of the World, Version 4.11 (GPWv4): Population Count, Revision 11. Palisades, NY: NASA Socioeconomic Data and Applications Center (SEDAC) 2018.
- IPCC Summary for Policymakers. In: Climate Change 2022: Mitigation of Climate Change. Contribution of Working Group III to the Sixth Assessment Report of the Intergovernmental Panel on Climate Change; 2022.
- Sarfaraz, A.; Mostafa, A.M.; Zahidul, I. Future Streamflow of Brahmaputra River Basin under Synthetic Climate Change Scenarios. J. Hydrol. Eng. 2016, 21, 5016027. [Google Scholar] [CrossRef]
- Hasan, M.K.; Parvin, F.; Tasnim, N. Impact of Temperature Change on Reference Evapotranspiration in Dhaka City. J. Environ. Treat. Tech. 2022, 10, 29–34. [Google Scholar]
- Zaman, M.Q. Rivers of Life: Living with Floods in Bangladesh. Asian Surv. 1993, 33, 985–996. [Google Scholar] [CrossRef]
- BWDB-FFWC Annual Flood Report; 2015.
- Arkley, R. Relationships between Plant Growth and Transpiration. Hilgardia 1963, 34, 559–584. [Google Scholar] [CrossRef]
- Erion, G.; Riedell, W. Barley Yellow Dwarf Virus Effects on Cereal Plant Growth and Transpiration. Crop Sci. 2012, 52, 2794. [Google Scholar] [CrossRef]
- Ni, J.; Leung, A.; Ng, C.W.W.; So, P. Investigation of Plant Growth and Transpiration-Induced Matric Suction under Mixed Grass–Tree Conditions. Can. Geotech. J. 2016, 54, 561–573. [Google Scholar] [CrossRef]
Figure 1.
(a) Topographical map of Bangladesh indicating the Sangu river basin, (b) topography of Sangu river basin (c) land use in the basin (d) demarcation of raingauge and discharge station in the basin.
Figure 1.
(a) Topographical map of Bangladesh indicating the Sangu river basin, (b) topography of Sangu river basin (c) land use in the basin (d) demarcation of raingauge and discharge station in the basin.
Figure 2.
Methodology of the study.
Figure 2.
Methodology of the study.
Figure 3.
(a) Comparison of basin average annual rainfall among the past, near-future, and far-future, and percentage change for both the near-future and far-future (b) Box and Whiskers of annual rainfall of each GCMs for the past, near-future and far-future. Outliers beyond ± 2 times the interquartile range are shown by black squares.
Figure 4.
Comparison of monthly rainfall among the past, near-future, and far-future. The solid line (past), dashed line (near-future), and dotted line (far-future) show the mean monthly rainfall, and the shaded area is the 95th and 5th percentiles of monthly rainfall. .
Figure 4.
Comparison of monthly rainfall among the past, near-future, and far-future. The solid line (past), dashed line (near-future), and dotted line (far-future) show the mean monthly rainfall, and the shaded area is the 95th and 5th percentiles of monthly rainfall. .
Figure 5.
Box-whisker plot for (a) consecutive wet days (CWD), (b) R50mm, (c) R100mm, and (d) consecutive dry days (CDD). Green circles show the mean value. Outliers beyond ± 2 times the interquartile range are shown by black squares.
Figure 5.
Box-whisker plot for (a) consecutive wet days (CWD), (b) R50mm, (c) R100mm, and (d) consecutive dry days (CDD). Green circles show the mean value. Outliers beyond ± 2 times the interquartile range are shown by black squares.
Figure 6.
Monthly rainfall difference (far-future minus past) of the selected GCMs.
Figure 6.
Monthly rainfall difference (far-future minus past) of the selected GCMs.
Figure 7.
Wind speed ratio (far-future divided by past) for the month of June (a) ACCESS1.0, (b) CESM1(CAM5), (c) CMCC-CMS, (d) MPI-ESM-LR, (e) MPI-ESM-MR.
Figure 7.
Wind speed ratio (far-future divided by past) for the month of June (a) ACCESS1.0, (b) CESM1(CAM5), (c) CMCC-CMS, (d) MPI-ESM-LR, (e) MPI-ESM-MR.
Figure 8.
Pressure difference (far-future minus past) for the month of July (a) MPI-ESM-LR, (b) MPI-ESM-MR.
Figure 8.
Pressure difference (far-future minus past) for the month of July (a) MPI-ESM-LR, (b) MPI-ESM-MR.
Figure 9.
Comparison between observed discharge and simulated discharge (a) model calibration for 1992-1993, (b) model validation for 1997-2005.
Figure 9.
Comparison between observed discharge and simulated discharge (a) model calibration for 1992-1993, (b) model validation for 1997-2005.
Figure 10.
Comparison of flood inundation in the sangu river basin for the flood 2015: (a) WEB-RRI simulated inundation (b) MLSWI by using MODIS data (c) WEB-RRI simulated inundation depth (m).
Figure 10.
Comparison of flood inundation in the sangu river basin for the flood 2015: (a) WEB-RRI simulated inundation (b) MLSWI by using MODIS data (c) WEB-RRI simulated inundation depth (m).
Figure 11.
Comparison between basin averaged WEB-RRI ET and MODIS ET from the year 2009 to 2016.
Figure 11.
Comparison between basin averaged WEB-RRI ET and MODIS ET from the year 2009 to 2016.
Figure 12.
Comparison of mean annual discharge among the past, near-future, and far-future, and percentage change for both the near-future and far-future.
Figure 12.
Comparison of mean annual discharge among the past, near-future, and far-future, and percentage change for both the near-future and far-future.
Figure 13.
Box and Whiskers of (a) Annual daily maximum discharge and (b) Annual daily minimum discharge at Bandarban gauging station for the selected GCMs. Green circles show the mean value. Outliers beyond ± 2 times the interquartile range are shown by black squares.
Figure 13.
Box and Whiskers of (a) Annual daily maximum discharge and (b) Annual daily minimum discharge at Bandarban gauging station for the selected GCMs. Green circles show the mean value. Outliers beyond ± 2 times the interquartile range are shown by black squares.
Figure 14.
Comparison of monthly discharge among the past, near-future, and far-future. The solid line (Past), dashed line (near-future) and dotted line (far-future) show the mean monthly discharge, and the shaded area is the 95th and 5th percentiles of monthly discharge.
Figure 14.
Comparison of monthly discharge among the past, near-future, and far-future. The solid line (Past), dashed line (near-future) and dotted line (far-future) show the mean monthly discharge, and the shaded area is the 95th and 5th percentiles of monthly discharge.
Figure 15.
Flow duration curve for the past, near-future and far-future (a-e) entire period, (f-j) high flows (probability of exceedance ≤ 10%), and (k-o) low flows (90% ≤ probability of exceedance ≤ 100%).
Figure 15.
Flow duration curve for the past, near-future and far-future (a-e) entire period, (f-j) high flows (probability of exceedance ≤ 10%), and (k-o) low flows (90% ≤ probability of exceedance ≤ 100%).
Figure 16.
All time maximum inundation depth difference (a-e) near-future minus past and (f-j) far-future minus past.
Figure 16.
All time maximum inundation depth difference (a-e) near-future minus past and (f-j) far-future minus past.
Figure 17.
Number of affected people in the Sangu river basin in the past, near-future, and far-future for all selected GCMs.
Figure 17.
Number of affected people in the Sangu river basin in the past, near-future, and far-future for all selected GCMs.
Figure 18.
Monthly ET for the all selected GCMs in the past, near-future and far-future.
Figure 18.
Monthly ET for the all selected GCMs in the past, near-future and far-future.
Figure 19.
Monthly transpiration for all selected GCMs in the past, near-future, and far-future.
Figure 19.
Monthly transpiration for all selected GCMs in the past, near-future, and far-future.
Table 1.
Extreme rainfall indices.
Table 1.
Extreme rainfall indices.
| Index |
Descriptive Name |
Definition |
Unit |
| CWD |
Consecutive wet days |
Maximum number of consecutive rainy days with rainfall ≥ 1 mm |
Days |
| CDD |
Consecutive dry days |
Maximum number of consecutive days with rainfall < 1mm |
Days |
| Rnn* |
Number of days above nn |
Yearly number of days with rainfall ≥ nn (nn is a user-defined threshold) |
Days |
| * In this study user defined threshold has been taken as 50 mm and 100 mm |
Table 2.
Model Selection Summary.
Table 2.
Model Selection Summary.
| Model Name |
Institute |
Country |
Precipitation |
Total Index |
Remarks |
| ACCESS1.0 |
CSIRO-BOM |
Australia |
1 |
6 |
Selected |
| CESM1(CAM5) |
NCAR |
USA |
1 |
8 |
Selected |
| CMCC-CMS |
CMCC |
Italy |
1 |
7 |
Selected |
| CNRM-CM5 |
NCMR |
France |
0 |
6 |
PPR1
|
| GFDL-CM2.1 |
NOAA-GFDL |
USA |
1 |
6 |
NFD2
|
| MPI-ESM-LR |
MPI-N |
Germany |
1 |
7 |
Selected |
| MPI-ESM-MR |
MPI-N |
Germany |
1 |
6 |
Selected |
| MPI-ESM-P |
MPI-N |
Germany |
1 |
7 |
NFD2
|
|
1PPR= Poor Precipitation Representation in past, 2NFD= No Future Data |
Table 3.
Daily rain-gauges in the Sangu River basin with ID, name, location, and average annual rainfall.
Table 3.
Daily rain-gauges in the Sangu River basin with ID, name, location, and average annual rainfall.
| ID |
Station Name |
Latitude |
Longitude |
Annual Rainfall (mm) |
| 1 |
Anwara |
22.23° |
91.83° |
2340 |
| 2 |
Patiya |
22.28° |
92.00° |
2725 |
| 3 |
Satkania |
22.17° |
92.06° |
2385 |
| 4 |
Bandarban |
22.22° |
92.19° |
2560 |
| 5 |
Lama |
21.81° |
92.19° |
3745 |
| 6 |
Dulahazra |
21.66° |
92.08° |
3240 |
| 7 |
Nakhyangchari |
21.51° |
92.33° |
3460 |
Table 4.
Percentage change of meteorological variables.
Table 4.
Percentage change of meteorological variables.
| |
% change in Near Future |
|
% change in Far Future |
| Variables |
ACCESS1.0 |
CESM1(CAM5) |
CMCC-CMS |
MPI-ESM-LR |
MPI-ESM-MR |
|
ACCESS1.0 |
CESM1(CAM5) |
CMCC-CMS |
MPI-ESM-LR |
MPI-ESM-MR |
|
| Annual Rainfall |
13 |
12 |
2 |
10 |
6 |
|
52 |
23 |
28 |
-7 |
11 |
|
| Pre-monsoon Rainfall |
-19 |
26 |
10 |
11 |
-19 |
|
87 |
9 |
-37 |
-24 |
-41 |
|
| Monsoon Rainfall |
21 |
12 |
8 |
11 |
10 |
|
48 |
22 |
46 |
-5 |
25 |
|
| Post-monsoon Rainfall |
-11 |
11 |
-35 |
-7 |
7 |
|
57 |
57 |
-13 |
12 |
-6 |
|
| Winter Rainfall |
-31 |
-37 |
-42 |
44 |
17 |
|
-13 |
12 |
-52 |
-75 |
9 |
|
| Consecutive Wet Days |
19 |
6 |
1 |
3 |
6 |
|
9 |
29 |
-3 |
-11 |
-4 |
|
| R50mm* |
21 |
18 |
8 |
12 |
12 |
|
69 |
34 |
38 |
-4 |
16 |
|
| R100mm* |
38 |
31 |
16 |
23 |
15 |
|
97 |
63 |
101 |
4 |
39 |
|
| Consecutive Dry Days |
7 |
17 |
27 |
-1 |
10 |
|
17 |
6 |
61 |
22 |
-1 |
|
| * Definition has been shown in Table-1 |
Table 5.
Model calibrated parameters for the Sangu river basin.
Table 5.
Model calibrated parameters for the Sangu river basin.
| Parameters |
Unit |
Value |
| Soil Parameters (basin average) |
|
|
| Saturated water content (θS) |
m3/m3
|
0.46 |
| Residual soil water content (θr) |
m3/m3
|
0.08 |
| Saturated hydraulic conductivity for soil surface |
mm/h |
71.54 |
| van Genuchten parameter (α) |
m-2
|
0.02 |
| van Genuchten parameter (n) |
|
1.46 |
| River Parameters |
|
|
| Manning’s roughness coefficient for river |
|
0.035 |
| Manning’s roughness coefficient for slope |
|
0.4 |
| Width parameter (CW) |
|
5.2 |
| Width parameter (SW) |
|
0.3 |
| Depth parameter (Cd) |
|
2.5 |
| Depth parameter (Sd) |
|
0.2 |
Table 6.
Percentage change of hydrological variables.
Table 6.
Percentage change of hydrological variables.
| |
% change in Near Future |
|
% change in Far Future |
|
| Variables |
ACCESS1.0 |
CESM1(CAM5) |
CMCC-CMS |
MPI-ESM-LR |
MPI-ESM-MR |
|
ACCESS1.0 |
CESM1(CAM5) |
CMCC-CMS |
MPI-ESM-LR |
MPI-ESM-MR |
| Mean annual discharge |
12 |
11 |
8 |
9 |
3 |
|
59 |
21 |
29 |
-17 |
7 |
| Annual daily max. discharge |
24 |
38 |
6 |
6 |
1 |
|
44 |
24 |
35 |
-11 |
31 |
| Annual daily min. discharge |
-18 |
-16 |
-4 |
-11 |
-10 |
|
-31 |
-13 |
-24 |
-6 |
-10 |
| Pre-monsoon discharge |
-16 |
25 |
10 |
11 |
-21 |
|
90 |
10 |
-37 |
-28 |
-35 |
| Monsoon discharge |
20 |
12 |
4 |
11 |
8 |
|
59 |
19 |
44 |
-18 |
17 |
| Post-monsoon discharge |
-22 |
12 |
-35 |
-10 |
-6 |
|
47 |
51 |
-18 |
4 |
-15 |
| Winter discharge |
-38 |
-48 |
-30 |
13 |
10 |
|
-28 |
19 |
-33 |
-56 |
-3 |
| Pre-monsoon ET |
1 |
14 |
-6 |
5 |
1 |
|
26 |
1 |
-3 |
-17 |
-9 |
| Monsoon ET |
18 |
14 |
16 |
18 |
14 |
|
20 |
17 |
19 |
9 |
16 |
| Post-monsoon ET |
9 |
13 |
9 |
10 |
11 |
|
23 |
18 |
19 |
12 |
13 |
| Winter ET |
10 |
9 |
4 |
10 |
10 |
|
23 |
18 |
21 |
-4 |
11 |
| Pre-monsoon transpiration |
10 |
12 |
3 |
8 |
9 |
|
17 |
14 |
7 |
-2 |
5 |
| Monsoon transpiration |
30 |
28 |
35 |
28 |
28 |
|
73 |
76 |
85 |
80 |
76 |
| Post-monsoon transpiration |
19 |
17 |
20 |
16 |
14 |
|
41 |
38 |
48 |
35 |
40 |
| Winter transpiration |
15 |
15 |
12 |
11 |
12 |
|
43 |
34 |
43 |
16 |
29 |
Table 7.
Summary of basin scale assessment.
Table 7.
Summary of basin scale assessment.
| |
Likelihood of outcomes (Increasing Trend) |
| |
Near Future |
|
Far Future |
| a) Meteorological Assessment |
| Future Annual Rainfall |
virtually certain |
|
likely |
| Future Extreme Rainfall |
virtually certain |
|
likely |
| Future Meteorological Droughts |
likely |
|
likely |
| b) Hydrological Assessment |
| Future Annual Discharge |
virtually certain |
|
likely |
| Future Extreme Discharge |
virtually certain |
|
likely |
| Future Hydrological Droughts |
virtually certain |
|
virtually certain |
|
Disclaimer/Publisher’s Note: The statements, opinions and data contained in all publications are solely those of the individual author(s) and contributor(s) and not of MDPI and/or the editor(s). MDPI and/or the editor(s) disclaim responsibility for any injury to people or property resulting from any ideas, methods, instructions or products referred to in the content. |
© 2024 by the authors. Licensee MDPI, Basel, Switzerland. This article is an open access article distributed under the terms and conditions of the Creative Commons Attribution (CC BY) license (http://creativecommons.org/licenses/by/4.0/).
