Submitted:
31 January 2024
Posted:
01 February 2024
You are already at the latest version
Abstract
Keywords:
1. Introduction
2. Materials and Methods
2.1. Experiments on Friction and Wear
2.2. Methodology for the Assessment of Damage at Friction
3. Method for Performance Assessment of Lubricating Compositions Containing Nano-Additives
3.1. Experimental Research Results
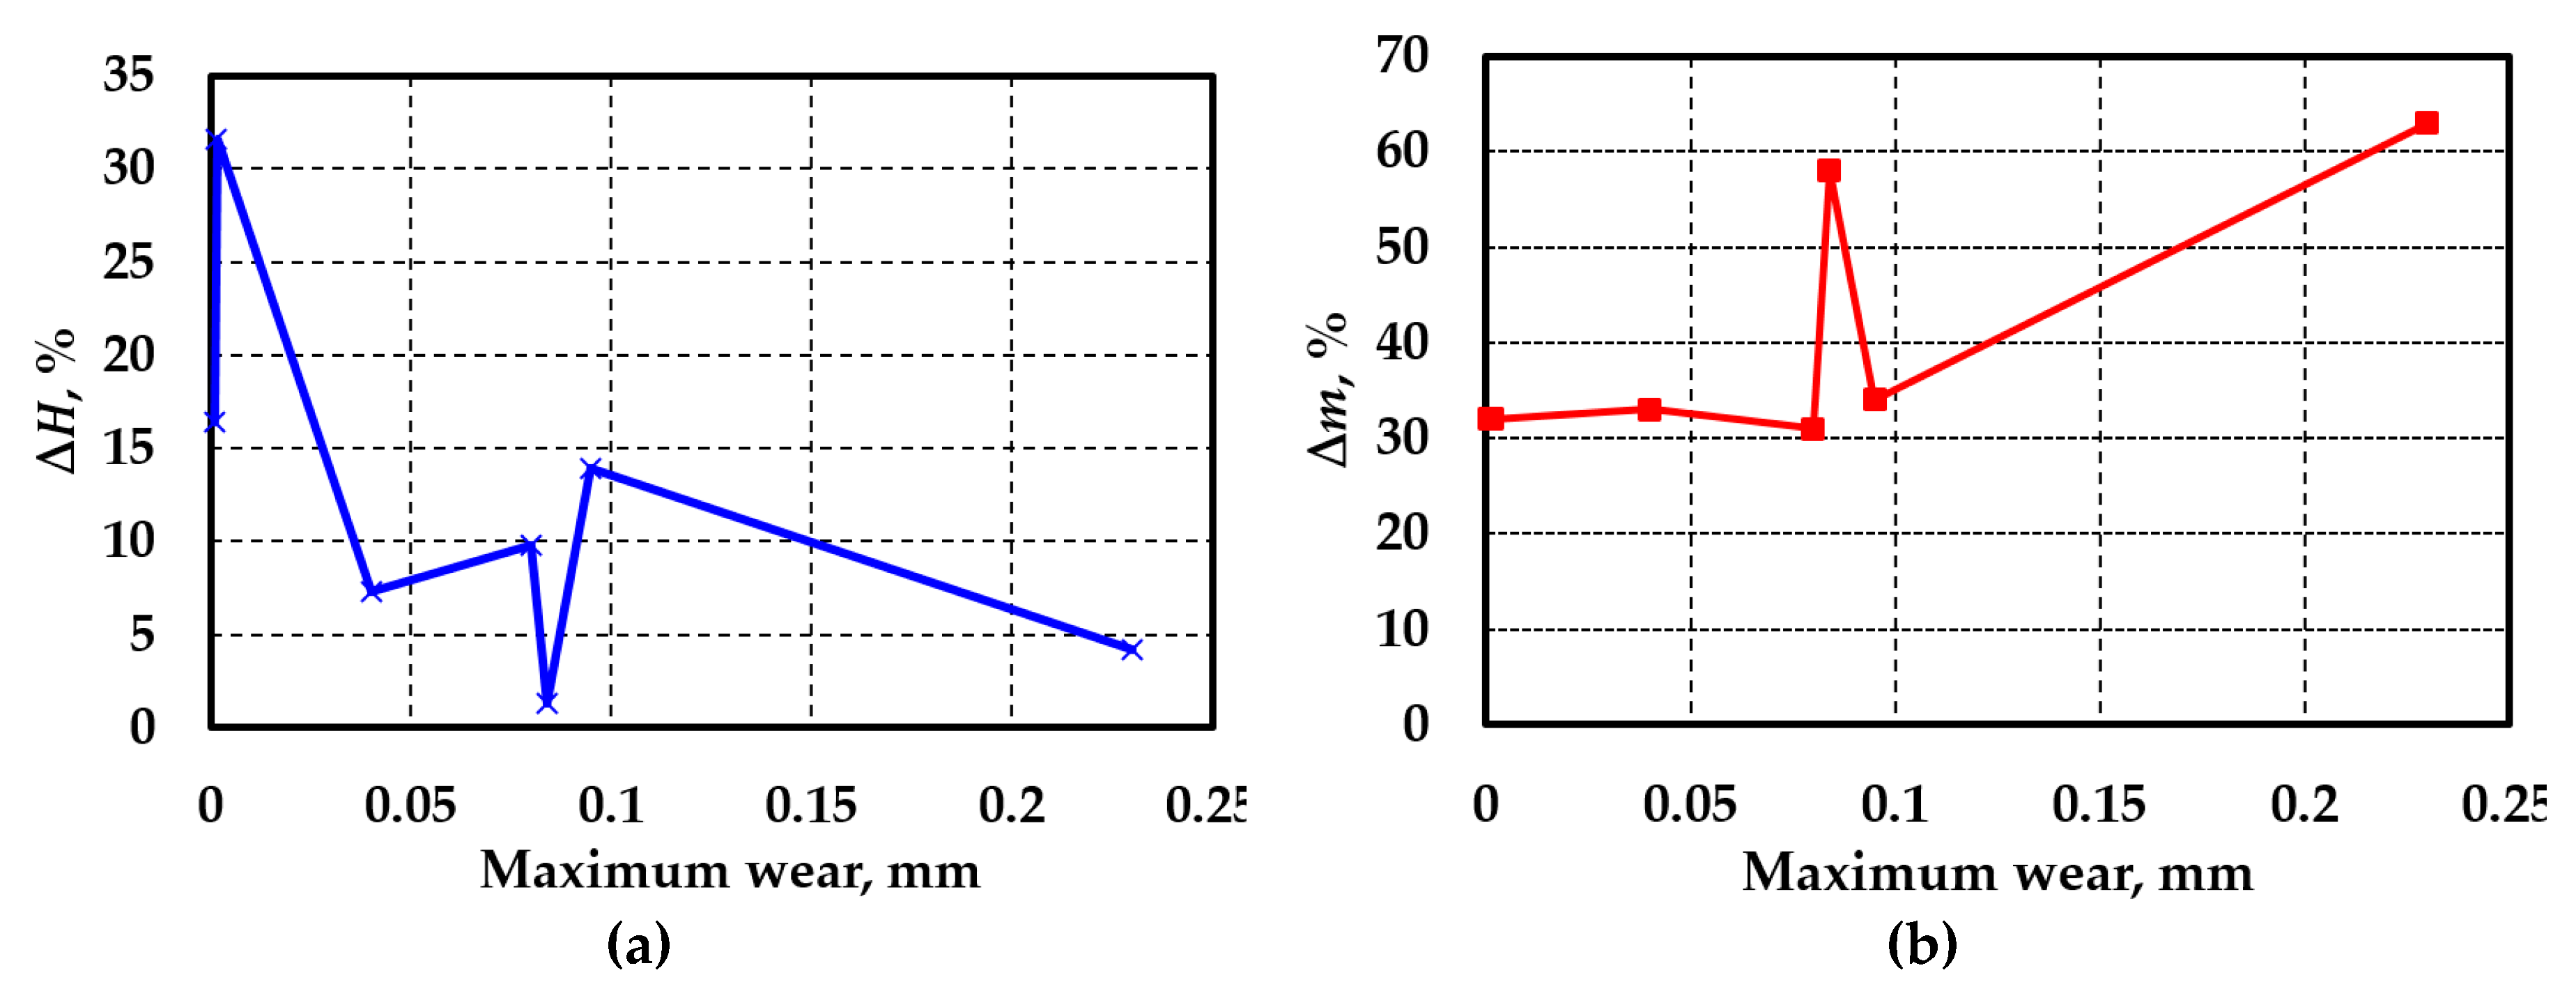
3.3. Lubricant Composition Performance Evaluation Method
4. Conclusions
Author Contributions
Funding
Institutional Review Board Statement
Informed Consent Statement
Data Availability Statement
Conflicts of Interest
References
- Ma, L.; He, C.G.; Zhao, X.J.; Guo, J.; Zhu, Y.; Wang, W.J.; Liu, Q.Y.; Jin, X.S. Study on wear and rolling contact fatigue behaviors of wheel-rail materials under different slip ratio conditions. Wear 2016, 366-367, 13-26. [CrossRef]
- Cannon, D.F.; Edel, K.-O.; Grassie, S.L.; Sawley, K. Rail defects: An overview. Fatigue Fracture Eng. Mater. Struct. 2003, 26, 865–887. [CrossRef]
- Harris, W.J.; Ebersöhn, W.; Lundgren, J.; Tournay, H.; Zakharov, S. Guidelines to Best Practices for Heavy Haul Railway Operations: Wheel and Rail Interface Issues; International Heavy Haul Association: Virginia Beach, VA, USA, 2001.
- AGRINOL. Available online: www.agrinol.ua (accessed on 10 May 2023).
- AIMOL. Available online: www.aimol.nl (accessed on 18 May 2023).
- Singh, A.; Chauhan, P.; Mamatha, T. A review on tribological performance of lubricants with nanoparticles additives. Mater. Today Proc. 2020, 25, 586–591. [CrossRef]
- Singh, A.; Chauhan, P.; Mamatha, T. A review on tribological performance of lubricants with nanoparticles additives. Mater. Today Proc., 2020, 25, 586–591. [CrossRef]
- Waqas, M.; Zahid, R.; Bhutta, M.U.; Khan, Z.A.; Saeed, A. A Review of Friction Performance of Lubricants with Nano Additives. Materials, 2021, 14, 6310. [CrossRef]
- Venger, R.; Tmenova, T.; Valensi, F.; Veklich, A.; Cressault, Y.; Boretskij, V. Detailed Investigation of the Electric Discharge Plasma between Copper Electrodes Immersed into Water. Atoms, 2017, 5, 40. [CrossRef]
- Ijaz, I.; Gilani, E.; Nazir, A.; Bukhari, A. Detail review on chemical, physical and green synthesis, classification, characterizations and applications of nanoparticles. Green Chem. Lett. Rev. 2020, 13, 223–245. [CrossRef]
- Ealias, A.M.; Saravanakumar, M.P. A review on the classification, characterisation, synthesis of nanoparticles and their application. IOP Conf. Ser. Mater. Sci. Eng., 2017, 263, 032019. [CrossRef]
- Kargin, S.; Artyukh, V.; Ignatovich, I.; Dikareva, V. Development and efficiency assessment of process lubrication for hot forging. IOP Conf. Ser. Earth and Environmental Science 2017, 90, 012190. [CrossRef]
- Warden, R.; Frame, E.; Tedesco, S.J.; Brandt, A.C. Laboratory Based Axle Lubricant Efficiency Evaluation. Interim Report TFLRF (U.S. Army TARDEC Fuel and Lubricants Research Facility), No. 459, 2014, 24 р.
- Abramov, A.N.; Semenov, V.I.; Tyulenev, D.G.; Sholom, V.Yu.; Valeeva, A.Kh. Method of choice of lubricants for process of wet drawing brass-coated wires. Proc. X-th Int. Baltic Conf. “Materials Engineering & Balttrib-2001”. Jurmala, Latvia, 2001, 231-234.
- Lewis, R., Magel, E., Wang, W.-J.; Olofsson, U.; Lewis, S.; Slatter, T.; Beagles, А. Towards a Standard Approach for Wear Testing of Wheel and Rail Materials. Proceedings of the Institution of Mechanical Engineers, Part F: Journal of Rail and Rapid Transit, 2017, 231 (7), 760-774. [CrossRef]
- Olofsson, U.; Telliskivi, T. Wear, Friction and Plastic Deformation of Two Rail Steels - Full Scale Test and Laboratory Study. Wear, 2003, 254, 80–93. [CrossRef]
- Polzer, G.; Meissner, F. Grundlagen zu Reibung und Verschleiß. VEB Deutscher Verlag für Grundstoffindustrie Leipzig, Leipzig, 1983, 340 s.
- Chichinadze, A.V. et al. Fundamentals of tribology (friction, wear, lubrication). M.:Mechanical Engineering, 2001, 664 p.
- Patent of RF N 2119165, Gromakovskij, D.G.; Belen’kikh, E.V.; Ibatullin, I.D.; Karpov, A.S.; Kovshov, A.G.; Sorokin, A.N.; Kudjurov, L.V.; Torrens, E. Method evaluating activation energy of thermal-mechanical destruction of lubricants in progress of friction, 20 September 1998.
- Kosarchuk, V.; Chausov, M.; Pylypenko, A.; Tverdomed, V.; Maruschak, P.; Vasylkiv, V. Increasing Wear Resistance of Heavy-Loaded Friction Pairs by Nanoparticles in Conventional Lubricants: A Proof of Concept. Lubricants, 2022, 10, 64. [CrossRef]
- Veklich, A.; Lebid, A.; Tmenova, T.; Boretskij, V.; Cressault, Y.; Valensi, F.; Lopatko, K.; Aftandilyants, Y. Plasma assisted generation of micro- and nanoparticles. Plasma Physics and Technology 2017, 4(1), 28-31. [CrossRef]
- Meng, Y.; Xu, J.; Jin, Z.; Prakash, B.; Hu, Y. A review of recent advances in tribology. Friction 2020, 8(2), 221–300. [CrossRef]
- Sundararajan, G.; Roy, M. Hardness Testing. Encyclopedia of Materials: Science and Technology. Editor(s): K.H. Jürgen Buschow, Robert, W. Cahn, Merton, C. Flemings, Bernhard Ilschner, Edward, J. Kramer, Subhash Mahajan, Patrick Veyssière, Elsevier, 2001, pp. 3728–3736. [CrossRef]
- Hashemi, S.H. Strength-hardness statistical correlation in API X65 steel. Mater. Sci. Eng. A. 2011, 528 (3), 1648–1655. [CrossRef]
- Tekkaya, A.E. Improved relationship between Vickers hardness and yield stress for cold formed materials. Steel Research 2001, 72 (8), 304–310. [CrossRef]
- Lebedev, A.; Muzyka, M.R. Technical diagnostics of the material using the LM-hardness method. Problems of resource and safety of operation of structures, buildings and machines. Kiev: Institute of Electric Welding named after E.O. Paton National Academy of Sciences of Ukraine, 2006, 97–101.
- Sakai, T.; Nakajima, M.; Tokaji, K.; Hasegawa, N. Statistical distribution patterns in mechanical and fatigue properties of metallic materials. Materials Science Research International 1997, 3(2), 63 – 74. [CrossRef]
- Маkhutov, N.А. Structural strength, resource and technogenic safety. Part1: Strength and resource criteria. Nauka: Novosibirsk, Russia, 2005. (In Russian).
- Lebedev, A.A.; Makovetskiy, I.V.; Muzyka, M.R.; Volchek, N.L.; Shvets, V.P. Evaluation of damage to the material by the dispersion of the characteristics of elasticity and static strength. Strength of Materials. 2012, 6, 5–14.
- Lokoshchenko, А.М.; Ilyin, А.А.; Mamonov, А.М.; Nazarov, V.V. Analysis of creep and long-term strength of titanium alloy VT6 with pre-embedded hydrogen. Physical and chemical mechanics of materials, 2008, 5, 98 – 104.
- Lebedev, A.A.; Makovetskiy, I.V.; Muzyka, M.R.; Shvets, V.P. Study of the Processes of Deformation and Damage Accumulation in Steel 10GN2MFA under Low-Cycle Loading. Strength of Materials, 2008, 2, 5–10.
- Chausov, M.; Pylypenko, A.; Maruschak, P.; Menou, A. Phenomenological Models and Peculiarities of Evaluating Fatigue Life of Aluminum Alloys Subjected to Dynamic Non-Equilibrium Processes. Metals, 2021, 11, 1625. https:// doi.org/10.3390/met11101625.
- Muzyka, M.R.; Shvets, V.P. Determination of stresses and strains in a deformed elastoplastic material by hardness characteristics. Strength of Materials 2014, 4, 84–91.
- Muzyka, M.R.; Shvets, V.P. Influence of the type of loading on the process of damage accumulation in the material, Strength of Materials 2014, 1, 130–136.
- DSTU 7793:2015; Metal materials. Determination of the level of scattered damage by LM-hardness method, State enterprise “Ukrainian scientific research and training center for problems of standardization, certification and quality”, Kyiv, Ukraine, 2016, 15p. (in Ukrainian).
- Gumbel, E.J. Statistical theory of extreme values and some practical applications: A series of lectures (Vol.33). US Government Printing Office: Washington, USA, 1954, 472 p.
- Padgurskas, J.; Rukuiza, R.; Prosycevas, I.; Kreivaitis, R. Tribological properties of lubricant additives of Fe, Cu and Co nanoparticles. Tribol. Int., 2013, 60, 224–232. [CrossRef]
- Choi, Y.; Lee, C.; Hwang, Y.; Park, M.; Lee, J.; Choi, C.; Jung, M. Tribological behavior of copper nanoparticles as additives in oil. Curr. Appl. Phys. 2009, 9, e124–e127. [CrossRef]
- Jatti, V.S.; Singh, T.P. Copper oxide nano-particles as friction-reduction and anti-wear additives in lubricating oil. J. Mech. Sci. Technol., 2015, 29(2), 793–798. [CrossRef]
- Tarasov, S. Yu.; Belyaev, S.A.; Lerner, M.I. Wear Resistance of Structural Steel in Lubricants Bearing Metal Nanopowders. Metal Science and Heat Treatment, 2005, 47(11 – 12), 560 – 565. [CrossRef]
- Tarasov, S.; Belyaev, S. Alloying contact zones by metallic nanopowders in sliding wear. Wear, 2004, 257, 523–530. [CrossRef]
- Ghaednia, H.; Jackson, R.L. The effect of nanoparticles on the real area of contact, friction and wear. J. Tribol. 2013, 135, 041603. [CrossRef]
| Materials |
Chemical composition (in terms of main components) |
, GPa | , MPa | , MPa |
| Rail steel | С – 0.57%, Si – 0.32%, Mn – 0.94%, Fe – base | 211 | 740 | 920 |
| Industrial steel | С – 0.18%, Si – 0.19%, Mn – 0.41%, Cr – 0.05%, Fe – base | 210 | 250 | 435 |
| Wheel steel | С – 0.58%, Si – 0.34%, Mn – 0.76%, Fe – base | 212 | 845 | 985 |
| М2 copper | Fe – 0.04%, Ni – 0.08%, Sn – 0.02, Cu – base | 117 | 116 | 210 |
| МА2 magnesium alloy | Al – 4.32%, Mn – 0.32%, Zn – 1.16%, Mg – base | 48.8 | 135 | 230 |
| Al-Mn alloy | Mn – 1.24%, Si – 0.26%, Fe – 0.18%, Cu – 0.09, Al – base | 70.5 | 141 | 224 |
| Sample material | Lubricant composition | ||
| Pure oil | No.1 | No.2—No.6 | |
| Rail steel | + | + | – |
| Industrial steel | + | + | |
| Sample material | Friction mode, lubricating composition number |
Maximum wear |
Relative friction coefficient | Variation of mean hardness | Variation of homogeneity coefficient |
| , mm | , % | , % | |||
| Rail steel | pure oil | 0.08 | +9.8 | +31 | |
| No.1 | <0.001 | +14.7 | +29 | ||
| Industrial steel | pure oil | 0.095 | +13.9 | +34 | |
| No.2 | 0.084 | +1.3 | +58 | ||
| No.3 | 0.23 | +4.2 | +63 | ||
| No.4 | 0.0015 | +31.6 | +32 | ||
| No.5 | 0.001 | +16.4 | +32 | ||
| No.6 | 0.04 | +7.3 | +33 |
Disclaimer/Publisher’s Note: The statements, opinions and data contained in all publications are solely those of the individual author(s) and contributor(s) and not of MDPI and/or the editor(s). MDPI and/or the editor(s) disclaim responsibility for any injury to people or property resulting from any ideas, methods, instructions or products referred to in the content. |
© 2024 by the authors. Licensee MDPI, Basel, Switzerland. This article is an open access article distributed under the terms and conditions of the Creative Commons Attribution (CC BY) license (https://creativecommons.org/licenses/by/4.0/).


