1. Introduction
High speed vehicles are rapidly developing in the aeronautical and astronautical realm. The successful flight tests of X-43A[
1] and X-51A[
2] have attracted widespread attention in high speed airframe/engine integration vehicle.
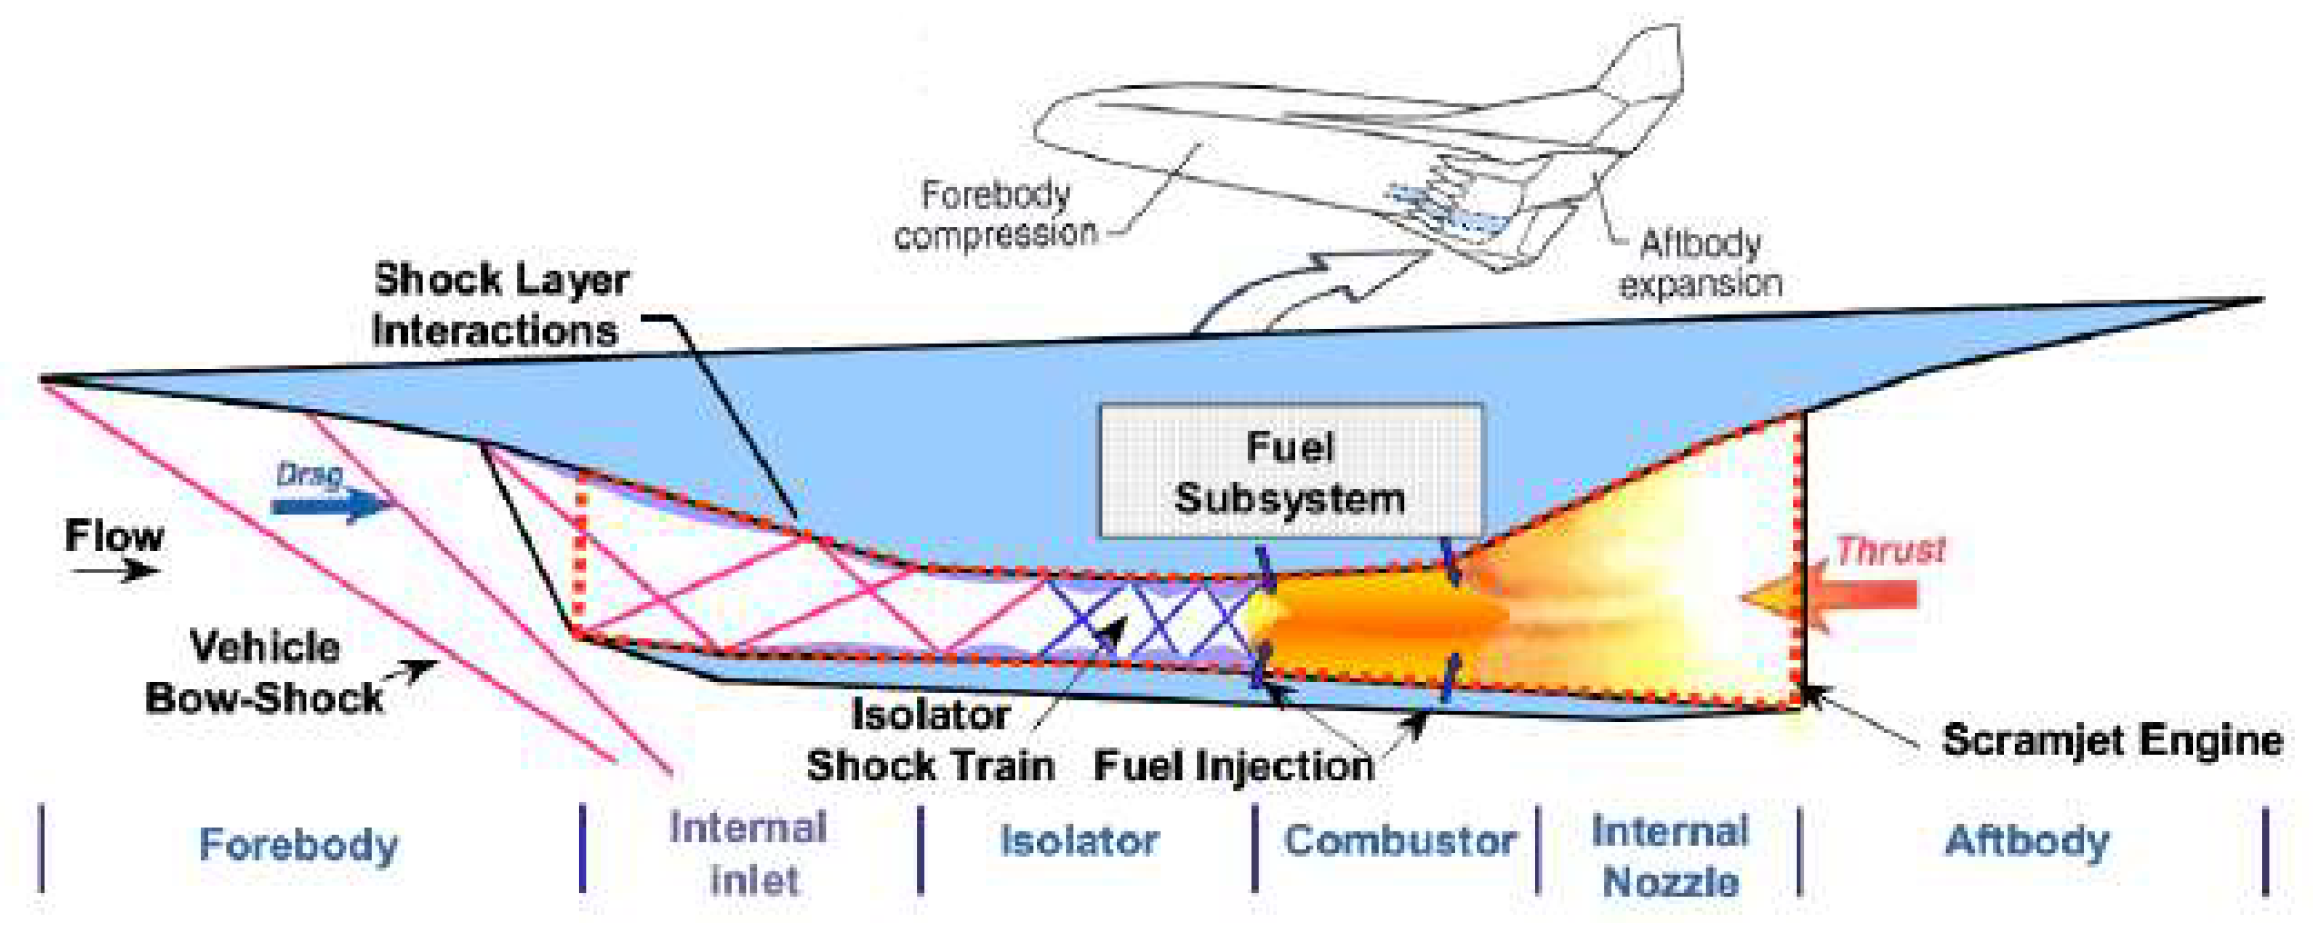
Figure 1 demonstrates the schematic of the typical integrated high speed vehicle[
3]. Denman et al[
4] implement a series of shock tunnel experiments with a rectangular to elliptical throat transition engine, and achieve the ignition and combustion of hydrocarbon fuels at a high Mach number. To evaluate the effects of trips on oscillatory flows, GAO et al[
5] conducted an experimental investigation on axisymmetric high speed inlet, the results indicate that trips exert substantial effects on oscillatory flows of high speed inlet, especially for unstart flows. These researches involve experimental facilities, models, fuels etc, which is complex, costly and time-consuming. Although the experimental tests have a relative high reliability, ground experimental facilities has costly expense and cannot simulate the real flight environment, it is necessary to employ computational fluid dynamic (CFD) method to gain important aerodynamic values and enhance research efficiency.
In recent years, CFD method becomes more and more widespread in high speed aerodynamic and can gain satisfactory values[6, 7]. Brad K.K[
8] introduces a new approach to integrated vehicle design known as the top-down design methodology. Daniel Oliden[
9] investigates the parametric effect of a high speed inlet using computational fluid dynamics. Han J. L[
10] compares the performance of several eddy-viscosity turbulence models in computing supersonic nozzle exhaust flows using ANSYS Fluent. Huang et al[
11] studies the effect of cavity location on combustion flow field for integrated high speed vehicle and analyzes the whole flow field characteristic using CFD method. Torrez[
12] gives the design and evaluation methods in highly-integrated high speed vehicles, compares the numerical solutions and experimental data. To improve the compression efficiency and aerodynamic performance of inlet, Wang et al[
13] use multistage optimization to design the shape morphing high speed inward-turning inlet based CFD, the numerical results demonstrate obvious decrease in flow non-uniformity and the total pressure loss. To achieve successful ignition and stable combustion in an ethylene-fueled scramjet, Shi et al[
14] apply the hydrogen as the pilot fuel to ignite ethylene at low flight Mach numbers and investigate the flow characteristics, flame propagation characteristics and combustion stability by various strategies of fuel injections.
However, CFD method requires enough computer storage and long simulation time, how to effectively maintain accuracy and reduce simulation is still an imperative challenge. With super-computer emerging and developing, large-scale numerical simulation becomes feasible, nevertheless, computation resource is finite and expense is difficult to bear, so other method is in demand to explore to improve computation efficiency. Wang et al[
15] propose a novel airframe/propulsion integration design method of high speed cruise aircraft, in order to evaluate the performance, the CFD method is used to perform numerical calculation on the design point, the results show a high level of compression efficiency and flow uniformity for the inlet, which enhances the design efficiency of high speed vehicle. Jiao et al[
16] perform an unsteady viscous numerical simulation to study the starting process of a high speed nozzle coupled with a simplified inlet model, the impact of the initial backpressure on the pulse-starting characteristics of high speed nozzle-inlet is studied. The results present the intuitional flow phenomenon including separation bubbles, induced shock waves and shock train, specifically the wall pressure distribution, which can help us improve starting characteristics by optimization. To improve inlet performance, a fluidic method to control the high speed inlet external shock based on forebody secondary flow recirculation is proposed and verified by both experimental and numerical methods[
17]. The obtained performances by CFD agree well with that by experiments. The predicted ramp shock basically overlaps the numerically obtained one, meanwhile, the numerical approach also provides additional information of the flowfield. Shape optimization is an effective way to upgrade the performance of high speed vehicles, more and more aerodynamic configurations are improved by CFD method because of its high efficiency and low cost[
18]. A high speed inlet is optimized by using gradient-based searches informed by an adjoint flow solution, the results show that an undesirable shock is removed in the optimized inlet compared with the original geometry[
19]. A parametric numerical study of aftbody design of airbreathing high speed vehicle is conducted using three-dimensional Euler simulation, the results show that large variation in the thrust-to-drag ratio highlights the criticality of the aftbody[
20]. Reardon et al[
21] apply computational fluid dynamics method to study the unstart problem in variable-geometry inlet, it was found that the quasi-steady CFD was able to correctly predict the started or unstarted operating mode for the different cowl angles considered.
From the public literature, the existing researches mainly focus on the forebody-inlet, combustor and nozzle, independently. Considering the flow and combustion calculation workload of integrated model is large and difficult and the divergence is prone to occur. The main reason is that the problem of shock wave interference for forebody-inlet is more prominent, the iterative period for solving the shock wave is long. For the combustor, the combustion process not only involves the chemical reactions, but also embodies complex flow problems such as shock interference, fuel evaporation and multiphase, which makes the numerical simulation of combustion camber more complicated and difficult. The nozzle mainly expands at a supersonic speed, as a result, the calculation is relatively easy. How to improve the calculation efficiency has become a difficult point while considering the entire integrated high speed vehicle in the full-state numerical simulation.
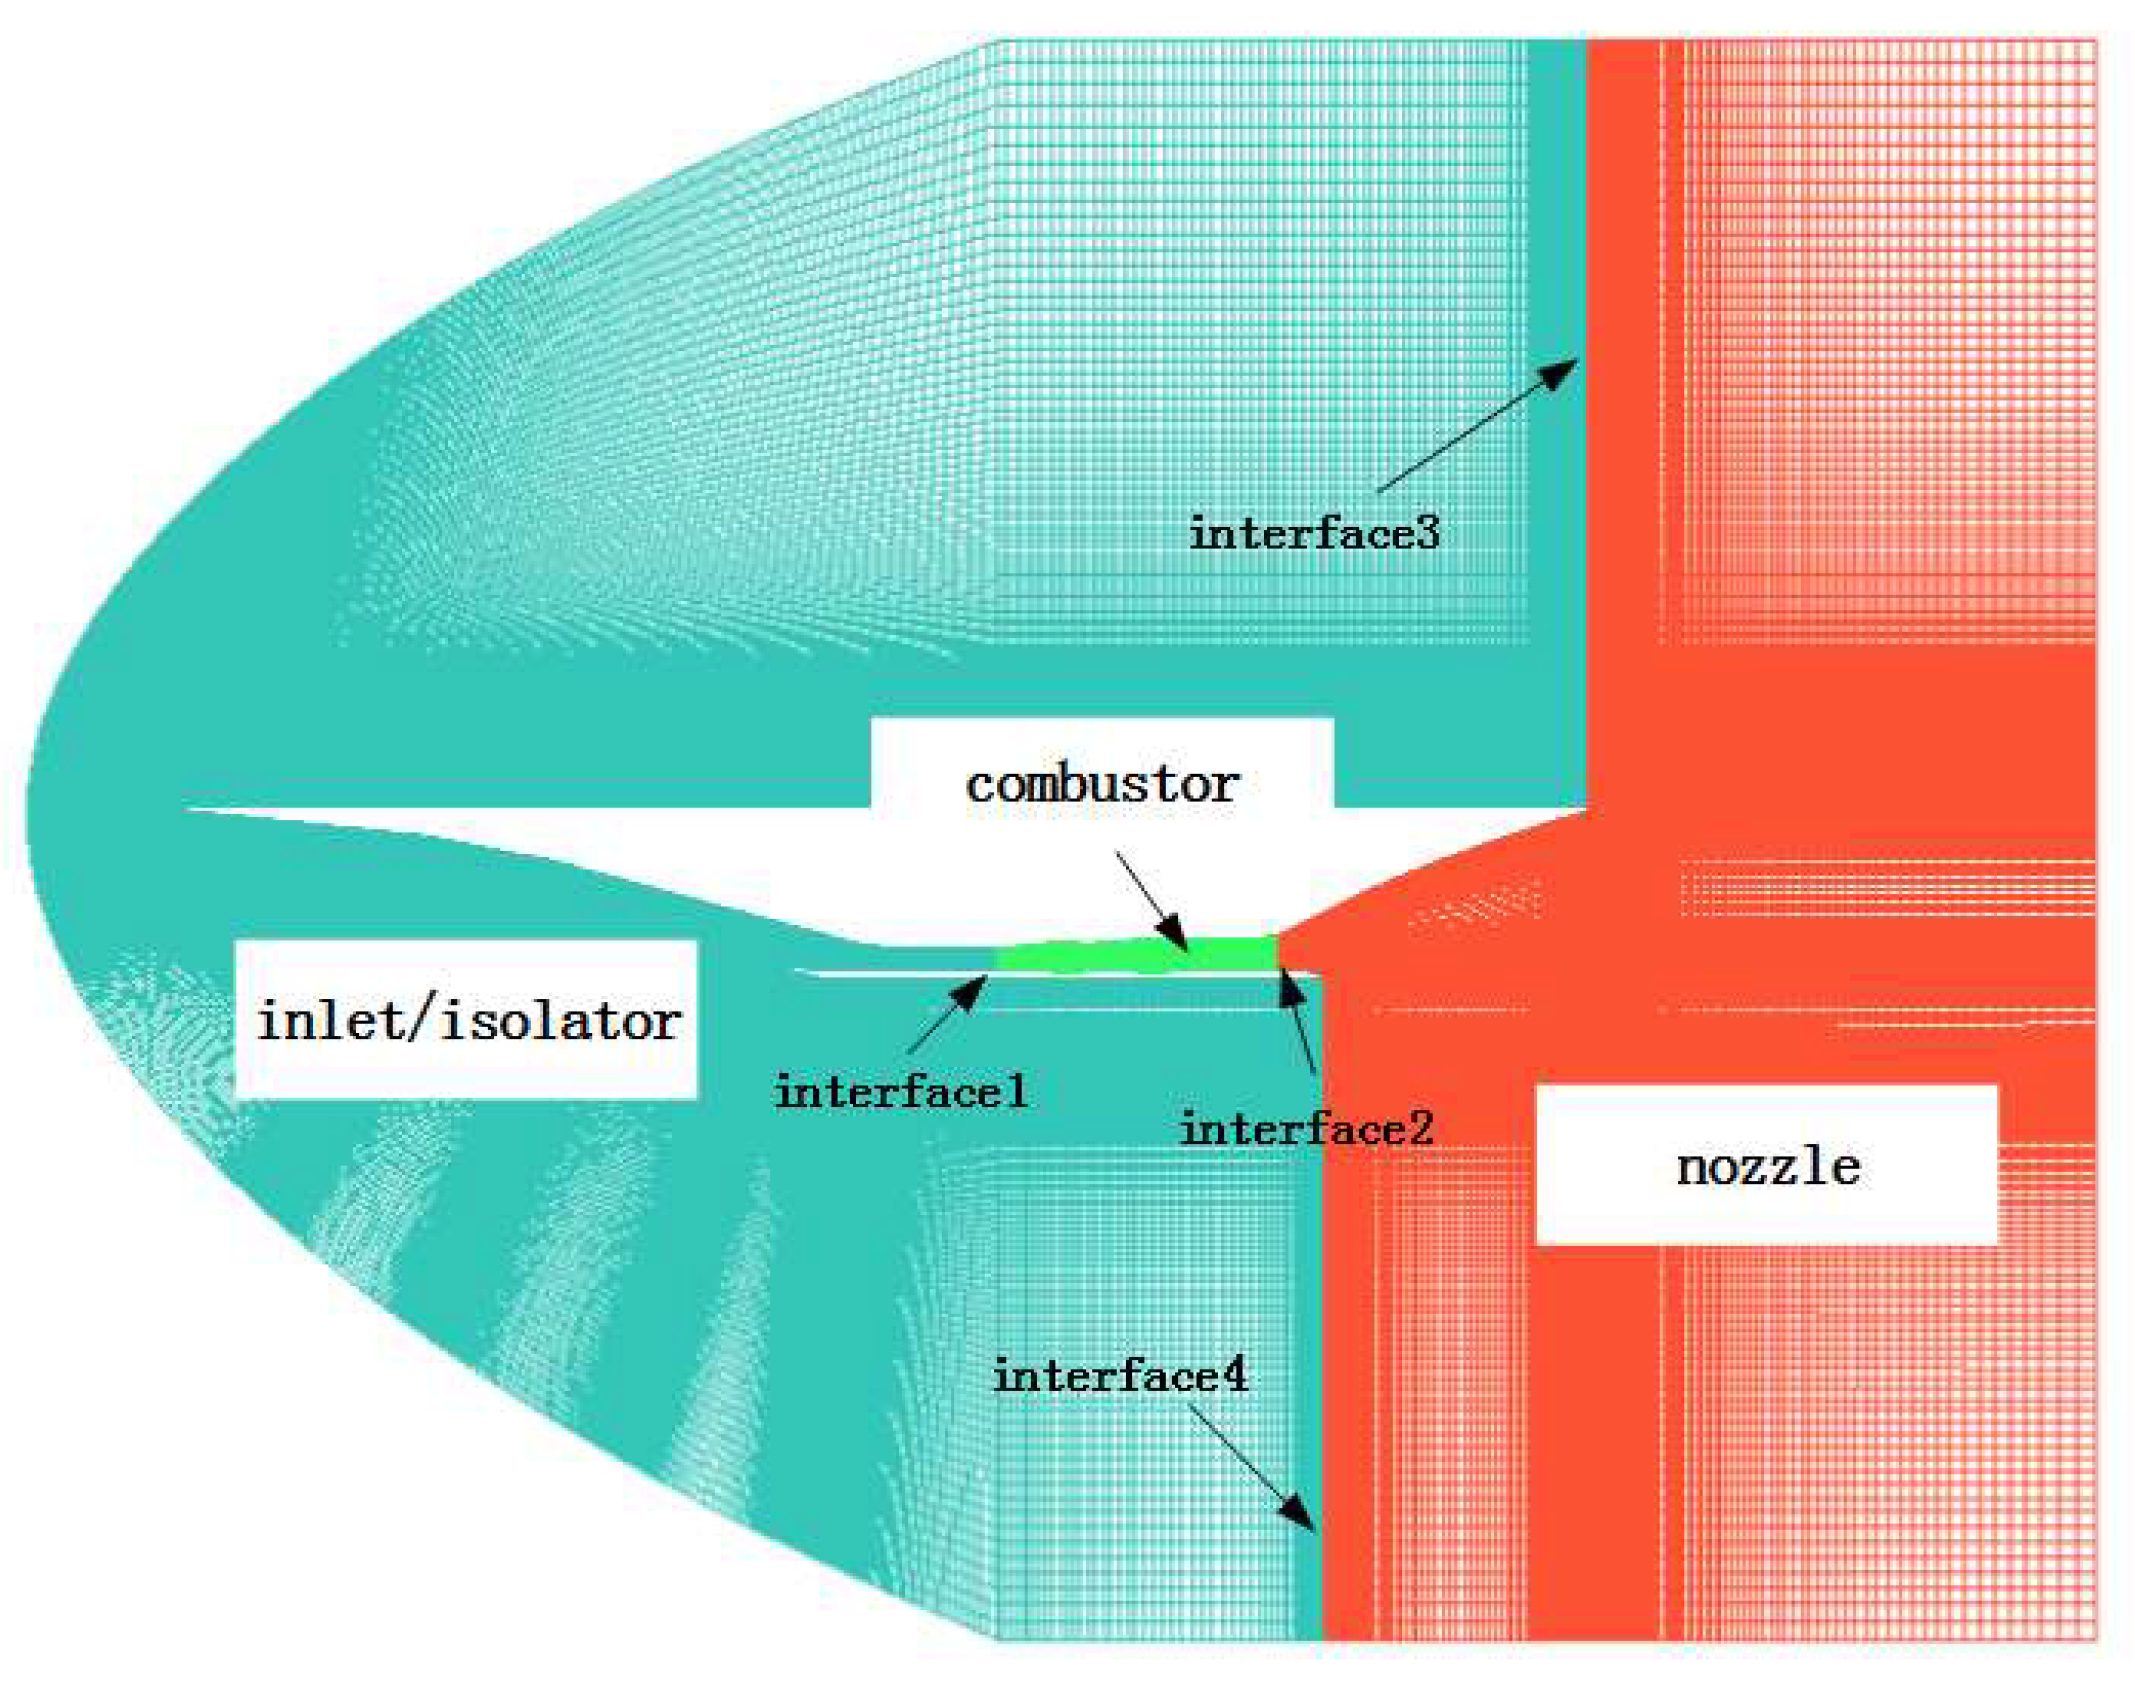
Based on the above discussion, a multiple fragment computation method is proposed in regimes of high speed airframe/engine integration vehicle. Considering the high speed flow trait, physical variables are extrapolated from the internal flow, therefore, the high speed flow field can be divided three parts, shockwave-solving need more simulation time for inlet and combustor, and expansion wave can be solved rapidly for nozzle. The outlet parameters of the isolator section from inlet are endowed to the inlet boundary conditions of combustion chamber, the condition of the exit of combustor serves as the inlet of nozzle. By the method, it can not only ensure the accuracy of the calculation, but also can classify and study the calculation according to characteristics of the internal flow and improve the efficiency by the distributed calculation of each component.
2. Governing Equations
The flow solver is a Reynolds Averaged Navier-Stokes (RANS) solver that utilizes finite volume approach. The governing equations are the compressible Navier-Stokes equations as follows,
Where, U is conservation scalar quantity,
represent the flux quantity at x, y and z direction, respectively. The subscript i represents inviscid flux vector and v is viscid flux vector.
Specific heat ratio is set as piecewise-polynomial. Sutherland formula is selected to calculate viscosity as follows,
Supposing that ideal gas equation is established,
The governing equations are discretized and numerically integrated based on a finite-volume approach. The RNG k–ε turbulence model is employed to simulate the internal/external flow fields of the two-dimensional high speed vehicle. The second order spatially accurate upwind scheme with the advection upstream splitting method (AUSM) flux vector splitting is utilized and the standard wall functions are introduced to solve the near-wall region flow. The inlet and outlet boundary for the first part is assigned as “far-field” and pressure-outlet boundary condition, the inlet and outlet boundary of combustion chamber and nozzle are assigned as pressure-inlet and pressure-outlet condition, and the no-slip adiabatic conditions are assumed for the walls. Eddy-Dissipation turbulence-chemistry interaction model is applied to compute combustion process in this paper, and the hydrogen(H2) is selected as fuel in the simulation.
4. Code Validation
In this section, the inlet/isolator model is numerically investigated and compared with experiment[22, 23]. The investigated subscale inlet model is a two-dimensional configuration with a width-to-height ratio of 3.5. The freestream Mach is 2.41, the unit Reynolds number is , the total pressure is 540 Kpa, the total temperature is 305 K, the given angle of attack of the freestream -10 deg. In this paper, the isolator is set at 79.3mm.
Figure 4.
Main dimensions of the model.
Figure 4.
Main dimensions of the model.
Figure 5.
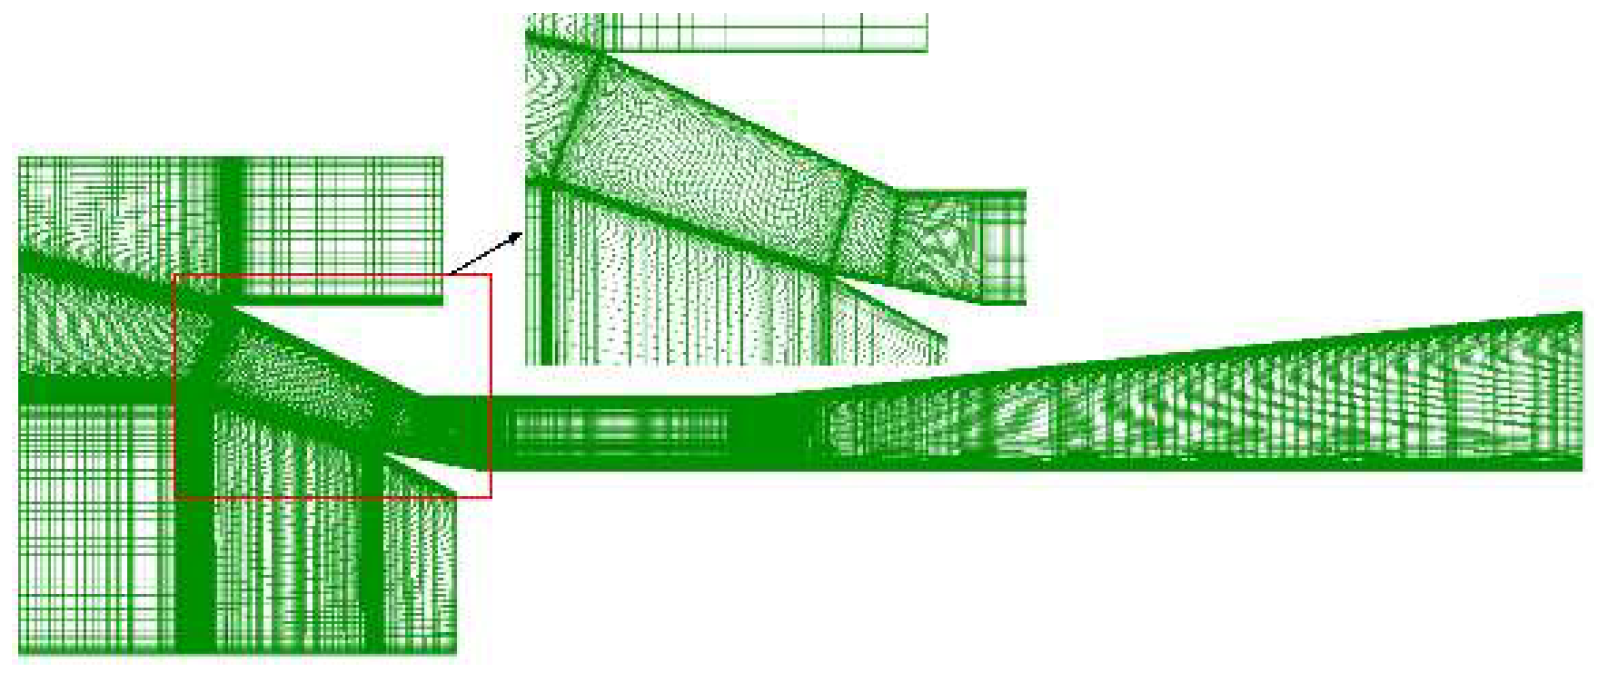
Computational grid.
Figure 5.
Computational grid.
A sort of structured grid is generated, in order to study the sensitivity analysis of grid on high speed inlet/isolator flow, four sets of grids are generated based on different height of first cell, the overall grid scale is
. The grids G1, G2, G3 and G4 are distinguished with
(first layer cell height)
,
,
and
, respectively, the grid description is showed in
Table 2.
Here, grid cell Reynolds number is computed as follows,
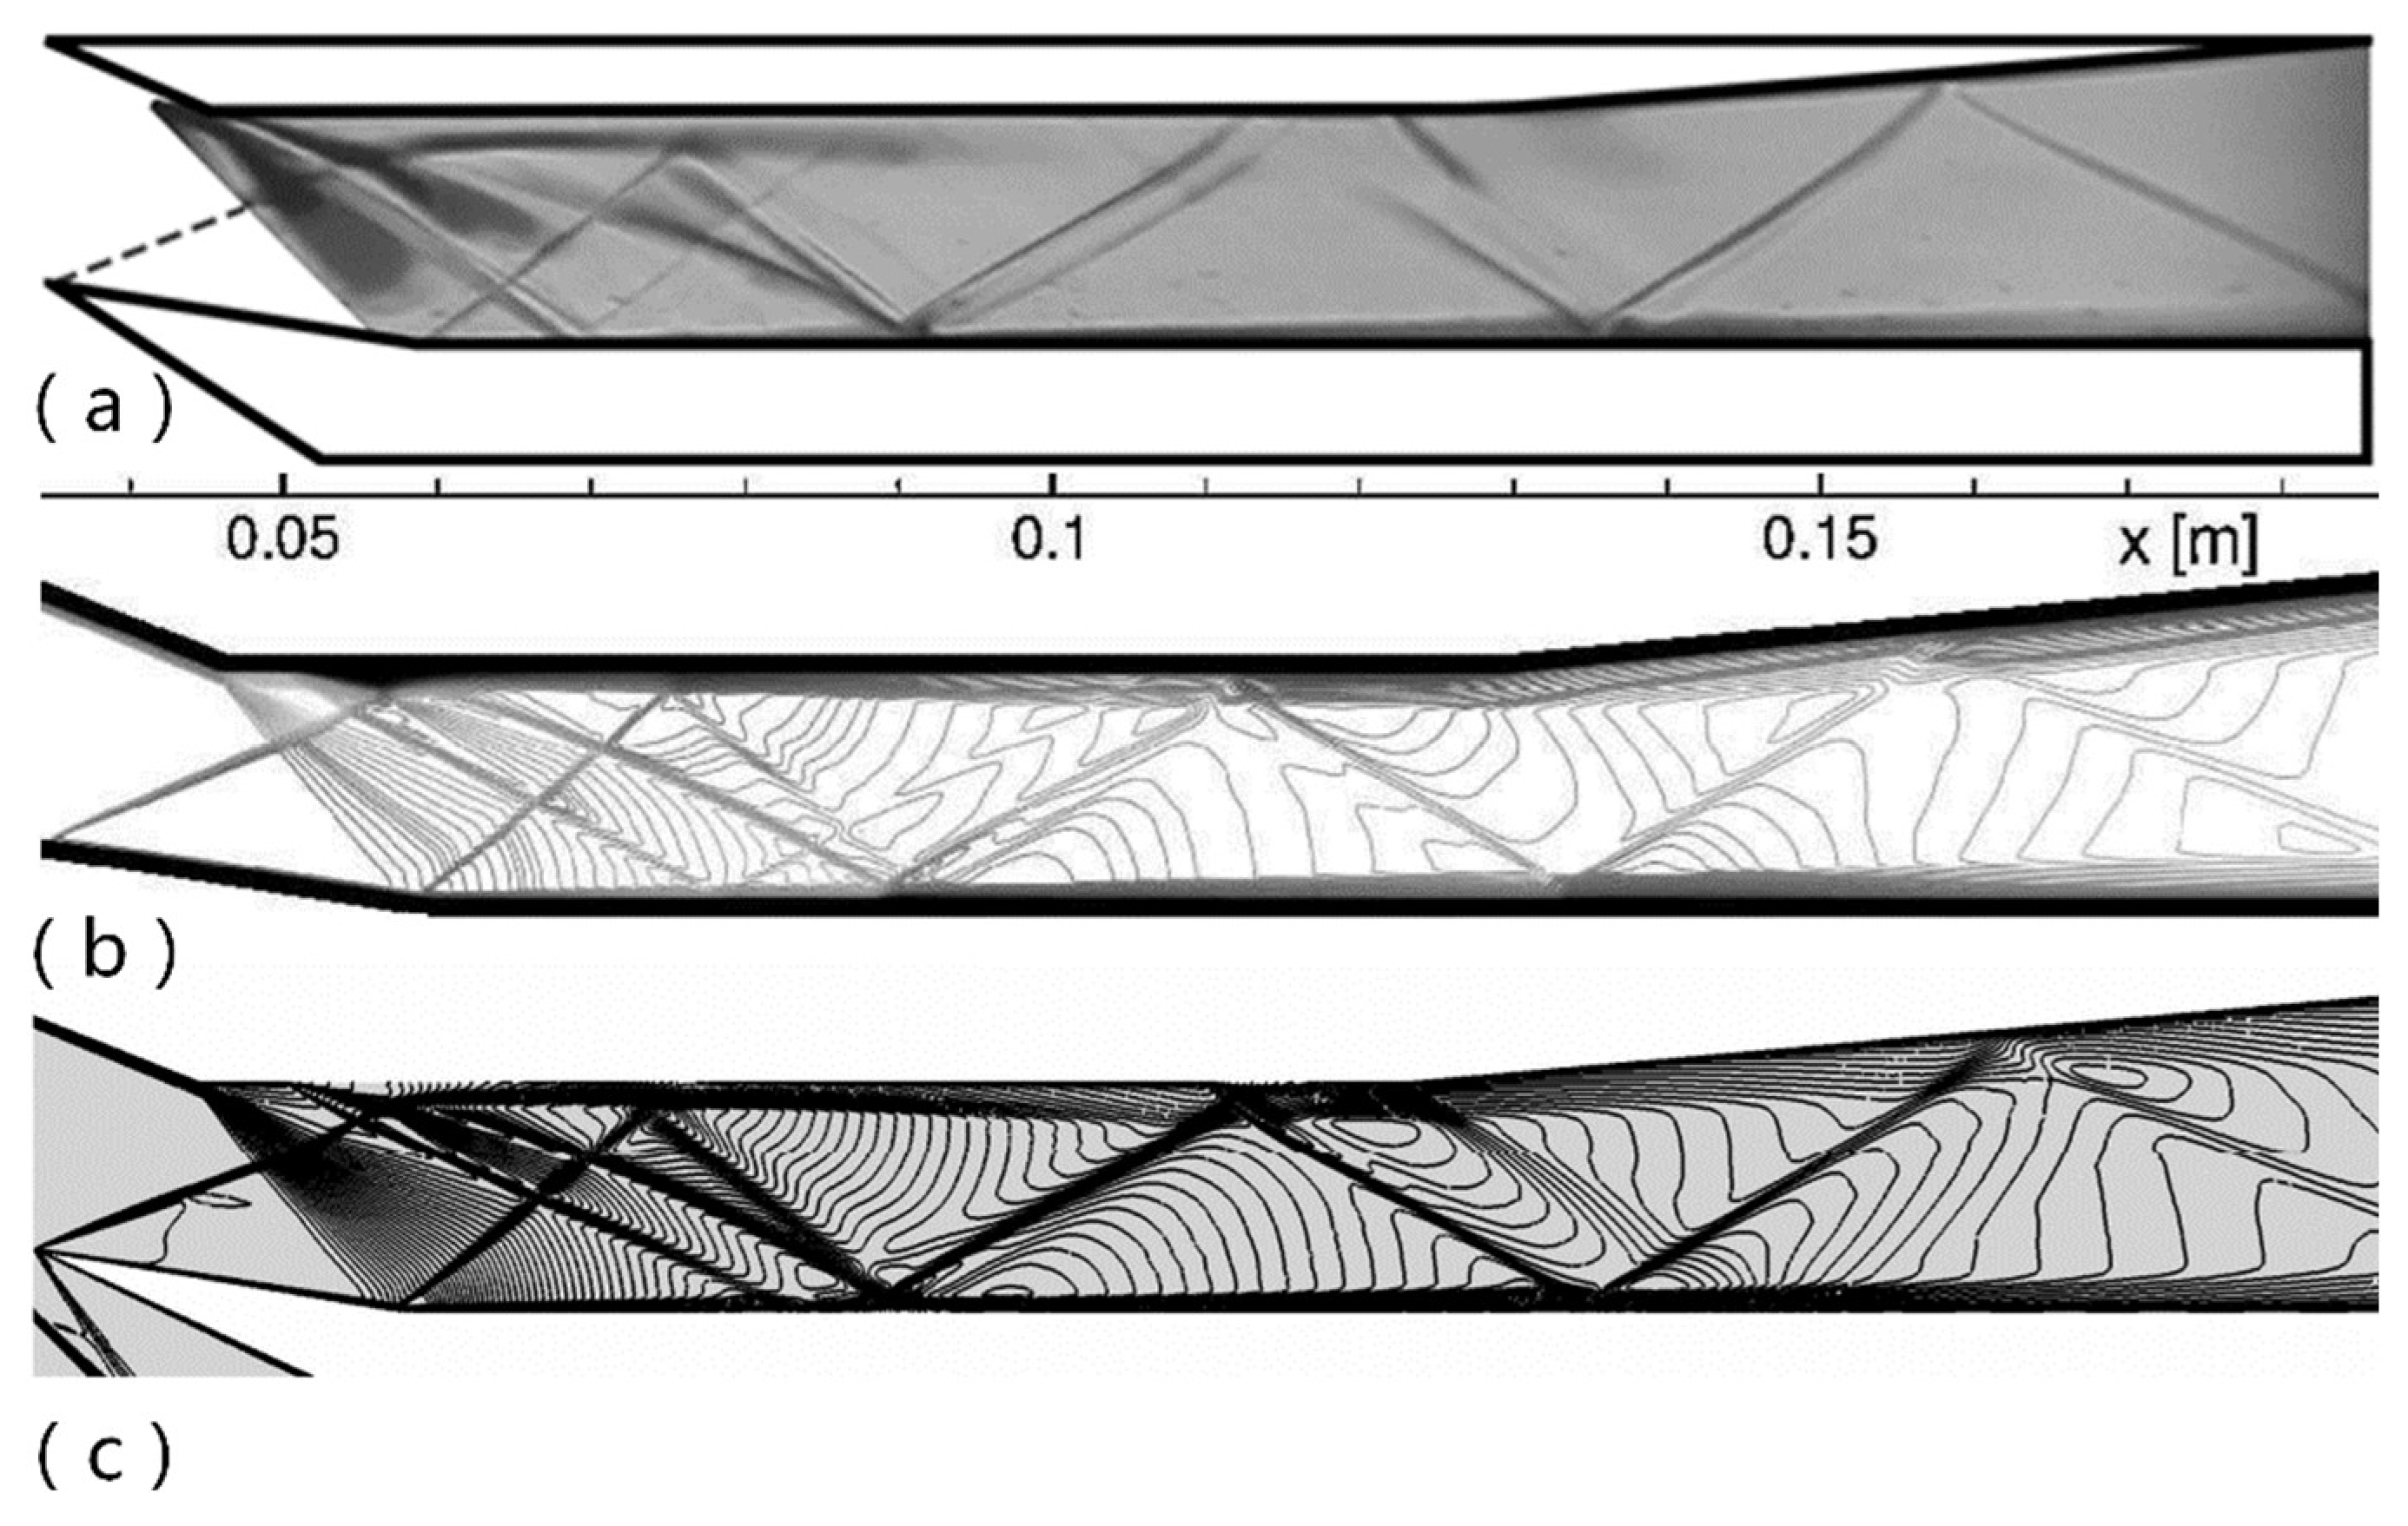
Figure 6 demonstrates the comparison of the experimental schlieren picture and numerical contour from literature and this paper. From the comparison, it illustrates that numerical method in this paper can get credible result close to experiment.
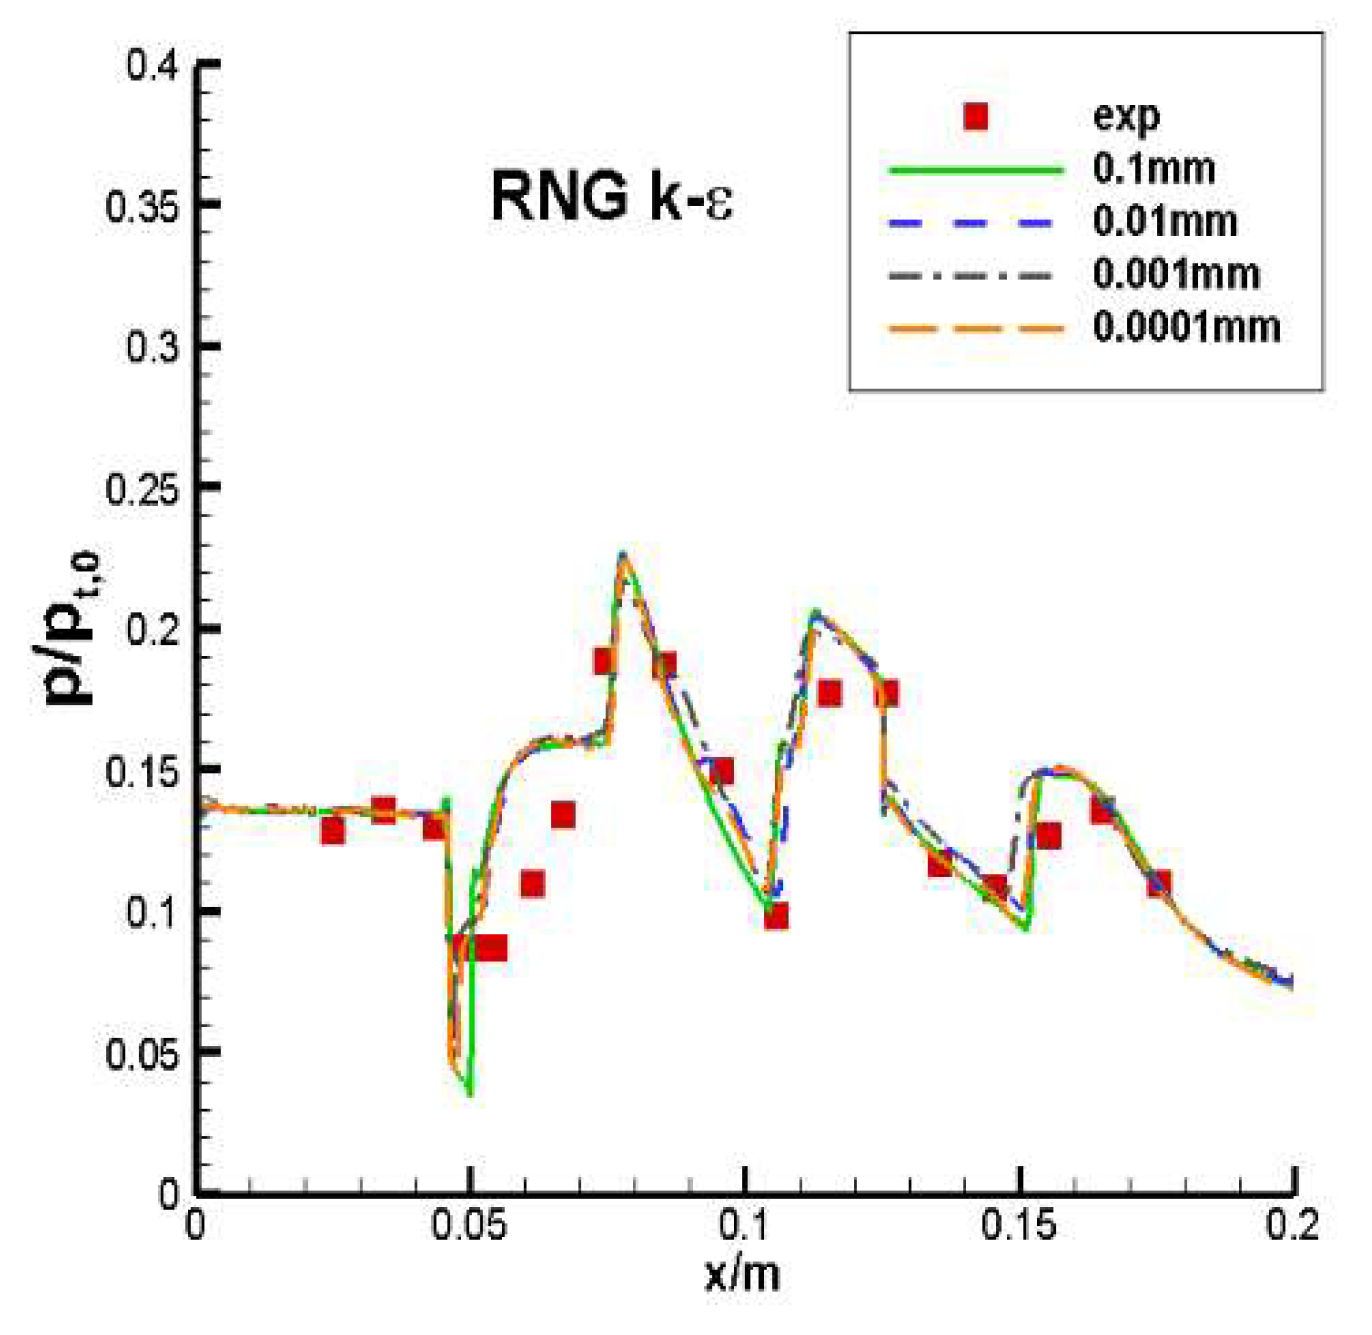
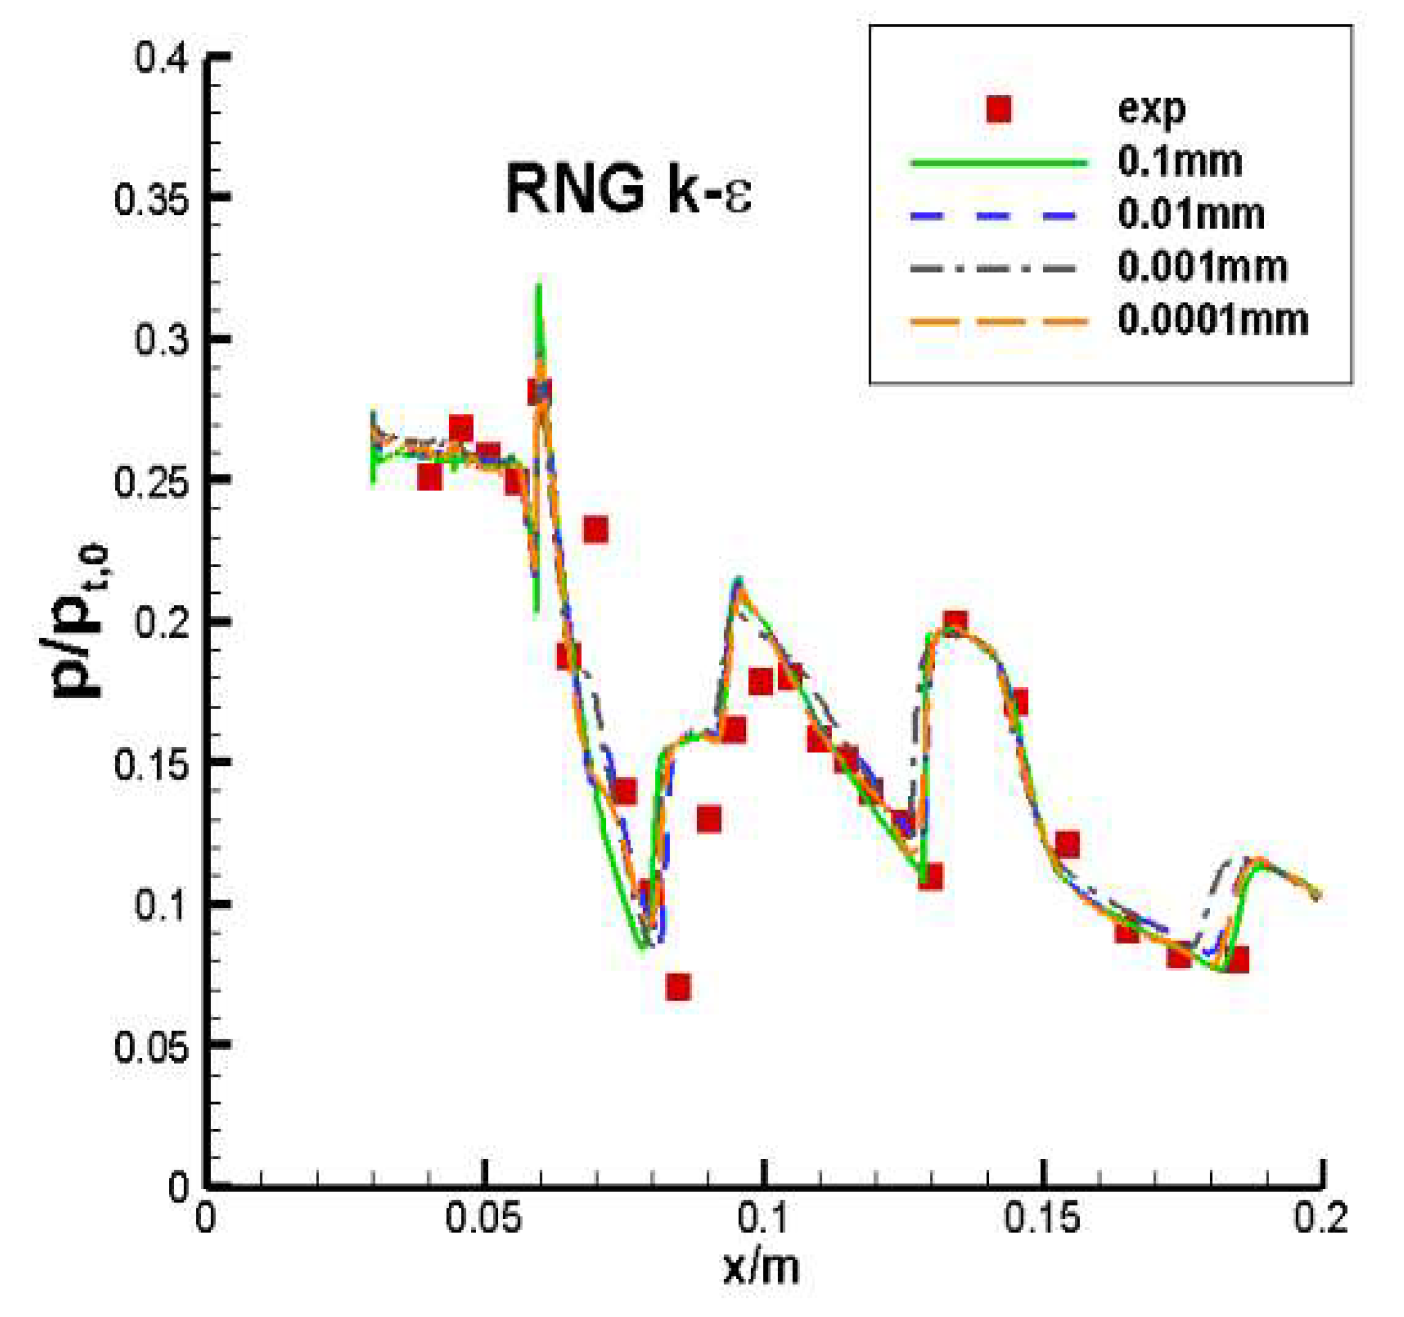
Figure 7 presents the wall pressure distributions obtained by numerical simulation and wind tunnel experiments, where p/pt, 0 indicates the ratio of static pressure along the wall and the freestream total pressure. The results show the numerical data match well with measured values.
5. Result and Discussion
A. Time Conclusion
Numerical simulation is executed in the following hardware device: 8 cores intel-i7-4770@3.40-GHz. In this study, it is found that 8 cores parallel does not makes the computer compute efficiency to the utmost and 6 cores parallel can get higher computation efficiency, so 6 cores parallel computation, not 8 cores, is selected in this paper to complete computation and compare the simulation efficiency. In this paper, inviscid flow field also is solved for reference.
Table 3.
Simulation time contrast of different computation method.
Table 3.
Simulation time contrast of different computation method.
| Cases |
model |
Courant number |
Simulation time |
| Case1 |
Inviscid |
0.5 |
450min |
| Case2 |
RNG k–ε-through |
0.5 |
684min |
| Case3 |
RNG k–ε-fragment-through |
0.5 |
376min |
| Case4 |
Reaction-through |
0.5 |
~2950min |
| Case5 |
Reaction-fragment-through |
0.5 |
~880min |
Integration simulation need more storage and considerable simulation time, for ordinary personal computer, it is difficult to complete the integration flow field computation at large-scale grid because of its inadequate storage. However, if the computational domain is divided multiple fragments and each section is computed independently, it will occupy less storage, which can enhance efficiency and reduce the requirement of computation resource. In the simulation process, the lift coefficient and drag coefficient are plotted to monitor convergence. The courant number is kept 0.5 constantly. As is known, the convergence is determined by the flow feature for each section, for example, it need more iteration steps for shock wave solving and less steps for expansion wave. Through analysis, when it reaches 20000 iterations, the inlet/isolator domain achieves steady and the computation is finished and costs 233 minutes. The combustion chamber domain need 30000 iteration steps with 127 minutes and the nozzle only need 4000 iterations with 16 minutes. The simulation time of whole flow field based on fragment is 376 minutes. The simulation time reaches 684 minutes for integration computation with 40000 iterations. Therefore, it is cheerfully found that it will reduce 45% time by using fragment method.
B. Aerodynamic Characteristic
In order to systematically investigate the discrepancy of fragment computation and integration computation of the integrated high speed vehicle. The flow is analyzed at different angles of attack from -2° to 10° at 2-degree intervals.
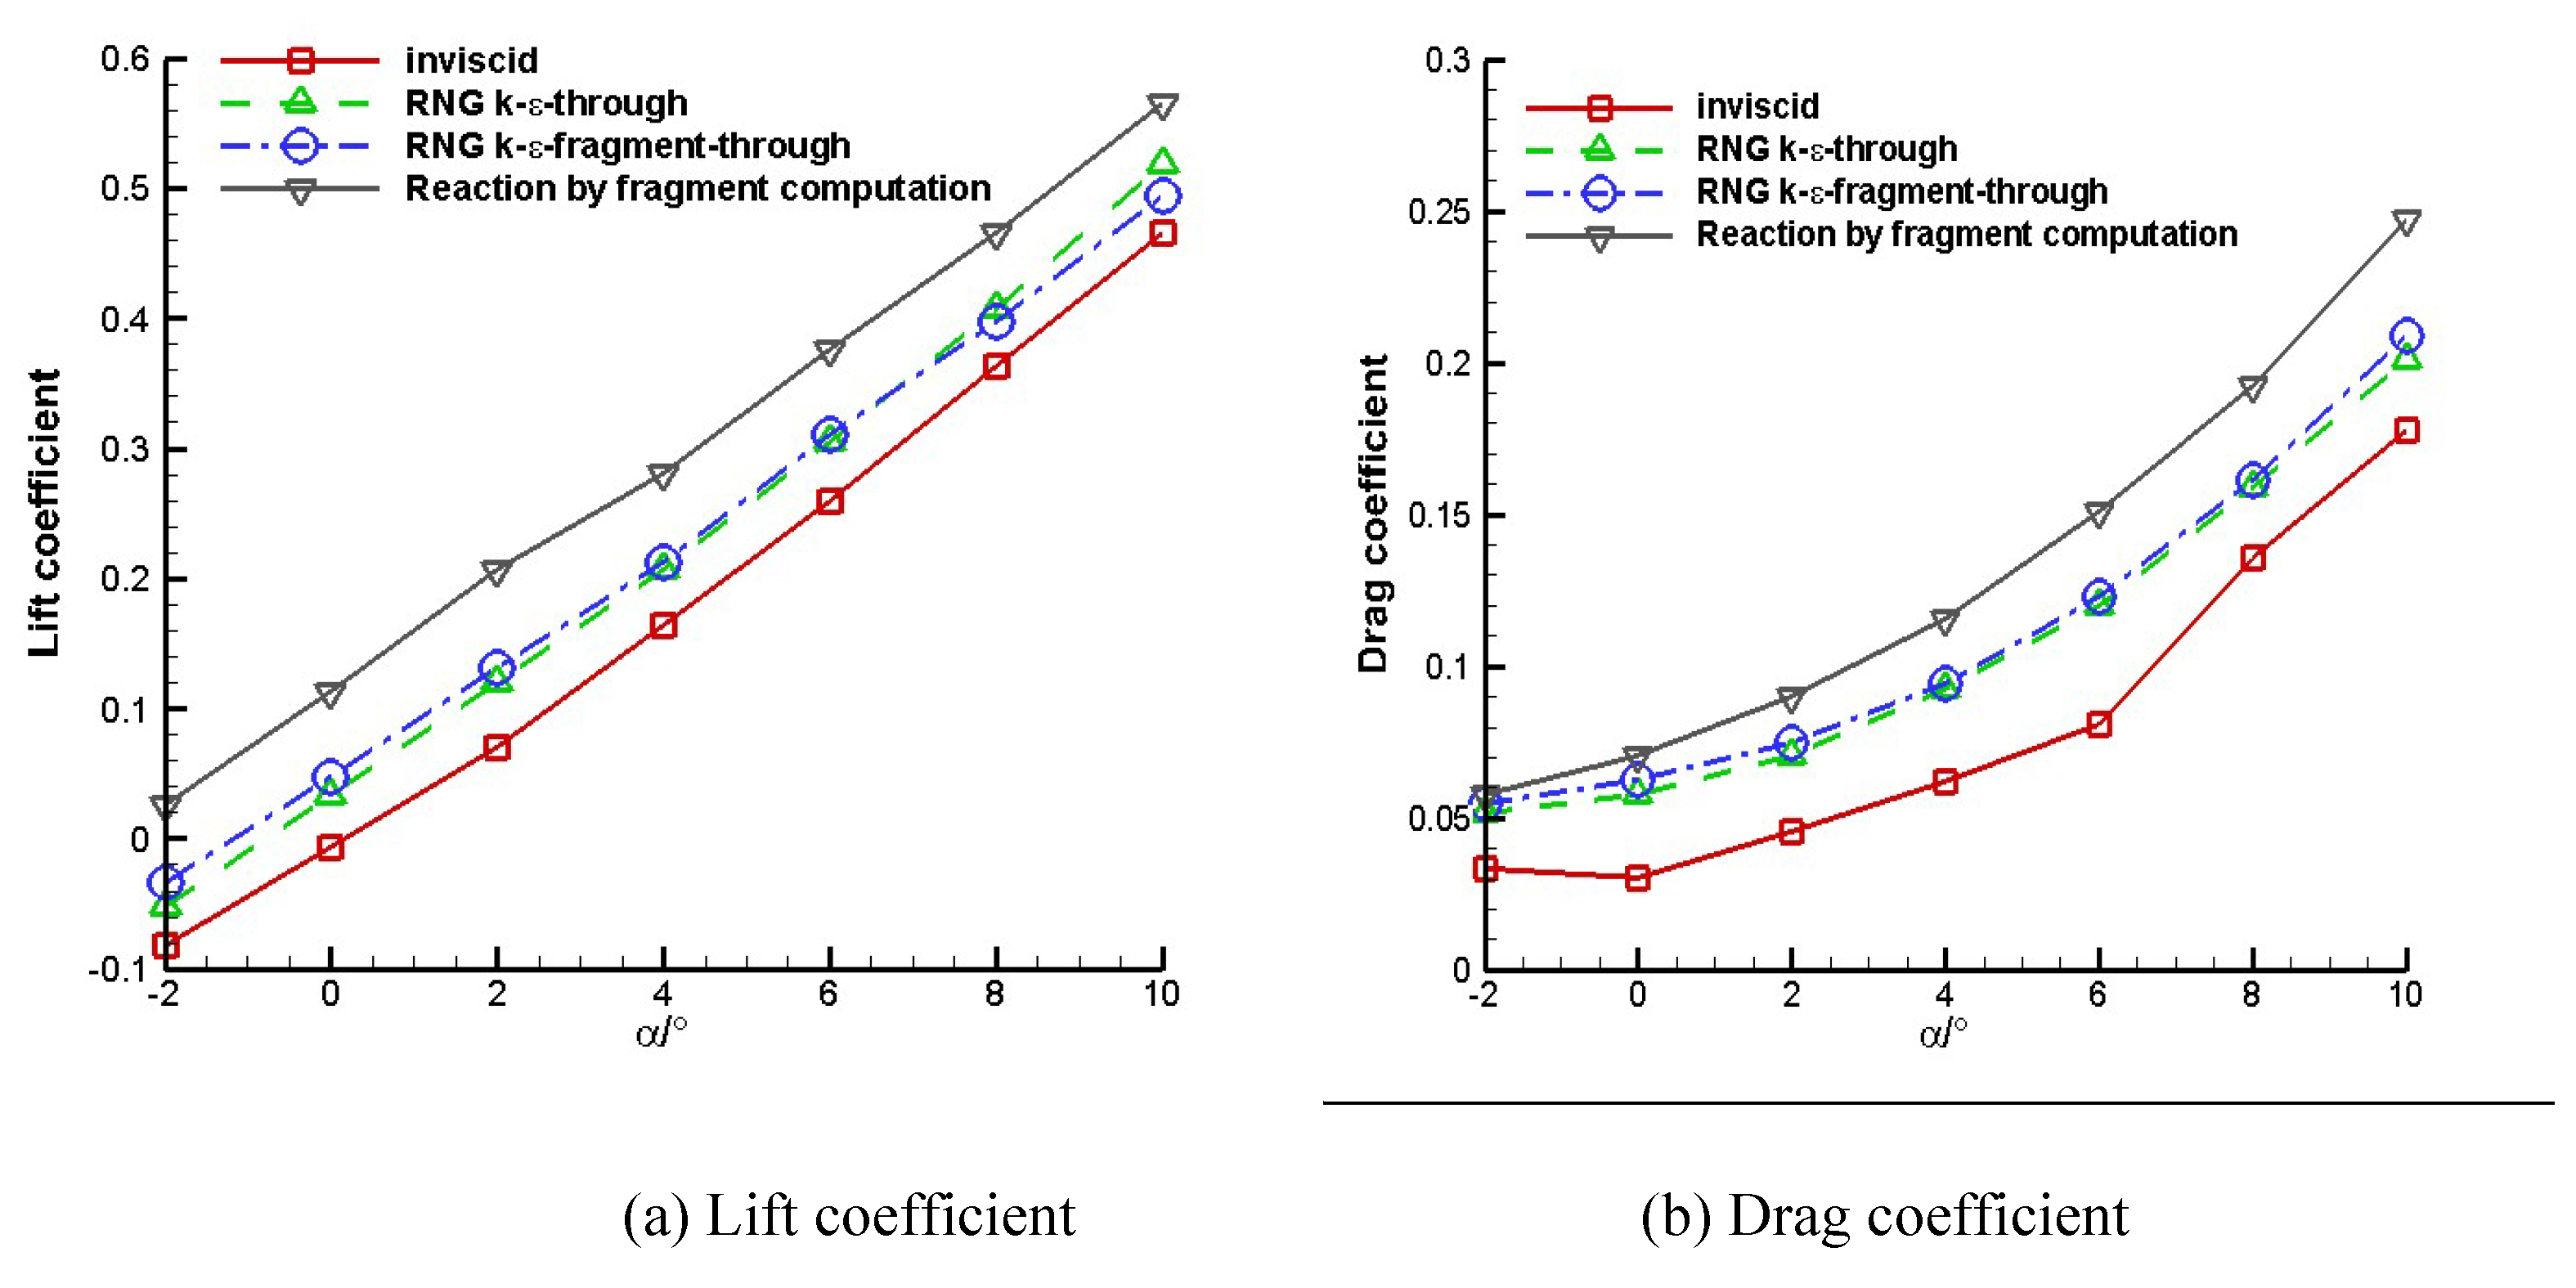
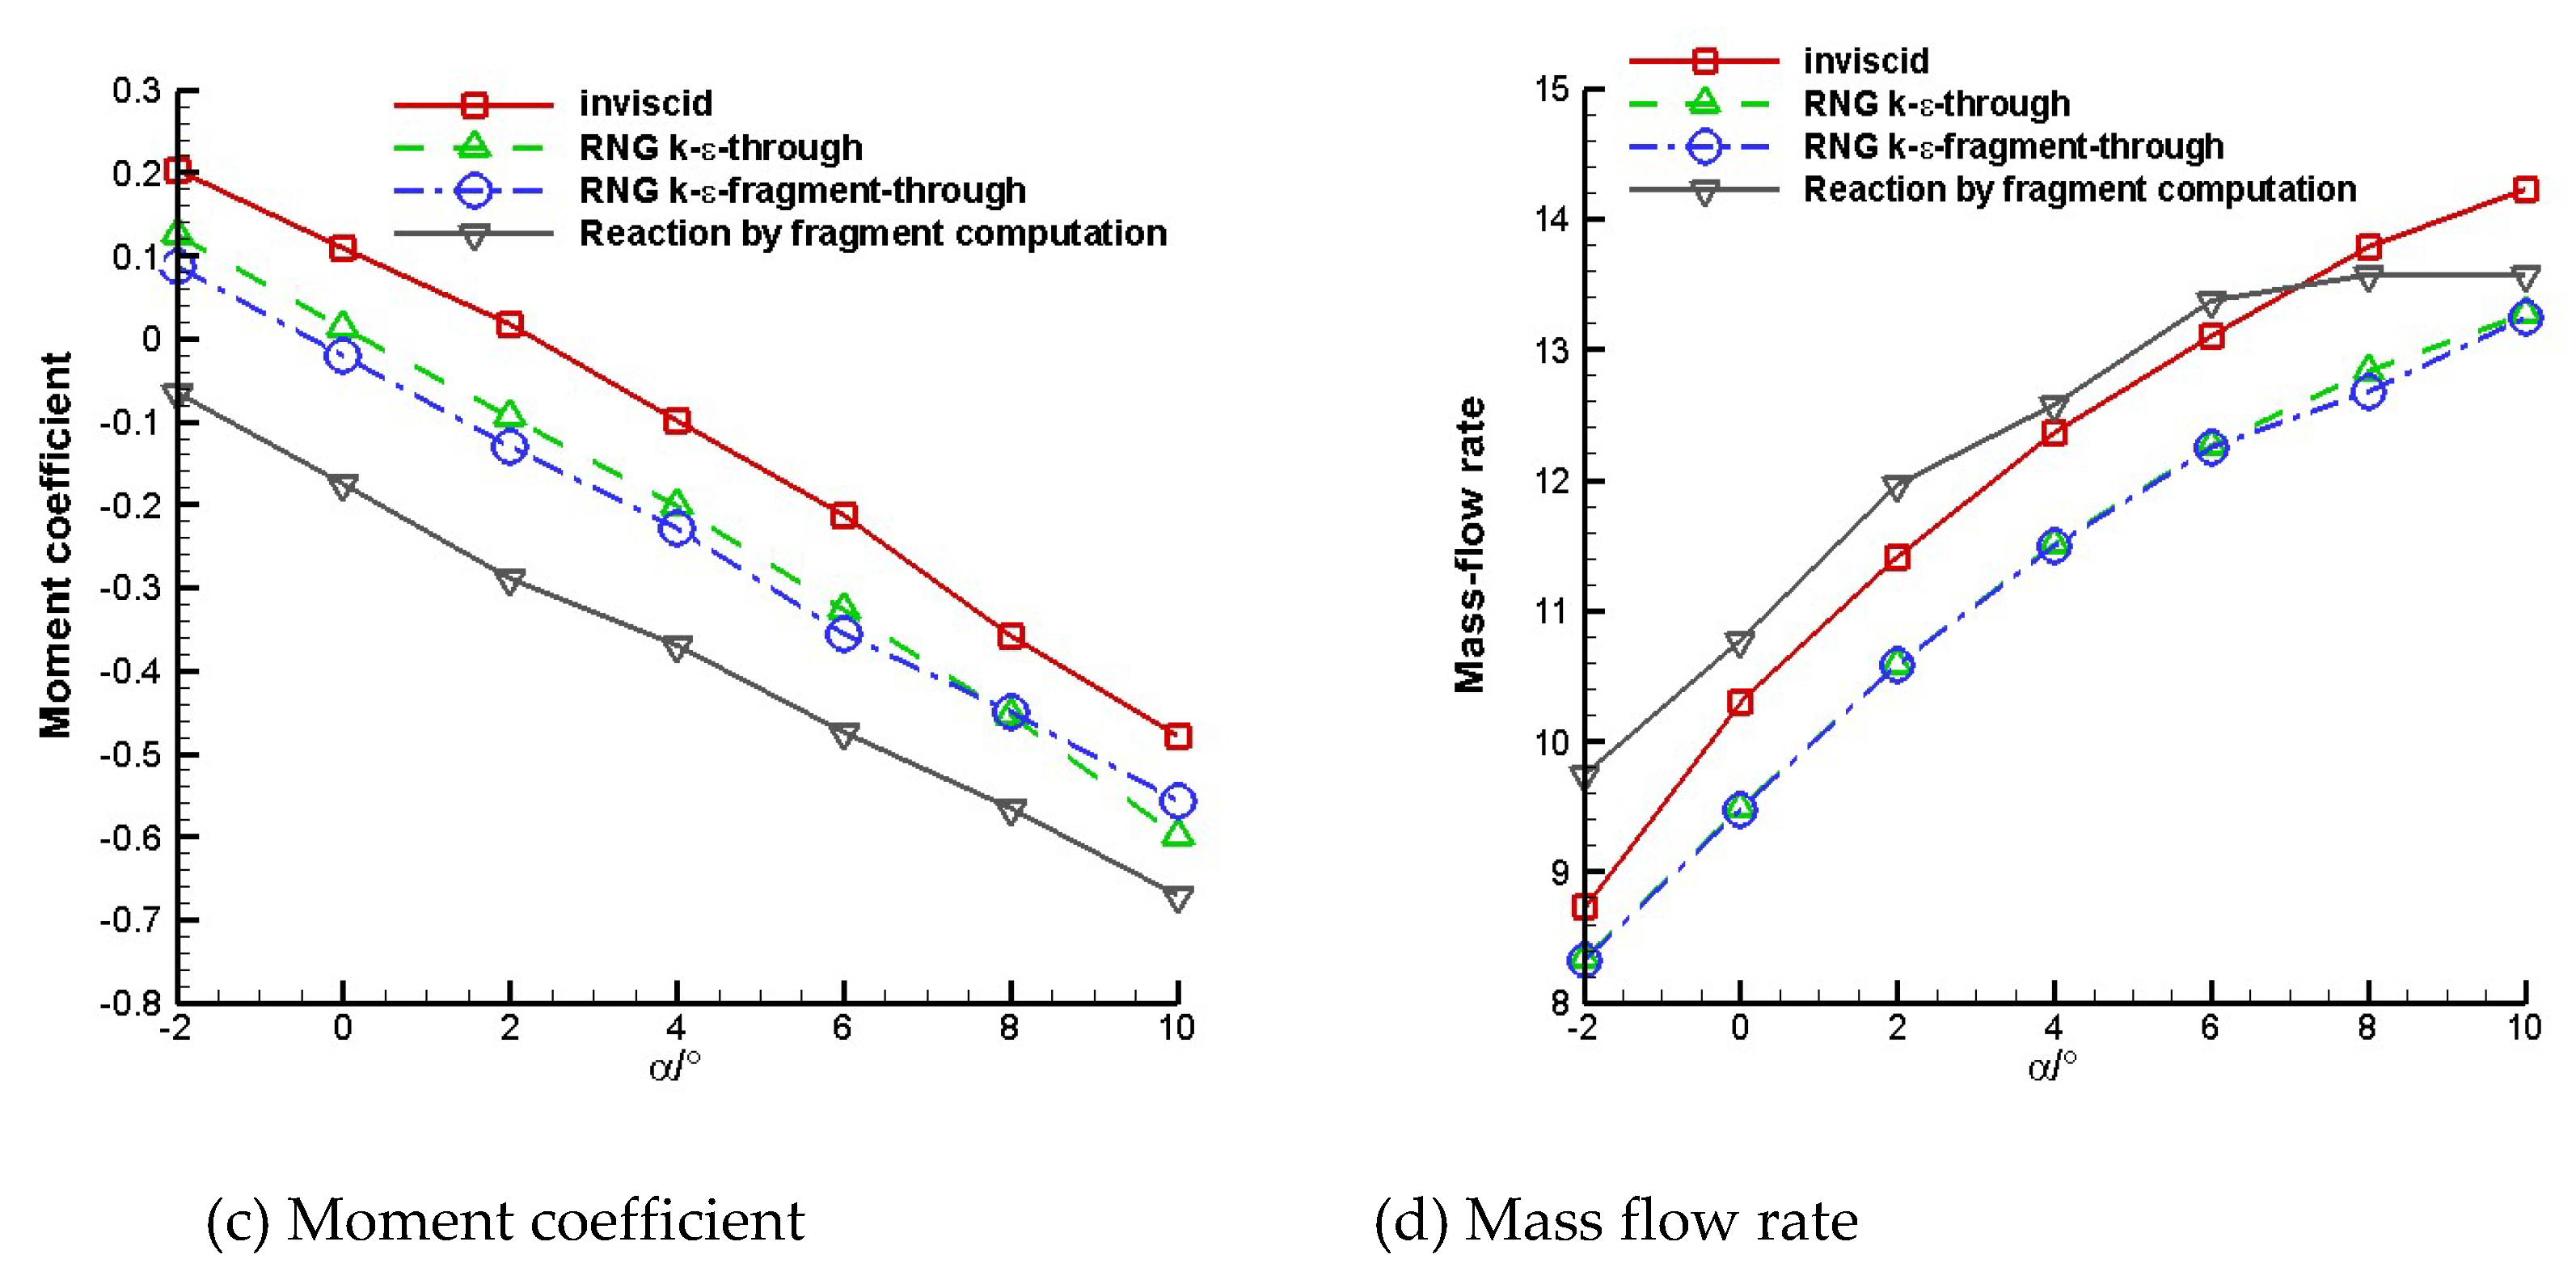
Figure 9(a)~
Figure 9(d) present the comparisons of lift coefficient, drag coefficient, pitching moment coefficient and mass flow rate at different computation method, respectively. It is observed that the lift and drag coefficient curves obtained by fragment computation shows reasonably good agreement with the integration computation data, so, the fragment method can be used to solve the flow field of high speed vehicle commendably. The maximum error of lift coefficient by fragment computation is about 3% compared with that by integration computation and drag coefficient error is about 5%.
Figure 9(c) shows that the moment coefficient has an obvious deviation but the maximum error is still less than 12%, which is reasonable for numerical simulation. By comparison, we can also find that viscosity has an important effect on aerodynamic characteristic of high speed vehicle, which makes the lift coefficient reduce about 20% and drag coefficient reduce 33%.
Figure 9(c) shows that pitching moment coefficient obtained with viscosity decreases 50% than inviscid result. Meanwhile, viscosity makes the mass flow rate reduce, see in
Figure 9(d), the reason is that viscosity increases the boundary layer thickness and diminishes the flow effective area.
C. Pressure distribution
1) Without reaction
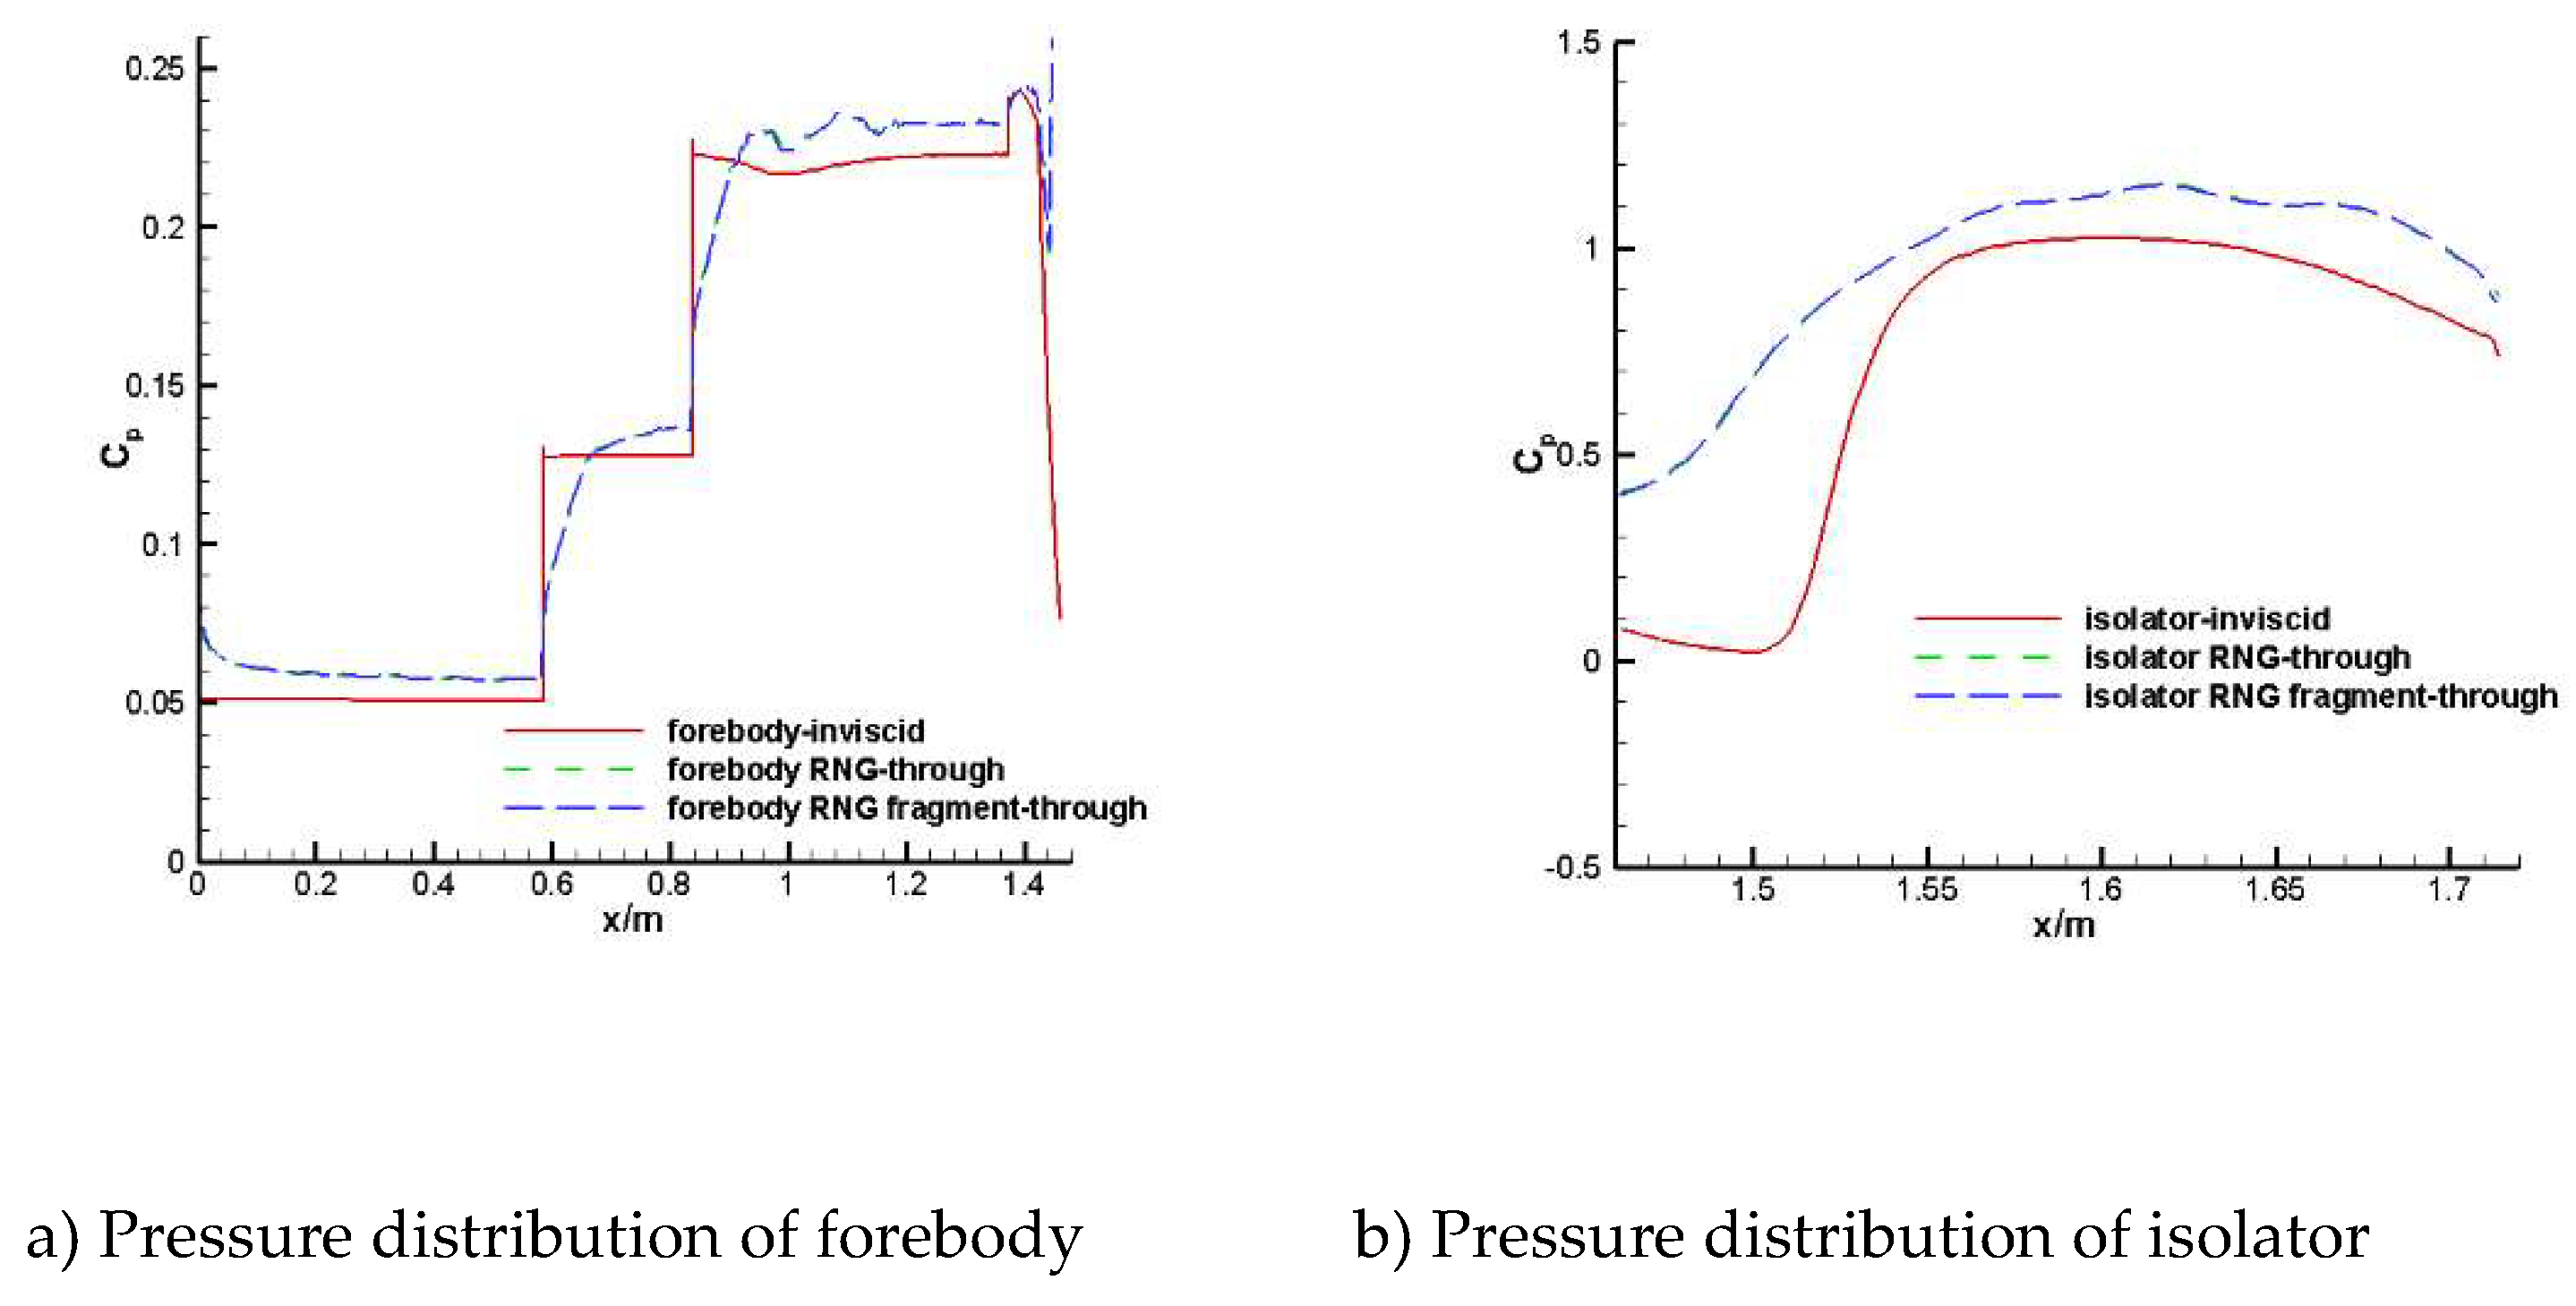
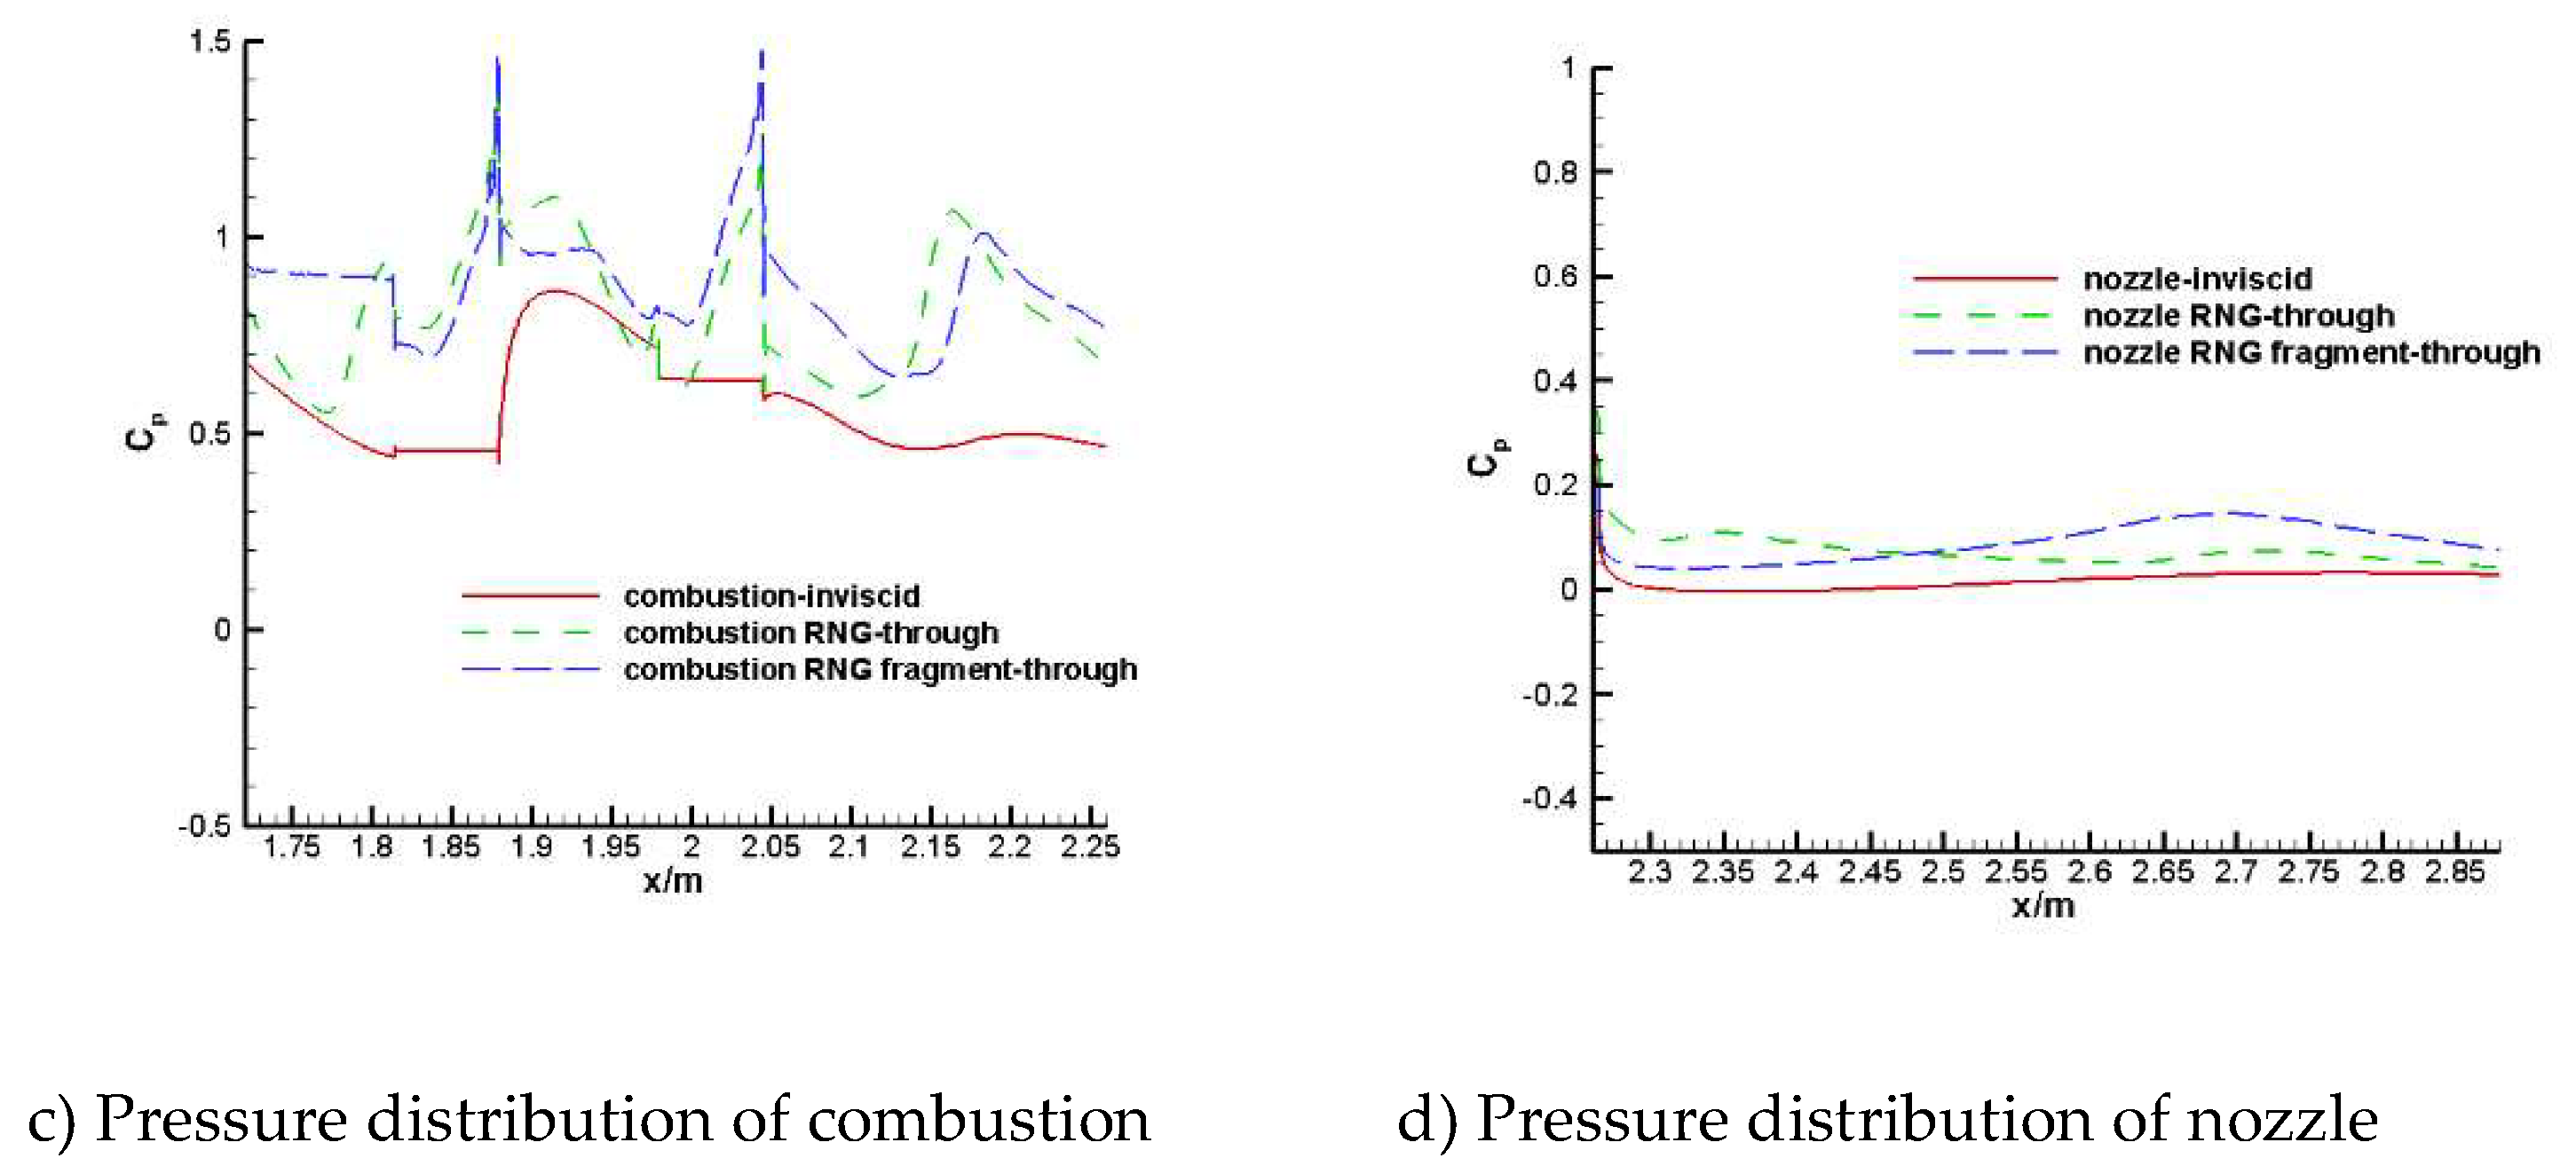
Figure 10 compares the pressure coefficient distribution of the upper surface of the aircraft from head to tail without considering combustion. It can be seen that the calculation results of inviscid and viscous are quite different. For the viscous results, the pressure distribution calculated by through is in good agreement with that calculated by fragment, and the main difference lies in the inlet of combustion chamber and the outlet of nozzle, which is mainly caused by the difference of inlet boundary conditions. From the lift-to-drag characteristics given in
Figure 9, the influence on the overall aerodynamic force is very small.
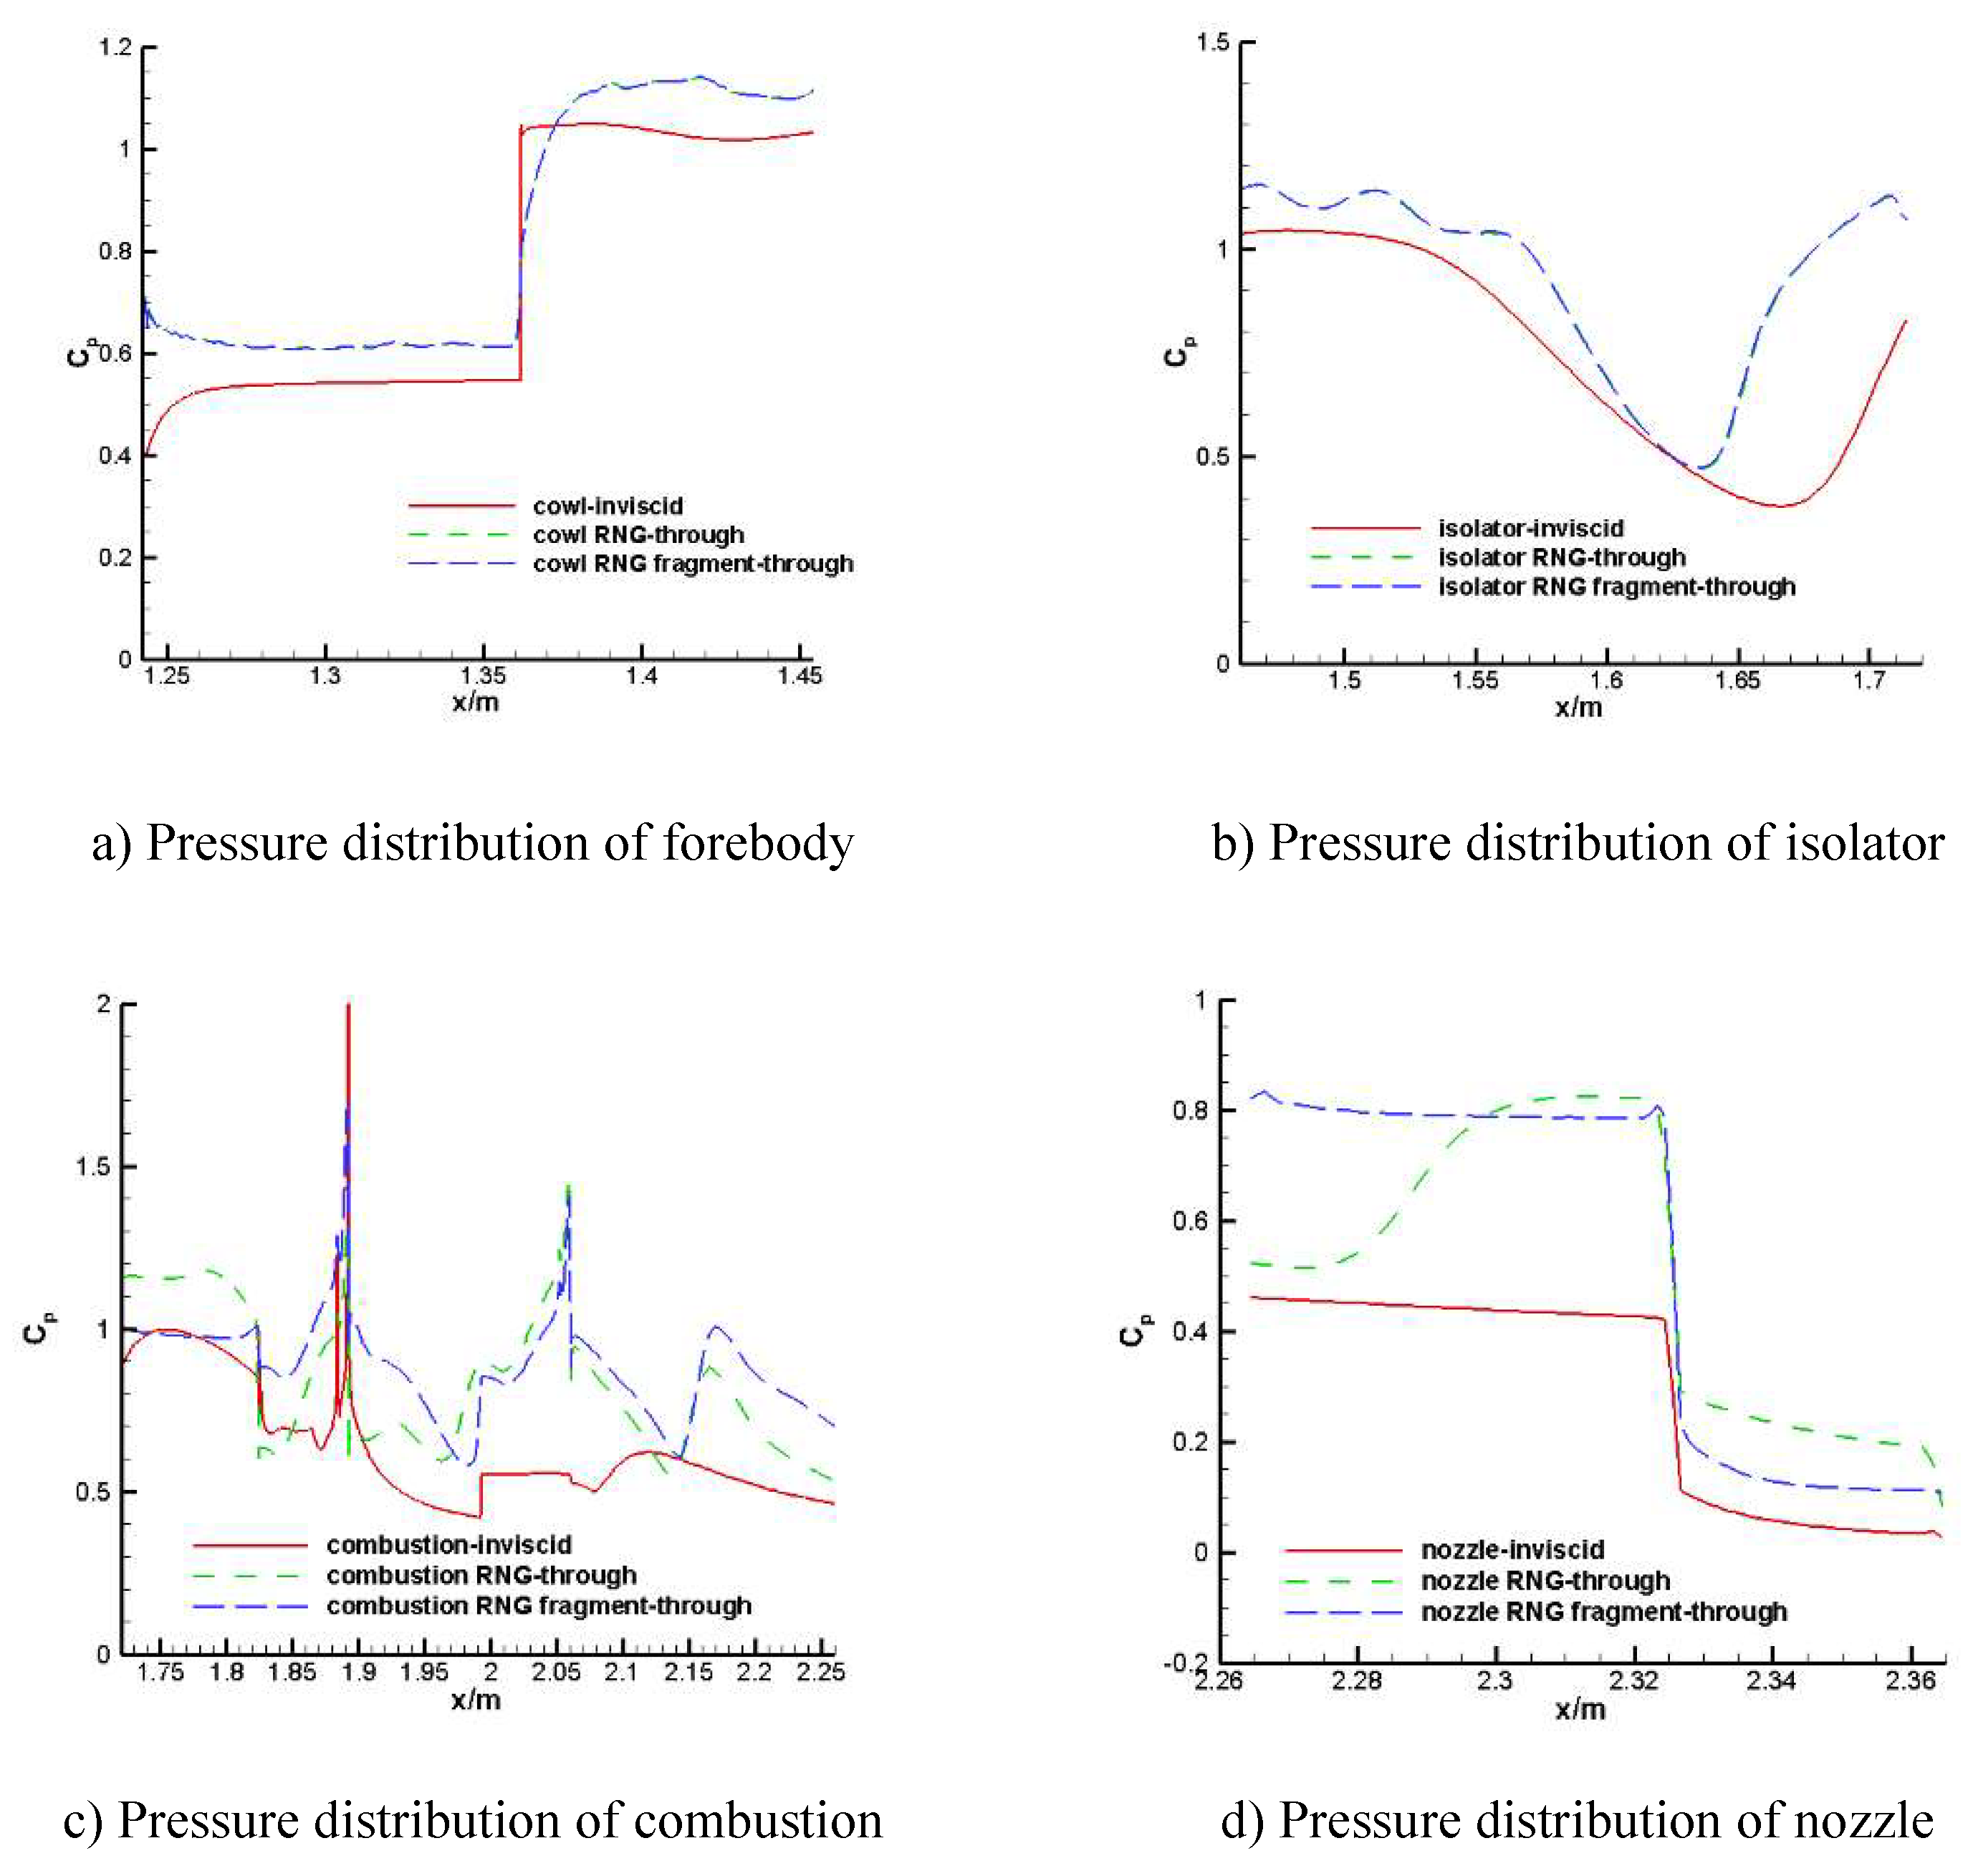
Figure 11 gives a comparison of the pressure coefficient distribution from head to tail on the down-wall of the aircraft without considering combustion conditions. Similar to the pressure distribution on the upper surface, the inviscid and viscous calculation results present obvious distinction. The difference of viscosity calculation results is mainly near the inlet of combustion chamber and the outlet of nozzle, which is mainly caused by the difference of inlet boundary conditions. As a whole, it has little influence on the aerodynamic force of the whole aircraft, which proves the feasibility of using fragment calculation to obtain the aerodynamic performance and flow field distribution of the aircraft without combustion.
2)With reaction
According to the aforemention results, as there is no combustion flow field in the inlet and isolation section, the pressure distribution is basically the same as that in
Figure 10 and
Figure 11, it is not listed separately here, only the calculation results of the combustion chamber and isolation section are given.
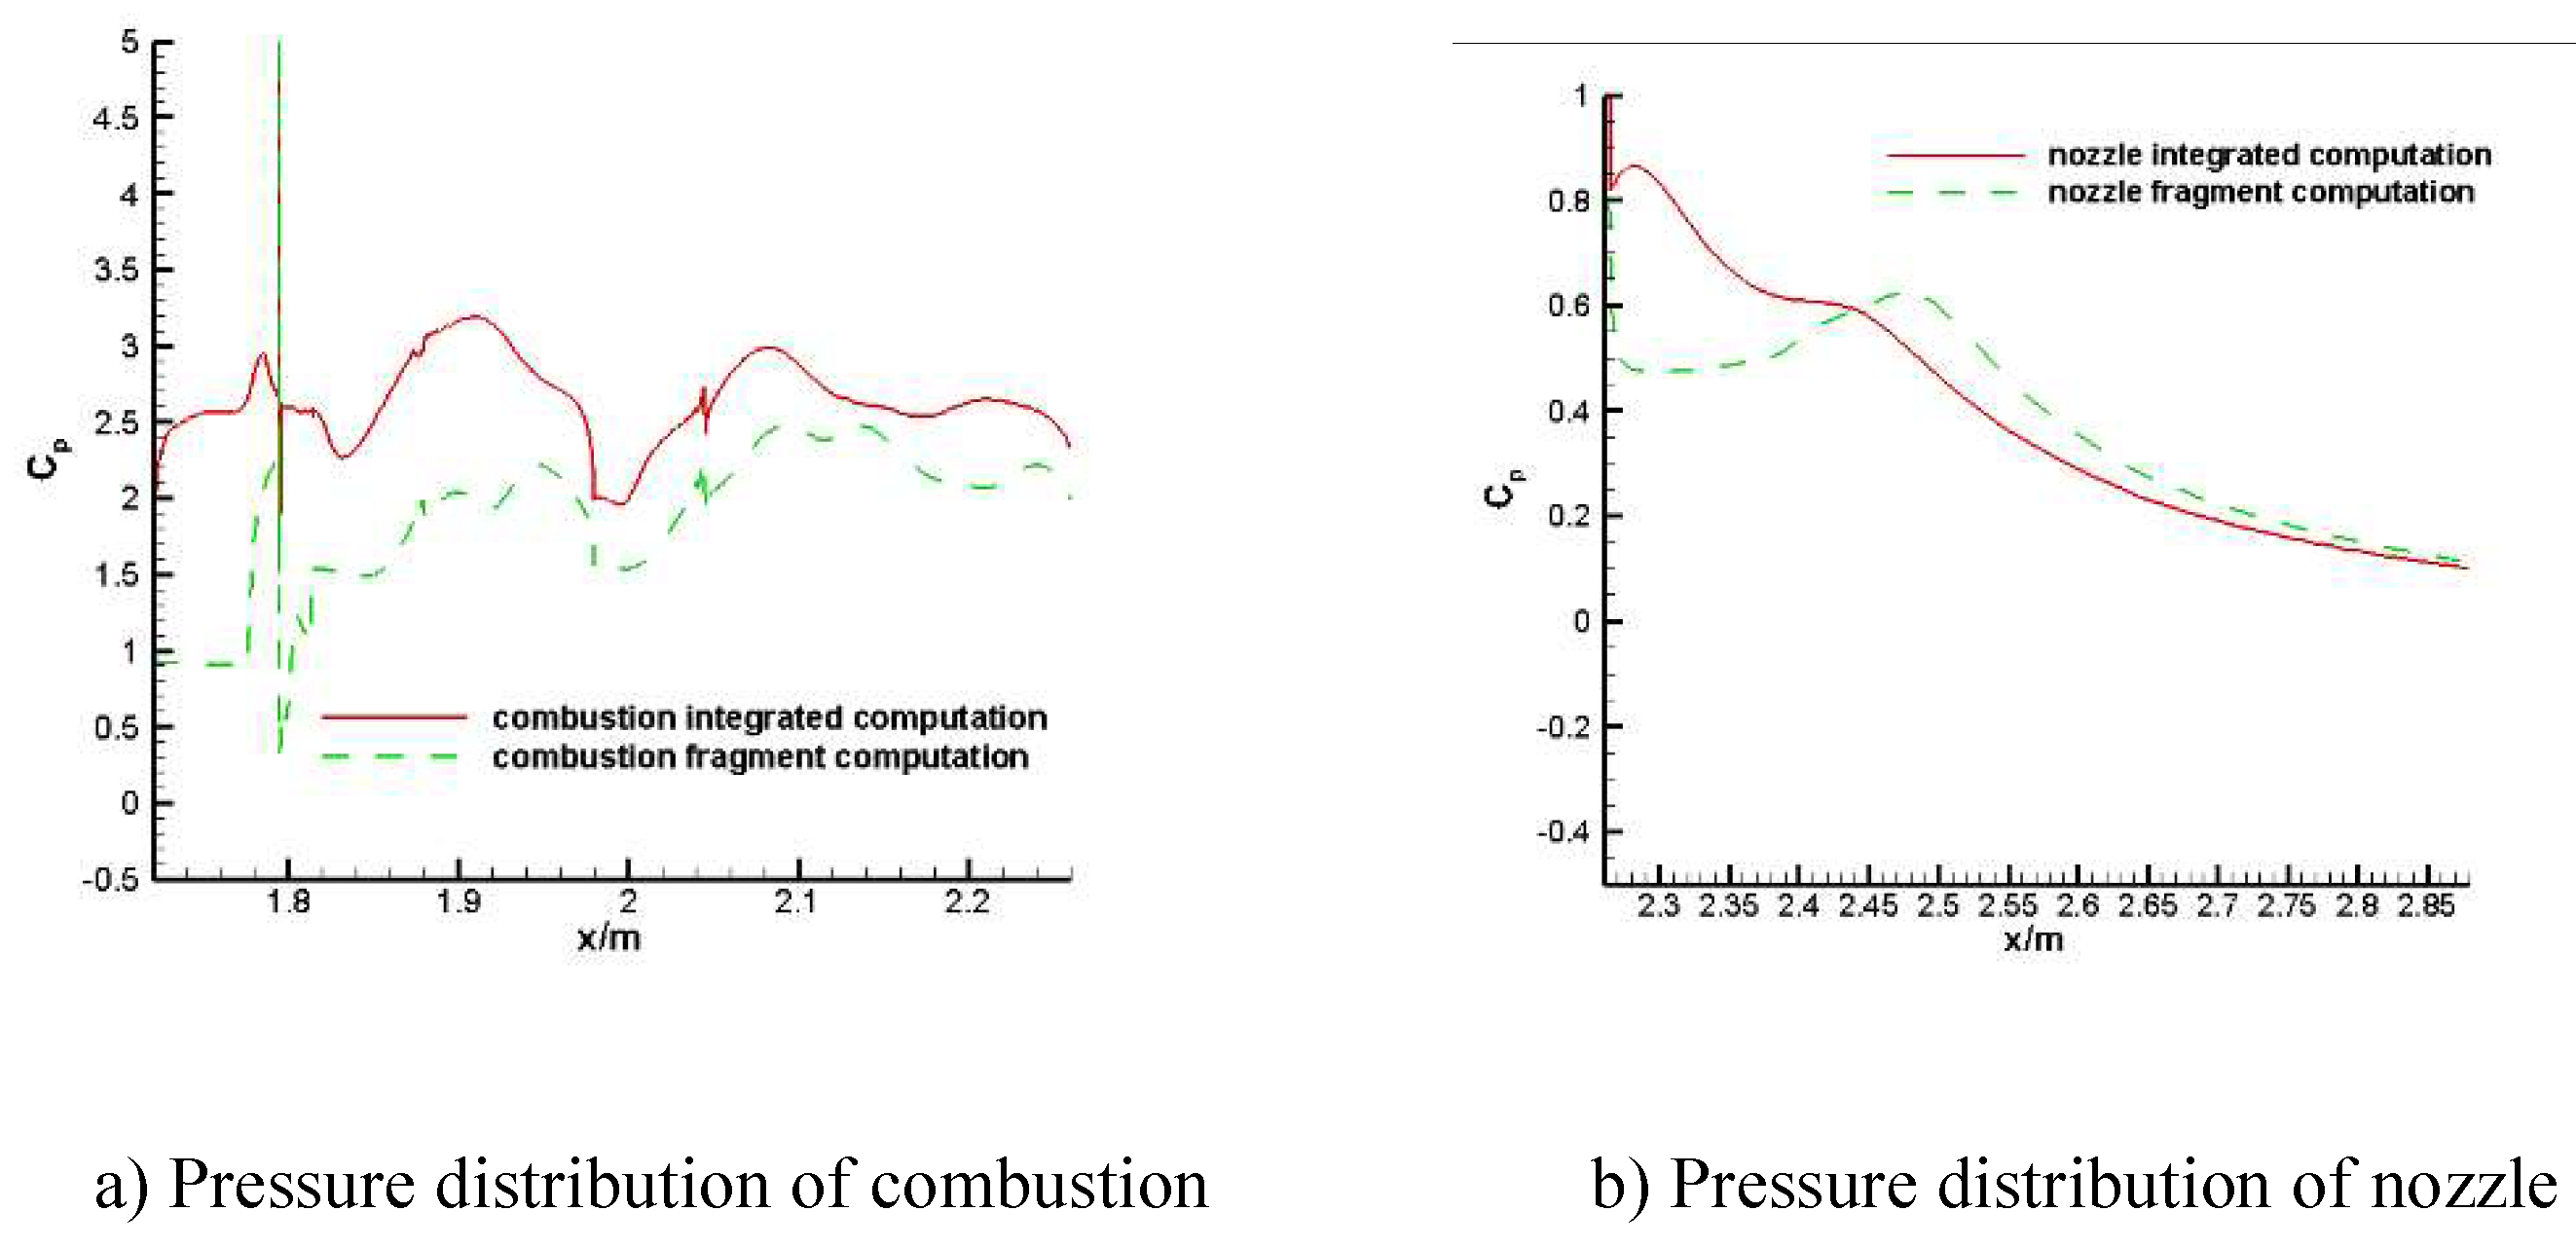
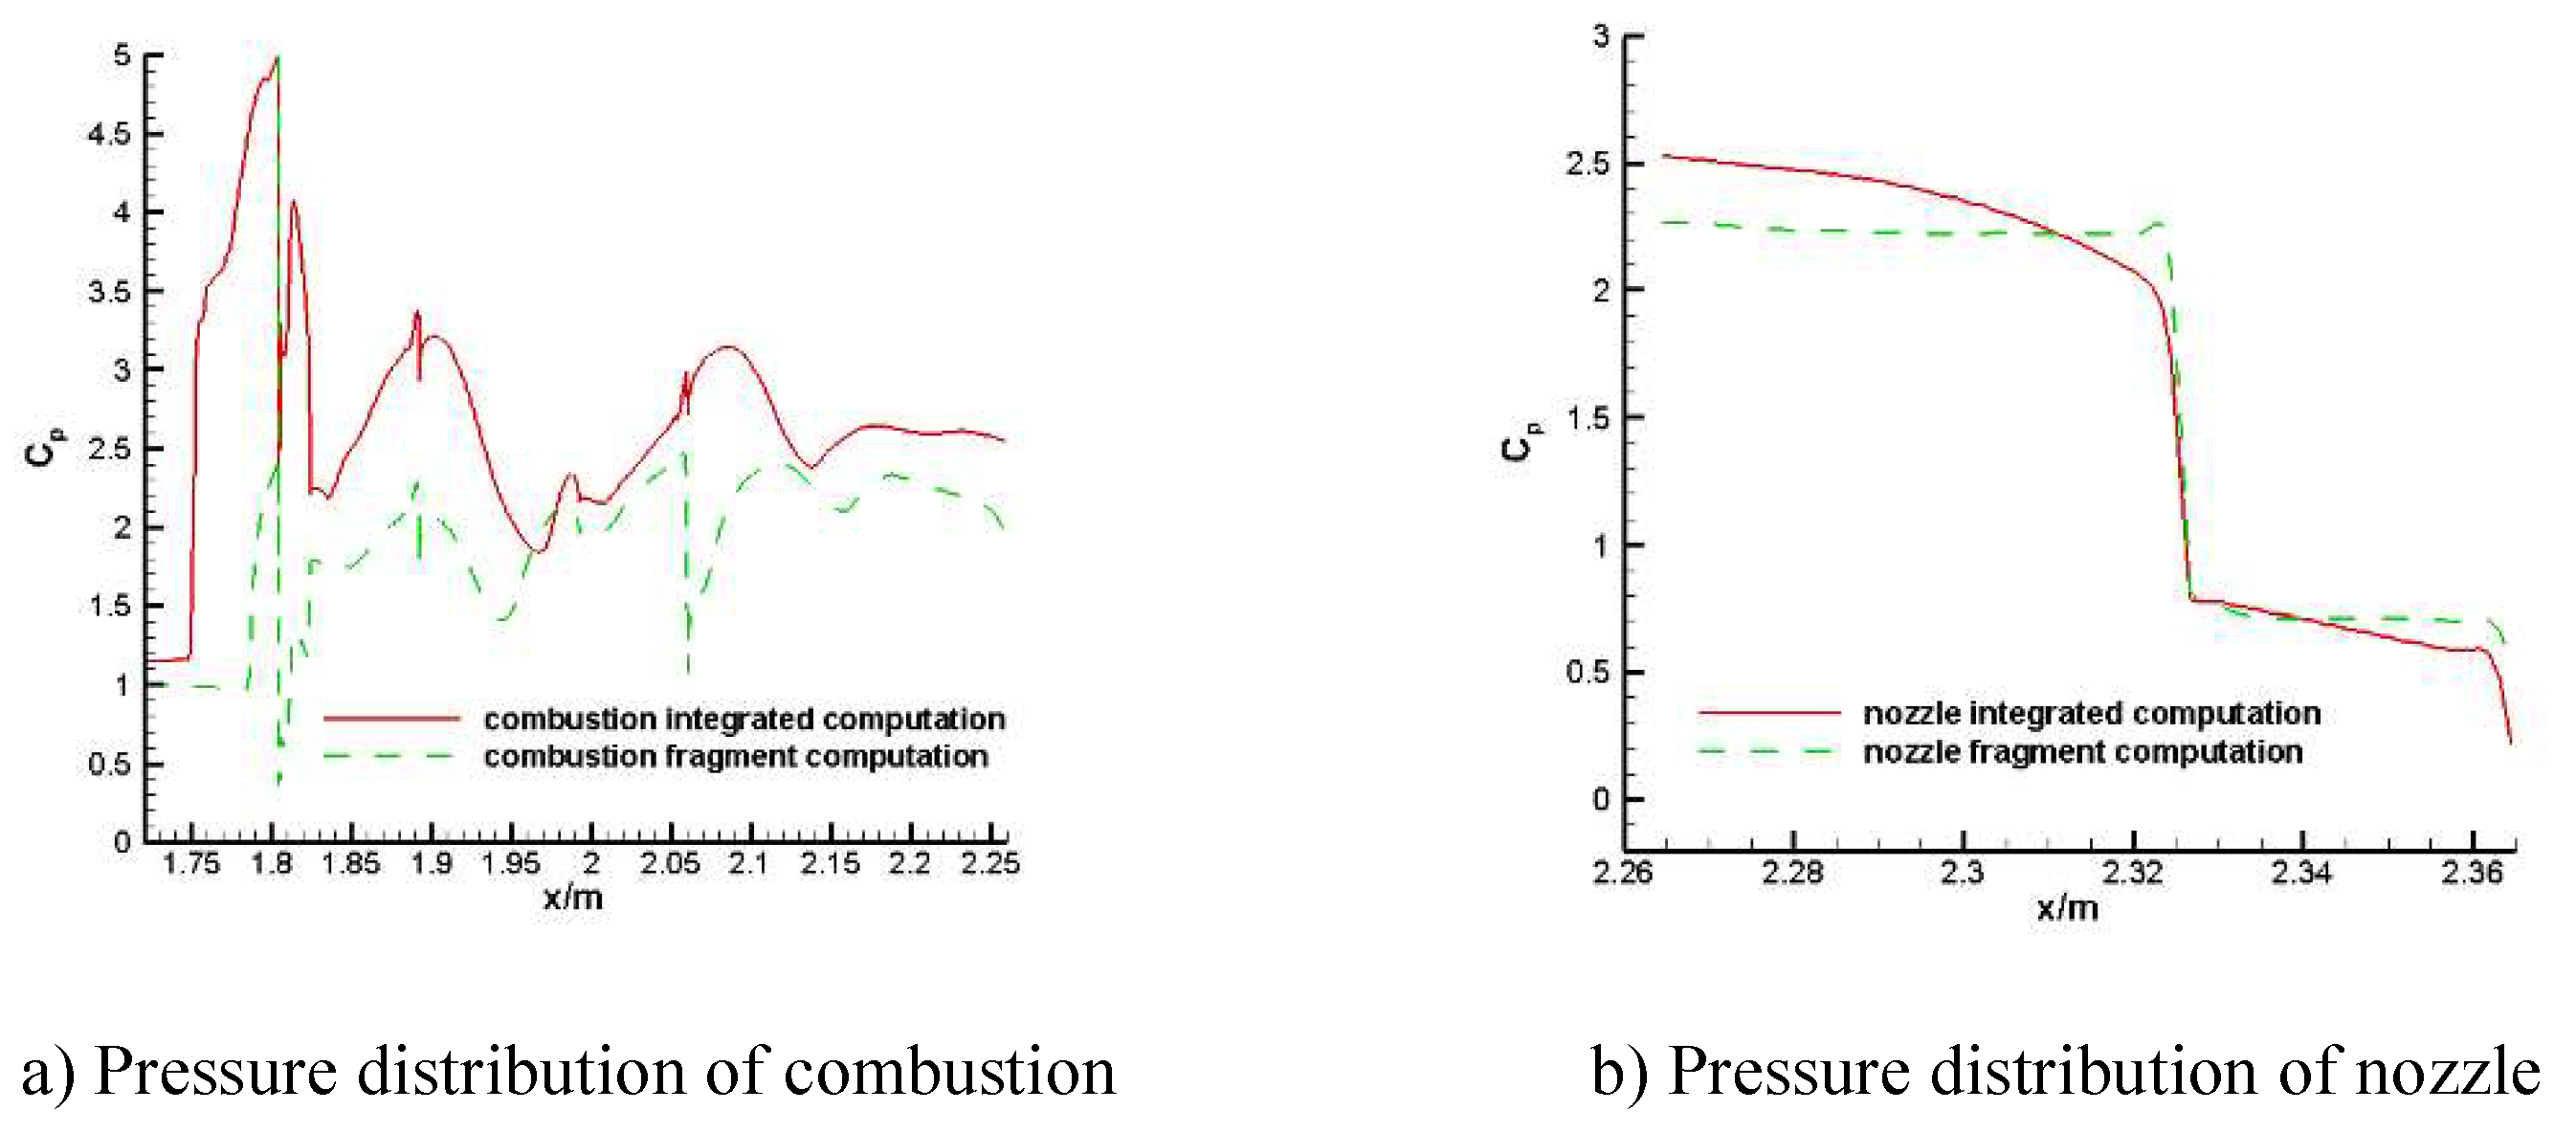
Figure 12 shows the pressure distribution on the upper surface of the combustion chamber and nozzle under combustion conditions. As shown in
Figure 12(a), the pressure difference at the inlet of the combustion chamber is relatively large, and the pressure value calculated by fragment is smaller than that calculated by through, which show a translation phenomenon as a whole, but the pressure distribution is similar. As shown in
Figure 12(b), the pressure difference at the inlet of nozzle is obvious, but the results by the two methods tend to be consistent with the distance becoming larger. Generally speaking, the pressure distribution obtained by fragment calculation is in good agreement with the results by through calculation.
Figure 13 shows the pressure distribution on the lower surface of the combustion chamber and nozzle under combustion conditions. The calculated results are similar to those of the upper surface. There is a big difference in the combustion chamber, and it presents a translation phenomenon as the whole, which may be related to the uniform boundary conditions given by the inlet. There is little difference in the nozzle, but there is a certain pressure deviation at the nozzle inlet. According to the comparison, the fragment calculation can reflect a certain law of engine internal flow.
D. Flow Field Analysis
a).Flowfield without reaction
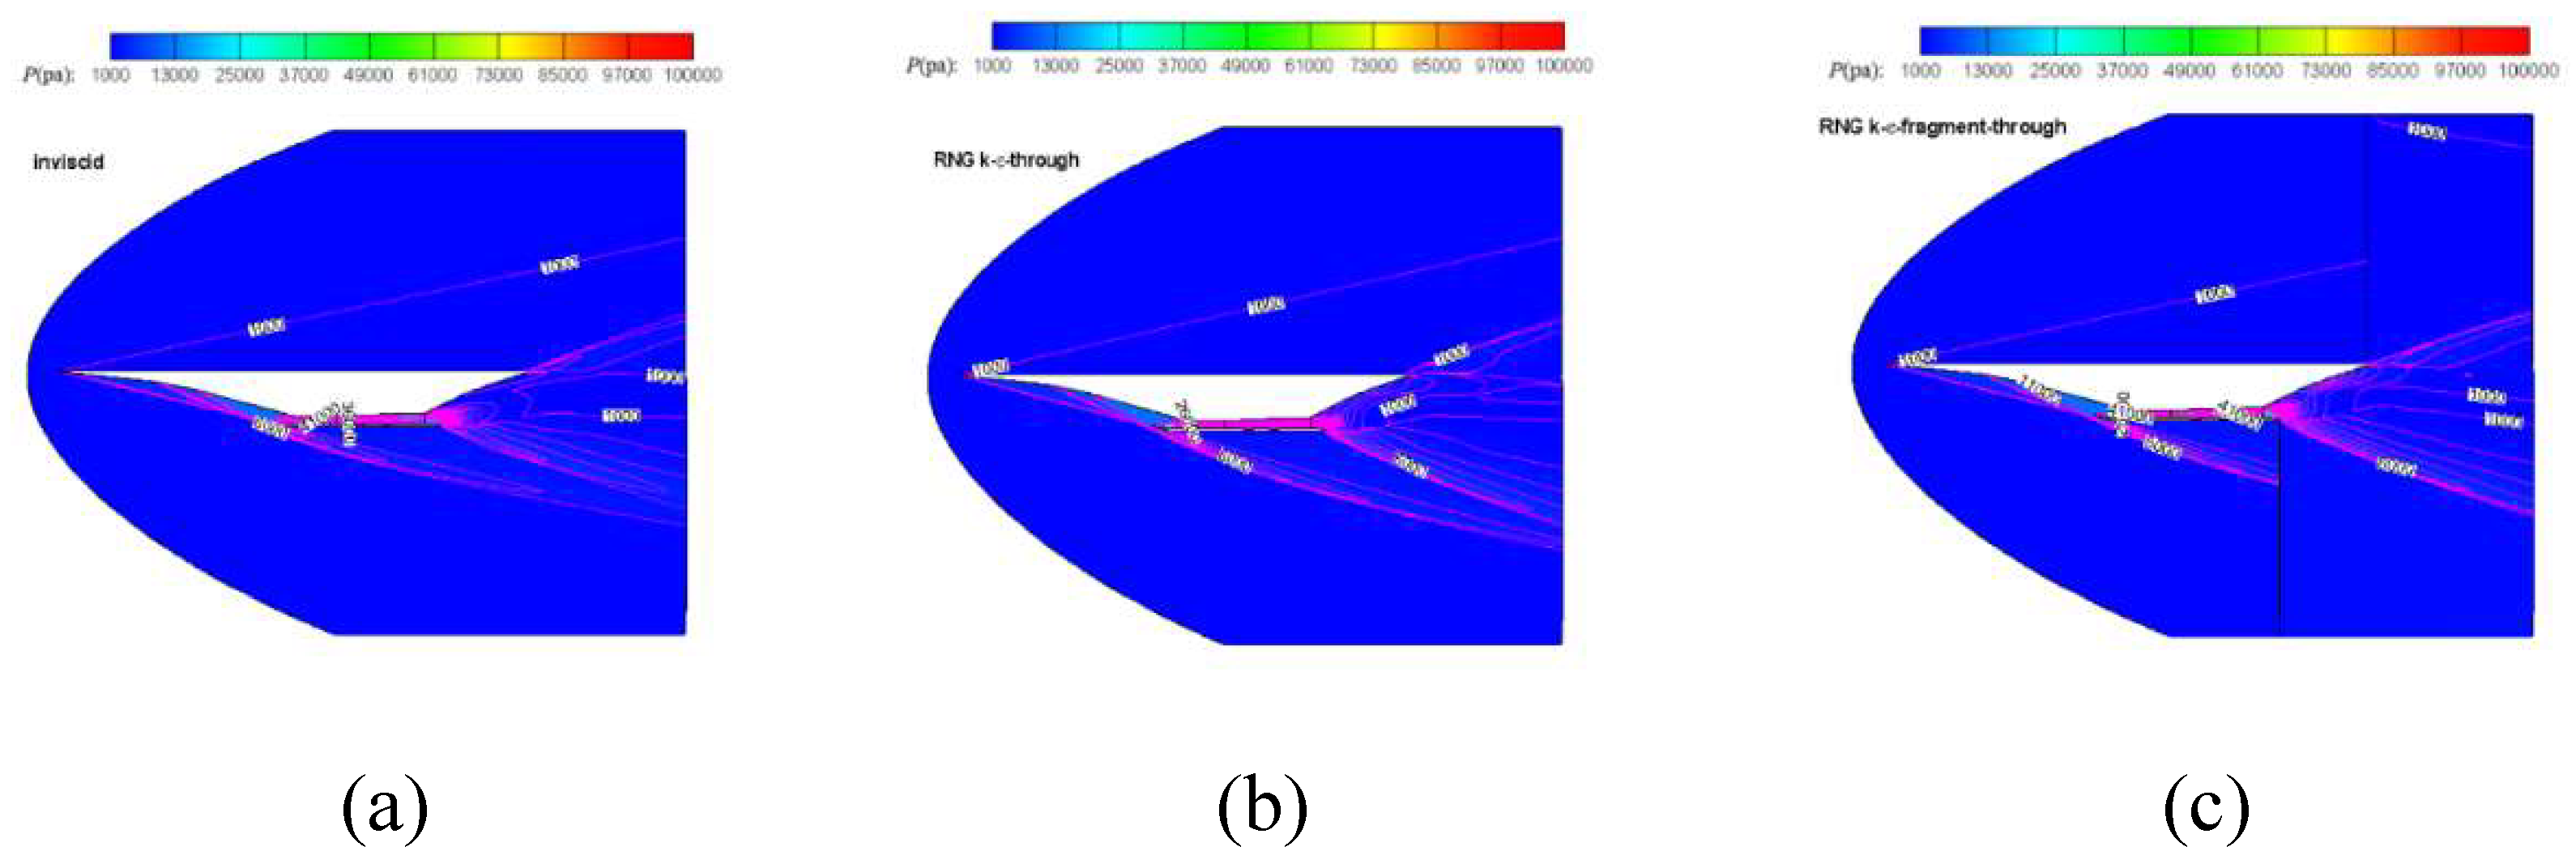
Figure 14 gives the pressure contour of inviscid, RNG k-
through and RNG k-
fragment through when the angle of attack is 4 degrees, respectively. The flow field show similarity in profile. The Mach contour is displayed in
Figure 15, which shows that the Mach distribution is similar at the section of inlet and a little different at the nozzle. The detail difference will be further analyzed in the following section.
The inlet/isolator pressure contour is exhibited in
Figure 16.
Figure 16(a) shows that the oblique shock waves cluster at the lip of cowl. However,
Figure 16(b) and
Figure 16(c) shows the clustered oblique shock waves have a deflection from the lip, because the inlet is designed based on inviscid flow. when the flow field is solved by viscous method, the existence of boundary layer pushes the shock wave shift a little angle, then the clustered shock would not nestle at the lip of cowl at design condition. As shown in
Figure 16(b) and
Figure 16(c), the flow field calculated by integration and by fragment is displayed in detail and it presents little difference between two computation method. Therefore, we can conclude that inlet/isolator can be solved separately and obtains corresponding aerodynamic performance.
For combustion chamber, the inlet boundary condition is endowed by the outlet condition of isolator in fragment method. While the inlet/isolator is solved completely, the average static pressure, average total pressure and average total temperature are extracted and exerted on the inlet boundary with pressure-in type. As shown in
Figure 17, in the vicinity of inlet of combustor, the pressure contour presents a little difference, with the flow field extrapolating, the pressure distribution becomes similar.
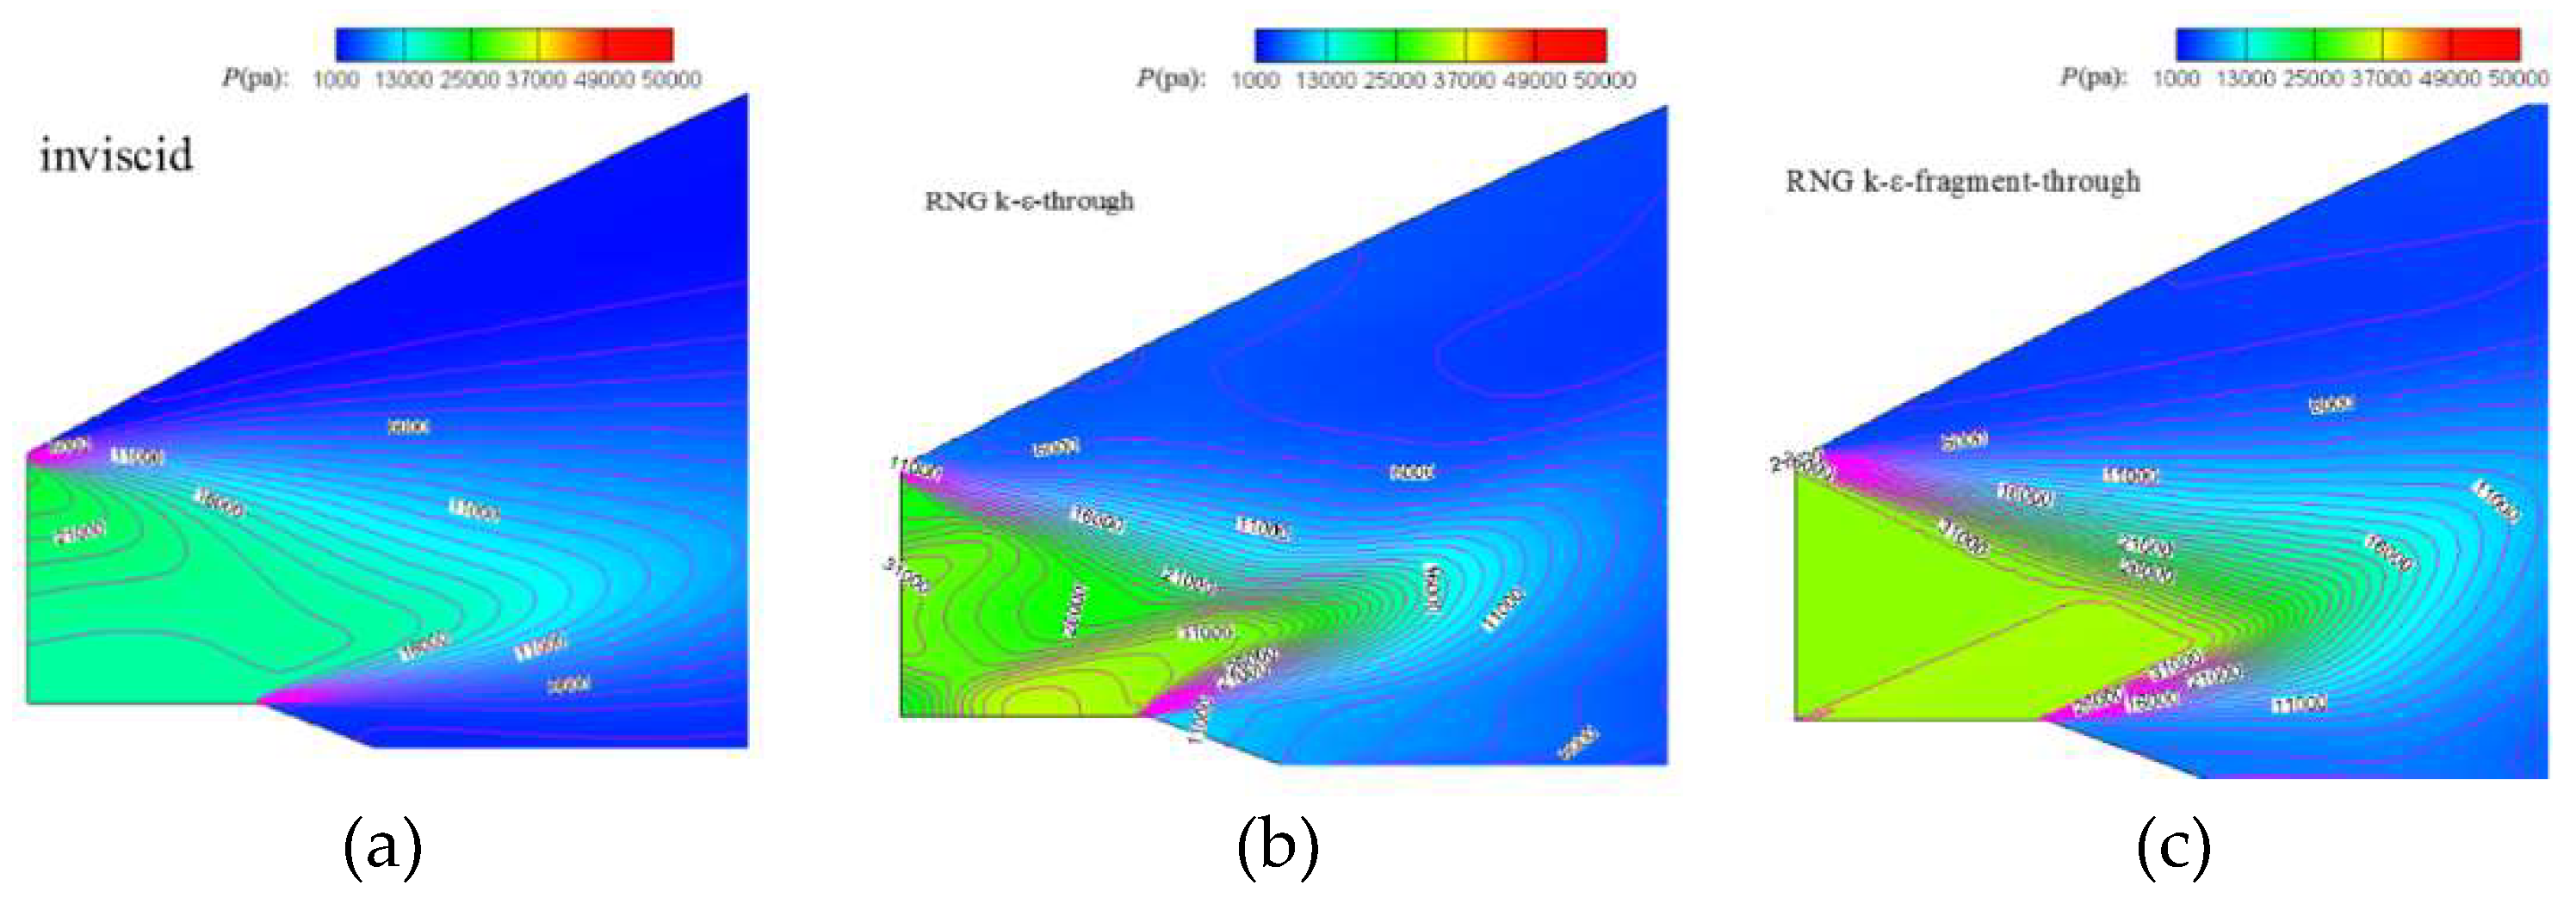
Figure 18 demonstrates the pressure contour of nozzle section at different computation method. The flow field appears glossy due to inviscid solution, see in
Figure 18(a). Though the inlet boundary is different in the nozzle, the outlines show high resemblance, especially in the region away from inlet, which can be seen in
Figure 18(b) and
Figure 18(c).
Figure 18(b) stems from integration computation with RNG k-
turbulent model, its flow filed is continuous from inlet/isolator to nozzle.
Figure 18(c) is from fragment computation with RNG k-
turbulent model, its inlet boundary is endowed by the outlet boundary of combustion chamber with average static pressure, average total pressure and average total temperature. The main distinction behaves in the entrance region, the pressure is uniform along vertical direction in the inlet boundary. Flow developing gradually abates the discrepancy and flow field tends to become coincident.
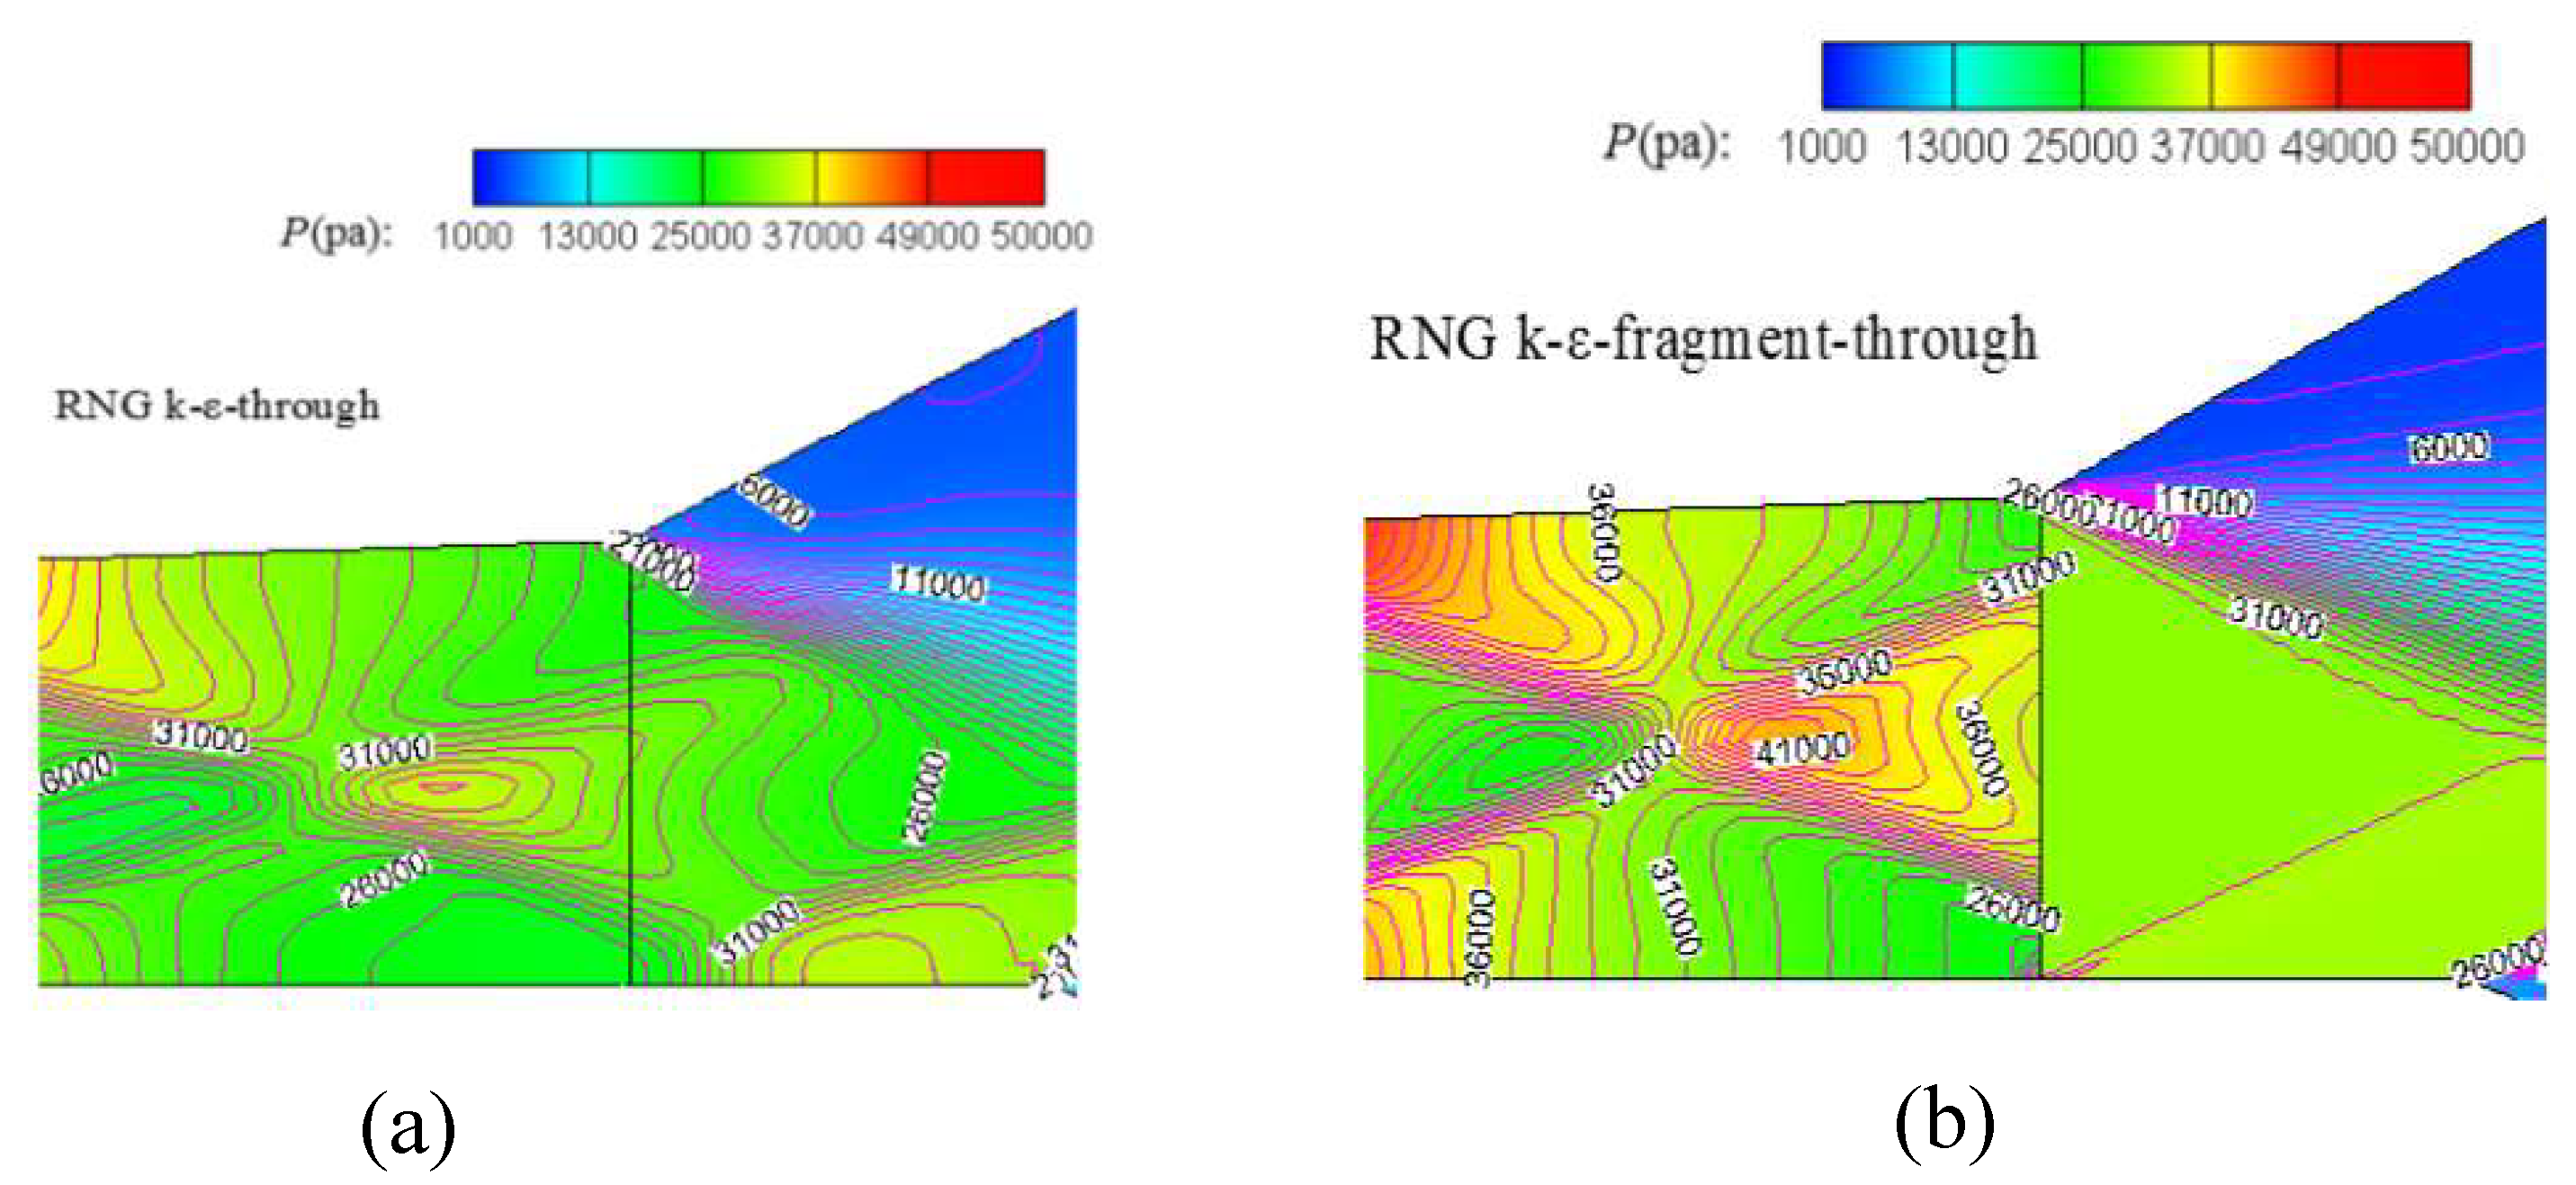
As is shown in
Figure 19, the detail description at the interface between isolator and combustion chamber is displayed, because of the boundary condition effect by fragment computation, the flow presents obvious discontinuity at the interface. However, by comparing the section aerodynamic, the discontinuity will bring in subtle error. Additionally, owing to the small fractional contribution to lift coefficient and drag coefficient by combustor, consequently, the effect on the aerodynamic of whole vehicle by the discontinuity commonly can be ignored in the preliminary design.
Figure 20 illustrates the pressure contour comparison at the interface of combustor and nozzle. In
Figure 20(a), the pressure distribution is continuous and uninterrupted, while the pressure shows discontinuity in
Figure 20(b). It is easily understood that the inlet of nozzle is given by uniform pressure boundary in fragment computation that results in the pressure discrepancy. In spite of the obvious existence of pressure difference, once the flow departs from the inlet of nozzle in fragment computation, the pressure distribution gradually approaches result by integration computation under the action of viscosity, especially in the upper face of nozzle. As a result, the aerodynamic force obtained by fragment computation is nearly equivalent to that by integration computation, which can be verified in
Figure 9.
From above discussion, we can conclude that the fragment computation method used in high speed vehicle is reasonable and has conspicuous advantage in computation efficiency compared with integration computation.
b) Flowfield with reaction
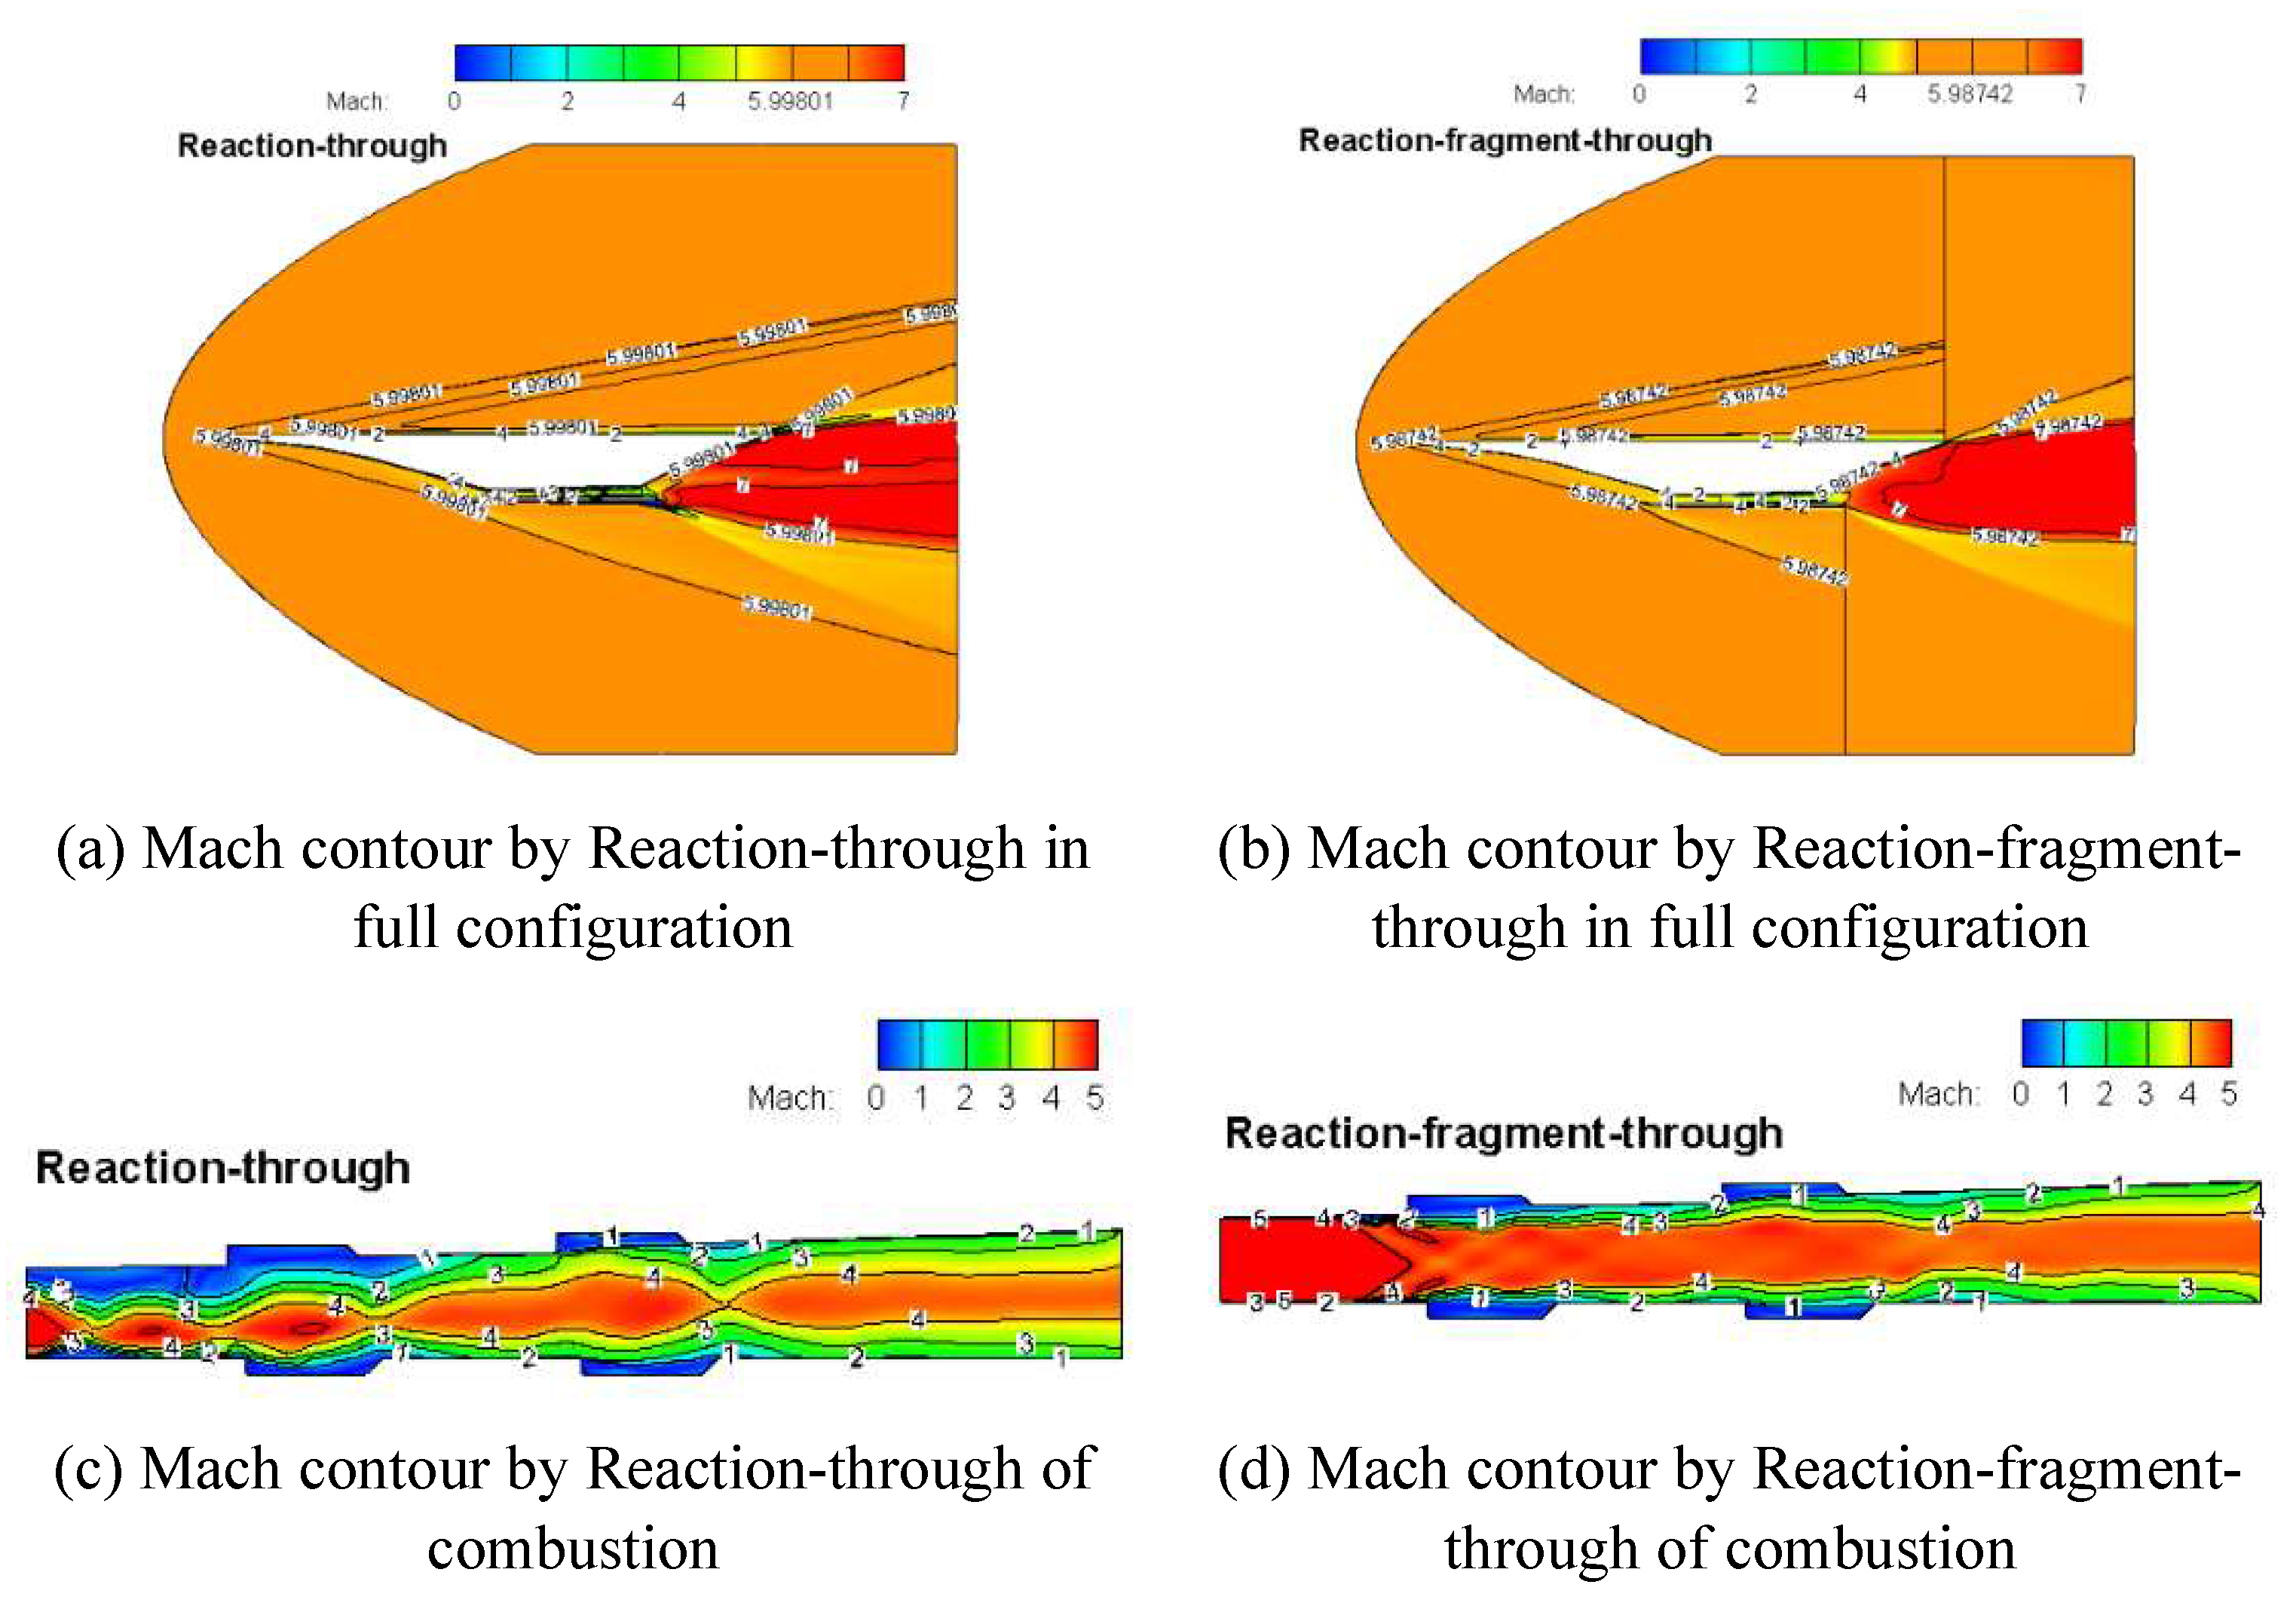
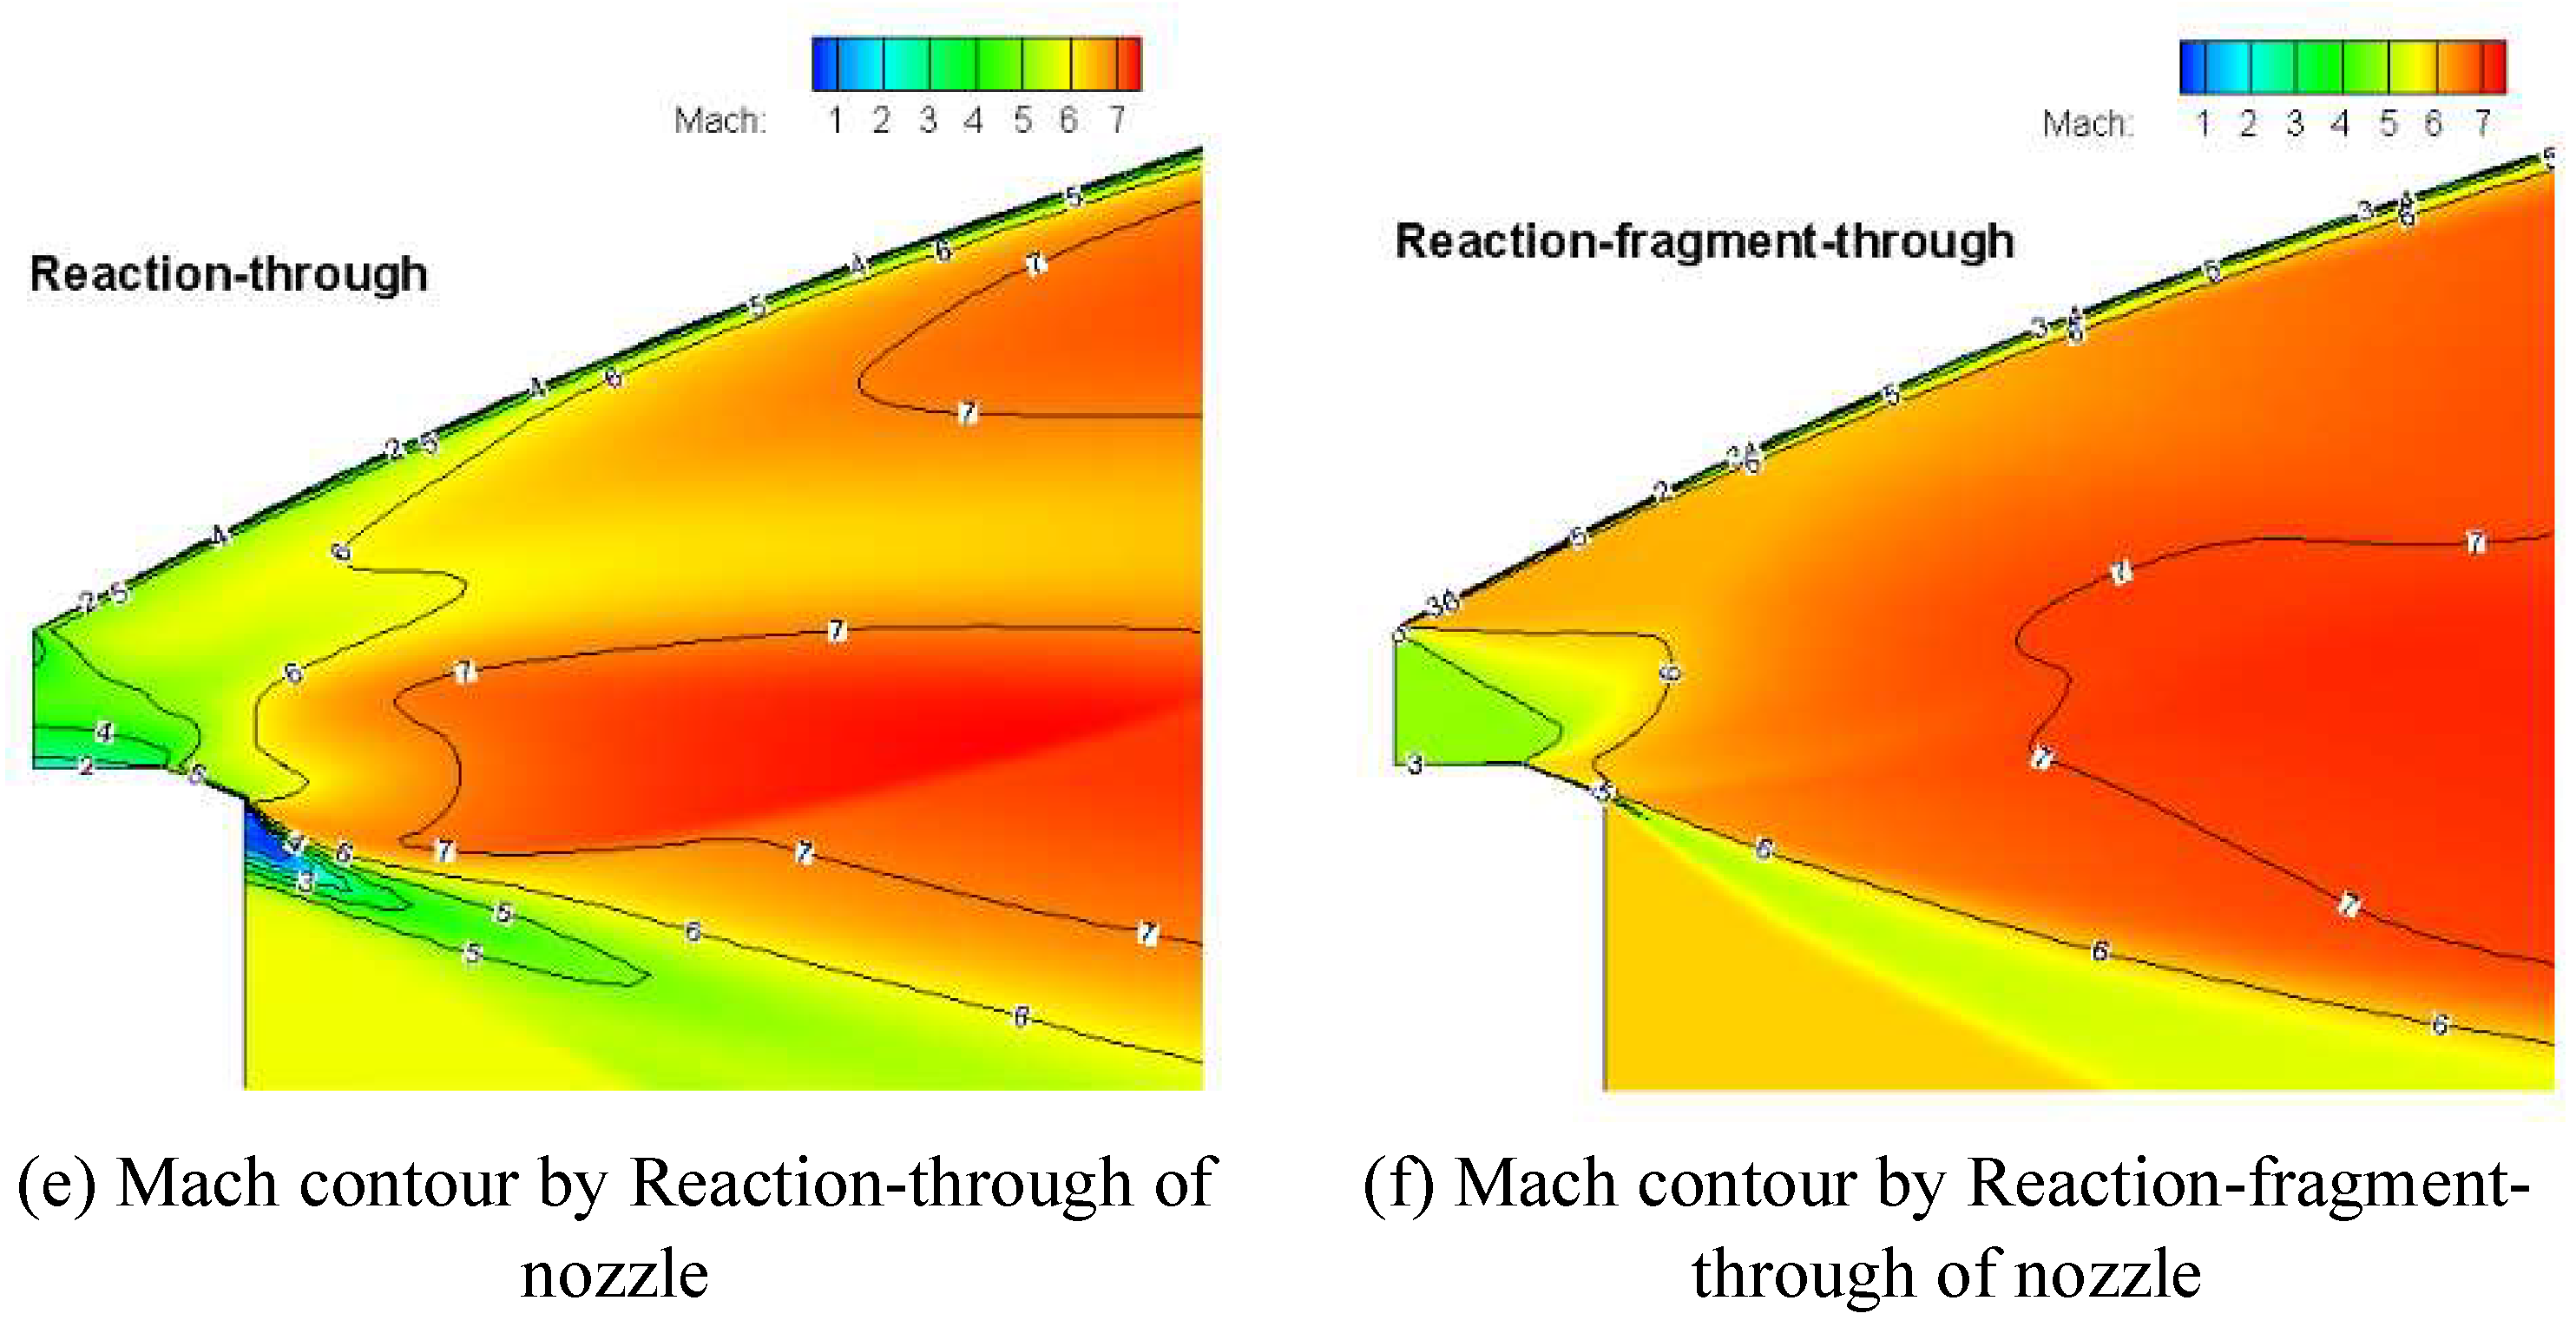
Figure 21 illustrates the Mach contour comparison of reaction-through and reaction-fragment-through in full configuration. In
Figure 21(a), the Mach distribution is continuous and uninterrupted, while the Mach shows discontinuity in
Figure 21(b). However, it can be seen that the Mach outline close to the wall show a high similarity for the two method. The same results can be discovered in the combustion (see
Figure 21(c)~
Figure 21(d)) and nozzle (see
Figure 21(e)~
Figure 21(f)).
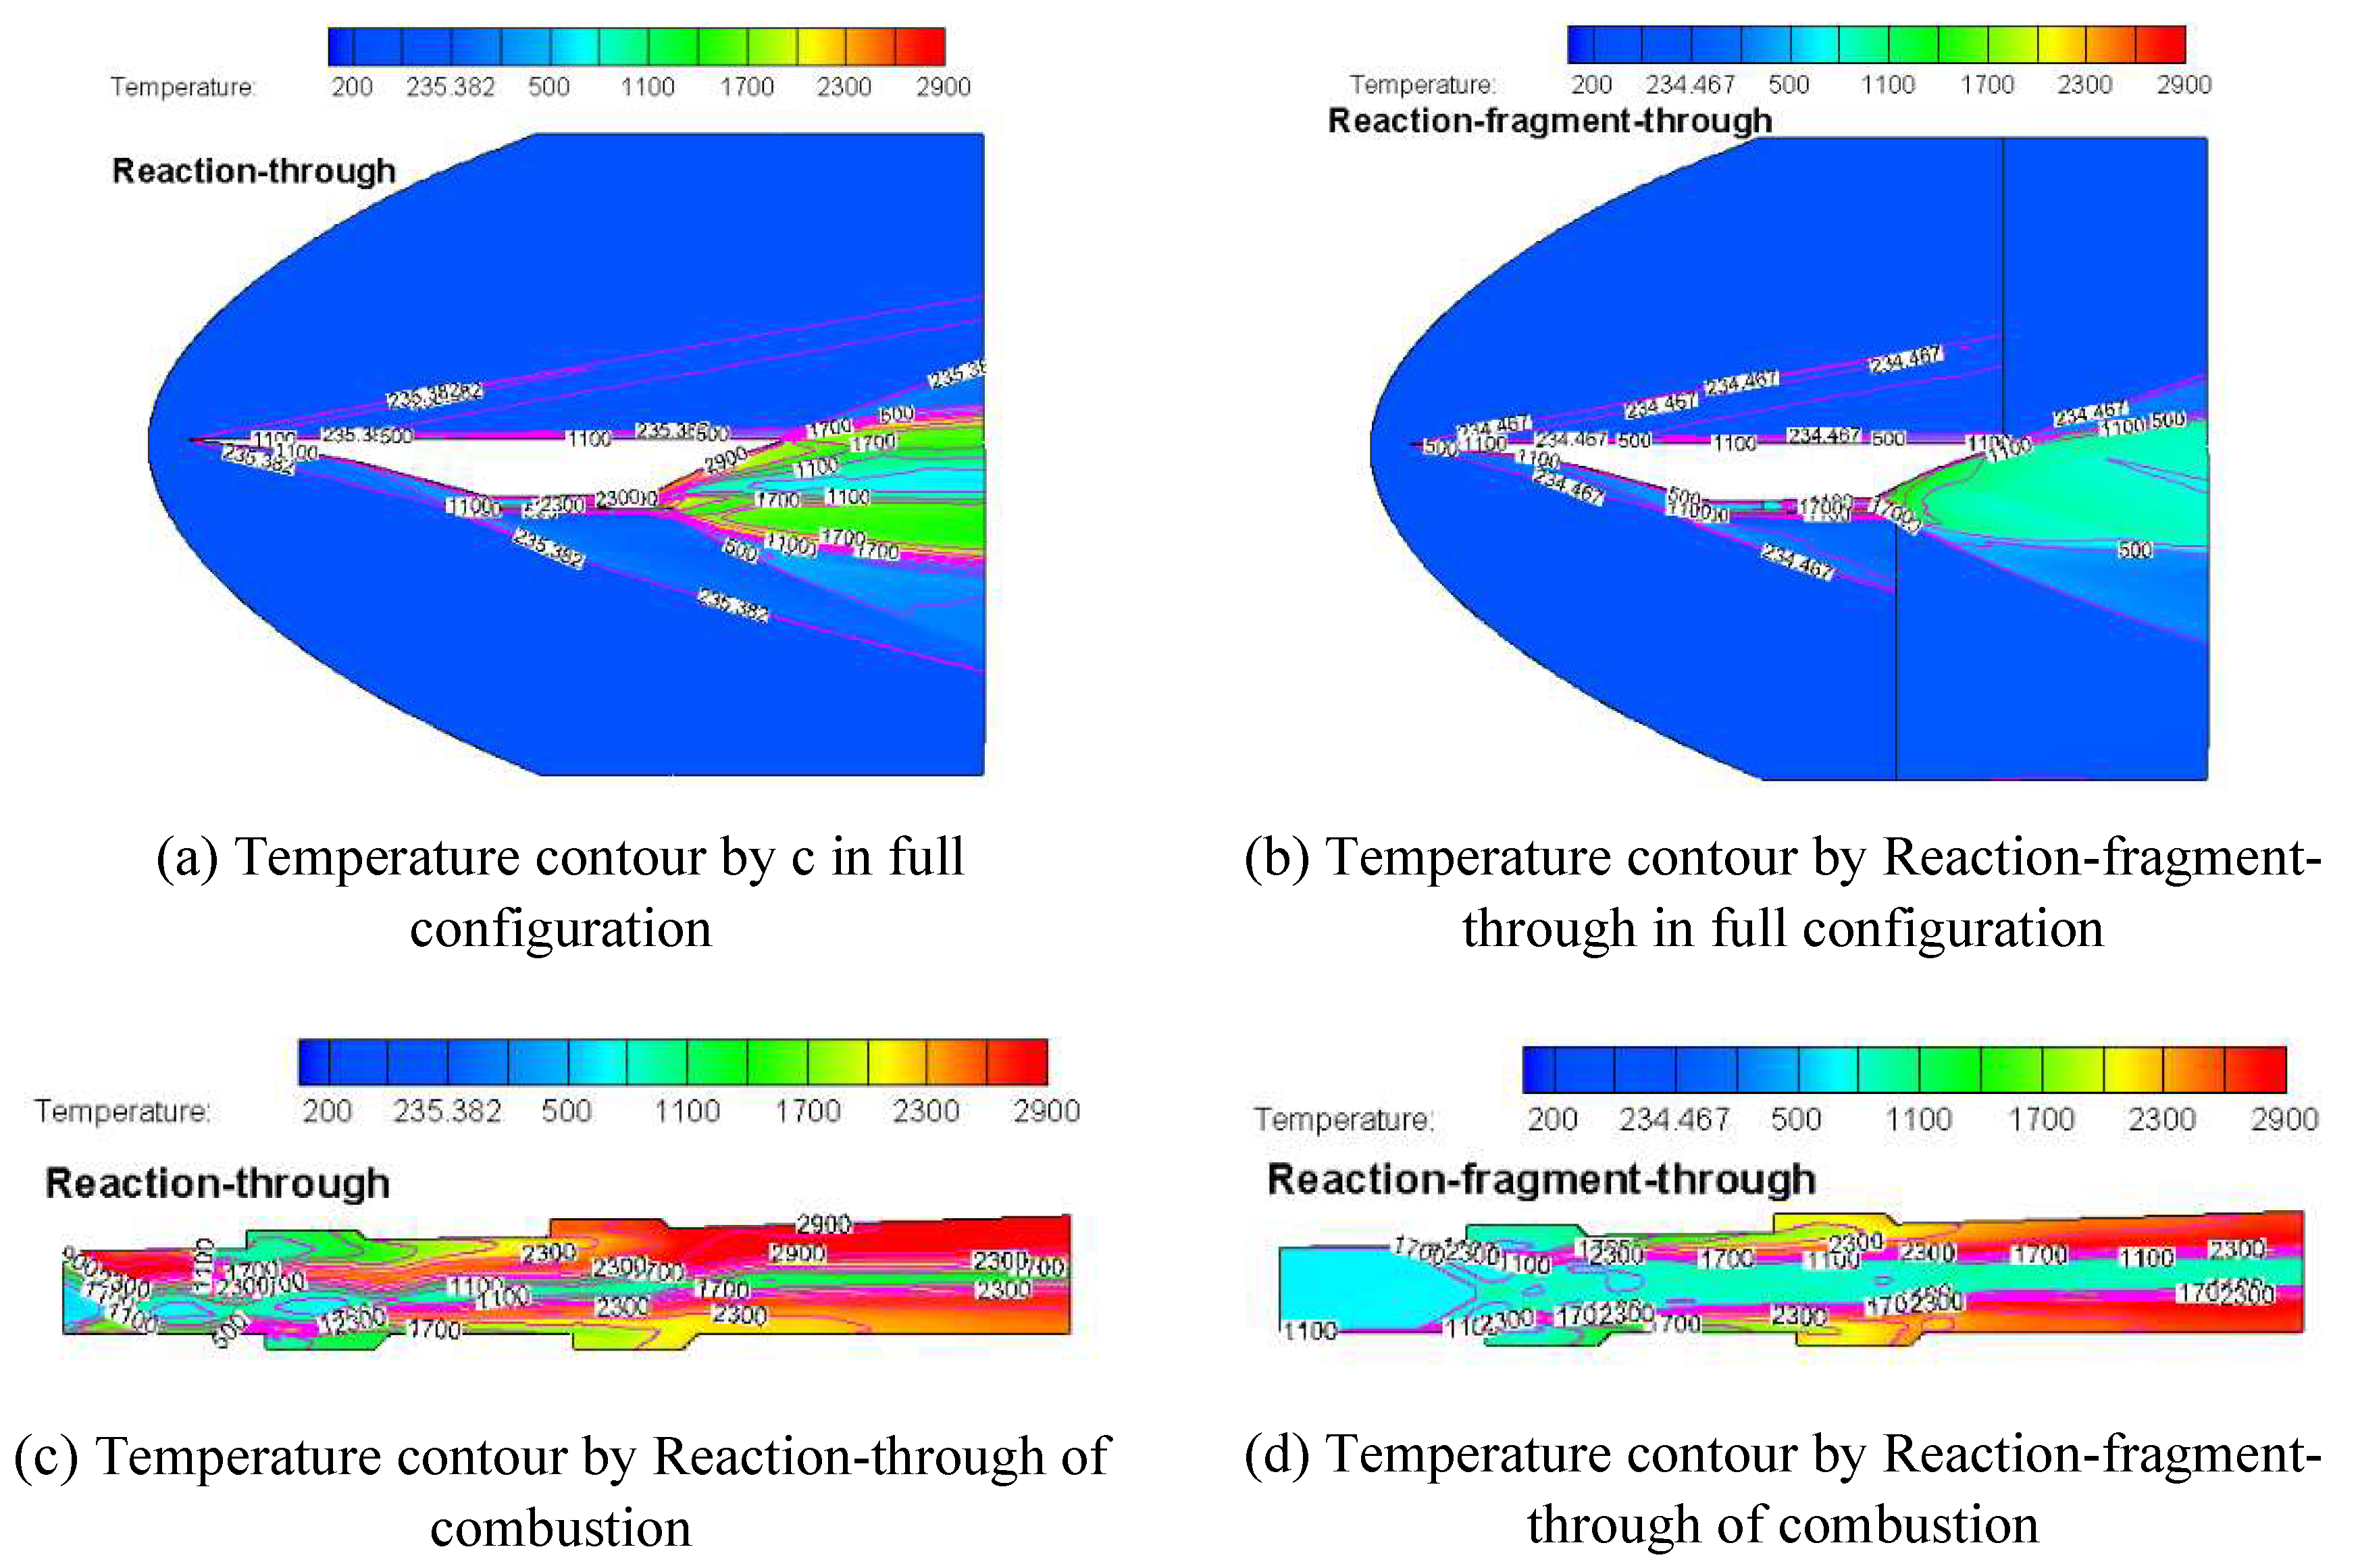
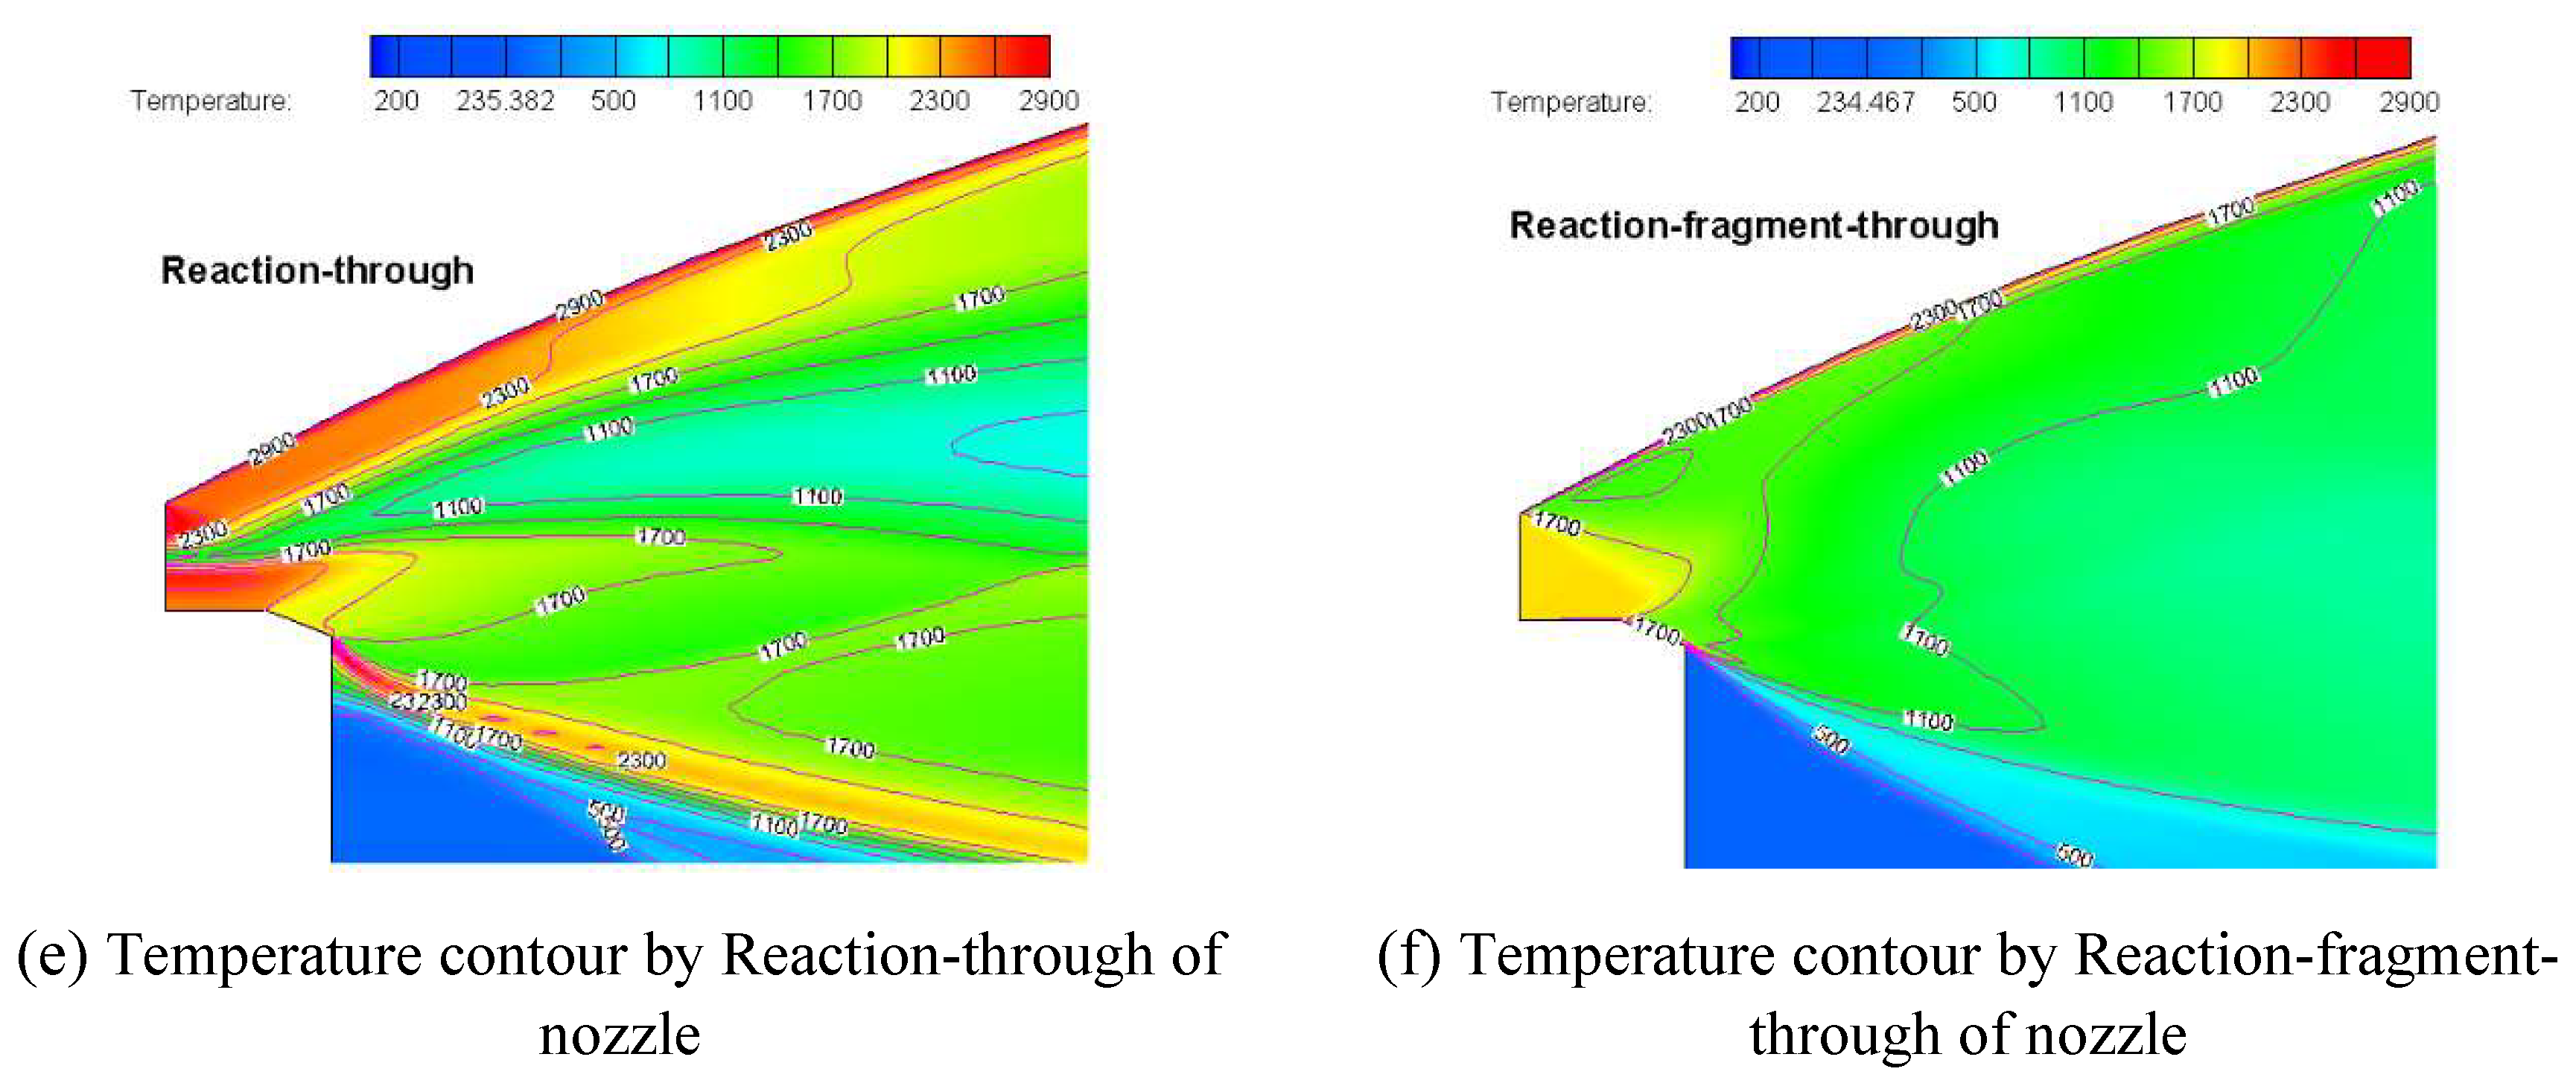
As is shown in
Figure 22, the temperature contour comparison corresponding to the two calculation method is displayed. It can be seen from
Figure 22(a) and
Figure 22(b) that the temperature distribution by Reaction-through show discontinuity. Especially at the outlet of the nozzle, there are certain differences. According to the results from Reaction-through, the temperature shows a slow expansion at the outlet, while the temperature gradient change is not significant from the Reaction-fragment-through calculation, which can be seen in
Figure 22(e) and
Figure 22(f). In the combustion, the temperature distribution is unlike because the entrance is given a unitary boundary condition. However, as the combustion progresses, the outlet exhibits a high similarity in the temperature distribution. Therefore, the reaction by fragment computation can achieve the expected calculation results.
6. Conclusion
The multiple fragment computation method for high speed airframe/engine integration vehicle is presented and analyzed in this paper. Firstly, through comparing the simulation efficiency, it is found that the fragment computation has a prominent advantage, especially in flowfield-solving with reaction. The simulation time can reduce 45% and 70% for high speed flowfield-solving of without reaction and with reaction by using fragment computation method, respectively. Moreover, fragment computation can gain results close to that by integrated computation for both flowfield. By contrast, we can conclude that fragment computation method is an excellent choice to solve high speed flow of integration vehicle to boost analysis efficiency and shorten research period in the preliminary design phase.
In this paper, the combustion chamber inlet condition is given using the average flow rate of the outlet from the isolator section, which is different from the real inlet conditions, involved parameters such as Mach number and velocity direction etc. A more accurate flowfield distribution at the entrance of the combustion chamber can further improves the research efficiency of the method, the self-defining functions that can express real values would be added in the process to achieve better results.
Figure 1.
Schematic diagram of the typical integrated high speed vehicle[
3].
Figure 1.
Schematic diagram of the typical integrated high speed vehicle[
3].
Figure 2.
Schematic diagram of the integrated high speed vehicle.
Figure 2.
Schematic diagram of the integrated high speed vehicle.
Figure 6.
Comparison of schlieren picture (a), numerical contour by literature(b), and numerical results by this paper(c).
Figure 6.
Comparison of schlieren picture (a), numerical contour by literature(b), and numerical results by this paper(c).
Figure 7.
Pressure distribution contrast of cowl(top-wall of inlet)
Figure 7.
Pressure distribution contrast of cowl(top-wall of inlet)
Figure 8.
Pressure distribution contrast of compression ramp(down-wall of inlet)
Figure 8.
Pressure distribution contrast of compression ramp(down-wall of inlet)
Figure 9.
Aerodynamic characteristic comparison of high speed integrated vehicle.
Figure 9.
Aerodynamic characteristic comparison of high speed integrated vehicle.
Figure 10.
Upper-wall pressure coefficient distribution without reaction at AOA=0°.
Figure 10.
Upper-wall pressure coefficient distribution without reaction at AOA=0°.
Figure 11.
Down-wall pressure coefficient distribution without reaction at AOA=0°.
Figure 11.
Down-wall pressure coefficient distribution without reaction at AOA=0°.
Figure 12.
Upper-wall pressure coefficient distribution with reaction at AOA=0°.
Figure 12.
Upper-wall pressure coefficient distribution with reaction at AOA=0°.
Figure 13.
Down-wall pressure coefficient distribution with reaction at AOA=0°.
Figure 13.
Down-wall pressure coefficient distribution with reaction at AOA=0°.
Figure 14.
Pressure contour contrast of high speed vehicle at AOA=4°.
Figure 14.
Pressure contour contrast of high speed vehicle at AOA=4°.
Figure 15.
Mach contour contrast of high speed vehicle at AOA=4°.
Figure 15.
Mach contour contrast of high speed vehicle at AOA=4°.
Figure 16.
Pressure contour contrast of inlet/isolator at AOA=4°.
Figure 16.
Pressure contour contrast of inlet/isolator at AOA=4°.
Figure 17.
Pressure contour contrast of combustion chamber at AOA=4°.
Figure 17.
Pressure contour contrast of combustion chamber at AOA=4°.
Figure 18.
Pressure contour contrast of nozzle at AOA=4°.
Figure 18.
Pressure contour contrast of nozzle at AOA=4°.
Figure 19.
Pressure contour at the interface of isolator and combustor at AOA=4°.
Figure 19.
Pressure contour at the interface of isolator and combustor at AOA=4°.
Figure 20.
Pressure contour at the interface of combustor and nozzle at AOA=4°.
Figure 20.
Pressure contour at the interface of combustor and nozzle at AOA=4°.
Figure 21.
Mach contour comparison at AOA=0°.
Figure 21.
Mach contour comparison at AOA=0°.
Figure 22.
Temperature contour comparison at AOA=0°.
Figure 22.
Temperature contour comparison at AOA=0°.
Table 1.
Main Parameters of the integrated high speed vehicle.
Table 1.
Main Parameters of the integrated high speed vehicle.
| parameter |
Value(mm) |
parameter |
Value(mm) |
parameter |
Value(mm) |
|
585.2 |
Liso |
252.8 |
Hiso |
45.25 |
|
253.3 |
Lcomb |
550.5 |
|
15 |
|
623.1 |
Lnozzle |
620 |
Ltotal |
2884.9 |
Table 2.
Grid Description of different Grid Levels.
Table 2.
Grid Description of different Grid Levels.
| Grid |
Scale |
/mm |
y+ |
| G1 |
|
0.1 |
160 |
| G2 |
|
0.01 |
16 |
| G3 |
|
0.001 |
1.6 |
| G4 |
|
0.0001 |
0.16 |
