1. Introduction
An important part of global sustainable development is the creation of an environmentally friendly energy sector [
1]. In this regard, renewable energy sources (RESs) are widely developed in the world, the most common types of which are wind power systems (WPSs) and photovoltaic systems (PVSs) [
2,
3]. Their total installed capacity in the world reached 1398 GW in 2020 [
4].Renewable energy resources allow achieving not only an environmental impact, but also an economic one in remote settlements, mining, oil and gas enterprises, exploration stations, etc., where diesel power systems (DPSs) were traditional sources of electricity [
5,
6,
7] .DG unites and the continuation of the introduction of these unites into the electric power system, in connection with which DG units were introduced into this system. However, the installation of calculated generation units poses a number of technical problems, combined with network voltage, power quality, safety, power flow, control, and frequency regulation.
2. Definition of distributed generation
There is currently no consensus on an exact definition of distributed generation. The Distributed Generation Working Group of the International Conference on Large High Voltage Systems (CIGRE) defines it as 50-100 MW generating units that are usually connected to the distribution network and are not centrally planned and controlled.
Whereas, IEEE considers distributed generation to be electrical generation by units that are sufficiently smaller than central generating stations so that they can be connected to any point in the power system.
In all cases, distributed generation has general agreed-upon features, the most important of which are:
The capacity of distributed generation units starts from a few kW to tens of MW
Without central planning (that is, the electricity institutions do not plan for it): of course, this feature is not available in vertically complete power systems (for example, those wholly owned by the state or any single monopoly).
Without central coordination and control: It should be noted that some DG units in some countries have recently been placed under the central control program. Even when distributed generation is not linked to central control, DG units may be forced to announce their generation plans a week in advance.
Often connected to the distribution system.
The most important technologies of the DG are piston engines, micro turbines, gas turbines with internal combustion, fuel cells, solar systems and electric systems.
3. Power flow in a distribution network that contains distributed generation
3.1. The nature of the distribution system has changed in the era of distributed generation
Modern distribution systems are designed on the basis of receiving electrical power from network transformers and distributing it to consumers at the average distribution voltage and through the switching centers to consumers at the low voltage level. Thus, the flow of effective power P and reactive capacity Q is always from the highest level of tension to the lowest level. Distributed generation transforms the distribution system from a passive system, as is the case in traditional electric power systems, to an active distribution system. Since the power injected into the distribution network can affect its flow pattern, it must be ensured that it will not reduce the power supply specifications for other network users. With distributed generation in the distribution system, the flow and tension of the network are determined not only by the loads but also by the generators and the loads together. It is possible that the direction of the two-way power flow will be reversed in some branches of the network depending on the size and location of the distributed generation and the size of the loads, which concluded through the computer tests that conducted and which we will present later [
8].
3.2. Mathematical model for analyzing the power flow of a distribution system containing distributed generation
It is known that the study of the power flow is not conducted for the entire electrical power system at once. Most studies and references focus on the power flow of transmission systems with the central generating stations associated with it (which would call the traditional flow). These references provide mathematical models and algorithms that have proven their effectiveness for these systems. But we will show that the flow in the distribution network that includes distributed generation is very different from the traditional flow in terms of the physical properties of the vehicles of the efficient transmission and distribution systems, especially the generators (large traditional in the central transmission and generation system and distributed with different technologies in the efficient distribution system) and the resulting difference in models Compilation bars representing different running states. Some of these algorithms (such as Fast Decoupled Load Flow FDLF)[ ] take advantage of the small impedance/reactance (R/X ≈ 0.3) ratio of the transmission system lines to force the [N] and [J] partial matrices of the "Yacobi" matrix to be zero[ ], This means that the reactive power transmission on the transmission line is most responsible for the change in the value of the voltage across a transmission line or part of the power transmission system, while the phase shift between the voltages results mostly from the actual power transmission. This conclusion is correct for transmission lines, but it is completely wrong for the distribution system, where the ratio of resistance/reactance for cables is greater than one and for overhead lines the ratio is slightly less than one, due to the small dimensions of the phases that make the reactance large. Therefore, the FDLF method will not converge if we use it to solve the effective distribution load-flow equations. The other thing is the reference bus "slack bus". In the transmission system, we usually choose the bus with a large generating unit as the reference bus. As for the distribution network, we usually choose the bus connecting the distribution network under test with the highest tension level as the reference collecting bus Therefore; important modifications must be made to the mathematical model and the traditional algorithm in order to achieve compatibility with the new guest on the distribution system. The mathematical model of the power flow in the effective distribution system (radial or meshed) depends on its new structure and on the principle of equilibrium of the actual and reactive powers related to a collection bus, which requires that the power be balanced at each bus in the system. That is the sum of the generated and consumed powers. in a bus and the potentials transmitted to and from other nearby collecting buss through lines, cables or transformers must be equal to zero.
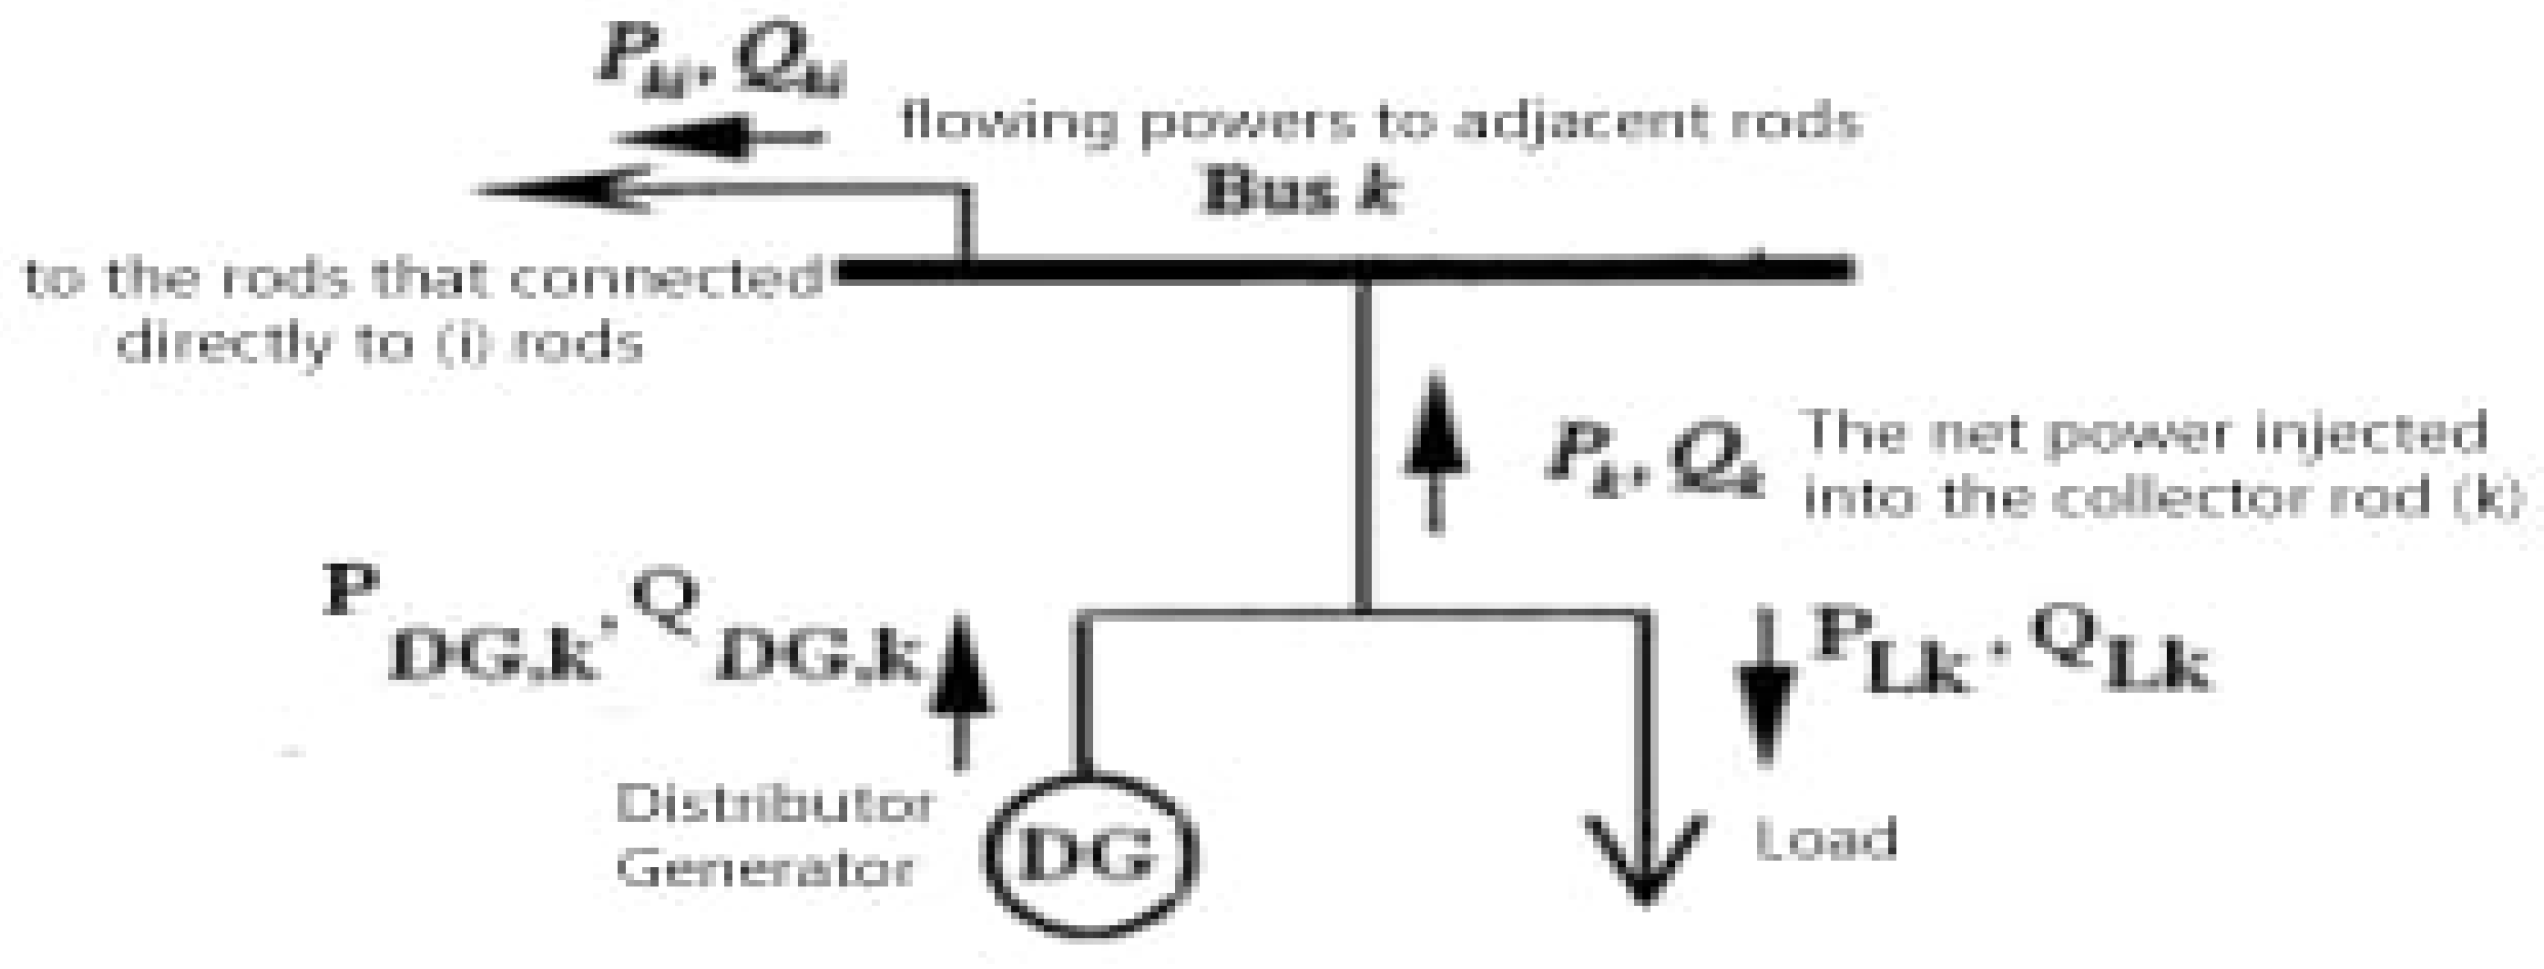
Figure 1 shows the concept of net effective power Pk and net response Qk injected into a bus k.
Since the actual and reactive powers are equilibrated separately from each other, we have a distribution system consisting of N collector buses, and with bus 1 as the reference bus Where the sum includes all the i-bus adjacent to the k-bus (i.e. the bus connected directly to the k-bus via a line, cable, or transformer) as shown in
Figure 2.
Substituting the current in terms of the buses voltage k and i, and the branch impedance Ki, therefore
It should be noted that due to the losses that occur in the resistance and reactance of the branch, the measured abilities at the two ends of the branch are not equal, that is
:
From equations 1,2 and 3, is found
For K = 1,2,…,N
Equations (5,6) are nonlinear power-flow equations that are mathematically similar to the power-flow equations for transmission systems (conventional flow), and they relate the actual and net reactive power injected into a bus k with the value of the voltage and its angle in the k-bus itself and in adjacent bus bars .
Since similar equations can be written for each bus of the system N and we have 2N equation but 4N unknown variable
The four variables θk, Vk, Qk, Pk represent a unique electrical representation.
For equations (5,6) to be solvable, two of these four variables must be known to each bus. Conventional flux uses 3 forms to group the known and unknown variables and thus 3 forms to model all the buses. These assemblies are of course related to the physical properties of the assembly buses. Here emerges the radical difference between the power flow of transmission systems and the power flow in effective distribution systems. Instead of 3 models that were enough to model the transmission and generation system collecting buses, 6 models are required for the distribution flow and most of them are related to the modeling of the distributed generation assembly buses.
3.3. modeling of the distributed regenerative generation assembly bars for the analysis of the power flow of the distribution network
The conventional power flow is combined with the distributed flow by adopting the PQ bus model to represent the load collecting bus where the actual power and net response injected into the bus are known, while the value of the voltage and its angle are unknown. They also partly share the use of the Vθ collecting bus model for modeling the reference assembly bus, where the parameters are the voltage and angle value and the unknowns are the actual and reactive powers injected; with the difference inherent in determining which collector bus is suitable as a reference collecting bus, as previously explained, the main difference is in how the generating assembly buses are modeled. The role of distributed generation technologies depends on the structure of existing energy supply systems, electricity prices, and the characteristics of energy supply markets. The distributed generation aggregation buses in the algorithm are designed in different models depending on the type of distributed generator, its interface connection, and its operation method. They can be classified according to the following categories [
9,
10].
The first category: includes the PV generator and the D type induction or synchronous wind generator, all of which share a power converter as a link interface with the network. Since it is the switch that determines the behavior of these generators from the network point of view, this class in the software system used by the power factory in the DG unit is the static generator. The static distributed generator has three operating modes and accordingly 3 models to model the collector rods for the power flow [
11].
1-Constant power factor operation
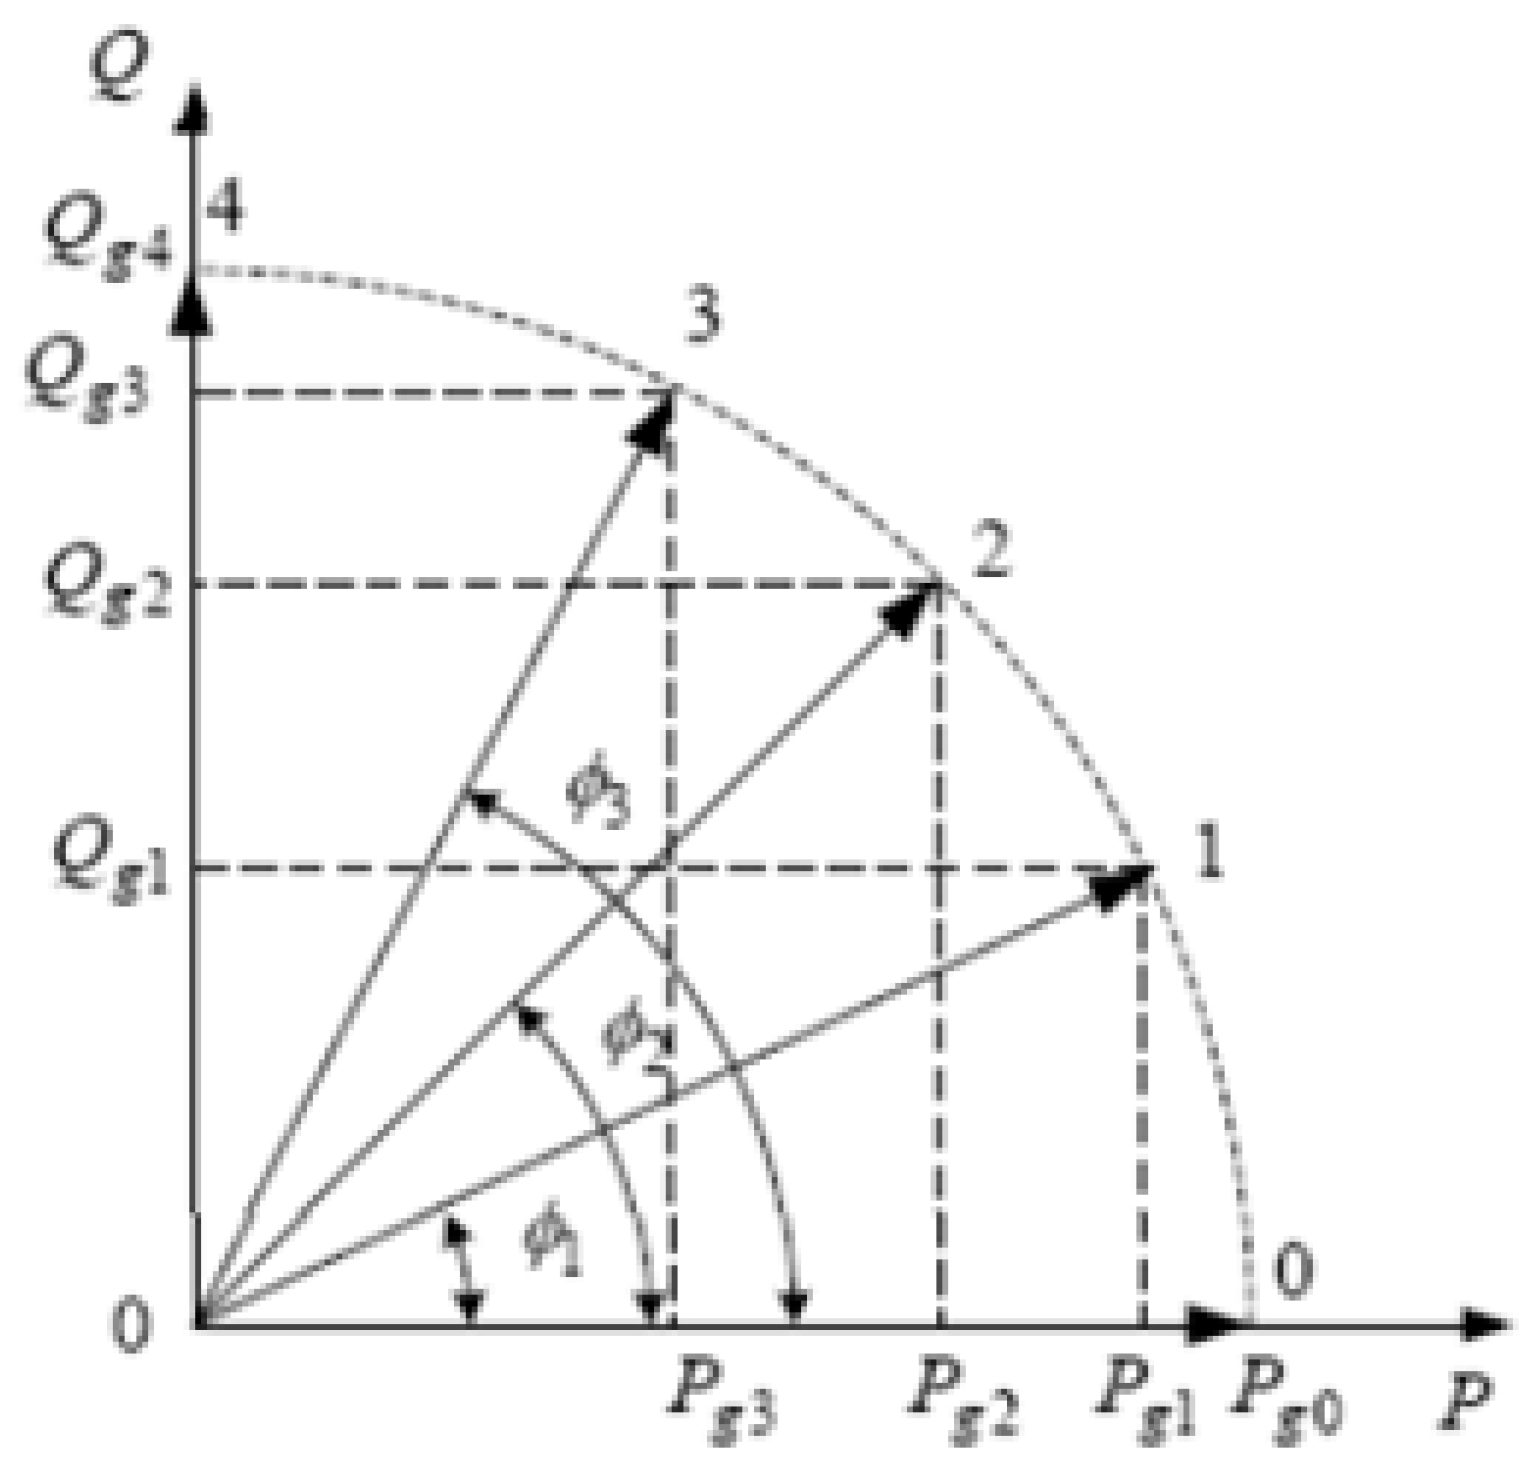
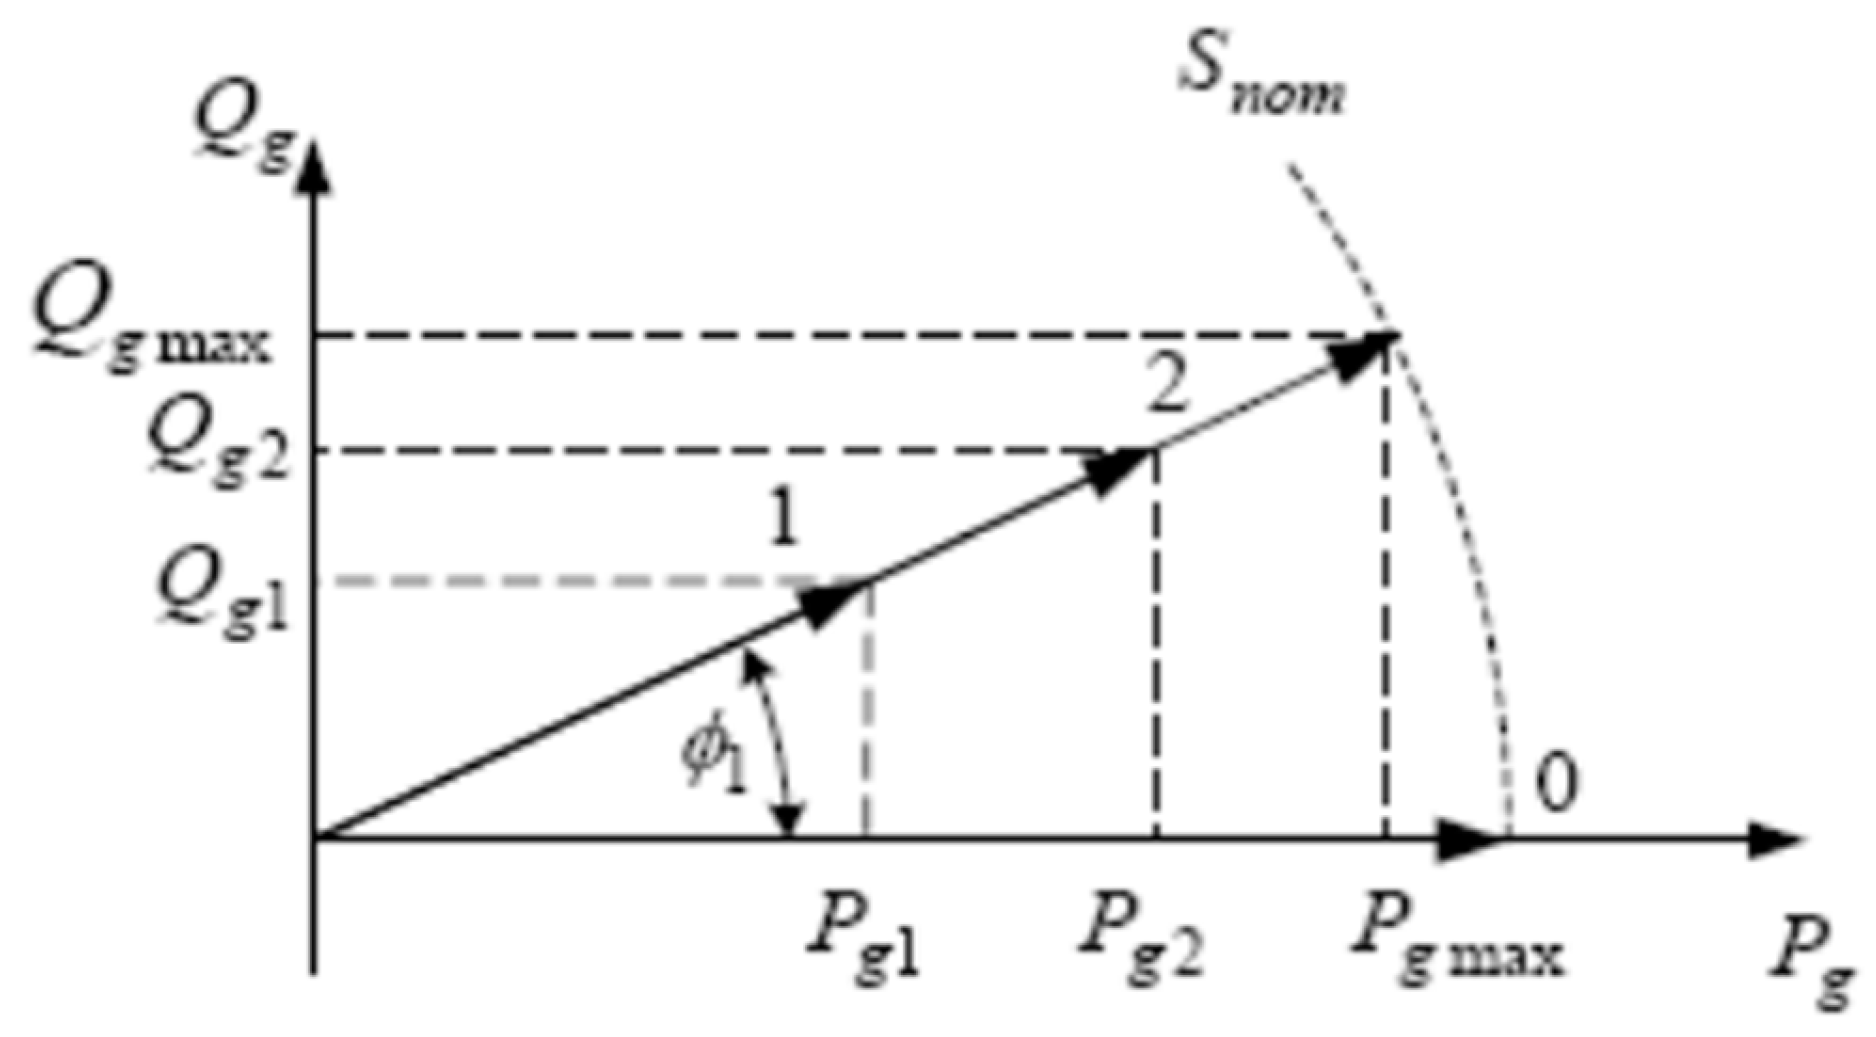
It activates the power factor control. The model used to represent this case is the PQ collecting rod model. This case is limited by two conditions
Figure 3, the first condition prohibits exceeding the nominal apparent power VA of the converter, and the second condition is that the power factor must be kept constant.
2-Variable power factor operation
Where it activates stress control. The model used to represent this situation is the PV collector bus model. This mode of operation allows a distributed generator to supply voltage to the grid by injecting reactive power. Figure 5 shows an example of this case
3- the mode of operation for the purpose of regulating the voltage of a specific Droop, Regulation by definition is
Figure 4.
Variable power factor operating mode of Class 1 DG unit.
Figure 4.
Variable power factor operating mode of Class 1 DG unit.
In this case the tension is controlled according to a specific regulating characteristic (e.g. D=2%) and a specific tension. This case is modeled by a DV Assembly bus model.
The second category: includes the classic induction generators of type A and B, connected directly to the network. This type provides real power but consumes reactive power. This distributed generator can be represented by the following two models [
5]:
1- PQ rail Model: Similar to the Load Rail Model and is an approximate representation.
2- A special model called the AS collector bus model: the user determines only the actual power of the generator, and calculates the corresponding slip and reactive power from the model's steady-state equations. This model is the most accurate representation, and it must be adopted when analyzing the power flow as an introduction to the study of transient cases.
The third category: includes the DFIG induction generator (Type C), .
Which is an induction generator equipped with a converter-PWM connected to slip rings. The commentator controls the value of the circuit voltage and angle, and then the actual and feedback power of the generator. The DFIG model consists of two parts: the induction generator model and the commentator model; Therefore, the complete model contains two terminals, one AC and one DC.
In order to analyze the power flow in a semi-containing generator, it is necessary to determine the actual power, the reactive power, and the static slip for it. Therefore, the representative model of the DFIG generator assembly rod is a special model that we call the PQS assembly bus model. The rest of the variables, including the corresponding modulation index, are calculated in the context of the repetitions of the power flow [
12]. Usually this generator is connected to the network via a three-coil transformer (e.g. 5.6 MVA, 30/3.3/0.96 kV).
4. Criteria (indicators) for the quantitative evaluation of the effect of the distributed generator on the tension and loss of power in the distribution network
A methodology based on the following criteria and indicators can be adopted:
4.1. Penetration Index (PI) or Penetration Level (PL):
T1he Penetration Index (PI %) is the ratio of the total distributed generation (P
DG) to the maximum load of the host distribution network (P
load) :
This indicator does not mean the percentage of the system's loads, but rather the loads of the host distribution network. If the electrical system contains central generation only, the penetration index is 0%, and the indicator 100% indicates that all loads of the host distribution network are covered by distributed generation. An indicator less than 20% to 30% reflects the presence of obstacles and a lack of incentives for the private sector to exploit renewable energy, while an indicator of 50% indicates the existence of a good market for the electricity sector with an incentive tariff-in. Indicators greater than 100% may in certain cases be achievable, such as the case of Germany, for example, at the time of the implementation of the first project to encourage the use of the PV system for residential buildings (100,000 surface project) 1990-1995, where the state bore about 70% of the cost of the system (approximately 4-5 kW) . Electricity companies were legally obligated to buy the energy produced from PV at a price that exceeds 4 times the price of conventional energy [
13,
14].
4.2. Dispersion Index (DI)
Distribution Index (DI %) is the ratio of the number of DG collecting rods to the number of total collecting bus bars
This indicator focuses on the geographical distribution of the distributed generators and not their capacity. Through modeling some computer tests, it was concluded that the larger indicator reflects positively on voltage and losses according to the RDG technique [
15]. Also, the numbers 20%, 30%, 50%, and 100% are indicators of the state of the electricity market and the incentives or obstacles issued by the state with regard to the exploitation of renewable energy.
4.3. Voltage rise index (VRI)
The Voltage rise index of a collector bus (VRI%) is the ratio of the difference between its voltage in the presence of DG in the distribution network (V + DG) and its voltage without DG (V-DG), to the voltage without DG
Some codes, such as the German VDEW, do not allow to exceed VRI% = 2%, but this number is suitable for strong networks, that is, those that have a normal voltage profile, but for weak networks, this indicator remains useful only as an indication [
16,
17]. Over the support of the distributed generation of voltage. As for the permissible limit for the voltage height, I think it is necessary to compare V+DG with the nominal network voltage while not allowing it to exceed ±5% (i.e. in the range pu 0.95-1.05).
4.4. Total Loss Index (TLI)
This indicator can be defined as the ratio of the total lost power (Actual or reactive) in the host distribution network with DG to that one without DG
This indicator actually shows the improvement or deterioration that occurs in the loss, but it does not give a direct idea of the ratio of the loss to the generated energy (that is, the sum of the energy extracted from the high-voltage network and the energy from the distributed generation) [
18]. So another, simpler indicator that applies to the network with or without DG can be given:
where
Pi is the sum of the actual power that the host network draws from the infinite network and the actual power that the RDG injects into the host network; Qi The reactive power injected into the host network by the infinite network and distributed generation (if any) minus the reactive power consumed by the specifically distributed generation; In other words, Qi is the reactive power that is rented by all the loads of the host network [
19,
20].
4.5. Index Overloading (OVI):
Loss Index This indicator is for network branches. Fatigue indicator is necessary to detect the effect of DG in loading lines and transformers. The load for a branch is the ratio of the current in branch I to its nominal rating current:
5. Proposed Algorithm
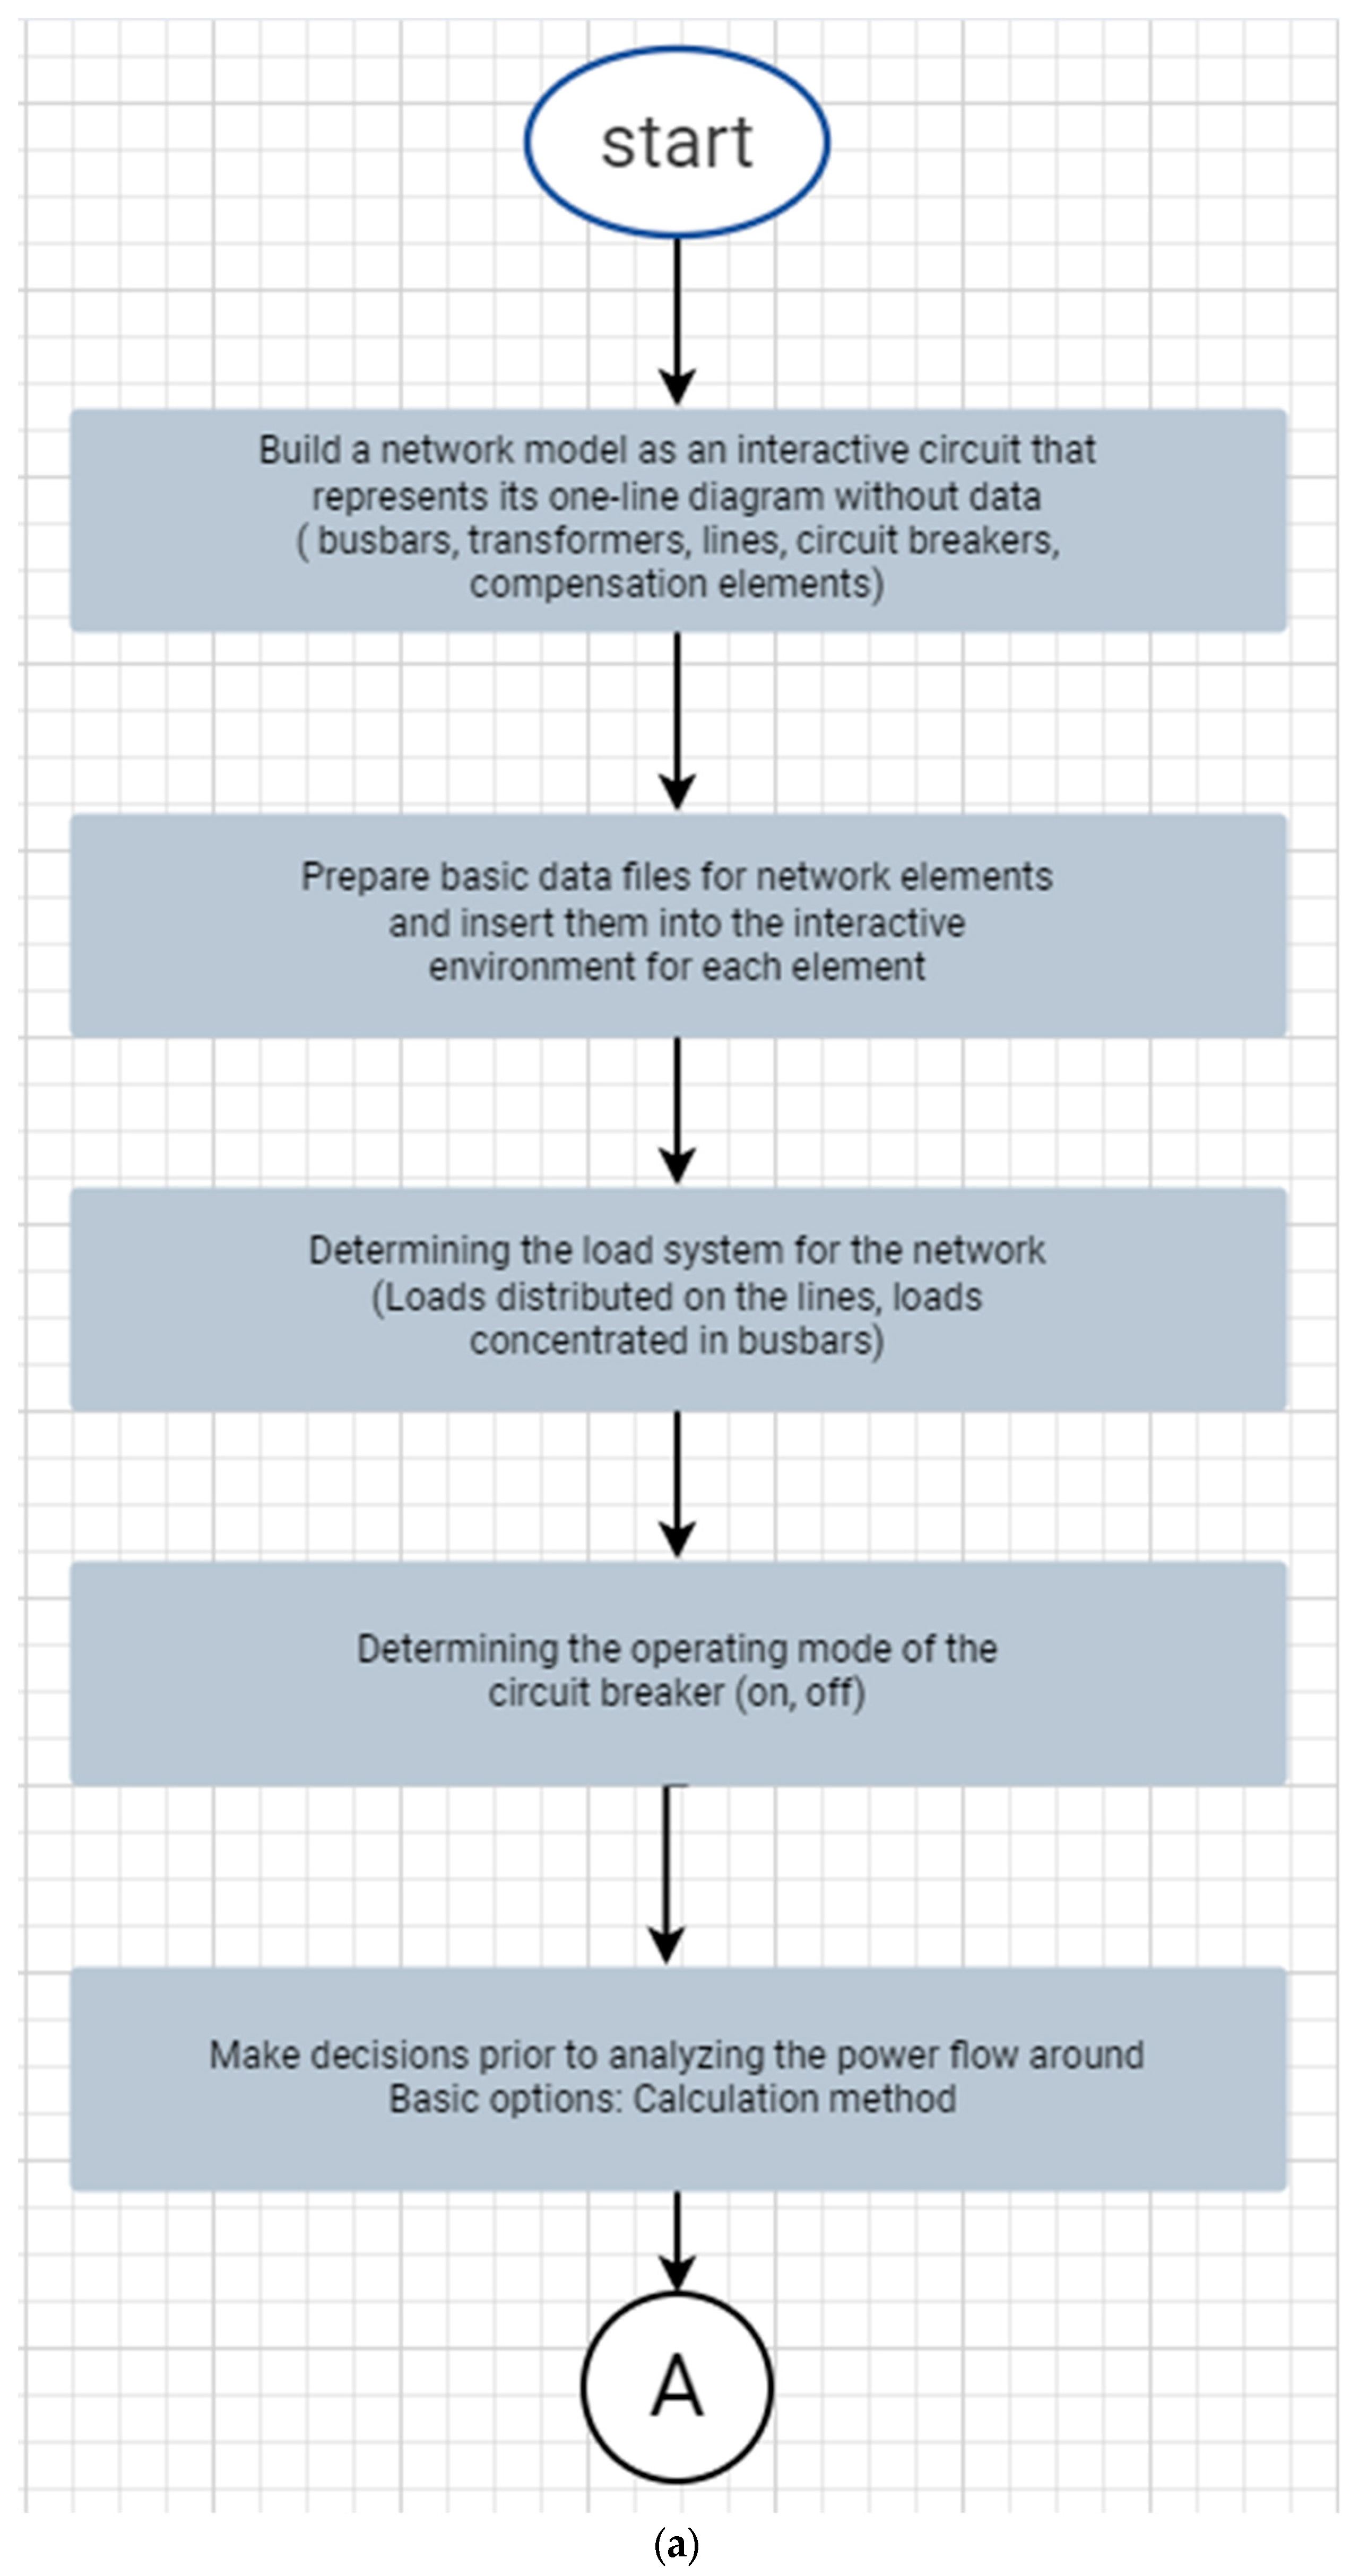
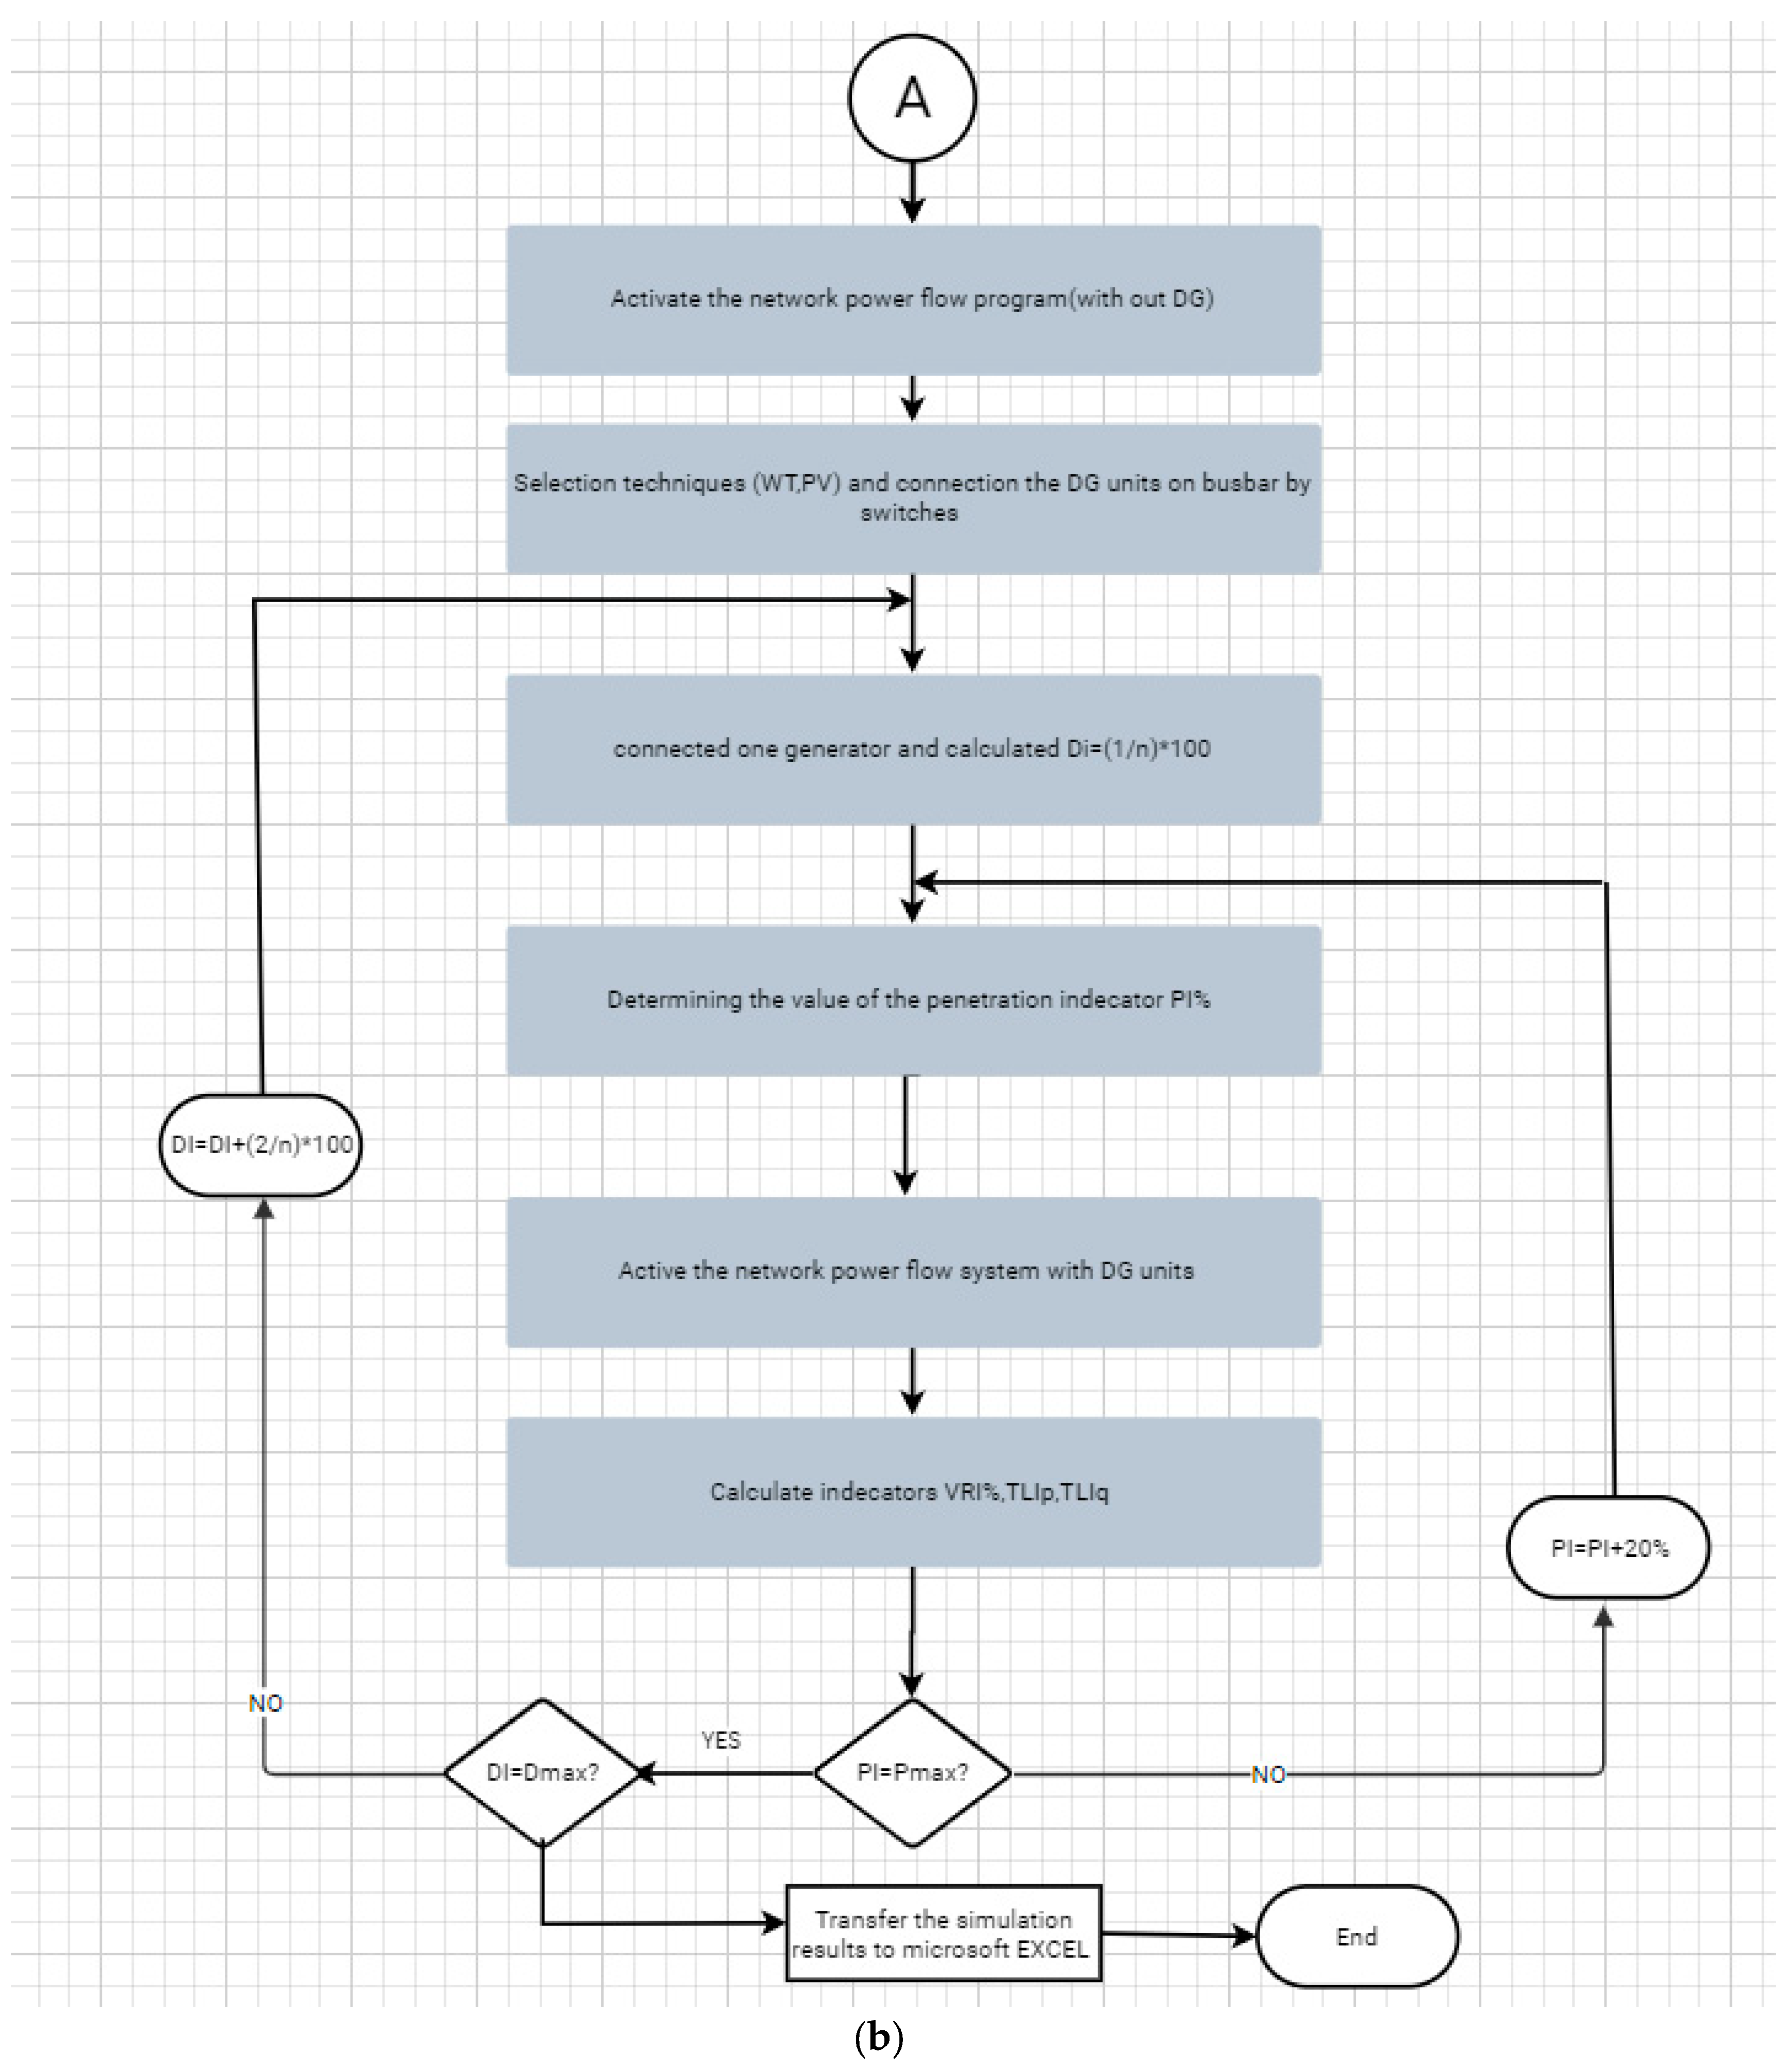
Based on the mathematical foundations that were accomplished in the previous paragraphs, The algorithm used, which is summarized by the flowchart shown in
Figure 5a, with its parts A and B, The algorithm is designed in such a way that it can be applied to any multi-level distribution system Voltage and for different renewable distributed generation technologies [
21,
22]. The algorithm was tested and implemented by computer in a typical distribution network operator in the Power Factory DigSilent which is somewhat similar to MATLAB but more suitable for the big power systems.
6. Study Case
6.1. Test distribution network
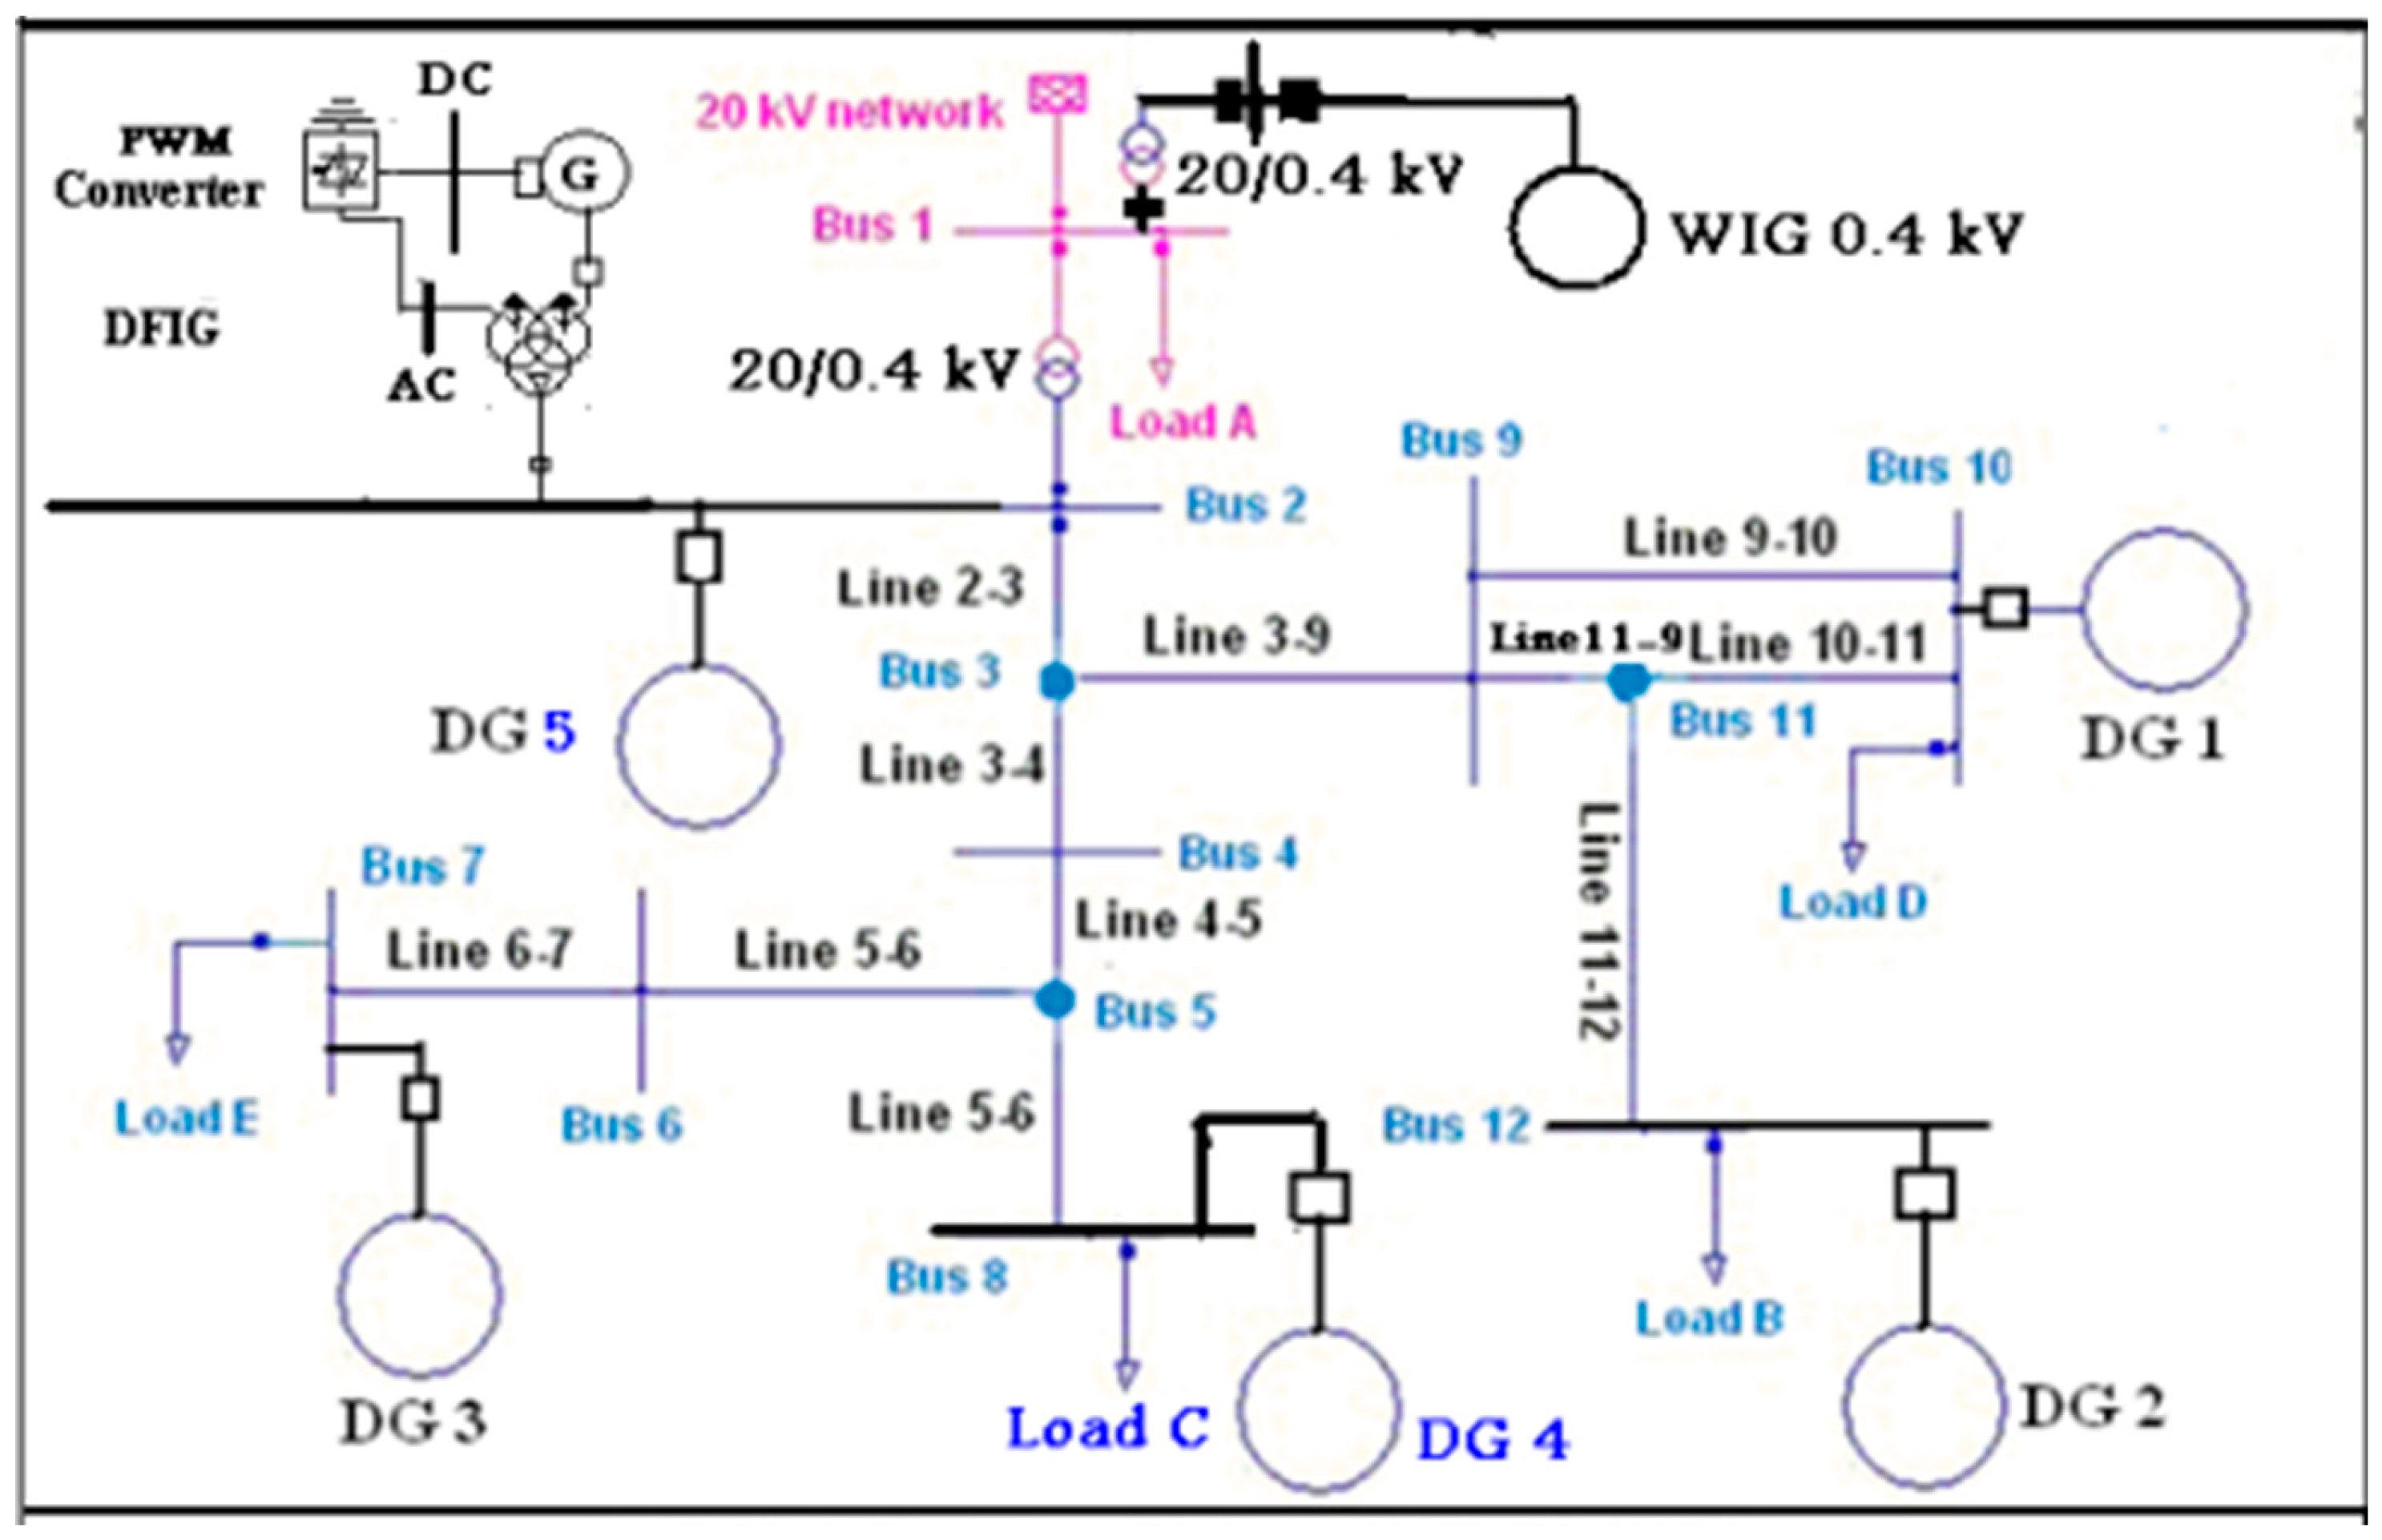
The approved distribution network consists of 18 busbars and 11 cable lines Distributed load and 5 loads concentrated in the collector bars and 3 dual adapters and triple files. The original grid assembly bars (the grid without RDG) are 12 in addition, the necessary assembly bars are added to connect the generators distributed to the 20 kW network the feed source is a 20 kV tension network that is assumed as an infinite network and connected It has a 4.0/20 kV conversion center with a nominal capacity of 250 kVA. The network includes circuit breakers. For lines, loads, transformers and distributed generators, which achieve great flexibility for modeling any modification to the network, as it can be separated and connected according to the desired test the network hosts a number of distributed generators deployed in it, which belong to the three categories It is equipped with modular circuit breakers that operate in both off-on states. Generators connected to a 20 kV network usually need a double coil transformer; except for the generator the DFIG wind power supply needs a PWM changer and a three-coil transformer [
23,
24].
Figure 6.
Single line diagram of the test distribution network [
25].
Figure 6.
Single line diagram of the test distribution network [
25].
Three distributed generators of the type of static generator were connected to the network, i.e. the scattering index is 60% in busbars 7, 10 and 12 . These generators can be of type D type synchronous induction wind generator or PV station (according to the operating mode with constant power factor ( pf=1 ). Was selected the total generating capacities so that penetration indicators of 100% and 150% are achieved, respectively. The modeling gives this test conducted a quantitative evaluation of the effect of the assumed distributed generation on the bus voltage and losses [
26,
27].
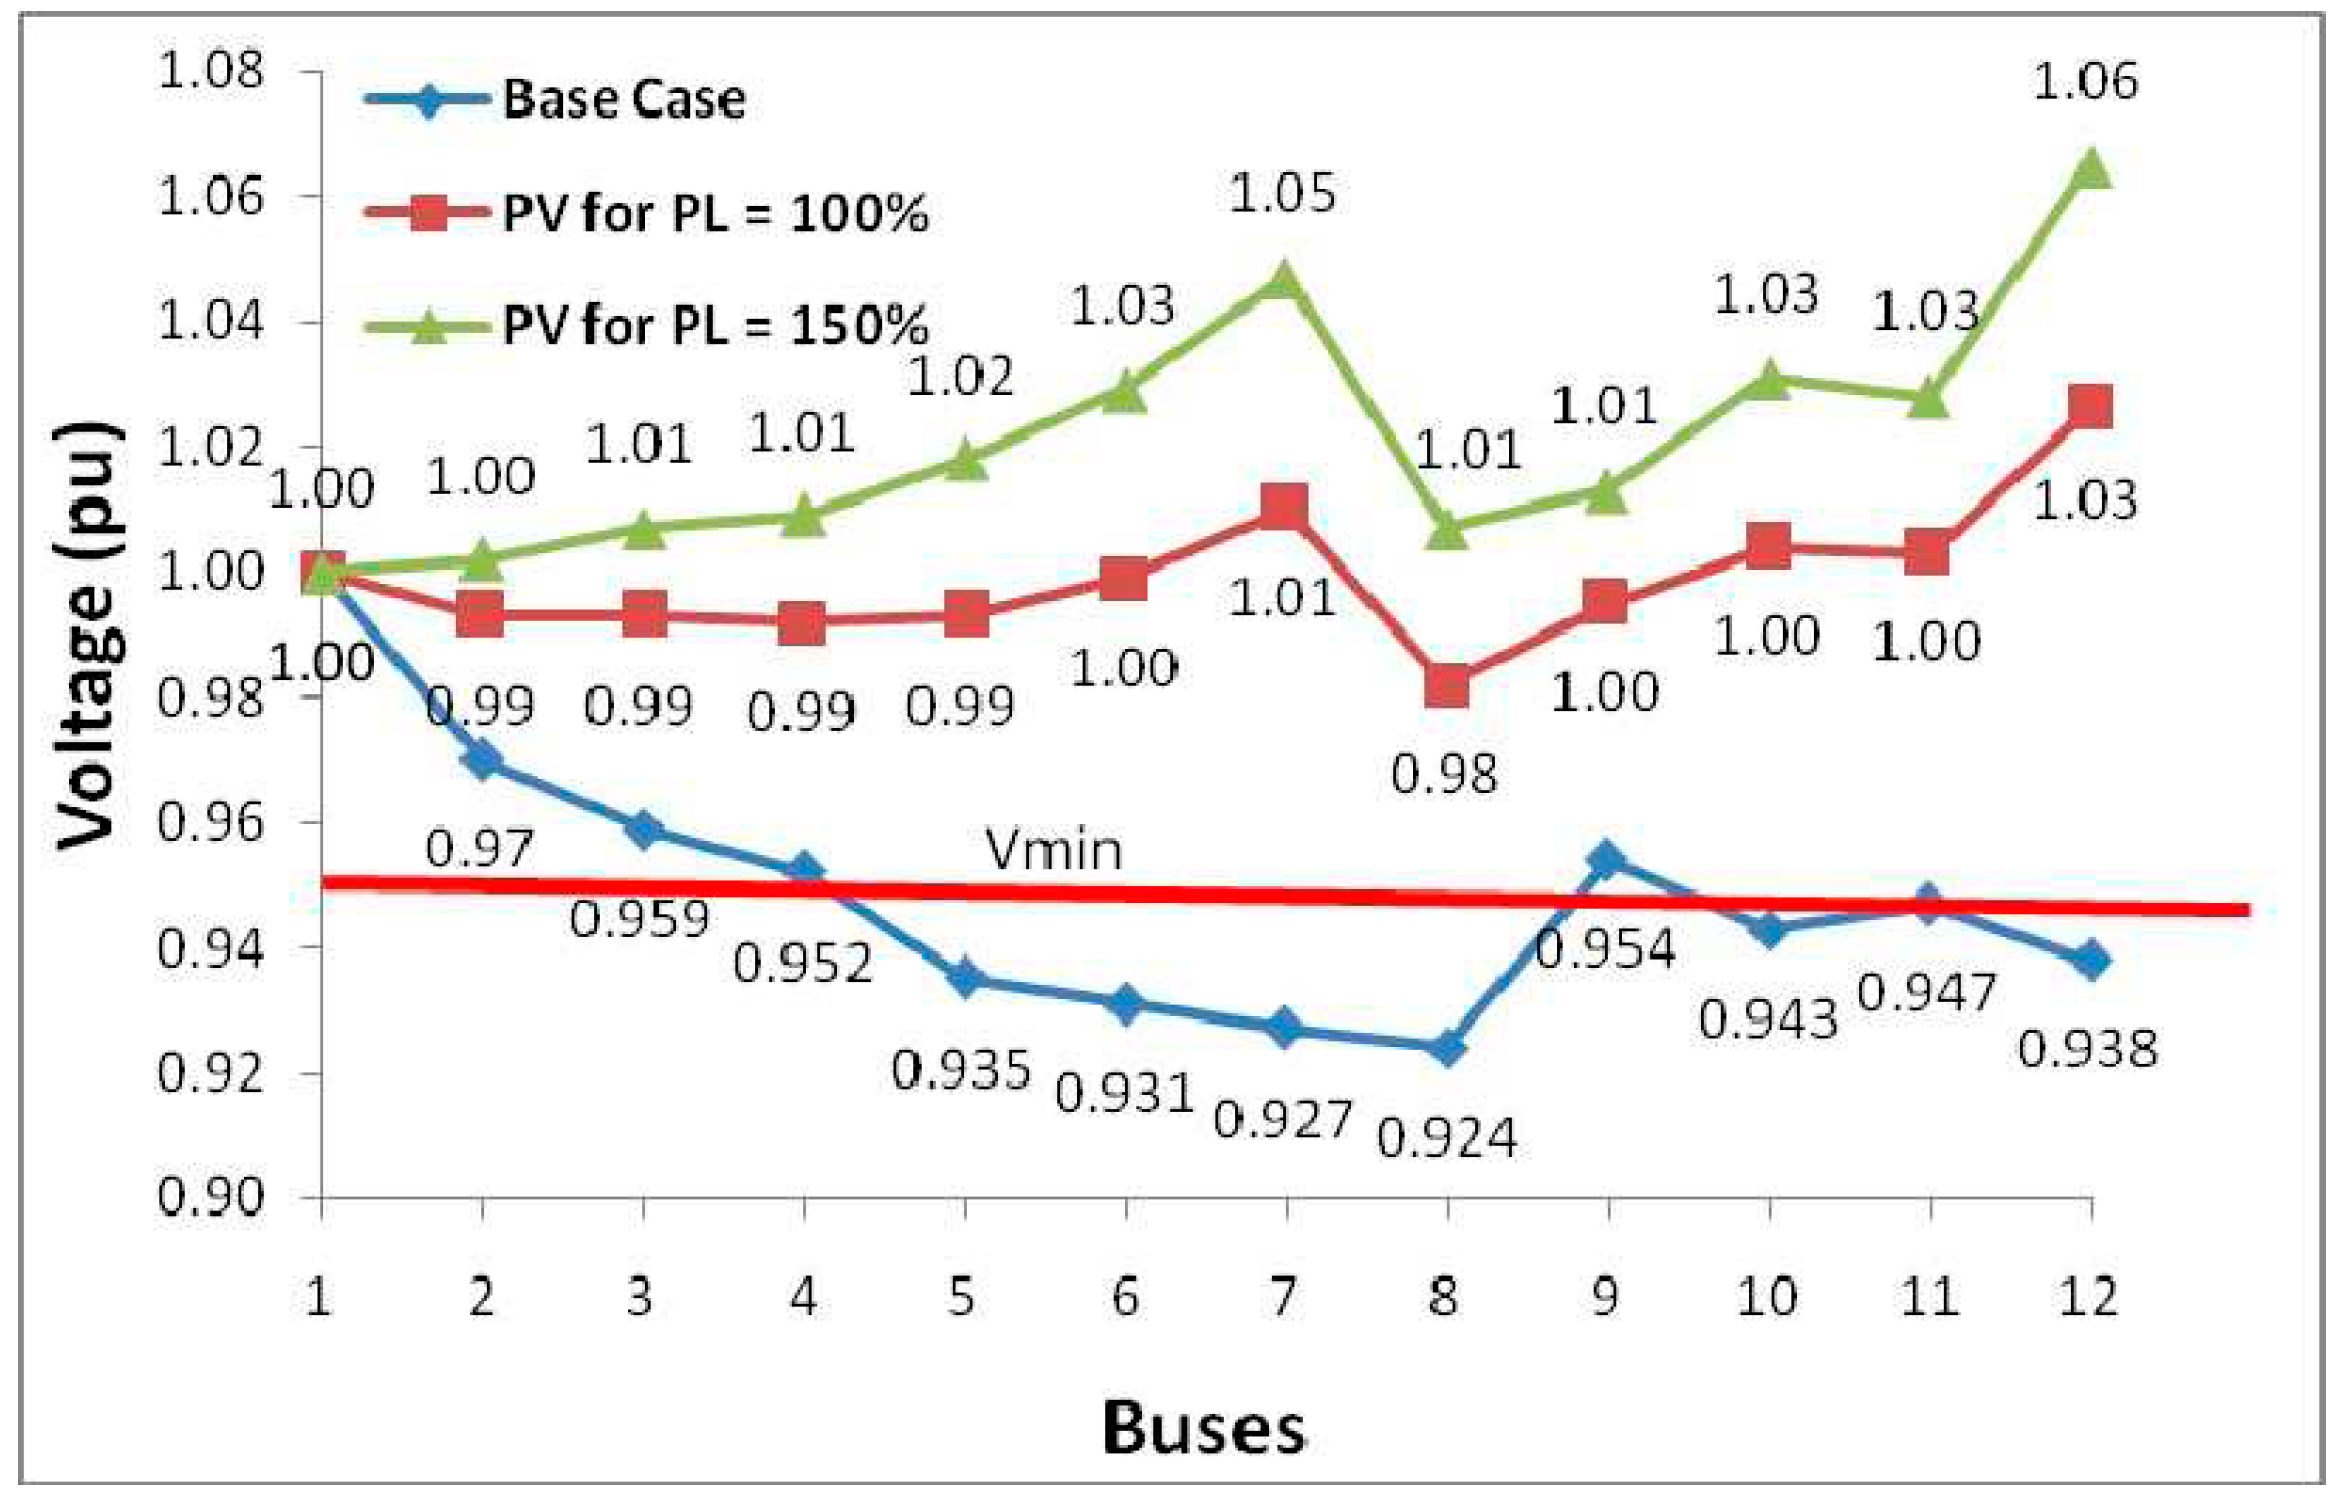
Figure 8 shows a graphical representation of the modeling results with respect to the bus voltage. The voltage in all bars increased as the PI and the voltage increased the busbars reached by the generators, bars 7, 10, and 12 are higher than their voltage other bars regardless of the level of penetration, so that the voltage in the bus 12 PI = 150% has exceeded the maximum allowed penetration [
28].
Figure 7.
Voltages of the test grid assembly bars with and without static distributor generation for indications different penetration.
Figure 7.
Voltages of the test grid assembly bars with and without static distributor generation for indications different penetration.
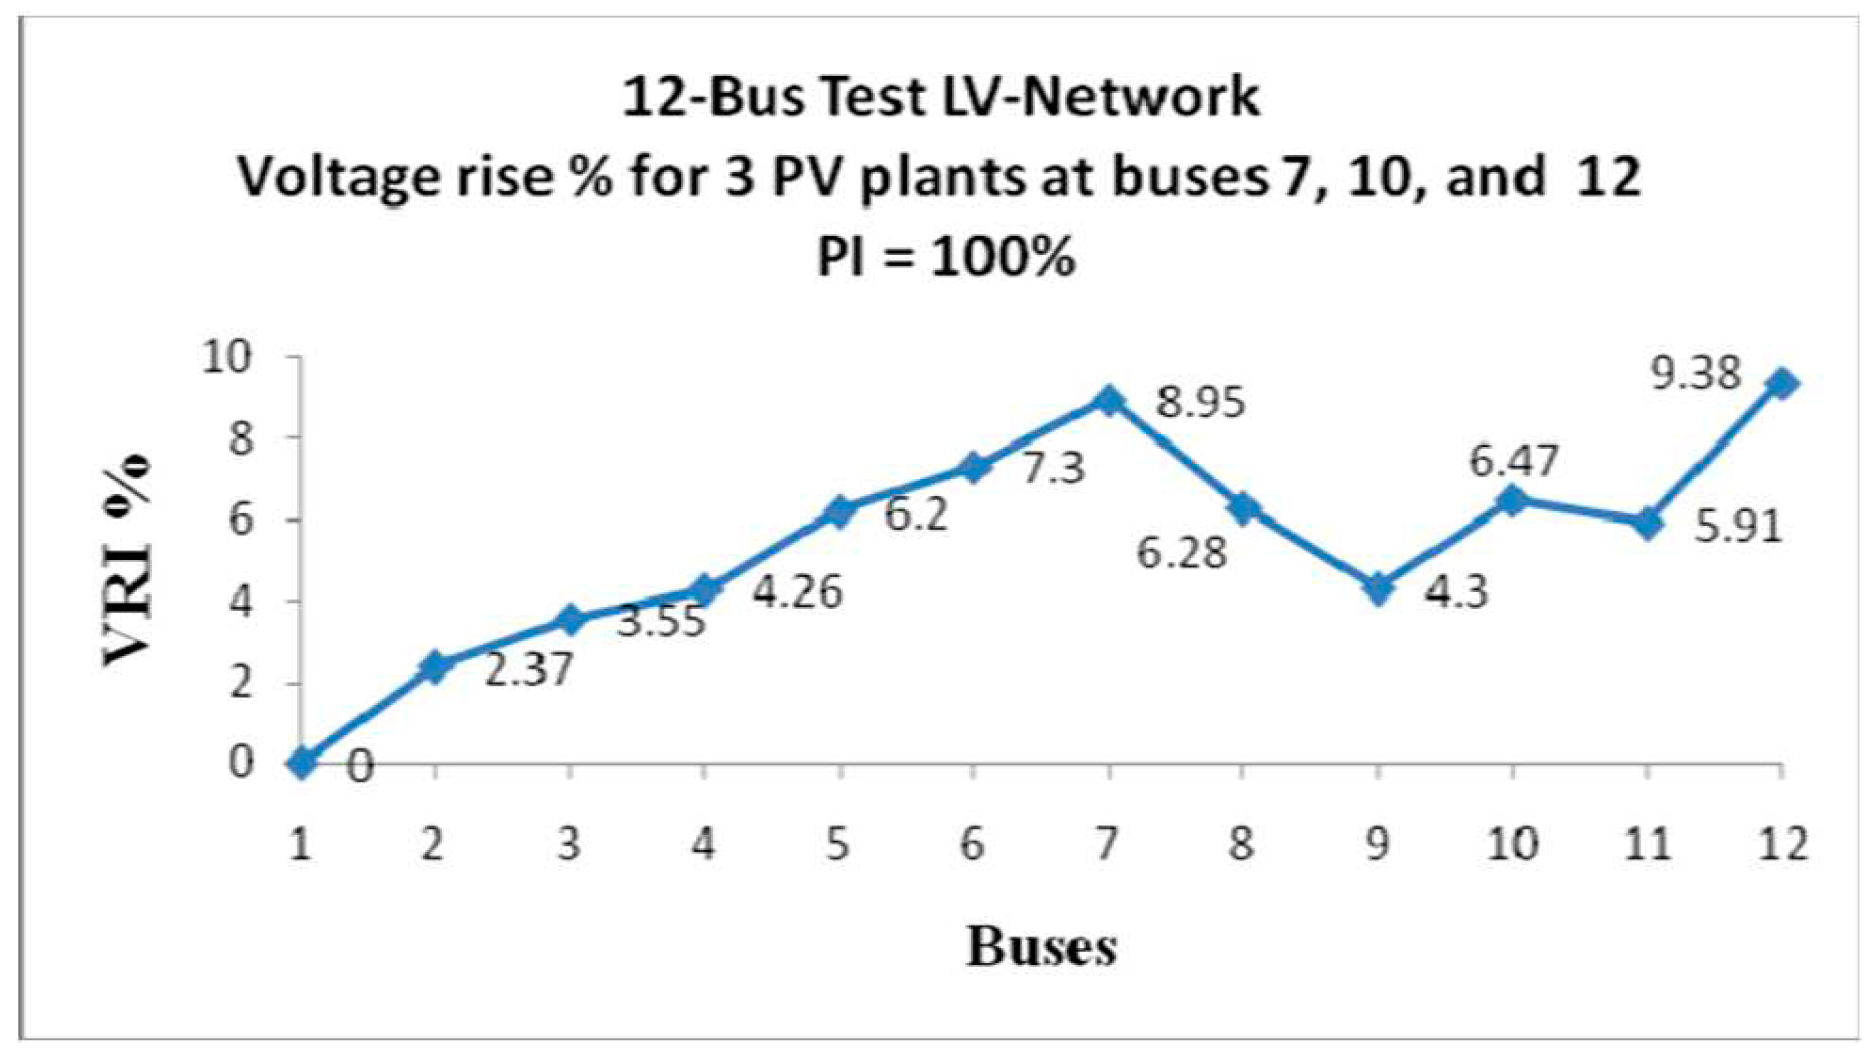
Because one of the dangers of static distributed generation is the possibility overvoltage allowable, showed in
Figure 8 the VRI values for all bars to order Penetration of 100% [
29]. That the three generators have caused an increase in the voltage index in proportions ranging from 2% to 9%, the voltages of the bars are all within the normal limits (0.95-1.05pu). (The reason for the high voltage is clearly the injection of actual power into distributed generator bars (tested distributed generators operate at a power factor of 1 do not inject reactive power) and its flow on the lines in the opposite direction of the original. And it could the following approximation also provides a mathematical explanation for the tension rise V (Δ) in units due to distributed generator
Where P is the effective output power of the distributed generator, Q is the reactive output power of the generator, the distributor, R is the resistance of the circuit, X is the inductive reactance of the circuit, V is the nominal voltage of the circuit [
30,
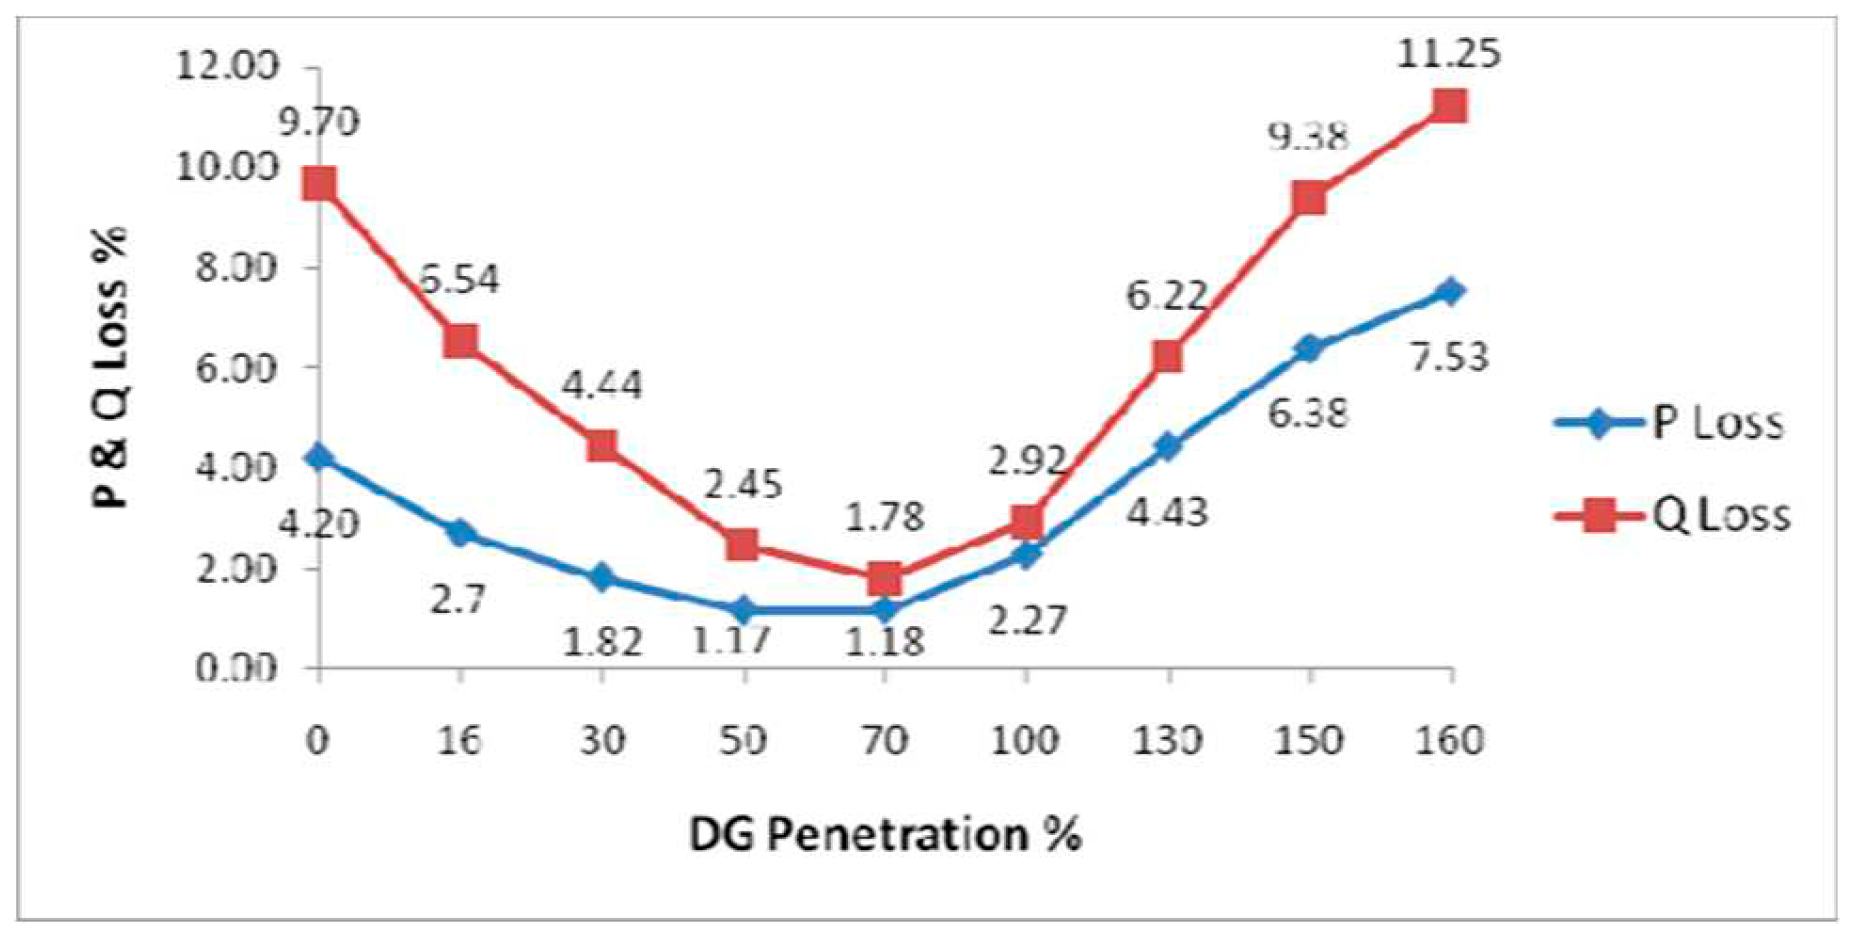
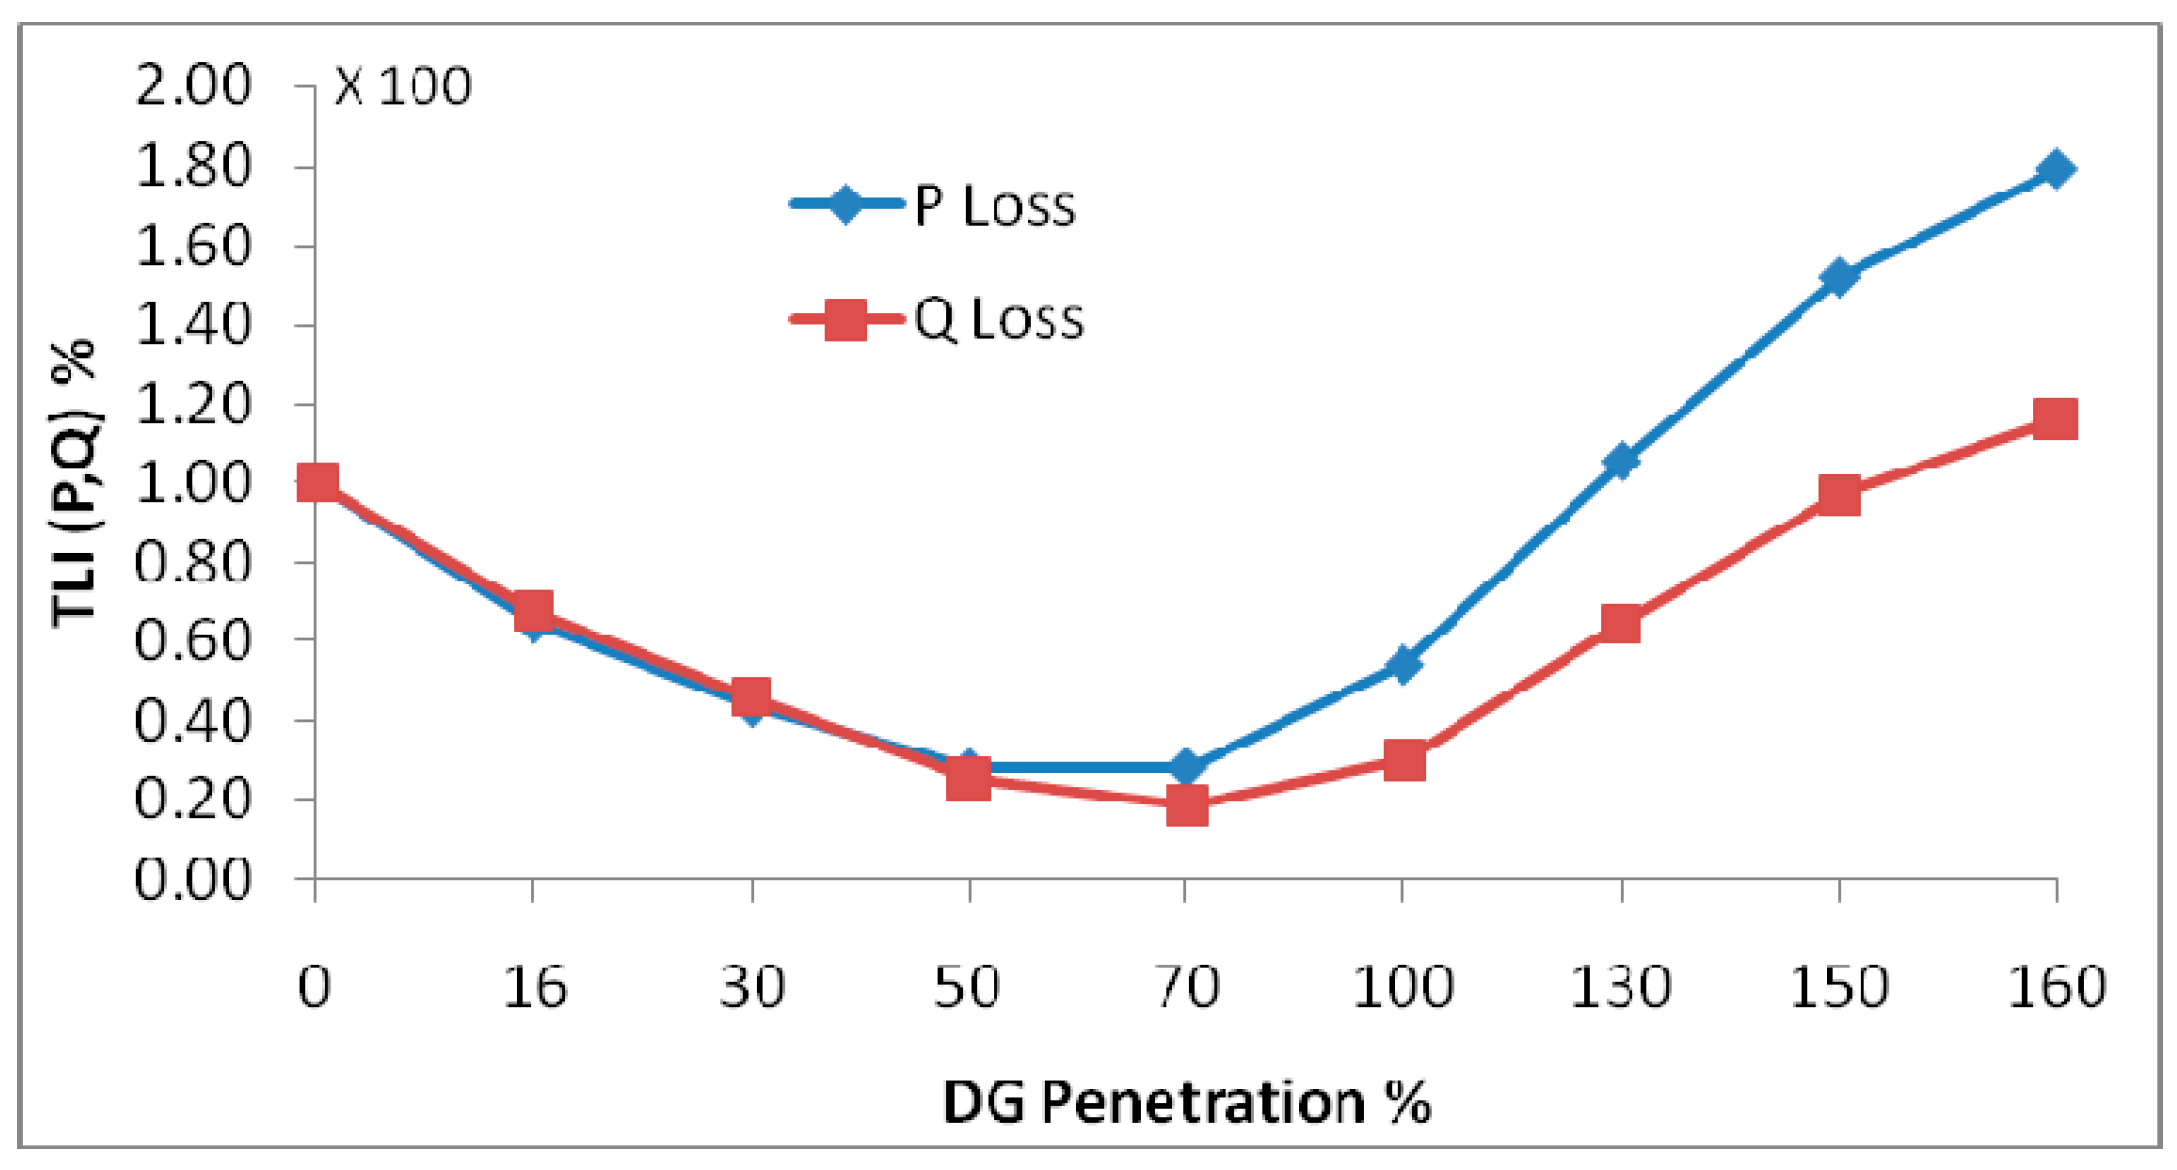
31]. Power losses were calculated for reentrance indicators from 0% below DG up to 160%.
Figure 8 shows that both the actual loss percentage and the reactive loss percentage decrease with the increase of the distributed generation only to a certain extent, after which the loss increases due to the increase in the values of the power fluxes in network branches. Also, the minimum actual loss percentage occurs before the minimum retaliatory loss percentage by approximately 20% penetration. The reason for this is that the resistance values of the branches are greater than its reactors [
32].
Figure 8.
Voltage surge index values for 100% penetration of static distributed generation.
Figure 8.
Voltage surge index values for 100% penetration of static distributed generation.
Figure 9.
the effective and reactive power loss indices are subordinated to the DG penetration index of the test network.
Figure 9.
the effective and reactive power loss indices are subordinated to the DG penetration index of the test network.
Calculated the loss index Q, P (TLI)
Figure 10. It was noted that the two curves are almost identical for penetrations up to 50%, that is, the actual loss and the reactive loss relative to the loss without DG decrease equally, and for penetrations greater than 50%, P (TLI) takes values greater than Q (TLI). Starting from a penetration of about 130%, the actual loss with DG becomes greater than the actual loss without DG, while the reactive loss with DG is delayed to exceed the value of the basic loss until the penetration of about 150%. The reason is that X > R for cable distribution lines [
33,
34].
7. Conclusion
Increasing the scattering index for conventional static and wind distributed generation for a penetration index a constant that enhances the improvement of the stress change curve is directly proportional to the first and indeterminate to the second. But Caution must be exercised against the risk of voltage raising above the permissible limit in the generating assembly bars the static of strong distribution networks when the penetration index exceeds a certain threshold. For networks weak distributions this threshold is higher depending on its original stress change curve. From where power is lost, a higher scattering index for a constant penetration index leads to the actual and reciprocal losses of static distributed generation are progressively decreasing while causing Initial increase in losses in the range 0-20% scattering for conventional wind generation, followed by a decrease in subsequent scattering areas.
8. Future work
Conducting a wide range of performance tests of the algorithms of protection systems for distributed networks with distributed generation
9. Data Availability
The results and data reached in this scientific paper are available to the public - the research can be published as an open source to ensure the possibility of replicating the work and reusability or analysis and discussion of the results to increase the reliability and impact of the scientific paper.
References
- Lavrik, A.; Zhukovskiy, Y.; Tcvetkov, P. Optimizing the Size of Autonomous Hybrid Microgrids with Regard to Load Shifting. Energies 2021, 14, 5059. [Google Scholar] [CrossRef]
- Hossein Alizadeh, R.; Shakouri, G.H.; Amalnick, M.S.; Taghipour, P. Economic sizing of a hybrid (PV-WT-FC) renewable energy system (HRES) for stand-alone usages by an optimization-simulation model: Case study of Iran. Renew. Sustain. Energy Rev. 2016, 54, 139–150. [Google Scholar] [CrossRef]
- Sychev, Y.A.; Abramovich, B.N.; Zimin, R.Y.; Kuznetsov, P.A. Mathematical modeling of harmonic correction by parallel active filter in conditions of distributed generation. J. Phys. Conf. Ser. 2019, 1333, 032081. [Google Scholar] [CrossRef]
- IEA. Total Installed Power Capacity by Fuel and Technology 2019–2025. Available online: https://www.iea.org/data-and-statistics/charts/total-installed-power-capacity-by-fuel-and-technology-2019–2025-main-case (accessed on 6 June 2021).
- Belsky, A.A.; Dobush, V.; Haikal, S.F. Operation of a single-phase autonomous inverter as a part of a low-power wind complex. J. Min. Inst. 2019, 239, 564–569. [Google Scholar] [CrossRef]
- Dobush, V.S.; Belsky, A.A.; Skamyin, A.N. Electrical complex for autonomous power supply of oil leakage detection systems in pipelines. J. Phys. Conf. Ser. 2020, 1441, 012021. [Google Scholar] [CrossRef]
- Abramovich, B.N.; Ustinov, D.A.; Abdallah, W.J. Development and design of a mobile power plant in the form of a standalone power supply. J. Phys. Conf. Ser. 2021, 1753, 1–28. [Google Scholar] [CrossRef]
- Lukutin, B.V.; Muravyev, D.I.; Ryzhkova, A.V. The efficiency of combined electrothermal and electrochemical accumulation of electricity of a photovoltaic power plant. In IOP Conference Series: Materials Science and Engineering; IOP Publishing: Bristol, UK, 2021; Volume 1019, p. 012053. [Google Scholar]
- Chauhan, A.; Saini, R.P. Size optimization and demand response of a stand-alone integrated renewable energy system. Energy 2017, 124, 59–73. [Google Scholar] [CrossRef]
- Sychev, Y.A., Aladin, M.E., Aleksandrovich, S.V. «Developing a hybrid filter structure and a control algorithm for hybrid power supply», International Journal of Power Electronics and Drive Systems, 2022, 13(3), pp. 1625–1634. [CrossRef]
- Voronin V. A., Nepsha F. S. (2020). Simulation of the electric drive of the shearer to assess the energy efficiency indicators of the power supply system. Journal of Mining Institute, 246, 633-639. [CrossRef]
- Skamyin, A.; Belsky, A.; Dobush, V.; Gurevich, I. Computation of Nonlinear Load Harmonic Currents in the Presence of External Distortions. Computation 2022, 10. [Google Scholar] [CrossRef]
- Sychev , Y. A., & Zimin , R. Y. (2021). Improving the quality of electricity in the power supply systems of the mineral resource complex with hybrid filter-compensating devices. Journal of Mining Institute, 247, 132-140. [CrossRef]
- Shklyarskiy, Y.; Dobush, I.; Jiménez Carrizosa, M.; Dobush, V.; Skamyin, A. Method for Evaluation of the Utility’s and Consumers’ Contribution to the Current and Voltage Distortions at the PCC. Energies 2021, 14, 8416. [Google Scholar] [CrossRef]
- Turysheva, A.; Voytyuk, I.; Guerra, D. Estimation of Electricity Generation by an Electro-Technical Complex with Photoelectric Panels Using Statistical Methods. Symmetry 2021, 13, 1278. [Google Scholar] [CrossRef]
- Koteleva, N.I.; Korolev, N.A.; Zhukovskiy, Y.L. Identification of the Technical Condition of Induction Motor Groups by the Total Energy Flow. Energies 2021, 14, 6677. [Google Scholar] [CrossRef]
- Tcvetkov, P. Climate Policy Imbalance in the Energy Sector: Time to Focus on the Value of CO2 Energies 2021, 14, 411. [CrossRef]
- Sychev Yuriy A. , Abramovich B. N., Prokhorova V. B. The assessment of the shunt active filter efficiency under varied power supply source and load parameters International Journal of Electrical and Computer Engineering. 2020. №10. pp. 5621-5630. http://ijece.iaescore.com/index.php/IJECE/article/view/21315/14344.
- Vasiliev B. Y. , Kozyaruk A. E., Mardashov D. V. Increasing the Utilization Factor of an Autonomous Inverter under Space Vector Control Russian Electrical Engineering. 2020. №4. pp. 247-254. https://link.springer.com/article/10.3103/S1068371220040082.
- Zhukovskiy, Y.L.; Batueva, D.E.; Buldysko, A.D.; Gil, B.; Starshaia, V.V. Fossil Energy in the Framework of Sustainable Development: Analysis of Prospects and Development of Forecast Scenarios. Energies 2021, 14, 5268. [Google Scholar] [CrossRef]
- Shklyarskiy, Y.; Hanzelka, Z.; Skamyin, A. Experimental Study of Harmonic Influence on Electrical Energy Metering. Energies 2020, 13, 5536. [Google Scholar] [CrossRef]
- Yuriy L. Zhukovskiy, Nikolay A. Korolev, Yana M. Malkova (2022) Monitoring of grinding condition in drum mills based on resulting shaft torque. Journal of Mining Institute. Vol 256. p. 686-700. [CrossRef]
- Abramovich , B. N., & Bogdanov , I. A. (2021). Improving the efficiency of autonomous electrical complexes of oil and gas enterprises. Journal of Mining Institute, 249, 408-416. [CrossRef]
- Schipachev A. M., Dmitrieva A. S. (2021). Application of the resonant energy separation effect at natural gas reduction points in order to improve the energy efficiency of the gas distribution system. Journal of Mining Institute, 248, 253-259. [CrossRef]
- Kharrich, M.; Kamel, S.; Abdeen, M.; Mohammed, O.H. Developed approach based on equilibrium optimizer for optimal design of hybrid PV/Wind/Diesel/Battery microgrid in Dakhla, Morocco. IEEE Access 2021, 9, 13655–13670. [Google Scholar] [CrossRef]
- Fleck, B.; Huot, M. Comparative life-cycle assessment of a small wind turbine for residential off-grid use. Renew. Energy 2009, 34, 2688–2696. [Google Scholar] [CrossRef]
- Dufo-López, R.; Bernal-Agustín, J.L.; Domínguez-Navarro, J.A. Generation management using batteries in wind farms: Economical and technical analysis for Spain. Energy Policy 2009, 37, 126–139. [Google Scholar] [CrossRef]
- T. Lund: "Analysis of distribution systems with a high penetration of distributed generation ", PhD Thesis at Technical University of Denmark, September 2007.
- Fracisco M. González-Longatt: “Impact of Distributed Generation over Power Losses on Distribution System”, Proceedings of 9th International Conference Electrical Power quality, Barcelona, 9-11 October 2007.
- DIgSILENT GmbH, Germany, Technical Documentation for Power Factory Simulation tool, Copyright 2007. All rights.
- Thong, V. V., Pieter Vermeyen, Johan Driesen, and Ronnie Belmans. "Grid connection aspects of distributed generation." In Proceedings of UIE International conference. 2004.
- Serzhan S.L. Substantiation of the Draghead Application as a Mining Unit in Conditions of Solid Minerals Deep-Sea Mining / S.L.Serzhan, I.S.Trufanova, D.V.Malevannyi // IOP Conference Series: Earth and Environmental Science. 2019. Vol. 272. Iss. 2. P. 1-6. [CrossRef]
- Skamyin A.N. Energy efficiency improving of reactive power compensation devices / A.N.Skamyin, M.S.Kovalchuk // Proceedings of the 2018 IEEE Conference of Russian Young Researchers in Electrical and Electronic Engineering (ElConRus), 29 January – 1 February, 2018, Mos-cow, Russia, 2018. P. 780-783. [CrossRef]
- Ustinov D.A., Aysar A.R. Analysis of the influence of distributed generation facilities on protection systems and voltage conditions: review// Occupational safety in industry. - 2023. - No. 2 - P. 15-20. [CrossRef]
|
Disclaimer/Publisher’s Note: The statements, opinions and data contained in all publications are solely those of the individual author(s) and contributor(s) and not of MDPI and/or the editor(s). MDPI and/or the editor(s) disclaim responsibility for any injury to people or property resulting from any ideas, methods, instructions or products referred to in the content. |
© 2024 by the authors. Licensee MDPI, Basel, Switzerland. This article is an open access article distributed under the terms and conditions of the Creative Commons Attribution (CC BY) license (http://creativecommons.org/licenses/by/4.0/).
