Submitted:
01 February 2024
Posted:
02 February 2024
You are already at the latest version
Abstract
Keywords:
1. Introduction
2. Experimental part
2.1. Materials
2.2. Preparation of graphene oxide (GO)
2.3. Preparation of Chitin Nanocrystals (ChNCs)
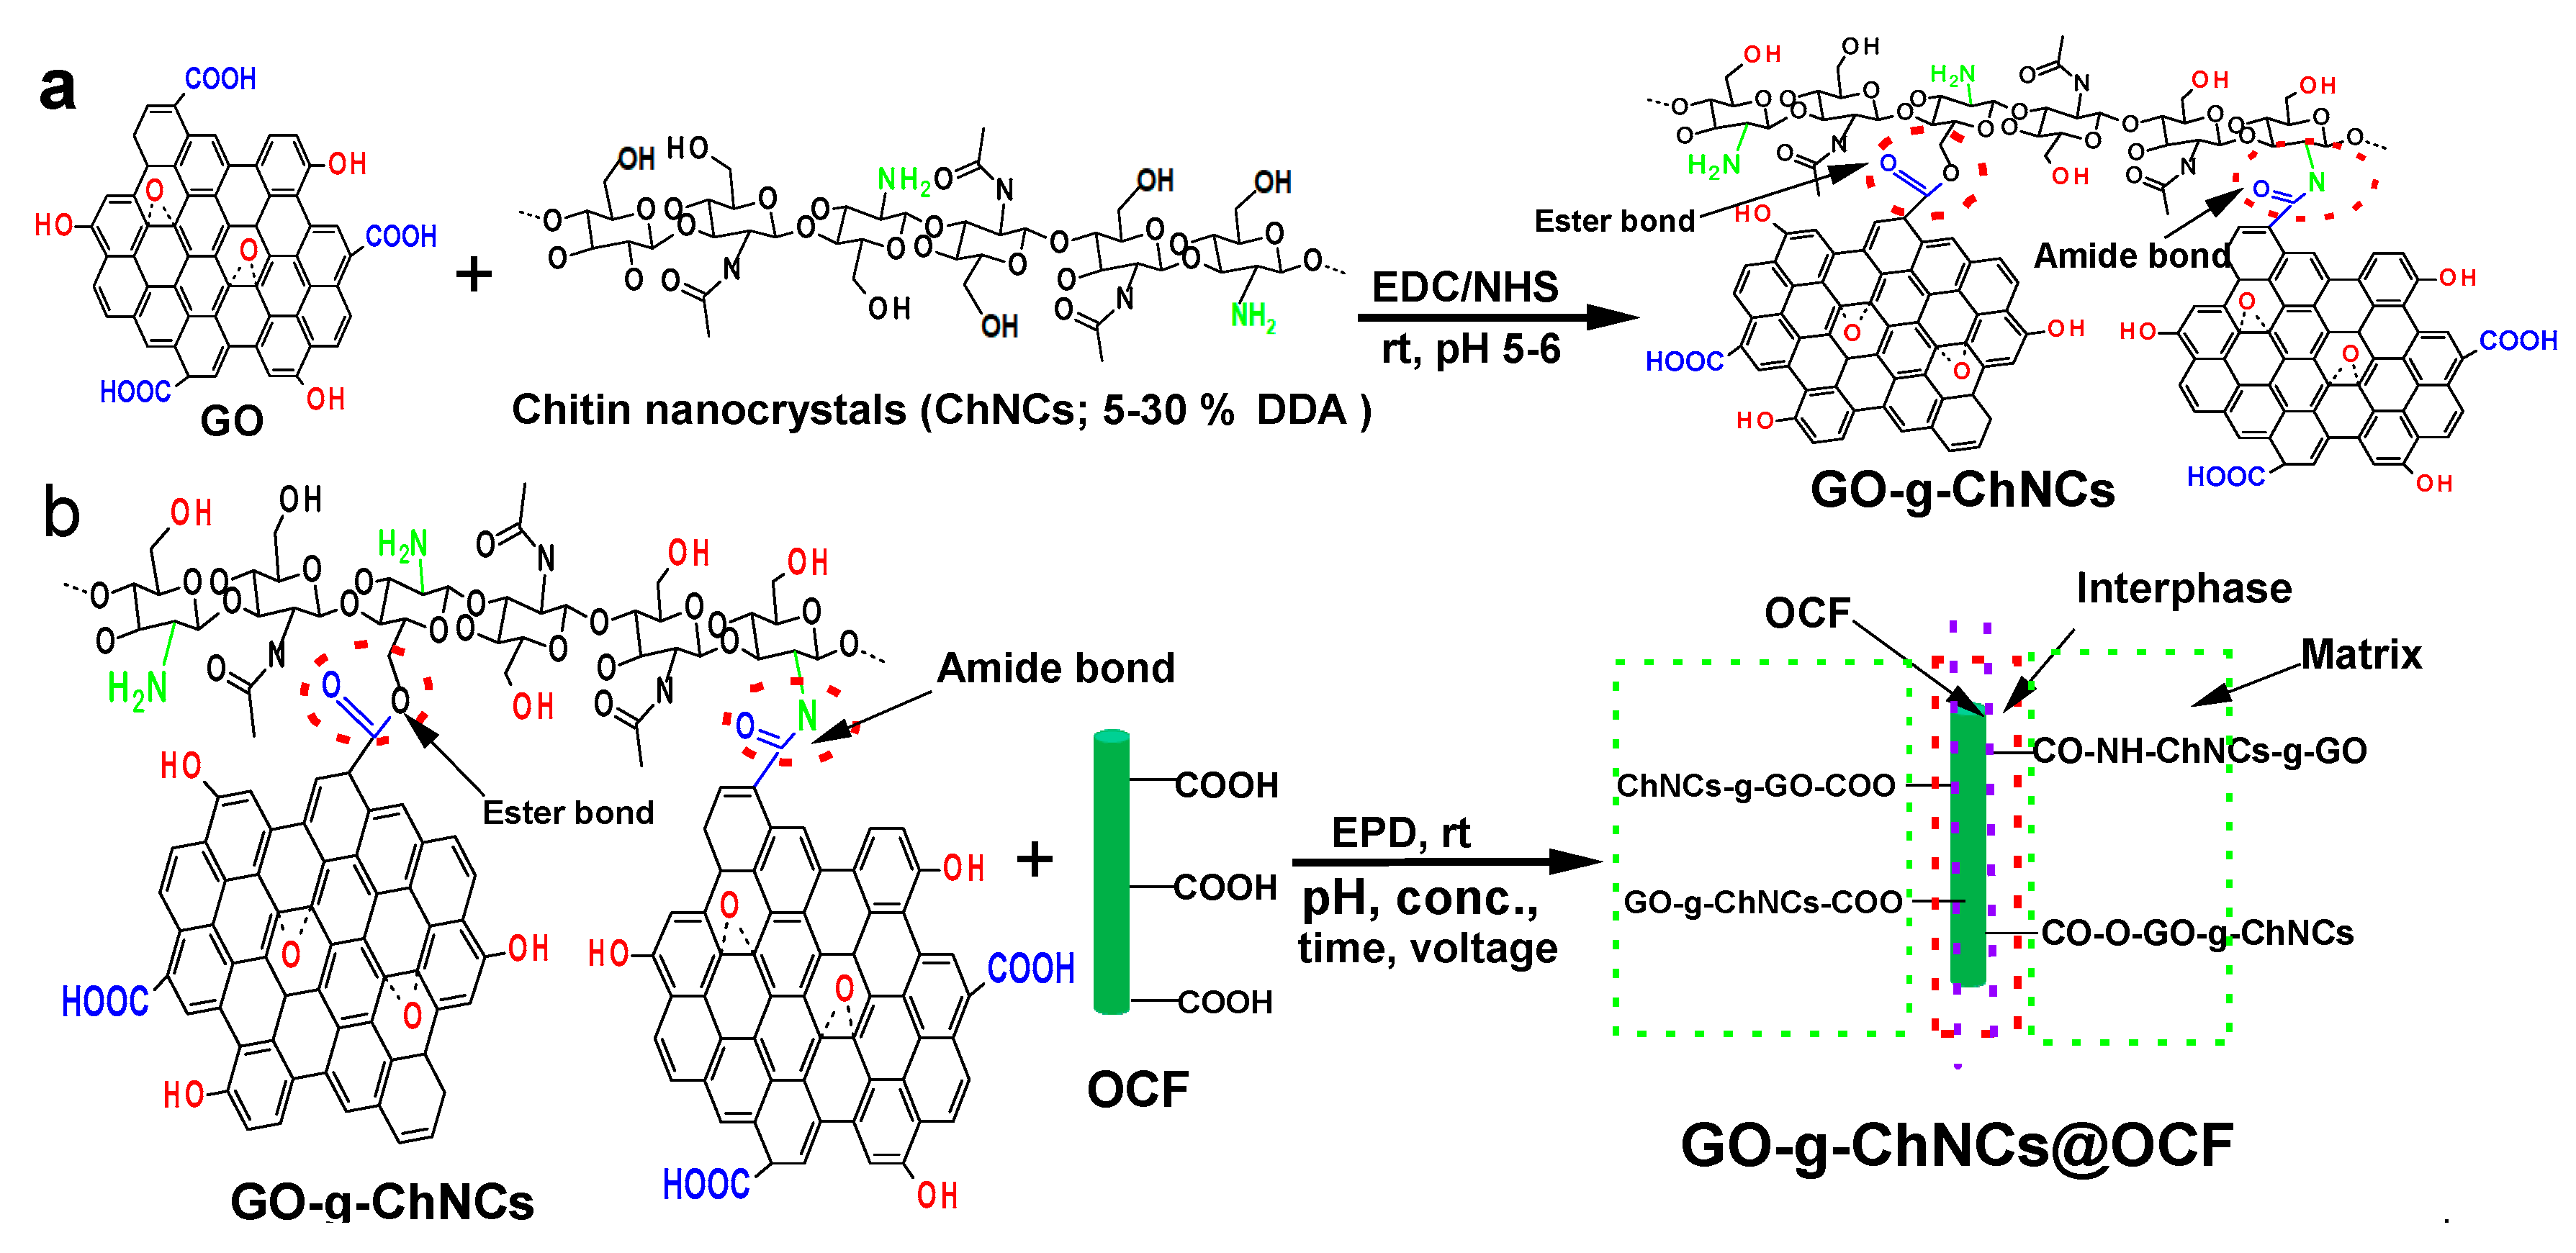
2.4. GO/ChNCs adduct synthesis
2.5. Electrophoretic coating
2.6. Characterization of OCF coated with a GO / CHNC adduct
3. Results and discussions
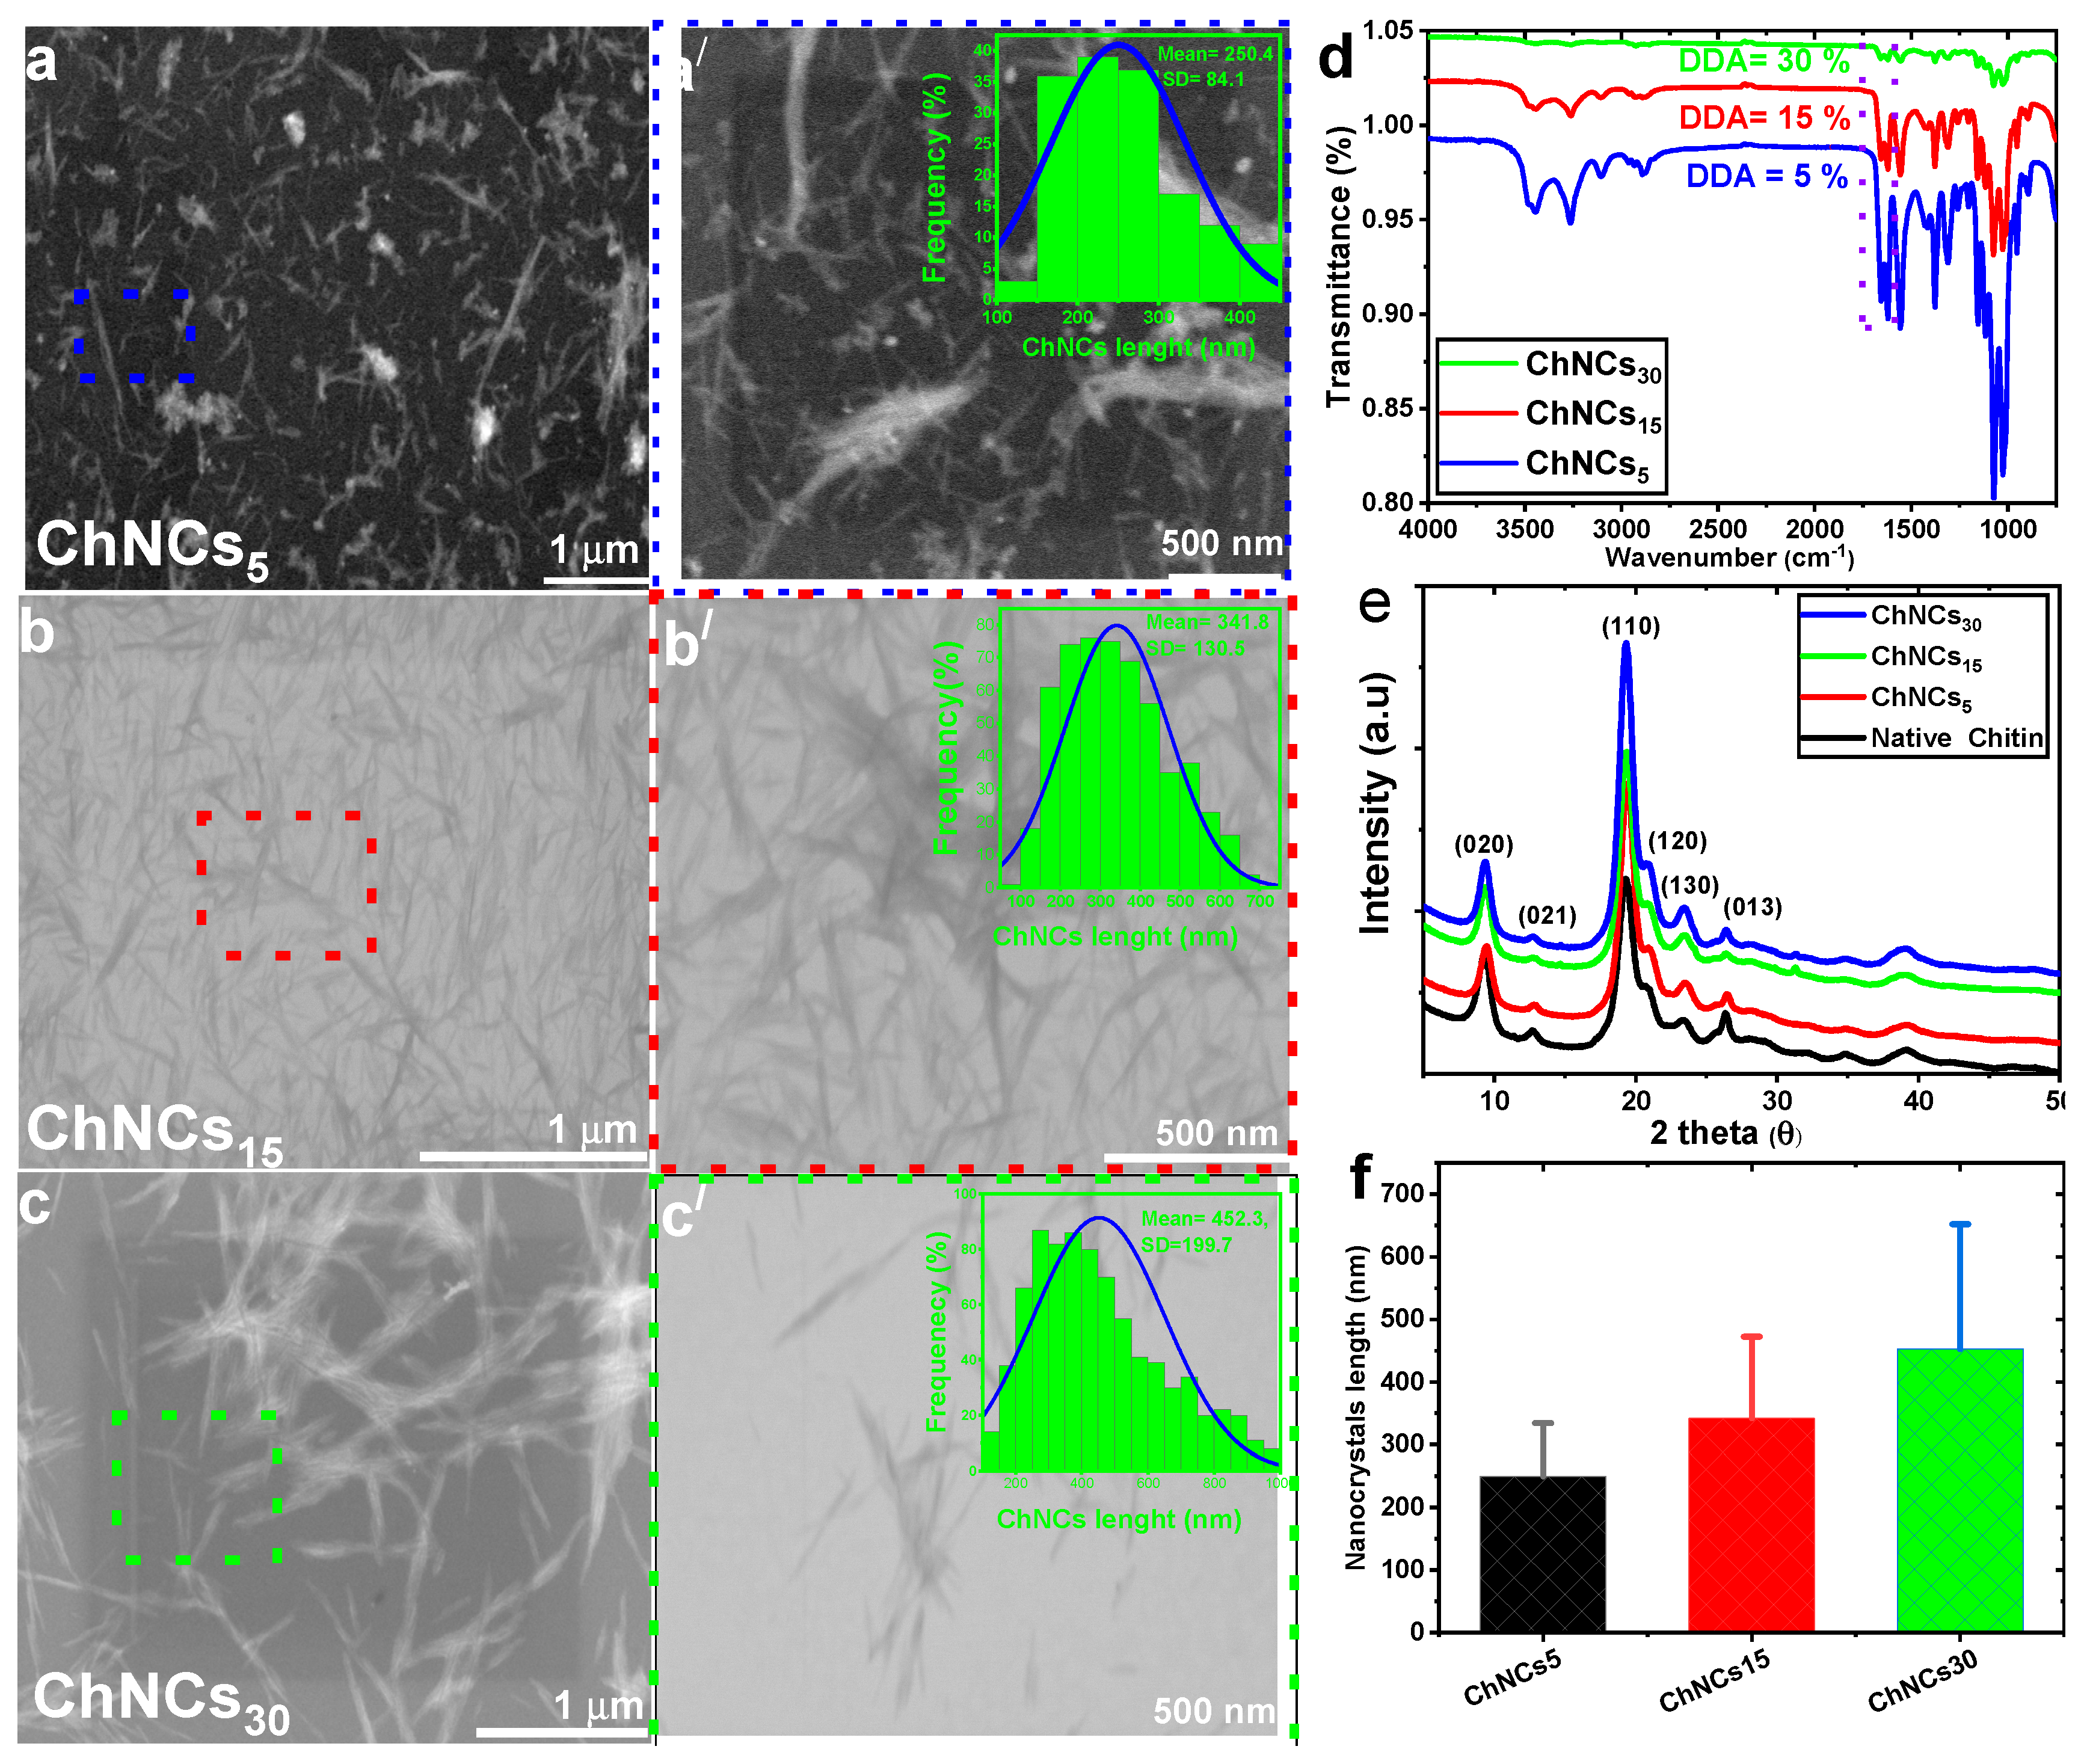
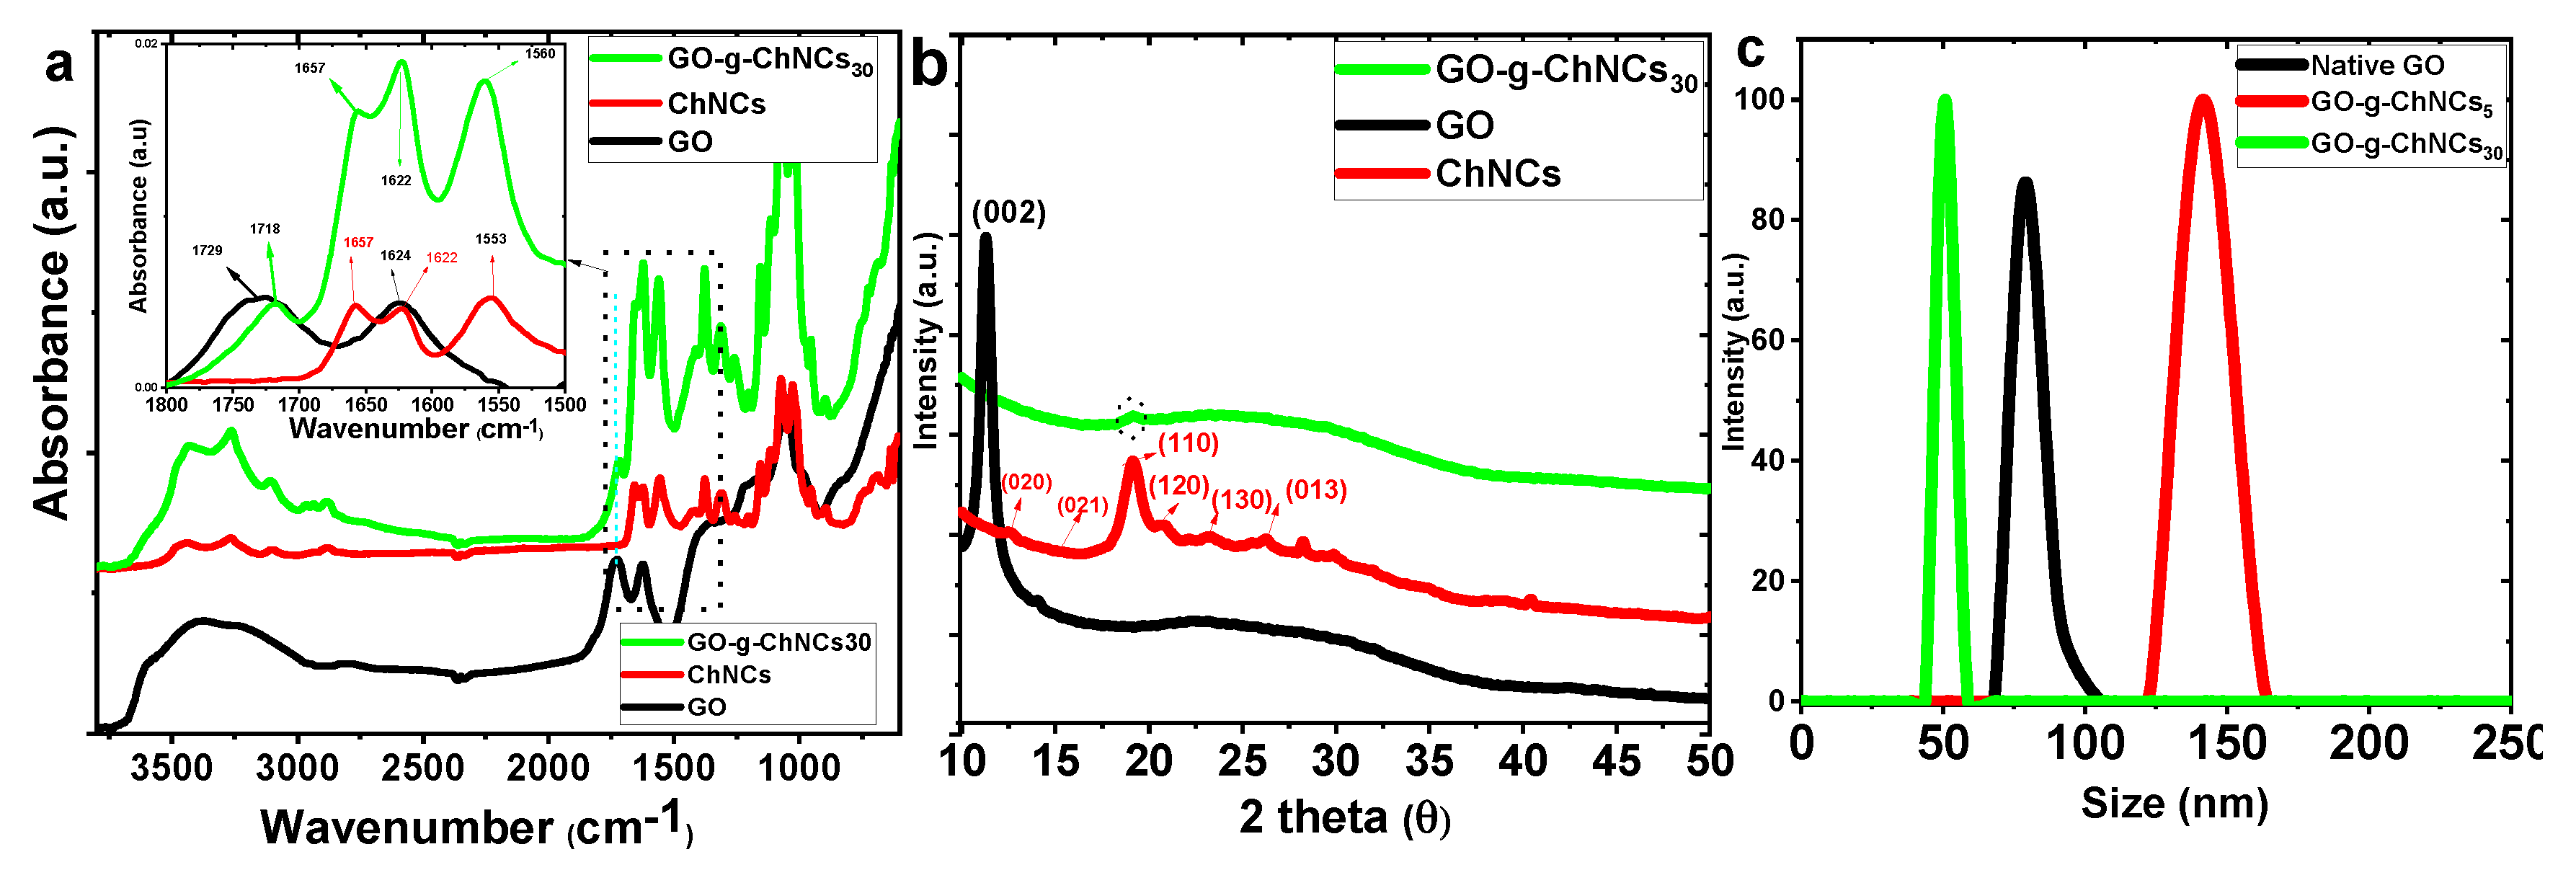
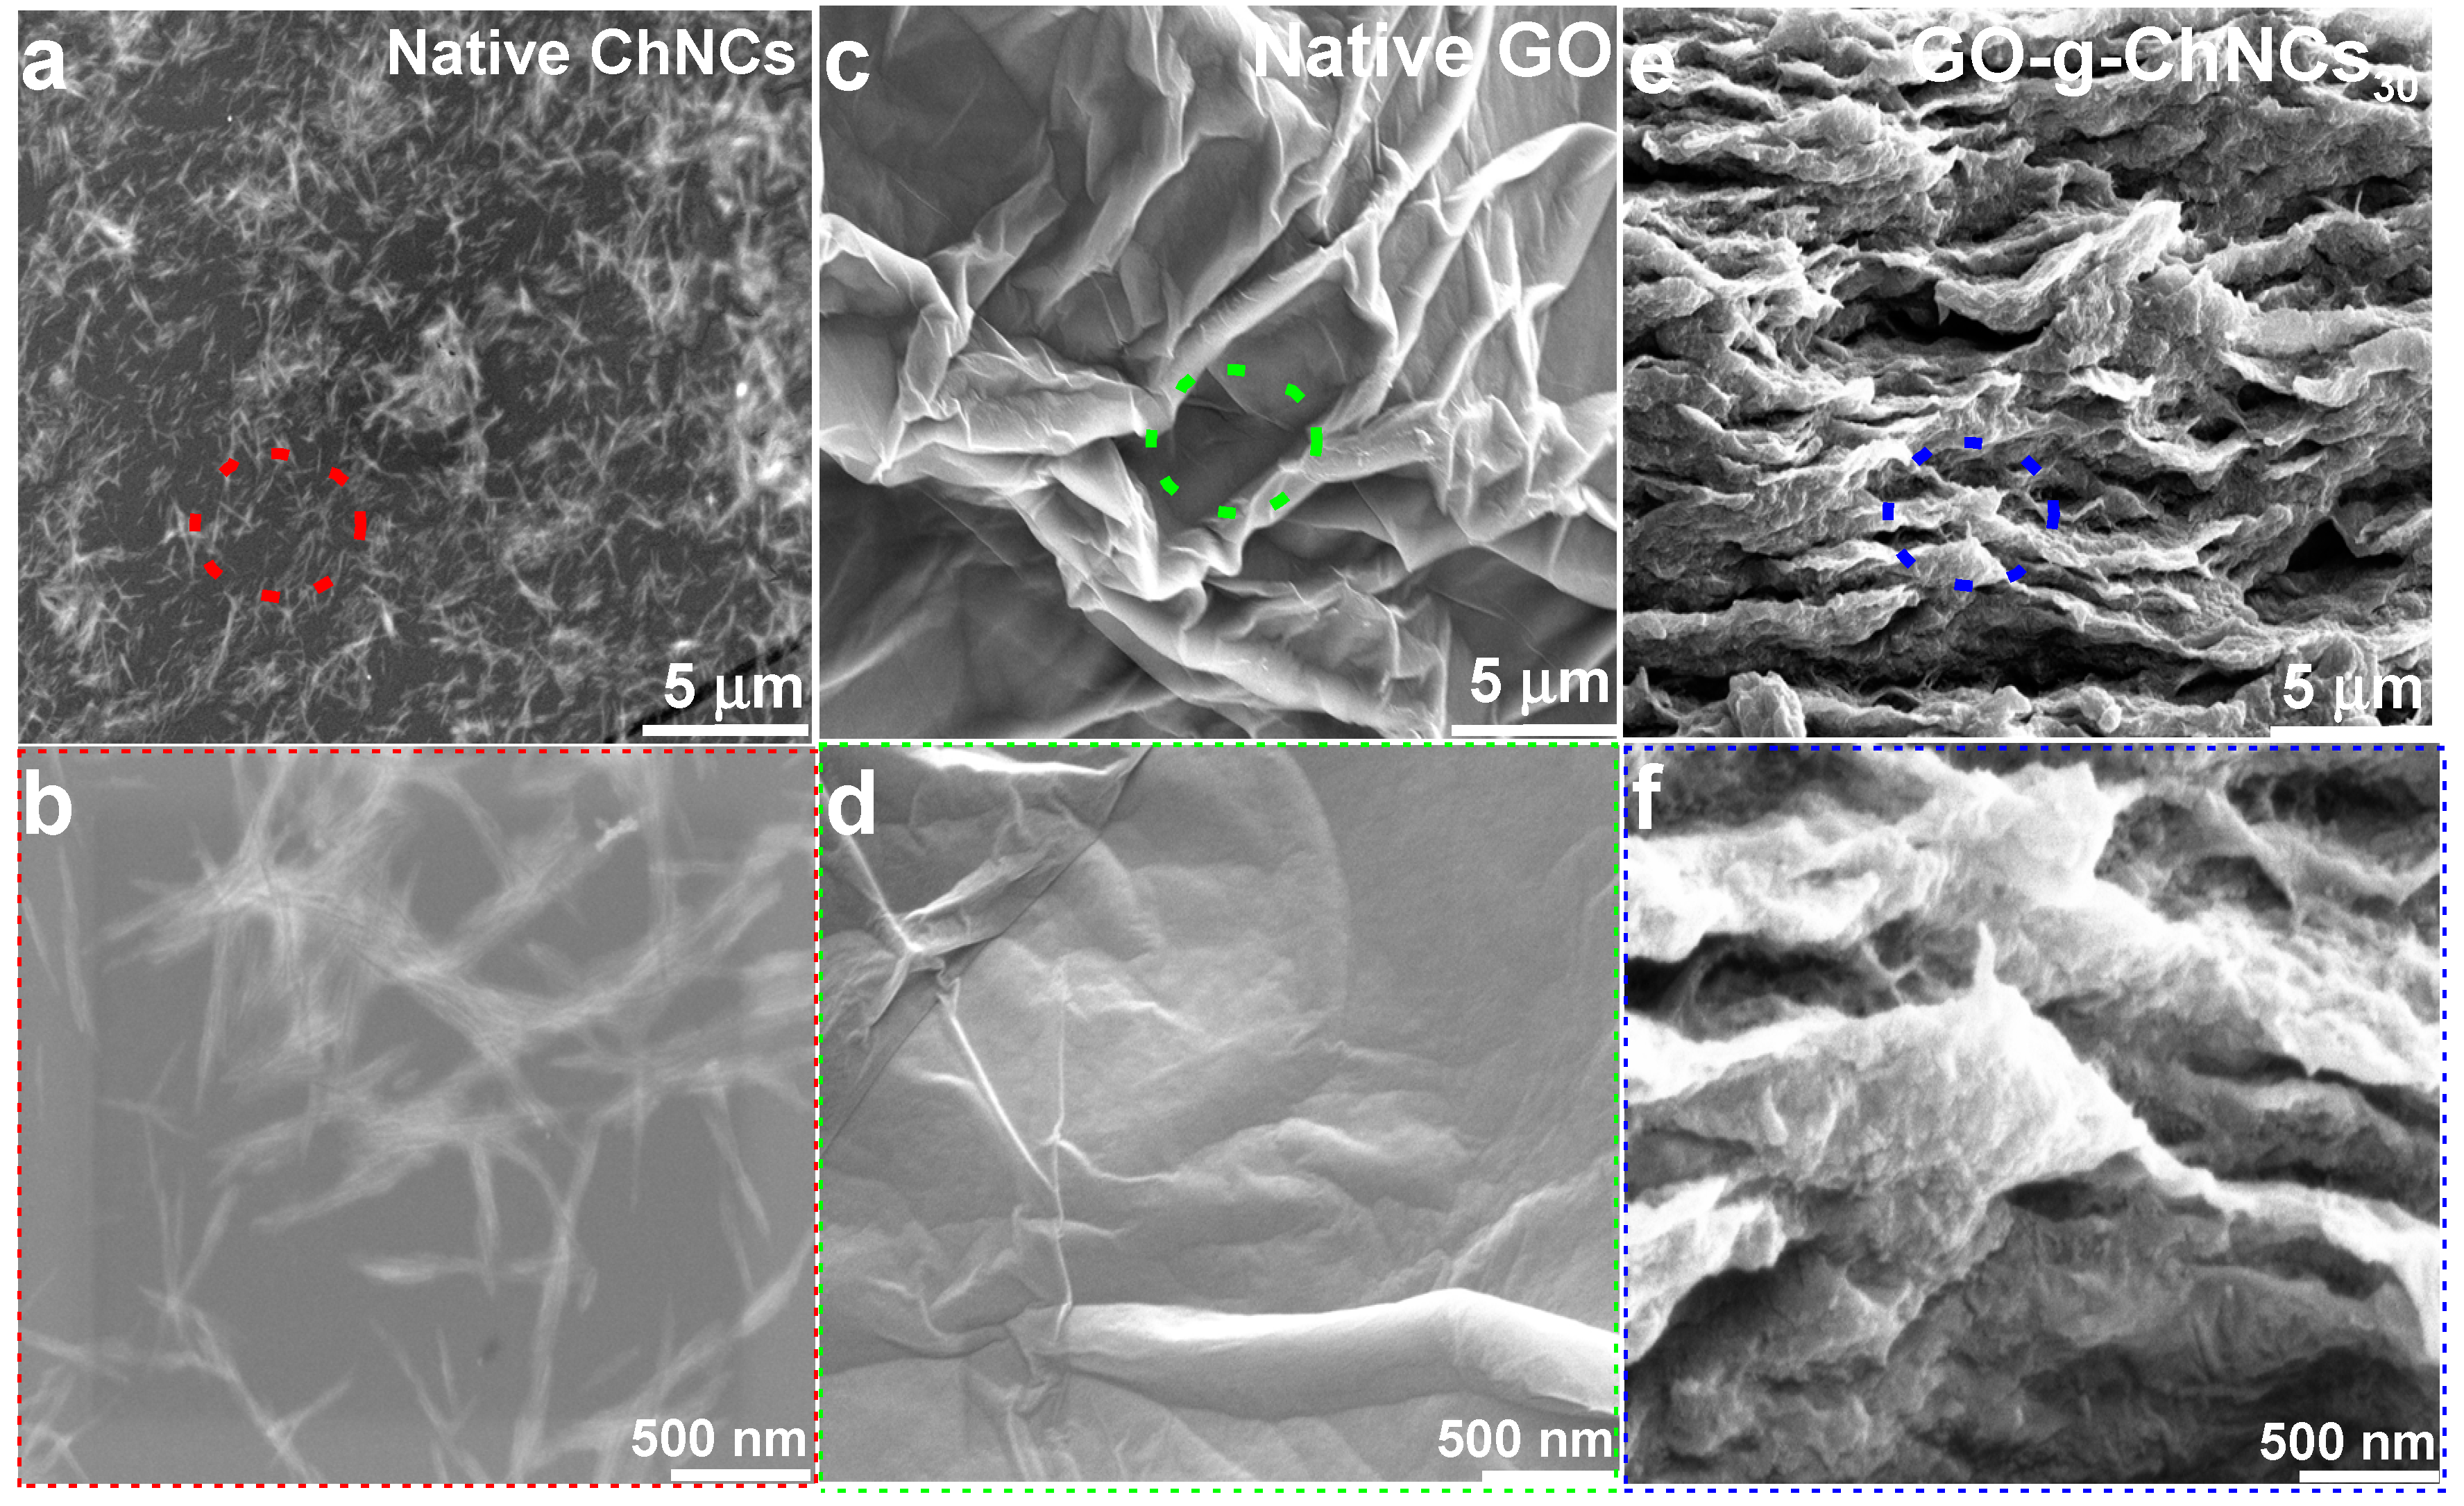
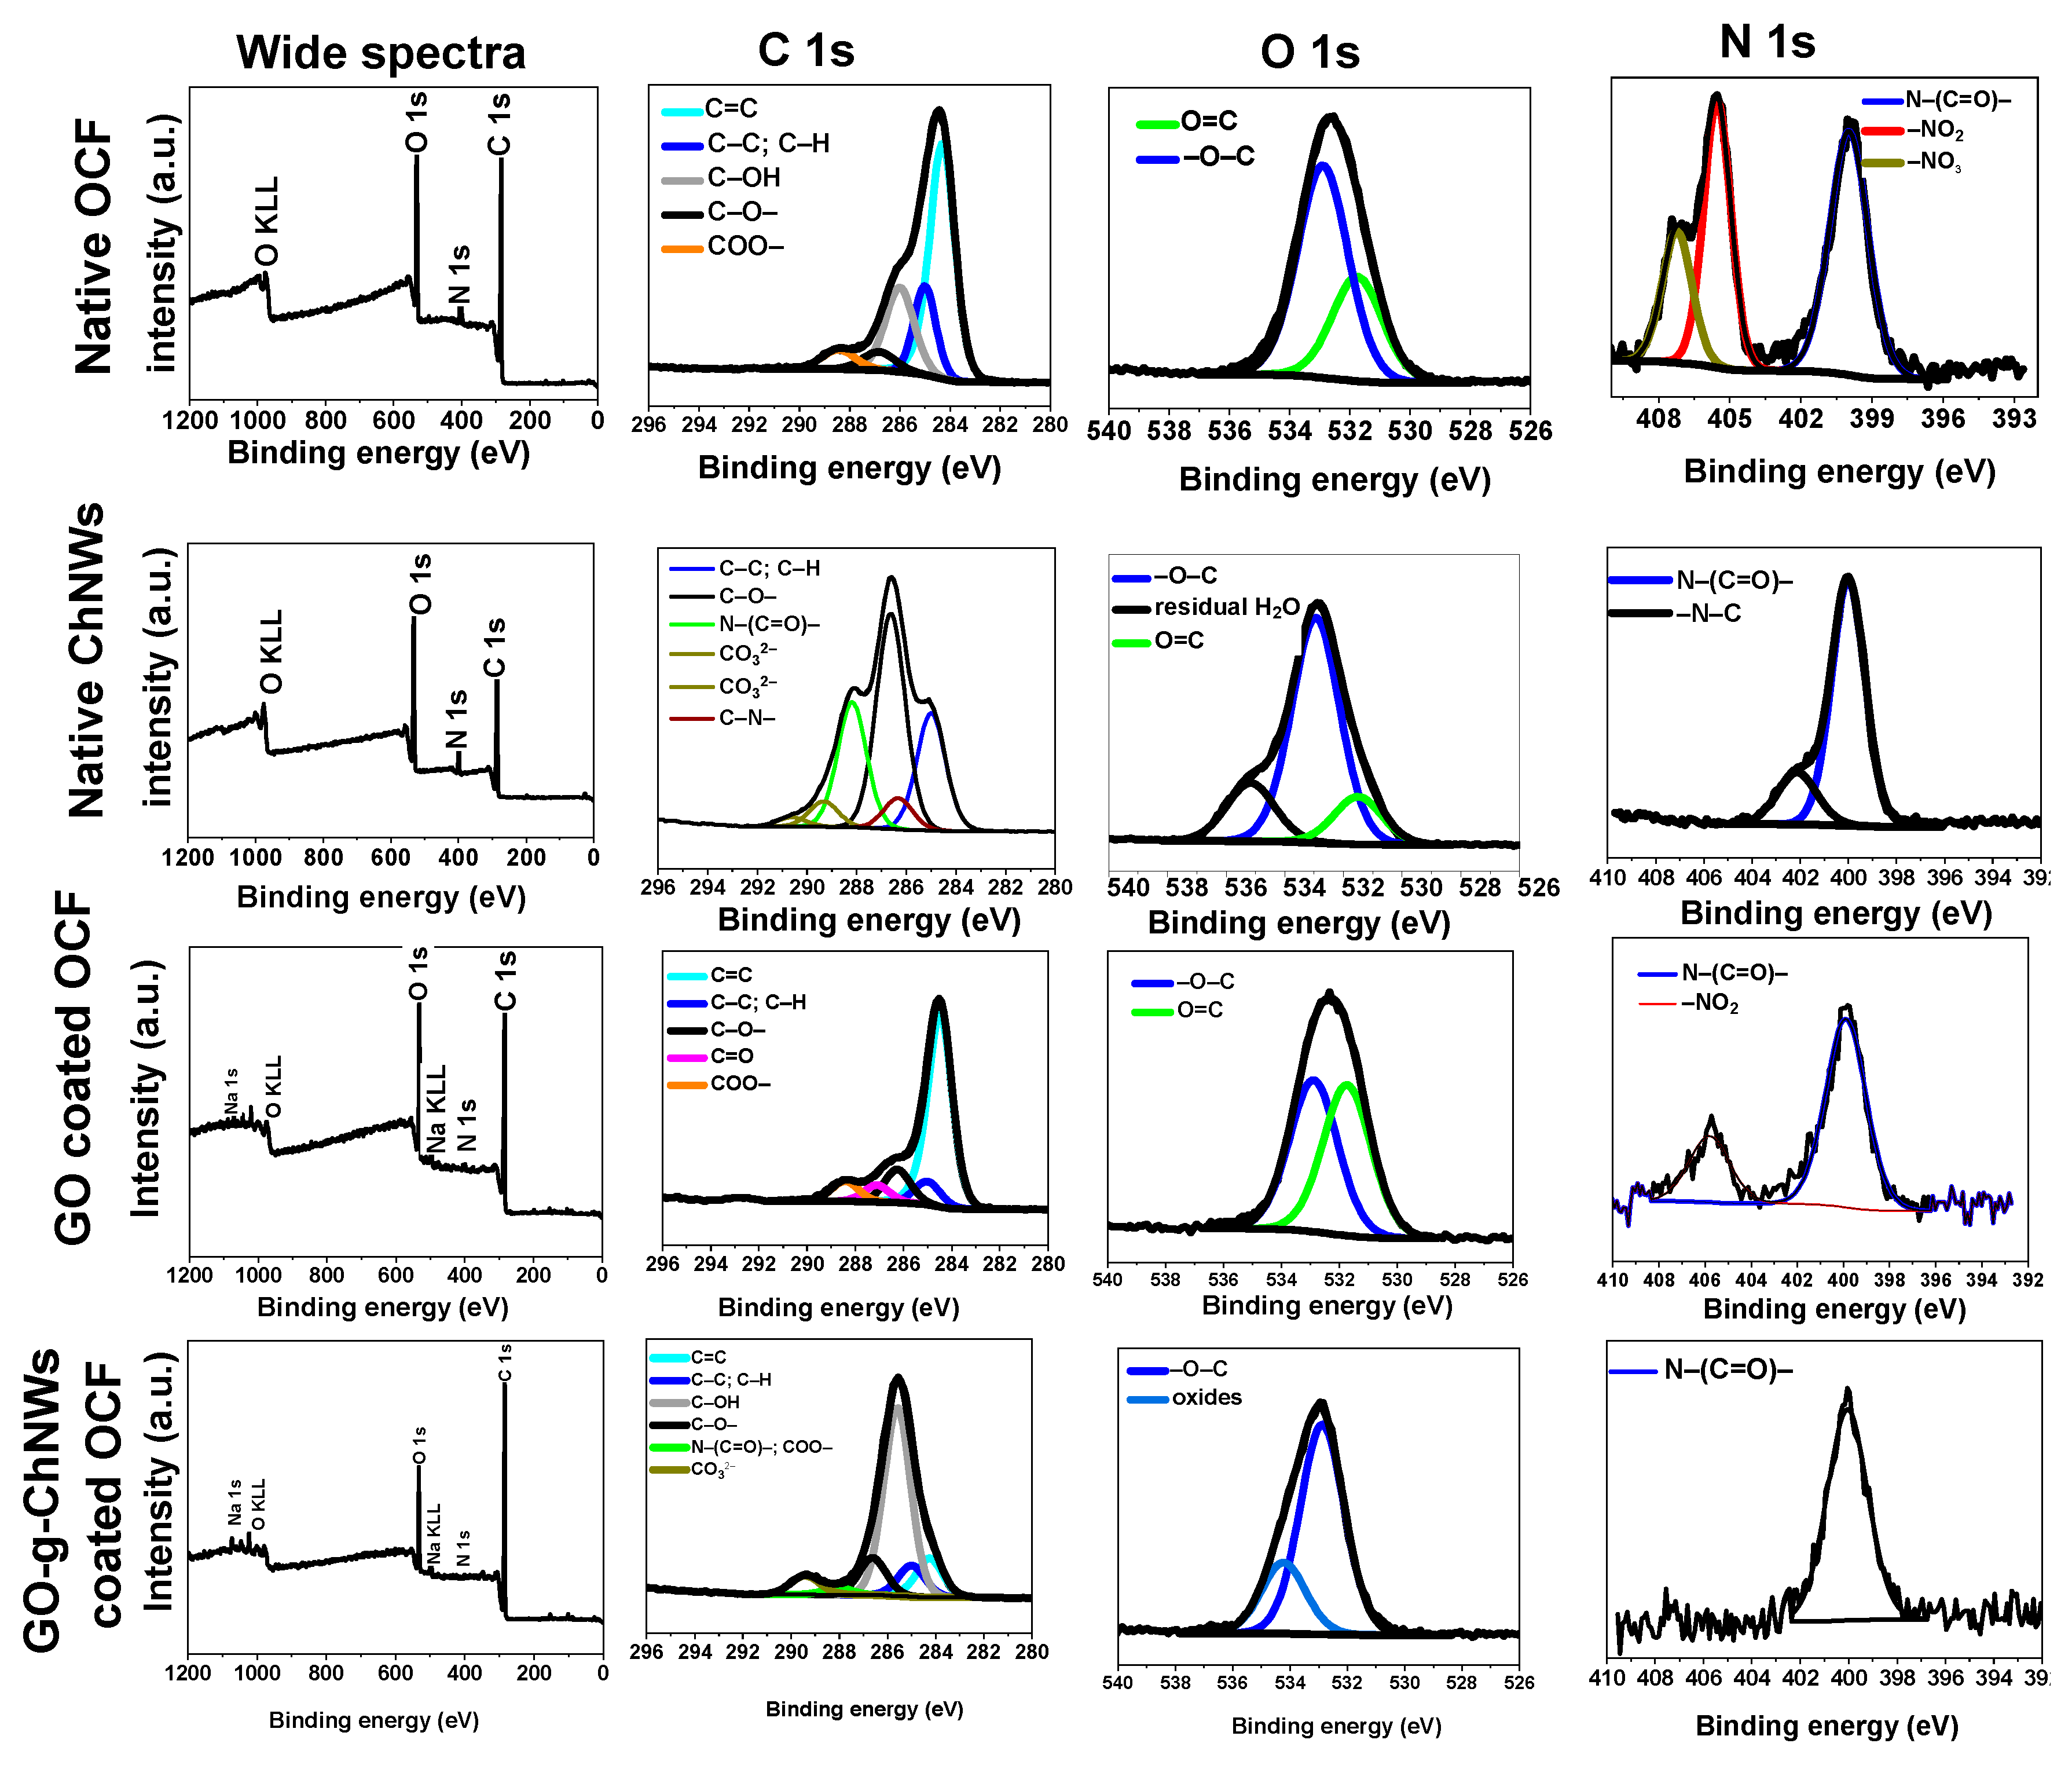
3.1. Effect of DDA on GO/ChNC adduct formation
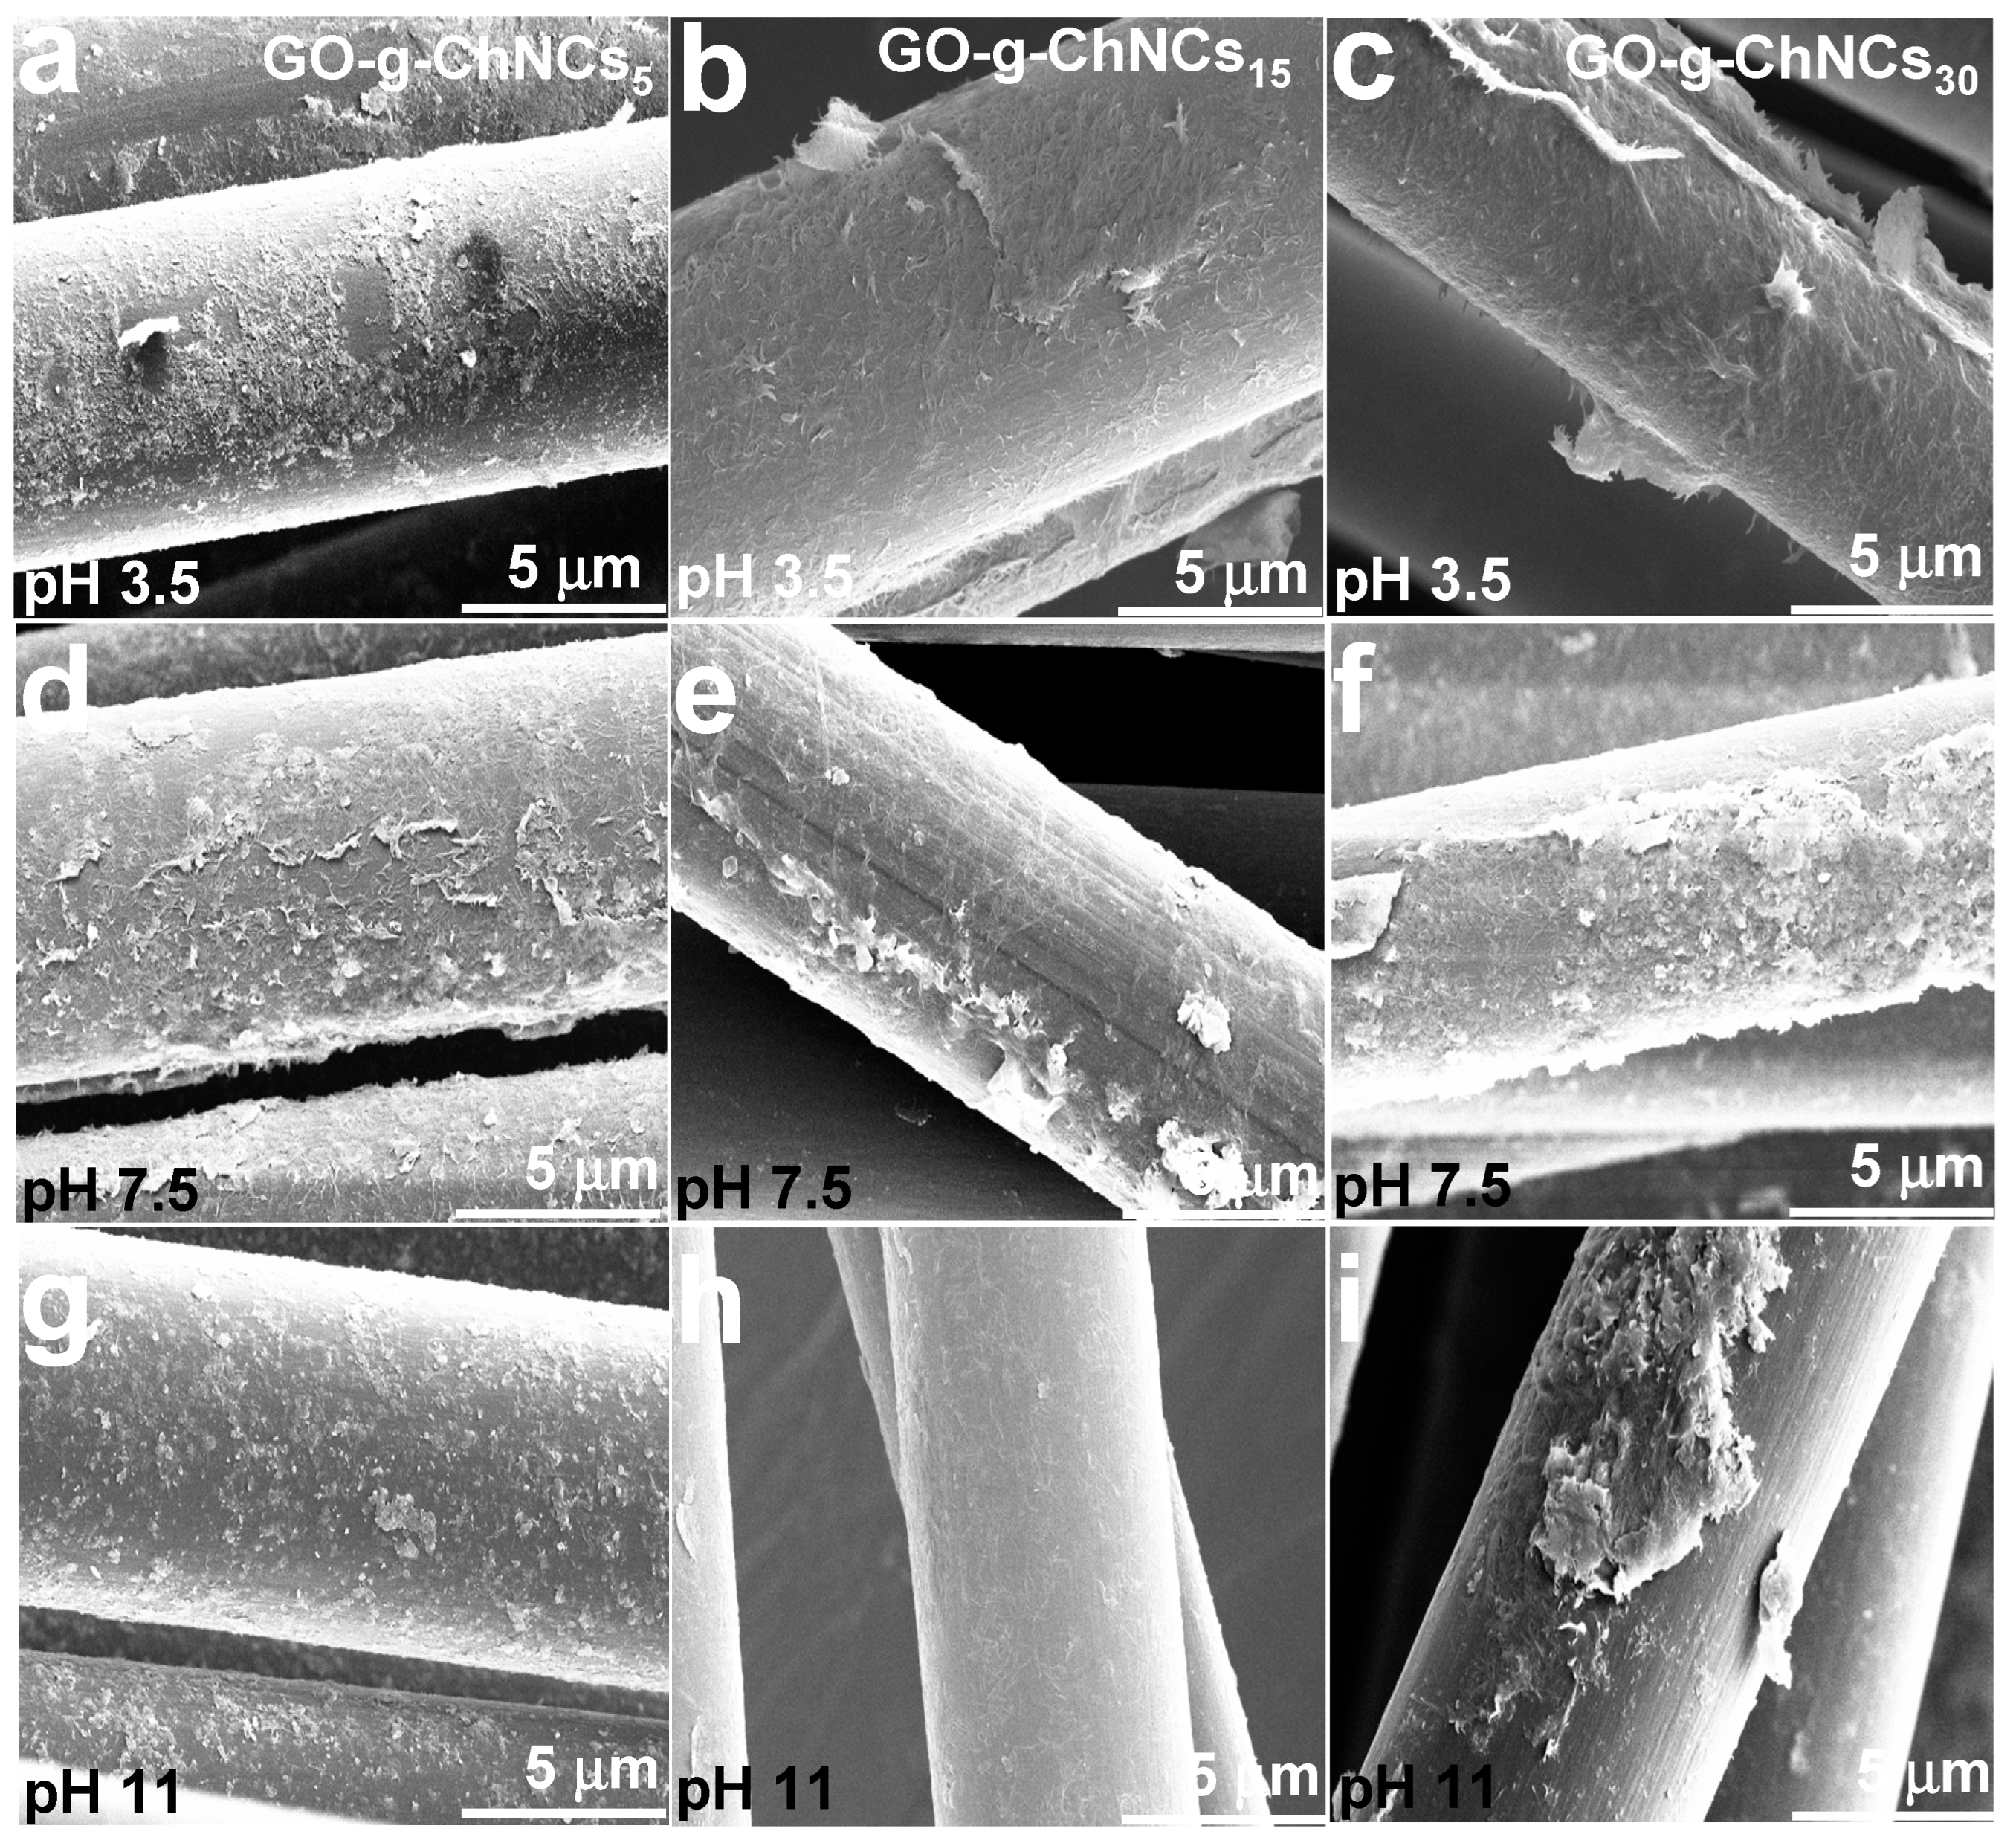
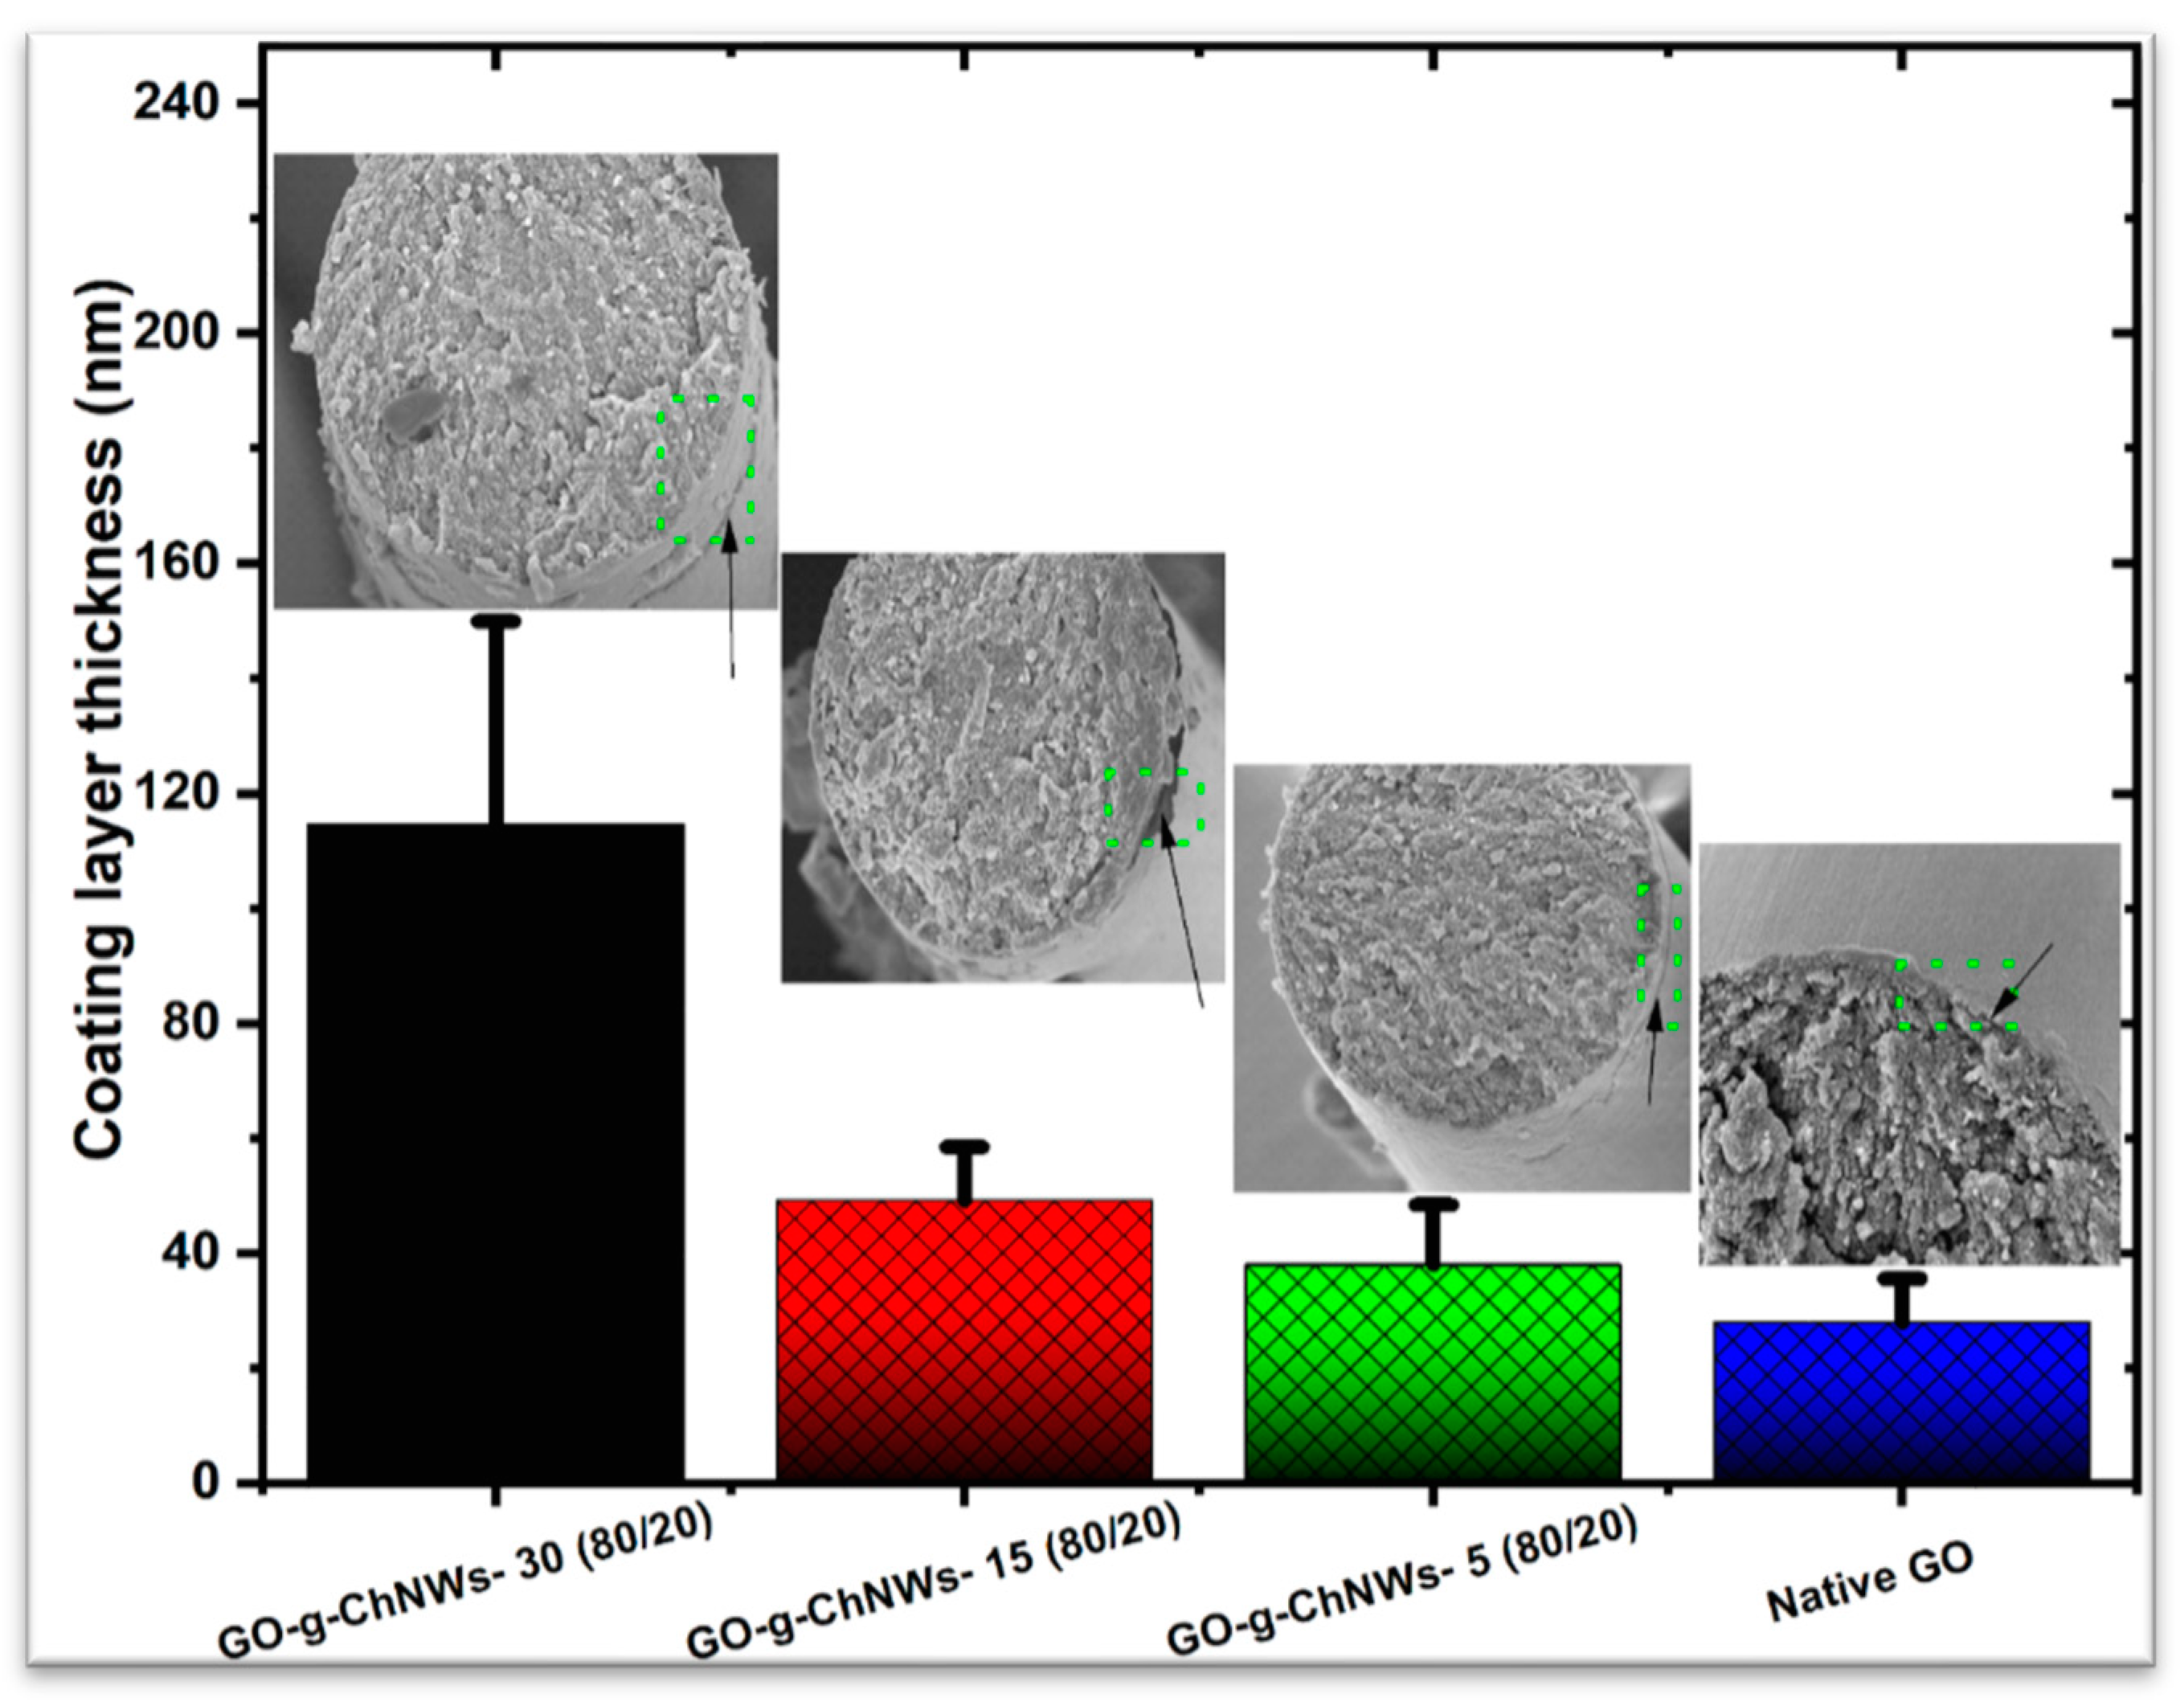
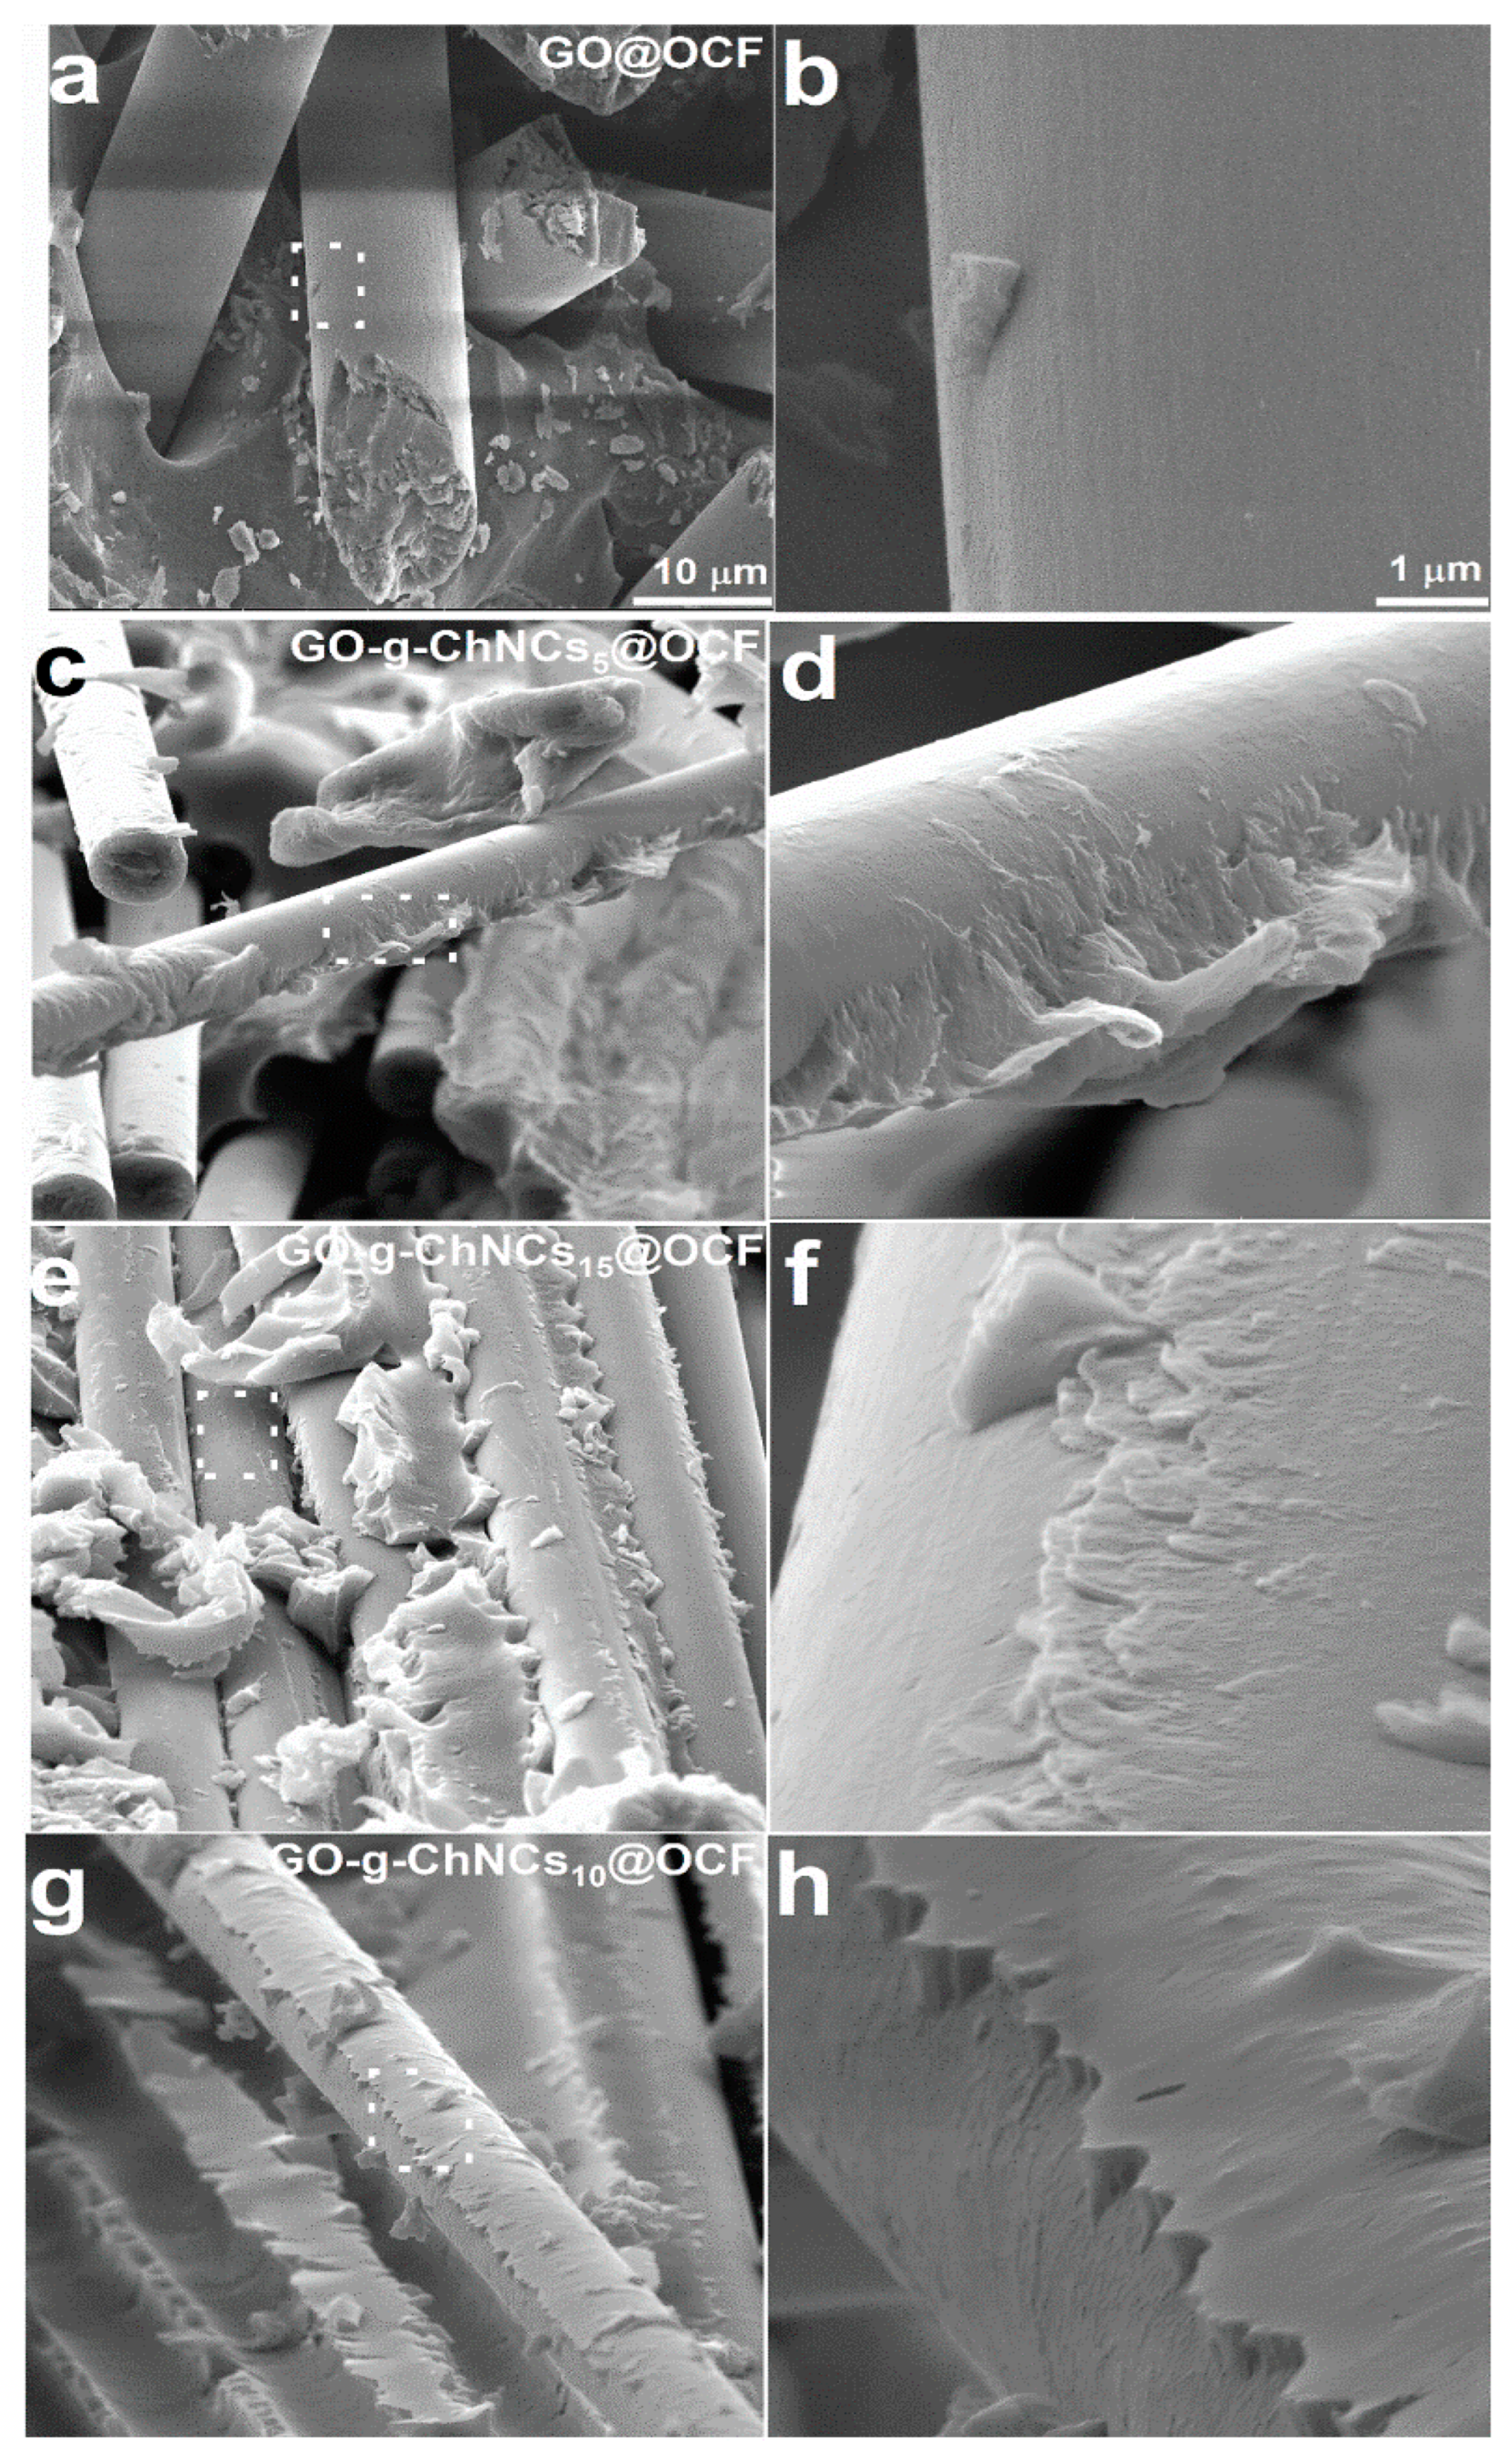
3.2. Effect of the GO/ChNCs adduct composition and EPD variations on the structure of the coating
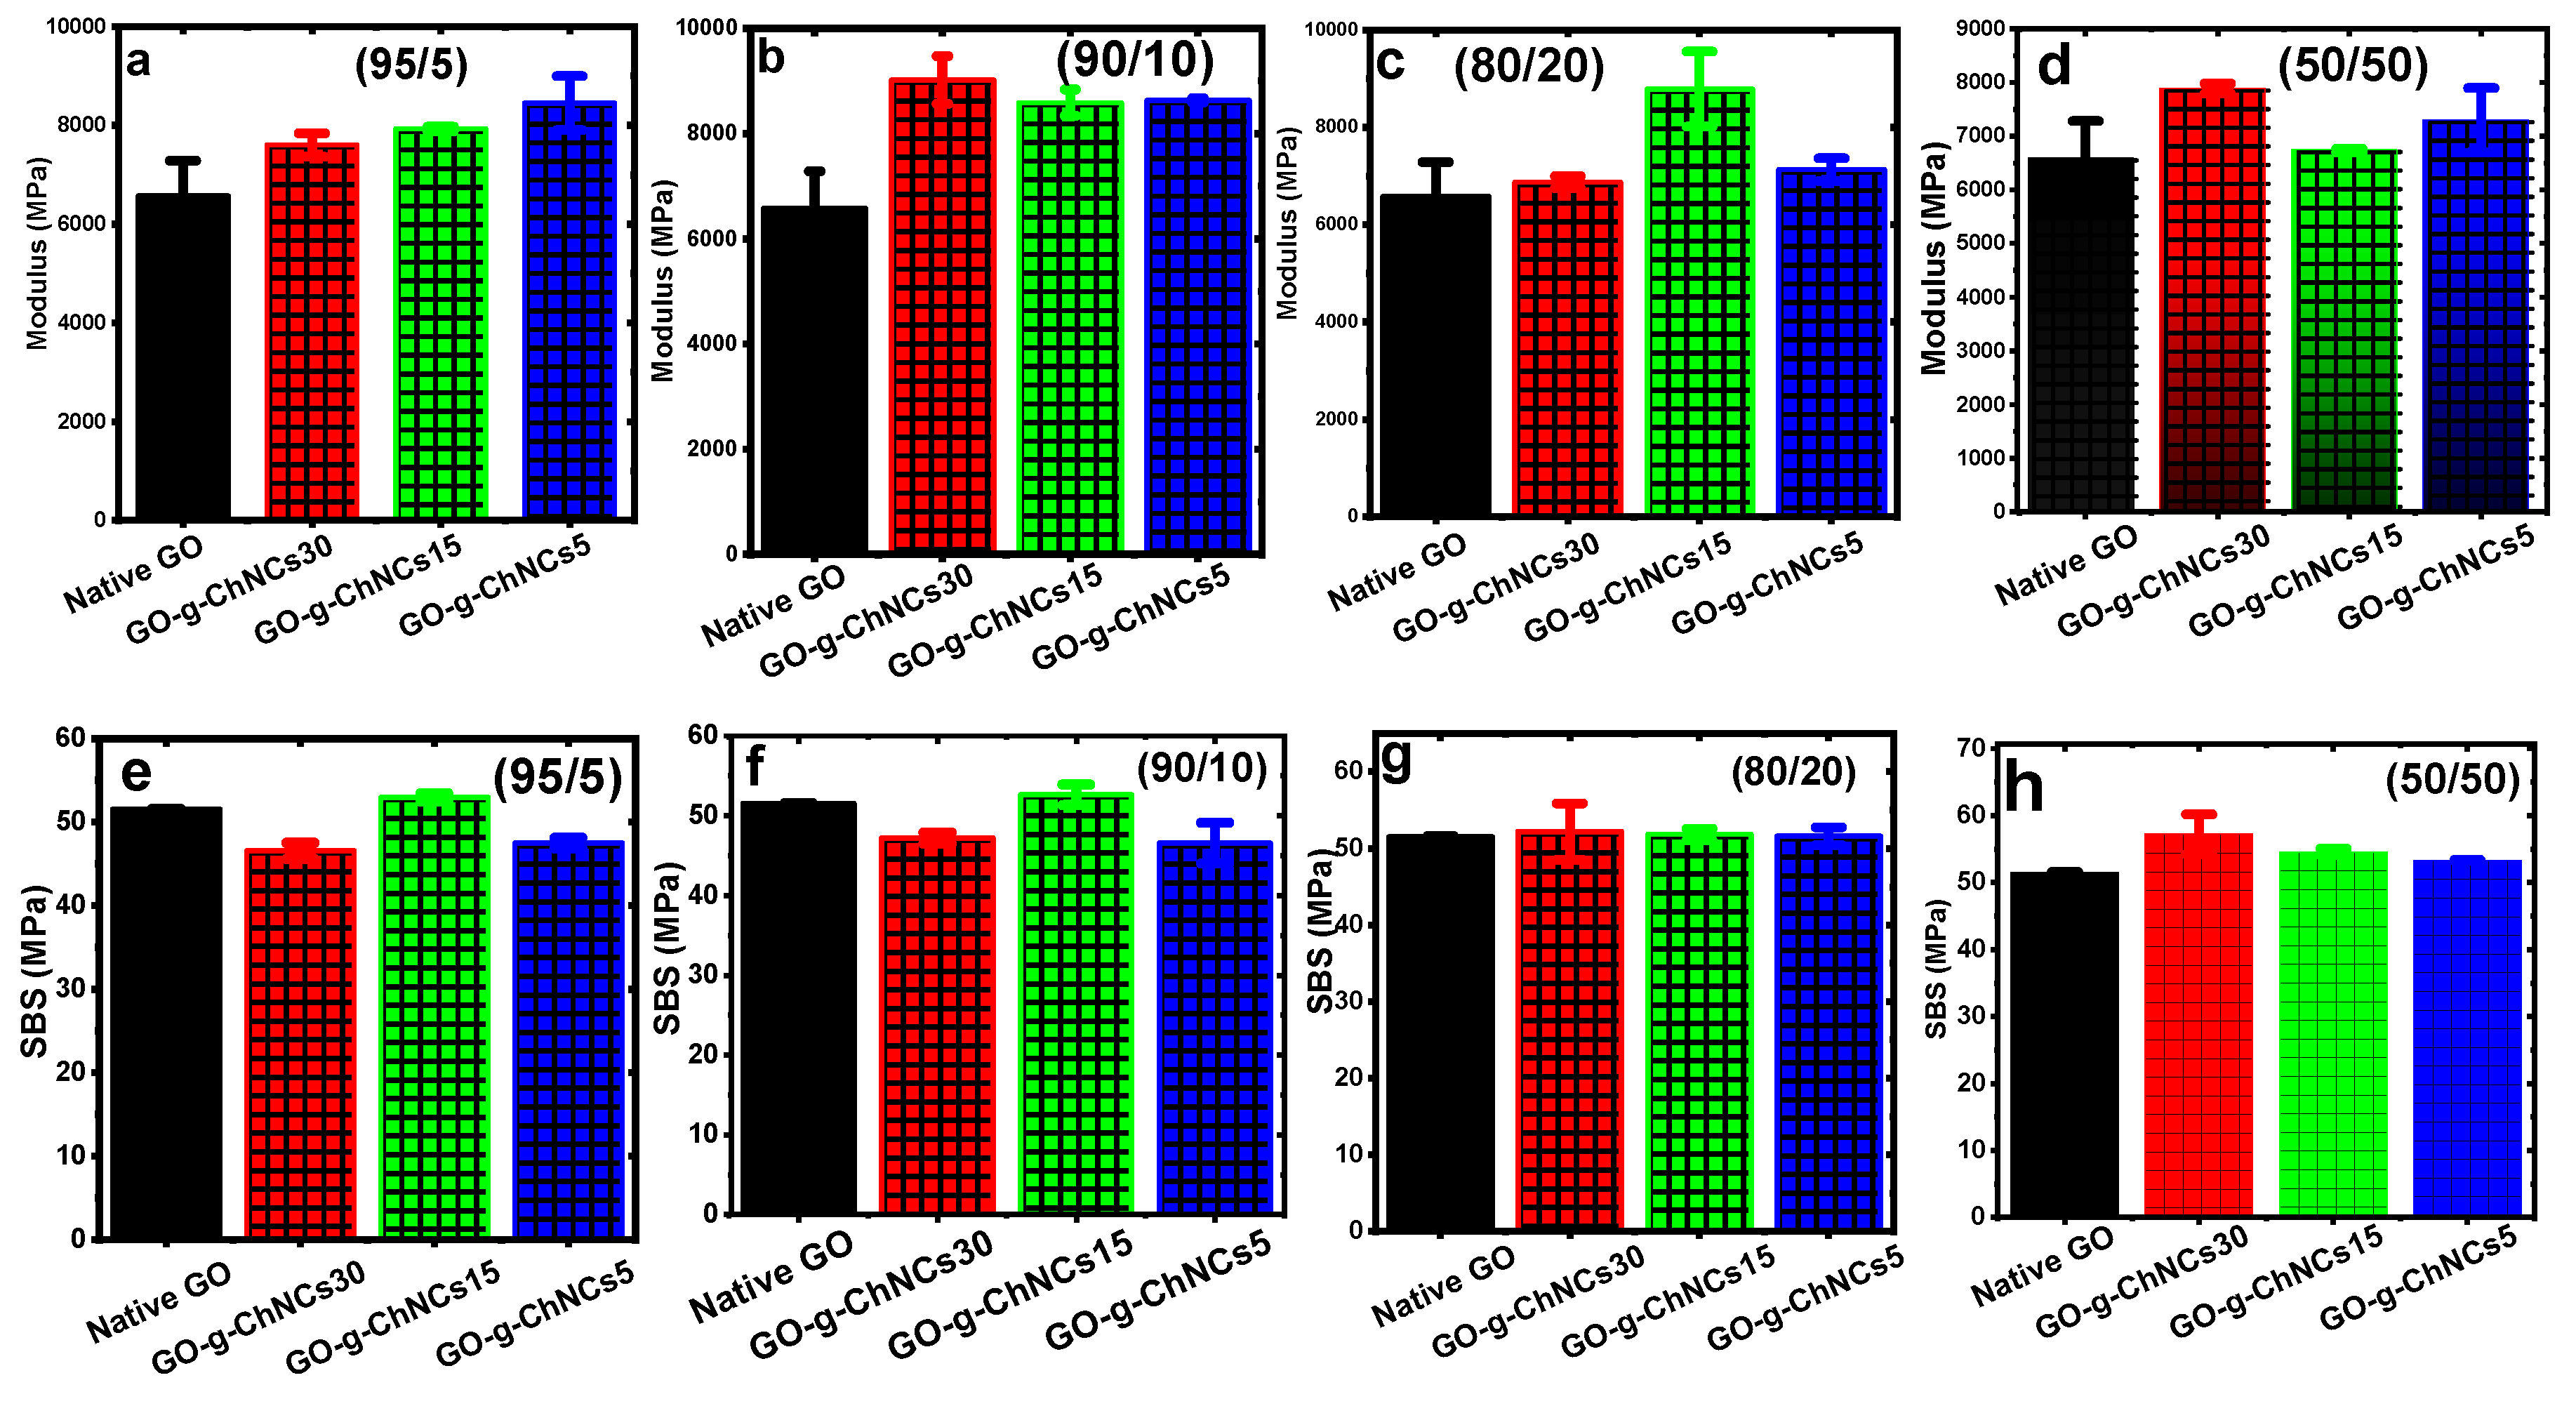
3.3. Short-beam testing (SBS)
4. Conclusions
Supplementary Materials
Acknowledgments
Supporting information
References
- Y. Zhang, S. Gong, Q. Zhang, P. Ming, S. Wan, J. Peng et al., Graphene-based artificial nacre nanocomposites, Chem. Soc. Rev. 45 (2016) 2378–2395. [CrossRef]
- L.J. Bonderer, A.R. Studart, L.J. Gauckler, Bioinspired Design and Assembly of Platelet Reinforced Polymer Films, Science 319 (2008) 1069–1073. [CrossRef]
- U.G.K. Wegst, H. Bai, E. Saiz, A.P. Tomsia, R.O. Ritchie, Bioinspired structural materials. Nat. Mater. 14 (2015) 23–36. [CrossRef]
- S. Wan, J. Peng, Y. Li, H. Hu, L. Jiang, Q. Cheng, Use of Synergistic Interactions to Fabricate Strong, Tough, and Conductive Artificial Nacre Based on Graphene Oxide and Chitosan, ACS Nano 9 (2015) 9830–9836. [CrossRef]
- R.Z. Wang, Z. Suo, A.G. Evans, N. Yao, I.A. Aksay, Deformation mechanisms in nacre, J. Mater. Res. 16 (2001) 2485–2493. [CrossRef]
- K. Chen, X. Tang, Y. Yue, H. Zhao, L. Guo, Strong and Tough Layered Nanocomposites with Buried Interfaces, ACS Nano 10 (2016) 4816–4827. [CrossRef]
- J. Duan, S. Gong, Y. Gao, X. Xie, L. Jiang, Q. Cheng, Bioinspired Ternary Artificial Nacre Nanocomposites Based on Reduced Graphene Oxide and Nanofibrillar Cellulose, ACS Appl. Mater. Interfaces 8 (2016) 10545–10550. [CrossRef]
- K. Yao, S. Huang, H. Tang, Y. Xu, G. Buntkowsky, L.A. Berglund et al., Bioinspired Interface Engineering for Moisture Resistance in Nacre-Mimetic Cellulose Nanofibrils/Clay Nanocomposites. ACS Appl. Mater. Interfaces 9 (2017) 20169–20178. [CrossRef]
- M. Li, X. Wang, R. Zhao, Y. Miao, Z. Liu, A novel graphene-based micro/nano architecture with high strength and conductivity inspired by multiple creatures, Sci. Rep. 11 (2021), 1387. [CrossRef]
- R. Xiong, H.S. Kim, L. Zhang, V.F. Korolovych, S. Zhang, Y.G. Yingling et al., Wrapping Nanocellulose Nets around Graphene Oxide Sheets, Angew. Chem. Int. Ed. 57 (2018) 8508–8513. [CrossRef]
- Y. Liu, S.-H. Yu, L. Bergström, Transparent and Flexible Nacre-Like Hybrid Films of Aminoclays and Carboxylated Cellulose Nanofibrils, Adv. Funct. Mater. 28 (2018), 1703277. [CrossRef]
- D. Xu, S. Wang, L.A. Berglund, Q. Zhou, Surface Charges Control the Structure and Properties of Layered Nanocomposite of Cellulose Nanofibrils and Clay Platelets, ACS Appl. Mater. Interfaces 13 (2021) 4463–4472. [CrossRef]
- P. Laaksonen, A. Walther, J.-M. Malho, M. Kainlauri, O. Ikkala, M.B. Linder, Genetic Engineering of Biomimetic Nanocomposites: Diblock Proteins, Graphene, and Nanofibrillated Cellulose, Angew. Chem. Int. Ed. 50 (2011) 8688–8691. [CrossRef]
- L. Huang, C. Li, W. Yuan, G. Shi, Strong composite films with layered structures prepared by casting silk fibroin–graphene oxide hydrogels, Nanoscale 5 (2013) 3780–3786. [CrossRef]
- M. Li, P. Xiong, M. Mo, Y. Cheng, Y. Zheng, Electrophoretic-deposited novel ternary silk fibroin/graphene oxide/hydroxyapatite nanocomposite coatings on titanium substrate for orthopedic applications, Front. Mater. Sci. 10 (2016) 270–280. [CrossRef]
- W. Zhang, K. Zheng, J. Ren, Y. Fan, S. Ling, Strong, ductile and lightweight bionanocomposites constructed by bioinspired hierarchical assembly, Compos. Commun. 17 (2020) 97–103. [CrossRef]
- T.H. Tran, H.-L. Nguyen, D.S. Hwang, J.Y. Lee, H.G. Cha, J.M. Koo et al., Five different chitin nanomaterials from identical source with different advantageous functions and performances, Carbohydr. Polym. 205 (2019) 392–400. [CrossRef]
- R.M. Abdelrahman, A.M. Abdel-Mohsen, M. Zboncak, J. Frankova, P. Lepcio, L. Kobera et al., Hyaluronan biofilms reinforced with partially deacetylated chitin nanowhiskers: Extraction, fabrication, in-vitro and antibacterial properties of advanced nanocomposites, Carbohydr. Polym. 235 (2020), 115951. [CrossRef]
- Kelnar, J. Kovářová, G. Tishchenko, L. Kaprálková, E. Pavlová, F. Carezzi et al., Chitosan/Chitin nanowhiskers composites: effect of plasticisers on the mechanical behaviour, J. Polym. Res. 22 (2015), 5. [CrossRef]
- A.J. Uddin, M. Fujie, S. Sembo, Y. Gotoh, Outstanding reinforcing effect of highly oriented chitin whiskers in PVA nanocomposites, Carbohydr. Polym. 87 (2012) 799–805. [CrossRef]
- C. Wang, J. Li, S. Sun, X. Li, F. Zhao, B. Jiang et al., Electrophoretic deposition of graphene oxide on continuous carbon fibers for reinforcement of both tensile and interfacial strength, Compos. Sci. Technol. 135 (2016) 46–53. [CrossRef]
- J. Jiang, X. Yao, C. Xu, Y. Su, L. Zhou, C. Deng, Influence of electrochemical oxidation of carbon fiber on the mechanical properties of carbon fiber/graphene oxide/epoxy composites, Compos. Pt. A-Appl. Sci. Manuf. 95 (2017) 248–256. [CrossRef]
- C. Wang, Y. Li, L. Tong, Q. Song, K. Li, J. Li et al., The role of grafting force and surface wettability in interfacial enhancement of carbon nanotube/carbon fiber hierarchical composites, Carbon 69 (2014) 239–246. [CrossRef]
- Q. Zhang, D. Jiang, L. Liu, Y. Huang, J. Long, G. Wu et al., Effects of Graphene Oxide Modified Sizing Agents on Interfacial Properties of Carbon Fibers/Epoxy Composites. J. Nanosci. Nanotechnol. 15 (2015) 9807–9811. [CrossRef]
- R.L. Zhang, B. Gao, Q.H. Ma, J. Zhang, H.Z. Cui, L. Liu, Directly grafting graphene oxide onto carbon fiber and the effect on the mechanical properties of carbon fiber composites, Mater. Des. 93 (2016) 364–369. [CrossRef]
- H. Qian, E.S. Greenhalgh, M.S.P. Shaffer, A. Bismarck, Carbon nanotube-based hierarchical composites: a review. J. Mater. Chem. 20 (2010) 4751–4762. [CrossRef]
- Y. Li, Q. Peng, X. He, P. Hu, C. Wang, Y. Shang et al., Synthesis and characterization of a new hierarchical reinforcement by chemically grafting graphene oxide onto carbon fibers, J. Mater. Chem. 22 (2012) 18748–18752. [CrossRef]
- Asadi, M. Miller, R.J. Moon, K. Kalaitzidou, Improving the interfacial and mechanical properties of short glass fiber/epoxy composites by coating the glass fibers with cellulose nanocrystals, Express Polym. Lett. 10 (2016) 587–597. [CrossRef]
- B.E.B. Uribe, E.M.S. Chiromito, A.J.F. Carvalho, J.R. Tarpani, Low-cost, environmentally friendly route for producing CFRP laminates with microfibrillated cellulose interphase. Express Polym. Lett. 11 (2017) 47–59. [CrossRef]
- M.D. Reale Batista, L.T. Drzal, Carbon fiber/epoxy matrix composite interphases modified with cellulose nanocrystals, Compos. Sci. Technol. 164 (2018) 274–281. [CrossRef]
- J.U. Lee, B. Park, B.-S. Kim, D.-R. Bae, W. Lee, Electrophoretic deposition of aramid nanofibers on carbon fibers for highly enhanced interfacial adhesion at low content. Compos. Pt. A-Appl. Sci. Manuf. 84 (2016) 482–489. [CrossRef]
- B. Zhang, T. Lian, X. Shao, M. Tian, N. Ning, L. Zhang et al., Surface Coating of Aramid Fiber by a Graphene/Aramid Nanofiber Hybrid Material to Enhance Interfacial Adhesion with Rubber Matrix, Ind. Eng. Chem. Res. 60 (2021) 2472–2480. [CrossRef]
- M.R. Wisnom, The role of delamination in failure of fibre-reinforced composites. Philos. Trans. R. Soc. A-Math. Phys. Eng. Sci. 370 (2012) 1850–1870. [CrossRef]
- J.-F. Gerard, Characterization and role of an elastomeric interphase on carbon fibers reinforcing an epoxy matrix. Polym. Eng. Sci. 28 (1988) 568–577. [CrossRef]
- B.D. Agarwal, R.K. Bansal, Effect of an interfacial layer on the properties of fibrous composites: A theoretical analysis, J. Fiber Sci. Technol. 12 (1979) 149–158. [CrossRef]
- S. Lee, S. Ryu, Theoretical study of the effective modulus of a composite considering the orientation distribution of the fillers and the weakened interface, Eur. J. Mech. A/Solids 72 (2018) 79–89. [CrossRef]
- Kausar, M. Siddiq, Epoxy composites reinforced with multi-walled carbon nanotube/poly(ethylene glycol)methylether-coated aramid fiber, J. Polym. Eng. 36 (2016) 465–471. [CrossRef]
- X. Yao, X. Gao, J. Jiang, C. Xu, C. Deng, J. Wang, Comparison of carbon nanotubes and graphene oxide coated carbon fiber for improving the interfacial properties of carbon fiber/epoxy composites, Compos. B Eng. 132 (2018) 170–177. [CrossRef]
- P. Wang, J. Yang, W. Liu, X.-Z. Tang, K. Zhao, X. Lu et al., Tunable crack propagation behavior in carbon fiber reinforced plastic laminates with polydopamine and graphene oxide treated fibers, Mater. Des. 113 (2017) 68–75. [CrossRef]
- F. De Luca, G. Sernicola, M.S.P. Shaffer, A. Bismarck, “Brick-and-Mortar” Nanostructured Interphase for Glass-Fiber-Reinforced Polymer Composites, ACS Appl. Mater. Interfaces 10 (2018) 7352–7361. [CrossRef]
- X. Yang, H. Du, S. Li, Z. Wang, L. Shao, Codepositing Mussel-Inspired Nanohybrids onto One-Dimensional Fibers under “Green” Conditions for Significantly Enhanced Surface/Interfacial Properties. ACS Sustain. Chem. Eng. 6 (2018) 4412–4420. [CrossRef]
- L. Jin, M. Zhang, L. Shang, L. Liu, M. Li, Y. Ao, A nature-inspired interface design strategy of carbon fiber composites by growing brick-and-mortar structure on carbon fiber. Compos. Sci. Technol. 200 (2020), 108382. [CrossRef]
- J. Wang, S. Zhou, J. Huang, G. Zhao, Y. Liu, Interfacial modification of basalt fiber filling composites with graphene oxide and polydopamine for enhanced mechanical and tribological properties, RSC Adv. 8 (2018) 12222–12231. [CrossRef]
- D.C. Marcano, D.V. Kosynkin, J.M. Berlin, A. Sinitskii, Z. Sun, A. Slesarev et al., Improved Synthesis of Graphene Oxide, ACS Nano 4 (2010) 4806–4814. [CrossRef]
- Kelnar, L. Kaprálková, P. Němeček, J. Dybal, R.M. Abdel-Rahman, M. Vyroubalová et al., The Effects of the Deacetylation of Chitin Nanowhiskers on the Performance of PCL/PLA Bio-Nanocomposites, Polymers 15 (2023), 3071. [CrossRef]
- Kelnar, L. Kaprálková, P. Němeček, M. Janata, J. Dybal, J. Svoboda et al., Nature-mimicking rigid tough interface in fibrous composites: Effect of polymer/GO combination. Mater. Today Commun. 33 (2022), 104883. [CrossRef]
- Q. Wu, X. Yang, Z. Ye, H. Deng, J. Zhu, Dopamine-dependent graphene oxide modification and its effects on interfacial adhesion of carbon fiber composites, Surf. Interfaces 31 (2022), 102086. [CrossRef]
- A.M. Abdel-Mohsen, R.M. Abdel-Rahman, I. Kubena, L. Kobera, Z. Spotz, M. Zboncak et al., Chitosan-glucan complex hollow fibers reinforced collagen wound dressing embedded with aloe vera. Part I: Preparation and characterization, Carbohydr. Polym. 230 (2020), 115708. [CrossRef]
- A.S. Aly, A.M. Abdel-Mohsen, R. Hrdina, A. Abou-Okeil, Preparation and Characterization of Polyethylene Glycol/Dimethyl Siloxane Adduct and Its Utilization as Finishing Agent for Cotton Fabric, J. Nat. Fibers. 8 (2011) 176–188. [CrossRef]
- Z. Lin, Y. Ma, C. Hu, Q. Zhang, Molecular intercalated graphene oxide with finely controllable interlayer spacing for fast dye separation, Colloids Surf. A: Physicochem. Eng. Asp. 677 (2023), 132437. [CrossRef]
- S. Dong, B. Wang, D. Liu, M. He, M. Chen, J. Zhao et al., Tailoring the interlayer channel structure of graphene oxide membrane with conjugated cationic dyes for butanol dehydration, Sep. Purif. Technol. 325 (2023), 124728. [CrossRef]
- W.L. Xu, C. Fang, F. Zhou, Z. Song, Q. Liu, R. Qiao et al., Self-Assembly: A Facile Way of Forming Ultrathin, High-Performance Graphene Oxide Membranes for Water Purification, Nano Lett. 17 (2017) 2928–2933. [CrossRef]
- N. Zheng, Y. Huang, H.-Y. Liu, J. Gao, Y.-W. Mai, Improvement of interlaminar fracture toughness in carbon fiber/epoxy composites with carbon nanotubes/polysulfone interleaves, Compos. Sci. Technol. 140 (2017) 8–15. [CrossRef]
- C.C. Riccardi, H.E. Adabbo, R.J.J. Williams, Curing reaction of epoxy resins with diamines, J. Appl. Polym. Sci. 29 (1984) 2481–2492. [CrossRef]
| Number | GO | ChNCs |
DDA of ChNCs (%) |
Abbreviation |
|---|---|---|---|---|
| 1 | 95 | 5 | 5 | GO/ChNCs5 adduct |
| 2 | 90 | 10 | 5 | GO/ChNCs5 adduct |
| 3 | 80 | 20 | 5 | GO/ChNCs5 adduct |
| 4 | 50 | 50 | 5 | GO/ChNCs5 adduct |
| 5 | 95 | 5 | 15 | GO/ChNCs15 adduct |
| 6 | 90 | 10 | 15 | GO/ChNCs15 adduct |
| 7 | 80 | 20 | 15 | GO/ChNCs15 adduct |
| 8 | 50 | 50 | 15 | GO/ChNCs15 adduct |
| 9 | 95 | 5 | 30 | GO/ChNCs30 adduct |
| 10 | 90 | 10 | 30 | GO/ChNCs30 adduct |
| 11 | 80 | 20 | 30 | GO/ChNCs30 adduct |
| 12 | 50 | 50 | 30 | GO/ChNCs30 adduct |
Disclaimer/Publisher’s Note: The statements, opinions and data contained in all publications are solely those of the individual author(s) and contributor(s) and not of MDPI and/or the editor(s). MDPI and/or the editor(s) disclaim responsibility for any injury to people or property resulting from any ideas, methods, instructions or products referred to in the content. |
© 2024 by the authors. Licensee MDPI, Basel, Switzerland. This article is an open access article distributed under the terms and conditions of the Creative Commons Attribution (CC BY) license (http://creativecommons.org/licenses/by/4.0/).


