Preprint
Article

Assessment of the Geographic and Technical Potential for Large-Scale Wind Energy Production Using a GIS-Based MCDM-AHP Multi-criteria Analysis Method and Sensitivity Analysis: Case of Cameroon

Altmetrics

Downloads

196

Views

129

Comments

0

Submitted:

31 January 2024

Posted:

02 February 2024

You are already at the latest version

Alerts
Abstract
This article presents the suitability analysis of onshore wind farm sites using an AHP (Hierarchical Analysis Process) multi-criteria decision-making (MCDM) approach based on geographic information system modeling (GIS). This analysis is based on different technical aspects (wind speed, elevation, slope), economic (proximity to the electricity network, proximity to roads) and social (proximity to residential areas, population density). The introduction of the factor “population density” and the constraint “required area” rarely used in previous studies makes it possible to refine the results. The data is classified into several categories in a gradual manner, namely unsuitable (0); less suitable (1); suitable (2); highly suitable (3) and most suitable (4). The results of the study show us that the largest percentage relating to spatial coverage is observed in the “suitable” range with 50.89% and the corresponding TWPP (theoretical wind power potential) is 1377.926 GW; it is followed by “highly suitable” 5.67% and a TWPP of 153.652 GW; then “less suitable” with 1.04% and a TWPP of 28.163GW. No areas were identified in “most suitable” and finally the “unsuitable” range with 42.4%. The results show that the most favorable areas are located in the part of the far north of the country corresponding to the strong wind zone. The sensitivity analysis was carried out based on scenario tests (technical, economic and equal-weight) in order to give greater visibility of choice to the different stakeholders who would like to invest in onshore wind energy in Cameroon. This study is useful in more than one way because the results obtained can help investors, the government and other stakeholders to identify potential areas for the deployment of wind energy systems in Cameroon. Furthermore, a study of hybrid solar-wind systems could improve the efficiency of electricity parks in Cameroon.
Keywords: 
Subject: Physical Sciences  -   Applied Physics

1. Introduction

Cameroon, like most developing countries in sub-Saharan Africa, faces the challenge of generating more electricity to meet existing and future demand in a sustainable way. Despite the country's enormous renewable energy potential, its electricity sector remains underdeveloped and faces major financial difficulties, which have been compounded by the consequences of the COVID-19 pandemic and the war in Ukraine [1]. Nationwide access to electricity in Cameroon will be around 65.4% in 2021, very high in urban areas (around 94.5%), in contrast to rural areas with around 24.8% [2]. Although electricity production in Cameroon is essentially hydroelectric (around 76.1%), peak load management and the electrification of isolated areas require the use of thermal power plants that run on fossil fuels, namely oil and gas (around 23.9%) [2]. Apart from the ever-increasing cost of these fossil fuels, their use emits greenhouse gases that are responsible for climate change. The war in Ukraine triggered a global energy crisis that led to soaring gas and electricity prices. In emerging and developing countries, the poorest households consume around nine times less energy than the richest, but spend a much higher proportion of their income on energy. According to the International Energy Agency (IEA), global demand for electricity is set to increase by 25 to 30% between now and 2030. Renewable energies, driven by solar photovoltaic and wind power, will play a crucial role in this energy transition [3]. This war is a major challenge for the energy sector, as it could lead to far-reaching, long-term policy changes aimed at accelerating the transition to renewable energies, which are more sustainable and secure energy systems. Investment in fossil fuels will inevitably decline, while investment in renewable energies will increase considerably [4]. This will lead to a reduction in the CO2 emissions that are causing climate change.
According to the spatial map obtained from Global Wind, wind speeds in Cameroon vary from 0.4 m/s to 11 m/s [5]. Given that wind turbines need a minimum wind speed of 3 m/s to start producing electricity, and reach their rated power at a speed of 12 to 13 m/s [6,7], we can conclude that there is considerable potential for the installation of wind farms in Cameroon. The harmful impact of fossil fuel use on the environment and the soaring prices of these energies in recent years have led to the strategic planning and development of renewable energy production systems such as wind power [8]. One of the main challenges to the development of wind energy in Cameroon is the lack of scientific data that would contribute to policy formulation and decision-making for the development of increased use of wind energy. The information contained in these data could be essential in the decision-making of decision-makers, public authorities, engineers and investors, so that they can make an optimal choice of site [9].
This judicious choice of site will ensure optimal investment and return on investment for wind farm developers. The development of wind farm projects requires appropriate technical, economic and socio-environmental planning and assessment. However, previous research on wind in Cameroon has focused mainly on the comparison of numerical methods for estimating Weibull parameters for the installation of a wind farm in Cameroon [10,11,12], the assessment of the potential of wind energy for the cogeneration of electricity and hydrogen in the Far North of Cameroon [13], technical-economic analysis based on meta-heuristic techniques for the optimal sizing of a stand-alone photovoltaic/wind hybrid system based on hydrogen batteries for rural electrification in Cameroon [14], study of the design and sensitivity analysis of biomass-based distributed hybrid renewable energy systems for rural electrification with a case study of different photovoltaic/wind/battery integrated options in Babadam, northern Cameroon [15], the design of a checkerboard sizing and layout optimization model for a small onshore wind farm with an estimated capacity of 500 kW in Kribi, Cameroon [16]. To our knowledge, only one study has analyzed the suitability of wind farm sites in Cameroon using a Boolean decision-making approach coupled with GIS (geographic information systems) using various climatic, geographic, economic and environmental criteria such as wind resource, slope, road accessibility, proximity to the power grid and optimal distance to airports. The results of this study showed that the most suitable sites were located mainly in the North, Far North, North-West, South-West, West, Littoral and very few in the South [17]. This Boolean method coupled with GIS, although providing results, remains incomplete as it is based on a binary approach (true or false). The use of an MDCM-AHP (Analytical Hierarchy Process) method combined with GIS, allowing the calculation of different criteria weights, will enable an optimal and more robust analysis of the problem.
In the literature, several studies have used the MDCM-GIS model applied to different criteria and factors to identify areas suitable for the siting of large-scale wind farms. For example, Ref [7] used AHP-GIS modeling with eight (8) criteria (Distance from airports, Distance from transmission lines and power grid, Distance from Urban/ Major cities, Wind speed, Slope, Lightning Strike flash rate, Distance from major roads and railways, Elevation) to identify suitable sites for wind farms in Bangladesh. In the Kuwaiti desert, Ref [21] applied an AHP-GIS model with five (5) criteria (Wind Speed, Proximity to transmission lines, Distance to urban areas, Proximity to main road and Distance to farms) to identify suitable sites for wind farms. The studies of Ref. [22], proposed a FAHP-GIS (GIS coupled to Fuzzy-AHP) model with nine (9) criteria (Distance from airports, Distance from protected and conservation areas, Distance from urban areas, Distance from rural settlements , Distance from coastlines, Wind speed, Slope, Distance from transmission lines, Distance from main roads) for the suitability analysis of wind farms in the Southern Philippines. In order to identify suitable sites for wind farms in Syria, Ref. [23] applied an AHP-GIS model to five (5) criteria (Wind energy potential, Land use, Slope, Proximity to power lines, Proximity to main roads). Ref [24] applied an innovative approach combining AHP-GIS-based linear regression modeling with five (5) criteria (Wind power density, Distance from roads and network, Distance from power lines, Land slope, Distance from urban and protected areas) to identify suitable sites for wind farms in Varzeghan city in East Azarbaijan province. Also in the case of Sudan, Ref [25] applied a high-resolution GIS model coupled with Fuzzy-AHP to the same criteria as Ref [7] for wind farm suitability analysis. These different approaches reviewed above have been proposed and applied in several other studies in the same directions [26,27,28,29,30,31,32,33,34,35,36]. Ref [37] combined a GIS-based model and Type-2 FAHP with six (6) criteria (Proximity to roads, Proximity to gridlines, Proximity to towns, Wind speed, Slope and Elevation) for the spatial selection of wind farm sites in Nigeria. The results show that the best wind farm development sites are mainly located in the northern part of Nigeria. Ref [38] in assessing the suitability of wind and solar farms over a large area of southern England using a GIS-assisted multi-criteria assessment, found that suitability for wind power is generally low with only 0.5 km2 representing the most suitable category. The authors of Ref [39] using the Boolean method of GIS software to identify ideal locations for the construction of wind power plants in the Middle East, concluded that the results found could be useful in creating sustainable energy development prospects for natural resource-based systems and in facilitating national policies for energy transport and environmental sustainability.
Table 1 provides a summary of studies using combined GIS and decision making for wind farm site selection, and Table 2 shows the decision criteria considered in previous studies of wind power plants. It can be seen that the most frequently used criteria are Wind speed, Proximity from roads, Proximity from gridlines, Proximity from residential areas, Slope. However, the criteria of population density and required site size are not used by most of these studies, yet they are essential for the identification of large-scale grid-connected onshore wind farms. All this makes the GIS a practical tool for multi-criteria analysis of site selection problems.
The main aim of this article is to use a decision-making tool coupled with a geographic information system (MDCM-AHP-GIS) to select suitable sites for the installation of large-scale wind farms connected to the Cameroon grid. GIS offers a wide range of capabilities for processing, managing and analyzing geographic data, enabling the inclusion of various environmental, economic, social and technical criteria and constraints. In the literature, no study combining multi-criteria analysis and GIS for the identification of suitable sites for onshore wind farms in Cameroon has been carried out to date. The present paper also takes into account various suggestions made by regional experts, stakeholders, experts from different environmental associations, energy practitioners and planning authorities, thus increasing the acceptability and viability of its results. The introduction of a new criterion, population density, helps to refine the results and optimize site selection. Also, the constraint of excluding sites smaller than 4km² allows us to optimize site selection to meet the standards of a large-scale onshore wind farm. The proposed methodology is designed to be comprehensive, simple and easy to use, while providing detailed and accurate visual results. Following the introduction considered as section 1 of the manuscript, section 2 describes the materials and the research methodology adopted. Section 3 discusses the various results, section 4 discusses the benefits, opportunities and limitations of the research study and finally, section 5 concludes this work and suggests directions for future work.

2. Materials and methodology

An AHP multi-criteria decision analysis method coupled with GIS was adopted for this study, as it provides an optimal solution to the problem of selecting a suitable wind farm site. The most important factors influencing the appropriate wind farm location are identified through a literature review. The corresponding weights for each criterion were calculated using the AHP method, taking into account their relative importance assigned on the basis of the matrix completed by the experts. The data used for this study were collected at different scales and raster resolutions; they were all resampled to the exact raster resolution (1km x 1km). Vector data were converted to raster format in order to homogenize all study parameters. The constraints and factors used are presented in Table 4 and Table 5.

2.1. Study area

Cameroon is a Central African country located at the bottom of the Gulf of Guinea, between 2nd and 13th degrees North latitude and 9th and 16th degrees East longitude (Figure 1). The country covers an area of 475,650 km2. It is triangular in shape, stretching almost 1,200 km south to Lake Chad, while its base extends 800 km from west to east (Figure 1). In the south-west, it has a maritime border of 420 km along the Atlantic Ocean. It is bordered to the west by Nigeria, to the south by Congo, Gabon and Equatorial Guinea, to the east by the Central African Republic, and to the northeast by Chad [58]. Indeed, several types of natural region contribute to the country's geographical diversity. The forested South (Centre, East, Littoral, South and South-West provinces) is located in the maritime and equatorial zones. This zone is characterized by dense vegetation, a vast hydrographic network and a hot, humid climate with abundant rainfall. The western highlands (West and North-West provinces), with an average altitude of over 1,100 m, form a region rich in volcanic soils suitable for agriculture (coffee, market gardening, etc.). The Sudano-Sahelian North (Adamaoua, North and Far North provinces) is a region of savannahs and steppes. Apart from the Adamaoua plateau, where the climate is more temperate, the rest of the region is characterized by a hot, dry tropical climate, with increasingly limited rainfall the closer one gets to Lake Chad [58]. Linguistically, the population is bilingual (English and French are the official languages), with a French-speaking majority (80%) and an English-speaking minority (20%). Cameroon's population is estimated at over 25 million in 2019.
According to the literature [10,11,12,13,14,15,16,17], there are significant reservoirs of wind generation in the areas of Kaelé and Kousseri in the Far North, the Bamboutos Mountains in the West region and certain localities in the Adamaoua region, Centre and Douala, Limbe, Kribi in the Littoral. In response to the ever-increasing demand for electricity, and the insufficient quantity and quality of electricity for the people of Cameroon, several investment projects for the construction of wind power plants are currently under study in Cameroon. These include wind farms on the Bamboutos Mountains, in the West, North-West and South-West regions, with a capacity of 42 MW, expandable to 80 MW.

2.2. Data sources

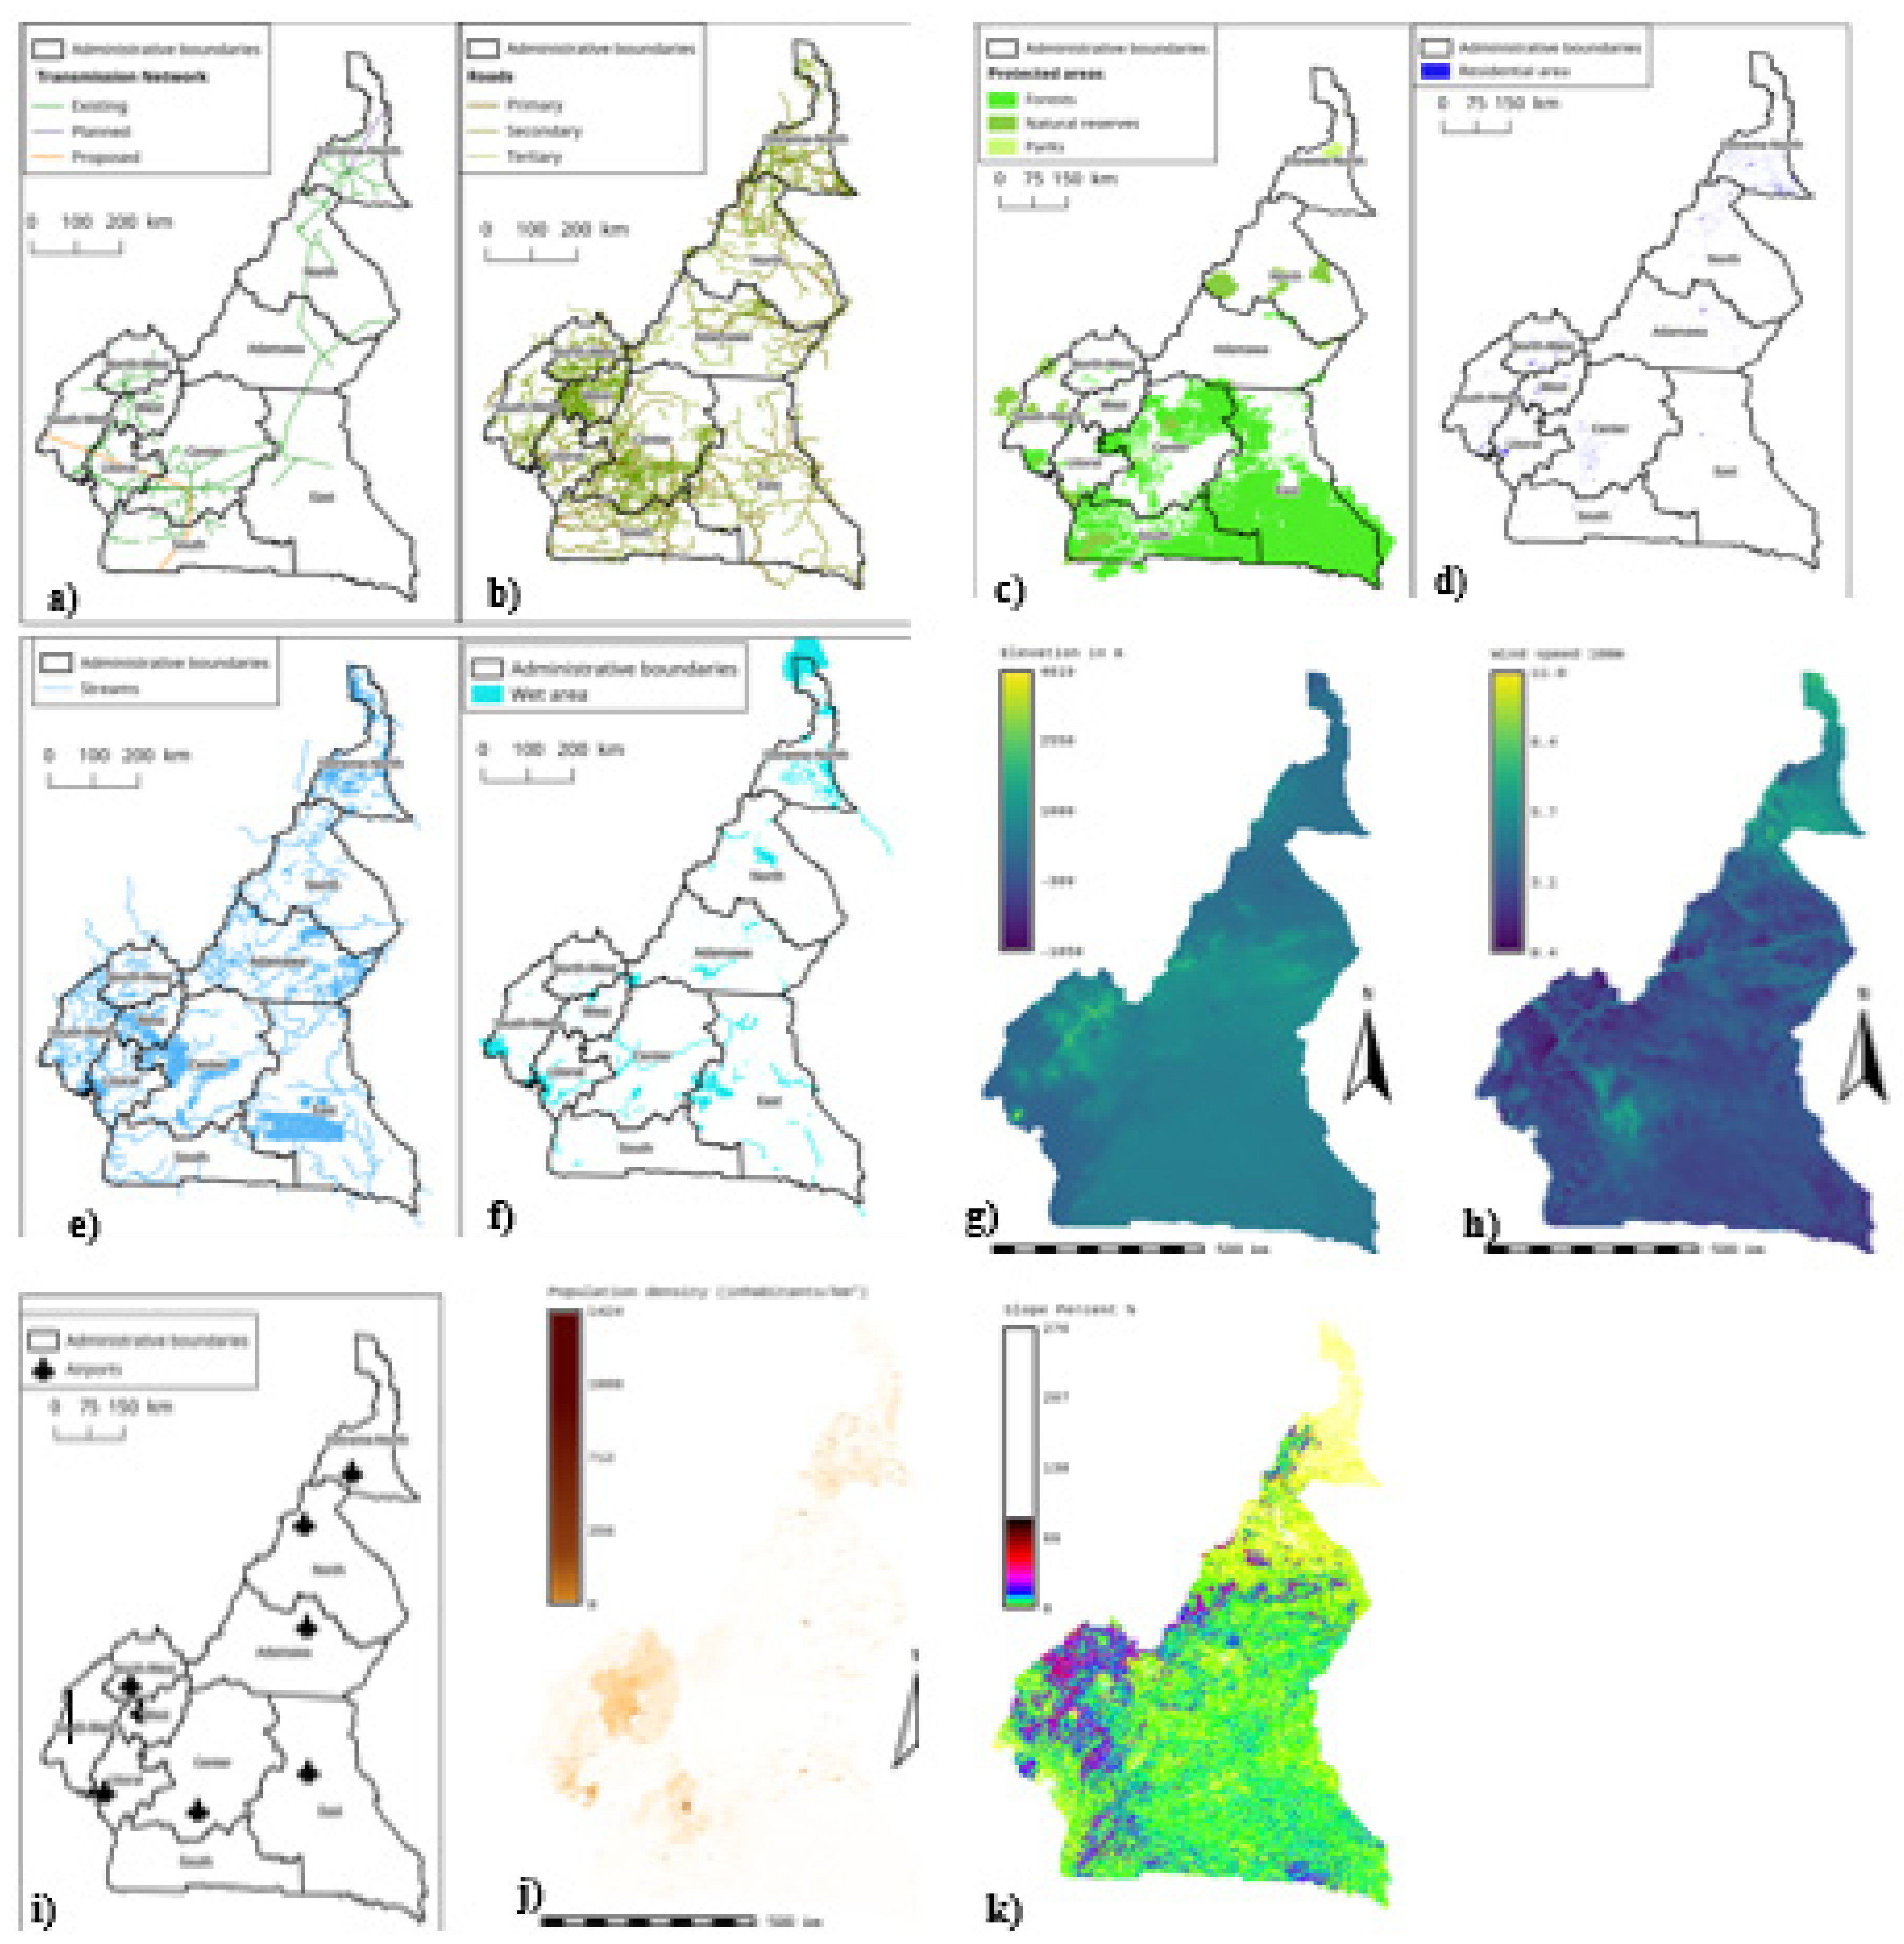
The data required for this study was collected and evaluated prior to analysis in a GIS environment. The portals of various governmental and international organizations were consulted to obtain the latest available data. Data on wind speed at 100m height, altitude and slope were collected from the Global Wind Atlas site at a spatial resolution of 1km² [60]. Population density data are obtained from WorldPop with a resolution of 1*1ha [77]. Airport location data are obtained from the Cameroon ADC airport site [62]. Land use and land cover data are obtained from OpenStreetMap [63]. Data on administrative boundaries are obtained from GADM [64]. Data on power lines are obtained from the World Bank website [65]. The description of the data used in this study is listed in Table 3, together with the type of format used, the resolution and their various sources, accompanied by Figure 2.

2.3. Analysis of wind resource siting criteria

The choice of the various selection criteria for this study was finalized after an in-depth review of the literature, and complies with national, environmental and international guidelines. These criteria were also validated by 10 experts whose profiles are listed in Table 10 in the Appendix. This was done in order to minimize any conflicts of interest or personal biases [66]. Eight of the selected experts are based in Cameroon and two in Belgium, and are university professors, professional engineers and researchers with sound knowledge of wind energy applications. The experts based in Cameroon have a good knowledge of the soil conditions in the study area.
Although wind speed (m/s) is an essential parameter to consider when choosing a large-scale wind farm connected to the electricity grid, technical-economic and socio-environmental factors are also important when choosing a wind farm [22,24]. In addition to optimal electricity production over their life cycle, wind farms should be placed in locations that would reduce installation and operating costs, as well as socio-environmental impacts such as electromagnetic radiation interference, noise, flickering shadows and vibrations [30]. In this study, seven factors were identified as effective in selecting suitable sites for grid-connected wind farms. These were obtained from scientific research carried out by researchers in other countries and validated by experts based in Cameroon. The factors considered are: wind speed, slope, elevation, distance from residential areas, distance from roads, distance from power transmission lines, population density.

2.3.1. Wind speed

The calculation of wind speed at different heights was based on Hellman's equation (1), which is the most common and simplest relationship for associating wind speed at two heights with n =0.4 for small towns, villages, forests and agricultural land typical of Cameroon [67].
V 2 = V 1 Z 2 Z 1 n
Where V2 is the wind speed at the desired height Z2, V1 is the wind speed at the reference height Z1, and n is the coefficient of friction (terrain-dependent roughness), also known as the Hellman exponent, which is a complex function of local climate, topography, surface roughness, environmental conditions and atmospheric stability, all of which depend on the date on which the wind speed was recorded (day or night).
Assessment of the wind sources available at the site can be made using the wind energy density parameter (in W/m2), given by equation (2) in which P (in W) is the average wind power, ρ is the air density at the location studied (1.225 kg / m3 for the present case), A (in m2) is the area swept by the wind turbine blades and V is the average wind speed [67].
P A = 1 2 ρ V 3
Several authors have considered wind speed to be the most important factor for a wind farm (Table 1). The minimum wind speed required to start production is 3m/s [19]. Several studies have been carried out with different wind speeds, such as Ref [26], which considered a minimum wind speed of 4m/s. For a location to be considered suitable, the lowest average wind speed must correspond to the technical and economic feasibility of the project. In this study, areas with average wind speeds below 4 m/s are considered "unsuitable", speeds between 4 and 5 m/s are considered "less suitable", 5 and 6 m/s "suitable", 6 and 7 m/s "highly suitable", and finally, areas with wind speeds above 7 m/s are considered "most suitable" [72]. Following the classification discussed, the final raster file of wind speed variation was prepared in GRASS GIS 7. The wind speed data were taken from the DTU Global Wind Atlas Project [60]. Figure 3 shows the spatial distribution of Cameroon's mean annual wind speed at 100m height. It can be seen from this figure that the lowest wind speed in the study area is 0.4 m/s and the highest is 11 m/s.

2.3.2. Distance from the power grid

Several authors have used proximity to the power grid as an important parameter for the siting of large-scale wind farms connected to the existing power grid (Table 2). The investment cost of a grid-connected wind farm construction project is reduced when electricity is delivered via existing transmission lines. On the other hand, long transmission lines between wind farms and the power grid are associated with cabling costs and electricity losses. For safety reasons, a minimum distance of 100 m will be observed between the wind farm and overhead power lines to minimize damage caused by any projections made by the wind turbines [54]. For the current analysis, the maps of the national power grid and the power plant are extracted from ENEO's electrical data register, which is a national electricity company responsible for managing electrical energy in Cameroon. In this study, a distance of 10km around the power grid was taken as the favorable zone for wind farm siting [26]. Beyond 10km, the area is considered unsuitable. Data on the electricity grid comes from the World Bank 2022. Figure 3a shows the spatial distribution of Cameroon's high-voltage electricity network.

2.3.3. Distance from residential areas

Proximity to residential areas is a very important factor used by several authors for the siting of large-scale wind farms connected to the existing electricity grid (Table 2). The siting of wind farms close to residential areas has negative social and environmental implications. The negative effects observed can be light reflections, flickering shadows or landscape effects. Accidents caused by the falling propellers of damaged wind turbines, and noise nuisance caused by the rotation of wind turbines have also been observed. Although there is no worldwide agreement on the appropriate distances of wind turbines from dwellings, it is nevertheless important to have a minimum safety distance between wind farms and residential areas in order to reduce socio-environmental impacts. Based on the literature review and international wind energy guidelines from several countries "International Review of Political and Recommendations for Wind Turbine Setbacks from Residences: Setbacks, Noise, Shadow Flicker, and Other Concerns", large-scale wind farms should be built far away from residential areas [73]. Furthermore, it is important that wind farm sites are located at a reasonable distance from residential areas to minimize transmission losses. In this study, a safety distance of 2km around residential areas was taken in order to reduce socio-environmental impacts as in Refs. [53,72]. Data on residential areas are obtained from Open Street Map (OSM 2022) [63]. Figure 3d shows the spatial distribution of residential areas in Cameroon. It can be observed that the East Cameroon zone is the most sparsely populated. This is due to the forest that covers a large part of this region.

2.3.4. Distance from roads

Large-scale wind farms must be accessible from the existing road network to avoid the need to build new roads to serve the site. In addition, expenditure on site construction and maintenance will be considerably reduced if the site is easily accessible by vehicles for transporting materials. According to Table 2, proximity to road networks has been used by several authors as a very important economic factor in reducing investment costs when siting large-scale wind farms. However, a safe distance must be maintained to reduce the risk of fatalities due to accidents caused by projected materials or falling turbine parts. On the basis of the literature review, we have assumed a safety distance of 500 m in this study [23,72]. To reduce transport costs, it is preferable to keep the distance from the road as short as possible. A distance of 10 km around roads is considered to be a suitable area for siting wind power plants, and areas greater than 10km are considered inappropriate [26,53]. Road data is taken from Open Street Map 2022 [63]. Figure 3b shows the spatial distribution of the road network in Cameroon. The data have been filtered to group the main types of road (primary, secondary and tertiary). In this study, we have used primary and secondary roads, as tertiary roads here are mainly tracks and are very poorly developed and maintained. The construction of a wind farm close to tertiary roads would require regular road development and maintenance. This would lead to additional costs.

2.3.5. Slope

Accessibility for the installation and maintenance of large-scale wind farms is hampered by steep slopes, as these prevent installation equipment such as trucks and cranes from depositing the materials needed to erect the turbines on site. Steep slopes increase the cost of construction and maintenance of wind farm installations. For this reason, a maximum threshold should be observed when selecting a wind farm site. Furthermore, wind speed increases with height. It therefore makes sense to choose a slope that would optimize the site's profitability while also being economically viable. In the literature, the maximum permissible slope for wind farms ranges from 10% to 30%. In this study, a slope of 10% was taken as the maximum threshold [33,53]. The elevation map from which the slope is derived comes from the DTU Global Wind Atlas Project [60]. Figure 3g shows the spatial distribution of slope in Cameroon. This map was obtained from DEM using the spatial analysis tool (r.slope.aspect) in GRASS-GIS 7.4.3. It can be seen that the slope in Cameroon varies from 0 to 1,290%. However, most of the study area has a slope of less than 9%.

2.3.6. Elevation

Elevation refers to the vertical geometric height between a point and sea level. Some authors have used elevation as a factor that can influence the choice of site for a large-scale wind farm [7,33,34]. Indeed, the construction of a wind farm in areas with high altitudes is generally considered less suitable due to the additional construction and maintenance costs. In this study, a maximum altitude of 2km was taken as the threshold according to Refs. [34,44]. The elevation map is taken from USGS/NASA SRTM data. Figure 3h shows the spatial distribution of elevation in Cameroon. It can be seen that elevation varies from -1858 to 4010 m in Cameroon.

2.3.7. Population density

Although population density is an important social parameter for the selection of renewable energy plants, to the best of our knowledge, no author has used it as a factor in the selection of the suitable site for the siting of large-scale wind power. However, it has been used by Ref [74], for site selection of photovoltaic (PV) and concentrating solar power (CSP) parks connected to the existing and unconnected electricity grid. For grid-connected sites, the authors minimized population density. Moreover, according to IRENA (International Renewable Energy Agency), population density is an important social parameter when choosing a renewable energy site [75]. Indeed, the negative impact of wind farms on the population means that they should be built as far away from densely populated areas as possible. In this study, areas with a population density of over 500 habitants/km² are considered unsuitable for wind farms [76]. Figure 3j shows the spatial distribution of population density in Cameroon. We can see that population density varies from 0 to 1424 inhabitants per km² in Cameroon. The most densely populated regions are the West and Littoral. The high population density observed in the Littoral region is due to the presence of the economic capital in this region.

2.3.8. Airport safety distance (Constraint factor)

Wind turbines can seriously affect the processes of communication, navigation and surveillance systems used in air traffic control by interfering with the radar signal. Refs [7,34] have considered an important safety distance around airports. In this study, a buffer of 3500 m is observed around the various airports in Cameroon [53]. Relative data on the position of airports in Cameroon come from Cameroon Airport (ADC 2022) [62]. Figure 3i shows the geographical location of the eight airports in Cameroon.

2.3.9. Land use and protected areas (Constraint factor)

When considering the selection of suitable sites for large-scale onshore wind farms, several authors have excluded protected areas and land use from their study area (Table 2). Indeed, wind farms should not be located in forests, woodlands, protected areas, wildlife reserves, archaeological and historical sites, tourist areas and parks. According to studies carried out by INRA, electromagnetic fields generated by high or medium-voltage lines, transformers, wind turbines or other electrical sources can create stray currents above a certain threshold, which can have a negative impact on animals and farms located nearby [77]. In this study, protected areas and land use were considered unsuitable for the installation of wind farms, and a 300m buffer zone was established around these areas to reduce environmental impacts [54]. Land use data are taken from OSM 2022 [63]. Figure 3c shows the spatial distribution of protected areas in Cameroon. They are grouped into three categories (parks, forests and nature reserves).

2.3.10. Water bodies and wetlands (Constraint factor)

Some authors have used water bodies and wetlands as a parameter that can influence the installation of large-scale wind farms (Table 2). The construction of wind farms in water bodies or wetlands is not advisable, as it would block the flow of water and be more costly [23,72]. Consequently, a buffer of 400 m was taken as a safety distance around water bodies or wetlands [23,53,54]. Figure 3e and Figure 3f show the Streams and Water bodies of Cameroon.

2.3.11. Plant required (Constraint factor)

Some authors have used the minimum surface area required as an important constraint factor for the installation of a large-scale onshore wind farm connected to the existing electricity grid.
Indeed, in this study, we identify suitable sites for the construction of large-scale wind power plants connected to the electricity grid in order to produce the electrical energy required to supplement the population's electricity needs. Consequently, it is essential that these plants have the dimensions required to cover the population's electricity needs. In this study, the minimum area required for the installation of a wind farm is 4 km² [53,55]. Figure 3 shows the distribution of the various study inputs. These include the spatial distribution of the power grid, roads, watercourses, altitude, slope, protected areas, residential areas and airports.

2.4. Methodology

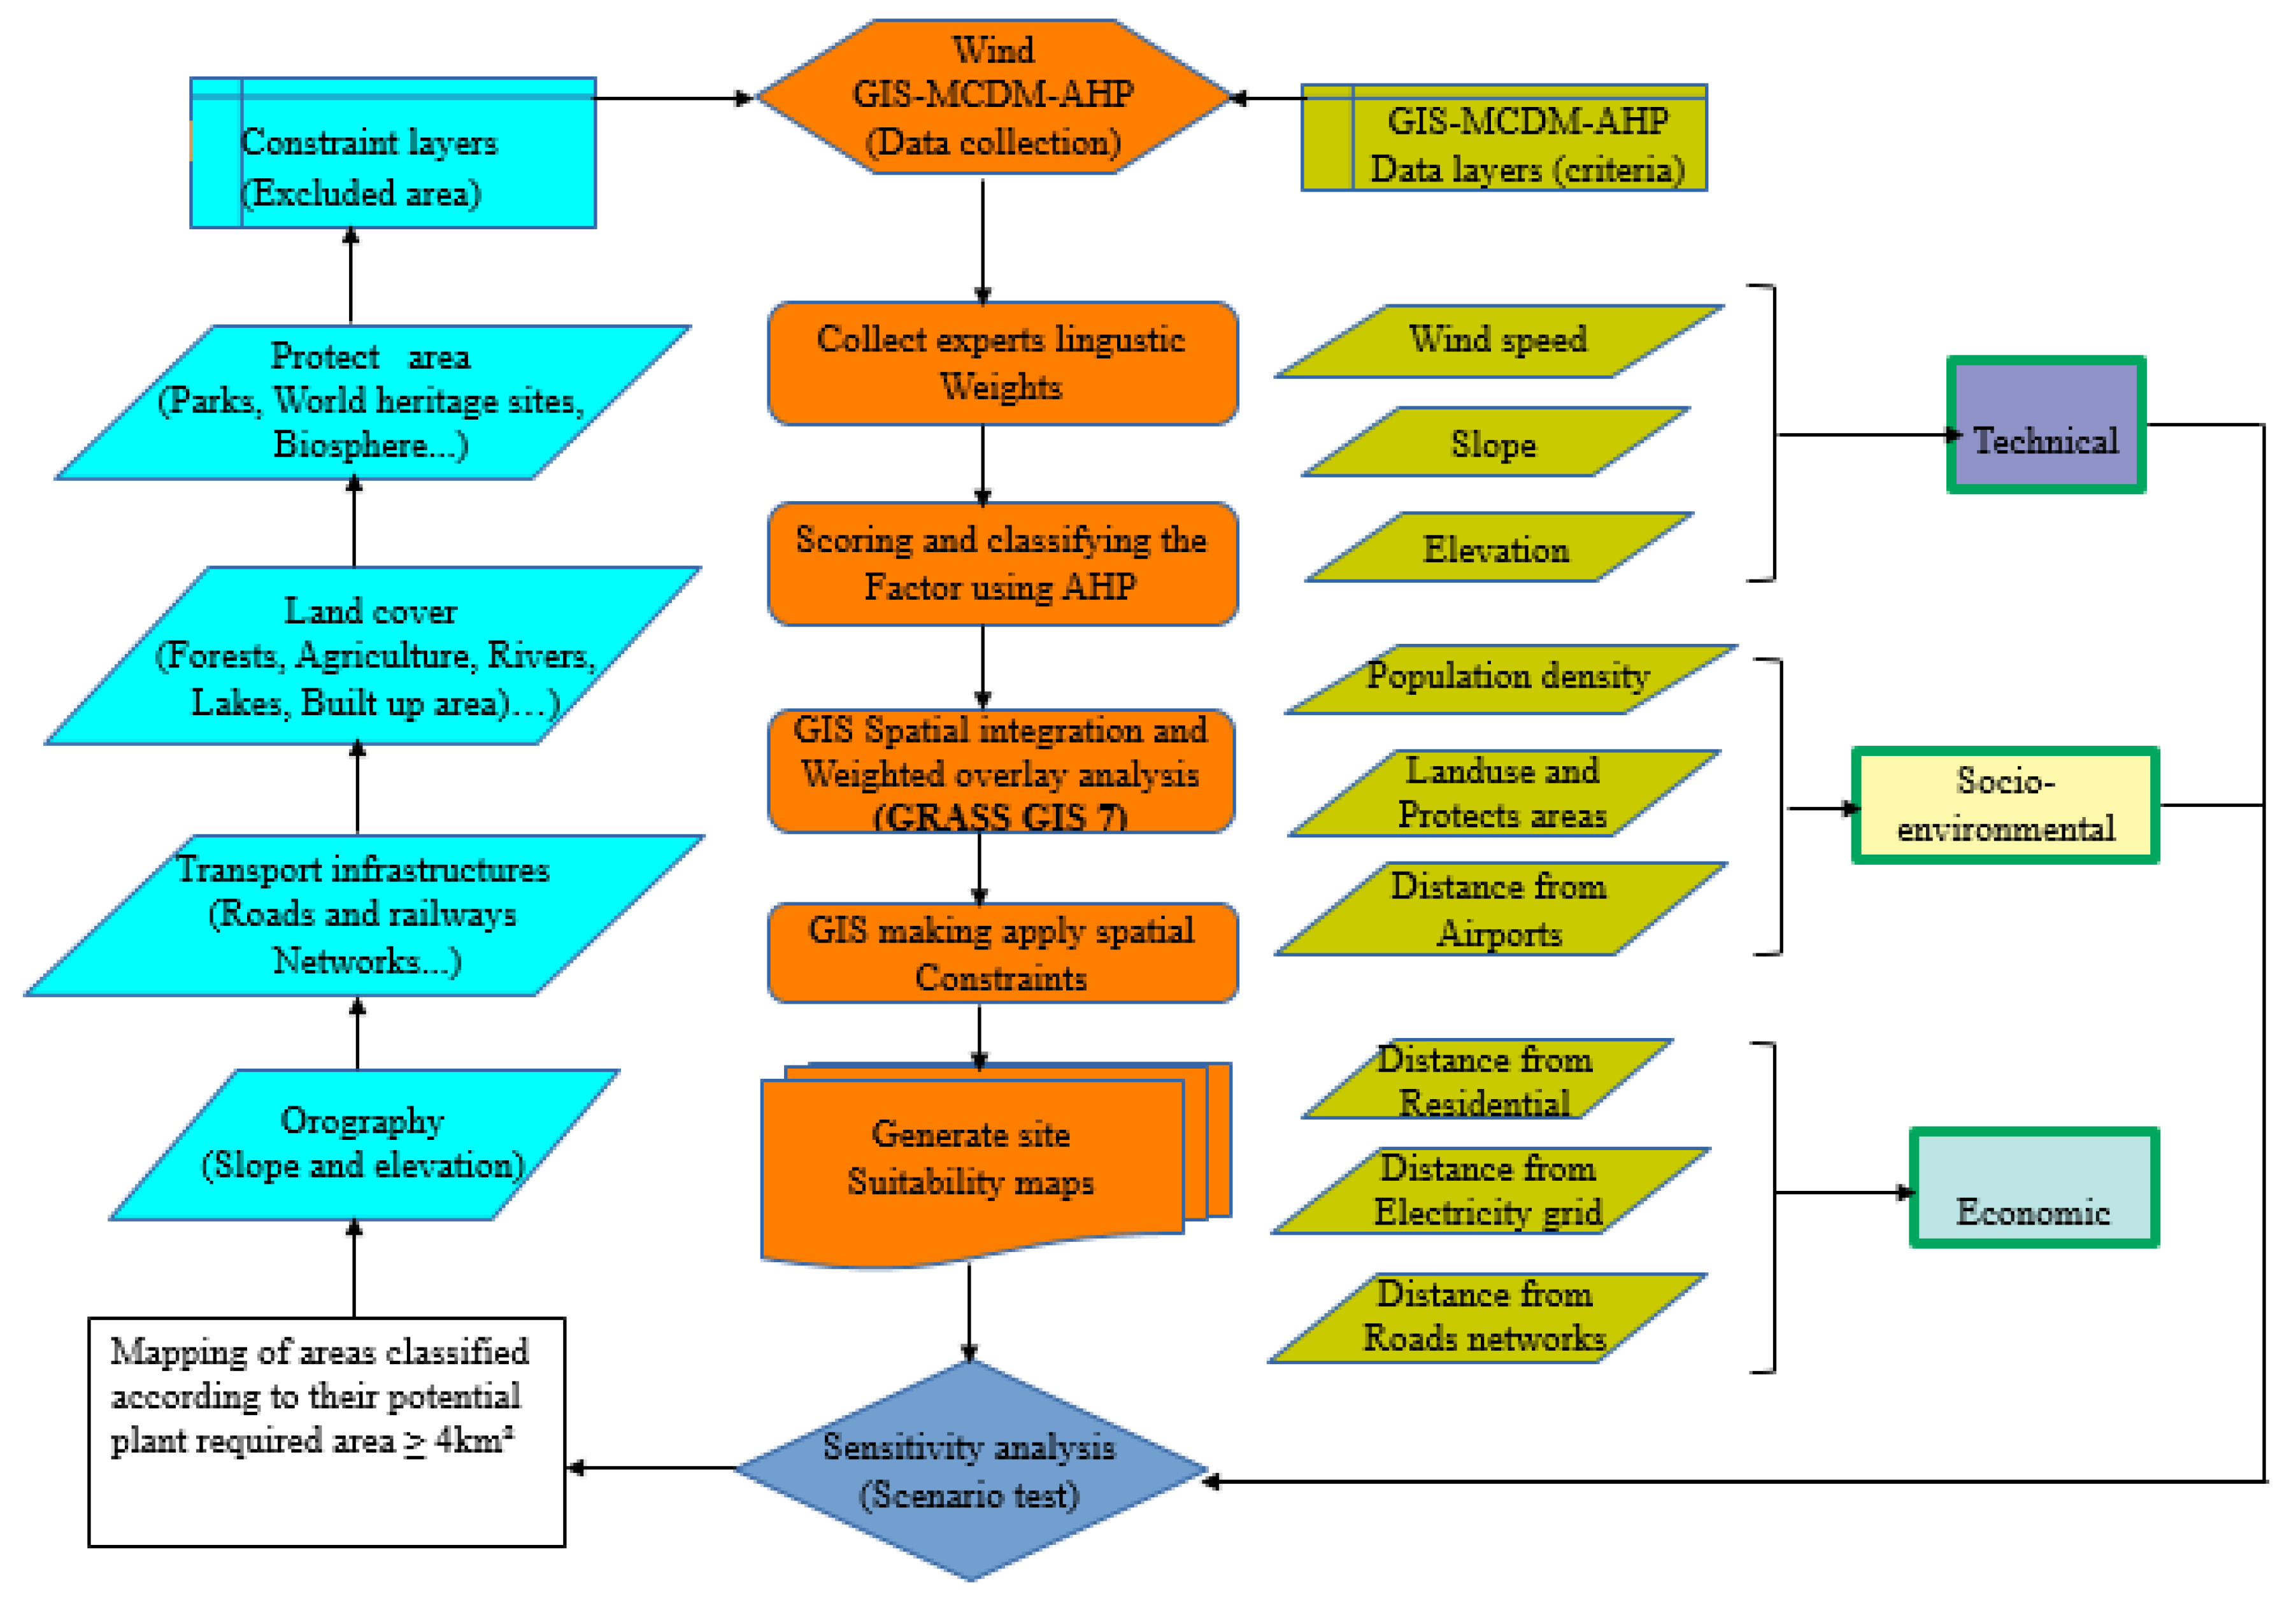
The methodological approach used here is a combination, the details of which are shown in Figure 4.

2.4.1. Geographical Information Systems (GIS)

Geographic Information Systems (GIS) have been used as a research and application tool since the 1970s, enabling the creation, management, analysis and mapping of all types of data [78]. It is applied in many scientific and industrial fields. The main objective of GIScience is to formalize geographic principles in order to explore the scientific and political applications of geographic information. GIS is also used to reveal and analyze the complex relationships that organizations, individuals and society have with geographic information technologies. In addition, they enable geographic data to be stored, retrieved, manipulated, analyzed and mapped [79]. Rasters and vectors are the two types of coverage representation in GIS. Raster is represented by a rectangular grid called pixels, which contains specific information according to a specific geographic location. Vectors manage a geometric figure (points, lines and polygons) defining the boundaries associated with a reference system. The storage of this information is presented in a Geodatabase, which provides data order, structure and normalization [80]. In this study, all geographic information was processed in raster form at a resolution of 1km*1km. Vector data (waterbodies, power lines, road network, residential areas, spatial distribution of airports, land use...) were rasterized to make them homogeneous with raster data (wind speed, elevation, population density...). In this study, Boolean logic based on 0 for non-appropriate and 1 for appropriate is used to extract inappropriate areas. The free software GRASS GIS.7 and QGIS 2.18 were used to pixelate and normalize the data layers in this study. QGIS 2.18 was used to extract data from Cameroon and to create layouts. XLSTAT software was used to calculate the weights of the various parameters and the coherence index (CI). GRASS GIS.7 software was used to carry out the methodology and extract the results. Statistical analysis was also carried out in GRASS GIS.7 and presented using LibreOffice Calc.

2.4.2. MCDM-AHP method

Numerous multi-criteria decision support methods, such as FAHP, BMW, AHP, etc., can be used to determine criteria weightings. The aim of these methods is to help decision-makers formalize a problem and clarify the decision-making context, before proceeding with the evaluation and comparison of solutions. The MCDM-AHP (hierarchical multicriteria analysis) method developed by Saaty and Vargas is the most widely applied MCDM tool for facilitating the ranking of site alternatives, and is among the simplest to implement [82,83,84]. It calculates an aggregated synthetic score based on a hierarchical ranking and weighting of all the criteria involved in the decision. It has been widely used by many authors in several energy fields, such as renewable and conventional energy planning, energy resource allocation, building energy management and electric utility planning [85]. However, AHP (Analytical Hierarchy Process) has been criticized for the rank inversion that occurs when adding or deleting parameters that influence all other parameters [86,87]. To cope with inaccuracy, AHP uses a consistency test to filter out inconsistent judgments. In addition, commercial software such as XLSTAT supports the method to overcome the influence of rank inversion. Overall, AHP is accepted by the international scientific community as a robust and flexible MCDM technique to facilitate the solution of complex decision problems [88]. It remains the most popular method for establishing weighting criteria in the evaluation of renewable energy site selection. In addition, the application of GIS-based AHP for the identification of suitable sites for wind farms has been used in recent years by Refs. [7,21,23,28,31,89].
Table 4. The fundamental scale of absolute numbers [90].
Intensity of
Importance
Definition Explanation
1 Equal Importance Two activities contribute equally to the objective
2 Weak or slight
3 Moderate importance Experience and judgement slightly favour one activity over another
4 Moderate plus
5 Strong importance Experience and judgement strongly favour one activity over another
6 Strong plus
7 Very strong or demonstrated importance An activity is favoured very strongly over another; its dominance demonstrated in practice
8 Very, very strong
9 Extreme importance The evidence favouring one activity over another is of the highest possible order of affirmation
Table 5. Random index RI.
n 1 2 3 4 5 6 7 8 9 10
RI 0.00 0.00 0.058 0.90 1.12 1.24 1.32 1.41 1.45 1.49
It is appropriate to initially qualify the decision-making framework relating to the decision problem. This step is applicable regardless of the AMC method chosen and allows the establishment of the entity responsible for the decision, the limits of the evaluation, and to define in particular what are the development alternatives (or scenarios) to be evaluated, and what are the relevant criteria (technical, economic, social) to use to compare them.
The main stages of the AHP methodology are described below:
Step 1. Develop the hierarchical structure of the decision problem.
Step 2. Develop a pairwise comparison matrix of the decision problem as illustrated in equation (3) using the Saaty point scale of 1 to 9 based on Table 4.
A i j = A 11 A 12 A 1 n A 21 A 22 A 2 n A n 1 A n 2 A n m
Step 3.Calculate the consistency index (CI) from equation (4). The CI consistency index is used to measure the consistency of the pairwise comparison of the matrix.
C I = λ max n n 1
λ max is the eigenvalue and n is the number of main criteria which is seven in this study.
Step 4. Calculate the consistency rate (CR) from equation (5)
C R = C I R I
Where RI is the random consistency index which depends on the number of main criteria as shown in Table 5. In this study, the RI is 1.32 because, the number of main criteria is seven. When comparing pairwise, the consistency rate (CR) must be less than 10%; if it exceeds 10%, the results may be inconsistent. In this study, the random consistency index CI is 8%. for the economic and technical scenarios, the CI is 4.5%. We can therefore conclude that these values are adequate for the study. In this study, the AHP method allowed us to obtain the different weights of the 7 main criteria. The total fit score is calculated by adding the factor weights according to equation (6):
S = i = 1 i = N W i P i
where Wi is the ith weight of the criterion and Pi the score of the criterion of the ith factor. Table 7 presents the factors and weightings chosen for the evaluation of wind energy production potential. The different weightings corresponding to the sensitivity analysis are also listed in this table. The final map is obtained by multiplying the map resulting from equation 6 by the constraint layer using the “Raster calculator” tool in the free software Grass Gis 7. The formula used is that presented in equation ( 7).
S u i t a b i l i t y M a p = i = 1 i = N W i P i * c o n s t r a int

2.4.3. Theoretical wind power potential

The theoretical wind energy potential for suitable land areas can be obtained as a function of rotor diameter, turbine production capacity and the total area of suitable land available. Equation (8) is used to calculate the theoretical wind energy potential [47,53].
T W P P = T A * A F
Where TA is the total area of suitable land available in the identified range (km²), AF is the area factor (MW/km²) and TWPP is the theoretical wind power potential (GW). The turbine used in this study to assess the theoretical wind power potential is the V110-2.0 MW® IEC IIIA turbine. This turbine is extremely reliable, with documented high performance and availability. This turbine contributes to an increase in productivity by opening up low-wind sites previously considered unsuitable. To maximize power output in areas with low wind speeds, the turbines' 110 m rotor takes greater advantage of the wind available at an incredibly low speed of 3 m/s. With its 54 m blades, the V110-2.0 MW® IEC IIIA offers an exceptional rotor-to-generator ratio, producing outstanding capacity and efficiency in low- and medium-wind sites. The area factor of this turbine is 4.722 MW/km2. This turbine was also used by Saraswat [44] in India to assess the country's theoretical wind potential.
Table 6. Restriction criteria from chosen wind farm site selection studies [17].
Plant required area in km2 [93] Wind speed (m/s)
/density
Potential [9]⁠
Buffer
distance/
proximity
from
electricity
grid, m[9]⁠
Proximity
/buffer
to roads &
highways, m[94]⁠ ; ⁠
Buffer
distance
from forests
& parks, m
Buffer
distance
from
airports, m[94];⁠
Buffer distance/ proximity from residential, m[94]⁠ ;
Buffer
distance from lakes, m[94]⁠
Buffer
distance from rivers, m[94]⁠
Slope,% [94]⁠ Elevation (m) [9]⁠
>=4 >4
>250 and <10000 >500 and <10000 >300 >3500 >2000 >400 >400 <10 <2000

Table 7. Reclassification of weighted criteria for wind power [9].
Economic Technical Social
Category Proximity (m) Wind speed (m/s) at 100m Slope (%) Elevation (m) Population density,
Minimize density in inhabitants/km²
score Relevance
Proximity from roads and
highways
proximity
from
electricity
grid (in m)
proximity from residential,
A <500 <250 <2000 <4 >15 2001-2384 >500 0 Unsuitable
B >15000 >20000 2001-6000 4-5 10-15 1001-2000 500-100 1 less suitable
C 10001-15000 10001-20000 6001-10000 5-6 6-10 501-1000 50-100 2 suitable
D 5001-10000 5001-10000 10001-20000 6-7 3-6 201-500 1-50 3 Highly suitable
E 501-5000 251-5000 >20000 >7 <3 <200 0 4 Most suitable

Sensitivity analysis
0,104 0,147 0,096 0,326 0,043 0,082 0,224 weight
10 % 15 % 9% 32% 4 % 8% 22% Nornalized weight
34 % 44 % 22% CR=8%
6,5% 15% 5 % 35 % 10 % 15,7% 12,8% Scenario 1 (Technical weight)
26,5 % 60,7 % 12,8 % CR=4,5%
15,7% 35% 10 % 15% 5% 6,5% 12,8% Scenario 2 (Economic weight)
60,7 % 26,5 % 12,8% CR=4,5%
14 % 15 % 14 % 15 % 14 % 14 % 14 % Scenario 3
(Equal Weight)
43 % 43 % 14 %

3. Results and discussion

3.1. Final determination of suitable lands

The 7 selection criteria for this study were finalized after an in-depth review of the literature and the approval of the ten experts interviewed in order to minimize conflicts of interest and personal bias [52]⁠. Indeed, eight of the chosen experts are based in Cameroon and are professional engineers, officials of national energy authorities, university professors and researchers with a solid knowledge of wind energy applications as well as a knowledge of the conditions of occupation and use of land in Cameroon. To have a little diversity, we also consulted two experts at the Free University of Brussels to get the opinion of experts working in industrialized countries.
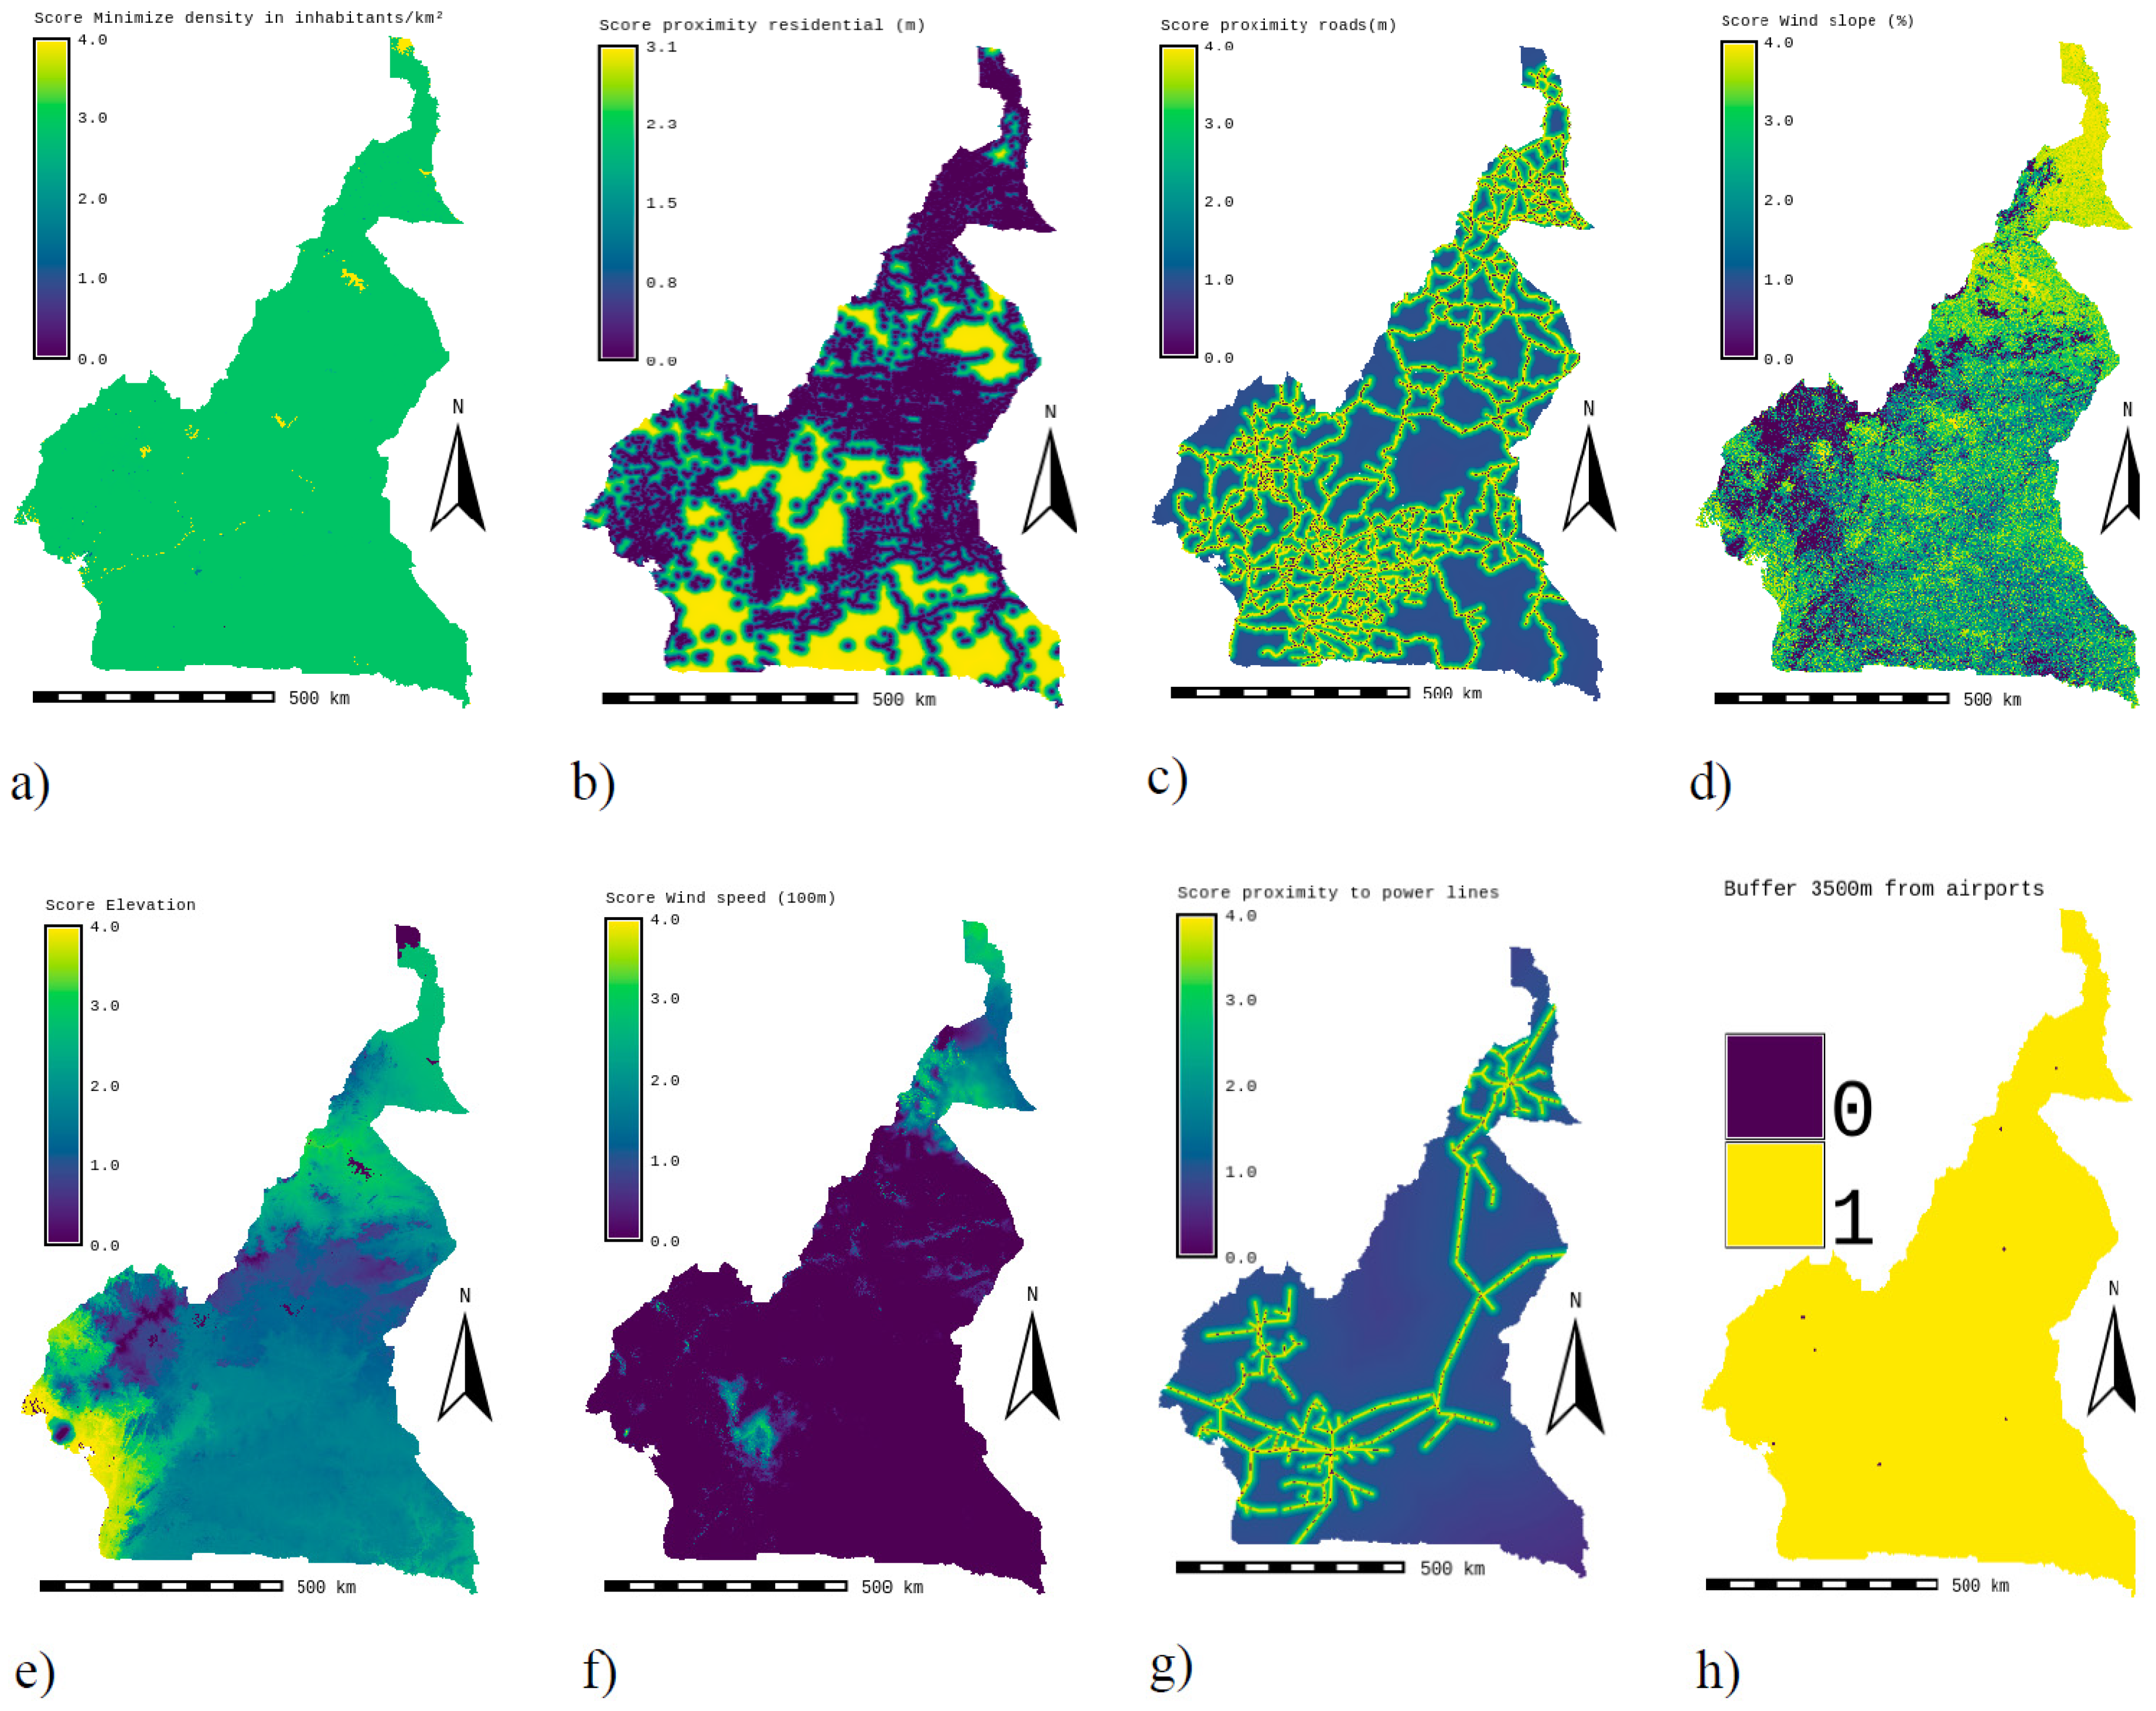
In this study we have associated the different scores with the following land suitability indices: 0-Unsuitable; 1- Less suitable; 2-Suitable; 3- Highly suitable and 4- Most suitable. This allowed us to reclassify the different factors. The maps corresponding to the reclassified layers of location factors of wind farms connected to the large-scale grid are presented in Figure 5. These maps are constructed from the data in Table 7 corresponding to the factors and weightings chosen for the evaluation of the potential of large-scale grid-connected wind power generation. Table 7 also presents the different weights corresponding to the different factors according to the different scenarios. Land suitability index maps are determined by combining AHP with GIS for locating suitable sites for large-scale onshore wind farms in Cameroon under different scenarios. Figure 9 shows the graphical interpretation of land suitability zones for three sensitivity cases.
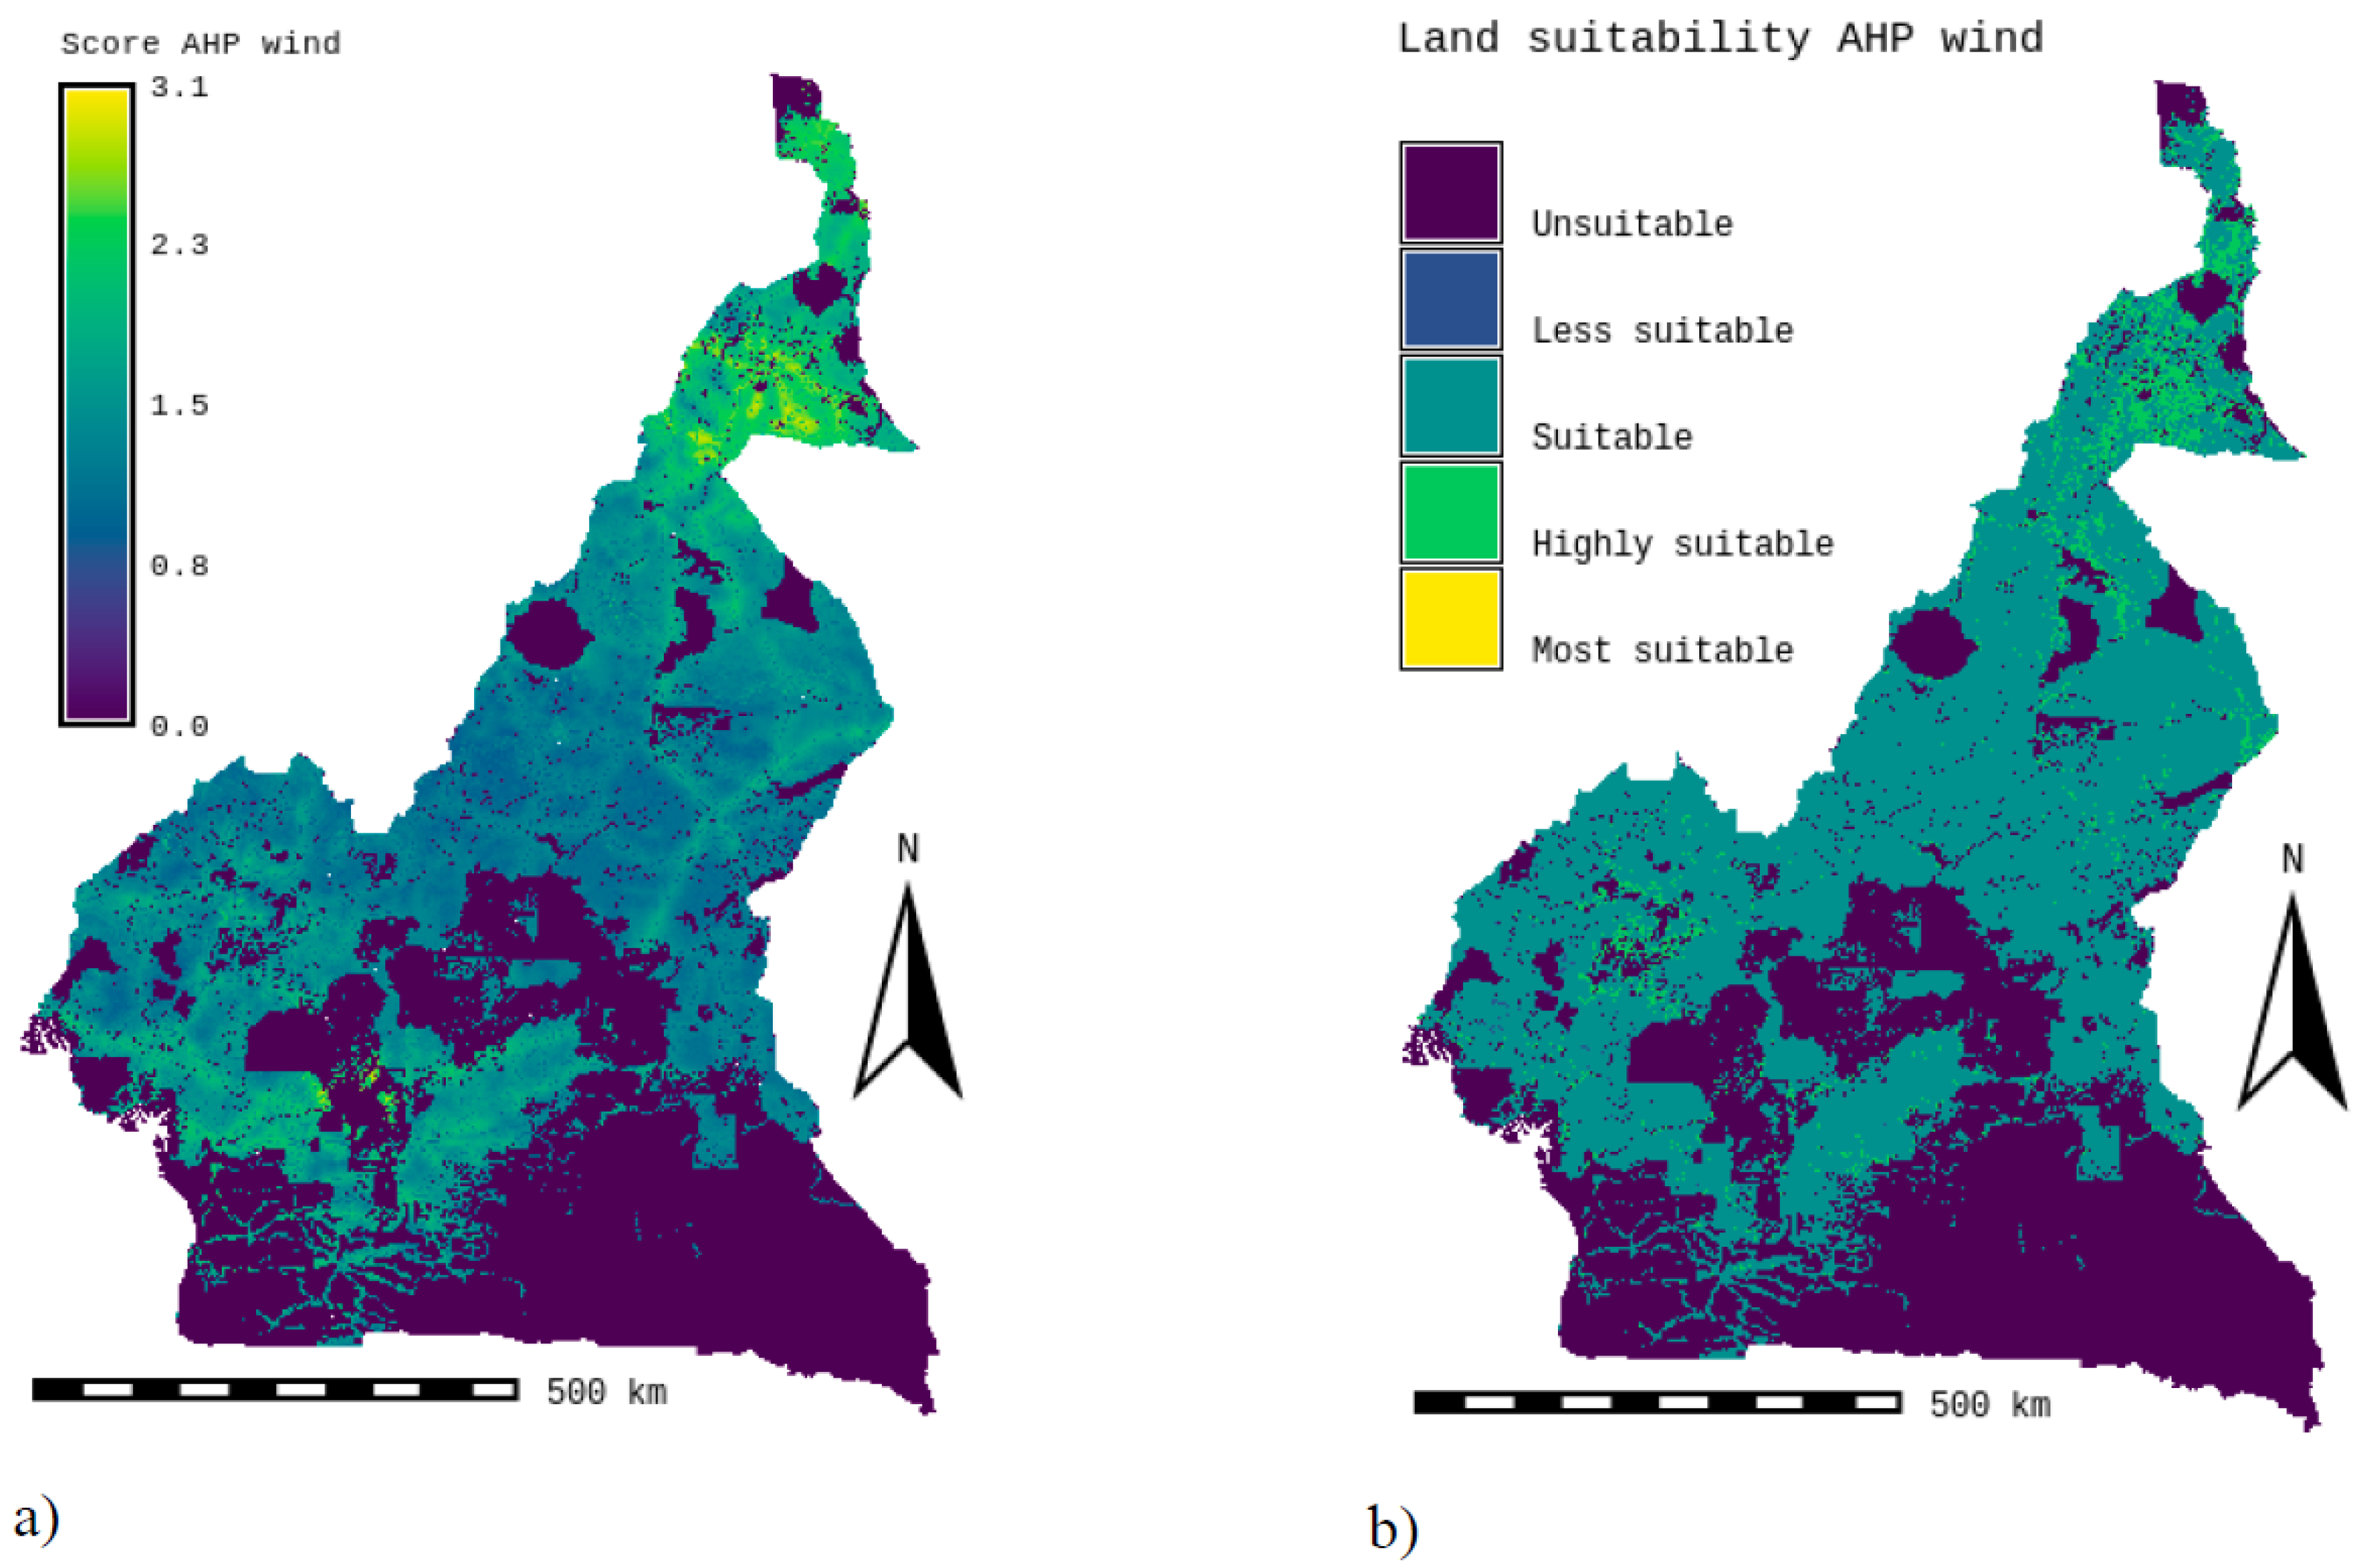
The results obtained from the analysis are summarized in this section. This study aimed to evaluate suitable sites for connected onshore wind farms in Cameroon using the GIS-MCDM-AHP approach. Seven factors grouped into three aspects were selected based on the literature review, expert opinion and above all, according to the study requirements for onshore wind farms connected to the electricity grid. This is the technical aspect (wind speed, slope, elevation); The economic aspect (distance from electricity networks, distance from roads, distance from residential areas) and the social aspect (population density). The factor weights were obtained from the AHP approach and based on the judgment of the ten experts collected during the interviews. The technical, economic and social factors are first compared two by two to obtain the overall importance of each factor. Table 7 shows that the technical aspect is the most important with a preference score of 44% followed by economic aspects 34% and social aspects 22% for onshore wind farms connected to the grid. We also note that “wind speed” is the most dominant factor with a weight of 32%. With a weight of 22%, “population density” is the second most important factor while “proximity to the electricity grid” is the third important factor with a weight of 15%. “Proximity to the road network” is the fourth choice with a weight of 10%. This is followed by the factors “proximity to residential”, “elevation” and “slope” with weights of 9%, 8% and 4% respectively. All these features are listed in Table 7. The scores and capability maps of the GIS-AHP combination are shown in Figure 6-a and Figure 6-b. After analyzing Table 8 listing the statistical information and the theoretical wind potential, we see that 42.40% of Cameroonian territory is considered unsuitable for the installation of large-scale wind power plants. This same table 8 shows that 5.67% is most suitable with a wind potential of approximately 153.652 GW. 50.89%; 1.04% and 0% are suitability respectively; less suitability and highly suitability with wind potentials of 1377.926GW and 28.163 GW and 0GW respectively.

3.2. Sensitivity analysis

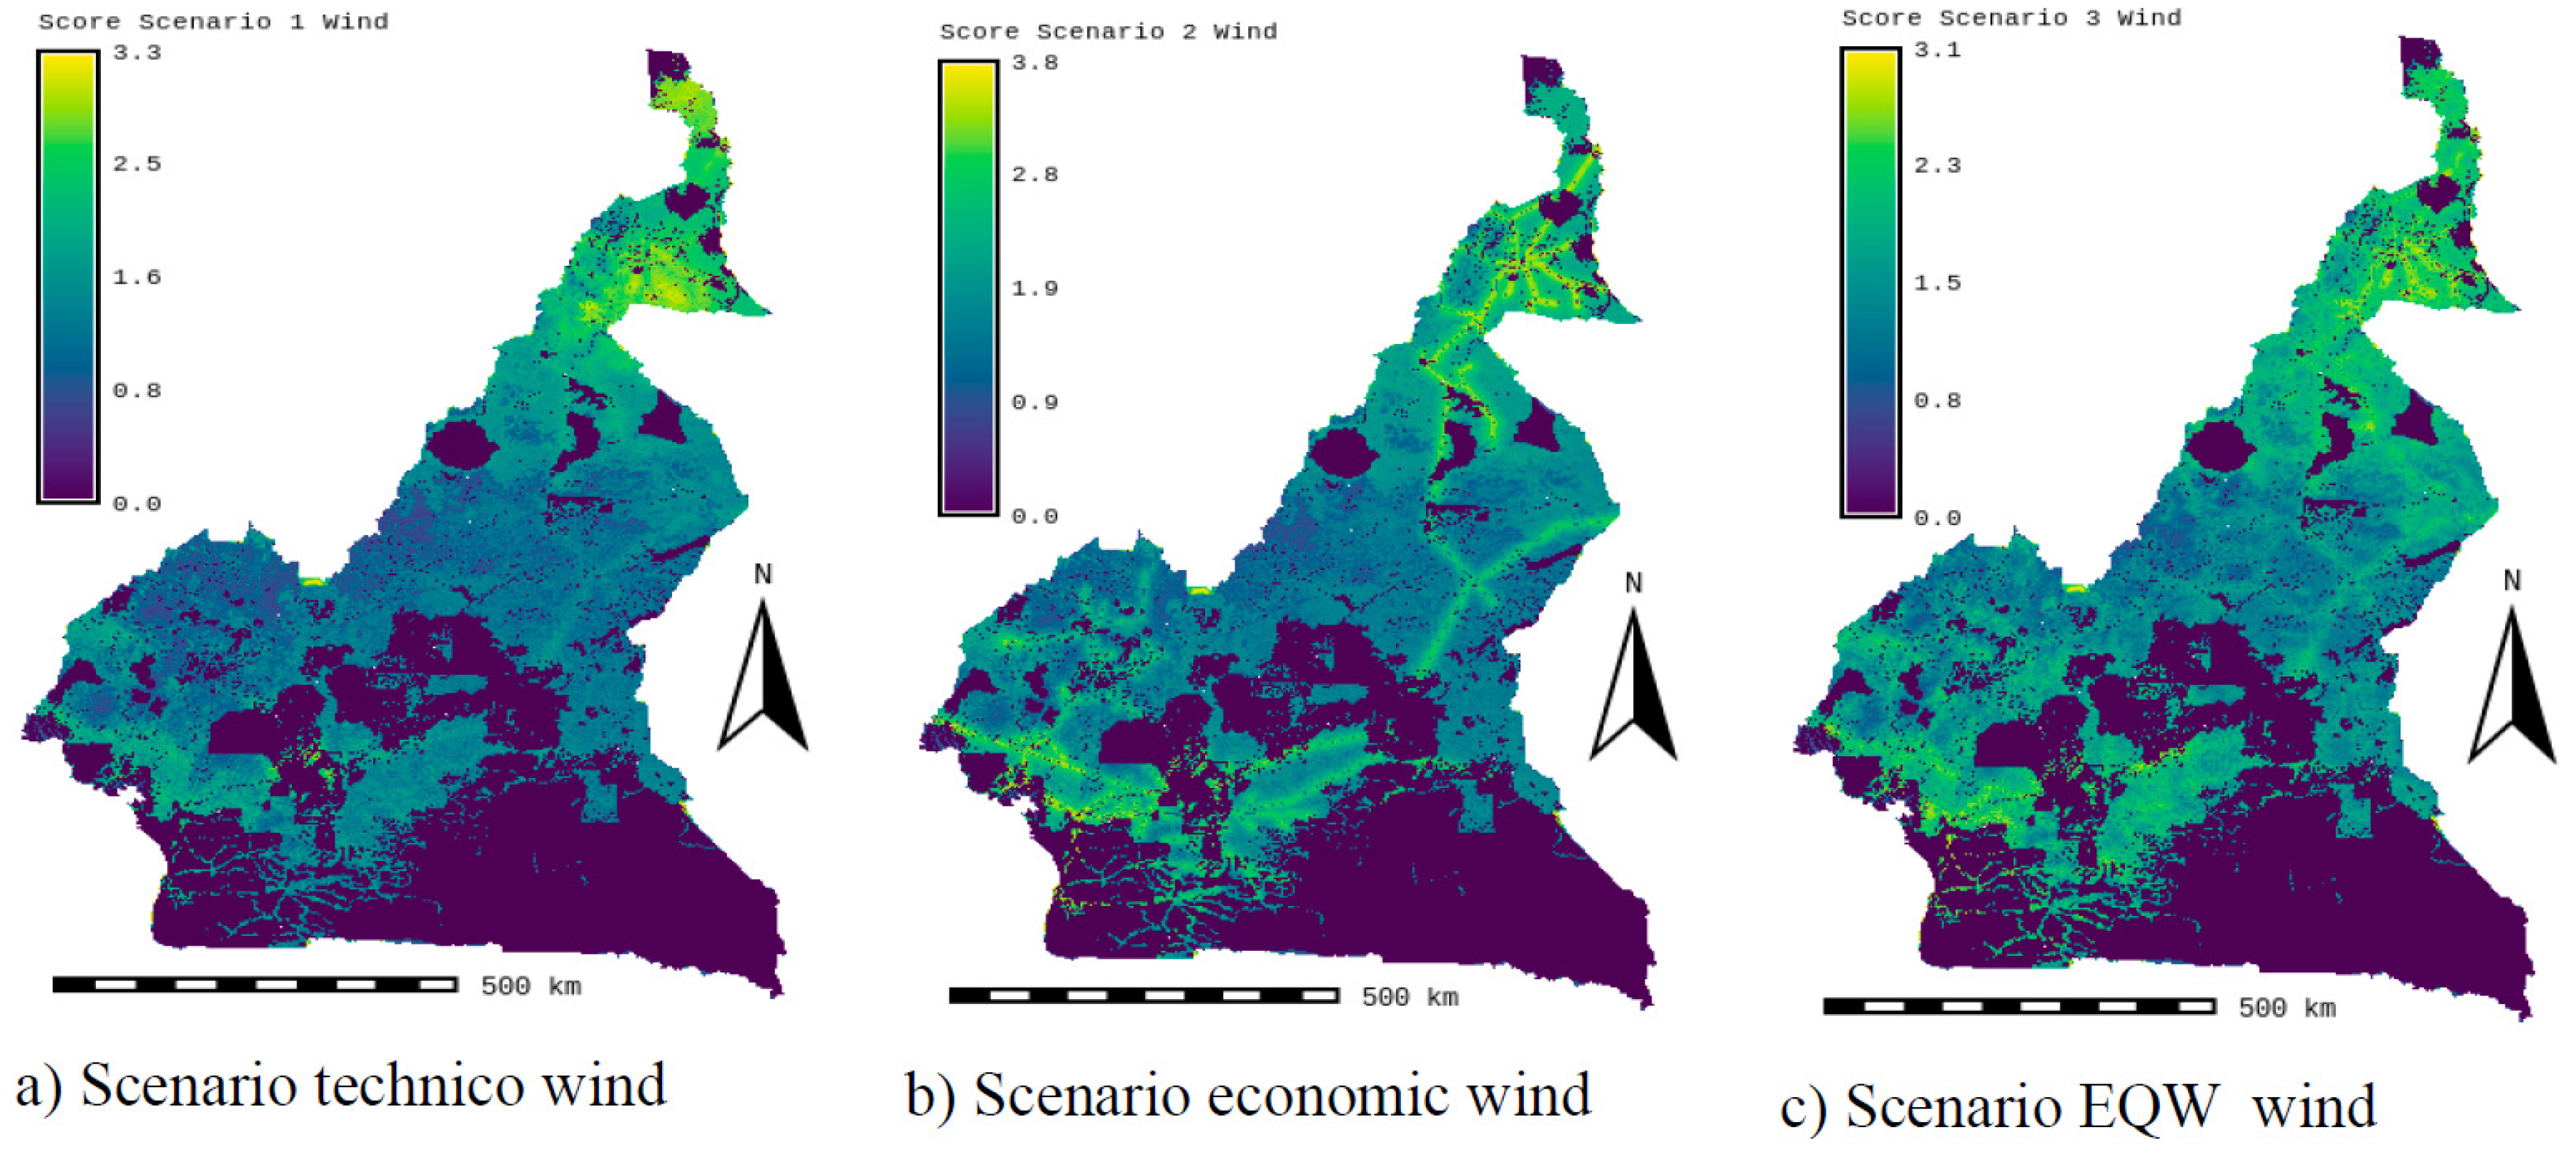
The sensitivity analysis takes into account three scenarios: the technical scenario, which assigns a higher weight to the technical factors (scenario 1); the economic scenario, which assigns a higher weight to the economic factors (scenario 2); and the equal weight scenario (scenario 3), which assigns the same weight to all factors. Table 8 lists statistical information on land suitability zones and theoretical wind power potential in GW for the different scenarios.
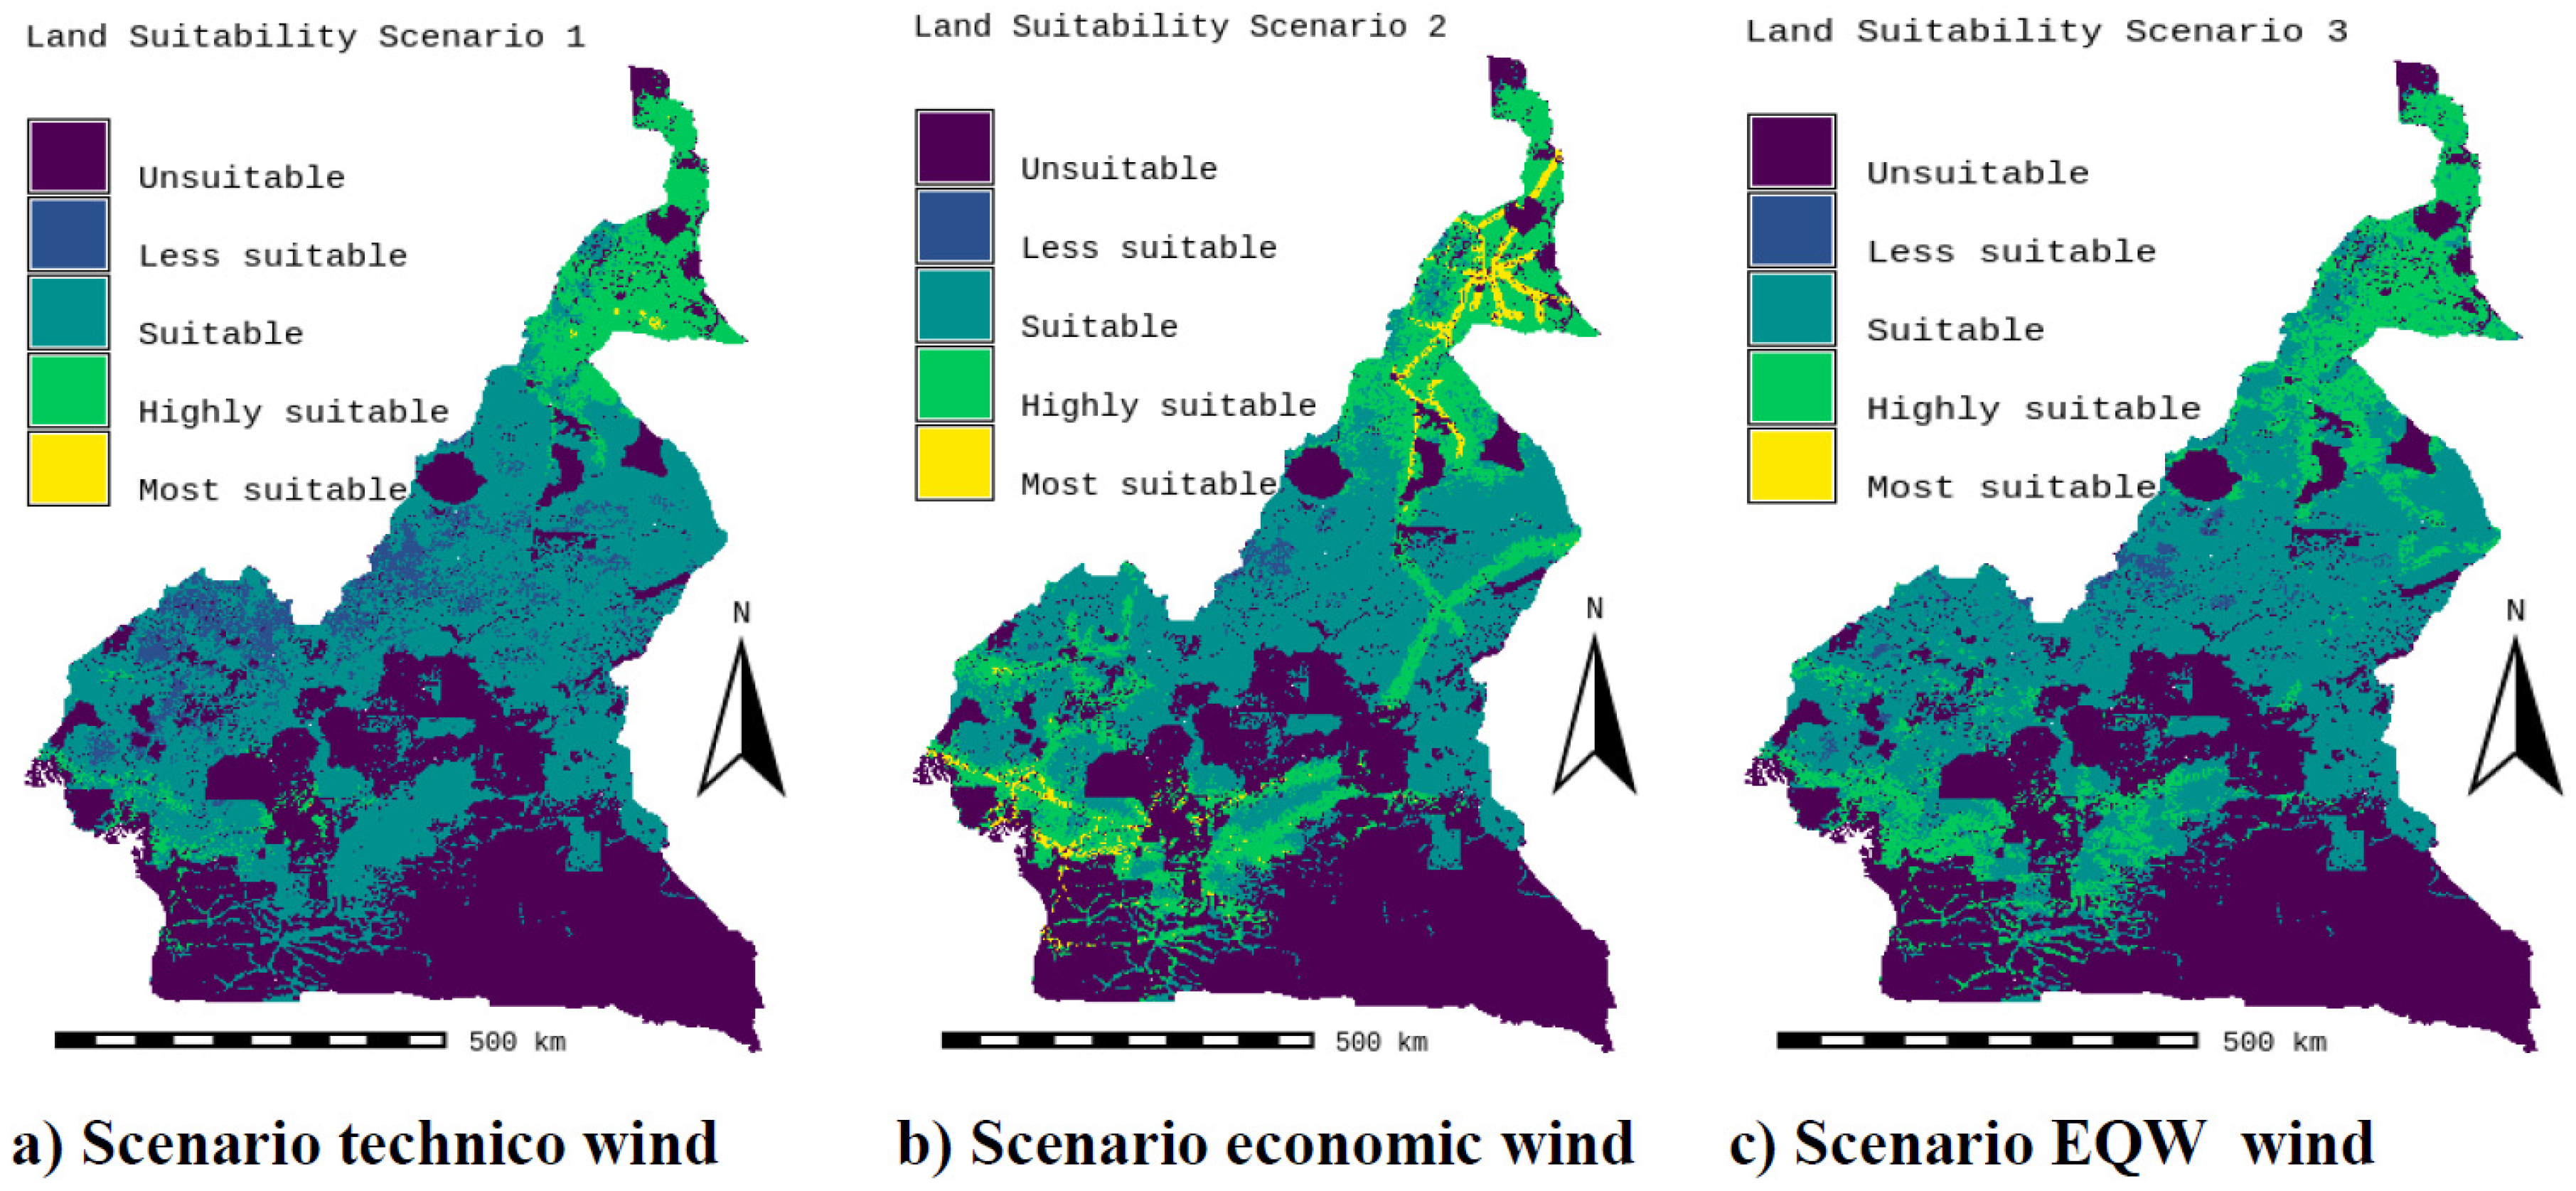
The combined technical scenario (scenario 1) assigns the greatest weight to technical factors (60.7% wind speed, elevation and slope) and the lowest weights to economic and social aspects (26.5% and 12.8% respectively). The weights of the factors corresponding to the technical scenario are listed in Table 7, and the suitability maps resulting from the GIS-AHP combination are illustrated in Figure 5-a and Figure 6-a. After analysis of Table 8 listing statistical information and theoretical wind potential, it can be seen that 42.40% of Cameroon's land area is considered unsuitable for large-scale wind power plants. This corresponds mainly to protected areas, land use, transport infrastructure, airports, watercourses, orography and the various criteria based on climatic, orographic, location and watercourses factors in order to optimize the siting of large-scale wind farms. Table 8 also shows that 0.07% of Cameroon's land is highly suitable for large-scale wind farms, with a corresponding technical wind potential of around 2GW in this technical scenario; 8.17% is most suitable, with a wind potential of around 221.108GW; the highest percentage, 43.26%, corresponds to suitability, with a wind potential of 1171.6GW. 6.10% of Cameroon's land area is less suitability, with a wind energy potential of 165.135GW. Comparing the initial study result with the technical scenario, we note that the area corresponding to highly suitability increases from 0 km² to 423,264 km², i.e. an increase of around 423,264 km²; the area corresponding to suitability decreases from 291809.767 km² to 248115. 271 km², a decrease of 43694.496 km²; the area corresponding to most suitability increases from 32539.747 km² to 46824.981 km², an increase of 14285.234km²; the area corresponding to less suitability increases from 5964.161 km² to 34971.342 km², an increase of around 29007.181km². In addition, wind speed is the main factor influencing this scenario, with a weight of 35%. In summary, it can be concluded that the transition from the initial scenario to the technical scenario results in an increase in the highly suitability, most suitability and less suitability zones, and a decrease in the suitability zone.
The economic scenario (scenario 2) assigns the greatest weight (60.7%) to economic factors (proximity to power grids, roads and residential areas), followed by technical factors (26.5%) and social factors (12.8%). The weights of the various factors corresponding to the economic scenario are listed in table 7, and the suitability maps resulting from the GIS-AHP combination are illustrated in figures 5b and 6b. After analysis of Table 8 listing statistical information and wind potential, we note that 42.40% of Cameroon's land area is considered unsuitable for the siting of large-scale wind power plants. Table 8 also shows that 2.40% of Cameroonian land is highly suitable for large-scale wind farms, with a corresponding technical wind potential of around 65.093 GW; 18.95% is most suitable, with a wind potential of around 513.03 GW; 35.58% and 0.68% are respectively suitable and less suitable, with wind potentials of 963.384GW and 18.335 GW respectively. Comparing the initial study result with the socio-economic scenario, we note that the area corresponding to high suitability decreases from 0 km² to 13784.946 km², i.e. an increase of 13784.946 km²; the area corresponding to suitability increases from 291809.767 km² to 204020. 342 km², a decrease of 87787.425 km²; the area corresponding to most suitability increases from 32539.747 km² to 108646.7543 km², an increase of 76107.007km²; the area corresponding to less suitability decreases from 5964.161 km² to 3882.816 km², a decrease of around 2081.345 km². In addition, proximity to the power grid is the main factor influencing this scenario, with a weight of 35%. Since electrical energy cannot be stored once it has been produced, and since transporting it over long distances leads to losses, it is very economical to build large-scale wind power plants close to power transmission lines, so as to avoid having to build new lines to transport the electricity. This will optimize transmission and reduce investment costs. In summary, we can conclude that the transition from the initial scenario to the economic scenario results in a decrease in the highly suitability, suitability and less suitability zones; and an increase in the most suitability zones.
The equal weight scenario (scenario 3) assigns the same weight to all factors, i.e. 14% and 15% for the 7 factors. This scenario assigns 43% to technical factors, 43% to economic factors and 14% to social factors. The weights of the factors corresponding to the equal-weight scenario are listed in Table 7, and the suitability maps resulting from the GIS-AHP combination are illustrated in Figure 5d and Figure 6d. After analysis of Table 8 listing the statistical information and theoretical wind potential, we note that 42.40% of Cameroon's land is considered unsuitable for the siting of large-scale wind power plants. The same table shows that 0.0000% of Cameroon's land is highly suitable for large-scale wind farms, with a corresponding technical wind potential of around 6.91GW; 14.04% is most suitable, with a wind potential of around 380.21GW; 41.94% and 1.62% are suitability and less suitability respectively, with wind potentials of 1135.651GW and 43.975GW respectively. Comparing the initial result of the study with the equal-weight scenario, we note that the area corresponding to high suitability increases from 0 km² to 1.29 km², i.e. an increase of around 1.29 km²; the area corresponding to suitability decreases from 291809.767 km² to 240502. 028 km², a decrease of 51307.739 km²; the area corresponding to most suitability increases from 32539.747 km² to 80518.772km², an increase of 47979.025km²; the area corresponding to less suitability increases from 5964.161 km² to 9312.7672 Km², an increase of around 3348.6062km². We can therefore conclude that the transition from the initial scenario to the equal weight scenario results in a decrease in the suitability zone and an increase in the highly suitability, most suitability and less suitability zones.
The results of the study show that suitable sites are mainly located in the far north of the country, notably in the Extreme North and North regions. There are also suitable sites in the North-West, South-West, West, Littoral and very few in the South. However, the Centre and East regions have no suitable sites. This is mainly due to the tropical forest that covers the whole of East Cameroon, and the low wind speed in these regions, which is the determining factor for the installation of wind farms.
Figure 8. Land suitability scenario 1, 2, 3.
Preprints 97764 g008
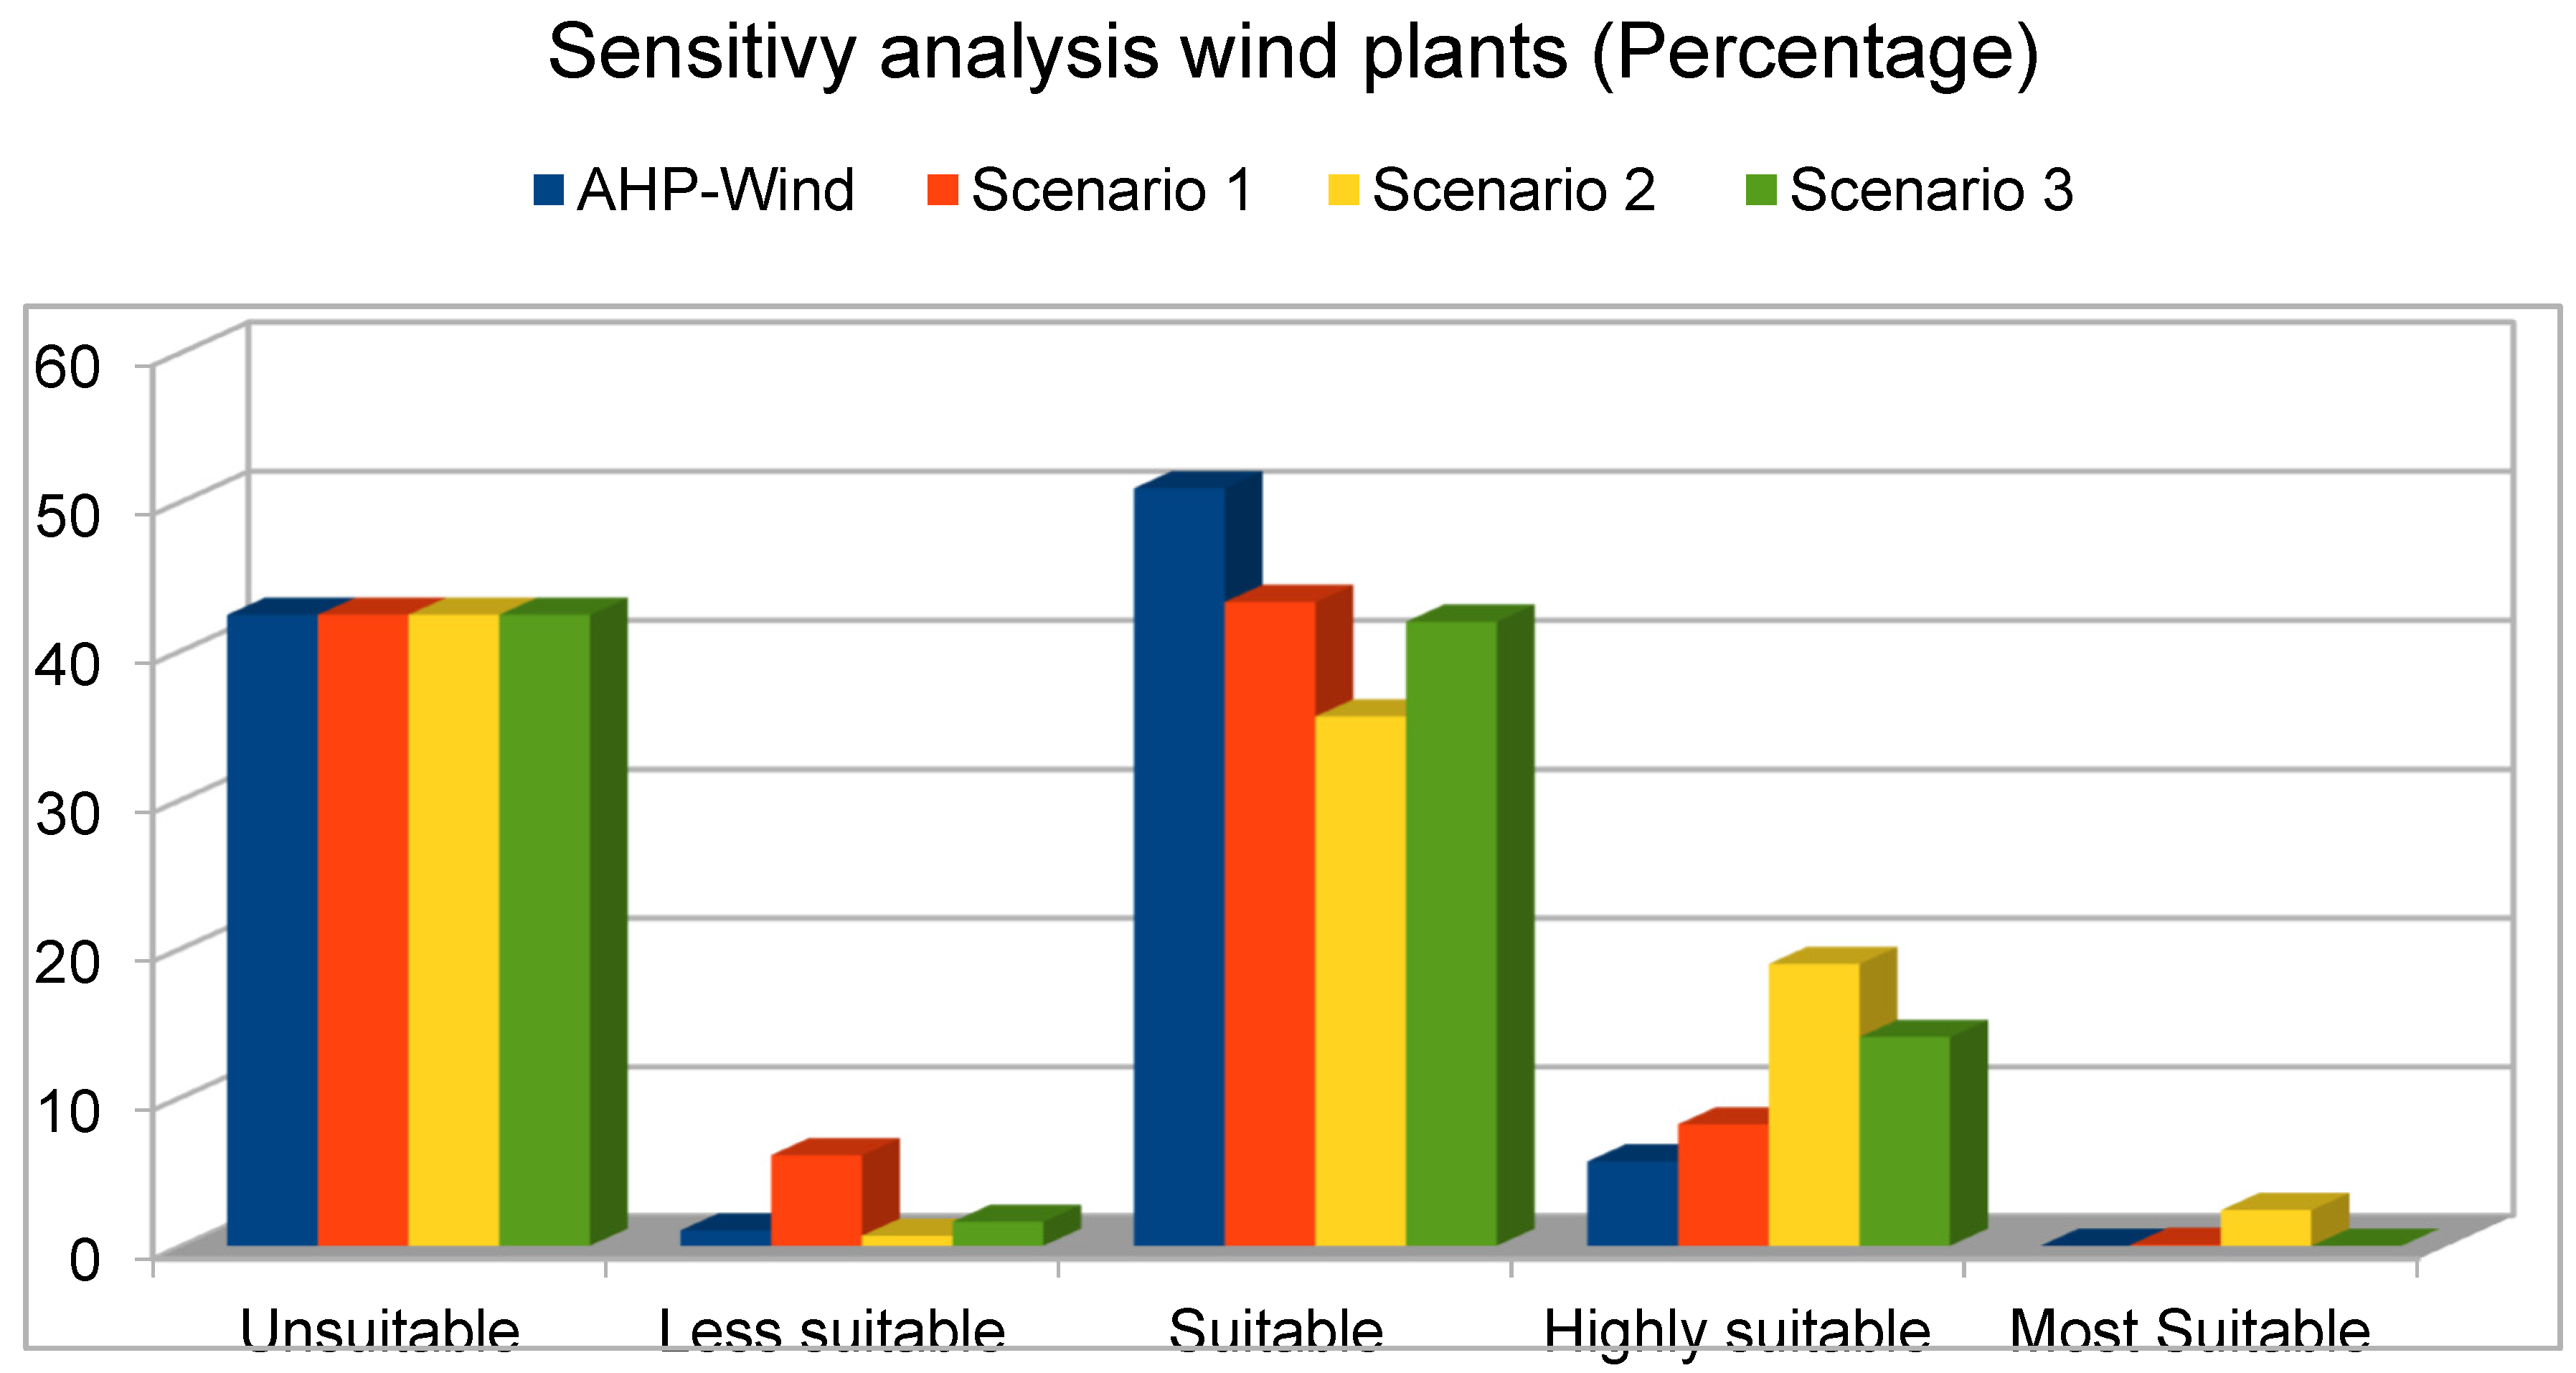
Figure 9. Graphical interpretation for land suitability areas for sensitivity cases.
Preprints 97764 g009
Table 8. Statistical information of land suitability areas for three sensitivity cases.
Plage Categories Statistics AHP-Wind TWPP is the theoretical wind power potential (GW) Scenario 1
(Technic)
TWPP is the theoretical wind power potential (GW) on scenario 1 Scenario 2
(Economic)
TWPP is the theoretical wind power potential (GW) on scenario 2 Scenario 3
(Equal weights)
TWPP is the theoretical wind power potential (GW) on scenario 3
0-0 0 Areas in km² 243147,935 243147,935 4.722 243147.935 243147.935
Nbre pixels 24313443 24313443 24313443 24313443
% 42,40 % 42,40 % 42.40% 42.40%
0,001-1 1 Areas in km² 5964,161 28,163 34971.342 165,135 3882,816 18,335 9312.7672 43,975
Nbre pixels 596383 3496940 388260 931225
% 1.04% 6.10% 0.68% 1.62%
1,001-2 2 Areas in km² 291809,767 1377,926 248115.271 1171,6 204020.342 963,384 240502.028 1135,651
Nbre pixels 29179356 24810149 20400901 24048867
% 50.89% 43.26% 35.58% 41.94%
2,001-3 3 Areas in km² 32539,747 153,652 46824.981 221,108 108646.7543 513,03 80518.772 380,21
Nbre pixels 3253794 4682238 10864072 8051430
% 5.67% 8.17% 18.95% 14.04%
3,001-4 4 Areas in km² 0 0 423.264 2 13784.946 65,093 1.29 6,091
Nbre pixels 0 42324 1378418 129
% 0 % 0.07% 2.40% 0.00001 %
Table 9. List of experts.
Designation Qualification Age Work experience Department /Company
1 Professor PhD 36 12 University of Dschang, Cameroon (UDs)
2 Professor PhD 50 25 University of Dschang, Cameroon (UDs)
3 Lecturer Graduate 55 25 Free University of Brussels (ULB)
4 Energy expert Graduate 48 23 Ministry of energy, Cameroon
5 Energy expert Graduate 42 18 Ministry of energy, Cameroon
6 Deputy-Manager PhD 38 8 Solar Energy Technology , Cameroon
7 Deputy-Manager Graduate 37 11 Instrumelec, Cameroon
8 Lecturer PhD 52 22 Free University of Brussels (ULB)
9 Assistant-Manager Graduate 30 7 ENEO, Cameroon
10 Assistant-Manager Graduate 35 11 SONATREL, Cameroon

4. Conclusion

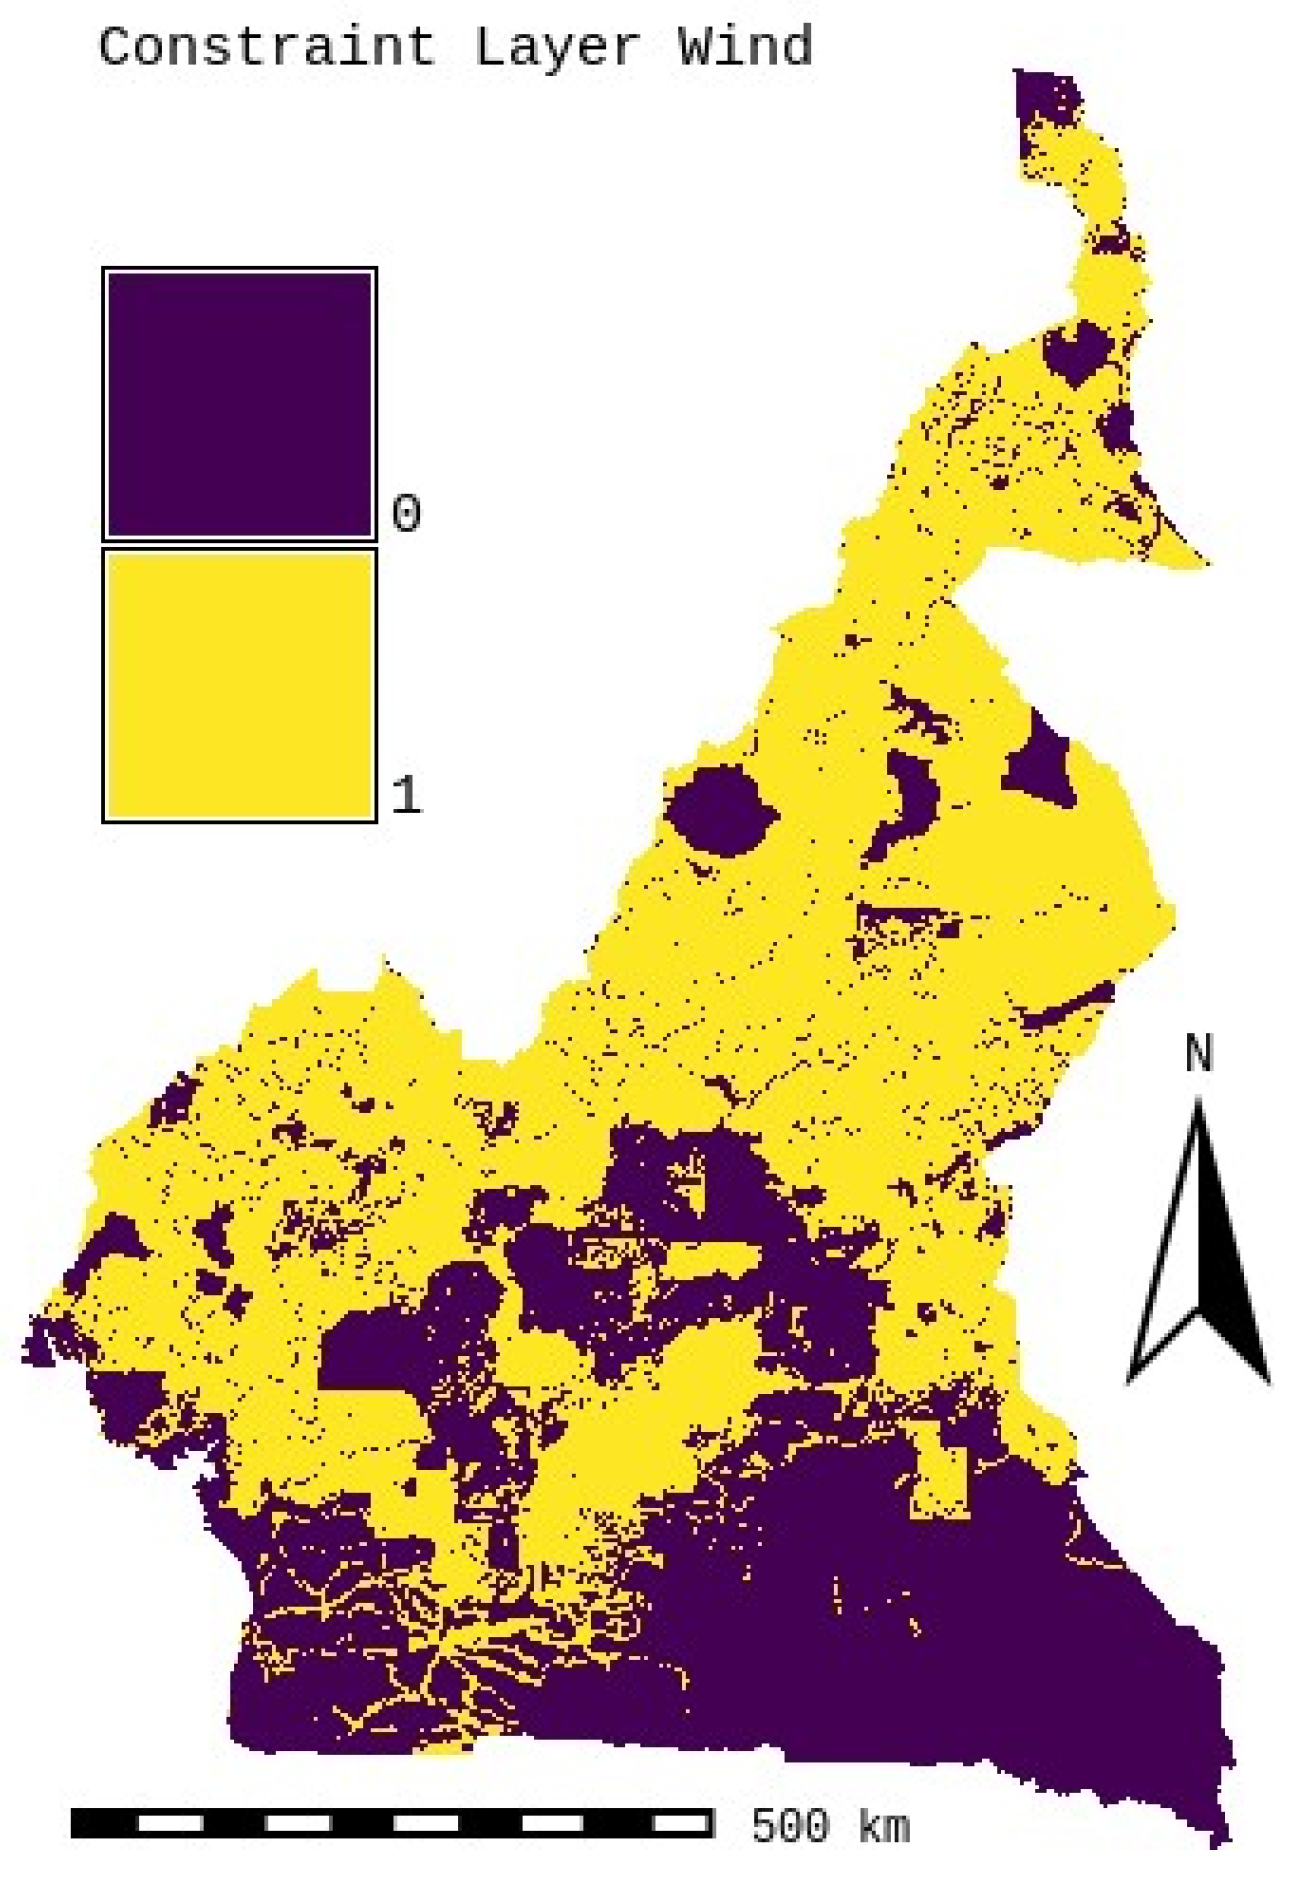
This study proposes an effective decision-support tool to identify suitable sites for the installation of onshore wind farms in Cameroon by combining GIS and MCDM methods. Based on expert judgment and literature review, this study began by excluding unsuitable areas (constraints) corresponding to 42.5% of Cameroon's surface area. The constraint map describes areas that are unsuitable for onshore wind farm development and should not be considered due to social, environmental, economic and technical factors. 57.6% of Cameroon's land area is suitable for the development of onshore wind farms connected to the existing electricity grid. Suitability maps were created by compiling the full evaluation criteria (three criteria and seven sub-criteria) and calculating their weightings using the AHP method. In order to optimize the selection of large-scale onshore wind farms, we excluded areas smaller than 4km² from the final suitability map. The results obtained in this study can help investors, the government and other stakeholders to identify potential areas for the deployment of wind power systems in Cameroon. They can also help decision-making on the relative expansion of the power grid to facilitate investment in wind power plants and realize synergies between power generation and transmission. However, it should be noted that the results need to be treated with caution in practice regarding assumptions, data quality, decision-maker preference and the methods applied. For effective implementation, more detailed information and analysis is required. The preference of decision-makers in determining restrictive criteria, evaluation criteria, and their weights have a major impact on results. A sensitivity analysis of the weights was therefore carried out to test the robustness of the results.
This sensitivity analysis also enabled us to decide whether to maximize technical, economic or social factors, or even equiprobability of factors. We can also see from Figure 9 that the highest percentages in all scenarios are obtained in the second range corresponding to "suitable", followed by the third range corresponding to "highly suitable". The lowest percentages are observed in the fourth range corresponding to "most suitable". An estimate of the theoretical wind potential of large-scale grid-connected wind farms in suitable areas is put at around 1559.741 GW. Although Cameroon does not have enormous wind energy potential across its entire territory, suitable sites for large-scale wind farms can be found in many parts of the country. Solar-wind hybridization could optimize the output of these power plants, since solar works during the day and wind is optimal at night.
The AHP-based MCDM method we use is easy to use, as it solves a disordered problem by breaking it down into smaller phases. No real data sets are required. AHP thus creates a simple path enabling a non-expert individual to solve complex problems. However, a weakness of the AHP method lies in the use of fundamental qualities for judgments, and for future research in this field. The use of the FUZZY AHP method could make up for the shortcomings observed in the AHP. In addition, the observed results could be improved by introducing other factors such as land cost, lightning flash rate, bird area, appearance, etc. This study was carried out for large-scale onshore wind farms connected to the existing power grid. It would be interesting to carry out a study for off-grid areas in order to propose suitable sites for powering areas not covered by the electricity grid.

Author Contributions

Conceptualization, I.F.F.M.; Methodology, I.F.F.M. and I.Y.B.; Software, I.F.F.M.; Validation, I.F.F.M., I.Y.B., and V.S.C.-D; Formal analysis, I.F.F.M., and I.Y.B.; Investigation, I.F.F.M.; Resources, I.F.F.M.; Data curation, I.F.F.M.; Writing—original draft, I.F.F.M.; Writing—review & editing, I.F.F.M., and V.S.C.-D.; Visualization, I.F.F.M., D.N., R.T. and V.S.C.-D.; Supervision, D.N. and R.T. All authors have read and agreed to the published version of the manuscript.

Funding

This study did not receive funding from any person or institution.

Data Availability Statement

The data used are included in the article through the referenced article.

Acknowledgements

The authors would like to thank ARES for its scientific contribution to the Geographic Information System (GIS) via the Institut de Gestion d'Environnement et d'Aménagement du Territoire (IGEAT) at the Université Libre de Bruxelles (ULB). Special thanks to Eleonore WOLFF Maëlle VERCAUTEREN and Michel HUART.

References

  1. H. L. E. Picard, ‘Nouveau paradigme de l ’ électrification en Afrique subsaharienne Comment les systèmes hybrides décentralisés changent-ils la donne ?’, 2022. [https://www.ifri.org/fr/publications/notes-de-lifri/nouveau-paradigme-de-lelectrification-afrique-subsaharienne-systemes ].
  2. Banque Mondiale “Accès à l’électricité , Cameroun”. [https://donnees.banquemondiale.org/indicator/EG.ELC.ACCS.RU.ZS?locations=CM].
  3. World Energy Outlook 2022 , For the first time, global demand for each of the fossil fuels shows a peak or plateau across all WEO scenarios, with Russian exports in particular falling significantly as the world energy order is reshaped , 2022. [https://www.iea.org/news/world–energy–outlook–2022–shows–the–global–energy–crisis–can–be–a–historic–turning–point–towards–a–cleaner–and–more–secure–future].
  4. Hayat Gazzane Comment la guerre en Ukraine a bouleversé le marché de l'énergie en 4 chiffres clés, 2022 [https://www.lesechos.fr/industrie-services/energie-environnement/guerre-en-ukraine-le-bouleversement-du-marche-de-lenergie-en-4-chiffres-1873548].
  5. Global Wind Atlas , 2023 .[https://globalwindatlas.info/fr/area/Cameroon].
  6. S. Nasery, ‘GIS-based wind farm suitability assessment using fuzzy AHP multi-criteria approach : the case of Herat , Afghanistan’, 2021. [https://link.springer.com/article/10.1007/s12517-021-07478-5]. [CrossRef]
  7. R. Islam, R. Islam, and H. M. Imran, ‘Assessing Wind Farm Site Suitability in Bangladesh : A GIS-AHP Approach’, 2022. . [ https://www.preprints.org/manuscript/202210.0252/v1].
  8. M. A. Baseer, S. Rehman, J. P. Meyer, and M. M. Alam, ‘GIS-based site suitability analysis for wind farm development in Saudi Arabia’, Energy, vol. 141. pp. 1166–1176, 2017.[https://ideas.repec.org/a/eee/energy/v141y2017icp1166-1176.html].
  9. T. R. Ayodele, A. S. O. Ogunjuyigbe, O. Odigie, and A. A. Jimoh, ‘On the most suitable sites for wind farm development in Nigeria’, Data Br., vol. 19, pp. 29–41, 2018. [http://dx.doi.org/10.1016/j.dib.2018.04.144]. [CrossRef]
  10. P. T. Kapen and M. J. Gouajio, ‘Analysis and ef fi cient comparison of ten numerical methods in estimating Weibull parameters for wind energy potential : Application to the city of Bafoussam , Cameroon’, vol. 159, 2020.[https://ideas.repec.org/a/eee/renene/v159y2020icp1188-1198.html].
  11. R. H. T. Djiela, P. T. Kapen, and G. Tchuen, ‘Wind energy of Cameroon by determining Weibull parameters : potential of a environmentally friendly energy’, Int. J. Environ. Sci. Technol., vol. 18, no. 8, pp. 2251–2270, 2021.[https://link.springer.com/article/10.1007/s13762-020-02962-z]. [CrossRef]
  12. M. J. Gouajio and D. Yemele, ‘Comparison of numerical methods in estimating Weibull parameters to install a sustainable wind farm in mount Bamboutos , Cameroon’, vol. 15, no. 6, pp. 1033–1049, 2021.[https://ui.adsabs.harvard.edu/link_gateway/2021IJESM..15.1033J/doi:10.1108/IJESM-02-2020-0019]. [CrossRef]
  13. Y. W. Kohole, F. Cyrille, V. Fohagui, and R. Hermann, ‘Wind energy potential assessment for co-generation of electricity and hydrogen in the far North region of Cameroon’, vol. 279, no. September 2022, 2023. https://doi.org/10.1016/j.egypro.2016.07.151. [CrossRef]
  14. C. Ameri, W. Ngouleu, Y. W. Kohol, F. Cyrille, V. Fohagui, and G. Tchuen, ‘Techno-economic analysis and optimal sizing of a battery-based and hydrogen-based standalone photovoltaic / wind hybrid system for rural electrification in Cameroon based on meta-heuristic techniques’, vol. 280, no. November 2022, 2023.[https://doi.org/10.1016/j.enconman.2023.116794]. [CrossRef]
  15. N. Yimen et al., ‘Optimal design and sensitivity analysis of distributed biomass-based hybrid renewable energy systems for rural electrification : Case study of different photovoltaic / wind / battery-integrated options in Babadam , northern Cameroon’, no. June 2021, pp. 2939–2956, 2022.[https://doi.org/10.1016/j.enconman.2023.116794 ]. [CrossRef]
  16. D. T. Hermann, N. Donatien, T. Konchou, and F. Armel, ‘A Feasibility Study of an on-Grid PV / Wind / Battery / Diesel for Residential Buildings Under Various Climates in Cameroon’, vol. 2100615, pp. 1–27, 2021. [https://doi.org/10.1002/ente.202100615]. [CrossRef]
  17. F. Metegam, I. Flora, N. Donatien, and R. Tchinda, ‘Selection Wind Farm Sites Based on GIS Using a Boolean Method : Evaluation of the Case of Cameroon’, pp. 1–24, 2021.[https://doi.org/10.4236/jpee.2021.91001 ]. [CrossRef]
  18. T. R. Ayodele, A. S. O. Ogunjuyigbe, O. Odigie, and J. L. Munda, ‘A multi-criteria GIS based model for wind farm site selection using interval type-2 fuzzy analytic hierarchy process: The case study of Nigeria’, Applied Energy, vol. 228. pp. 1853–1869, 2018.[https://doi.org/10.1016/j.apenergy.2018.07.051]. [CrossRef]
  19. J. Jangid et al., ‘Potential zones identification for harvesting wind energy resources in desert region of India – A multi criteria evaluation approach using remote sensing and GIS’, Renewable and Sustainable Energy Reviews. 2016.[https://doi.org/10.1016/j.rser.2016.06.078 ]. [CrossRef]
  20. S. H. Siyal, U. Mörtberg, D. Mentis, M. Welsch, I. Babelon, and M. Howells, ‘Wind energy assessment considering geographic and environmental restrictions in Sweden: A GIS-based approach’, Energy, vol. 83, pp. 447–461, 2015.[https://doi.org/10.1016/j.energy.2015.02.044]. [CrossRef]
  21. S. Alotaibi and F. Anzah, ‘Applying an AHP – GIS model to hybrid wind – solar energy site selection in a hot desert region : A case study of the Kuwaiti desert’, Geogr. Tidsskr. J. Geogr., vol. 00, no. 00, pp. 1–17, 2023.[https://doi.org/10.1080/00167223.2023.2218891 ]. [CrossRef]
  22. R. Tarife, Y. Nakanishi, Y. Zhou, N. Estoperez, and A. Tahud, ‘Integrated GIS and Fuzzy-AHP Framework for Suitability Analysis of Hybrid Renewable Energy Systems : A Case in Southern Philippines’, 2023.[https://doi.org/10.3390/su15032372]. [CrossRef]
  23. Othman and M. Hushari, ‘Integrating AHP and GIS as a decision-making tool for the optimal allocation of wind farm : A case study of Syria Integrating AHP and GIS as a decision-making tool for the optimal allocation of wind farm : A case study of Syria’, 2020.[http://dx.doi.org/10.1088/1757-899X/800/1/012019 ]. [CrossRef]
  24. M. Asadi, K. Pourhossein, Y. Noorollahi, and M. Marzband, ‘A New Decision Framework for Hybrid Solar and Wind Power Plant Site Selection Using Linear Regression Modeling Based on GIS-AHP’, 2023. [https://doi.org/10.3390/su15108359]. [CrossRef]
  25. S. Zalhaf et al., ‘A High-Resolution Wind Farms Suitability Mapping Using GIS and Fuzzy AHP Approach : A National-Level Case Study in Sudan’, pp. 1–21, 2022. [https://doi.org/10.3390/su14010358]. [CrossRef]
  26. S. Ali, J. Taweekun, K. Techato, J. Waewsak, and S. Gyawali, ‘GIS based site suitability assessment for wind and solar farms in’, Renew. Energy, vol. 132, pp. 1360–1372, 2019. [https://doi.org/10.1016/j.renene.2018.09.035]. [CrossRef]
  27. H. Eroğlu, ‘Multi - criteria decision analysis for wind power plant location selection based on fuzzy AHP and geographic information systems’, Environ. Dev. Sustain., vol. 23, no. 12, pp. 18278–18310, 2021. [https://link.springer.com/article/10.1007/s10668-021-01438-5]. [CrossRef]
  28. V. Olivero-ortíz, C. Robles-algarín, J. Viloria-porto, and U. Magdalena, ‘An AHP-GIS Based Approach for Site Suitability Analysis of Solar-wind Projects in Santa Marta , Colombia’, vol. 11, no. 5, pp. 211–223, 2021. [https://doi.org/10.32479/ijeep.11212]. [CrossRef]
  29. Konstantinos, T. Georgios, and A. Garyfalos, ‘A Decision Support System methodology for selecting wind farm installation locations using AHP and TOPSIS : Case study in Eastern Macedonia and Thrace region , Greece’, Energy Policy, vol. 132, no. May 2019, pp. 232–246, 2020. [http://dx.doi.org/10.1016/j.enpol.2019.05.020]. [CrossRef]
  30. S. Moradi, H. Yousefi, Y. Noorollahi, and D. Rosso, ‘Multi-criteria decision support system for wind farm site selection and sensitivity analysis : Case study of Alborz Province , Iran’, Energy Strateg. Rev., vol. 29, no. March, p. 100478, 2020. [http://dx.doi.org/10.1016/j.esr.2020.100478]. [CrossRef]
  31. Koc, S. Turk, and Ş. Gökhan, ‘Multi-criteria of wind-solar site selection problem using a GIS-AHP-based approach with an application in Igdir Province / Turkey’, pp. 32298–32310, 2019. [https://link.springer.com/article/10.1007/s11356-019-06260-1]. [CrossRef]
  32. G. Villacreses, G. Gaona, J. Martínez-Gómez, and D. J. Jijón, ‘Wind farms suitability location using geographical information system (GIS), based on multi-criteria decision making (MCDM) methods: The case of continental Ecuador’, Renew. Energy, 2017. [https://doi.org/10.1016/j.renene.2017.03.041]. [CrossRef]
  33. K. B. Atici, A. B. Simsek, A. Ulucan, and M. U. Tosun, ‘A GIS-based Multiple Criteria Decision Analysis approach for wind power plant site selection’, Util. Policy, 2015. [http://dx.doi.org/10.1016/j.jup.2015.06.001]. [CrossRef]
  34. M. Sadeghi, M. Karimi, and G. Engineering, ‘GIS-BASED SOLAR AND WIND TURBINE SITE SELECTION USING MULTI-CRITERIA ANALYSIS : CASE STUDY TEHRAN , IRAN’, vol. XLII, no. October, pp. 7–10, 2017. [http://dx.doi.org/10.5194/isprs-archives-XLII-4-W4-469-2017]. [CrossRef]
  35. S. De and F. Bingöl, ‘RESEARCH ARTICLE MCDM analysis of wind energy in Turkey : decision making based on environmental impact’, vol. 2016, pp. 19753–19766, 2018. [https://link.springer.com/article/10.1007/s11356-018-2004-4]. [CrossRef]
  36. M. Ghobadi and M. Ahmadipari, ‘Environmental Planning for Wind Power Plant Site Selection using a Fuzzy PROMETHEE-Based Outranking Method in Geographical Information System’, vol. 2, pp. 75–87, 2018. [http://dx.doi.org/10.22097/eeer.2018.148760.1041]. [CrossRef]
  37. T. R. Ayodele, A. S. O. Ogunjuyigbe, O. Odigie, and J. L. Munda, ‘A multi-criteria GIS based model for wind farm site selection using interval type-2 fuzzy analytic hierarchy process : The case study of Nigeria’, Appl. Energy, vol. 228, no. July, pp. 1853–1869, 2018. [https://doi.org/10.1016/j.apenergy.2018.07.051]. [CrossRef]
  38. J. J. W. Watson and M. D. Hudson, ‘Regional Scale wind farm and solar farm suitability assessment using GIS-assisted multi-criteria evaluation’, Landsc. Urban Plan., vol. 138, pp. 20–31, 2015. [https://doi.org/10.1016/j.landurbplan.2015.02.001]. [CrossRef]
  39. M. Jahangiri, R. Ghaderi, A. Haghani, and O. Nematollahi, ‘Finding the best locations for establishment of solar-wind power stations in Middle-East using GIS: A review’, Renewable and Sustainable Energy Reviews. 2016. [http://dx.doi.org/10.1016/j.rser.2016.07.069]. [CrossRef]
  40. L. Gigović, D. Pamučar, D. Božanić, and S. Ljubojević, ‘Application of the GIS-DANP-MABAC multi-criteria model for selecting the location of wind farms: A case study of Vojvodina, Serbia’, Renew. Energy, vol. 103, pp. 501–521, 2017. [http://dx.doi.org/10.1016/j.renene.2016.11.057]. [CrossRef]
  41. D. Latinopoulos and K. Kechagia, ‘A GIS-based multi-criteria evaluation for wind farm site selection. A regional scale application in Greece’, Renew. Energy, vol. 78, pp. 550–560, 2015. [http://dx.doi.org/10.1016/j.renene.2015.01.041]. [CrossRef]
  42. Y. Noorollahi, H. Yousefi, and M. Mohammadi, ‘Multi-criteria decision support system for wind farm site selection using GIS’, Sustain. Energy Technol. Assessments, vol. 13, pp. 38–50, 2016. [https://doi.org/10.1016/j.esr.2020.100478 ]. [CrossRef]
  43. S. Al-Yahyai, Y. Charabi, A. Gastli, and A. Al-Badi, ‘Wind farm land suitability indexing using multi-criteria analysis’, Renew. Energy, vol. 44, pp. 80–87, 2012. [http://dx.doi.org/10.1016/j.renene.2012.01.004]. [CrossRef]
  44. S. K. Saraswat, A. K. Digalwar, S. S. Yadav, and G. Kumar, ‘MCDM and GIS based modelling technique for assessment of solar and wind farm locations in India’, Renew. Energy, vol. 169, pp. 865–884, 2021. [http://dx.doi.org/10.1016/j.renene.2021.01.056]. [CrossRef]
  45. M. A. Baseer, S. Rehman, J. P. Meyer, and M. M. Alam, ‘GIS-based site suitability analysis for wind farm development in Saudi Arabia’, Energy, vol. 141, pp. 1166–1176, 2017. [http://dx.doi.org/10.1016/j.energy.2017.10.016]. [CrossRef]
  46. T. R. Ayodele, A. S. O. Ogunjuyigbe, O. Odigie, and J. L. Munda, ‘A multi-criteria GIS based model for wind farm site selection using interval type-2 fuzzy analytic hierarchy process : The case study of Nigeria’, Appl. Energy, vol. 228, no. April, pp. 1853–1869, 2018. [https://doi.org/10.1016/j.apenergy.2018.07.051]. [CrossRef]
  47. S. Mohammadzadeh, S. Jalilinasrabady, H. Fujii, and H. Farabi-asl, ‘A comprehensive approach for wind power plant potential assessment , application to northwestern Iran’, Energy, vol. 164, pp. 344–358, 2018. [http://dx.doi.org/10.1016/j.energy.2018.08.211]. [CrossRef]
  48. K. Shiraishi, R. G. Shirley, and D. M. Kammen, ‘Geospatial multi-criteria analysis for identifying high priority clean energy investment opportunities : A case study on land-use con fl ict in Bangladesh’, Appl. Energy, vol. 235, no. August 2018, pp. 1457–1467, 2019. [http://dx.doi.org/10.1016/j.apenergy.2018.10.123 ]. [CrossRef]
  49. H. Pasalari and R. Nabizadeh, ‘MethodsX Land fi ll site selection using a hybrid system of AHP-Fuzzy in GIS environment : A case study in Shiraz city , Iran’, MethodsX, vol. 6, pp. 1454–1466, 2019. [https://doi.org/10.1016/j.mex.2019.06.009]. [CrossRef]
  50. J. R. Janke, ‘Multicriteria GIS modeling of wind and solar farms in Colorado’, Renew. Energy, vol. 35, no. 10, pp. 2228–2234, 2010. [http://dx.doi.org/10.1016/j.renene.2010.03.014]. [CrossRef]
  51. D. Jun, F. Tian-tian, Y. Yi-sheng, and M. Yu, ‘Macro-site selection of wind / solar hybrid power station based on ELECTRE - II’, vol. 35, pp. 194–204, 2014. [http://dx.doi.org/10.1016/j.rser.2014.04.005]. [CrossRef]
  52. J. J. W. Watson and M. D. Hudson, ‘Landscape and Urban Planning Regional Scale wind farm and solar farm suitability assessment using GIS-assisted multi-criteria evaluation’, Landsc. Urban Plan., vol. 138, pp. 20–31, 2015. [https://doi.org/10.1016/j.landurbplan.2015.02.001]. [CrossRef]
  53. M. Abed and K. Nagasaka, ‘Utility-scale implementable potential of wind and solar energies for Afghanistan using GIS multi-criteria decision analysis’, Renew. Sustain. Energy Rev., no. June 2015, pp. 0–1, 2016. [https://doi.org/10.1016/J.RSER.2016.12.048]. [CrossRef]
  54. T. Höfer, Y. Sunak, H. Siddique, and R. Madlener, ‘Wind farm siting using a spatial Analytic Hierarchy Process approach : A case study of the Städteregion Aachen’, vol. 163, pp. 222–243, 2016. [http://dx.doi.org/10.1016/j.apenergy.2015.10.138]. [CrossRef]
  55. S. Ali, J. Taweekun, K. Techato, J. Waewsak, and S. Gyawali, ‘GIS based site suitability assessment for wind and solar farms in Songkhla, Thailand’, Renew. Energy, 2018. [http://dx.doi.org/10.1016/j.renene.2018.09.035]. [CrossRef]
  56. S. M. Bina, S. Jalilinasrabady, H. Fujii, and H. Farabi-asl, ‘A comprehensive approach for wind power plant potential assessment, application to northwestern Iran’, Energy, 2018. [http://dx.doi.org/10.1016/j.energy.2018.08.211]. [CrossRef]
  57. Vernyuy, A. Abubakar, F. Muhammad-sukki, and E. Karim, ‘Renewable energy potentials in Cameroon : Prospects and challenges’, Renew. Energy, vol. 76, pp. 560–565, 2015. [http://dx.doi.org/10.1016/j.renene.2014.11.083]. [CrossRef]
  58. P. D. E. L. Enquête, P. Roger, and E. Jazet, ‘Caractéristiques du pays et présentation de l’enquête’, pp. 1–16. [https://dhsprogram.com/pubs/pdf/FR125/01Chapitre01.pdf ].
  59. Abubakar et al., ‘Wind Power Potentials in Cameroon and Nigeria : Lessons from South Africa’, pp. 1–19, 2017. [http://dx.doi.org/10.3390/en10040443]. [CrossRef]
  60. Global Wind Atlas , 2022 .[https://globalwindatlas.info/fr/area/Cameroon] (accessed October 20, 2022).
  61. Worldpop, 2022 [http://www.worldpop.org.uk/data ] (accessed October 20, 2022).
  62. Aéroport du Cameroun , 2022 [https://www.adcsa.aero/aeroports] (accessed October 20, 2022).
  63. OSM. open street map 2020. https://www.openstreetmap.org/ (accessed October 20, 2022). https://www.openstreetmap.org/#map=6/7.402/12.343.
  64. GADM, 2022 [https://gadm.org] (accessed October 20, 2022).
  65. Data Bank [http://databank.banquemondiale.org/data/reports.aspx?source=2&country=CMR ](accessed October 20, 2020).
  66. G. Grilli et al., ‘Experts ’ Perceptions of the Effects of Forest Biomass Harvesting on Sustainability in the Alpine Region’, vol. 6, no. 1, pp. 77–95, 2020. [http://dx.doi.org/10.15177/seefor.15-01]. [CrossRef]
  67. S. Ozlu and I. Dincer, ‘ScienceDirect Development and analysis of a solar and wind energy based multigeneration system’, Sol. ENERGY, vol. 122, pp. 1279–1295, 2015. [http://dx.doi.org/10.1016/j.solener.2015.10.035]. [CrossRef]
  68. M. Mahdy and A. B. S. Bahaj, ‘Multi criteria decision analysis for offshore wind energy potential in Egypt’, Renew. Energy, vol. 118, pp. 278–289, 2018. [http://dx.doi.org/10.1016/j.renene.2017.11.021]. [CrossRef]
  69. M. Jahangiri, A. Haghani, A. Mostafaeipour, A. Khosravi, and H. A. Raeisi, ‘Assessment of solar-wind power plants in Afghanistan : A review’, Renew. Sustain. Energy Rev., vol. 99, no. October 2018, pp. 169–190, 2019. [http://dx.doi.org/10.1016/j.rser.2018.10.003]. [CrossRef]
  70. Z. Dhunny, J. R. S. Doorga, Z. Allam, M. R. Lollchund, and R. Boojhawon, ‘Identi fi cation of optimal wind , solar and hybrid wind-solar farming sites using fuzzy logic modelling’, Energy, vol. 188, p. 116056, 2019. [http://dx.doi.org/10.1016/j.energy.2019.116056]. [CrossRef]
  71. S. Moradi, H. Yousefi, Y. Noorollahi, and D. Rosso, ‘Multi-criteria decision support system for wind farm site selection and sensitivity analysis : Case study of Alborz Province , Iran’, Energy Strateg. Rev., vol. 29, no. April 2017, p. 100478, 2020. [https://doi.org/10.1016/j.esr.2020.100478]. [CrossRef]
  72. L. Albraheem and L. Alawlaqi, ‘Geospatial analysis of wind energy plant in Saudi Arabia using a GIS-AHP technique’, Energy Reports, vol. 9, pp. 5878–5898, 2023. [https://doi.org/10.1016/j.egyr.2023.05.032 ]. [CrossRef]
  73. Kathryn M. B. Haugen “International Review of Policies and Recommendations for Wind Turbine Setbacks from Residences: Setbacks, Noise, Shadow Flicker, and Other Concerns”, pp. 1–43, 2011. [https://www.scribd.com/doc/187157704/International-Review-of-Wind-Policies-and-Recommendations].
  74. Yushchenko, A. de Bono, B. Chatenoux, M. K. Patel, and N. Ray, ‘GIS-based assessment of photovoltaic (PV) and concentrated solar power (CSP) generation potential in West Africa’, Renewable and Sustainable Energy Reviews. 2018. [http://dx.doi.org/10.1016/j.rser.2017.06.021]. [CrossRef]
  75. ‘IRENA. Unleashing the solar potential in ECOWAS: Seeking areas of opportunity for grid- connected and decentralised PV applications. An opportunity-based approach. International Renewable Energy Agency; 2013.’, p. 2013, 2013. [https://www.irena.org/-/media/Files/IRENA/Agency/Publication/2014/GA_ECOWAS_Solar_Web.pdf?rev=a2e8a58639c74f6e988d5f15bf91ab34 ].
  76. Renewable and E. Agency, ‘Unleashing the solar potential in ECOWAS : Seeking areas of opportunity for grid-connected and decentralised PV applications’. [https://www.irena.org/-/media/Files/IRENA/Agency/Publication/2014/GA_ECOWAS_Solar_Web.pdf?rev=a2e8a58639c74f6e988d5f15bf91ab34].
  77. Rapport, ‘Avis de l’Anses Rapport d’expertise collective’, 2015 [https://www.anses.fr/fr/system/files/Consultation_AP_2012sa0091_RF.pdf].
  78. J. Malczewski and C. Rinner, Multicriteria Decision Analysis in Geographic Information Science. . [http://dx.doi.org/10.1007/978-3-540-74757-4 ]. [CrossRef]
  79. R. L. Church, ‘Geographical information systems and location science’, vol. 29, pp. 541–562, 2002. [http://dx.doi.org/10.1016/S0305-0548(99)00104-5]. [CrossRef]
  80. H. Hardware and S. Gis, ‘What is GIS ? Components of a GIS’. [https://www.highpointnc.gov/DocumentCenter/View/1900/What-is-GIS-PDF?bidId=].
  81. D. Mentis, S. Hermann, M. Howells, M. Welsch, and S. H. Siyal, ‘Assessing the technical wind energy potential in africa a GIS-based approach’, Renew. Energy, vol. 83, pp. 110–125, 2015. [https://doi.org/10.1016/j.renene.2015.03.072]. [CrossRef]
  82. T. L. Saaty and G. Hu, ‘Ranking by Eigenvector Versus Other Methods in the Analytic Hierarchy Process’, vol. 11, no. 4, pp. 121–125, 1998. [https://core.ac.uk/download/pdf/82350436.pdf].
  83. T. L. Saaty, ‘How to make a decision : The Analytic Hierarchy Process’, vol. 48, 1990. [https://doi.org/10.1016/0377-2217(90)90057-I]. [CrossRef]
  84. Melvin Alexander, Social Security Administration, Baltimore, MD , ‘Decision-Making using the Analytic Hierarchy Process (AHP) and SAS/IML ’, SESUG 2012. [https://api.semanticscholar.org/CorpusID:62336770].
  85. H. Z. Al Garni and A. Awasthi, ‘Solar PV power plant site selection using a GIS-AHP based approach with application in Saudi Arabia’, Appl. Energy, vol. 206, no. July, pp. 1225–1240, 2017. [http://dx.doi.org/10.1016/j.apenergy.2017.10.024]. [CrossRef]
  86. Thomas_Saaty and Mujgan-Sagir-Ozdemir, ‘Negative Priorities in the Analytic Hierarchy Process’, vol. 37, pp. 1063–1075, 2003. [http://dx.doi.org/10.1016/S0895-7177(03)00118-3]. [CrossRef]
  87. M. A. Elliott, ‘Selecting numerical scales for pairwise comparisons’, Reliab. Eng. Syst. Saf., vol. 95, no. 7, pp. 750–763, 2010. [http://dx.doi.org/10.1016/j.ress.2010.02.013 ]. [CrossRef]
  88. F. Elkarmi and I. Mustafa, ‘Increasing the utilization of solar energy technologies ( SET ) in Jordan’, pp. 978–984, 1993. [https://doi.org/10.1016/0301-4215%2893%2990186-J]. [CrossRef]
  89. P. Sd-, ‘Decision-Making using the Analytic Hierarchy Process ( AHP ) and SAS / IML ® Melvin Alexander , Social Security Administration , Baltimore , MD ABSTRACT’, pp. 1–12, 2012. [https://api.semanticscholar.org/CorpusID:62336770 ].
  90. T. L. Saaty, ‘Decision making with the analytic hierarchy process’, vol. 1, no. 1, 2008. [http://dx.doi.org/10.1504/IJSSCI.2008.017590]. [CrossRef]
  91. T. L. Saaty, ‘WHAT IS THE ANALYTIC HIERARCHY PROCESS ? .’, 1988. [https://link.springer.com/chapter/10.1007/978-3-642-83555-1_5]. [CrossRef]
  92. L. Falconer, D. Hunter, T. C. Telfer, and L. G. Ross, ‘Land Use Policy Visual , seascape and landscape analysis to support coastal aquaculture site selection’, Land use policy, vol. 34, pp. 1–10, 2013. [http://dx.doi.org/10.1016/j.landusepol.2013.02.002]. [CrossRef]
  93. J. M. Sánchez-lozano, J. Teruel-solano, P. L. Soto-elvira, and M. S. García-cascales, ‘Geographical Information Systems ( GIS ) and Multi-Criteria Decision Making ( MCDM ) methods for the evaluation of solar farms locations : Case study in south-eastern Spain’, Renew. Sustain. Energy Rev., vol. 24, pp. 544–556, 2013. [http://dx.doi.org/10.1016/j.rser.2013.03.019]. [CrossRef]
  94. M. A. Anwarzai and K. Nagasaka, ‘Utility-scale implementable potential of wind and solar energies for Afghanistan using GIS multi-criteria decision analysis’, Renew. Sustain. Energy Rev., vol. 71, no. December 2016, pp. 150–160, 2017. [https://ideas.repec.org/a/eee/rensus/v71y2017icp150-160.html ].
  95. S. Darwish, S. Shaaban, E. Marsillac, and N. M. Mahmood, ‘A Methodology for Improving Wind Energy Production in Low Wind Speed Regions, with a Case Study Application in Iraq’, Comput. Ind. Eng., 2018. [https://dl.acm.org/doi/10.1016/j.cie.2021.107880 ]. [CrossRef]
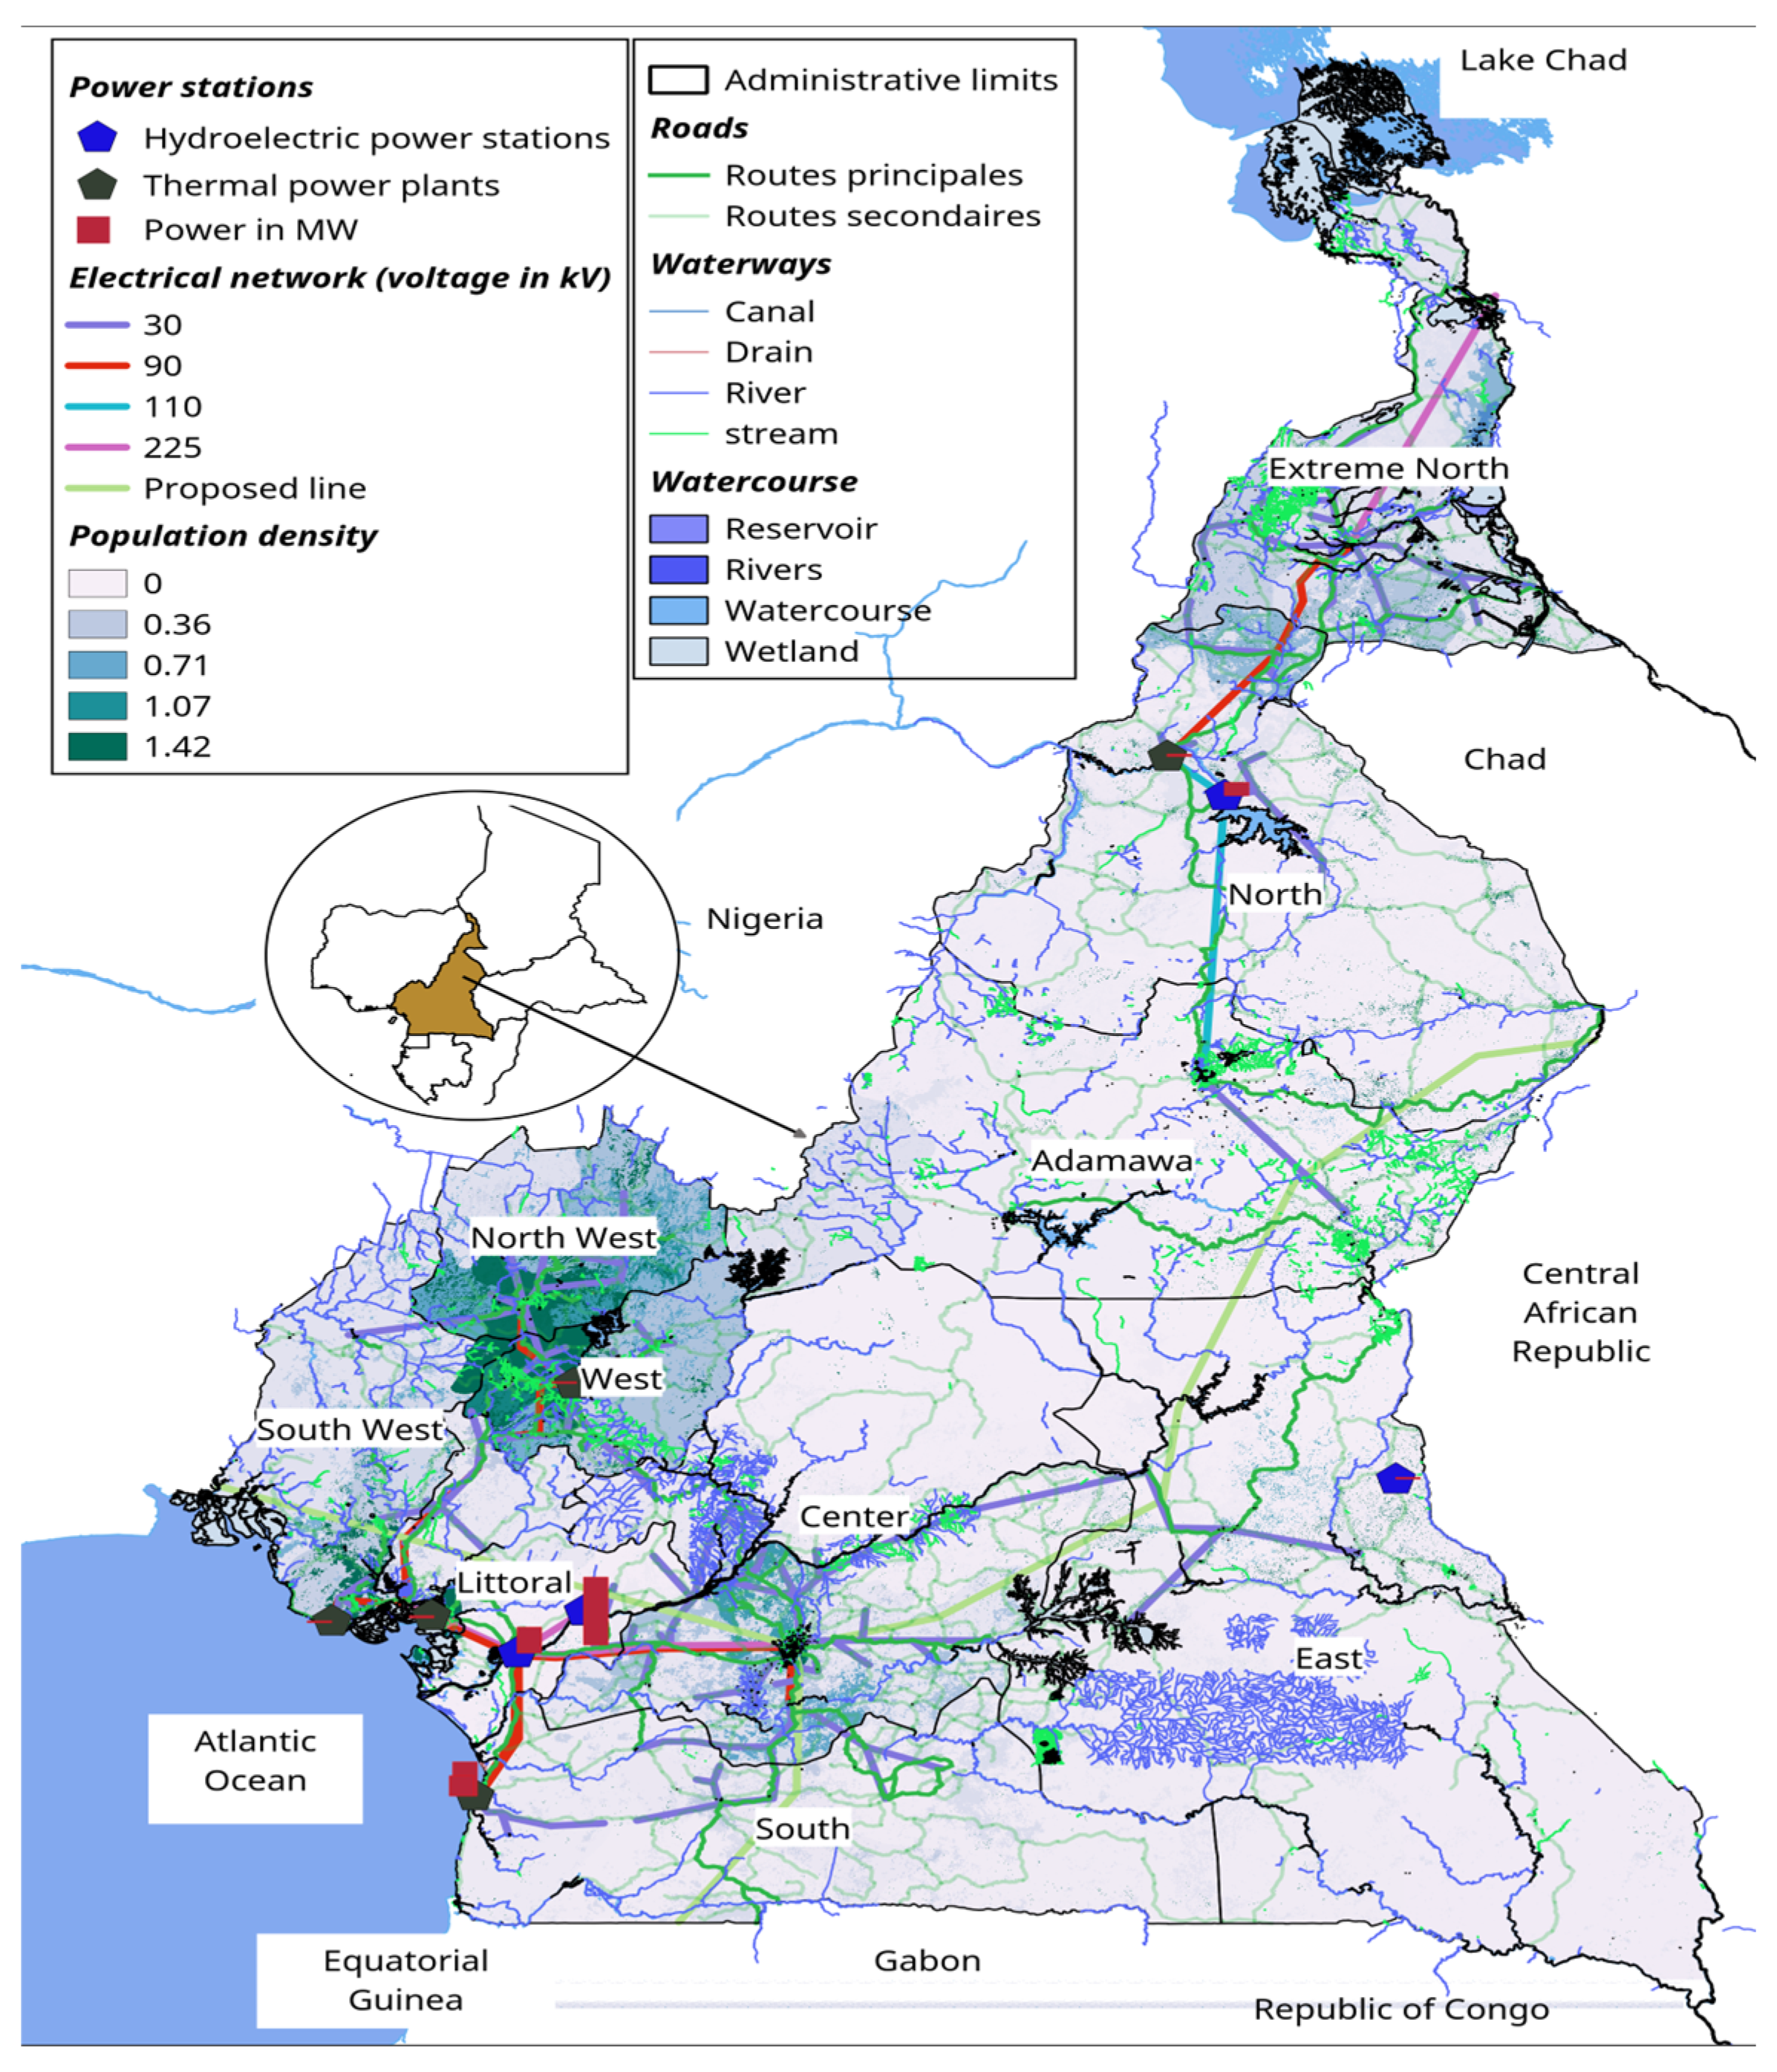
Figure 1. Map of Cameroon's energy infrastructure.
Preprints 97764 g001
Figure 2. Constraint layer.
Preprints 97764 g002
Figure 3. Study area, a) Transmission network Map, b) Roads Map, c) Protected areas Map, d) Residential areas Map, e) Streams Map, f) Wet area Map, g) Slope Map, h) Elevation Map, i) Airport, j) population density, k) Wind speed 100m.
Preprints 97764 g003
Figure 4. Methodology of study.
Preprints 97764 g004
Figure 5. Score evaluation data.
Preprints 97764 g005
Figure 6. Score and Land suitability wind.
Preprints 97764 g006
Figure 7. Score scenarios 1, 2, 3 Wind.
Preprints 97764 g007
Table 1. Studies using combined GIS and decision making for wind site selection.
Authors Year Wind-Solar-power technologies Criteria Case study Methods
1 Janke [50]⁠ 2010 Wind and Solar 8 USA Multi-criteria GIS
modelling
2 Jun et al. [51]⁠ 2014 Wind and Solar 13 China ELECTRE-II
3 Watson and Hudson [52]⁠ 2015 Wind and Solar 7 UK GIS and AHP
4 Mehdi Jahangiri et al. [39]⁠ 2016 Wind and Solar / Middle-East using GIS and Boolean
5 Jayant Jangid et al. [19]⁠ 2016 Wind 5 India GIS and MCDM
6 Mohammad Abed et al. [53]⁠ 2016 Solar and Wind 9 Afghanistan GIS and MCDM
7 M.A. Baseer et al. [45]⁠ 2017 Wind 7 Saudi Arabia GIS and AHP
8 Geovanna Villacreses et al. [32]⁠ 2017 Wind 9 Ecuador GIS and MCDM
9 T.R. Ayodele et al. [46]⁠ 2018 Wind 6 Nigeria GIS and Fuzzy and AHP
10 Saeid Mohammadzadeh et al. [47]⁠ 2018 Wind 16 Iran GIS and MCDM
11 Kenji Shiraishi et al. [48]⁠ 2019 Wind and Solar / Bangladesh GIS and MCDM
12 Shahid Ali et al. [26]⁠ 2019 Wind and Solar 12 Thailand GIS and AHP
13 Hasan Pasalari et al.[49]⁠ 2019 Wind and Solar 15 Shiraz city, Iran GIS-FAHP
14 Ahmet Koc et al. [31]⁠ 2019 Wind and Solar 7 Igdir Province/ Turkey Ahmet GIS and AHP
15 PSiamak Moradi et al. [30]⁠ 2020 Wind 6 Alborz Province, Iran GIS and AHP
16 Ioannou Konstantinos et al. [29]⁠ 2020 Wind 5 Eastern Macedonia and Thrace region, Greece Ioannou AHP and TOPSIS
17 I. Othman and M. Hushari . [23]⁠ 2020 Wind 5 Syria GIS and AHP
20 S.K. Saraswat et al. [44]⁠ 2021 Wind and Solar 13 India GIS and AHP
21 Fotsing Isabelle et al. [17]⁠ 2021 Wind 11 Cameroon GIS-Booléan
22 Hasan Eroğlu. [27]⁠ 2021 Wind 17 Gümüşhane in Turkey GIS-FAHP
23 Víctor Olivero et al. [28]⁠ 2021 Wind and Solar Santa Marta, Colombia GIS-AHP
24 Suhrabuddin et al.[6]⁠ 2021 Wind 5 Herat, Afghanistan GIS-FAHP
25 Md Rabiul et al. [7]⁠ 2022 Wind 8 Bangladesh GIS-AHP
26 Amr S. Zalhaf et al. [25]⁠ 2022 Wind 8 Sudan GIS-FAHP
27 Obaid S.A and Faisal Anzah [21]⁠ 2023 Wind and Solar 5 Kuwaiti desert GIS-AHP
28 Rovick Tarife et al. [22]⁠ 2023 Wind, Solar and Hydro 9 Southern Philippines GIS-FAHP
29 Meysam Asadi et al. [24] 2023 Wind and Solar 5 East Azarbaijan province GIS-AHP and Linear Regression Model
Table 2. Decision criteria considered in the previous studies wind plants.
Criteria [54]⁠ [40]⁠⁠ [45]⁠ [44]⁠ [55]⁠ [46]⁠ [33]⁠ [56]⁠ [57]⁠⁠ [17]⁠ [24]⁠ [22]⁠ [21]⁠ [25]⁠ [7]⁠ [6]⁠ [29]⁠ [30]⁠ [23]⁠ [31]⁠
Wind ressources (wind speed) × × × × × × × × × × × × × × × × × × × ×
Slope × × × × × × × × × × × × × × × × ×
Aspect × × × ×
Elevation × × × × × × ×
Distance from Coastline × × ×
Distance from waterbodies × × × × × × ×
Distance from airports × × × × × × × × × × ×
Distance from wildlife × × × × × × × ×
land-use × × × × × × × × × × × ×
Distance from residential area × × × × × × × × × × × × × × × ×
Distance from roads × × × × × × × × × × × × × × × × × × ×
Distance from transmission lines × × × × × × × × × × × × × × × × × × × ×
Distance from power plants × × ×
Distance from telecommunications × ×
Distance from tourist facilities ×
Population density ×
Farm required area ×
Birds area × ×
Table 3. List of data layers, their types and sources.
Data layer Types (format) Resolution Geometry Sources
Administrative limits of Cameroon (regions, departments, districts) Map Vector (shapefile) - polygon GADM,2022 [64]⁠
Wind speed m/s at 100m Raster (1*1km²) Global Wind Atlas [60]⁠ ⁠
Map of population density in Cameroon Raster (1*1ha) Wordpop, 2010 [61]⁠
Map of Cameroon Power lines Vector (shapefile) - Point World Bank [65]⁠
Hydrological map of Cameroon (streams, navigable waters, rivers, rivers, wetlands, reservoirs…). Vector (shapefile) -
Line, polygon
OSM, 2022 [63]⁠
Map of land use in Cameroon Map Vector (shapefile) - polygon OSM, 2022 [63]
Map of the road network (inter_state, primary, secondary roads…) in Cameroon. Vector (shapefile) -
lines
OSM, 2022 [63]
Map of elevation and slope in Cameroon Raster (1*1km²)
Global Wind Atlas [71]⁠⁠
Map of Cameroon airport Vector (text format csv) Geometry - Point ADC (Cameroon airport), 2022 [62]⁠
Disclaimer/Publisher’s Note: The statements, opinions and data contained in all publications are solely those of the individual author(s) and contributor(s) and not of MDPI and/or the editor(s). MDPI and/or the editor(s) disclaim responsibility for any injury to people or property resulting from any ideas, methods, instructions or products referred to in the content.
Copyright: This open access article is published under a Creative Commons CC BY 4.0 license, which permit the free download, distribution, and reuse, provided that the author and preprint are cited in any reuse.
Prerpints.org logo

Preprints.org is a free preprint server supported by MDPI in Basel, Switzerland.

Subscribe

© 2024 MDPI (Basel, Switzerland) unless otherwise stated