Submitted:
02 February 2024
Posted:
05 February 2024
You are already at the latest version
Abstract
Keywords:
1. Introduction
2. Materials and Methods
3. Data and Statistical Analysis for the Well-Being Measures
- D1. Suicide rate (1990-2019, N=148 countries reporting consistently and worldwide): The worldwide rate per 100,000 declined from 15.0 to 9.5, a 37% reduction. Of the 148 countries, the one with the highest suicide rate during 2015-2019 was Lesotho at a rate of 44 [23].
- D2. Homicide rate (1990-2019, N=148 and worldwide): The worldwide rate per 100,000 declined from 7.5 to 5.3, a 29% reduction. Of the 148 reporting countries, the ones with the highest homicide rate during 2015-2019 were El Salvador (at a rate of 60) and Honduras (at 49) [23].
- D3. Happiness (2005-2021, the Cantril/Gallup 1-10 life satisfaction scale, N=131 and worldwide): The worldwide average declined slightly from 5.3 to 5.2. Of the 131 reporting countries, the least happy during 2015-2021 was Central African Republic at 3.1 [24].
- D4. Poverty fraction (World Bank, 1990-2018, N=86 and worldwide): The worldwide figure declined from 0.55 to 0.26, a relative reduction of 53%. Of the 86 reporting countries, the poorest during 2015-2018 was Malawi at 89%, followed by Rwanda (80%), Tanzania (77%), and Zambia (74%) [25].
- D5. Undernourished fraction (1991-2020; N=94 and worldwide): The worldwide figure declined from 0.15 to 0.08, a relative reduction of 47%. Of the 94 reporting countries, the most undernourished during 2015-2021 was Central African Republic at 47%, followed by Madagascar (45%) and Haiti (42%) [26].
- D6. Refugees (1990-2020, all countries): The worldwide total declined from 19.9 million in 1990 to a low of 13.0 million in 2005, and then climbed steadily to 26.4 million by 2020. The country of origin with the most refugees in 2020 was Syria (6.0 million), followed by Afghanistan (2.6 million) and Sudan/South Sudan (2.6 million) [27,28].
- D7. Population internally displaced by conflict (2009-2020, all countries): The worldwide total declined from 25.0 million in 2009 to a low of 22.4 million in 2011 and then climbed steadily to 48.0 million by 2020. The country with the most people displaced by conflict in 2020 was Syria (6.6 million), followed by Colombia (4.9 million), Sudan/South Sudan (3.7 million), Yemen (3.6 million), Afghanistan (3.5 million), Somalia (3.0 million), and Nigeria (2.7 million) [29].
4. Estimating Effects of Climate Change on Well-Being and Governance
5. Revised Model
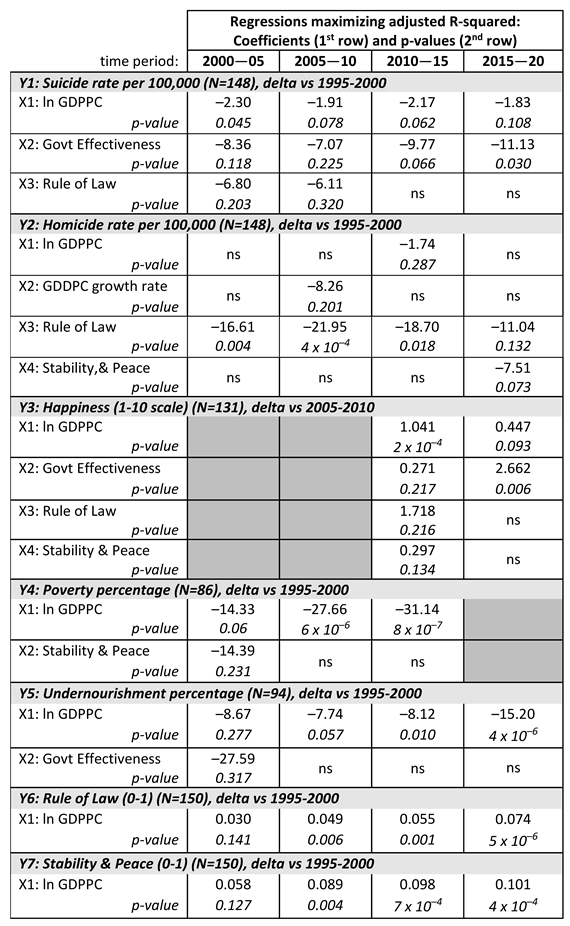
- E1. Suicide rate: The regressions in Table 1 were used to estimate coefficients for lnGDPPC and Government Effectiveness. These effects explained only a portion of the 37% global reduction in suicide rate from 1990 to 2019. A 30% downward ramp from 1990 to 2015 was introduced exogenously to help produce a close fit to history. The ramp has no further effect after 2015.
- E2. Homicide rate: The regressions in Table 1 were used to estimate coefficients for lnGDPPC, Rule of Law, and Stability-Peace. These effects explained only a portion of the 29% global reduction in homicide rate from 1990 to 2019. A 28% downward ramp from 1990 to 2015 was introduced exogenously to help produce a close fit to history. The ramp has no further effect after 2015.
- E3. Happiness: The regressions in Table 1 were used to estimate coefficients for lnGDPPC, Government Effectiveness, Rule of Law, and Stability-Peace. A close fit to history was achieved assuming an initial (1990) value of 4.9 for happiness.
- E4. Poverty fraction: The regressions in Table 1 were used to estimate the coefficient for lnGDPPC. This effect explained only a portion of the 53% global reduction in poverty from 1990 to 2018. A 30% downward ramp from 1990 to 2015 was introduced exogenously to help produce a close fit to history. The ramp has no further effect after 2015.
- E5: Undernourished fraction: The regressions in Table 1 were used to estimate the coefficient for lnGDPPC. This effect explained only a portion of the 47% global reduction in undernourishment from 1991 to 2020. A 30% downward ramp from 1990 to 2015 was introduced exogenously to help produce a close fit to history. The ramp has no further effect after 2015. The equation also includes the adverse effect of climate change on undernourishment described above.
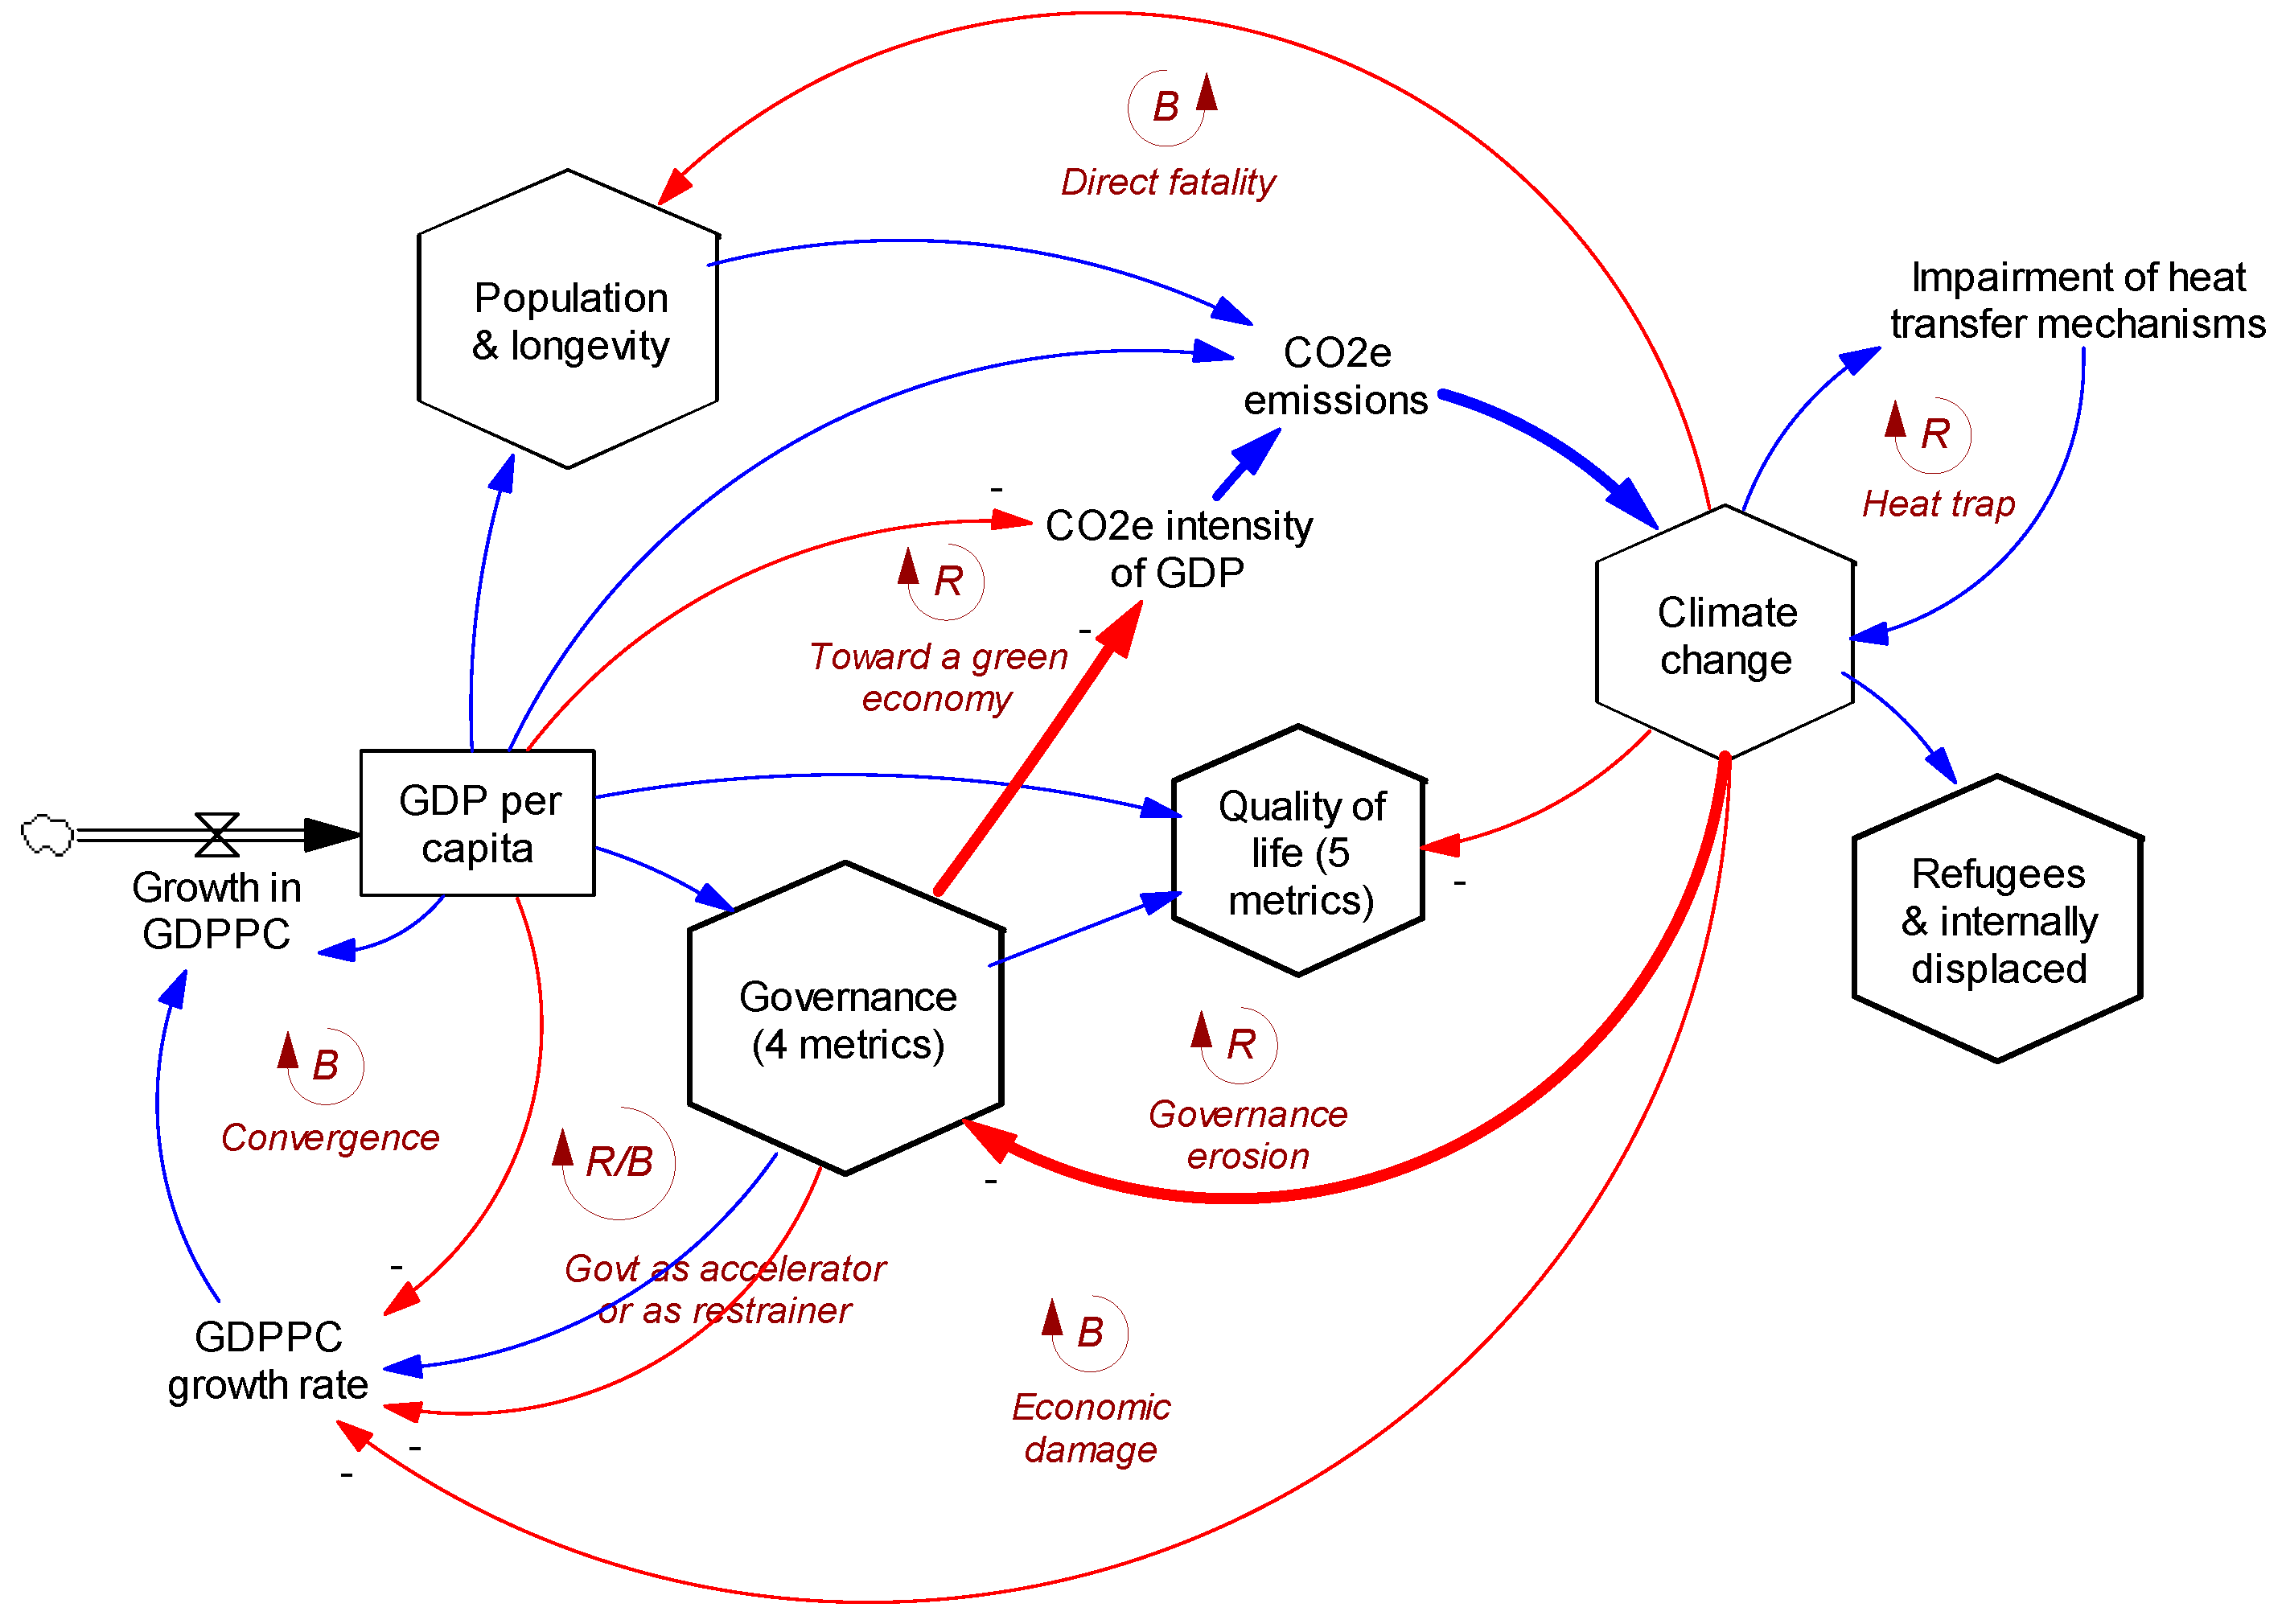
- E6-E10: Governance indicators: Regression-based equations for Government Effectiveness and Regulatory Quality were described previously [20]. For Rule of Law and Stability-Peace, the regressions in Table 1 were used to estimate the coefficients for lnGDPPC. Close fits to history were achieved using initial (1990) values of 0.48 for Rule of Law and 0.44 for Stability-Peace. The revised model also includes an adverse effect of climate change on governance (eqn. 10), assuming the same multiplier for all four governance indicators. The coefficient is uncertain, as described above; equation 10 shows a mid-range value of 4% erosion in governance per 1.0oC of additional warming.
- E11. Refugee rate: The worldwide refugee rate (refugees per thousand population) follows history until 2017 when its value was 3.2. After 2017, that 3.2 is multiplied by an adverse effect of climate change that increases refugees with a coefficient of 0.90 per 1.0oC of additional warming, as described above.
- E12. Internally displaced rate: The worldwide internal displacement rate (per thousand population) follows history (available starting 2009) until 2017 when its value was 5.4. After 2017, that 5.4 is multiplied by an adverse effect of climate change that increases the internally displaced rate with a coefficient of 2.65 per 1.0oC of additional warming, as described above.
6. Scenario Testing
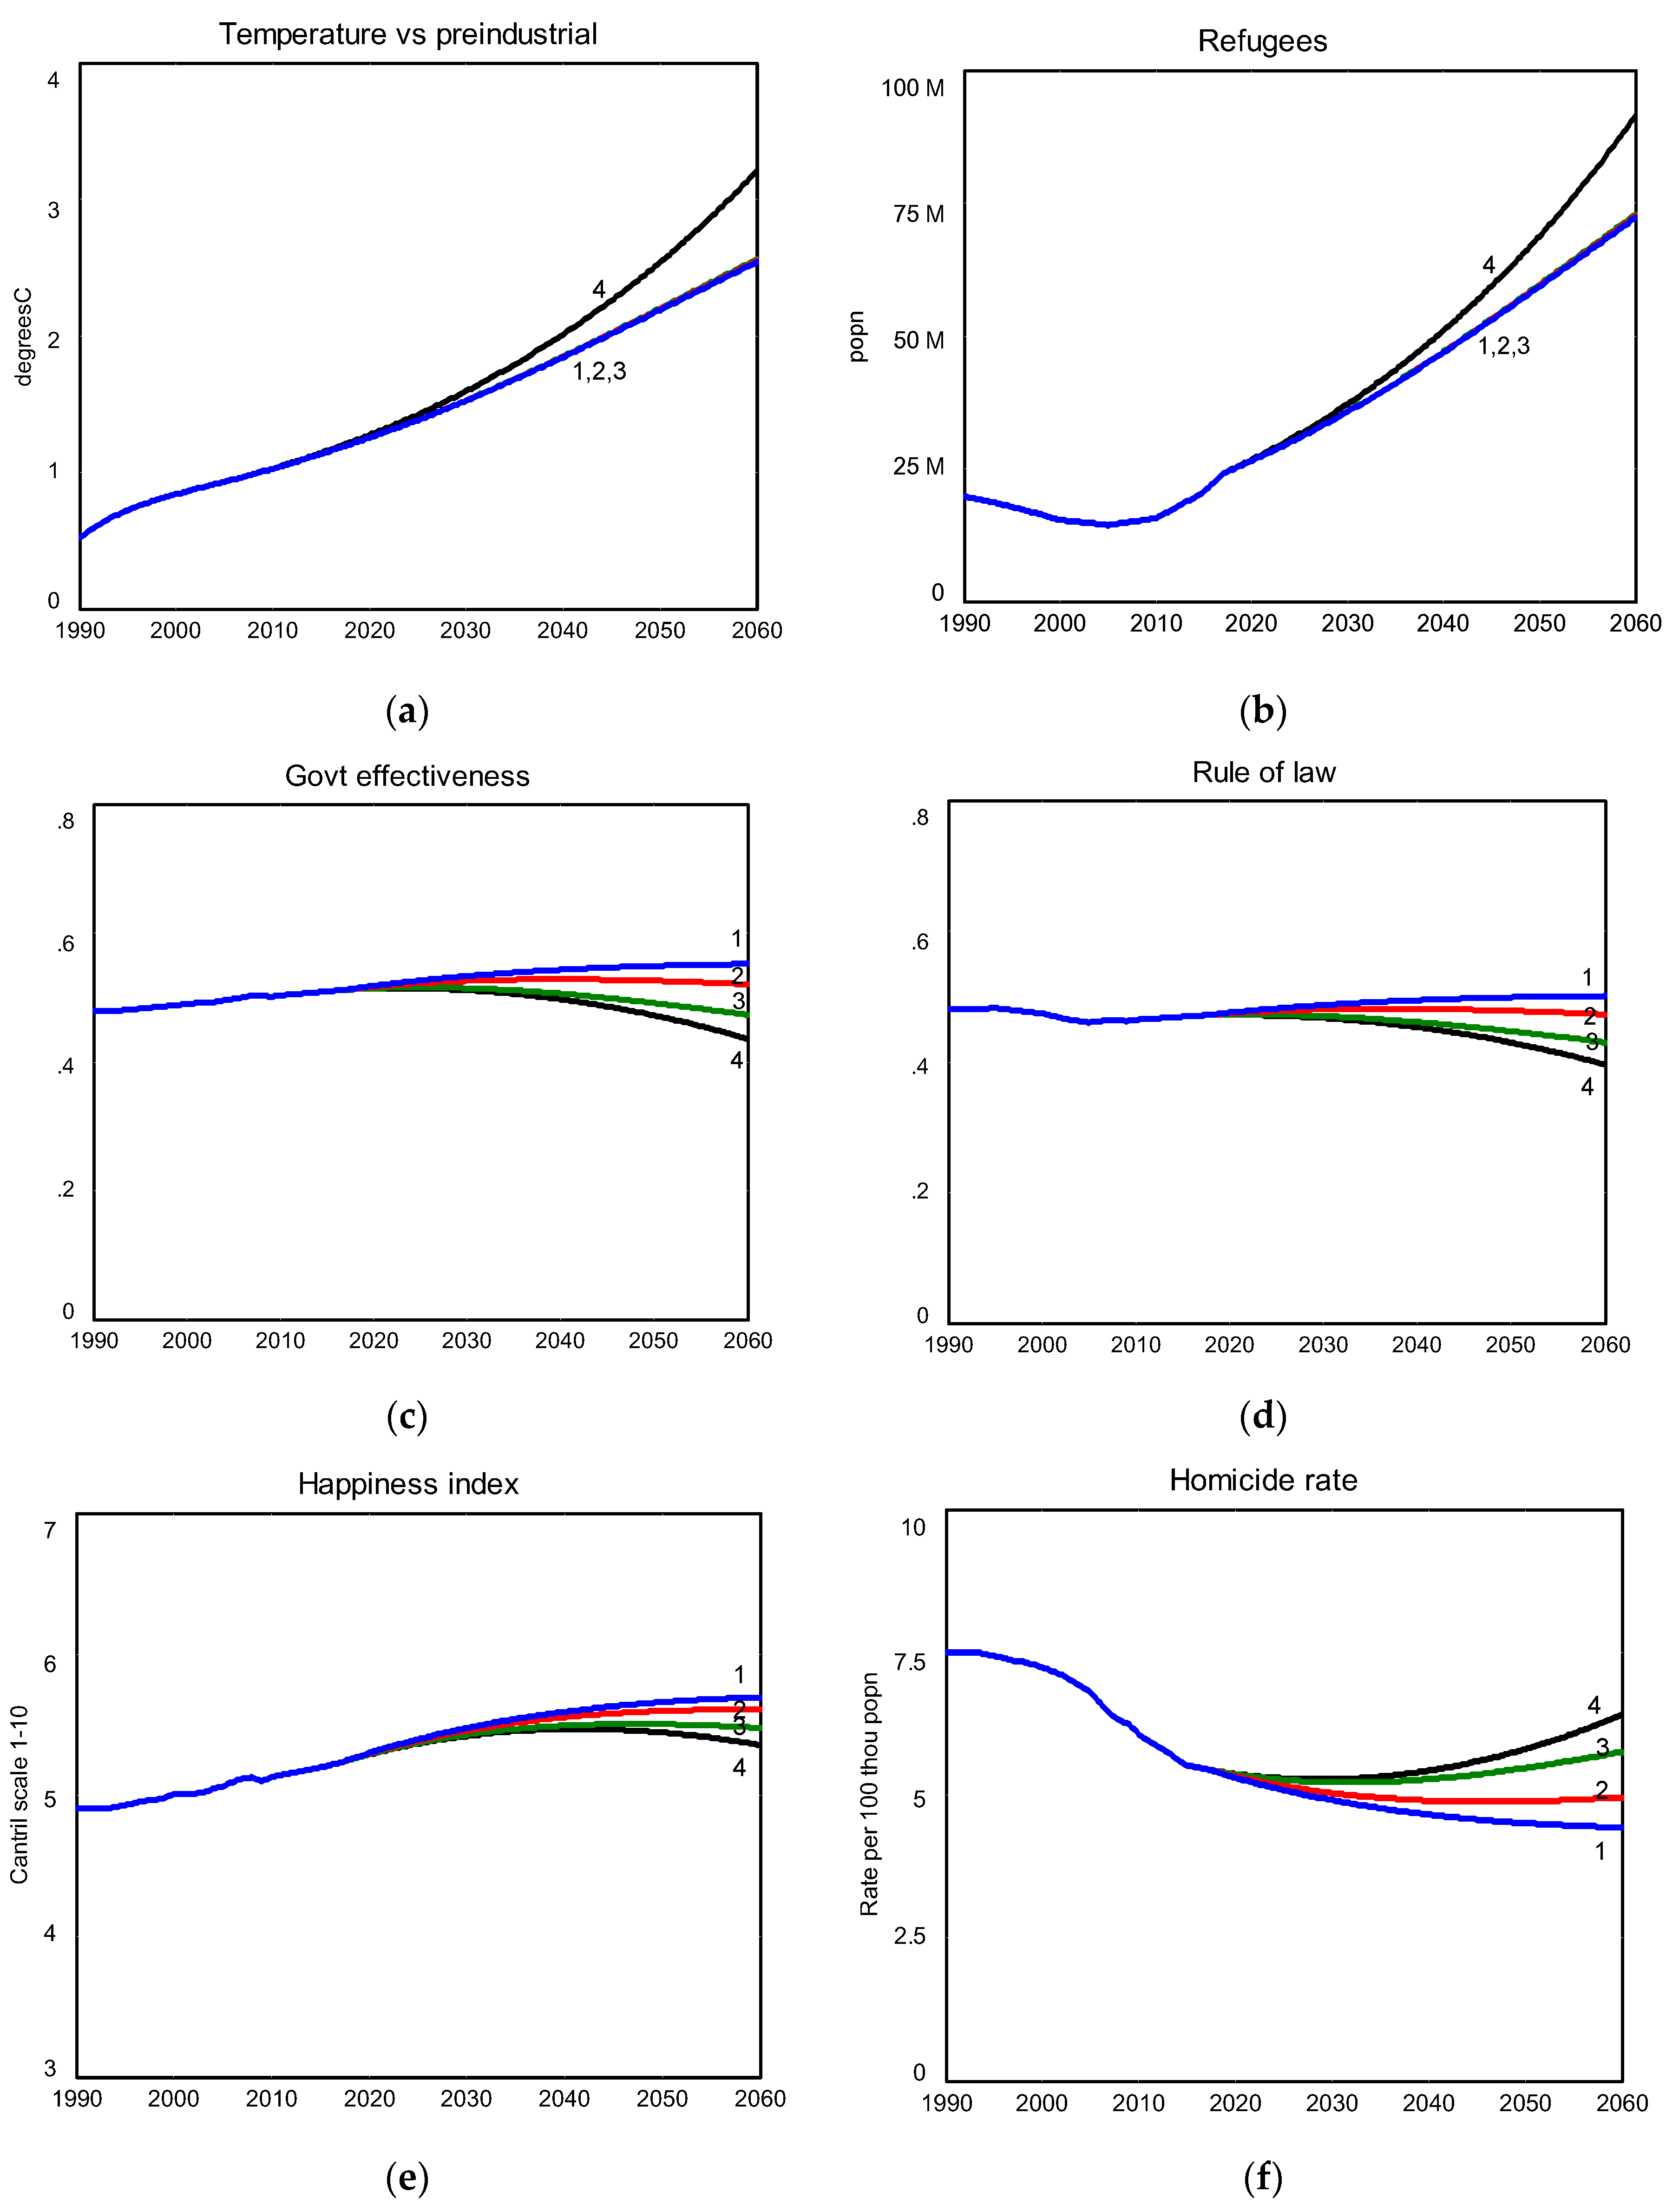
- Scenario 1: 0% governance erosion effect, default (1x) heat trap effect;
- Scenario 2: 4% governance erosion effect, 1x heat trap effect;
- Scenario 3: 10% governance erosion effect, 1x heat trap effect;
- Scenario 4: 10% governance erosion effect, 3x heat trap effect.
7. Discussion
Institutional Review Board Statement
Informed Consent Statement
Data Availability Statement
Conflicts of Interest
References
- UNFCCC (United Nations Framework Convention on Climate Change). 2023. Integrated Assessment Models (IAMs) and Energy-Environment-Economy (E3) Models. https://unfccc.int/topics/mitigation/workstreams/response-measures/modelling-tools-to-assess-the-impact-of-the-implementation-of-response-measures/integrated-assessment-models-iams-and-energy-environment-economy-e3-models.
- McKay DIA, Staal A, Abrams JF, Winkelmann R, Sakschewski B, Loriani S, Fetzer I, Cornell SE, Rockström J, Lenton TM. 2022. Exceeding 1.5°C global warming could trigger multiple climate tipping points. Science 377(6611).
- Lenton TM, Rockström J, Gaffney O, Rahmstorf S, Richardson K, Steffen W, Schellnhuber HJ. 2019. Climate tipping points-too risky to bet against. Nature 575(7784):592-595. [CrossRef]
- Zaelke D, Picolotti R, Dreyfus G, and others. 2020. The need for fast near-term climate mitigation to slow feedbacks amd avoid tipping points. Institute for Governance & Sustainable Development (IGSD) and Center for Human Rights and Environment (CHRE). 15 September 2023, 168 pp. https://www.igsd.org/wp-content/uploads/2020/09/Science-Supporting-Need-for-Fast-Near-Term-Climate-Mitigation-Sept2020.pdf.
- Rocha JC, Peterson G, Bodin Ö, Levin S. 2018. Cascading regime shifts within and across scales. Science 362(6421):1379-1383. [CrossRef]
- Kemp L, Xu C, Depledge J, Ebi KL, Gibbins G, Kohler TA, Rockström J, and others. 2022. Climate endgame: exploring catastrophic climate change scenarios. PNAS 119(34); 9 pp. [CrossRef]
- WHO (World Health Organization). 2014. Quantitative risk assessment of the effects of climate change on selected causes of death, 2030s and 2050s. 18 September 2014. 128 pp. https://www.who.int/publications/i/item/9789241507691.
- Ebi KL, Hess JJ, Watkiss P. 2017. Health risks and costs of climate variability and change. Chapter 8, pp. 153-169. In: Injury Prevention and Environmental Health (3rd edition), eds. Mock CN, Nugent R, Kobusingye O, Smith KR. The World Bank: Washington, DC. https://www.dcp-3.org/chapter/2487/health-risks-and-costs-climate-variability-and-change.
- WHO (World Health Organization). 2018. COP24 special report: health & climate change. 3 December 2018. 74 pp. https://www.who.int/publications/i/item/9789241514972.
- WHO (World Health Organization). 2023. Climate change. 12 October 2023. https://www.who.int/news-room/fact-sheets/detail/climate-change-and-health.
- Springmann M, Mason-D'Croz D, Robinson S, Garnett T, and others. 2016. Global and regional health effects of future food production under climate change: a modelling study. Lancet 387:1937-1946. [CrossRef]
- World Bank. 2012. Turn Down the Heat: Why a 4°C Warmer World Must be Avoided. World Bank Group: Washington DC. November 2012, report 74455, 105 pp. https://documents.worldbank.org/en/publication/documents-reports/documentdetail/865571468149107611/turn-down-the-heat-why-a-4-c-warmer-world-must-be-avoided.
- de Châtel F. 2014. The role of drought and climate change in the Syrian uprising: untangling the triggers of the revolution. Middle Eastern Studies 50(4):521-535.
- Kelley C, Mohtadi S, Cane M, Seager R, Kushnir Y. 2015. Climate change in the Fertile Crescent and implications of the recent Syrian drought. PNAS 112 (11):3241-3246. [CrossRef]
- Adano WR, Daudi F. 2012. Links between climate change, conflict and governance in Africa. Institute for Security Studies Paper No. 234. May 2012, 16 pp. https://www.files.ethz.ch/isn/145415/Paper_234.pdf.
- Schleussner C-F, Donges JF, Donner RV, Schellnhuber HJ. 2016. Armed-conflict risks enhanced by climate-related disasters in ethnically fractionalized countries. PNAS 113(33): 9216-9221. [CrossRef]
- Arora A, Spatz E, Herrin J, Riley C, Roy B, Kell K, Coberley C, Rula E, Krumholz HM. 2016. Population well-being measures help explain geographic disparities in life expectancy at the county level. Health Affairs 2016;35(11):2075-82. [CrossRef]
- Botchwey N, Dannenberg A, Frumkin H. 2022. Making Healthy Places: Designing and Building for Well-Being, Equity, and Sustainability. 2nd ed, 552 pp. Island Press: Washington DC. https://islandpress.org/books/making-healthy-places-second-edition.
- Homer J. 2020. Modeling global loss of life from climate change through 2060. Sys Dyn Rev 36(4):523-535. [CrossRef]
- Homer J. 2022. Can good government save us? Extending a climate-population model to include governance and its effects. Systems 10(37): 11 pp. [CrossRef]
- Climate Interactive. 2023. The En-ROADS climate solutions simulator. https://www.climateinteractive.org/en-roads/.
- Kaufmann D, Kraay A. 2023. Worldwide Governance Indicators, 2023 Update. https://www.worldbank.org/en/publication/worldwide-governance-indicators.
- IHME (Institute of Health Metrics and Evaluation). 2023. Global Health Data Exchange: deaths by homicide and suicide. https://ghdx.healthdata.org/.
- Helliwell JF, Layard R, Sachs JD, Aknin LB, De Neve J-E, Wang S (Eds.). 2023. World Happiness Report 2023 (11th ed). Sustainable Development Solutions Network (using Gallup World Poll data). https://worldhappiness.report/ed/2023/#appendices-and-data.
- World Bank. 2023. Poverty headcount ratio at $3.65 a day (2017 PPP). https://data.worldbank.org/indicator/SI.POV.LMIC.
- FAO (Food and Agriculture Organization of the United Nations). 2023. Suite of Food Security Indicators. https://fao.org/faostat/en/#data/FS.
- UNHCR (The UN Refguee Agency). 2023. Refugee Data Finder. https://www.unhcr.org/refugee-statistics/.
- World Bank. 2023. Refugee population by country or territory of asylum. https://data.worldbank.org/indicator/SM.POP.REFG.
- IDMC (Internal Displacement Monitoring Centre). 2023. Global Internal Displacement Database. https://www.internal-displacement.org/database/displacement-data.
- Clement V, Rigaud KK, de Sherbinin A, Jones B, Adarno S, Schewe J, Sadiq N, Shabahat E. 2021. Groundswell Part 2: Acting on Internal Climate Migration. World Bank: Washington DC. http://hdl.handle.net/10986/36248.


| (1) Suicides per 100 thou = 15.6 × RAMP(from 1.0 [1990] to 0.70 [2015]) – (ln GDPPC ratio to 1990 × 2.0) - (Govt effectiveness delta vs 1990 × 10.5) |
| (2) Homicide per 100 thou = 7.5 × RAMP(from 1.0 [1990] to 0.72 [2015]) – (ln GDPPC ratio to 1990 × 0.85) - (Rule of law delta vs 1990 × 15.0) - (Stability peace delta vs 1990 × 3.75) |
| (3) Happiness = 4.9 + (ln GDPPC ratio to 1990 × 0.75) + (Govt effectiveness delta vs 1990 × 1.5) + (Rule of law delta vs 1990 × 0.85) + (Stability peace delta vs 1990 × 0.15) |
| (4) Poverty fraction = 0.55 × RAMP(from 1.0 [1990] to 0.70 [2015]) – (ln GDPPC ratio to 1990 × 0.30) |
| (5) Undernourished fraction = 0.17 × RAMP(1.0 [1990] to 0.70 [2015]) × (1 + Temperature delta vs 2017 × 0.07) – (ln GDPPC ratio to 1990 × 0.10) |
| (6) Govt effectiveness = (0.48 + (ln GDDPC ratio to 1990 × 0.08)) × Climate change multiplier on governance |
| (7) Regulatory quality = (0.46 + (ln GDDPC ratio to 1990 × 0.06)) × Climate change multiplier on governance |
| (8) Rule of law = (0.48 + (ln GDDPC ratio to 1990 × 0.065)) × Climate change multiplier on governance |
| (9) Stability peace = (0.44 + (ln GDDPC ratio to 1990 × 0.10)) × Climate change multiplier on governance |
| (10) Climate change multiplier on governance = 1 – Temperature delta vs 2017 × 0.04 |
| (11) Refugees per thou (starting 2017) = 3.2 × (1 + Temperature delta vs 2017 × 0.90) |
| (12) Internally displaced per thou (starting 2017) = 5.4 × (1 + Temperature delta vs 2017 × 2.65) |
| 2010 | 2060 value by scenario | ||||
|---|---|---|---|---|---|
| Output variable | value | S1 | S2 | S3 | S4 |
| Temp. vs preindustrial (oC) | 1.03 | 2.54 | 2.55 | 2.56 | 3.21 |
| CO2e emissions (gtonnes/yr.) | 51.5 | 90.4 | 91.3 | 91.8 | 90.4 |
| Refugees (million) | 15.6 | 72.2 | 72.5 | 72.9 | 91.5 |
| Internally displaced (million) | 23.6 | 252.2 | 253.5 | 255.4 | 348 |
| GDP per capita ($/person/yr.) | 9545 | 17552 | 17272 | 16859 | 16163 |
| Life expectancy (years) | 70.6 | 75.8 | 75.7 | 75.5 | 75.2 |
| Government effectiveness (0-1) | 0.503 | 0.552 | 0.52 | 0.473 | 0.435 |
| Regulatory quality (0-1) | 0.477 | 0.514 | 0.485 | 0.441 | 0.406 |
| Rule of law (0-1) | 0.464 | 0.501 | 0.472 | 0.429 | 0.396 |
| Stability-peace (0-1) | 0.365 | 0.413 | 0.389 | 0.353 | 0.325 |
| Happiness (1-10 index) | 5.12 | 5.69 | 5.61 | 5.47 | 5.35 |
| Suicide rate (per 100,000) | 10.89 | 8.38 | 8.74 | 9.29 | 9.77 |
| Homicide rate (per 100,000) | 6.06 | 4.43 | 4.96 | 5.76 | 6.41 |
| Poverty fraction (0-1) | 0.354 | 0.117 | 0.121 | 0.129 | 0.141 |
| Undernourished fraction (0-1) | 0.094 | 0.041 | 0.042 | 0.045 | 0.055 |
Disclaimer/Publisher’s Note: The statements, opinions and data contained in all publications are solely those of the individual author(s) and contributor(s) and not of MDPI and/or the editor(s). MDPI and/or the editor(s) disclaim responsibility for any injury to people or property resulting from any ideas, methods, instructions or products referred to in the content. |
© 2024 by the authors. Licensee MDPI, Basel, Switzerland. This article is an open access article distributed under the terms and conditions of the Creative Commons Attribution (CC BY) license (http://creativecommons.org/licenses/by/4.0/).


