Submitted:
05 February 2024
Posted:
05 February 2024
You are already at the latest version
Abstract
Keywords:
1. Introduction
2. Materials and Methods
2.1. Materials
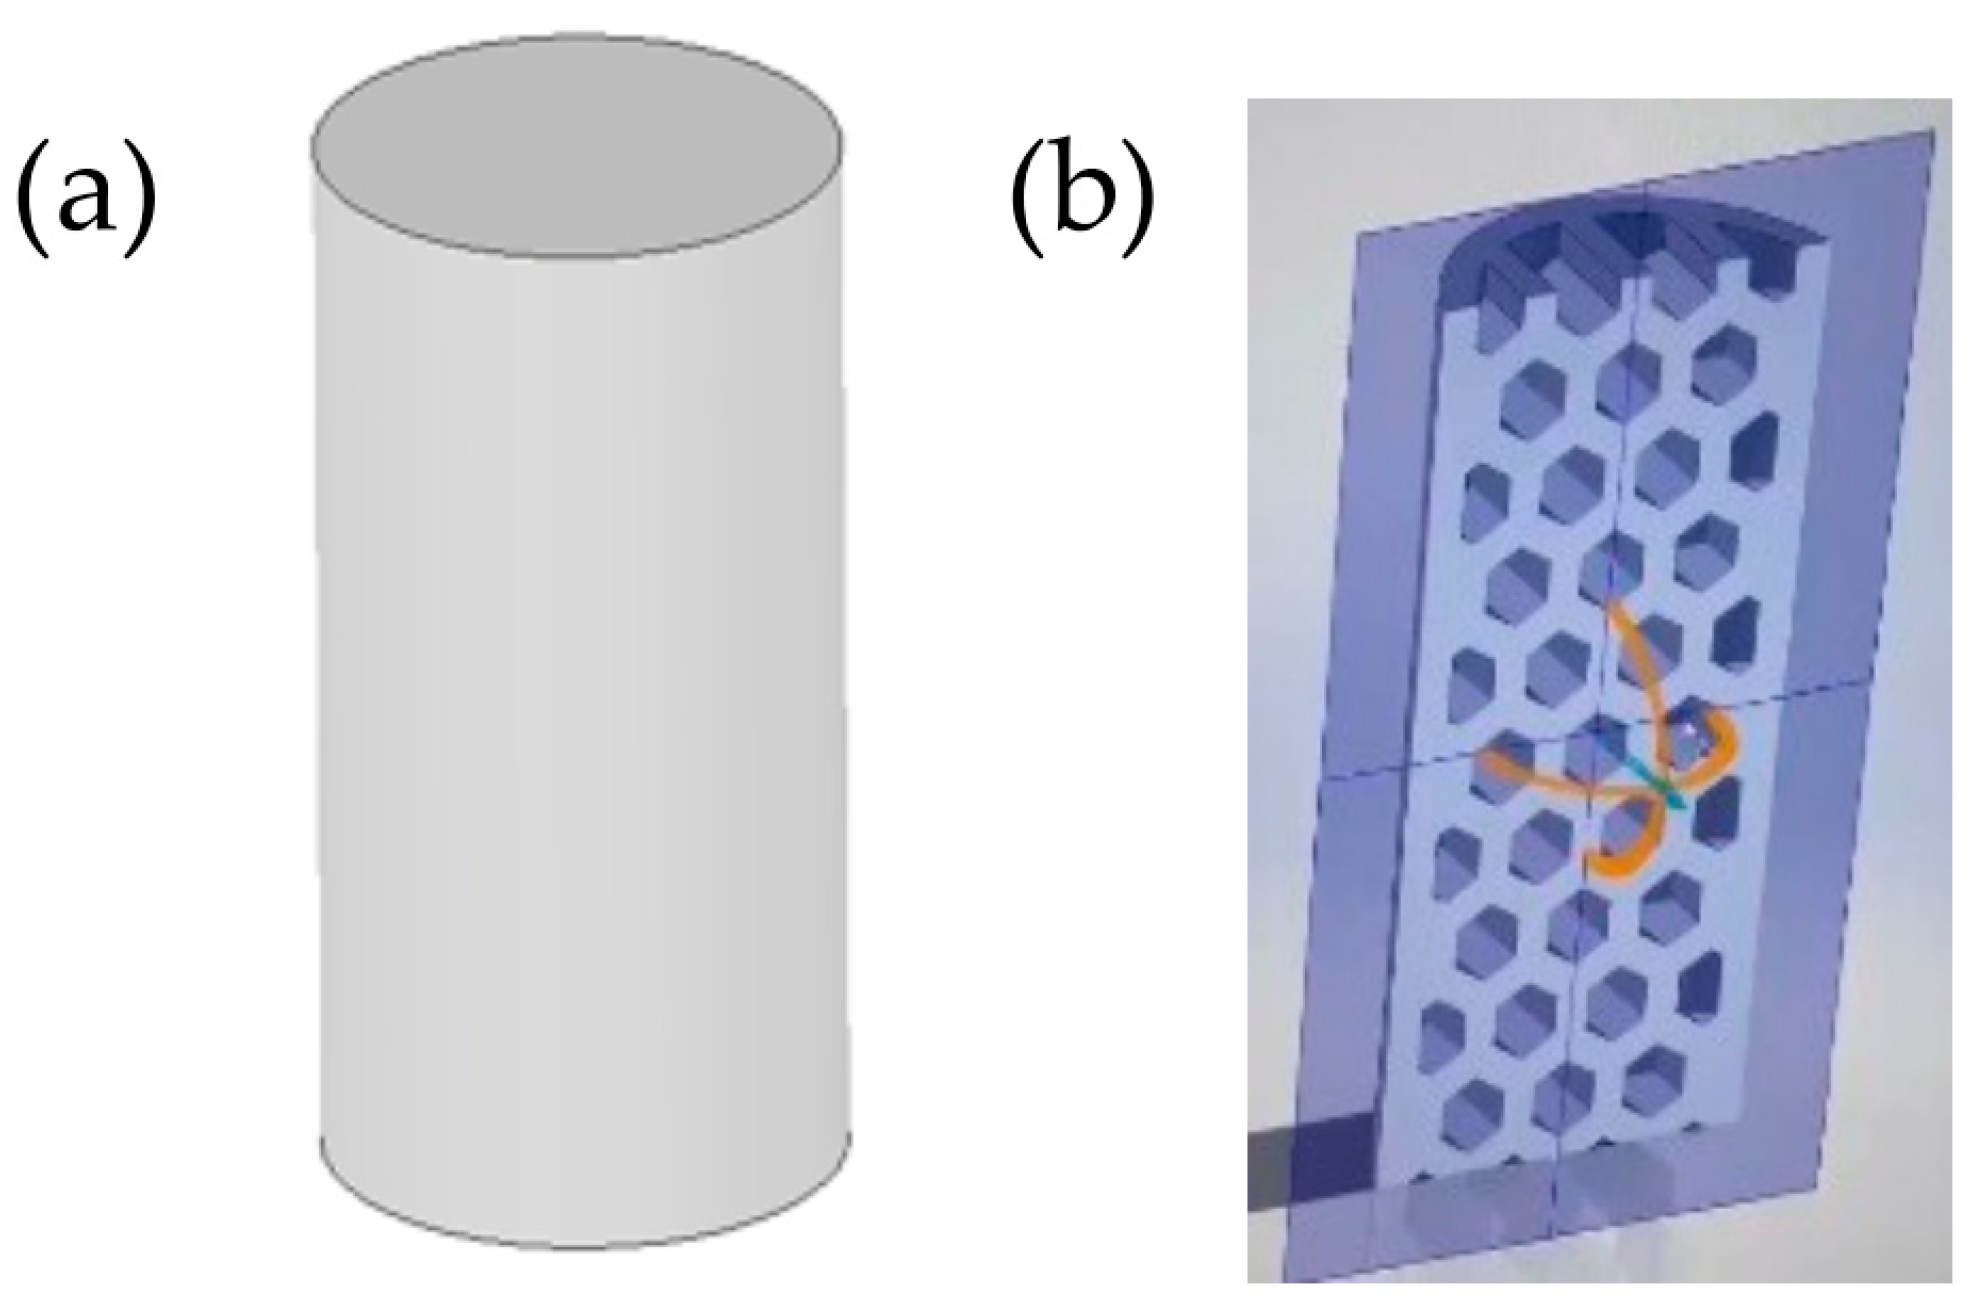
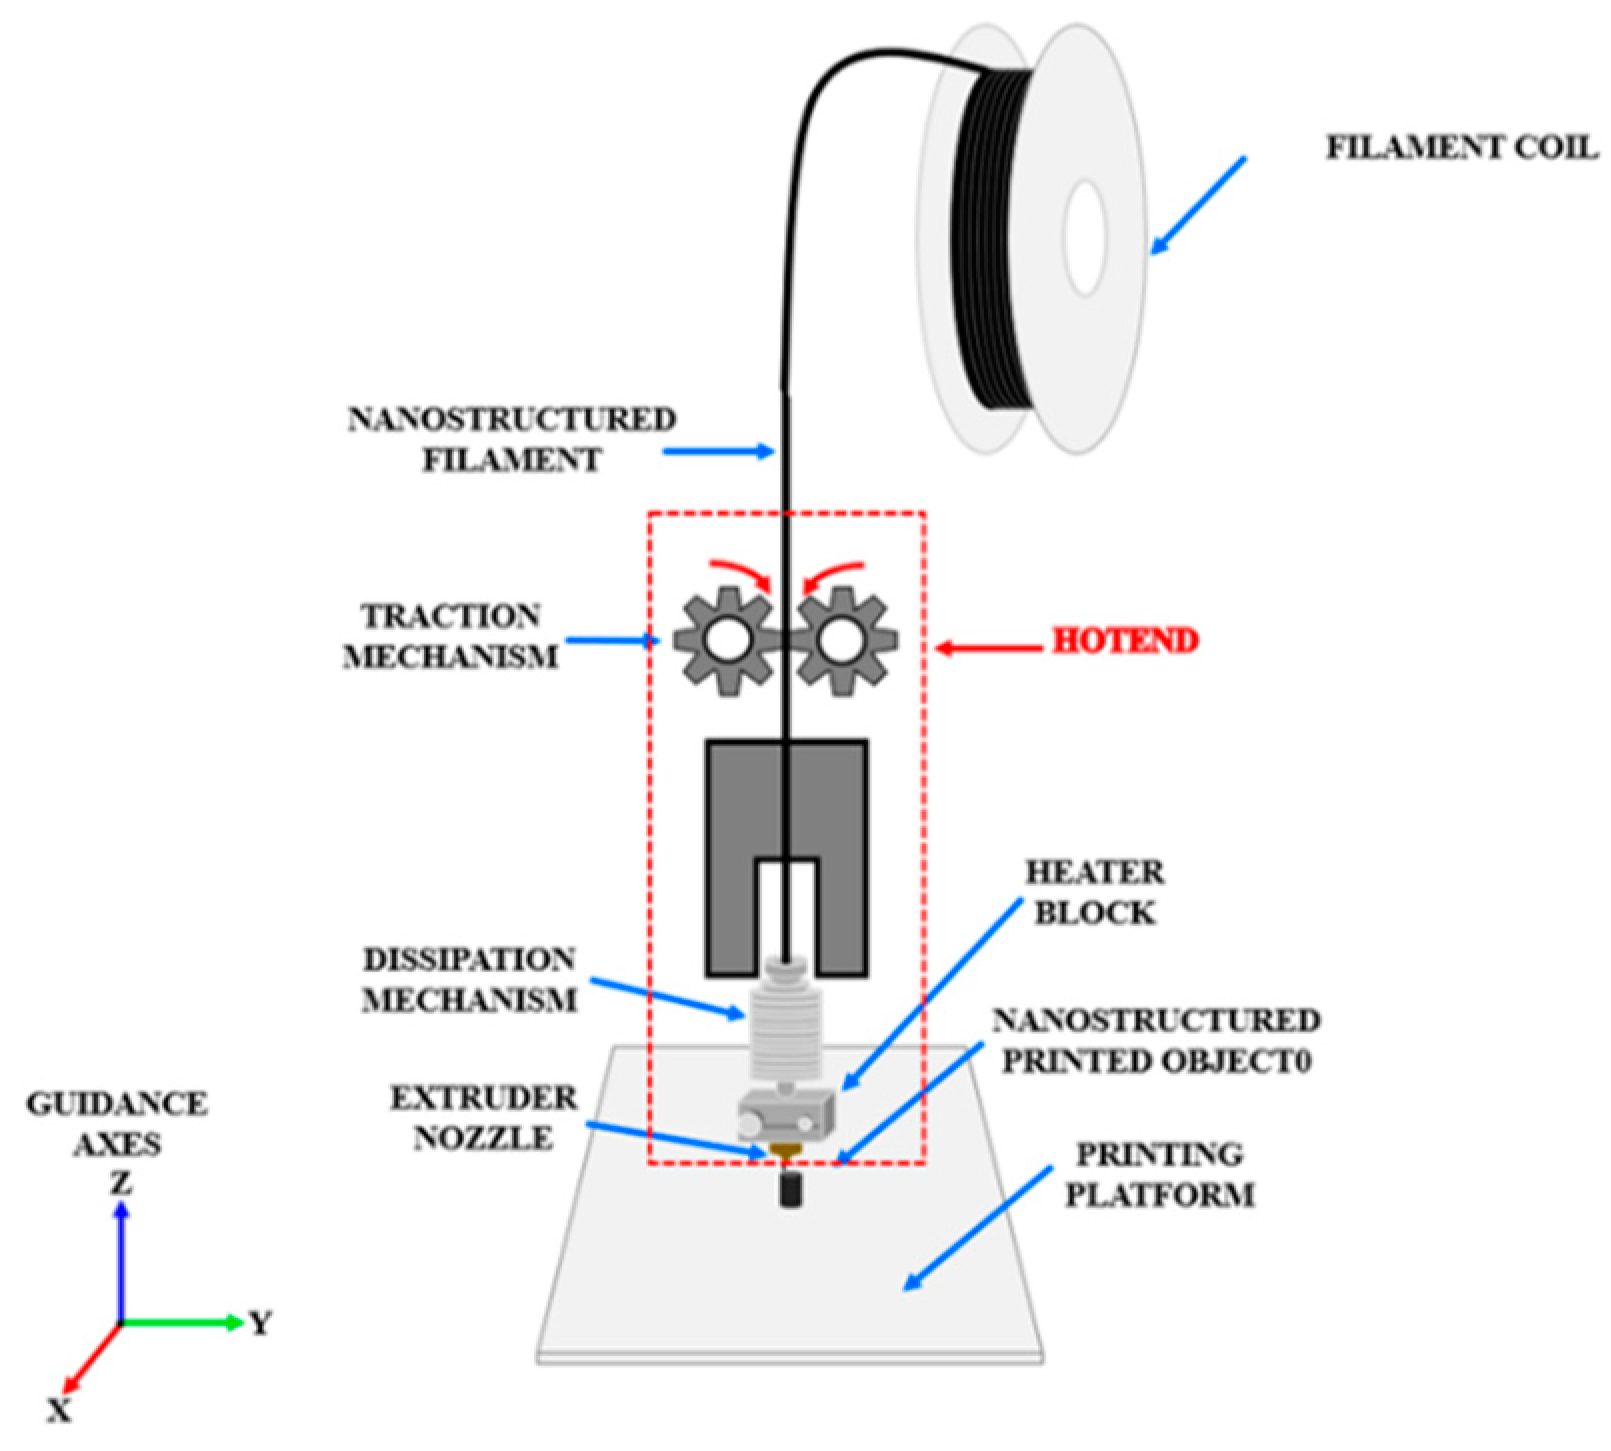
2.2. Modeling, Slicing and Printing Stage

2.3. Morphological Characterization by SEM
2.4. Characterization by X-Ray Diffraction
2.5. Vibrational Characterization by Raman Spectroscopy
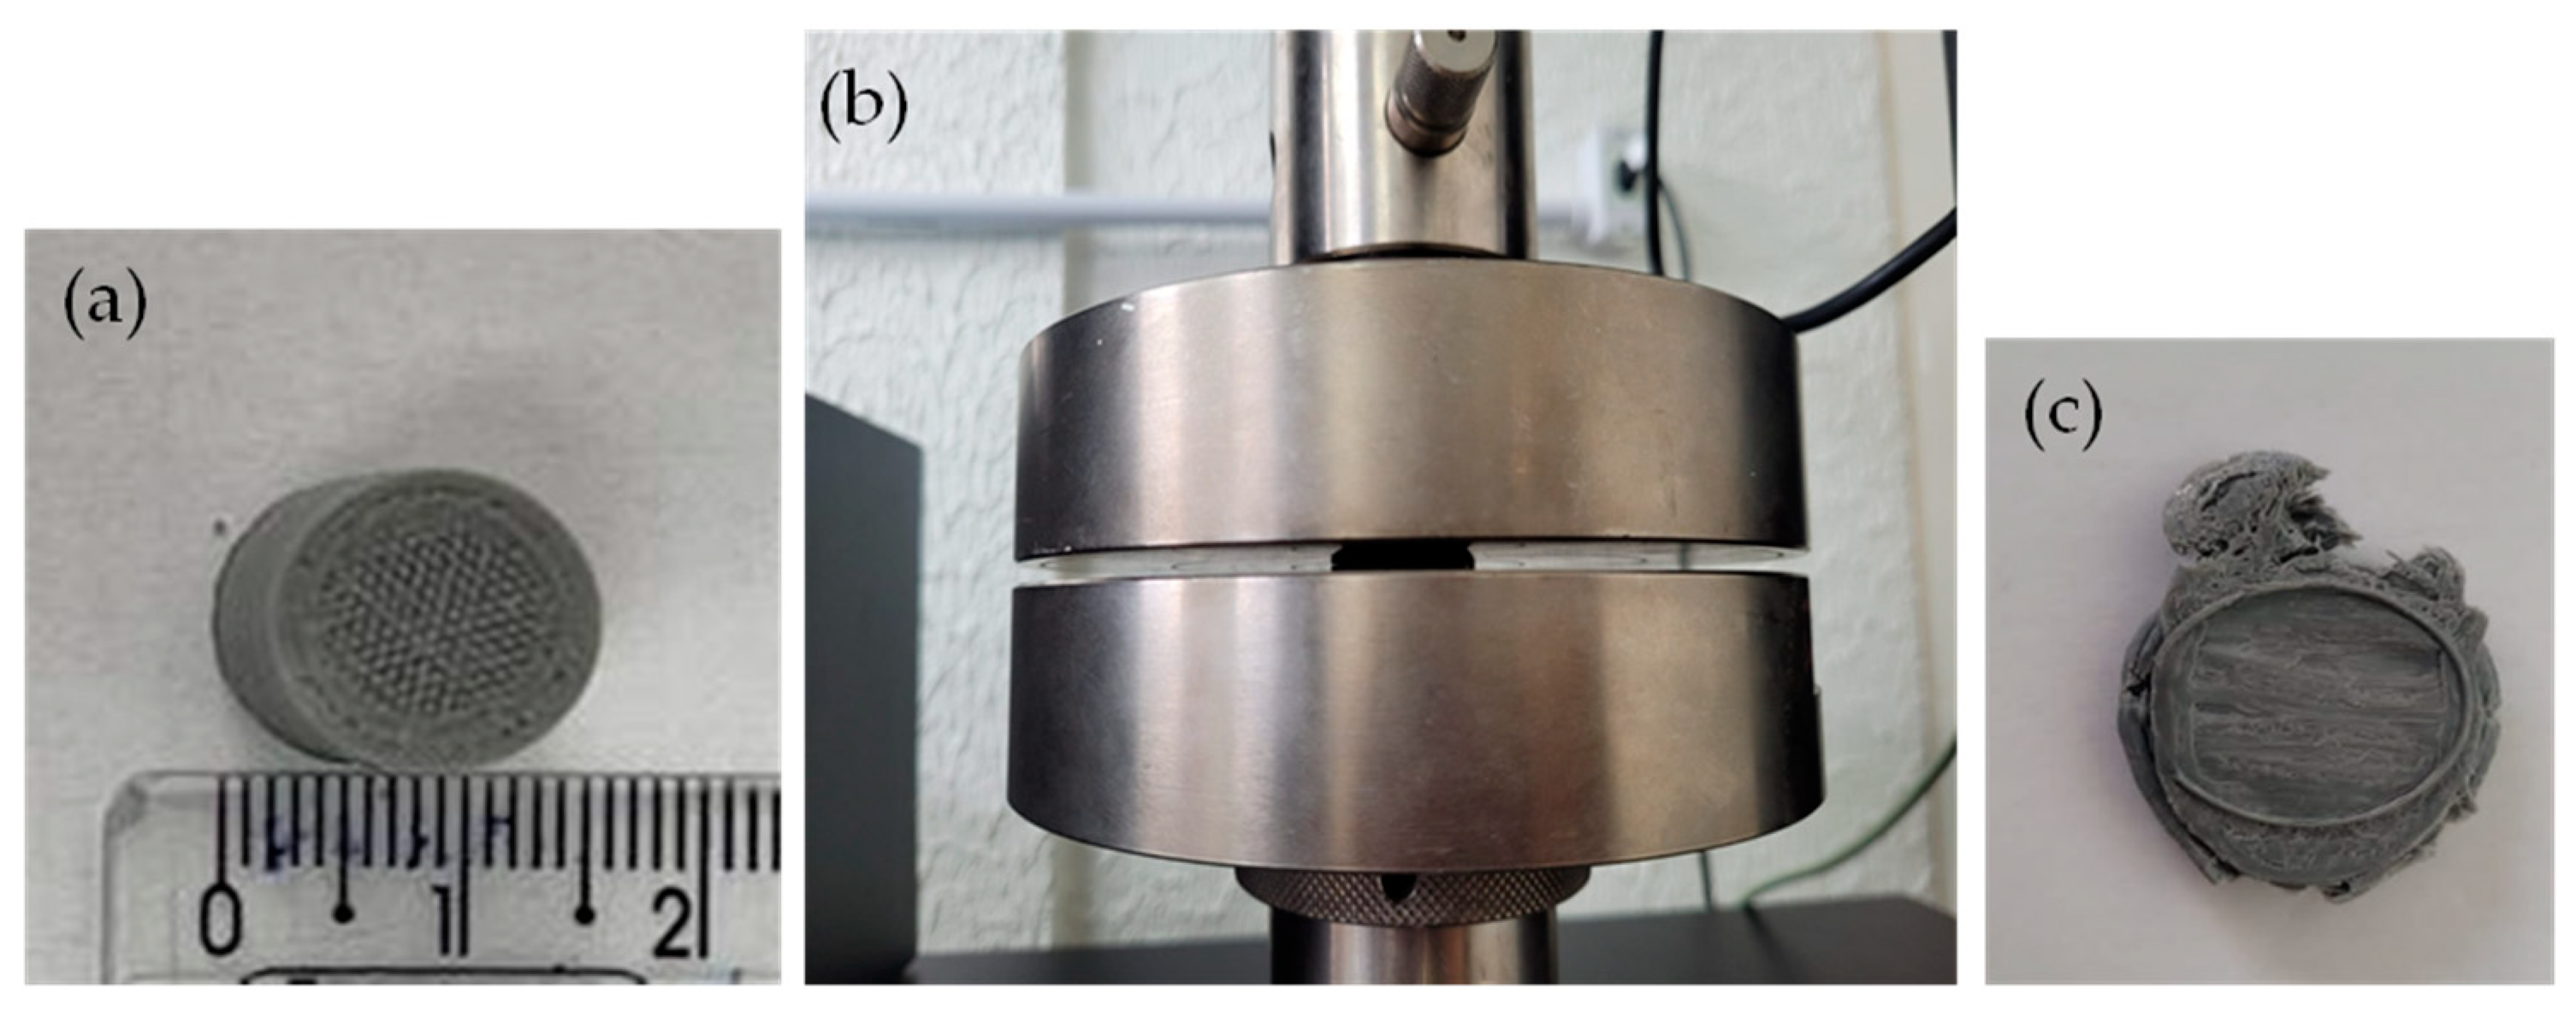
2.6. Compression Test
3. Results and Discussion
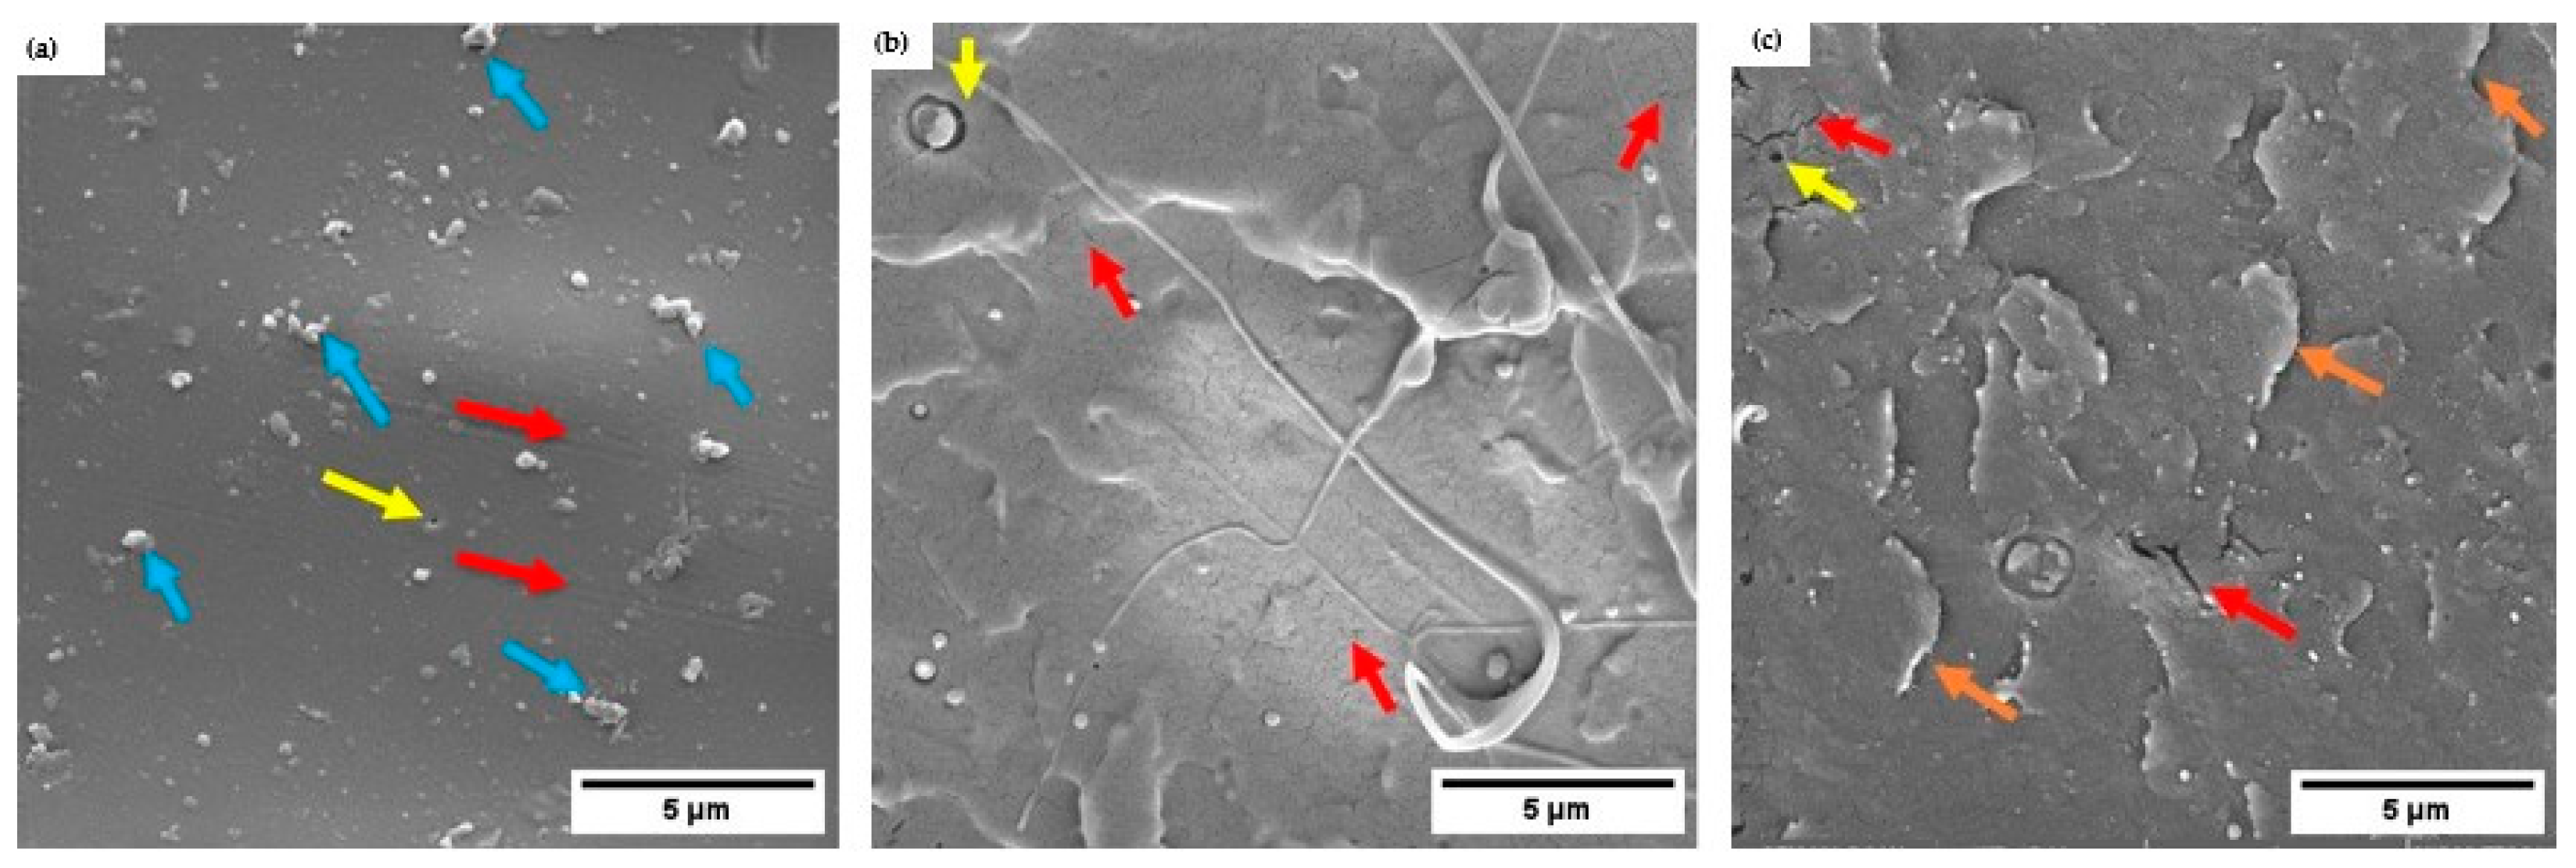
3.1. Scanning Electron Microscopy Analysis - SEM
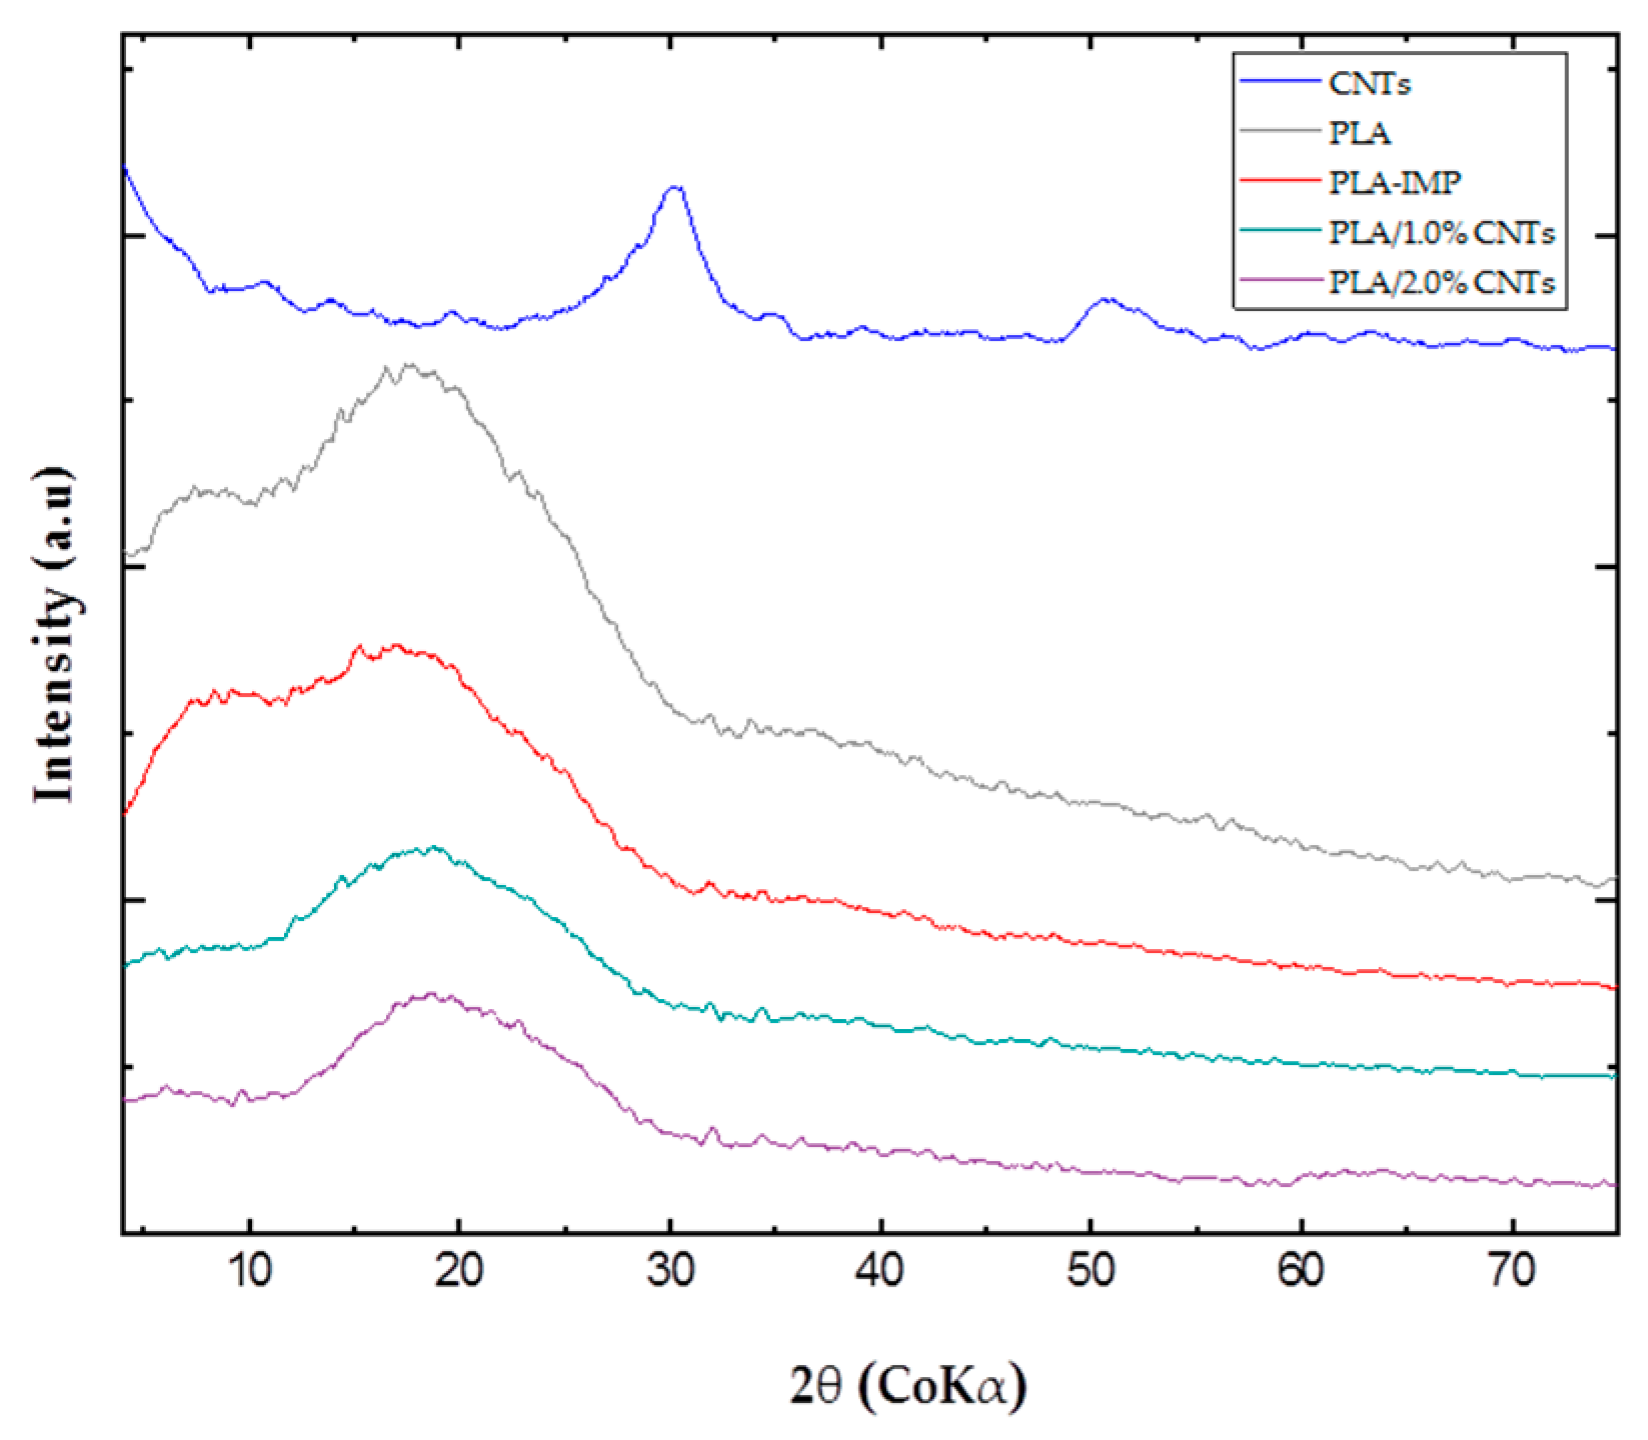
3.2. Characterization by X-ray Diffraction
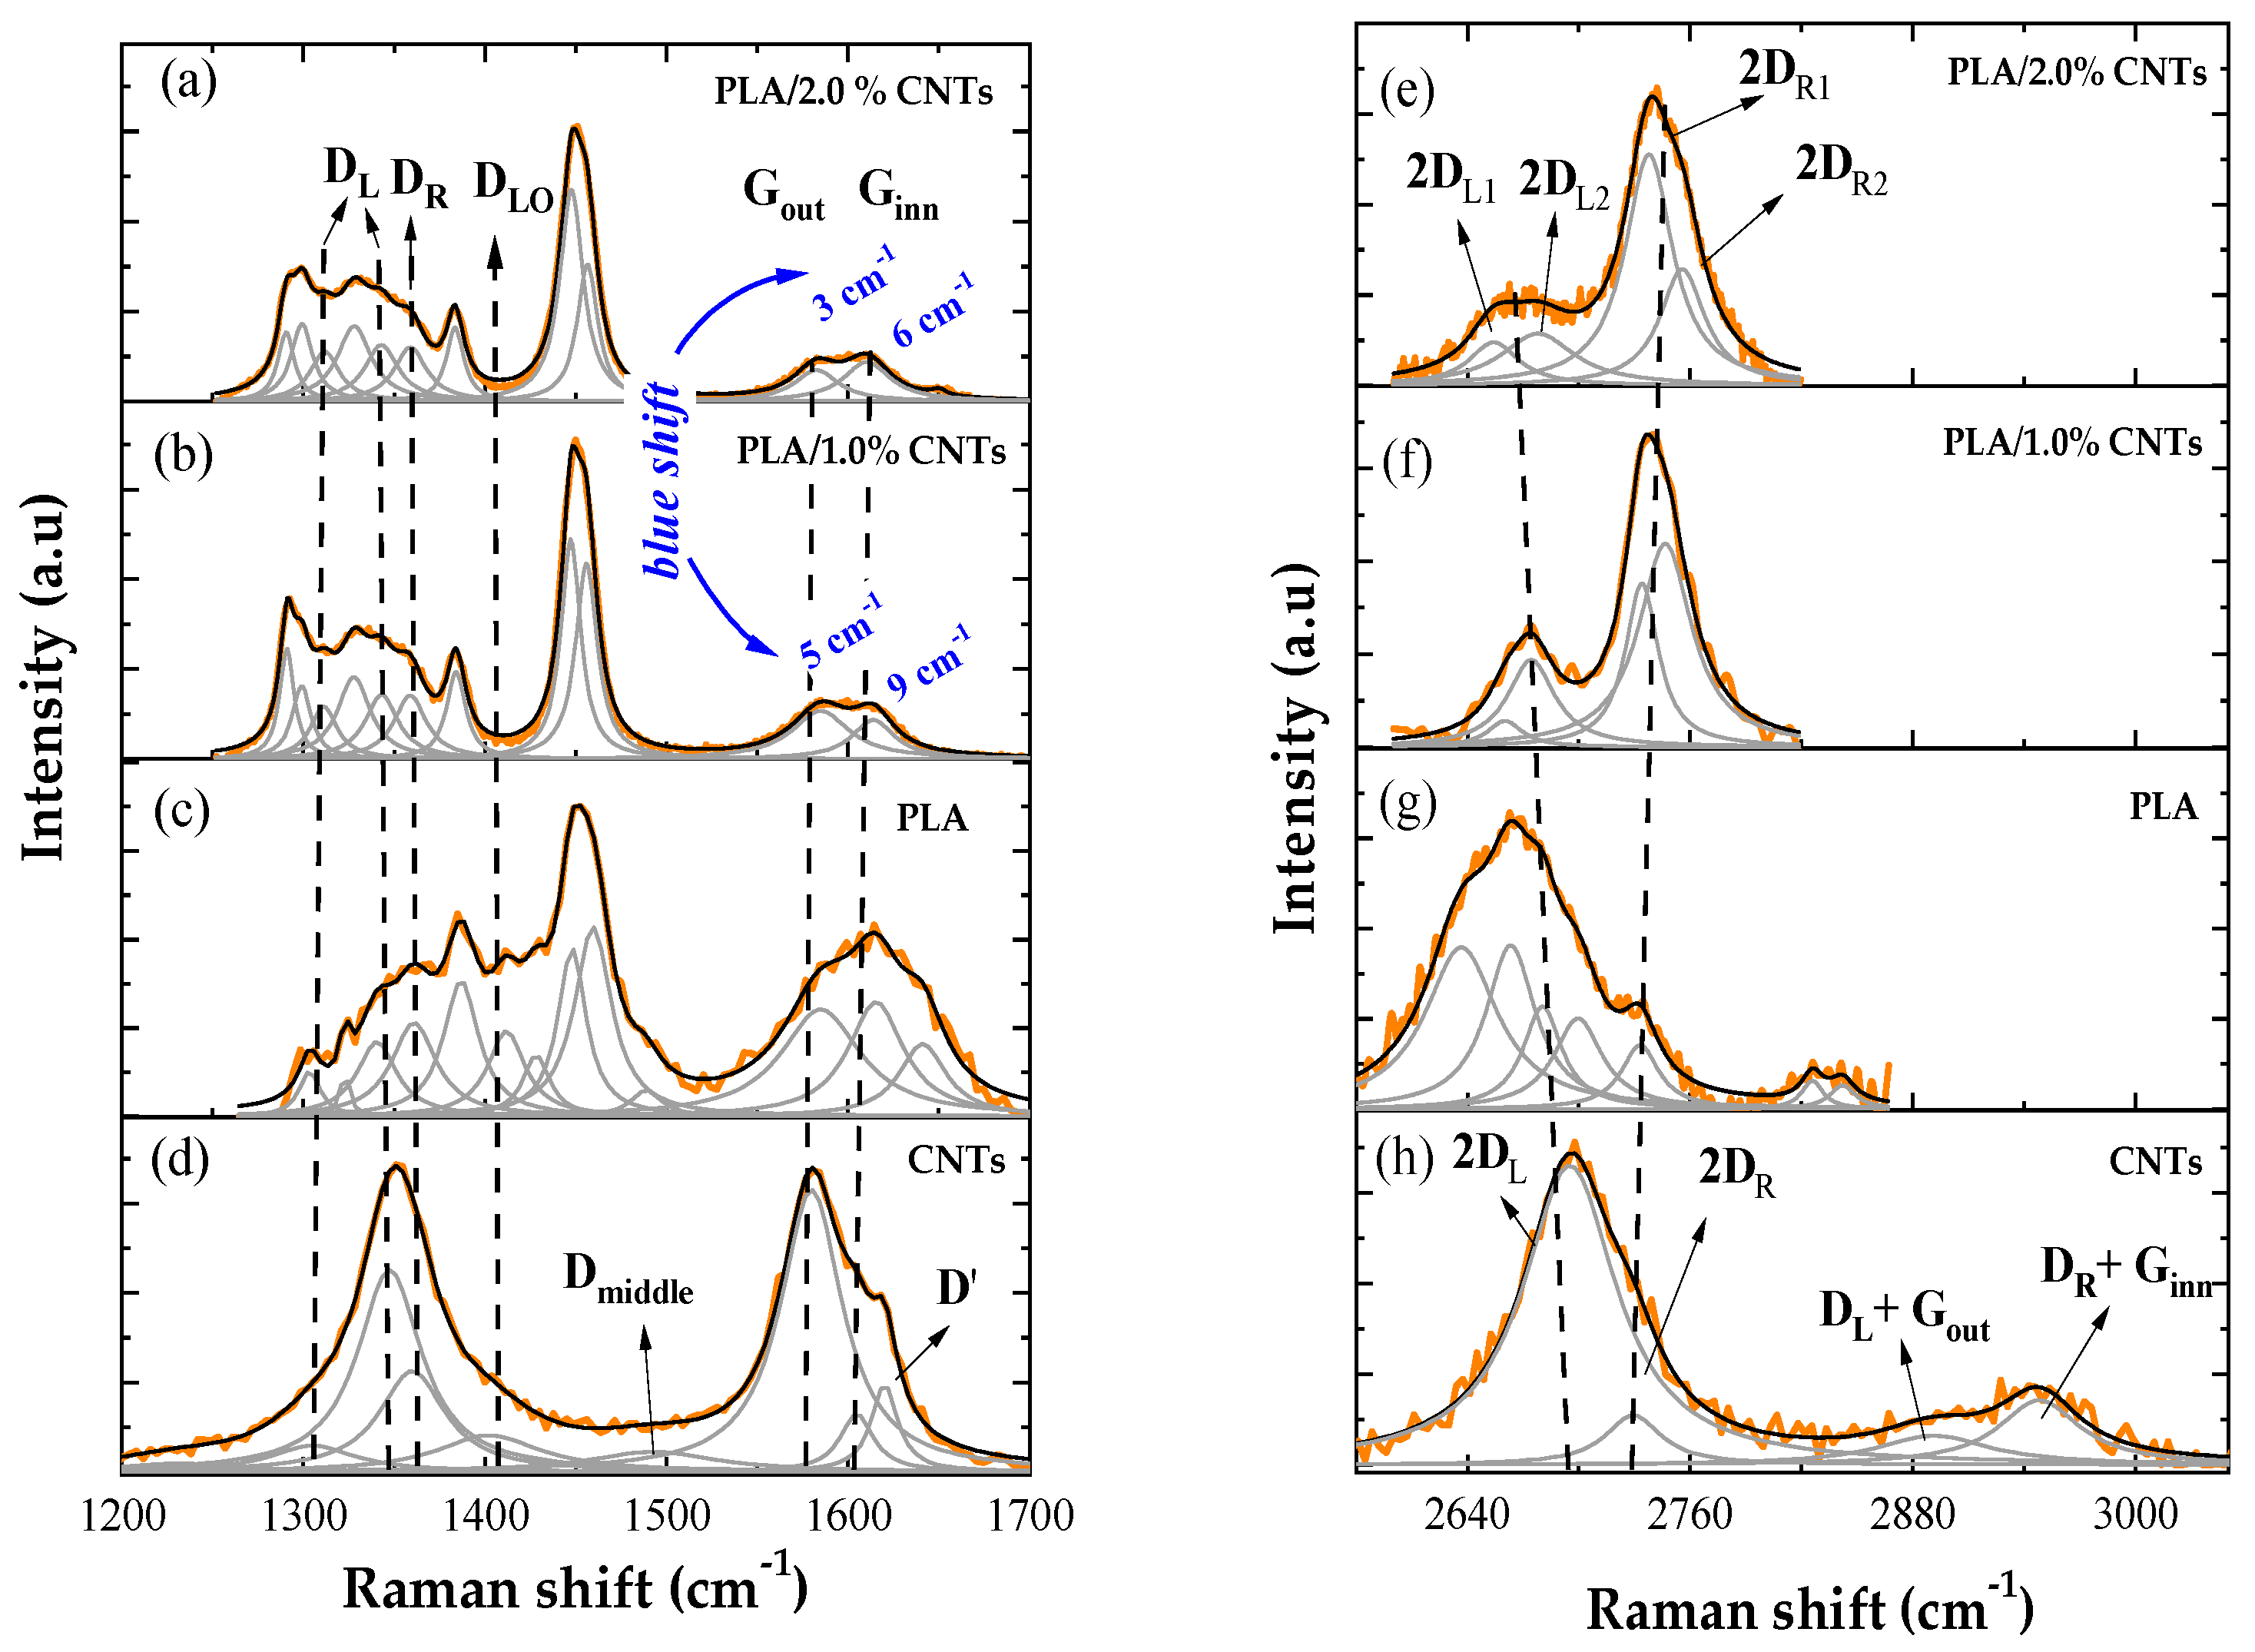
3.3. Characterization by Raman Spectroscopy
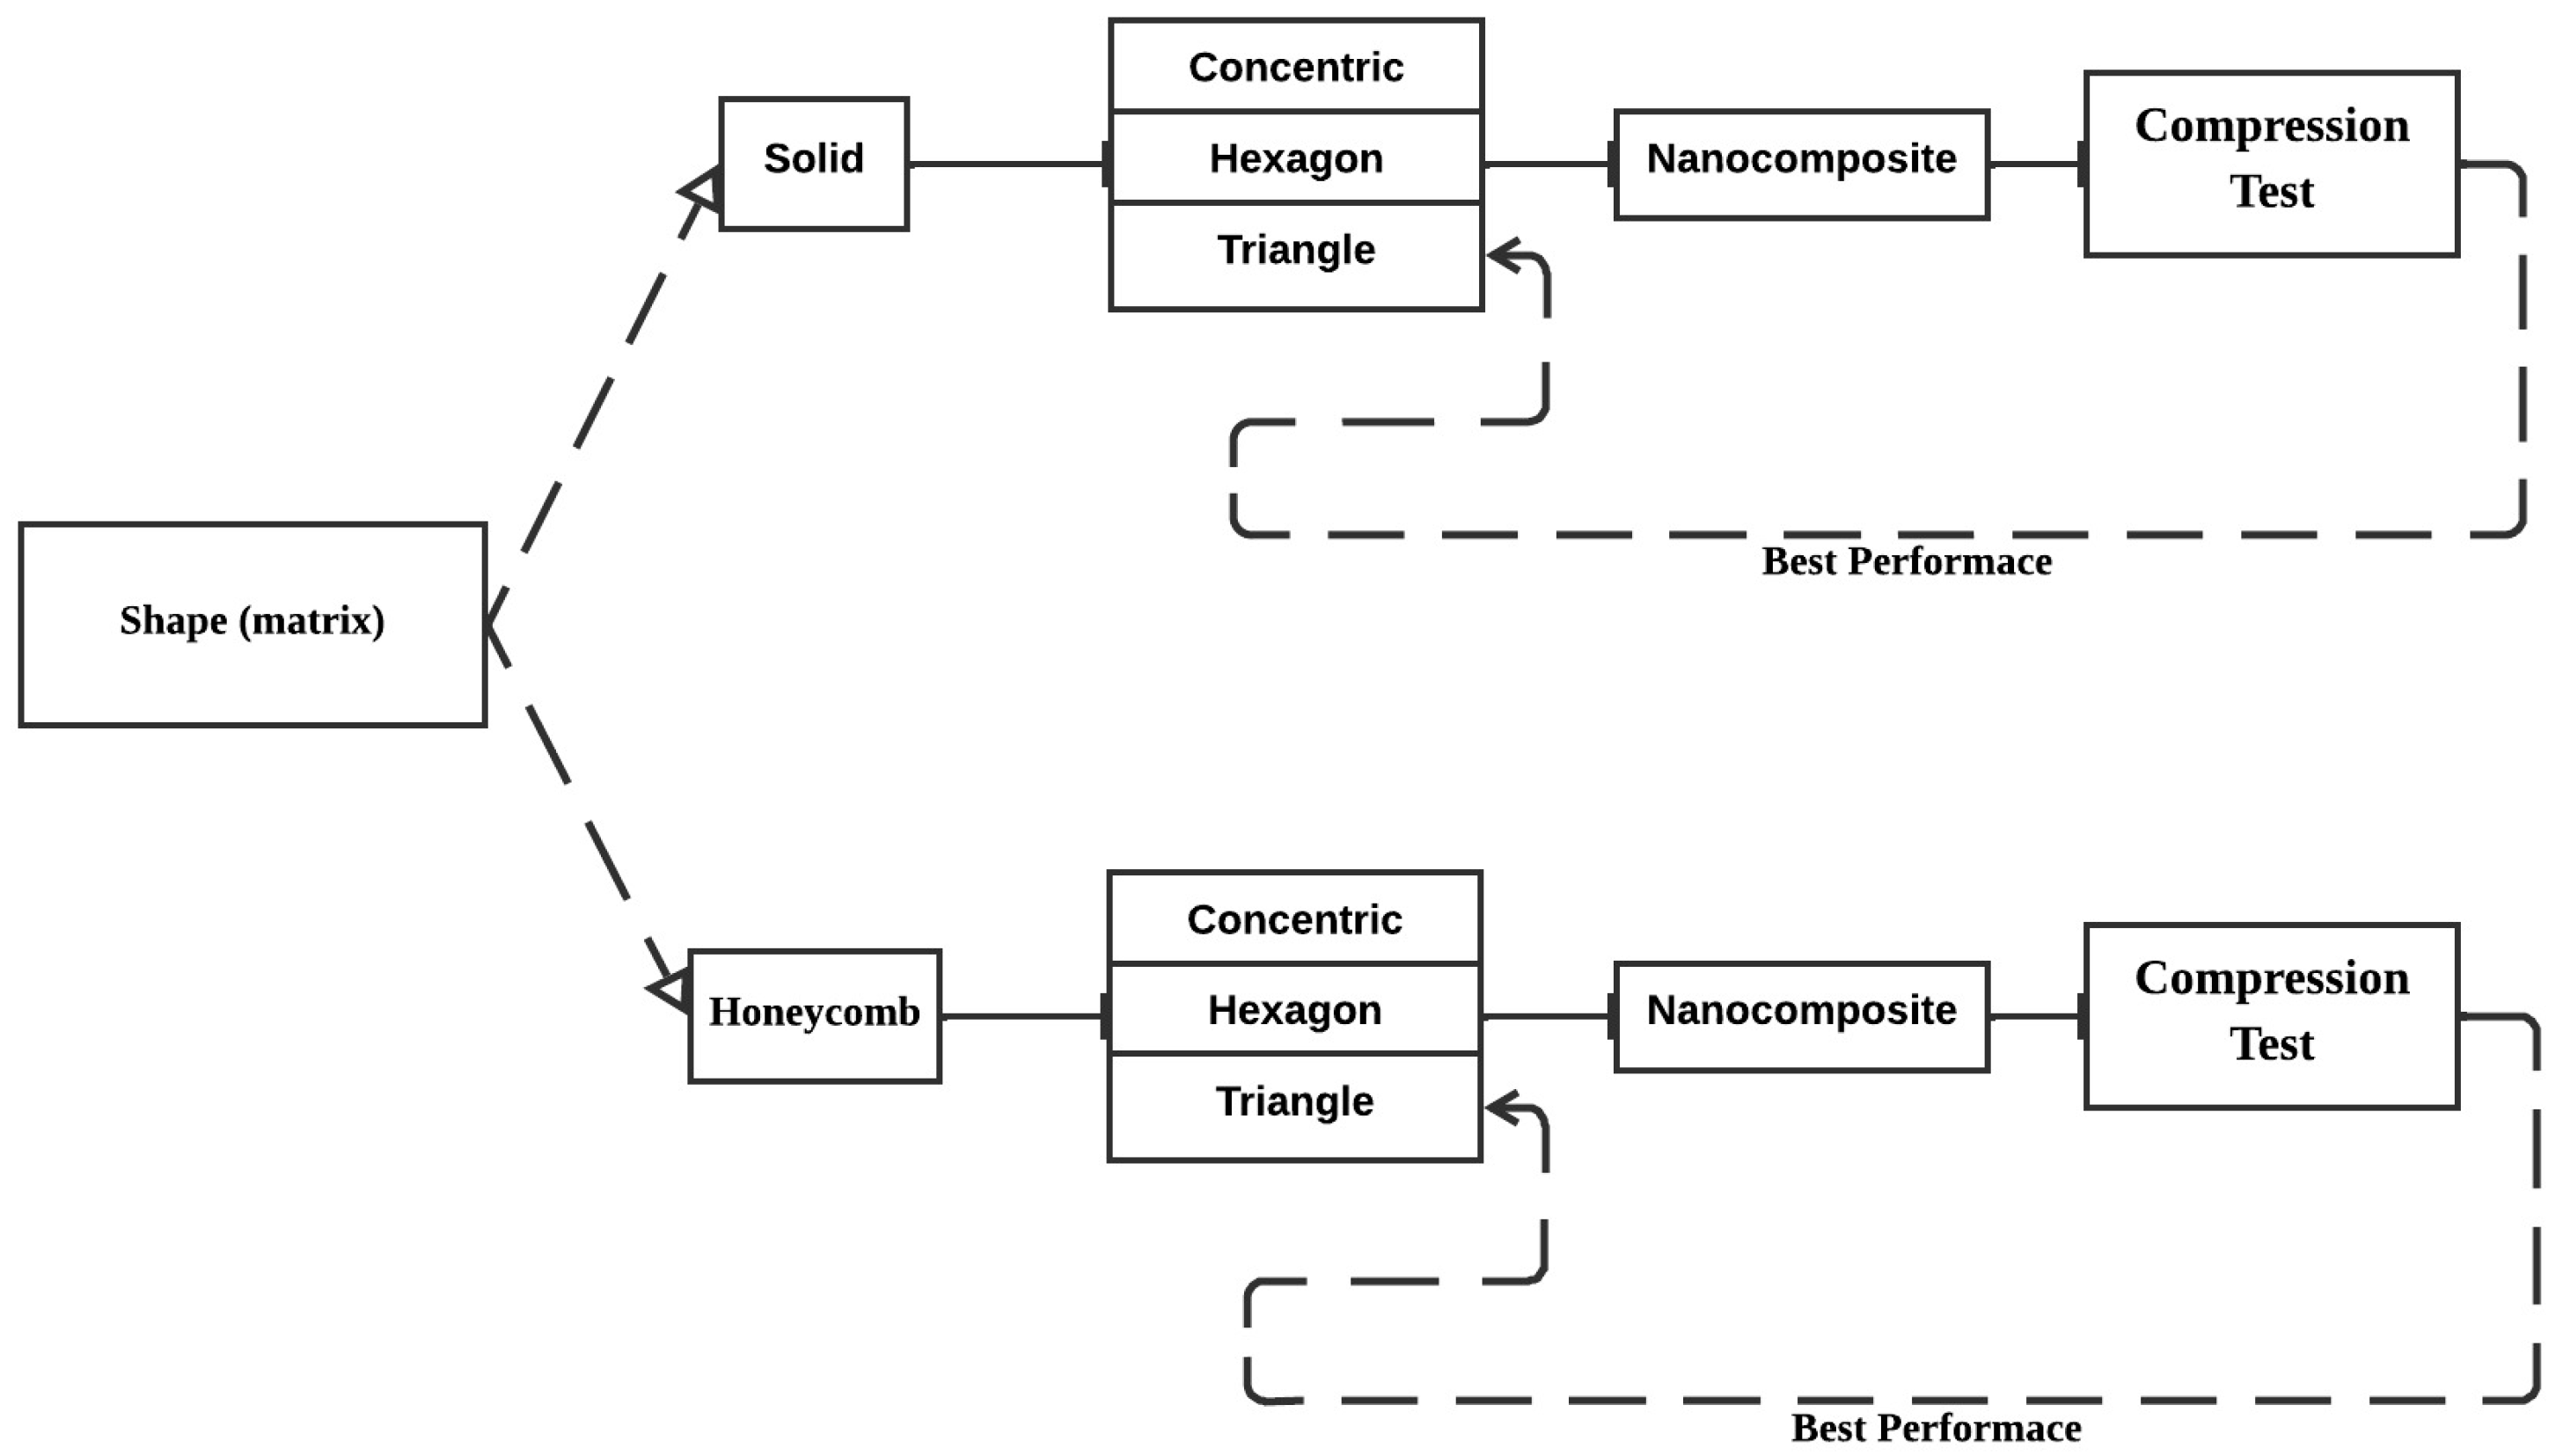
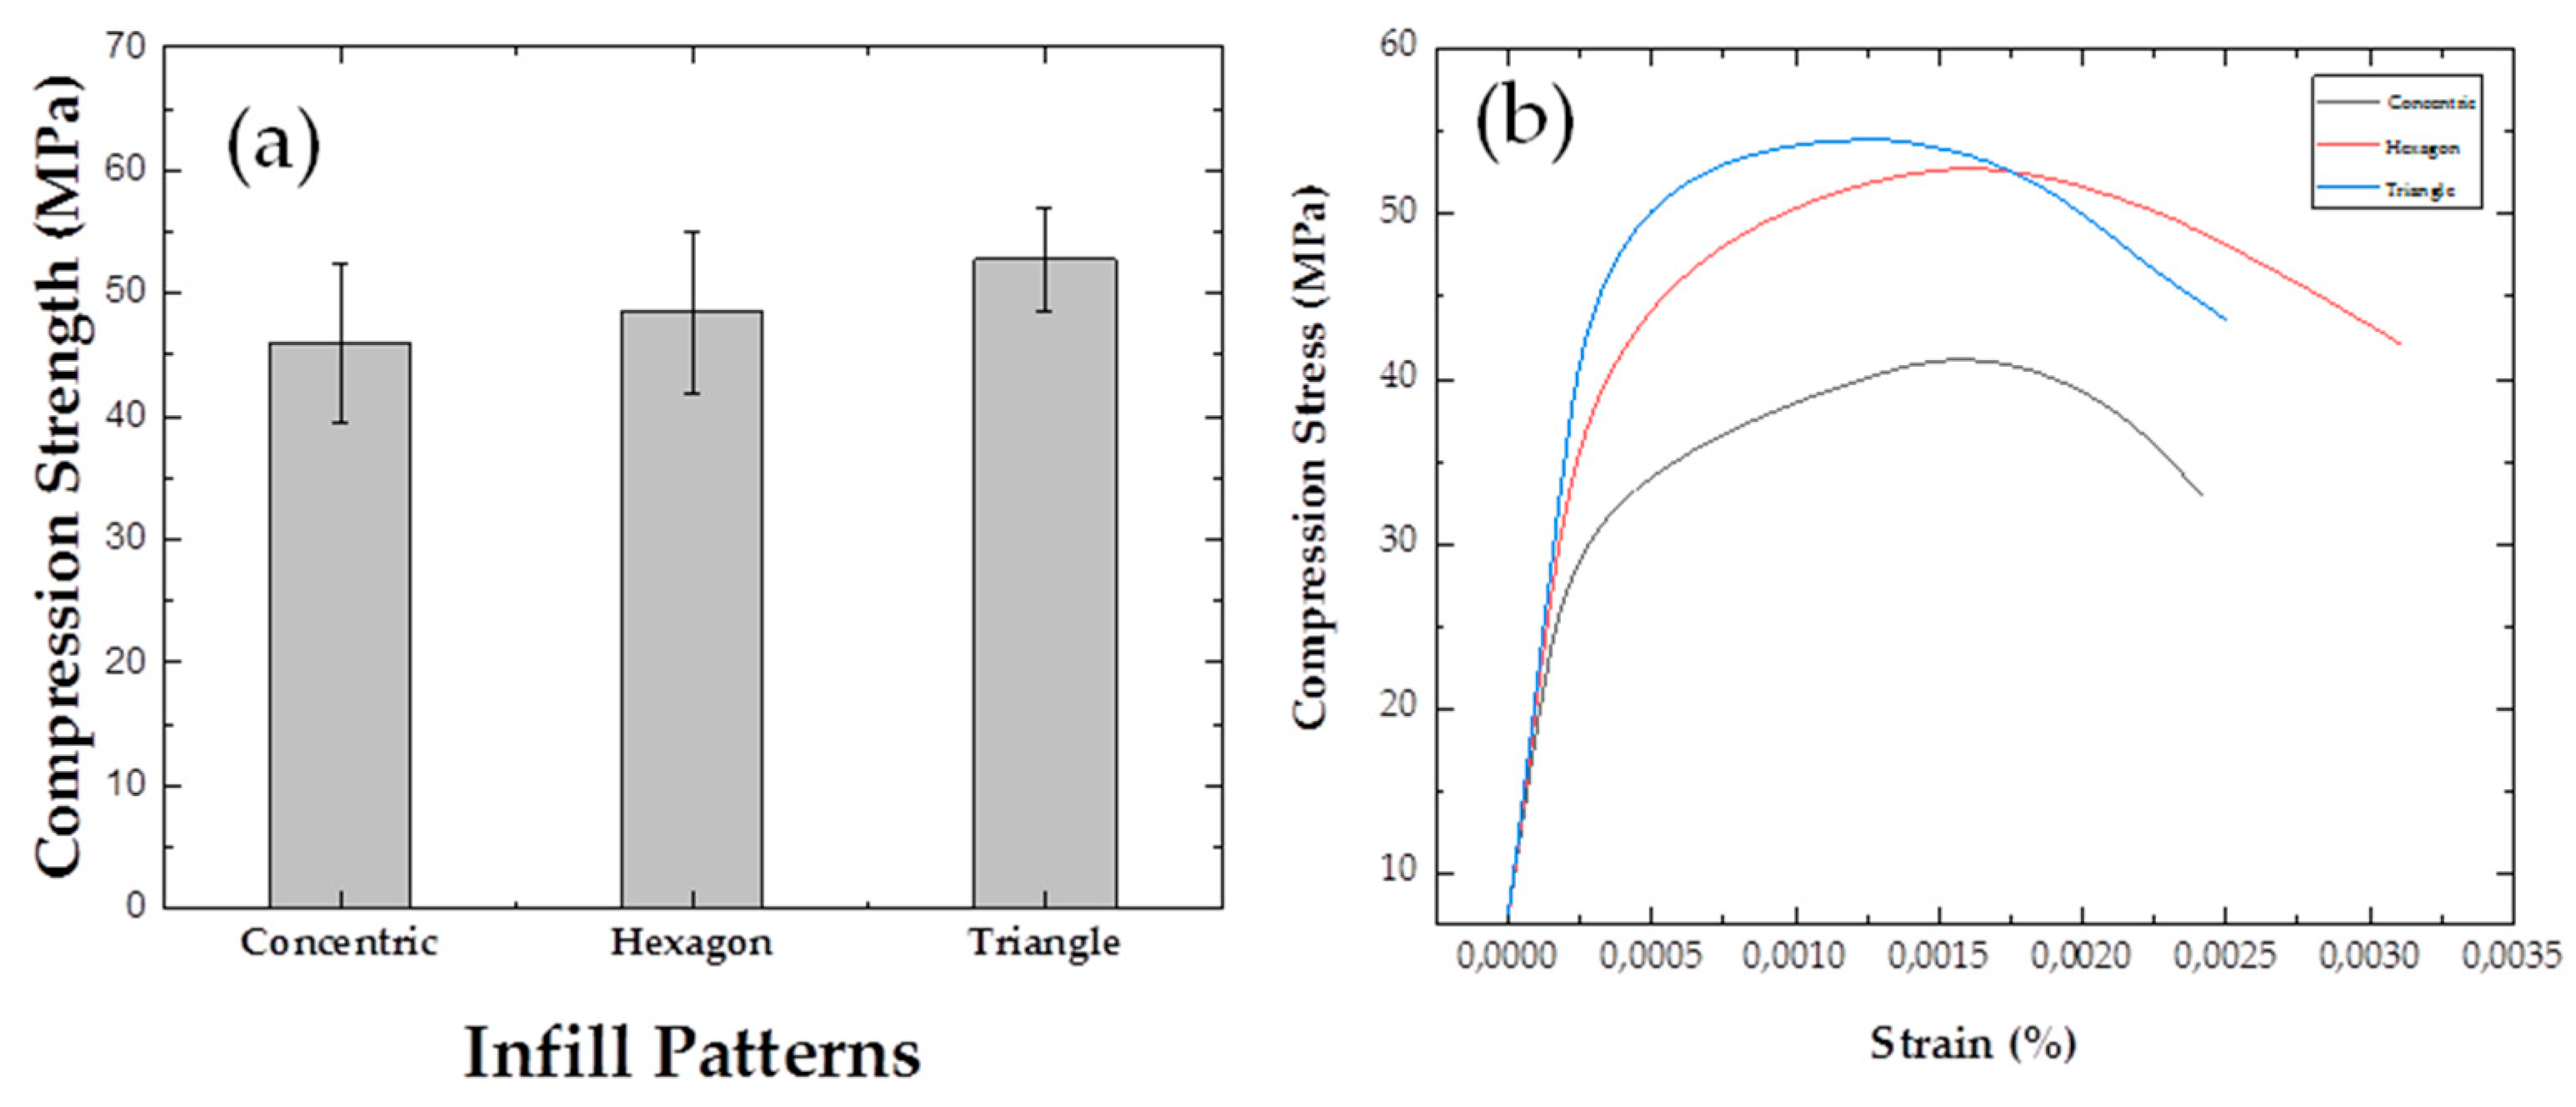
3.4. Compression Testing: Shape Solid Sample Variations of Infill Patterns
| Types of Samples/Infill Patterns | Filling Percentage | Compressive Strength (MPa) |
| PLA/Concentric | 90 % | 45.9 ± 6,5 |
| PLA/Hexagon | 90 % | 48.5 ± 6,6 |
| PLA/Triangle | 90 % | 52.8 ± 4,2 |
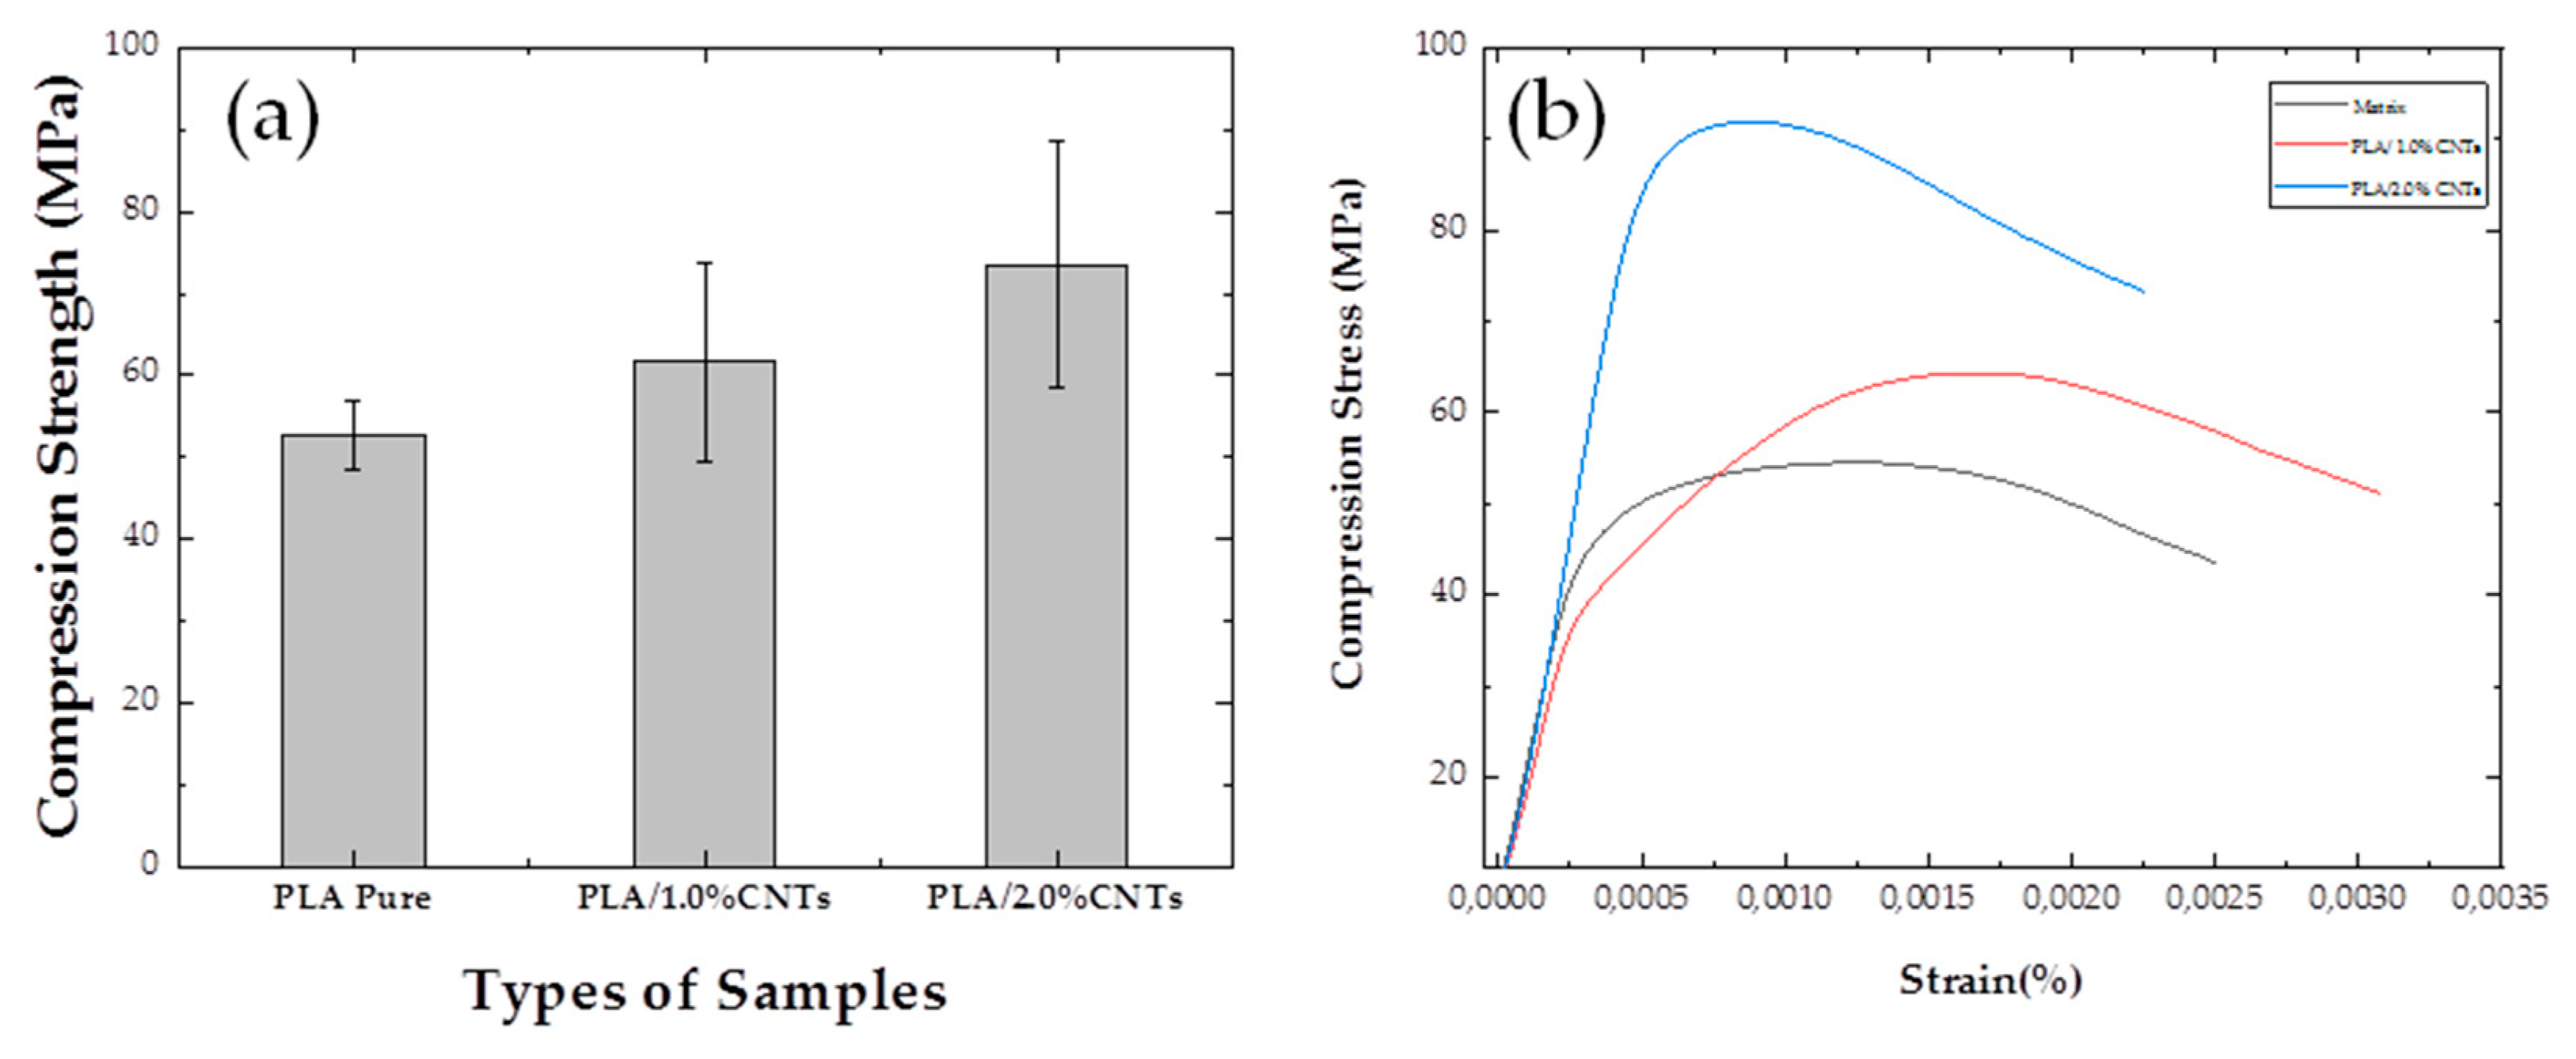
3.5. Compression Test: Nanocomposites PLA with 1.0 wt% and 2.0 wt% CNTs
| Types of Samples/Infill Patterns | Filling Percentage | Compressive Strength (MPa) |
| PLA/Triangles | 90 % | 52.8 ± 4,2 |
| PLA/1.0%CNTs/ Triangles | 90% | 61.7 ± 12,1 |
| PLA/2.0%CNTs/Triangles | 90% | 73.5 ± 15,0 |
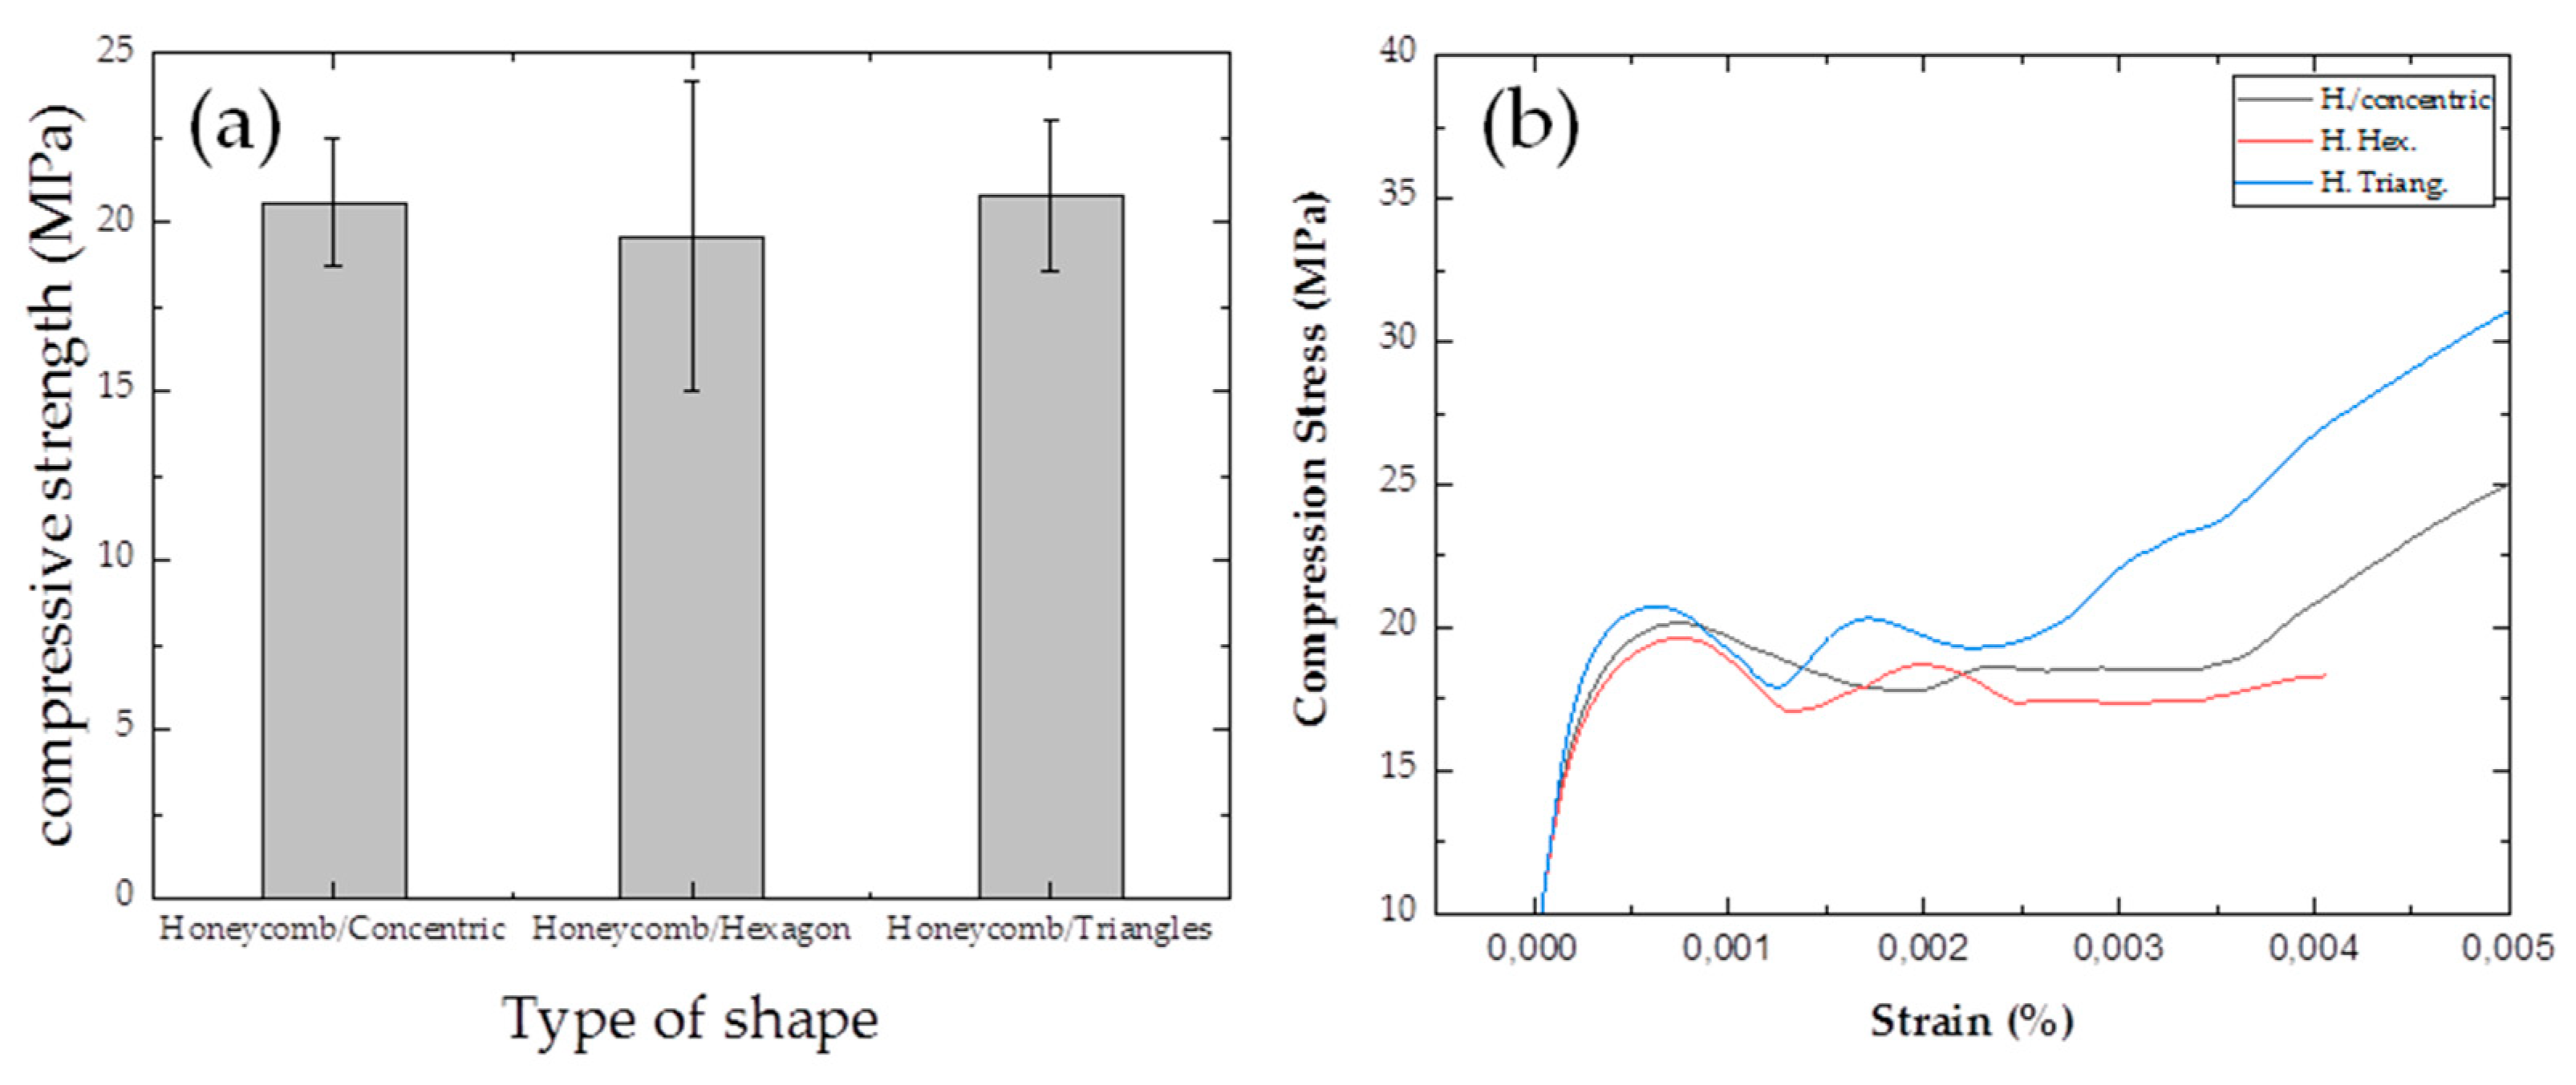
3.6. Compression Testing: Honeycomb Shape with Variations of Infill Patterns
| Type of Samples/Infill Patterns | Filling Percentage | Compressive Strength (MPa) |
| Honeycomb/Concentric | 90 % | 20.6 ± 1,9 |
| Honeycomb/Hexagon | 90 % | 19.6 ± 4,6 |
| Honeycomb/Triangles | 90 % | 20.8 ± 2,2 |
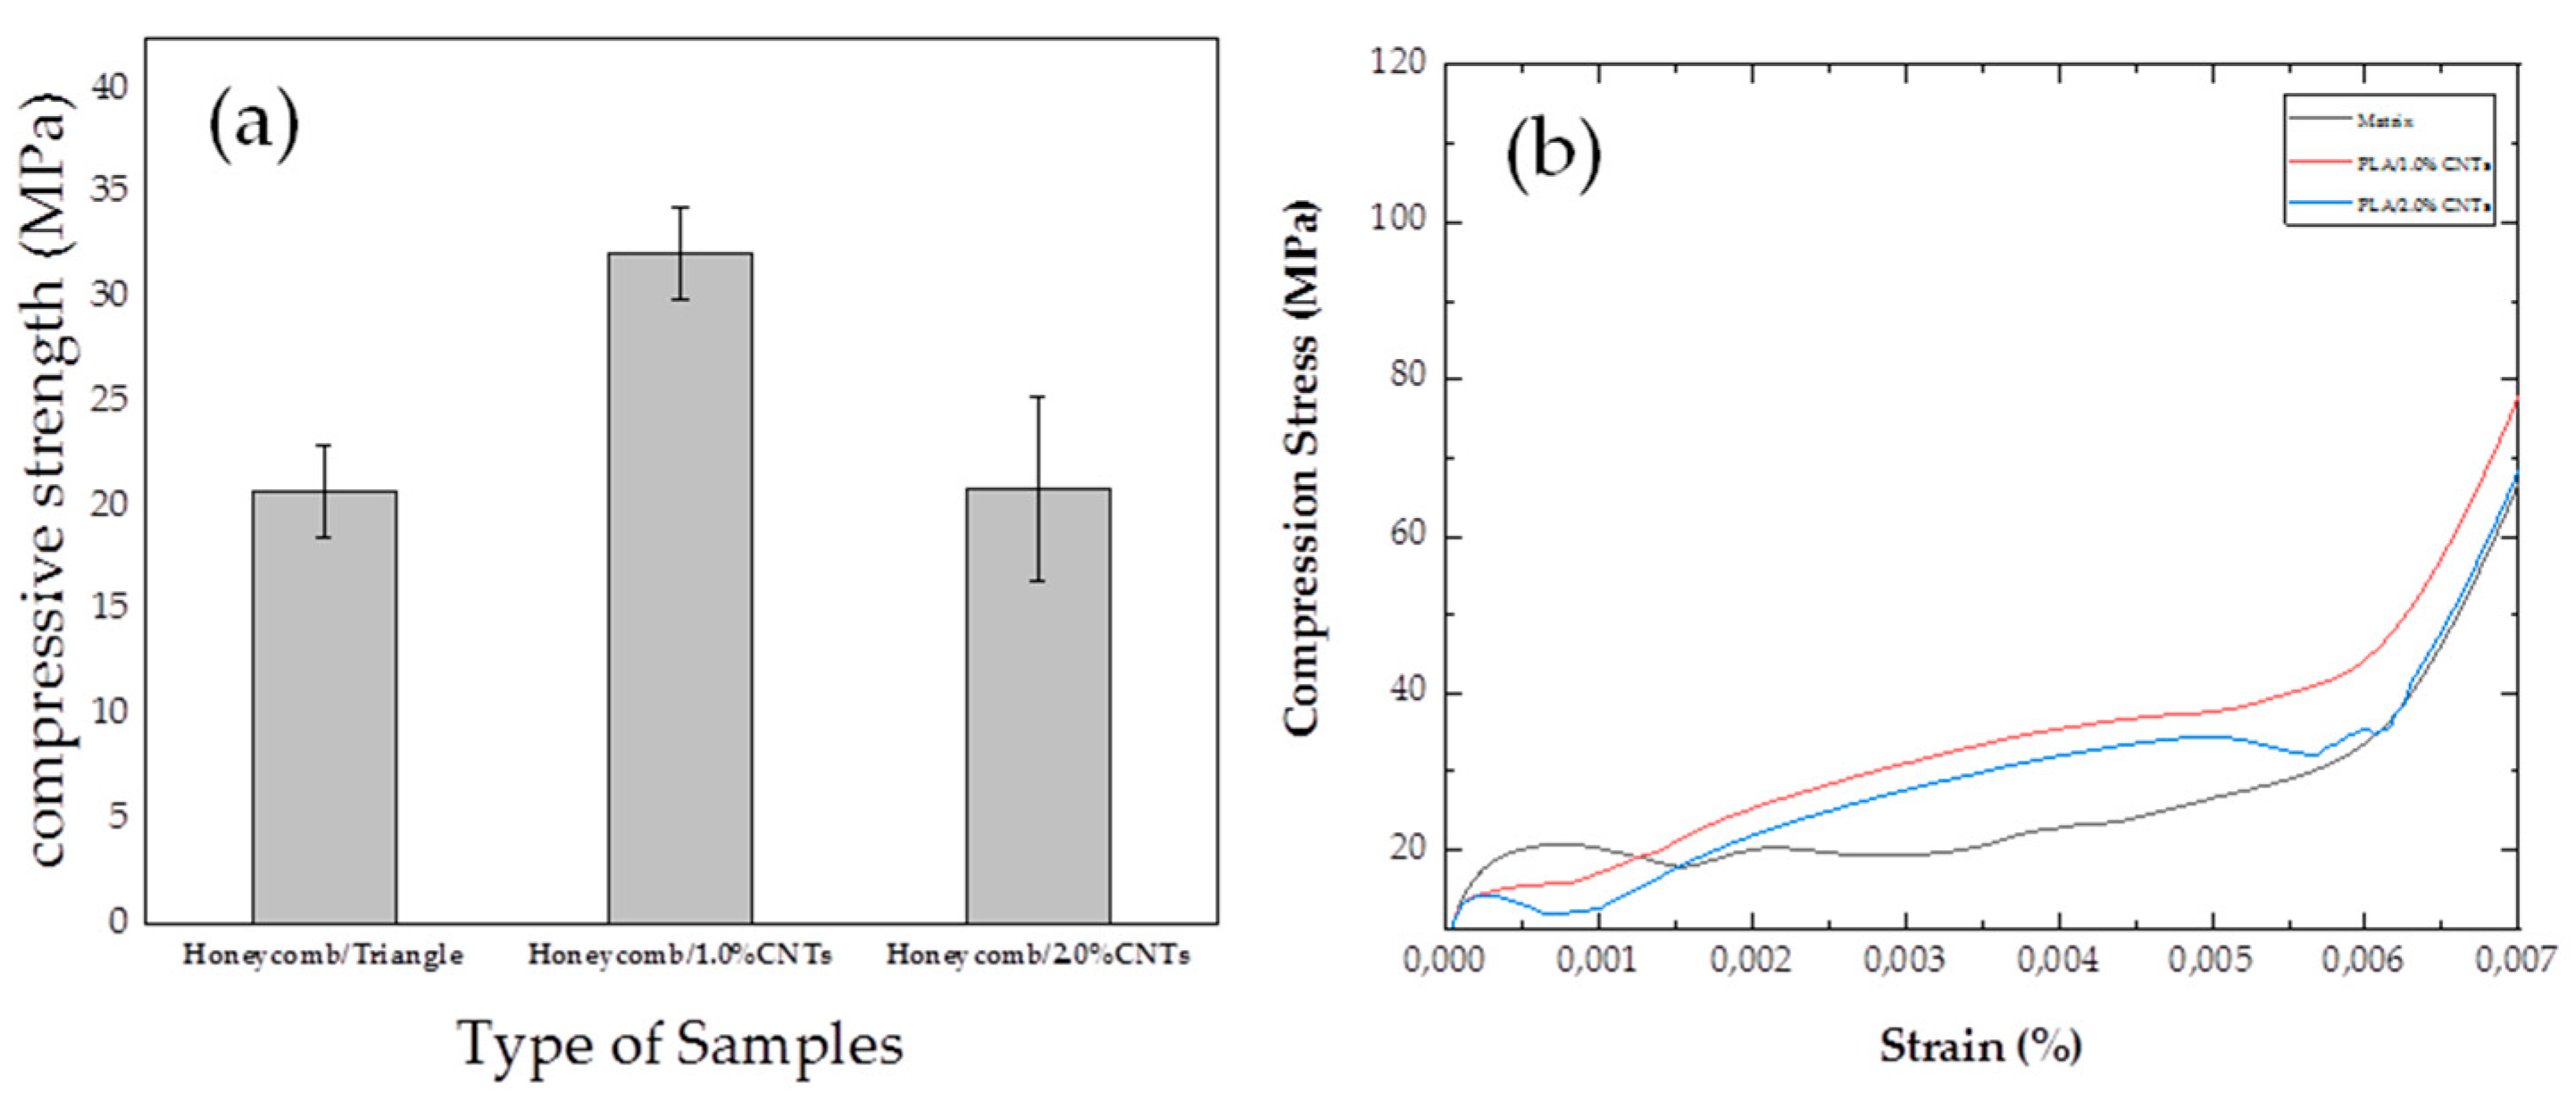
3.7. Compression Test: Honeycomb Samples with 1.0 wt% and 2.0 wt% Carbon Nanotubes
| Type of samples/Infill Patterns | Filling Percentage | Compressive Strength (MPa) |
| Honeycomb/Triangles | 90 % | 20.8 ± 2,2 |
| Honeycomb/1.0%CNTs | 90 % | 33.2 ± 2,2 |
| Honeycomb/2.0%CNTs | 90 % | 20.9 ± 4,4 |
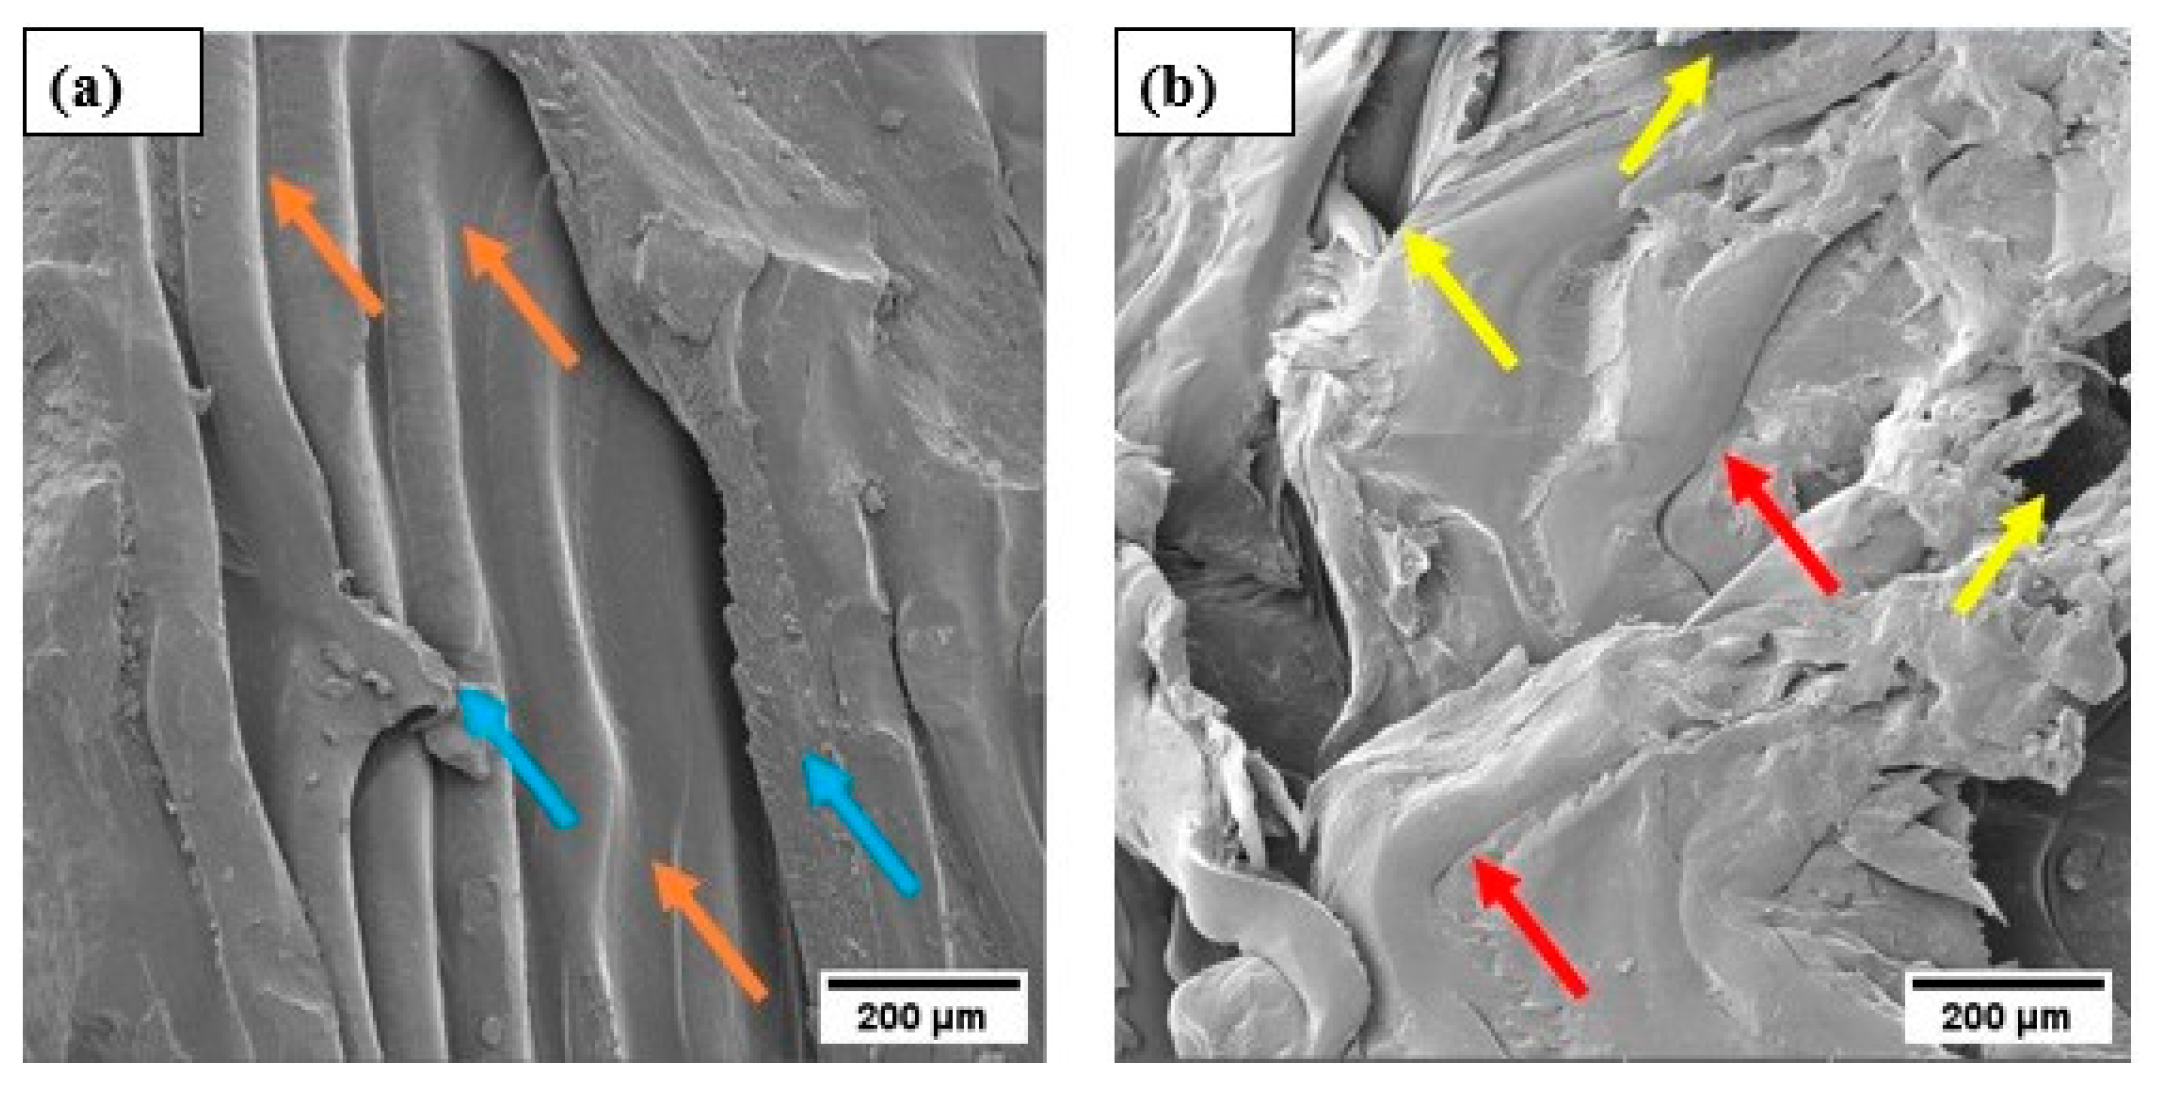
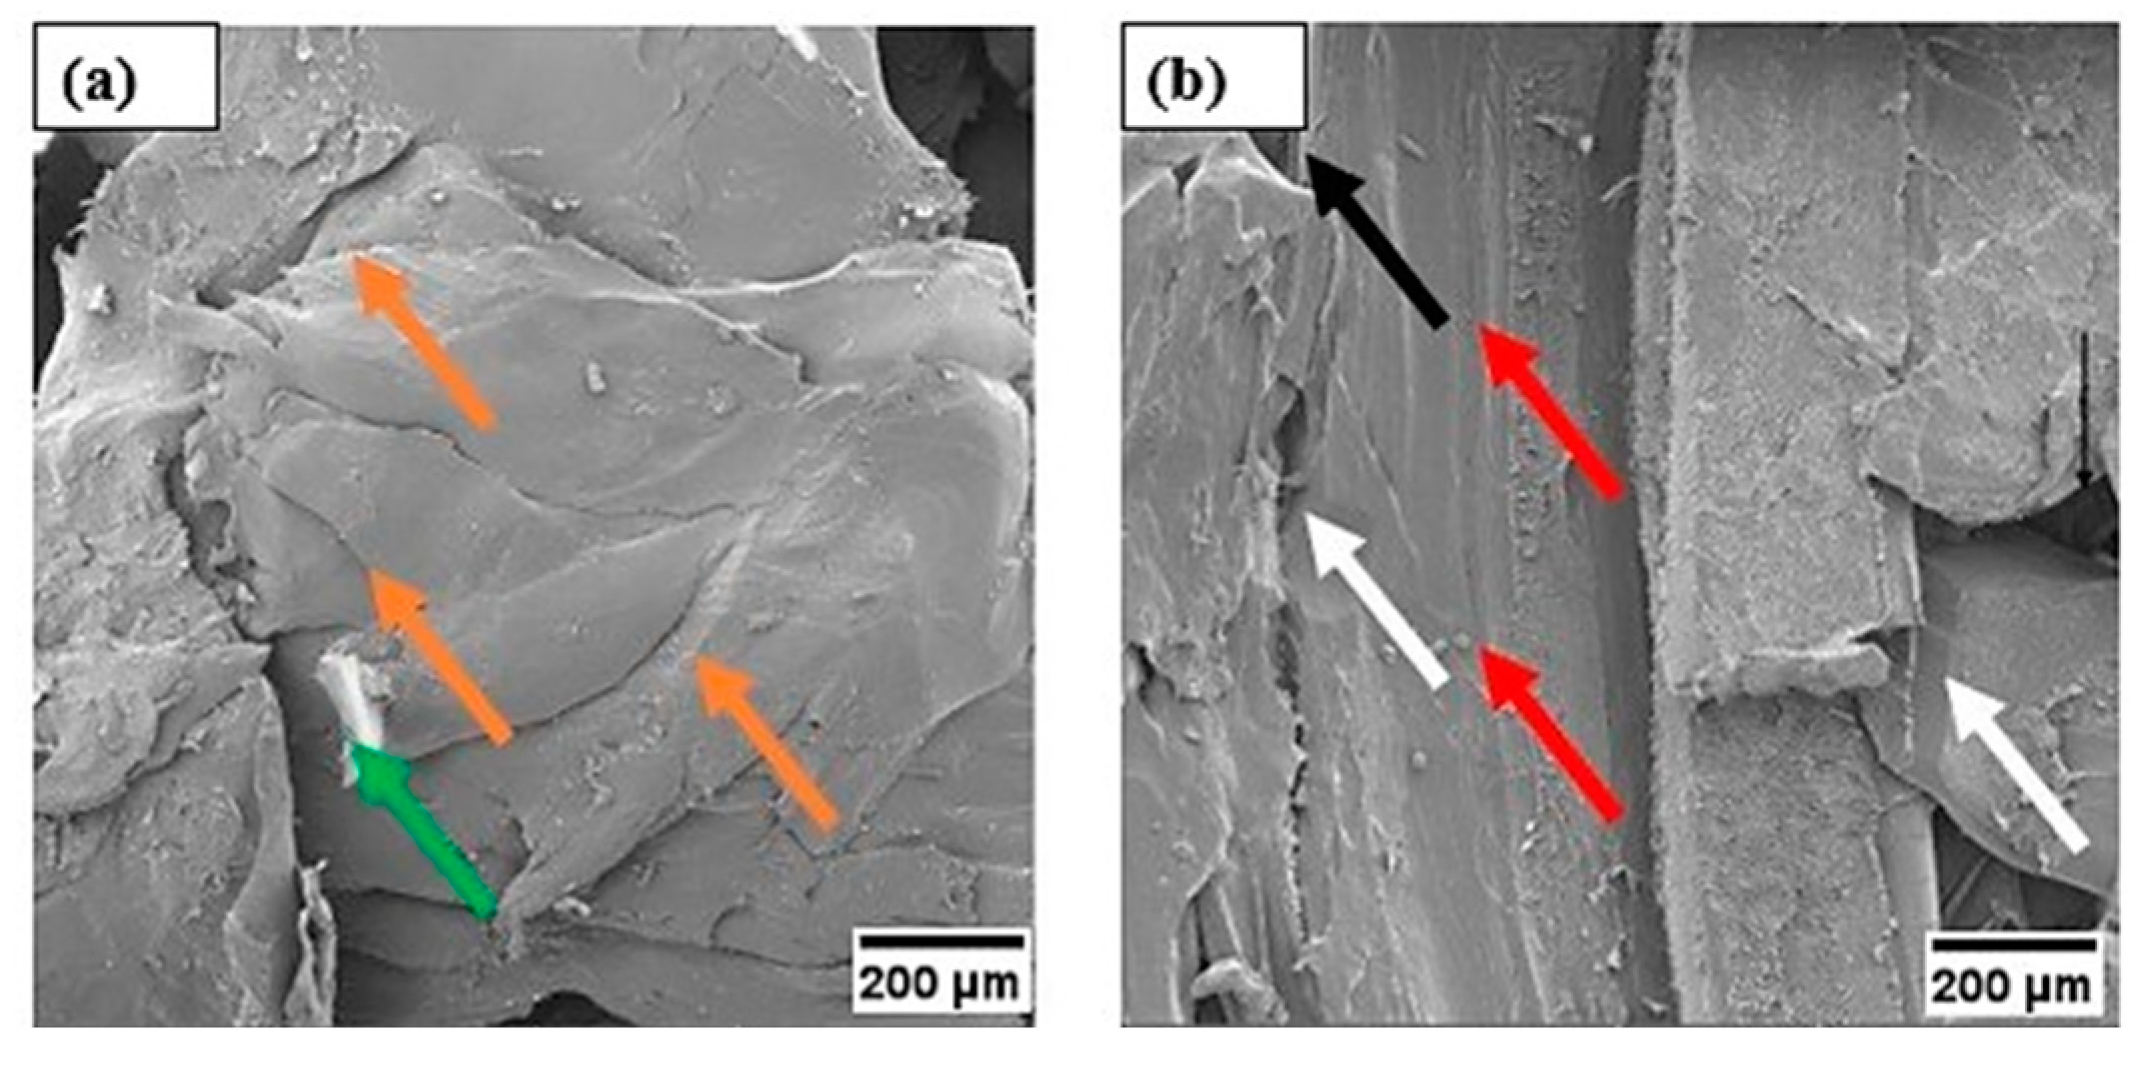
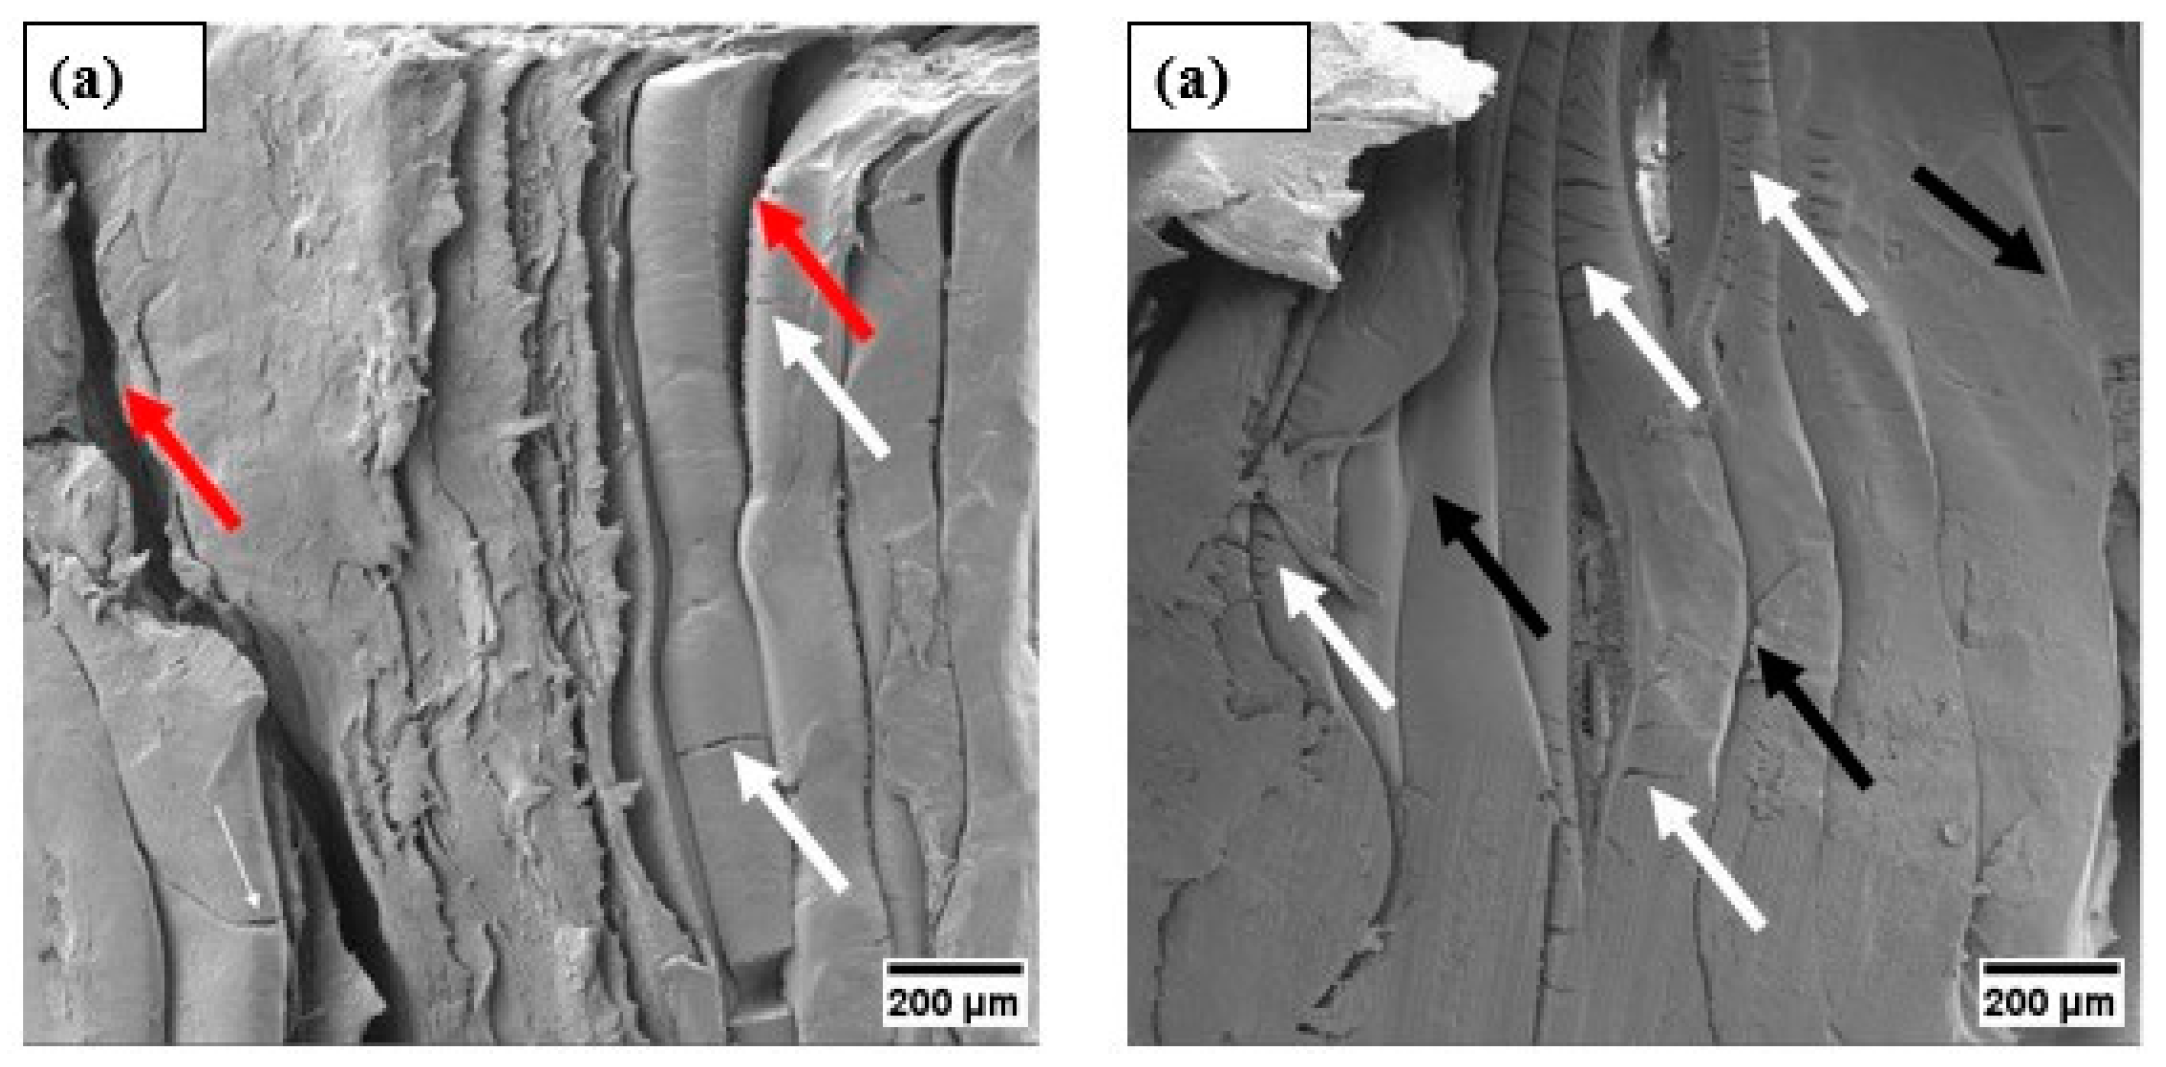
3.8. Morphological Analysis via SEM After the Compression Test

4. Conclusions
- a)
- The SEM characterization of PLA filaments before and after the incorporation of Carbon Nanotubes reveals the presence of clusters, pores, CNTs and cracks.
- b)
- X-ray Diffraction analysis of CNTs, PLA, and nanocomposites (PLA/1.0%CNTs and PLA/2.0%CNTs) provided insights into their crystallographic properties. CNTs exhibited characteristic diffractions, while PLA, both before and after 3D Printing, showed an absence of crystallinity, indicating a predominance of the amorphous phase. The nanocomposites PLA/1.0%CNTs and PLA/2.0%CNTs demonstrated minimal changes attributed to functionalization and the low dimensionality of MWCNTs clusters.
- c)
- In Raman analysis, the CNTs had their bands (D and G) deconvoluted into three sub-bands. The PLA exhibited its respective vibrational modes associated with stretching and bending of carbon atoms, symmetric and asymmetric deformation vibrations of CH3. The vibrational modes of the nanocomposites are an overlap of the vibrational modes of both CNTs and PLA.
- d)
- In the mechanical analysis of compression, the triangle pattern outperforms others with a 15.03% increase over concentric and 8.8% over hexagonal. In solid nanocomposites, PLA/1.0%CNTs exhibits a 16.8% increase, while PLA/2.0%CNTs shows a 39.2% increase compared to the matrix. For the honeycomb shape, the triangular pattern excels, showing a 0.97% increase over concentric and 6.12% over hexagonal. The nanostructured honeycomb PLA/1.0%CNTs surpasses the matrix by 59.6%, reaching and honeycomb PLA/2.0%CNTs has a 0.48% increase, reaching.
- e)
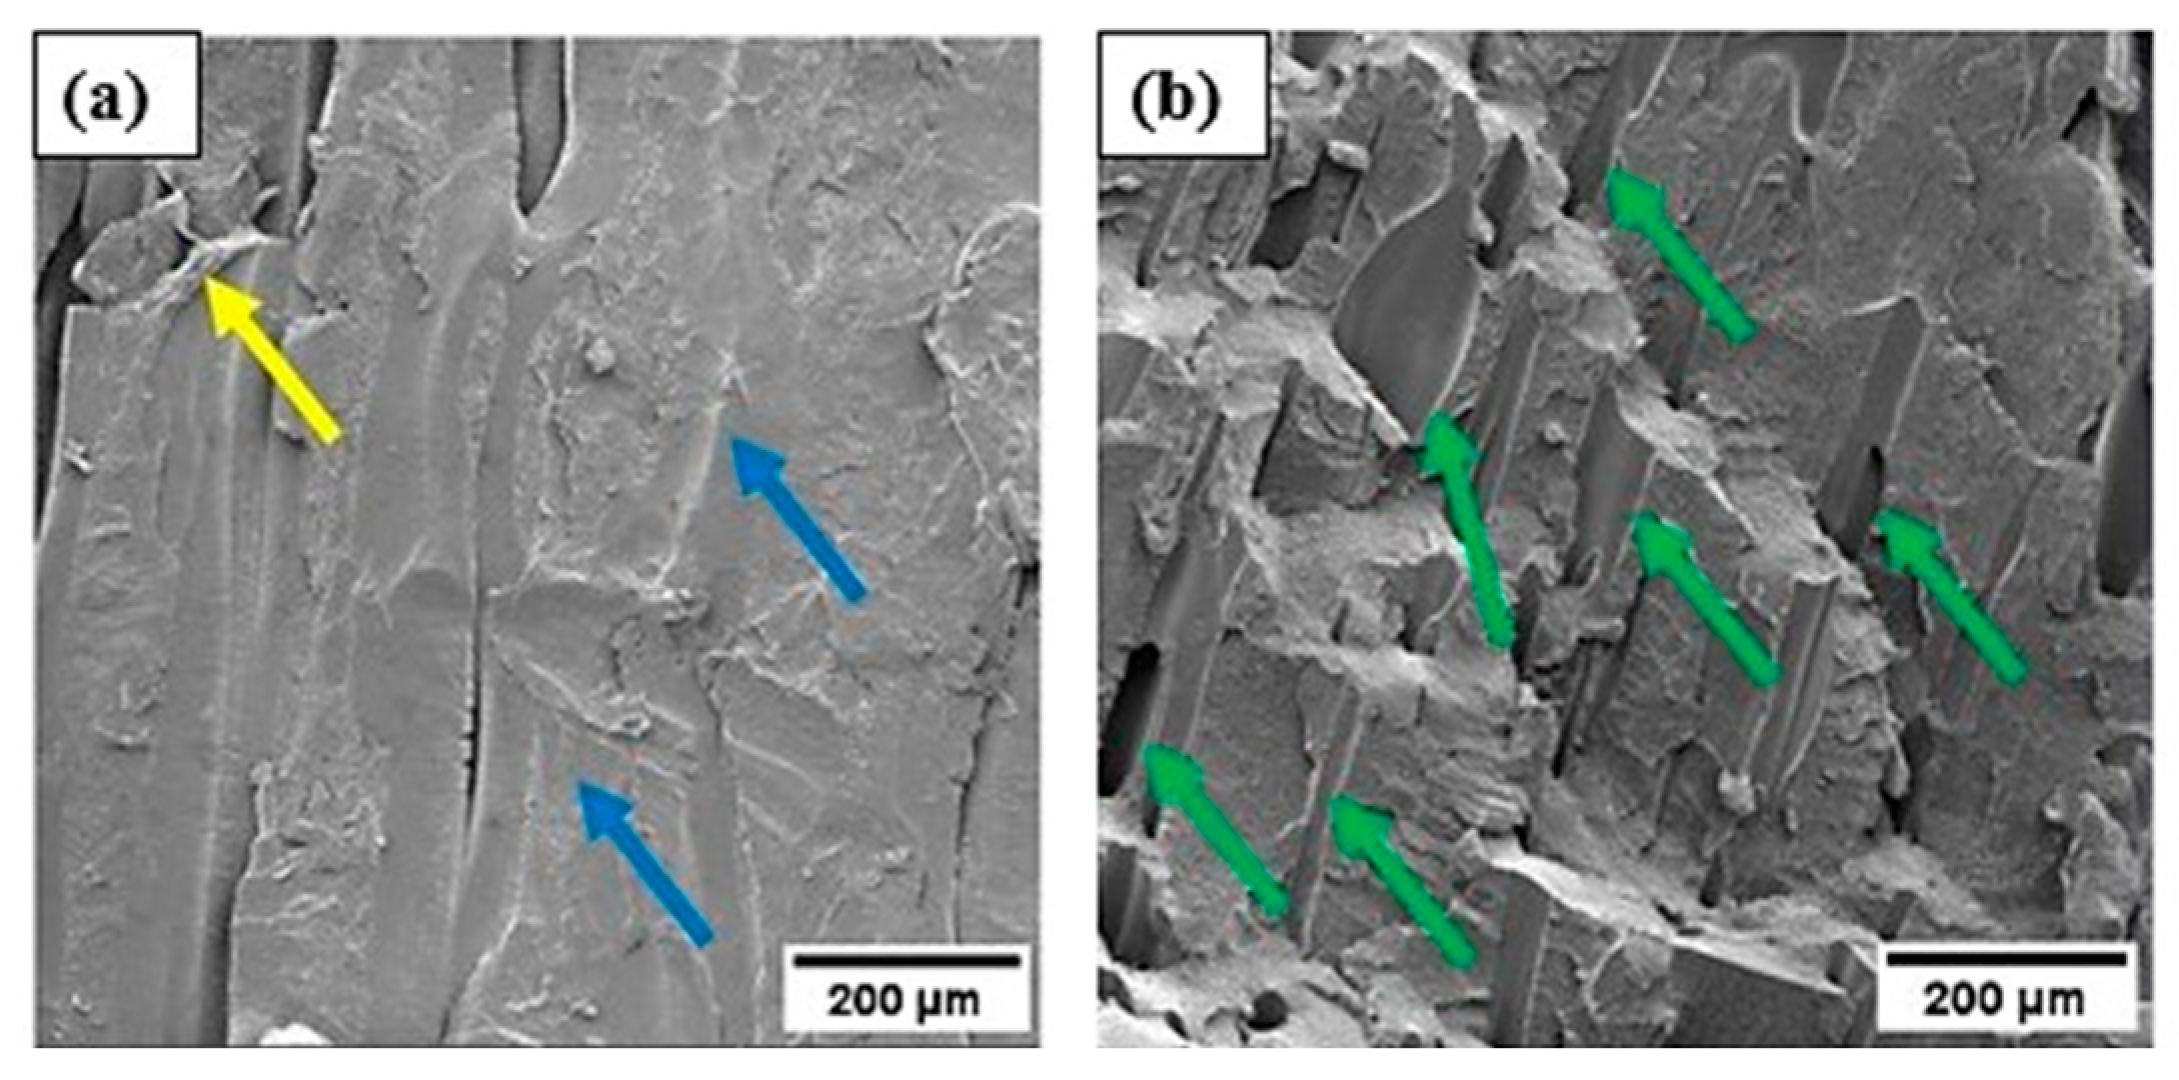
- A SEM analysis conducted after the mechanical compression test illustrates the mechanisms present in the material, such as detachment of structures, presence of compacted regions, internal voids, rupture, and cracks, which can be attributed to the application of stress.
- f)
- In this study, the direct influence of infill patterns and the percentages of CNTs on compressive mechanical properties is observed. Therefore, when employing the Fused Deposition Modeling (FDM) technique in the development of new materials, it becomes essential to investigate these parameters to achieve enhanced performances tailored to different applications.
Author Contributions
Funding
Institutional Review Board Statement
Data Availability Statement
Acknowledgments
Conflicts of Interest
References
- ASTM D695-15. Standard Test Method for Compressive Properties of Rigid Plastics. ASTM International, 2015.
- Awasthi, P.; Banerjee, S.S. Fused deposition modeling of thermoplastic elastomeric materials: Challenges and opportunities. Additive Manufacturing 2021, 46, 102177. [Google Scholar] [CrossRef]
- Liu, G.; et al. Additive manufacturing of structural materials. Mater. Sci. Eng. R 2021, 145, 100596. [Google Scholar] [CrossRef]
- Ádám, B.; Weltsch, Z. Thermal and Mechanical Assessment of PLA-SEBS and PLA-SEBS-CNT Biopolymer Blends for 3D Printing. Appl. Sci. 2021, 11, 6218. [Google Scholar] [CrossRef]
- Mwema, F.M.; et al. Basics of fused deposition modelling (FDM). Fused deposition modeling: strategies for quality enhancement, 2020, p. 1-15.
- Wickramasinghe, S.; Do, T.; Tran, P. FDM-based 3D printing of polymer and associated composite: A review on mechanical properties, defects and treatments. Polymers 2020, 12, 1529. [Google Scholar] [CrossRef]
- Syrlybayev, D.; et al. Optimisation of strength properties of FDM printed parts—A critical review. Polymers 2021, 13, 1587. [Google Scholar] [CrossRef] [PubMed]
- Siripongpreda, T.; et al. Emerging 3D printing based on polymers and nanomaterial additives: Enhancement of properties and potential applications. European Polymer Journal 2023, 184, 111806. [Google Scholar] [CrossRef]
- Lopez De ArmenTIA, S.; et al. Advances in biodegradable 3D printed scaffolds with carbon-based nanomaterials for bone regeneration. Materials 2020, 13, 5083. [Google Scholar] [CrossRef] [PubMed]
- Omanović, E.O.; et al. Nanocomposites: a brief review. Health and Technology 2020, 10, 51–59. [Google Scholar] [CrossRef]
- Shameem, M.M.; et al. A brief review on polymer nanocomposites and its applications. Mater. Today Proc 2021, 45, 2536–2539. [Google Scholar] [CrossRef]
- Boroumand, F.; Seyedkashi, S.M.H.; Pol, M.H. Experimental study of mechanical properties and failure mechanisms of metal–composite laminates reinforced with multi-walled carbon nanotubes. Thin-Walled Structures 2023, 183, 110377. [Google Scholar] [CrossRef]
- Smail, A.H.M.; et al. On the enhancement of the fatigue fracture performance of Polymer matrix composites by reinforcement with carbon nanotubes: a systematic review. Carbon Letters 2022, 32, 727–740. [Google Scholar] [CrossRef]
- Khodakarami, M.; Bagheri, M. Recent advances in synthesis and application of polymer nanocomposites for water and wastewater treatment. Journal of Cleaner Production 2021, 296, 126404. [Google Scholar] [CrossRef]
- Al Rashid, A.; et al. Additive manufacturing of polymer nanocomposites: Needs and challenges in materials, processes, and applications. J. Mater. Res. Technol. 2021, 14, 910–941. [Google Scholar] [CrossRef]
- Ibrahim, A.; et al. Graphene-Based Nanocomposites: Synthesis, Mechanical Properties, and Characterizations. Polymers 2021, 13, 2869. [Google Scholar] [CrossRef] [PubMed]
- Ates, M.; Eker, A.A.; Eker, B. Carbon nanotube-based nanocomposites and their applications. Journal of adhesion science and Technology 2017, 31, 1977–1997. [Google Scholar] [CrossRef]
- De Bortoli, L.S.; et al. Functionalized carbon nanotubes for 3D-printed PLA-nanocomposites: Effects on thermal and mechanical properties. Materials Today Communications 2022, 31, 103402. [Google Scholar] [CrossRef]
- Mohd Nurazzi, N.; et al. Fabrication, functionalization, and application of carbon nanotube-reinforced polymer composite: an overview. Polymers 2021, 13, 1047. [Google Scholar] [CrossRef] [PubMed]
- Yang, H.; et al. Preparation of hydrophobic surface on PLA and ABS by fused deposition modeling. Polymers 2020, 12, 1539. [Google Scholar] [CrossRef] [PubMed]
- Jem, K.J.; Tan, B. The development and challenges of poly (lactic acid) and poly (glycolic acid). Advanced Industrial and Engineering Polymer Research 2020, 3, 60–70. [Google Scholar] [CrossRef]
- Singh, J.; Goyal, K.K.; Kumar, R. Effect of filling percentage and raster style on tensile behavior of FDM produced PLA parts at different build orientation. Mater. Today Proc. 2022, 63, 433–439. [Google Scholar] [CrossRef]
- Soltani, A.; et al. 3D printing on-water sports boards with bio-inspired core designs. Polymers 2020, 12, 250. [Google Scholar] [CrossRef]
- Zhou, X.; et al. Additive manufacturing of CNTs/PLA composites and the correlation between microstructure and functional properties. J. Mater. Sci. Technol. 2021, 60, 27–34. [Google Scholar] [CrossRef]
- Kartikeyan, B.; et al. Experimental and theoretical analysis of FDM AM PLA mechanical properties. Mater. Today Proceedings 2023. [Google Scholar] [CrossRef]
- Pinto, V.C.; et al. Dispersion and failure analysis of PLA, PLA/GNP and PLA/CNT-COOH biodegradable nanocomposites by SEM and DIC inspection. Engineering Failure Analysis 2017, 71, 63–71. [Google Scholar] [CrossRef]
- Kotsilkova, R.; et al. Essential nanostructure parameters to govern reinforcement and functionality of poly (lactic) acid nanocomposites with graphene and carbon nanotubes for 3D printing application. Polymers 2020, 12, 1208. [Google Scholar] [CrossRef]
- Terzopoulou, Z.; et al. Interfacial interactions, crystallization and molecular mobility in nanocomposites of Poly (lactic acid) filled with new hybrid inclusions based on graphene oxide and silica nanoparticles. Polymer 2019, 166, 1–12. [Google Scholar] [CrossRef]
- Cao, M.; et al. Investigation of Carbon Fiber on the Tensile Property of FDM-Produced PLA Specimen. Polymers 2022, 14, 5230. [Google Scholar] [CrossRef]
- Dos Reis, M.A.L.; et al. Raman spectroscopy fingerprint of stainless steel-MWCNTs nanocomposite processed by ball-milling. AIP Advances 2018, 8. [Google Scholar] [CrossRef]
- Cuiffo, M.A.; et al. Impact of the fused deposition (FDM) printing process on polylactic acid (PLA) chemistry and structure. Applied Sciences 2017, 7, 579. [Google Scholar] [CrossRef]
- Suzuki, T.; et al. Application and analysis of a DSC-Raman spectroscopy for indium and poly (lactic acid). Journal of thermal analysis and calorimetry 2013, 113, 1543–1549. [Google Scholar] [CrossRef]
- Kister, G.; Cassanas, G.; Vert, M. Effects of morphology, conformation and configuration on the IR and Raman spectra of various poly (lactic acid) s. Polymer 1998, 39, 267–273. [Google Scholar] [CrossRef]
- Batakliev, T.; et al. Physico-chemical characterization of PLA-based composites holding carbon nanofillers. Applied Composite Materials 2021, 28, 1175–1192. [Google Scholar] [CrossRef]
- Saito, R.; et al. Raman spectroscopy of graphene and carbon nanotubes. Advances in Physics 2011, 60, 413–550. [Google Scholar] [CrossRef]
- Rebelo, S.L.H.; et al. Progress in the Raman spectra analysis of covalently functionalized multiwalled carbon nanotubes: unraveling disorder in graphitic materials. Physical Chemistry Chemical Physics 2016, 18, 12784–12796. [Google Scholar] [CrossRef] [PubMed]
- Parab, S.; Zaveri, N. Investigating the influence of infill pattern on the compressive strength of fused deposition modelled PLA parts. In: Proceedings of International Conference on Intelligent Manufacturing and Automation: ICIMA. Springer Singapore, 2020, p. 239-247.
- Subeshan, B.; et al. Investigating compression strengths of 3D printed polymeric infill specimens of various geometries. In: Nano-, Bio-, Info-Tech Sensors, and 3D Systems II. SPIE, 2018. p. 89-94.
- Vidakis, N.; et al. A comprehensive investigation of the mechanical behavior and the dielectrics of pure polylactic acid (PLA) and PLA with graphene (GnP) in fused deposition modeling (FDM). International Journal of Plastics Technology 2019, 23, 195–206. [Google Scholar] [CrossRef]
- Austermann, J.; et al. Fiber-reinforced composite sandwich structures by co-curing with additive manufactured epoxy lattices. J. compos. sci. 2019, 3, 53. [Google Scholar] [CrossRef]
- Saleh, M.; et al. Compression performance and failure analysis of 3D-printed carbon fiber/PLA composite TPMS lattice structures. Polymers 2022, 14, 4595. [Google Scholar] [CrossRef]
- Joseph, A.; Mahesh, V.; Mahesh, V. Effect of loading rates on the in-plane compressive properties of additively manufactured ABS and PLA-based hexagonal honeycomb structures. J. Thermoplast. Compos. Mater. 2023, 36, 1113–1134. [Google Scholar] [CrossRef]
Disclaimer/Publisher’s Note: The statements, opinions and data contained in all publications are solely those of the individual author(s) and contributor(s) and not of MDPI and/or the editor(s). MDPI and/or the editor(s) disclaim responsibility for any injury to people or property resulting from any ideas, methods, instructions or products referred to in the content. |
© 2024 by the authors. Licensee MDPI, Basel, Switzerland. This article is an open access article distributed under the terms and conditions of the Creative Commons Attribution (CC BY) license (https://creativecommons.org/licenses/by/4.0/).


