Preprint
Communication

Particle size Measurement and Detection of Bound Proteins of non-Porous/Mesoporous Silica Microspheres by Single-Particle Inductively Coupled Plasma Mass Spectrometry

Altmetrics

Downloads

100

Views

32

Comments

0

A peer-reviewed article of this preprint also exists.

Submitted:

06 February 2024

Posted:

06 February 2024

You are already at the latest version

Alerts
Abstract
Single-particle inductively coupled plasma mass spectrometry (spICP-MS) has been used for particle size measurement of diverse types of individual nanoparticles and micrometer-sized carbon-based particles, such as microplastics. However, its applicability to the measurement of micrometer-sized non-carbon-based particles such as silica (SiO2) is unclear. In this study, the applicability of spICP-MS to particle size measurement of non-porous/mesoporous SiO2 micro-spheres with a nominal diameter of 5.0 µm or smaller was investigated. Particle sizes of these microspheres were measured using both spICP-MS based on a conventional calibration approach using an ion standard solution and scanning electron microscopy (SEM) as a reference technique and the results were compared. The particle size distributions obtained using both techniques were in agreement within analytical uncertainty. The applicability of this technique to the detection of metal-containing protein-binding mesoporous SiO2 microspheres was also investigated. Bound iron (Fe)-containing proteins (i.e., lactoferrin and transferrin) of mesoporous SiO2 microspheres were detected using Fe as a presence marker for the proteins. Thus, spICP-MS is applicable to the particle size measurement of large-sized and non-porous/mesoporous SiO2 microspheres; it has considerable potential for element-based detection and qualification of bound proteins of mes-oporous SiO2 microspheres in a variety of applications.
Keywords: 
Subject: Chemistry and Materials Science  -   Analytical Chemistry

1. Introduction

Inorganic supports, such as silica (SiO2) microspheres, have become increasingly important for a variety of applications, including the isolation of nucleic acids [1], cell separation [2], and immuno- [3] and DNA-based assays [4]. They offer the combined benefits of a broad platform and unique properties of a SiO2 substrate: flexible silanization chemistry, unique refractive index and density, low autofluorescence, low nonspecific binding of many biomolecules, hydrophilicity, and ease of handling. Furthermore, mesoporous SiO2 with a pore size of 2–50 nm can encapsulate compounds, such as anticancer agents, or biomolecules, such as antigen proteins, within its regularly structured pores and release them in vivo. Because of these properties, various studies have been conducted on the feasibility of their use as drug delivery vehicles [5,6,7] and vaccine carriers [8,9,10]. For medical applications involving biological administration, it is important to evaluate SiO2 microsphere aggregation and closely assess the uniform binding of compounds and biomolecules to individual microspheres. This process ensures a homogeneous and contamination-free particle population and increases the feasibility of stringent lot-by-lot quality control measures. However, despite the multifaceted potential of SiO2 microspheres, current evaluation methods are often limited to bulk approaches such as dynamic light scattering (DLS) and X-ray diffraction (XRD) for particle characterization.
A promising technique for addressing this limitation is single-particle inductively coupled plasma mass spectrometry (spICP-MS), which is widely employed to size and count various individual nanoparticles (NPs) [11,12,13,14]. This encompasses non-porous/mesoporous SiO2 nanospheres [15] and nanometer/micrometer-sized carbon-based particles, such as nanoplastics and microplastics [14,16,17,18,19,20]. The approach is based on the one-by-one introduction of particles into the ICP ion source, in which the particles are destroyed, and their contents are vaporized, atomized, and ionized. Every individual particle that reaches the ICP yields a burst of ions that can be detected by MS. This provides an advantageous set of features: (i) it only requires an exceedingly small amount of particulate sample (micrograms or even less) in the form of a dilute dispersion (e.g., in a few milliliters at a concentration of 105 particles/mL); and (ii) the measurement and calculation are quick (takes only a few minutes) and simple. The basis and applications of spICP-MS have been described in many studies, indicating that this technique is suitable for particle characterization [11,12,13,14,16]. However, its applicability to the measurement of micrometer-sized non-carbon-based particles, such as SiO2 particles, is unclear.
In this study, we investigated the applicability of spICP-MS to the particle size measurement of non-porous/mesoporous SiO2 microspheres by comparing the measurement results obtained using this technique with those obtained by scanning electron microscopy (SEM), which was used as a reference technique. Moreover, we investigated the applicability of this technique to the detection of metal-containing protein-binding mesoporous SiO2 microspheres, as one of its potential applications.

2. Materials and Methods

2.1. Materials

Non-porous/mesoporous SiO2 microspheres were used as the samples in this study. An aqueous (deionized water) suspension of uniform, non-porous (plain) SiO2 microspheres with a nominal diameter of 5.0 µm and a coefficient of variation (CV) of less than 15 % (measured by Coulter principle) was purchased from Bangs Laboratories (IN, USA) (product code SS05003-1.0). The surface groups and densities of the non-porous SiO2 microspheres were Si-OH (non-functionalized) and 2.0 g/cm3, respectively. The non-porous SiO2 microsphere suspension was stored at 2–8 ℃ until use. Mesoporous SiO2 microspheres (SBA24 with a pore diameter of 23.5–23.6 nm) were synthesized based on previously reported methods [21,22]. Dried powder of the mesoporous SiO2 microspheres (SBA24) was stored at room temperature (20–25 ℃) in a sealed desiccator until use. Dried powder of lactoferrin (LF) (product code 123-04124) and transferrin (TF) (product code 208-18971) were purchased from FUJIFILM Wako Pure Chemical Corporation (Osaka, Japan). The 10x phosphate-buffered saline (PBS) buffer (pH 7.4) (product code 314-90185) and 10x Tris-buffered saline (TBS) buffer (pH 7.4) (product code 317-90175) from Nippon Gene Corporation (Toyama, Japan) were diluted 10-fold with ultrapure water to prepare PBS and TBS, respectively. These solutions were then used to suspend the SiO2 microspheres.

2.2. Sample Preparation

Five microliters of an aqueous suspension containing approximately 1 mg of non-porous SiO2 microspheres were placed in a tube. An aqueous buffer (995 µL), PBS or TBS, was added to the tube and rigorously vortexed. The non-porous SiO2 microsphere suspension was diluted 20 times with buffer to a concentration of approximately 5 × 10⁴ particles/mL and used for subsequent experiments.
Approximately 1 mg of dry mesoporous SiO2 microspheres (SBA24) were weighed in a tube. One milliliter of an aqueous buffer, such as PBS or TBS, was added to the tube and rigorously vortexed twice for 3 s. For SiO2 equilibration, the resultant suspension was gently rotated at room temperature (20–25 ℃) for 5 min. The mesoporous SiO2 microsphere suspension was diluted 400 times with buffer to a concentration of approximately 4 × 10⁶ particles/mL and used for subsequent experiments.
LF and TF were used as representative iron (Fe)-containing proteins to bind to mesoporous SiO2 microspheres (SBA24). Bottles of LF and TF stored in a refrigerator were left to stand for 15 to 30 min to return them to 20–25 ℃. Approximately 1 mg of LF or TF was placed in each tube. One milliliter of TBS was added to the tube, gently vortexed for 3 s, and slowly rotated for 30 min at 20–25 ℃ for complete dissolution. Thereafter, the resultant solution was centrifuged at 19 000×g for 5 min at 20 ℃. The supernatant (i.e., the dissolved protein fraction) was transferred to a new tube and used as a protein solution to prepare the protein-binding non-porous/mesoporous SiO2 microspheres.

2.3. Particle Size Measurement by spICP-MS

A quadrupole ICP-MS instrument (Agilent 7700x ICP-MS; Agilent Technologies, CA, USA) equipped with an ICP torch with an injector tube of diameter 1.5 mm, a conventional MicroMist nebulizer, and Scott double-pass spray chamber cooled at 2 ℃ was used for spICP-MS in combination with an externally assembled high-speed pulse signal processing system [23]. The ICP-MS instrument was tuned daily using a tuning solution containing 1 ng/mL each of Li, Co, Y, Ce, and Tl in 2 % nitric acid to achieve optimum signal intensity and stability. The typical operating conditions of the ICP-MS instrument are listed in Table 1. Measurements were conducted in the helium (He) mode and at the dwell time of 100 µs. All samples were measured three times for a 60-s period each to ensure the detection of a sufficient number of particles; this enables the attainment of statistically reliable results. The cleaning time between samples with 2 % nitric acid was 3 min.
Particle size measurements by spICP-MS are based on a conventional calibration approach using an ion standard solution (i.e., the ion standard solution approach) [24,25]. This approach uses a mass flux calibration curve from standard ion solutions and determines the particle size from the mass of the target particle, assuming a spherical geometry. Briefly, a calibration curve was constructed by relating the concentration of the ion standard solutions to the signal intensity. The concentration of the ion standard solution was then converted to mass flux using Equation (1):
W = C S T D × Q n e b × t d w e l l × η
where W is the delivered mass per dwell time (ng), C S T D is the mass concentration (ng/g), Q n e b is the sample flow rate (g/s), t d w e l l is the dwell time (s), and η is the transport efficiency (%). The mass concentration, sample flow rate, dwell time, and transport efficiency were determined experimentally. The actual sample flow rate based on the nebulizer pump speed set at 0.10 rps was 0.352 g/min. Transport efficiency is defined as the ratio of the amount of analyte entering the ICP system to the amount of aspirated analyte. In this study, the particle-size method examined by Pace et al. [23] was applied to determine the transport efficiency. The signal intensity of each particle event was then substituted into the resulting mass–flux calibration curve. The obtained signal intensities were converted to the masses of the corresponding particles using Equation (2),
m P = f 1 × I t a r g e t P I B K G m
where m P is the mass of the particle, f is the mass fraction (the fraction of the particle mass due to the analyte element), I t a r g e t P is the signal intensity of the particle event, I B K G is the background signal intensity, and m is the slope of the mass–flux calibration curve. The resulting m P was converted to diameter ( D t a r g e t   P ) using Equation (3), assuming a spherical geometry,
D t a r g e t   P = 6 × m P ρ × π × 1 φ 3
where ρ is the particle density and φ is the overall porosity (described below in detail). In the case of the non-porous SiO2 microsphere, the particle density (simply called ρ ) was assumed to be equal to the density of the bulk material (2.65 g/cm3 for SiO2), similar to the assumption made in many previous studies [23,24,25]. In the case of the mesoporous SiO2 microsphere, the particle density (called ρ t r u e ) was measured as the “true density” using the gas pycnometry method following the procedure in the ISO 12154:2014 standard [26] and using a BELPycno helium pycnometer (MicrotracBEL, Osaka, Japana). The sample cell volume was 1 cm3, and the measurement temperature was set at 23 ℃. Using the overall porosity ( φ ) and lower size detection limit for the non-porous (solid) particles (i.e., L O D s i z e , s o l i d ), the lower size detection limit for the porous particles (i.e., L O D s i z e , p o r o u s ) can be calculated as follows.
L O D s i z e , p o r o u s = L O D s i z e , s o l i d 1 φ 1 / 3
The value of L O D s i z e , s o l i d was determined using the method described by Lee et al. [27].

2.4. Porosity Determination

The overall porosity ( φ ) was determined for the mesoporous SiO2 microspheres using the following equation [28]:
φ = V p 1 ρ t r u e + V p
where V p is the pore (void) volume and ρ t r u e is the true density. The V p value was determined in-house using the nitrogen adsorption method [29].
Using spICP-MS data and the average value of the particle diameters measured by SEM (explained below in detail), the overall porosity ( φ ) of the microspheres was calculated using Equation (3). The calculated value was used only for discussion purposes.

2.5. Particle Size Measurement by SEM

A solution containing suspended SiO2 or MPS particles was dropped onto the carbon tape attached to the aluminum base, and excess water was removed using filter paper. This sample was dried for 5 min at room temperature (23 ℃) and introduced into the FE-SEM (SU5000, Hitachi High-Tech Corp, Japan). Secondary electron images (1280 × 1020 pixels) were captured at 2000–2500× magnification with a scanning time of 20 s, working distance of 7 mm, an EB acceleration voltage of 3–4 kV, and current of 1–5 pA. From 20 to 30 captured SEM images, 500 SiO2 and 400 MPS particle images were manually selected. The selected particle images were manually masked, and the diameter was calculated from the particle area using the masking region.

2.6. Detection of Protein-Binding Mesoporous SiO2 Microspheres by spICP-MS

An aqueous suspension (5 µL) containing approximately 1 mg of non-porous SiO2 microspheres, or approximately 1 mg of dry mesoporous SiO2 microspheres (SBA24) was placed in a tube. TBS (1 mL) was added to the tube and vortexed twice for 3 s. For SiO2 equilibration, the mesoporous SiO2 microsphere suspension was gently rotated at room temperature (20–25 ℃) for 5 min. The solution in the tubes was then centrifuged at 19 000×g for 1 min at 20 ℃. The supernatant was removed using a pipette tip. The prepared solution of Fe-containing proteins (i.e., LF or TF) was added to the tubes and rigorously vortexed twice for 3 s each time. For protein fixation, the solution was gently rotated at room temperature (20–25 ℃) for 10 min. The bound LF and TF of the non-porous/mesoporous SiO2 microspheres were detected by spICP-MS using Fe as a marker for the presence of proteins.

3. Results and Discussion

3.1. Particle Size Measurement by spICP-MS and SEM

The particle size of the non-porous/mesoporous SiO2 microspheres was measured by (i) spICP-MS based on a conventional calibration approach using an ion standard solution and (ii) SEM as a reference technique, and the results obtained were compared. In the case of spICP-MS, the particle density ( ρ p a r t i c l e ) value of 2.371 g/cm3 (average of triplicate measurements) measured using the gas pycnometry method was used for calculation. Representative time-resolved profiles of non-porous SiO2 microspheres and mesoporous SiO2 microspheres (SBA24) obtained by spICP-MS are shown in Figure 1. SEM images and particle size distributions of the non-porous/mesoporous SiO2 microspheres obtained from spICP-MS and SEM are shown in Figure 2. The SEM images of the non-porous/mesoporous SiO2 microspheres showed a spherical shape (Figures 2a and 2c) and the presence of some aggregates only in the mesoporous SiO2 microsphere suspension (Figure 2c). The particle size distributions of the non-porous/mesoporous SiO2 microspheres obtained using both techniques were in good agreement (Figures 2b and 2d). In spICP-MS, the average particle diameters and their standard deviations (SDs) of the non-porous/mesoporous SiO2 microspheres suspended in PBS were 4.97 µm ± 2.39 µm (n = 249) and 4.68 µm ± 2.40 µm (n = 839), respectively. They were almost in good agreement with the average particle diameters measured by SEM, 4.68 µm ± 0.19 µm (n = 400) for non-porous and 3.76 µm ± 0.49 µm (n = 569) for mesoporous SiO2 microspheres. For the non-porous SiO2 microspheres, the average particle diameter and their SDs obtained by spICP-MS also agreed well with those reported by Bangs Laboratories (i.e., 4.82 µm ± 0.38 µm). These results suggest that spICP-MS is applicable for the particle size measurement of large non-porous/mesoporous SiO2 microspheres.
Lee et al. [27] reported that the typical lower-size detection limits ( L O D s i z e ) range from approximately 10 to 40 nm for most monometallic particles, depending on the abundance of the analyte isotopes monitored. When working with alloys, oxides, or other compound or porous particles, the L O D s i z e values usually increase because the analyte only constitutes a fraction of the particle mass [15]. The lower-size detection limits ( L O D s i z e , s o l i d and L O D s i z e , p o r o u s ) calculated in this study were 241 nm for non-porous SiO2 microspheres and 441 nm for mesoporous SiO2 microspheres. Although the former value is close to the previously reported L O D s i z e , s o l i d value of 232 nm for commercially available non-porous (solid) SiO2 microspheres, the latter value is higher than the L O D s i z e , p o r o u s value of synthesized mesoporous Stöber SiO2 microspheres (292 nm) with an average porosity value of 50 % [15]. This difference is due to the higher porosity value (83.7 %) of the mesoporous SiO2 microspheres used in this study, which result in higher L O D s i z e , p o r o u s values according to Equation (4). Meanwhile, upper size detection limits have been studied less in the literature. They are significantly limited in spICP-MS because of the tendency of the plasma to fully atomize and ionize particles during the transition (residence) time. This limit is also influenced by the dynamic capabilities of ICP-MS detection electronics, density, and boiling point of the compound [30]. Typical upper-size detection limits range from ca. 1 to 1.5 µm for solid SiO2 microspheres [31] and ca. 200 to 250 nm for solid gold (Au) particles [30,32]. In this study, the size of 4.8 µm solid SiO2 microspheres was successfully measured by spICP-MS, which experimentally shows that the spICP-MS-based particle size of SiO2 microspheres of approximately 5.0 µm is possible.
The ability to measure the particle size of non-porous/mesoporous SiO2 microspheres with the demonstrated detection limit may enable the evaluation of submicron particle aggregation states. As mentioned in the introduction, these microspheres are often used with adsorbed biomolecules, such as nucleic acids, proteins, and cells. These biomolecules can undergo denaturation or degradation over time and with temperature changes, potentially causing the aggregation of SiO2 microspheres. Microscopic observations may have difficulty in distinguishing between the proximity and aggregation of the microspheres. The integration of complementary data from both microscopy and spICP-MS enables a more comprehensive evaluation.
In this study, the overall porosity (83.7 %) determined using a total pore volume ( V p ) of 2.17 cm3/g for the mesoporous SiO2 microspheres was used to calculate the particle size. Porosity has a profound impact on particle chemistry because (i) it can make the particles permeable and (ii) an increase in the specific surface area increases surface activity and the adsorption of molecular species [33,34], thereby promoting various industrial and environmental science applications [35]. Recently, Kéri et al. [15] newly proposed a spICP-MS-based overall porosity determination method for nano- and sub-micron particles (potentially, particles up to ca. 1–2 µm in size) with or without mesoporous pores. They demonstrated that the porosity of the synthesized mesoporous SiO2 NPs with an average diameter of ca. 400 nm (0.4 µm) could be determined by combining the information from spICP-MS (i.e., signal intensities from individual particles) with that from other NP characterization techniques (i.e., particle diameter or volume). The accuracy and precision of this method are comparable to those of other methods, such as small-angle X-ray scattering (SAXS), gas adsorption, and transmission electron microscopy (TEM). The overall porosity can also be used to calculate the density of the particles if the bulk density is known, which is not easy to determine because of the small amount of sample. The porosity value for the mesoporous SiO2 microspheres calculated according to Equation (3) (using the spICP-MS data and the average particle diameter measured by SEM) was 68.4 % ± 23.0 % (n = 745), agreeing well with that separately calculated using Equation (5) (83.7 %). According to our findings, the proposed spICP-MS-based porosity/density determination method is applicable to single micrometer-sized particles if they can be fully decomposed by plasma and their diameter and density are known. For example, the frequently used SAXS method requires a dry powder sample (tens of milligrams) and knowledge of the particle density, which may not be known for newly synthesized complex particles. However, the spICP-MS-based method requires a considerably smaller amount of sample material (micrograms or less), which is a significant advantage when the sample size is limited. This method offers an additional benefit by automatically including both open (connected and permeable) and closed pores in the calculation.

3.2. Detection of Fe-Containing Protein-Binding Mesoporous SiO2 Microspheres by spICP-MS

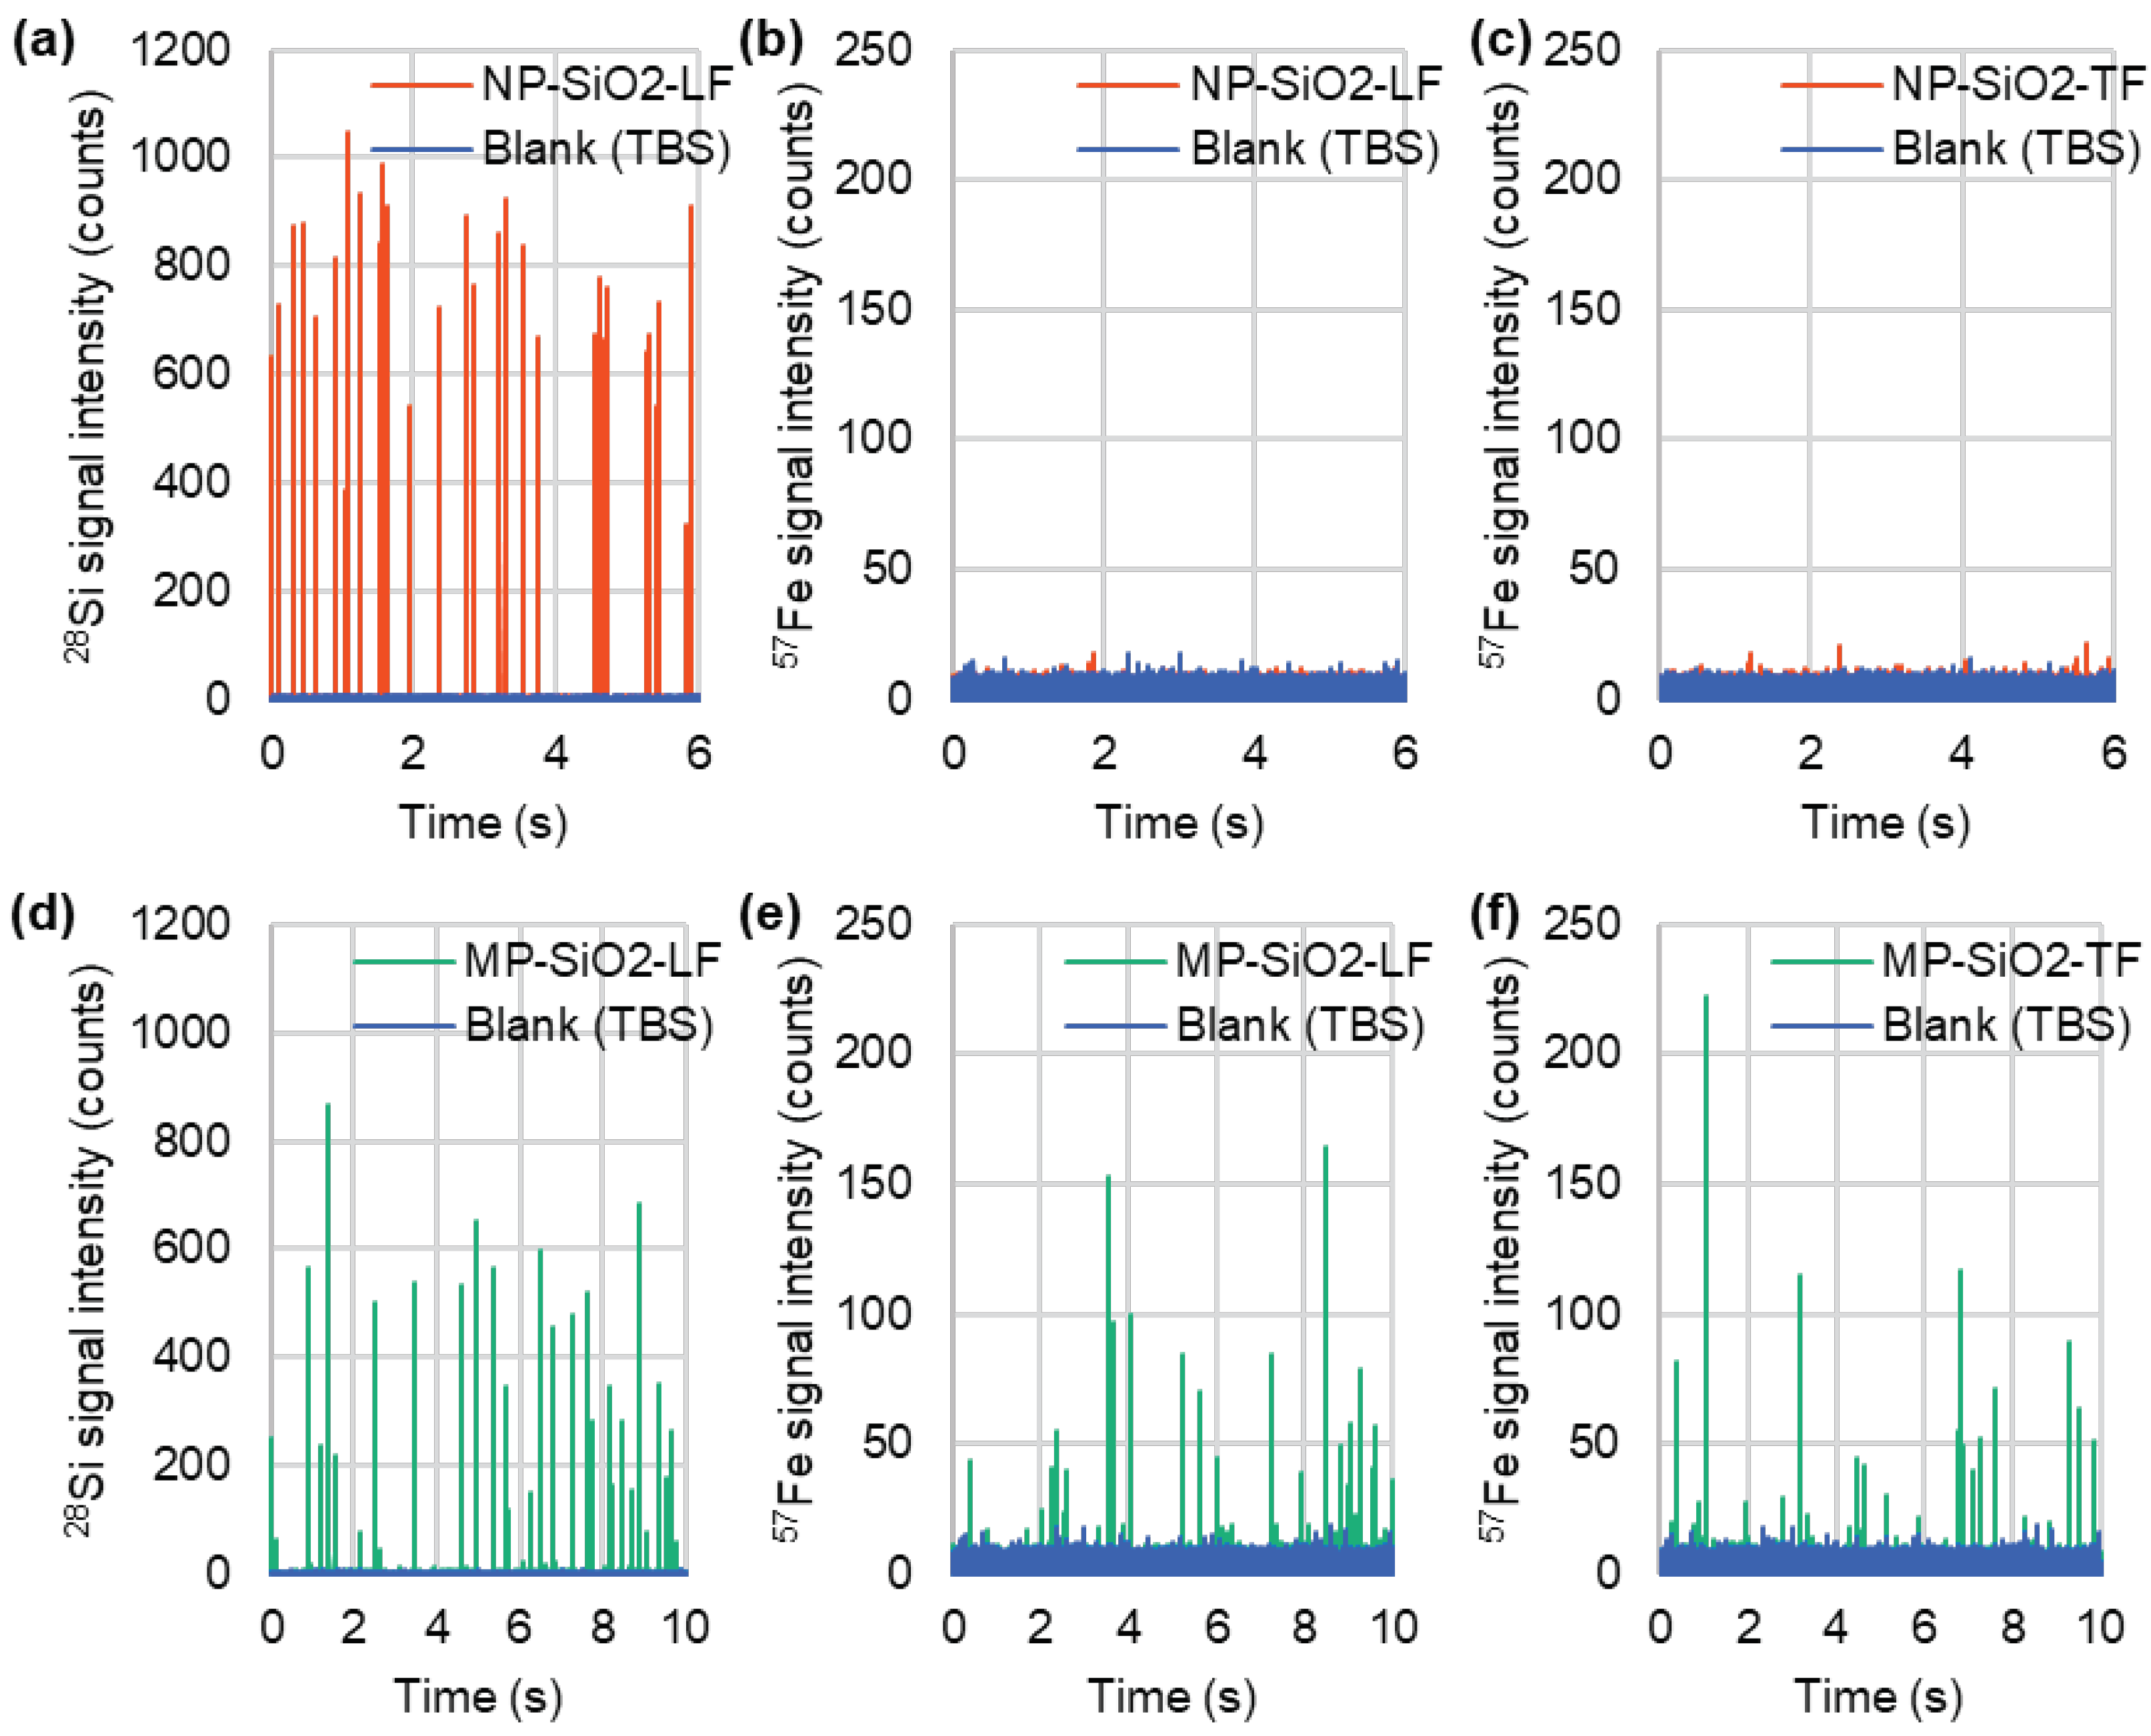
The applicability of spICP-MS to the detection of metal-containing protein-binding mesoporous SiO2 microspheres was investigated. The representative time-resolved profiles of the LF- and TF-bound mesoporous SiO2 microspheres obtained by spICP-MS are shown in Figure 3. The bound LF and TF of the mesoporous SiO2 microspheres were detected using Fe as a marker for the presence of proteins. In contrast, little to no binding was observed in non-porous SiO2 microspheres. This observation suggests differences in the protein binding capacities between mesoporous and non-porous SiO2 microspheres. The results indicate that spICP-MS has considerable potential for element-based detection and qualification of bound proteins of mesoporous SiO2 microspheres in a variety of applications.
In this study, we detected the binding of LF and TF to mesoporous SiO2 microspheres by identifying the Fe. LF is present in breast milk, supplying essential iron to newborns, whereas TF, found in the plasma, plays a role in transporting iron in the blood. Other Fe-binding proteins include heme proteins such as hemoglobins and myoglobins, Fe storage proteins such as ferritin, and transcription factors that sense Fe levels. Thus, Fe-binding proteins play essential roles in biological processes. The binding of these proteins to mesoporous SiO2 microspheres is promising for enhancing the heat resistance of proteins, inducing immune responses for antibody generation in animals, and other potential applications. However, the number of Fe-containing proteins is limited. In addition to Fe, proteins contain elements such as sulfur, phosphorus, and carbon. Sulfur is a constituent of amino acids, such as cysteine and methionine, contributing to the formation of disulfide bonds and the overall protein structure. Phosphorus is integral to phosphorylation events and plays a crucial role in post-translational modifications of proteins. Carbon, present in all amino acids, is fundamental to the backbone of proteins. To broaden our ability to detect a wider range of proteins, future studies should expand the analysis to include elements such as sulfur, phosphorus, and carbon.
When mesoporous SiO2 microspheres are used as carriers for drug delivery or as immune adjuvants, various molecules are adsorbed onto these microspheres depending on the purpose. These include proteins, peptides, nucleic acids, glycans, small-molecule drugs, polymers, lipids, and other molecules. Bulk assessments of molecules binding to these microspheres are feasible; however, the evaluation of each microsphere individually is limited. Although observation by labeling with fluorescent dyes or similar methods is possible, such labeling may alter the intrinsic behavior of molecules. The detection of proteins on the particles achieved in this study was performed with element selectivity, enabling the assessment of the presence of unlabeled proteins on a single-particle basis. It is also possible to distinguish between proteins, nucleic acids, lipids, and other components. This method is expected to provide valuable insights into the molecular biology and medical applications of mesoporous SiO2 microspheres. In the future, this achievement is expected to evolve into a promising method for assessing the homogeneity of prepared samples and evaluating the changes in the state of long-term stored samples.

4. Conclusions

The results obtained in this study led to the conclusion that spICP-MS is applicable for particle size measurements and the detection of bound proteins in non-porous/mesoporous SiO2 microspheres.
In the future, we will expand the application areas of this technique. This would apply to larger non-porous/mesoporous particles if they could be fully decomposed by the plasma and their density and porosity are known. Moreover, it can also be applied to diverse types of mesoporous particles other than mesoporous SiO2 particles. For example, mesoporous TiO2 particles are widely recognized as photocatalysts and utilized in solar cells, lithium-ion batteries, biosensors, and cancer therapy [36,37]. Mesoporous Co3O4 particles have been exploited in the fields of energy storage, semiconductors, and catalysis [38,39]. The spICP-MS technique can be applied to the particle size measurement of mesoporous particles.
Further studies and applications of SiO2 particles will be of interest. Although nanometer-sized SiO2 particles (i.e., SiO2 NPs) have been highlighted in the literature, micrometer-sized SiO2 particles have unique features. For example, they seem to have more potential for medical applications than SiO2 NPs, as subcutaneously injected micrometer-sized particles have a higher decomposition speed in a living body [40]. The applications of micrometer-sized SiO2 particles can be enhanced by determining their particle sizes and detecting bound proteins using the spICP-MS technique.

Author Contributions

Conceptualization: S.-I. Mi., T.O., S.-i.Ma., and E.F.; Methodology: S. I. Mi., T.O., and E.F.; Validation: S.-I. Mi. and T.O.; Formal analysis: S.-I.Mi. and T.O.; Investigation: S.-I. Mi., T.O., S.-I.Ma., and E.F.; Resources: S.-I.Mi., T.O., S.-I.Ma., and E.F.; Data curation: S.-I. Mi. and T.O.; Writing and original draft preparation: S.-I. Mi.; writing, review, and editing: T.O., S.-I. Ma., and E.F.; Visualization: S.-I. Mi., and T.O.; Supervision: E.F.; and project administration: E.F. All authors have read and agreed to the published version of the manuscript.

Funding

This research received no external funding.

Data Availability Statement

Data presented in this study are available upon request from the corresponding author. The data are not publicly available due to privacy concerns.

Acknowledgments

The authors thank Ms. Miho Iida for her technical assistance.

Conflicts of Interest

The authors declare no conflicts of interest.

References

  1. Close, E.D.; Nwokeoji, A.O.; Milton, D.; Cook, K.; Hindocha, D.M.; Hook, E.C.; Wood, H.; Dickman, M.J. Nucleic acid separations using superficially porous silica particles. J Chromatogr A 2016, 1440, 135–144. [Google Scholar] [CrossRef]
  2. Dong, Z.; Ahrens, C.C.; Yu, D.; Ding, Z.; Lim, H.; Li, W. Cell Isolation and Recovery Using Hollow Glass Microspheres Coated with Nanolayered Films for Applications in Resource-Limited Settings. ACS Appl Mater Interfaces 2017, 9, 15265–15273. [Google Scholar] [CrossRef]
  3. Soria, S.; Baldini, F.; Berneschi, S.; Cosi, F.; Giannetti, A.; Conti, G.N.; Pelli, S.; Righini, G.C.; Tiribilli, B. High-Q polymer-coated microspheres for immunosensing applications. Opt Express 2009, 17, 14694–14699. [Google Scholar] [CrossRef]
  4. Liu, L.; Guo, Z.; Huang, Z.; Zhuang, J.; Yang, W. Size-selective separation of DNA fragments by using lysine-functionalized silica particles. Sci Rep 2016, 6, 22029. [Google Scholar] [CrossRef]
  5. Manzano, M.; Aina, V.; Areán, C.O.; Balas, F.; Cauda, V.; Colilla, M.; Delgado, M.R.; Vallet-Regí, M. Studies on MCM-41 mesoporous silica for drug delivery: Effect of particle morphology and amine functionalization. Chem Eng J 2008, 137, 30–37. [Google Scholar] [CrossRef]
  6. Hu, Y.; Zhi, Z.; Zhao, Q.; Wu, C.; Zhao, P.; Jiang, H.; Jiang, T.; Wang, S. 3D cubic mesoporous silica microsphere as a carrier for poorly soluble drug carvedilol. Microporous Mesoporous Mater 2012, 147, 94–101. [Google Scholar] [CrossRef]
  7. Narayan, R.; Nayak, U.Y.; Raichur, A.M.; Garg, S. Mesoporous Silica Nanoparticles: A Comprehensive Review on Synthesis and Recent Advances. Pharmaceutics 2018, 10. [Google Scholar] [CrossRef]
  8. Mercuri, L.P.; Carvalho, L.V.; Lima, F.A.; Quayle, C.; Fantini, M.C.; Tanaka, G.S.; Cabrera, W.H.; Furtado, M.F.; Tambourgi, D.V.; Matos Jdo, R.; et al. Ordered mesoporous silica SBA-15: a new effective adjuvant to induce antibody response. Small 2006, 2, 254–256. [Google Scholar] [CrossRef]
  9. Dellacherie, M.O.; Li, A.; Lu, B.Y.; Verbeke, C.S.; Gu, L.; Stafford, A.G.; Doherty, E.J.; Mooney, D.J. Single-Shot Mesoporous Silica Rods Scaffold for Induction of Humoral Responses Against Small Antigens. Adv Funct Mater 2020, 30, 2002448. [Google Scholar] [CrossRef]
  10. Trezena, A.G.; Oseliero Filho, P.L.; Cides da Silva, L.C.; Oliveira, C.L.P.; Lopes, J.L.S.; Antonio, N.D.S.; Dettmann, V.F.B.; Akamatsu, M.A.; Martins, T.D.S.; Ribeiro, O.G.; et al. Adjuvant effect of mesoporous silica SBA-15 on anti-diphtheria and anti-tetanus humoral immune response. Biologicals 2022, 80, 18–26. [Google Scholar] [CrossRef] [PubMed]
  11. Montaño, M.D.; Olesik, J.W.; Barber, A.G.; Challis, K.; Ranville, J.F. Single Particle ICP-MS: Advances toward routine analysis of nanomaterials. Anal Bioanal Chem 2016, 408, 5053–5074. [Google Scholar] [CrossRef] [PubMed]
  12. Mozhayeva, D.; Engelhard, C. A critical review of single particle inductively coupled plasma mass spectrometry – A step towards an ideal method for nanomaterial characterization. J Anal At Spectrom 2020, 35, 1740–1783. [Google Scholar] [CrossRef]
  13. Bolea, E.; Jimenez, M.S.; Perez-Arantegui, J.; Vidal, J.C.; Bakir, M.; Ben-Jeddou, K.; Gimenez-Ingalaturre, A.C.; Ojeda, D.; Trujillo, C.; Laborda, F. Analytical applications of single particle inductively coupled plasma mass spectrometry: a comprehensive and critical review. Anal Methods 2021, 13, 2742–2795. [Google Scholar] [CrossRef]
  14. Resano, M.; Aramendía, M.; García-Ruiz, E.; Bazo, A.; Bolea-Fernandez, E.; Vanhaecke, F. Living in a transient world: ICP-MS reinvented via time-resolved analysis for monitoring single events. Chem Sci 2022, 13, 4436–4473. [Google Scholar] [CrossRef] [PubMed]
  15. Kéri, A.; Sápi, A.; Ungor, D.; Sebők, D.; Csapó, E.; Kónya, Z.; Galbács, G. Porosity determination of nano- and sub-micron particles by single particle inductively coupled plasma mass spectrometry. J Anal At Spectrom 2020, 35, 1139–1147. [Google Scholar] [CrossRef]
  16. Zhang, J.; Fu, D.; Feng, H.; Li, Y.; Zhang, S.; Peng, C.; Wang, Y.; Sun, H.; Wang, L. Mass spectrometry detection of environmental microplastics: Advances and challenges. TrAC Trends Anal Chem 2024, 170, 117472. [Google Scholar] [CrossRef]
  17. Bolea-Fernandez, E.; Rua-Ibarz, A.; Velimirovic, M.; Tirez, K.; Vanhaecke, F. Detection of microplastics using inductively coupled plasma-mass spectrometry (ICP-MS) operated in single-event mode. J Anal At Spectrom 2020, 35, 455–460. [Google Scholar] [CrossRef]
  18. Velimirovic, M.; Tirez, K.; Verstraelen, S.; Frijns, E.; Remy, S.; Koppen, G.; Rotander, A.; Bolea-Fernandez, E.; Vanhaecke, F. Mass spectrometry as a powerful analytical tool for the characterization of indoor airborne microplastics and nanoplastics. J Anal At Spectrom 2021, 36, 695–705. [Google Scholar] [CrossRef]
  19. Gelman, F.; Muszyńska, M.; Karasiński, J.; Lev, O.; Halicz, L. Detection of PTFE microparticles by ICP-qMS operated in single-particle mode. J Anal At Spectrom 2022, 37, 2282–2285. [Google Scholar] [CrossRef]
  20. Harycki, S.; Gundlach-Graham, A. Characterization of a high-sensitivity ICP-TOFMS instrument for microdroplet, nanoparticle, and microplastic analyses. J Anal At Spectrom 2023, 38, 111–120. [Google Scholar] [CrossRef]
  21. Matsuura, S.-i.; Ikeda, T.; Hiyoshi, N.; Chiba, M.; Yamaguchi, A. Assemblies of two multimeric enzymes using mesoporous silica microspheres toward cascade reaction fields. Biochem Eng J 2022, 182, 108416. [Google Scholar] [CrossRef]
  22. Matsuura, S.-i.; Baba, T.; Ikeda, T.; Yamamoto, K.; Tsunoda, T.; Yamaguchi, A. Highly Precise and Sensitive Polymerase Chain Reaction Using Mesoporous Silica-Immobilized Enzymes. ACS Appl Mater Interfaces 2022, 14, 29483–29490. [Google Scholar] [CrossRef]
  23. Miyashita, S.-i.; Mitsuhashi, H.; Fujii, S.-i.; Takatsu, A.; Inagaki, K.; Fujimoto, T. High transport efficiency of nanoparticles through a total-consumption sample introduction system and its beneficial application for particle size evaluation in single-particle ICP-MS. Anal Bioanal Chem 2017, 409, 1531–1545. [Google Scholar] [CrossRef]
  24. Pace, H.E.; Rogers, N.J.; Jarolimek, C.; Coleman, V.A.; Higgins, C.P.; Ranville, J.F. Determining Transport Efficiency for the Purpose of Counting and Sizing Nanoparticles via Single Particle Inductively Coupled Plasma Mass Spectrometry. Anal Chem 2011, 83, 9361–9369. [Google Scholar] [CrossRef]
  25. Yamashita, S.; Miyashita, S.-i.; Hirata, T. Size Uncertainty in Individual Nanoparticles Measured by Single Particle Inductively Coupled Plasma Mass Spectrometry. Nanomaterials 2023, 13, 1958. [Google Scholar] [CrossRef]
  26. Determination of density by volumetric displacement — Skeleton density by gas pycnometry. 2014, ISO 12154:2014.
  27. Lee, S.; Bi, X.; Reed, R.B.; Ranville, J.F.; Herckes, P.; Westerhoff, P. Nanoparticle Size Detection Limits by Single Particle ICP-MS for 40 Elements. Environ Sci Technol 2014, 48, 10291–10300. [Google Scholar] [CrossRef]
  28. Hu, M.; Yang, W.; Tan, H.; Jin, L.; Zhang, L.; Kerns, P.; Dang, Y.; Dissanayake, S.; Schaefer, S.; Liu, B.; et al. Template-free Synthesis of Mesoporous and Crystalline Transition Metal Oxide Nanoplates with Abundant Surface Defects. Matter 2020, 2, 1244–1259. [Google Scholar] [CrossRef]
  29. Matsuura, S.-i.; Chiba, M.; Tomon, E.; Tsunoda, T. Synthesis of amino acid using a flow-type microreactor containing enzyme–mesoporous silica microsphere composites. RSC Advances 2014, 4, 9021–9030. [Google Scholar] [CrossRef]
  30. Lee, W.-W.; Chan, W.-T. Calibration of single-particle inductively coupled plasma-mass spectrometry (SP-ICP-MS). J Anal At Spectrom 2015, 30, 1245–1254. [Google Scholar] [CrossRef]
  31. Olesik, J.W.; Gray, P.J. Considerations for measurement of individual nanoparticles or microparticles by ICP-MS: determination of the number of particles and the analyte mass in each particle. J Anal At Spectrom 2012, 27, 1143–1155. [Google Scholar] [CrossRef]
  32. Rush, L.A.; Endres, M.C.; Liezers, M.; Ward, J.D.; Eiden, G.C.; Duffin, A.M. Collisional dampening for improved quantification in single particle inductively coupled plasma mass spectrometry. Talanta 2018, 189, 268–273. [Google Scholar] [CrossRef]
  33. Bell, N.C.; Minelli, C.; Tompkins, J.; Stevens, M.M.; Shard, A.G. Emerging Techniques for Submicrometer Particle Sizing Applied to Stöber Silica. Langmuir 2012, 28, 10860–10872. [Google Scholar] [CrossRef]
  34. Cai, Y.; Chen, Y.; Hong, X.; Liu, Z.; Yuan, W. Porous microsphere and its applications. Int J Nanomedicine 2013, 8, 1111–1120. [Google Scholar] [CrossRef]
  35. Jiao, X.; Sokolov, S.V.; Tanner, E.E.L.; Young, N.P.; Compton, R.G. Exploring nanoparticle porosity using nano-impacts: platinum nanoparticle aggregates. Phys Chem Chem Phys 2017, 19, 64–68. [Google Scholar] [CrossRef]
  36. Zhang, R.; Elzatahry, A.A.; Al-Deyab, S.S.; Zhao, D. Mesoporous titania: From synthesis to application. Nano Today 2012, 7, 344–366. [Google Scholar] [CrossRef]
  37. Niu, B.; Wang, X.; Wu, K.; He, X.; Zhang, R. Mesoporous Titanium Dioxide: Synthesis and Applications in Photocatalysis, Energy and Biology. Materials (Basel) 2018, 11. [Google Scholar] [CrossRef]
  38. Dahal, N.; Ibarra, I.A.; Humphrey, S.M. High surface area mesoporous Co3O4 from a direct soft template route. J Mater Chem 2012, 22, 12675–12681. [Google Scholar] [CrossRef]
  39. Sápi, A.; Halasi, G.; Grósz, A.; Kiss, J.; Kéri, A.; Ballai, G.; Galbács, G.; Kukovecz, Á.; Kónya, Z. Designed Pt Promoted 3D Mesoporous Co₃O₄ Catalyst in CO₂ Hydrogenation. J Nanosci Nanotechnol 2019, 19, 436–441. [Google Scholar] [CrossRef] [PubMed]
  40. Choi, Y.; Lee, J.E.; Lee, J.H.; Jeong, J.H.; Kim, J. A Biodegradation Study of SBA-15 Microparticles in Simulated Body Fluid and in Vivo. Langmuir 2015, 31, 6457–6462. [Google Scholar] [CrossRef] [PubMed]
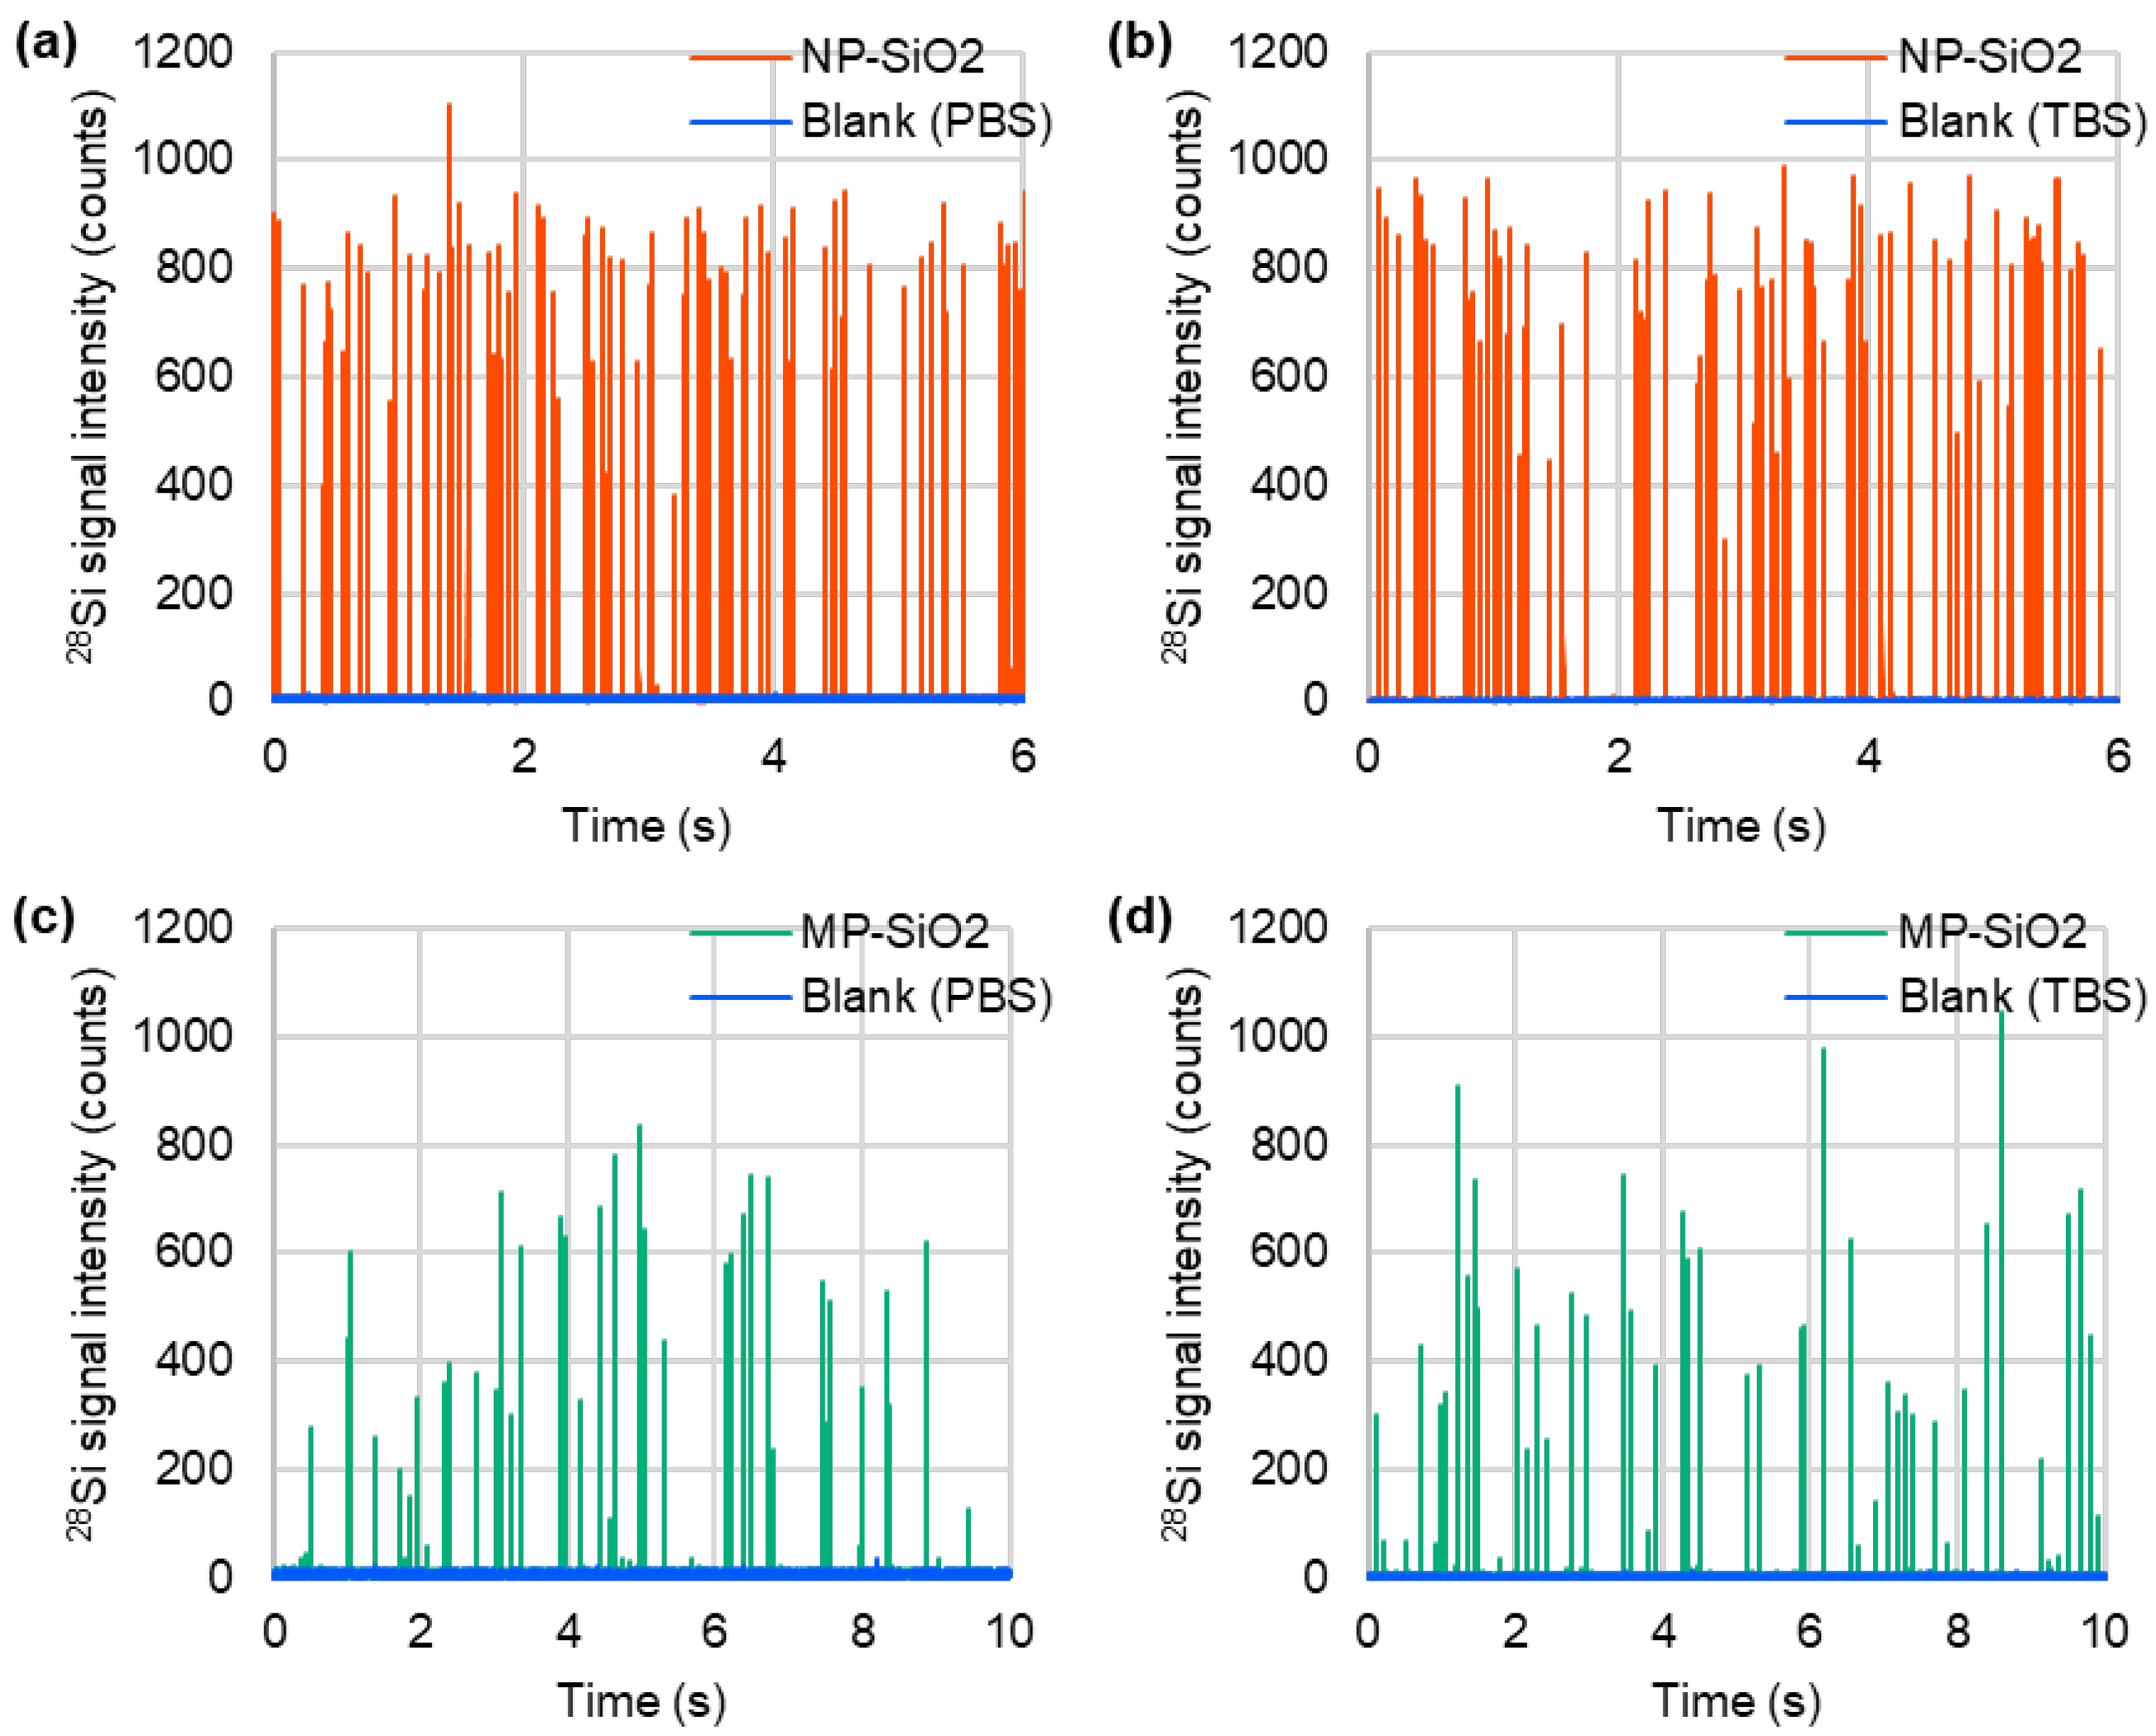
Figure 1. Representative time-resolved profiles for non-porous SiO2 microspheres (NP-SiO2) (a, b) and mesoporous SiO2 microspheres (MP-SiO2) (c, d) suspended in PBS/TBS, obtained by spICP-MS.
Preprints 98302 g001
Figure 2. SEM images and particle size distributions of non-porous SiO2 microspheres (a, b) and mesoporous SiO2 microspheres (SBA24) (c, d) suspended in PBS, obtained from spICP-MS and SEM.
Preprints 98302 g002
Figure 3. Representative time-resolved profiles for LF- and TF-binding non-porous SiO2 microspheres (NP-SiO2) (a, b, c) and mesoporous SiO2 microspheres (MP-SiO2) (d, e, f) suspended in TBS, obtained by spICP-MS while monitoring 28Si (a, d) and 57Fe (b, c, e, f) individually.
Preprints 98302 g003
Table 1. Typical operating conditions of the ICP-MS instrument.
Parameter Setting
Plasma and sampling conditions
RF power 1550 W
Plasma gas flow rate 15 L/min
Auxiliary gas flow rate 0.90 L/min
Carrier (nebulizer) gas flow rate 0.90 L/min
Nebulizer pump 0.10 rps
Sampling position 10.0 mm
Cell gas (He) flow rate 3.0 mL/min
Data acquisition
Scanning mode Peak hopping
Data point per peak 1 point
Monitored isotope 28Si, 57Fe
Disclaimer/Publisher’s Note: The statements, opinions and data contained in all publications are solely those of the individual author(s) and contributor(s) and not of MDPI and/or the editor(s). MDPI and/or the editor(s) disclaim responsibility for any injury to people or property resulting from any ideas, methods, instructions or products referred to in the content.
Copyright: This open access article is published under a Creative Commons CC BY 4.0 license, which permit the free download, distribution, and reuse, provided that the author and preprint are cited in any reuse.
Prerpints.org logo

Preprints.org is a free preprint server supported by MDPI in Basel, Switzerland.

Subscribe

© 2024 MDPI (Basel, Switzerland) unless otherwise stated