Submitted:
05 February 2024
Posted:
06 February 2024
You are already at the latest version
Abstract
Keywords:
1. Introduction
2. Materials and Methods
2.1. Study region
2.2. Modeling the spread of the emerald ash borer
| Variables | Limits |
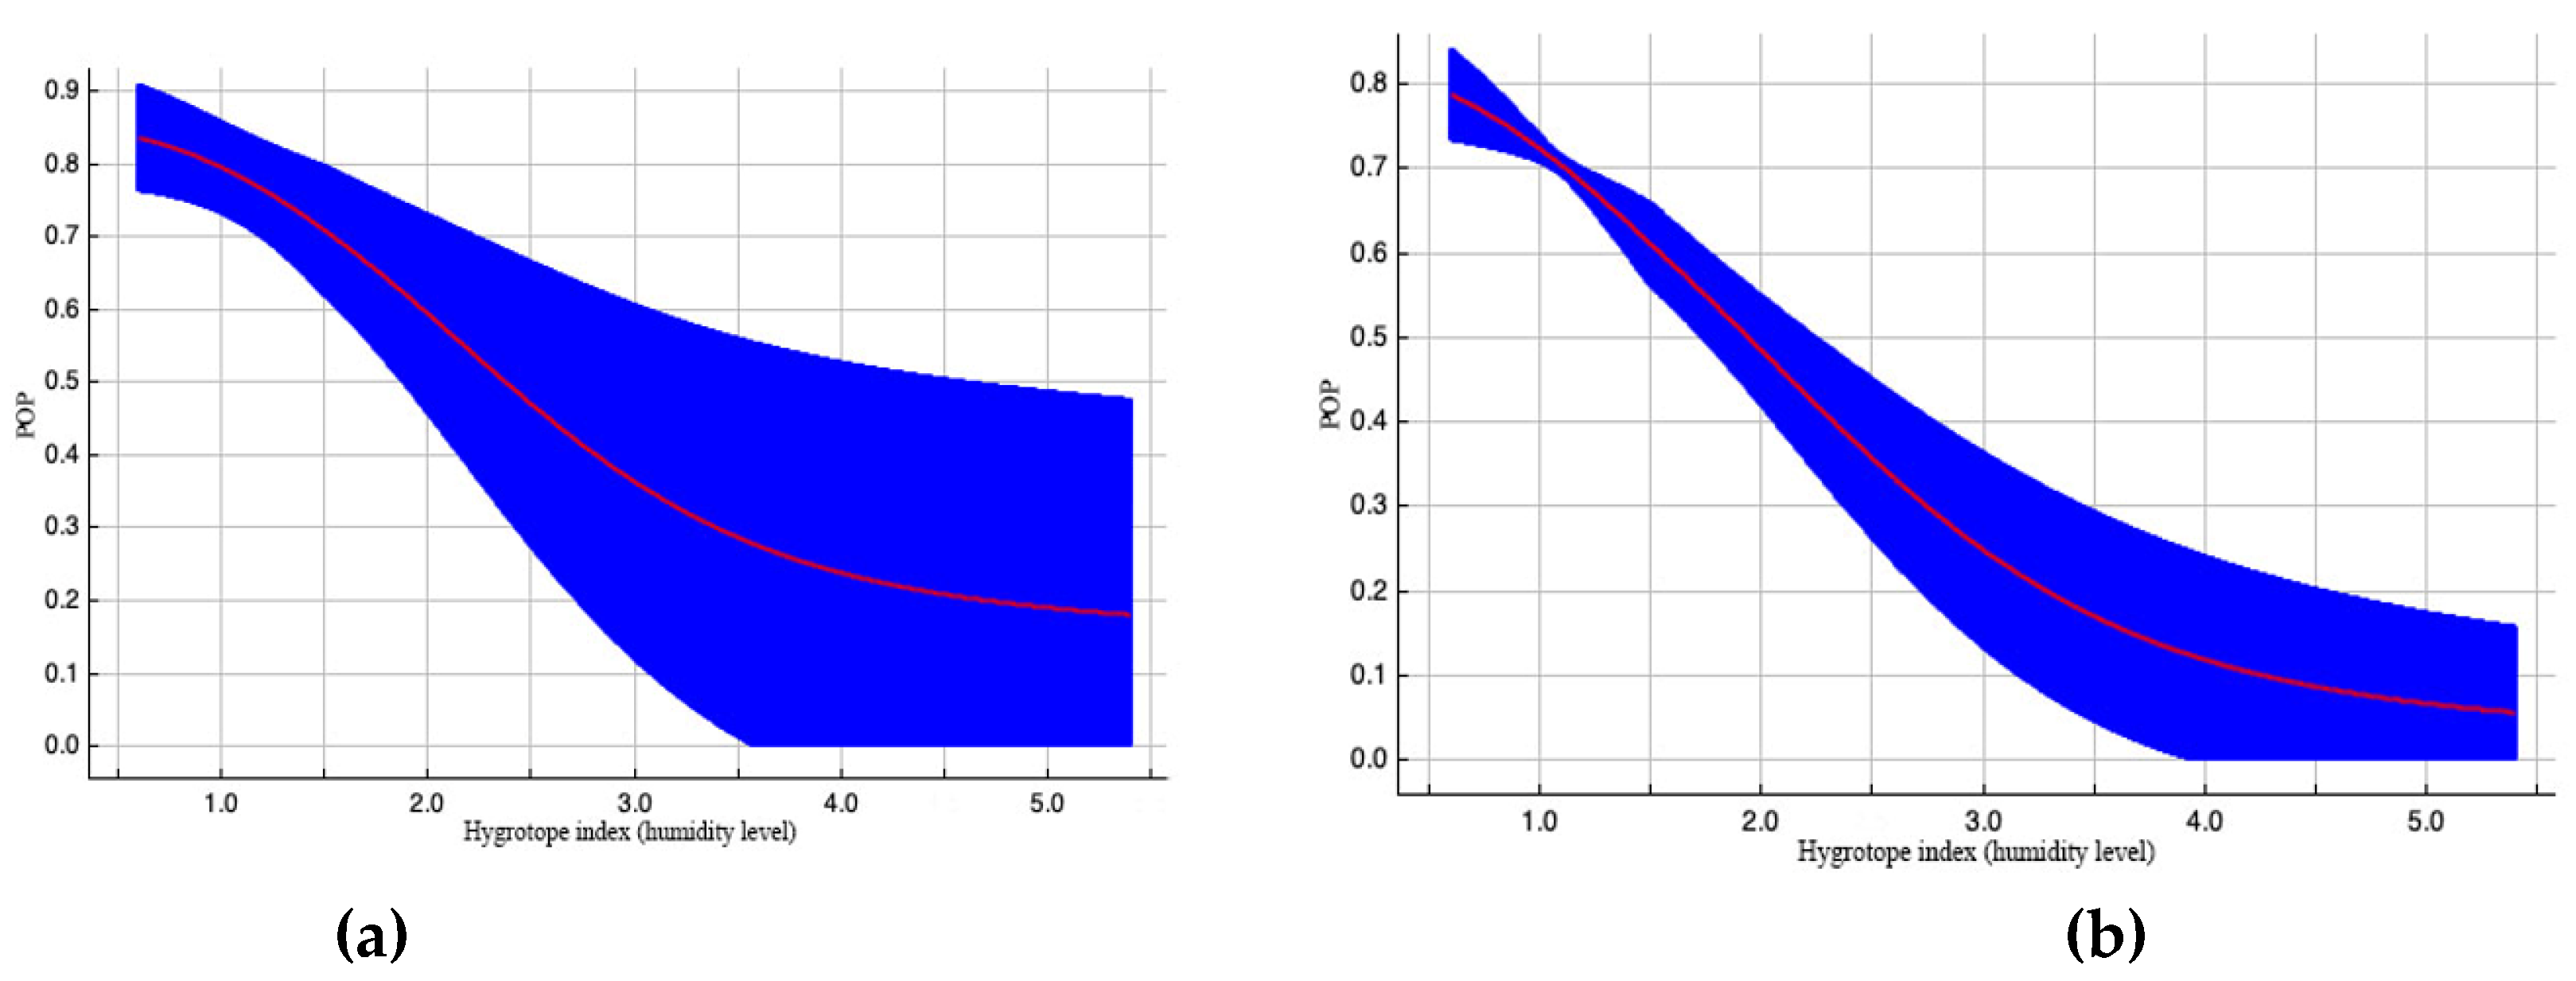
| Hygrotope index (humidity level) | 0, 1, 2, 3, 4, 5 |
| Trophotope index (A,B,C,D) | 1, 2, 3, 4 |
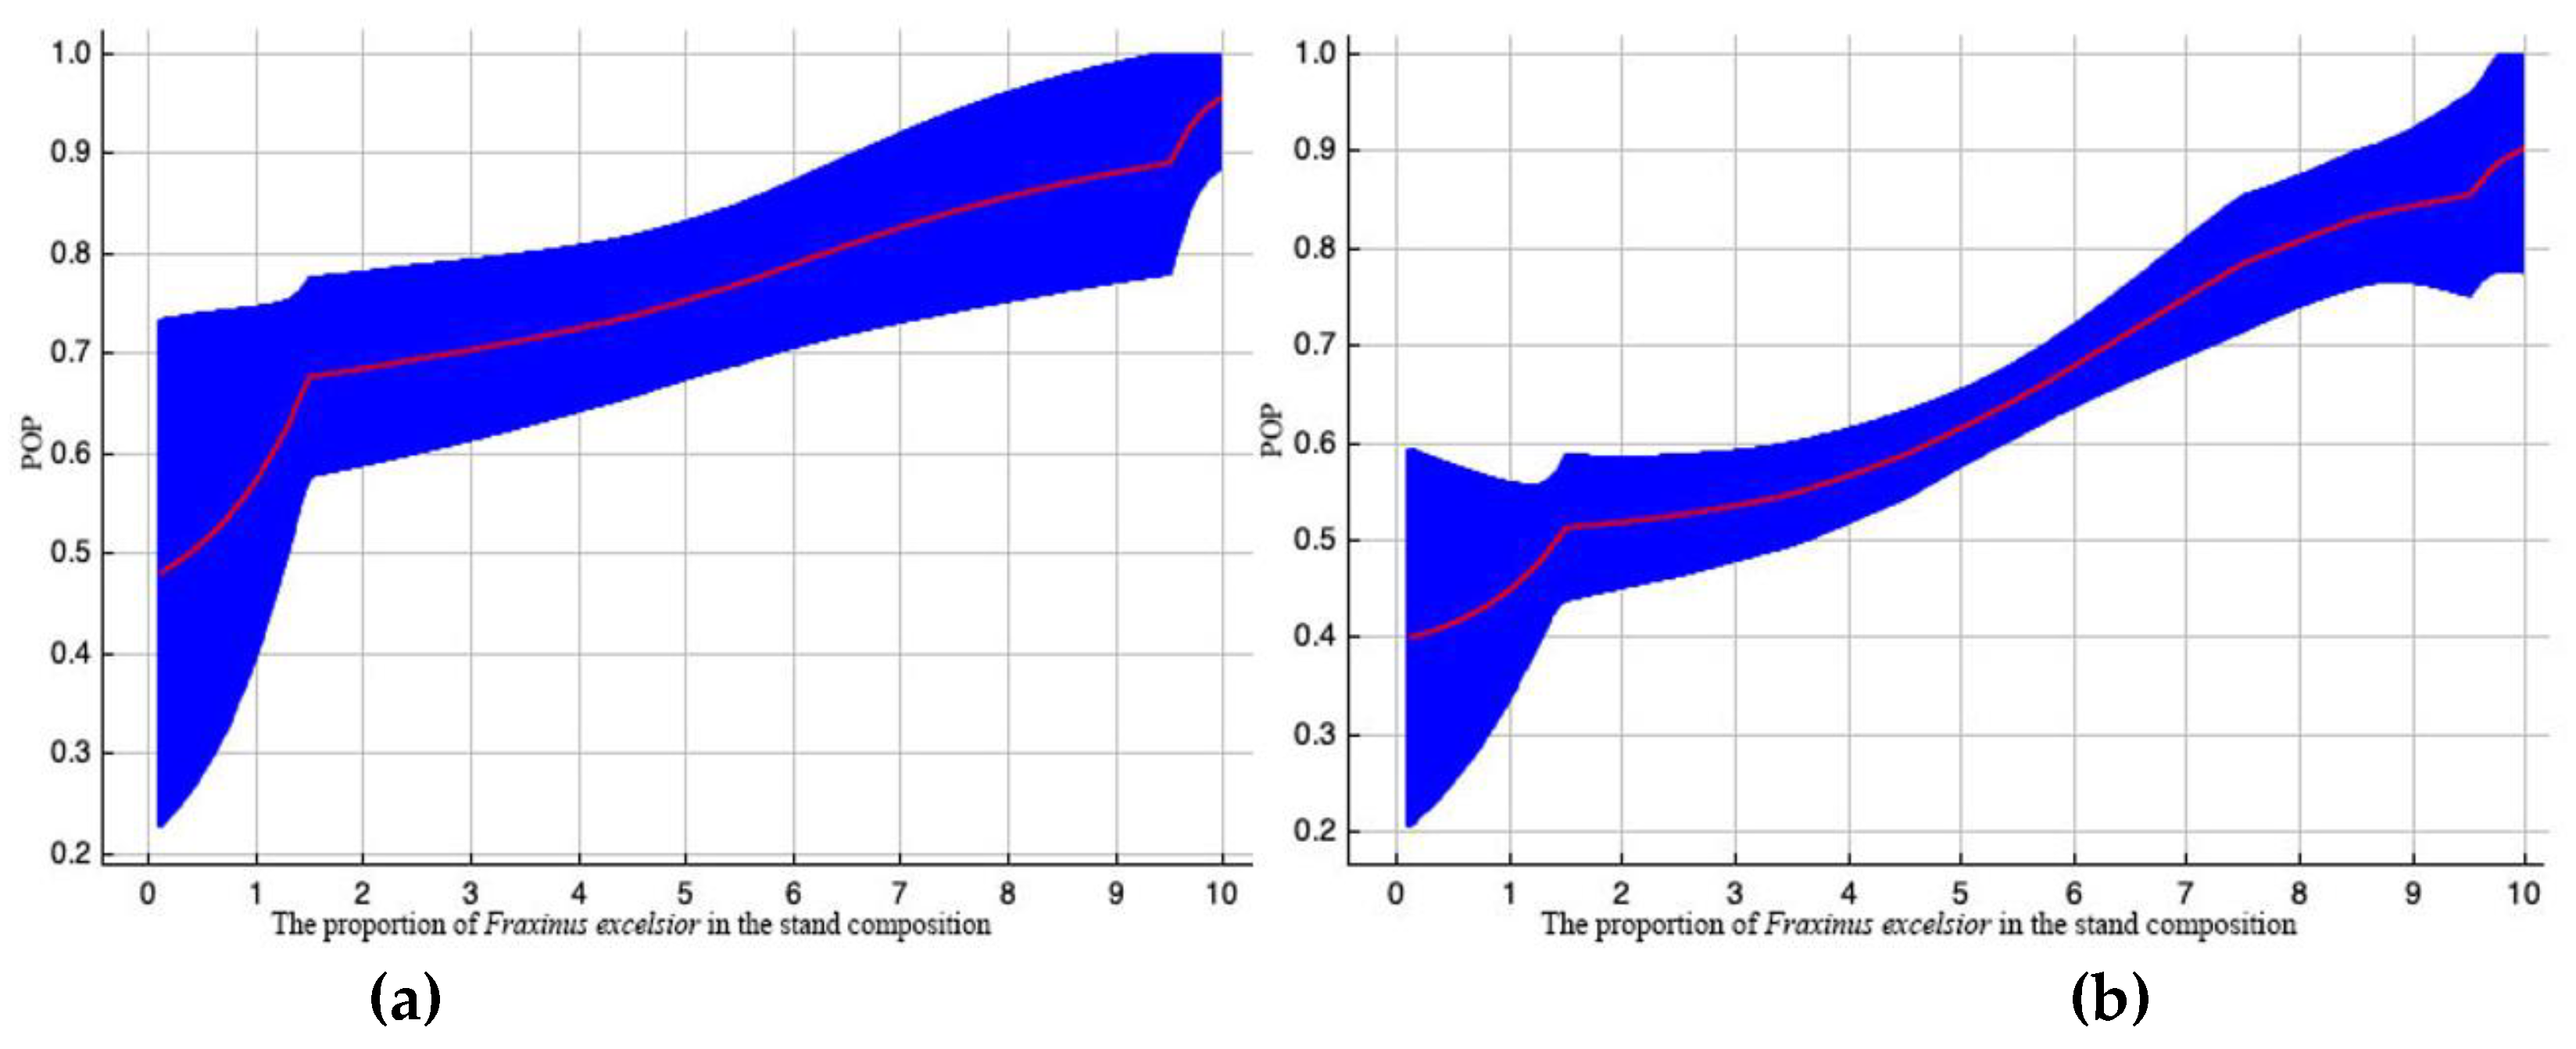
| The proportion of Fraxinus excelsior in the stand composition | 10–100% |
| The presence of any Fraxinus species in the stand composition | 1/0 |
| Age of trees, years | 30–110 |
| Mean height of trees, m | 6–25 m |
| Mean diameter of trees, cm (DBH) | 4–36 cm |
| Relative density of stocking | 0.5–0.9 |
| Site index class | 1–5 |
| Area of forest subcompartment | 0.5–59.5 ha |
| Number of non-forested lands neighbouring subcompartment | 0–8 |
3. Results
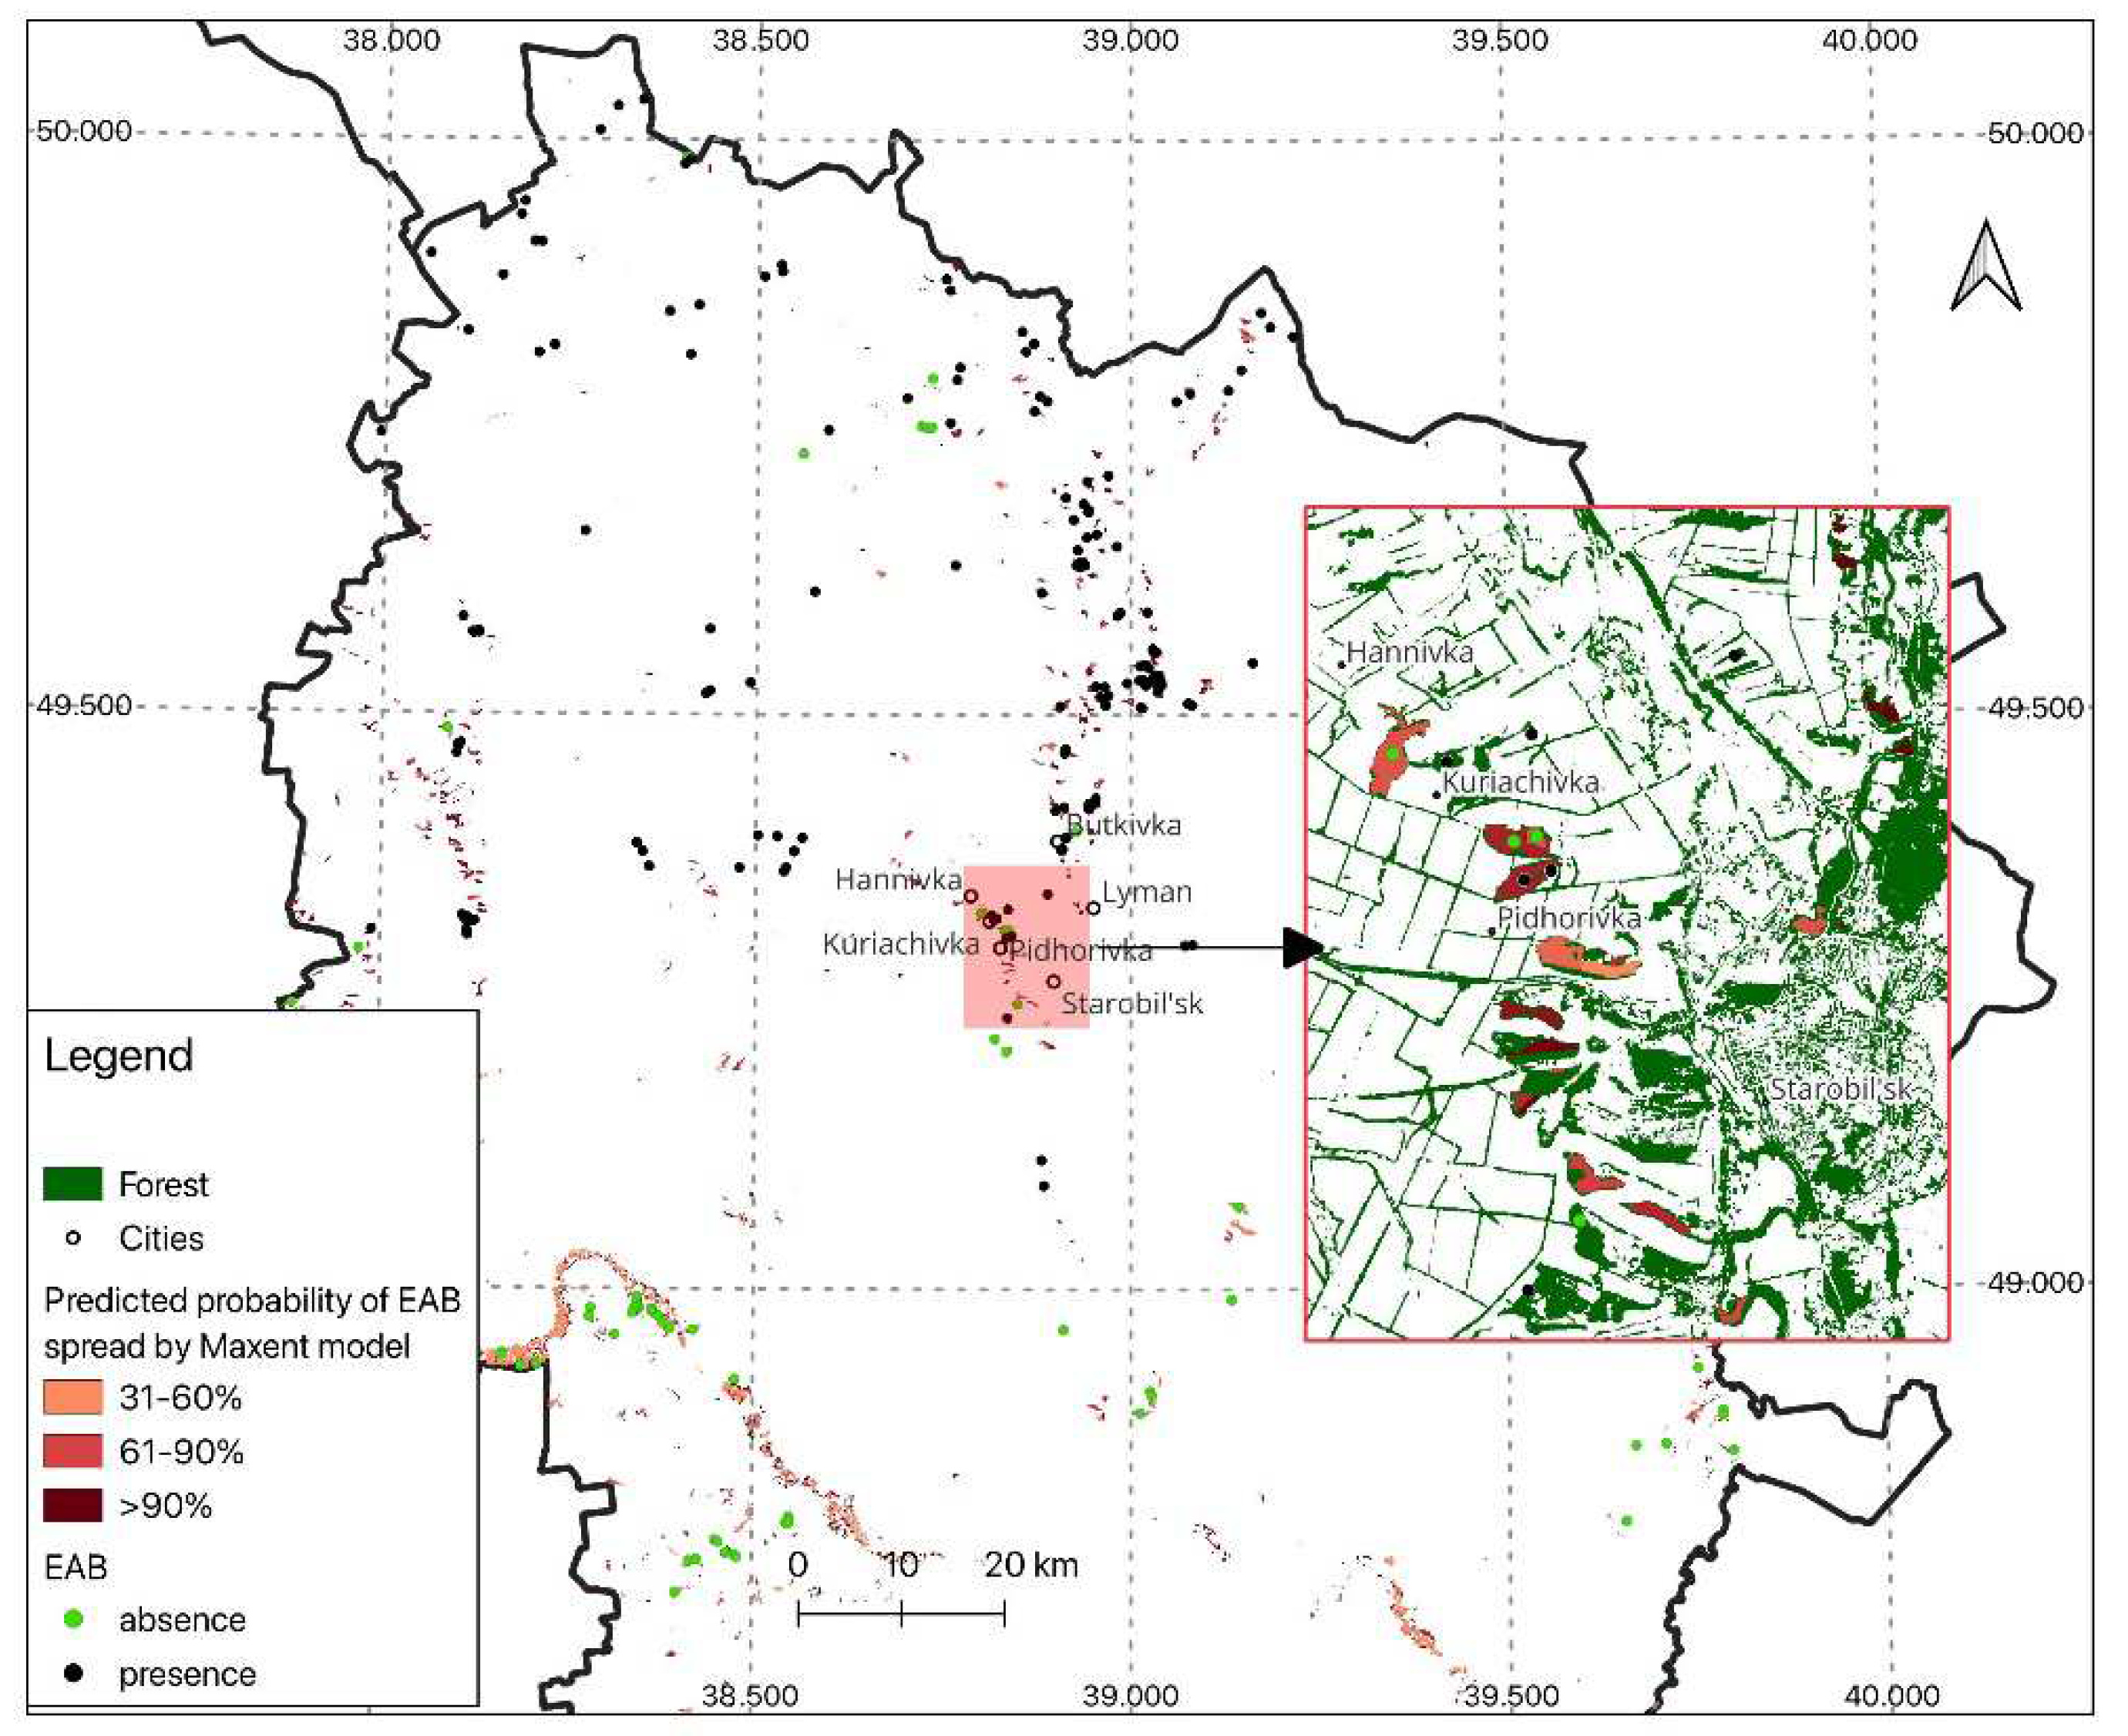
| Name | Latitude | Longitude |
| Hannivka | 38.787006 | 49.342424 |
| Kuriachivka | 38.811778 | 49.320327 |
| Pidhorivka | 38.826286 | 49.297213 |
| Starobil'sk | 38.897531 | 49.268241 |
| Butkivka | 38.902156 | 49.390202 |
| Lyman | 38.950438 | 49.332158 |
4. Discussion
5. Conclusions
Supplementary Materials
Author Contributions
Funding
Acknowledgments
Conflicts of Interest
References
- Wang, X.Y.; Yang, Z.Q.; Gould, J.R.; Zhang, Y.N.; Liu, G.J.; Liu, E.S. The biology and ecology of the emerald ash borer, Agrilus planipennis, in China. J. Insect Sci. 2010, 10, 128. [Google Scholar] [CrossRef]
- Haack, R.A.; Baranchikov, Y.; Bauer, L.S.; Poland, T.M. Emerald ash borer biology and invasion history. In Biology and Control of Emerald Ash Borer; Van Driesche, R.G., Reardon, R.C., Eds.; FHTET-2014-09 Department of Agriculture, Forest Service, Forest Health Technology Enterprise Team: Morgantown, WV, USA, 2015; Chapter 1; pp. 1–13.
- Herms, D.A.; McCullough, D.G. Emerald ash borer invasion of North America: History, biology, ecology, impacts, and management. Annu. Rev. Entomol. 2014, 59, 13–30. [Google Scholar] [CrossRef]
- Cipollini, D.; Rigsby, C.M.; Peterson, D.L. Feeding and development of emerald ash borer (Coleoptera: Buprestidae) on cultivated olive, Olea europaea. J. Econ. Entomol. 2017, 110, 1935–1937. [Google Scholar] [CrossRef]
- Orlova-Bienkowskaja, M.J.; Bienkowski, A.O. Southern range expansion of the emerald ash borer, Agrilus planipennis, in Russia threatens ash and olive trees in the Middle East and southern Europe. Forests 2022, 13, 541. [Google Scholar] [CrossRef]
- Sun, J.; Koski, T.M.; Wickham, J.D.; Baranchikov, Y.N.; Bushley, K. E. Emerald Ash Borer Management and Research: Decades of Damage and Still Expanding. Annual Review of Entomology 2024, 69, 239–258. [Google Scholar] [CrossRef]
- Drogvalenko, A.N.; Orlova-Bienkowskaja, M.J.; Bienkowski, A.O. Record of the Emerald ash borer (Agrilus planipennis) in Ukraine is confirmed. Insects 2019, 10, 338. [Google Scholar] [CrossRef]
- Orlova-Bienkowskaja, M.J.; Drogvalenko, A.N.; Zabaluev, I.A.; Sazhnev, A.S.; Peregudova, E.Y.; Mazurov, S.G.; Komarov, E.V.; Struchaev, V.V.; Martynov, V.V.; Nikulina, T.V.; et al. Current range of Agrilus planipennis Fairmaire, an alien pest of ash trees, in European Russia and Ukraine. Ann. For. Sci. 2020, 77, 1–14. [Google Scholar] [CrossRef]
- Meshkova, V.; Borysenko, O.; Kucheryavenko, T.; Skrylnyk, Y.; Davydenko, K.; Holusa, J. Potential westward spread of emerald ash borer, Agrilus planipennis Fairmaire, 1888 (Coleoptera: Buprestidae) from Eastern Ukraine. Forests 2023, 14, 736. [Google Scholar] [CrossRef]
- Strygun O.O.; Fedorenko, V.P.; Chumak, P.Y.; Vygera, S.M.;, Honcharenko, O.M., Anyol, O.H. Emerald ash borer (Agrilus planipennis Fairmaire) in Kyiv parks. In: Plant Protection and Quarantine in the 21st Century: Problems and Prospects. Proc. of the International scientific-practical conference dedicated to the anniversaries of the outstanding phytopathologists doctors of biological sciences, professors V.K. Panteleev and M.M. Rodygin (Kharkiv, State Biotechnological University, October 20−21, 2022), Kharkiv: 2022. 189−201. (ISBN 978-614-581-554-6).
- Skrylnyk, Y.Y., Kucheryavenko, T.V., Zinchenko, O.V. Distribution of the emerald ash borer Agrilus planipennis Fairmaire, 1888 (Coleoptera: Buprestidae) in the Kharkiv region. In: Plant Protection and Quarantine in the 21st Century: Problems and Prospects. Proc. of the International scientific-practical conference dedicated to the anniversaries of the outstanding entomologists doctors of biological sciences, professors O.O. Migulin and O.V. Zakharenko (Kharkiv, State Biotechnological Univer-sity, October 19−20, 2023). Zhytomyr, Ruta, 2023. 142–145. ISBN 978-617-581-597-7.
- Dang, Y.; Wei, K.; Wang, X.; Duan, J.J.; Jennings, D.E.; Poland, T.M. Introduced plants induce outbreaks of a native pest and facilitate invasion in the plants' native range: Evidence from the emerald ash borer. J. Ecol. 2022, 110, 593–604. [Google Scholar] [CrossRef]
- Tkach, V.; Rumiantsev, M.; Luk’yanets, V.; Kobets, O.; Pozniakova, S.; Obolonyk, I.; Sydorenko, S. Common ash (Fraxinus excelsior L.) in Ukrainian forests and its successful natural regeneration. For. Stud. | Metsanduslikud Uurim. 2020, 73, 26–42, ISSN 1406-9954. Journal homepage: Available online: http://mi.emu.ee/forestry.studies (accessed on 1 December 2023). [CrossRef]
- Davydenko, K.; Skrylnyk, Y.; Borysenko, O.; Menkis, A.; Vysotska, N.; Meshkova, V.; Olson, A.; Elfstrand, M.; Vasaitis, R. Invasion of Emerald ash borer Agrilus planipennis and ash dieback pathogen Hymenoscyphus fraxineus in Ukraine–A concerted action. Forests 2022, 13, 789. [Google Scholar] [CrossRef]
- Timms, L.L.; Smith, S.M.; De Groot, P. Patterns in the within-tree distribution of the emerald ash borer Agrilus planipennis (Fairmaire) in young, green-ash plantations of south-western Ontario, Canada. Agric. For. Entomol. 2006, 8, 313–321. [Google Scholar] [CrossRef]
- Cappaert, D.; McCullough, D.G.; Poland, T.M.; Siegert, N.W. Emerald ash borer in North America: A research and regulatory challenge. Am. Entomol. 2005, 51, 152–165. [Google Scholar] [CrossRef]
- Turgeon, J.J.; Fidgen, J.G.; Ryall, K.L.; Scarr, T.A. Estimates of emerald ash borer (Coleoptera: Buprestidae) larval galleries in branch samples from asymptomatic urban ash trees (Oleaceae). The Canadian Entomologist 2016, 148(3), 361–370. [CrossRef]
- Tluczek, A.R.; McCullough, D.G.; Poland, T.M. Influence of host stress on emerald ash borer (Coleoptera: Buprestidae) adult density, development, and distribution in Fraxinus pennsylvanica trees. Environ. Entomol. 2011, 40, 357–366. [Google Scholar] [CrossRef]
- Duan, J.J.; Watt, T.; Taylor, P.; Larson, K.; Lelito, J.P. Effects of ambient temperature on egg and larval development of the invasive emerald ash borer (Coleoptera: Buprestidae): Implications for laboratory rearing. J. Econ. Entomol. 2013, 106, 2101–2108. [Google Scholar] [CrossRef]
- Caitano, B.; Chaves, T.P.; Dodonov, P.; Delabie, J.H.C. Edge effects on insects depend on life history traits: A global meta-analysis. J. Insect Conserv. 2020, 24, 233–240. [Google Scholar] [CrossRef]
- National Atlas of Ukraine [Maps]. Kyiv: DNVP Cartography, 2007. 440 p.
- Ostapenko, B.F.; Ulanovsky, M.S. Typological Diversity of Forests in Ukraine. Steppe. Kharkiv: Kharkiv State Agrarian University, 1999. 157 p.
- Zubov A. R., Zubova L. G. The climate of Luhansk and its applied aspects: monograph. Luhansk: Publishing house of V. Dahl Luhansk National University. 2016. 180 p.
- Bondar, O.B.; Tkach, L.I.; Chuykova, O.O.; Zolotarova, A.S. Typological diversity of forests in the Siversky Donets river basin in the territory of Luhansk region. Ukrainian Journal of Ecology, 2017, 7(3), 120–127.
- Bila, Yu.; Tupchiy, O.; Yuhnovskyi, V. Components of optimizing protective forest density in agro-landscapes of the northern (“bayrak”) Steppe in Ukraine. Modern challenges and current issues in forestry education, science, and production: Proceedings of the II International Scientific and Practical Internet Conference (Bila Tserkva, April 15, 2022). Bila Tserkva National Agrarian University, 2022, 34–36.
- Phillips, S.J. 2014. A Brief Tutorial on Maxent [Internet]. Available online: http:// www.cs.princeton.edu/~schapire/maxent/ (accessed on 23 June 2023).
- Phillips, S.J.; Dudik, M.; Schapire, R.E. Maxent Software for Modeling Species Niches and Distributions. Available online: http://biodiversityinformatocs.amnh.org/open_source/maxent/ MaxEnt version 3.4.4 (accessed on 1 December 2023).
- Elith, J.; Graham, C.H. Do They? How Do They? WHY Do They Differ? On Finding Reasons for Differing Performances of Species Distribution Models. Ecography 2009, 32, 66–77. Available online: https://www.jstor.org/stable/30244651 (accessed on 4 August 2022). [CrossRef]
- Zanaga, D.; Van De Kerchove, R.; Daems, D.; De Keersmaecker, W.; Brockmann, C.; Kirches, G.; Wevers, J.; Cartus, O.; Santoro, M.; Fritz, S.; Lesiv, M.; Herold, M.; Tsendbazar, N.E.; Xu, P.; Ramoino, F.; Arino, O. 2022. ESA WorldCover 10 m 2021 v200. [CrossRef]
- QGIS 3.28.1. Available online: https://qgis.org/en/site/ (accessed on 23 September 2023).
- Van Erkel, A.R.; Peter, M. Receiver operating characteristic (ROC) analysis: Basic principles and applications in radiology. Eur. J. Radiol. 1998, 27, 88–94. [Google Scholar] [CrossRef]
- Orlova-Bienkowskaja, M.J.; Bieńkowski, A.O. Minimum winter temperature as a limiting factor of the potential spread of Agrilus planipennis, an alien pest of ash trees, in Europe. Insects 2020, 11, 25. [Google Scholar] [CrossRef]
- Orlova-Bienkowskaja, M.J.; Bieńkowski, A.O. Low heat availability could limit the potential spread of the Emerald ash borer to Northern Europe (Prognosis Based on Growing Degree Days per Year). Insects 2022, 13, 52. [Google Scholar] [CrossRef]
- Dang, Y.Q.; Zhang, Y.L.; Wang, X.Y.; Xin, B.; Quinn, N.F.; Duan, J.J. Retrospective analysis of factors affecting the distribution of an invasive wood-boring insect using native range data: The importance of host plants. J. Pest Sci. 2021, 94, 981–990. [Google Scholar] [CrossRef]
- Liu, H.; Bauer, L.S.; Miller, D.L.; Zhao, T.; Gao, R.; Song, L.; Luan, Q.; Jin, R.; Gao, C. Seasonal abundance of Agrilus planipennis (Coleoptera: Buprestidae) and its natural enemies Oobius agrili (Hymenoptera: Encyrtidae) and Tetrastichus planipennisi (Hymenoptera: Eulophidae) in China. Biol. Control. 2007, 42, 61–71. [Google Scholar] [CrossRef]
- Liebhold, A.M.; Brockerhoff, E.G.; Kalisz, S.; Nuñez, M.A.; Wardle, D.A.; Wingfield, M.J. Biological invasions in forest ecosys-tems. Biol. Invasions 2017, 19, 3437–3458. [Google Scholar] [CrossRef]
- Liang, L.; Fei, S. Divergence of the potential invasion range of emerald ash borer and its host distribution in North America under climate change. Clim. Chang. 2014, 122, 735–746. [Google Scholar] [CrossRef]
- Webb, C.R.; Mona, T.; Gilligan, C.A. Predicting the potential for spread of emerald ash borer (Agrilus planipennis) in Great Britain: What can we learn from other affected areas? Plants People Planet 2021, 3, 402–413. [Google Scholar] [CrossRef]
- Sobek-Swant, S.; Crosthwaite, J.C.; Lyons, D.B.; Sinclair, B.J. Could phenotypic plasticity limit an invasive species? Incomplete reversibility of mid-winter deacclimation in emerald ash borer. Biol. Invasions 2012, 14, 115–125. [Google Scholar] [CrossRef]
- Valenta, V.; Moser, D.; Kuttner, M.; Peterseil, J.; Essl, F. A high-resolution map of emerald ash borer invasion risk for south-ern central Europe. Forests 2015, 6, 3075–3086. [Google Scholar] [CrossRef]
- BenDor, T.K.; Metcalf, S.S.; Fontenot, L.E.; Sangunett, B.; Hannon, B. Modeling the spread of the emerald ash borer. Ecol. Model. 2006, 197, 221–236. [Google Scholar] [CrossRef]
- Flø, D.; Krokene, P.; Økland, B. Invasion potential of Agrilus planipennis and other Agrilus beetles in Europe: Import pathways of deciduous wood chips and MaxEnt analyses of potential distribution areas. EPPO Bull. 2015, 45, 259–268. [Google Scholar] [CrossRef]
- Selikhovkin, A.V.; Popovichev, B.G.; Merkuryev, S.A.; Volkovitsh, M.G.; Vasaitis, R.; Musolin, D.L. Invasive populations of Emerald ash borer Agrilus planipennis Fairmaire, 1888 (Coleoptera: Buprestidae) in Saint Petersburg, Russia: A “Hitchhiker”? Insects 2021, 13, 191. [Google Scholar] [CrossRef] [PubMed]
- Orlova-Bienkowskaja, M.J.; Bienkowski, A.O. The life cycle of the emerald ash borer Agrilus planipennis in European Russia and comparisons with its life cycles in Asia and North America. Agric. For. Entomol. 2016, 18, 182–188. [Google Scholar] [CrossRef]
- Allison, J.D.; ·Paine, T.D.; ·Slippers, B.; Wingfield, M.J. (Editors). Forest Entomology and Pathology. Volume 1: Entomology. Springer, 2023. 810 pp. ISBN 978-3-031-11552-3 ISBN 978-3-031-11553-0 (eBook). [CrossRef]
- Orlova-Bienkowskaja, M.J.; Bieńkowski, A.O. Modeling long-distance dispersal of emerald ash borer in European Russia and prognosis of spread of this pest to neighboring countries within next 5 years. Ecol. Evol. 2018, 8, 9295–9304. [Google Scholar] [CrossRef] [PubMed]
| Variables | AUC | Contribution, % | Permutation, % | Aggregated contribution, % |
|---|---|---|---|---|
| Age of trees, years | 0.7 | 38.9 | 31.4 | 38.9 |
| Area of forest subcompartment, ha | 0.6 | 13.9 | 11.2 | 52.8 |
| Mean height of trees, m | 0.7 | 11.2 | 17.1 | 64.0 |
| The proportion of Fraxinus excelsior in the stand composition, % | 0.6 | 10.6 | 4.3 | 74.6 |
| Hygrotope index (humidity level), point | 0.6 | 8.3 | 13.5 | 82.9 |
| Site index class, point | 0.5 | 5.8 | 8.3 | 88.6 |
| Number of non-forested lands neighboring subcompartment, point | 0.6 | 5.3 | 3.6 | 93.9 |
| Relative density of stocking, unit fraction | 0.6 | 2.1 | 2.6 | 96.0 |
| Mean diameter of trees, cm (DBH) | 0.6 | 1.8 | 5.5 | 97.8 |
| Trophotope index (soil richness level), point | 0.5 | 1.4 | 1.0 | 99.1 |
| The presence of any Fraxinus species in the stand composition, 1/0 | 0.6 | 0.9 | 1.4 | 100.0 |
| Probability | Area, ha | Proportion of area, % | Cumulative probability |
Cumulative proportion, % |
|---|---|---|---|---|
| 0–30 | 4007 | 25 | 0–30 | 25 |
| 31–60 | 3286 | 20 | 31–60 | 20 |
| 61–90 | 5691 | 35 | 31–90 | 55 |
| >90 | 3280 | 20 | >30 | 75 |
| Total | 16264 | 100 | – | 100 |
Disclaimer/Publisher’s Note: The statements, opinions and data contained in all publications are solely those of the individual author(s) and contributor(s) and not of MDPI and/or the editor(s). MDPI and/or the editor(s) disclaim responsibility for any injury to people or property resulting from any ideas, methods, instructions or products referred to in the content. |
© 2024 by the authors. Licensee MDPI, Basel, Switzerland. This article is an open access article distributed under the terms and conditions of the Creative Commons Attribution (CC BY) license (http://creativecommons.org/licenses/by/4.0/).


