
Submitted:
07 February 2024
Posted:
08 February 2024
You are already at the latest version
Abstract
Sepsis is a serious disease that can lead to mortality. The etiology of the disease is connected to how the body as a host reacts toward microbes such as bacteria, viruses, and fungi invasion. Current research shows that during sepsis, the reaction toward microbe attacks takes two main phases. The first is known as a cytokine storm, while the second is a vicious cycle of pro-inflammatory responses followed by a strict anti-inflammatory response led by CD4+ Tregs. Various immunomodulatory therapies have been proposed to break the cycle of pro- and anti-inflammatory reactions to sepsis. However, clinical trials did not show promising results, indicating further research into the mechanism that Treg uses to inhibit proinflammatory reactions. We used next-generation sequencing (NGS) analysis of bulk RNA-seq and single-cell RNA-seq data to examine the exact molecular pathways used by Treg to inhibit the immune response in sepsis. Our approach identified ACOD1 (Aconitate Decarboxylase 1) as a primary mediator of Treg suppression of immune cells. We identified and validated CD36 as a downstream target of ACOD1. CD36 is a known metabolite regulator in Tregs. Taken together, our results indicate that targeting ACOD1 could prove valuable in regulating Treg function during sepsis.
Keywords:
CD4
; sepsis
; Treg
; metabolism
Introduction
Growing evidence associates sepsis with a network of dysfunctional processes, including a poorly coordinated immune system response[1]. Sepsis is a serious organ dysfunction that results in millions of fatal cases per year[2]. This disease can be caused by a variety of infections, including bacterial, viral, and fungal pathogens [3]. Its main symptoms include fever, low blood pressure, an abnormal resting heartbeat tachycardia, and an uncharacteristically high white blood cell count[4]. The immune system during sepsis contributes to systemic inflammation, tissue damage, and organ failure affecting the kidney, respiratory system, the heart, or the brain[5]. Advances in understanding the pathophysiology of sepsis have led to the development of targeted therapies, such as immunomodulatory agents, that aim to restore immune system balance and improve patient outcomes[6]. However, various trials utilizing immune-modulatory agents to tackle sepsis have not produced promising results, highlighting the need for continued research to better understand how to challenge this complex disease [7].
Tregs are essential in the pathophysiology of septic complications by suppressing the adaptive immune response. Currently, the sepsis course of diseases is defined by an initial cytokine storm caused by the innate immune system response to invading microbes. This phase is usually followed by a cycle of hyper-hypoimmune reactions. This cycle results in cell exhaustion and cell death. Intriguingly, postmortem studies have discovered a significant reduction in the numbers of CD4 and CD8 T cells, pinpointing the role of dysfunctional Treg as a critical obstacle toward homeostasis during sepsis. A higher frequency of Tregs has been found in septic shock patients' blood. Additionally, a negative link between the frequency of Tregs and sepsis severity is evident in sequential organ failure, among other parameters [8,9]. These findings were further supported by an animal investigation that found that, in contrast to sham mice, the percentages of CD4+CD25+ Tregs were considerably higher 24 hours after abdominal sepsis induction using cecal ligation and puncture (CLP)[10,11].
How Tregs become dysfunctional in sepsis is currently unknown. In normal conditions, Tregs are considered the guardians of the immune system; they prevent excessive immune responses by suppressing other immune cells. The suppression mechanisms can take two forms. First, known as the indirect form, Tregs inhibit dendritic cells through various pathways, including CTLA4, CD28, CD80, CD86, LFA1, A20, CD40-CDO4L, neuropilin 1, and LAG3 [12]. CTLA-4 and Foxp3 were reported to be highly expressed in the blood of septic patients [13]. Direct inhibition of CD4+ and CD8+ T cells includes the production of suppressive cytokines such as TGFβ, IL10, and IL35, consumption of cytokines such as IL2, and induction of apoptosis through the TRAIL, CD3, CD46, CD25, and BIM pathways. Interestingly, elevated IL-10 and TGF-β levels have been reported in the blood of septic patients [14,15]. Additionally, Tregs can regulate ATP and ADP by interacting with CD73, CD39, APRT, A2A receptors, and p2ry11 receptors. Furthermore, Tregs can also regulate NFAT pathways through the IL4, ICER, PPARγ, GIT, and CBCLB pathways. It can also regulate calcium signaling in the responding cells by controlling the NFKB, PPP3CA, PPP3CB, PPP3CC, and IKAA pathways. Treg is known to be regulated by FoxP3 [16,17]. However, FoxP3 levels in many cases in transcriptomic studies of blood do not necessarily mirror real cases as the number of CD4+ and CD25+ FoxP3 is limited. The exact method by which the Treg function is destabilized remains unknown. scRNA-seq has the advantage of allowing inspection of Treg cells on molecular levels with higher accuracy.
In this report, we investigated the genetic networks controlled by FoxP3 that ultimately lead to excessive suppression of immune cells by Tregs. To do that, we analyzed a host of microarray, bulk RNA seq, and scRNA-seq studies, as well as extensive evolutionary studies. Our results pinpointed the role of a dysfunctional metabolic network in Tregs, manifested by increased itaconate production through the upregulation of the gene ACOD1 through putative interaction with other genes associated with metabolism and expressed particularly in the mitochondria, such as CD36.
2. Methods
Our workflow consisted of the following workflow. First, we analyzed the genomic pathway upregulated in septic blood samples. Then we focused on deciphering the association between Treg and the resulting upregulated pathway through scRNA-seq analysis by conducting two different analyses. (i) We analyzed the difference in expression of genes of interest resulting from the previous section utilizing the FoxP3 and FoXP3Δ datasets; (ii) This was followed by a co-localization analysis of genes of interest with FoxP3. Then we validated our hypothesis for the involvement of the resulting genes of interest in Treg function.
Datasets
We analyzed four different public datasets. First, we conducted a bulk RNA-seq analysis using the public microarray GSE65088 [18]. The dataset included ex vivo blood samples that were divided into control and treated groups. The treated groups contained samples that were subjected to one of four types of infection, namely two bacterial microbes (Staphylococcus aureus, Escherichia coli) and two fungal pathogens (Candida albicans, Aspergillus fumigatus), while the control blood samples were treated by HBSS. All samples were treated for 4–8 hours, followed by standard processing using RNA isolation, followed by bulk RNA-seq sequencing using Illumina [18]. After that, To investigate the role of Acod1 in Tregs, we compared the transcriptome of FoxP3WT Tregs and Foxp3KO Tregs using the public dataset (GEO: GSE176236) [19]. In this dataset, FoxP3WT Tregs were isolated from the lamina propria of Foxp3-DTR-GFP+ mice. Whereas in the case of knock-out mice, Foxp3DTR-GFP/loxp-Thy1.1-STOP-loxp-GFP markers were used to isolate Foxp3KO. 10X sequencing was followed according to the manufacturer's instructions. The third dataset included five healthy controls and five patients with proven sepsis from the Emergency Department, Surgical Critical Care Division, Tongji Trauma Center, Tongji Hospital, and Tongji Medical College. We examined scRNA-seq from the complete blood transcriptome of these patients (GSE224095). In the fourth dataset, eight-week-old WT or Irg1-/-C57bl/6 mice were infected with a combination of the 17 host-adapted P. aeruginosa clinical isolates (106 total CFU per animal in 50 uL) or WT PAO1. The mice were sacrificed sixteen hours after infection, their lungs were removed, and single-cell suspensions of the lungs were prepared, followed by 10x scRNA-seq.
RNA-seq analysis
RNA-seq analysis was done in R using limma [20]. Briefly, we used the limma RNA-seq differential gene expression approach to compute the non-parametric approximations of mean-variance relationships. This made it possible for us to calculate the weights and empirical Bayes shrinkage of variance parameters for a linear model analysis of log-transformed counts. Differential expression analysis was performed to determine the differences in gene expression between infected and non-infected samples by fitting a linear model to quantify the variability in the data using lmFit. First, the statistically significant DEGs were used for gene set enrichment analysis (GSEA) based on gene ontology biological process databases, GO (Biological Process, Cellular Component, and Molecular Function), KEGG (Pathways), Reactome (Pathways), and WikiPathways. The GeneTrail3 software was used for this. For this investigation, upregulated genes from each group were uploaded to the server. A gene enrichment analysis was conducted using overrepresentation. Over-representation analysis (ORA) evaluates if a group of variables is more common in a set of results than we would anticipate by chance. The ORA was run with its default settings to control the false discovery rate. Second, using Cytoscape, we used BiNGO to find pathways that are overrepresented in infected septic samples. BiNGO is built as a plugin for Cytoscape, which is an open-source bioinformatics software platform [21].
scRNA-seq analysis
Cell clustering was achieved, as previously noted, using the Seurat R tool[22]. Specifically, cell clustering was performed using the nonlinear dimensional reduction methodology in conjunction with the Uniform Manifold Approximation and Projection (UMAP) method. We analyzed each of the cell clusters using paired differential expression analysis, using parameters recommended for data with batch effect, to find flag genes of the cell clusters with average fold change (FC) expression compared with other included clusters >2. Our study utilized Library Seurat and dplyr in R to analyze quality control metrics, filter cells, normalize data, cluster cells, and identify cluster biomarkers. Low-quality cells were removed using a threshold of 200 to 7,000 genes per cell, and cells with over 10% of the mitochondrial genome were excluded. The "sctransform" package was used for normalization, and the "RunUMAP" function was used for clustering cells. The "FindAllMarkers" function identified specific markers for each cell cluster, and the "DoHeatmap" function displayed the top genes in each cluster. The "VlnPlot" function provided expression probability distributions across cell clusters.
Results
We conducted several analyses of public data to pinpoint how Tregs contribute to sepsis. First, we analyzed blood samples infected with various types of bacteria and fungi. We found that the genes differ significantly by the type of infection. However, in general, we found various differentiated genes that were common to all treated samples investigated. For example, in the case of C. albicans, LAG3, CD40, and A2A seem to be upregulated, indicating Treg could be suppressing dendritic cells in sepsis through indirect pathways (Figure 1A,B). Several proinflammatory markers were upregulated, such as IL6, TNF, and IL1 (Figure 1B). The Treg effect was also found in the overrepresentation of various Treg pathways, such as IL10 and IL4, in the OVA (Figure 1C). Interestingly, our results also showed that several genes related to metabolism were also upregulated, such as Acod1 (Aconitate decarboxylase 1) (Figure 1B,D).
Next, we analyzed the public GEO (GSE176236) to investigate the effect of FoxP3 on Treg. We discovered that Acod1 is tightly controlled by FoxP3 in Tregs, and it could be playing a role in regulation of Rorc inhibition of FoxP3 in an auto-inhibition loop. To investigate the role of Acod1 in Tregs, we compared the transcriptome of FoxP3WT Tregs and Foxp3KO Tregs using the public dataset (GEO: GSE176236). In this dataset, FoxP3WT Tregs were isolated from the lamina propria of Foxp3-DTR-GFP+ mice. Whereas in the case of knock-out mice, Foxp3DTR-GFP/loxp-Thy1.1-STOP-loxp-GFP markers were used to isolate Foxp3KO. We performed RNA-seq analysis using edgeR and Glimma in R. We found that the samples separate according to their PCA analysis, showing that FoxP3 is playing a primary role in determining the differentiation pattern of colon-induced Tregs (Figure 2A). Acod1 as well as two of its upstream regulators (e.g., Phlpp1 and Trat1 that control Acod1 expression through regulation of PKC) are upregulated in the WT Tregs. We found that Cebpb, which is directly upregulating Acod1, is also upregulated in WT Tregs (Figure 2B). Similarly, Swap70, which is known to upregulate Nfkβ, which in turn positively regulates ACOD1, is upregulated in the WT Tregs (Figure 2B,C). Conversely, IL17A and IL6 were downregulated; however, the Th17 pathway was enriched, confirming selected genes role in Treg function (Figure 2D).
After that, we analyzed single cells from peripheral immune cells extracted from the colon. We discovered that ACOD1 is particularly expressed in Tregs (Figure 3A,B).
Following that, we conducted a thorough analysis of the difference in transcriptomic between control and sepsis patients on a single cell level. Our results revealed that the cells can be clustered into 20 different types. Notably, most of the clusters showed mixtures of the two conditions, which indicate that they are the same type of cells that have changed their expression levels based on sepsis. However several clusters were only upregulated in one of the conditions, such as clusters 12 and 17 which seem to be exclusively expressed in sepsis (Figure 4A). To focus on FoxP3+ Tregs, we compared clusters based on the differential expression between them. We found that FoxP3 and CD4+ are both differentially expressed in clusters 1,2,5,8,13,16 and 17 Shifting our focus to ACOD1, we found that it is exclusively expressed in clusters 3,8 and 13 (Figure 4B). Hence we conducted a deferential expression analysis based on clusters. Our analysis revealed that FoxP3 and ACOD1 are solely deferentially expressed in cluster 8 between sepsis and control patients. Although CD4 is highly expressed in cluster 8 in relationship to other clusters we did not detect a difference in the expression of CD4 in cluster 8, indicating that CD4+ is ubiquitously expressed in this particular cluster. Additionally, this information indicates that there is no difference in the CD4+ FOXP3+ACOD1 frequency cluster, however, the difference is the expression of ACOD1 and FOXP3 between the two conditions (Figure 4C).
We looked deeper into the data, by comparing other genes that are also expressed between sepsis and non-sepsis patients in the cluster phenotyped as CD4+FOXP3+ACOD1+ T cells. The gene list of differentially expressed genes included LYZ, S100A8, GPX1, FOS, MND1, CD36, NRG1, and CST3 among others (Figure 5A). To assess the location of ACOD1 within the cell, we mined Human Atlas for its expression, our investigations indicate that ACOD1 is likely to be expressed in the mitochondria (Figure 5B).
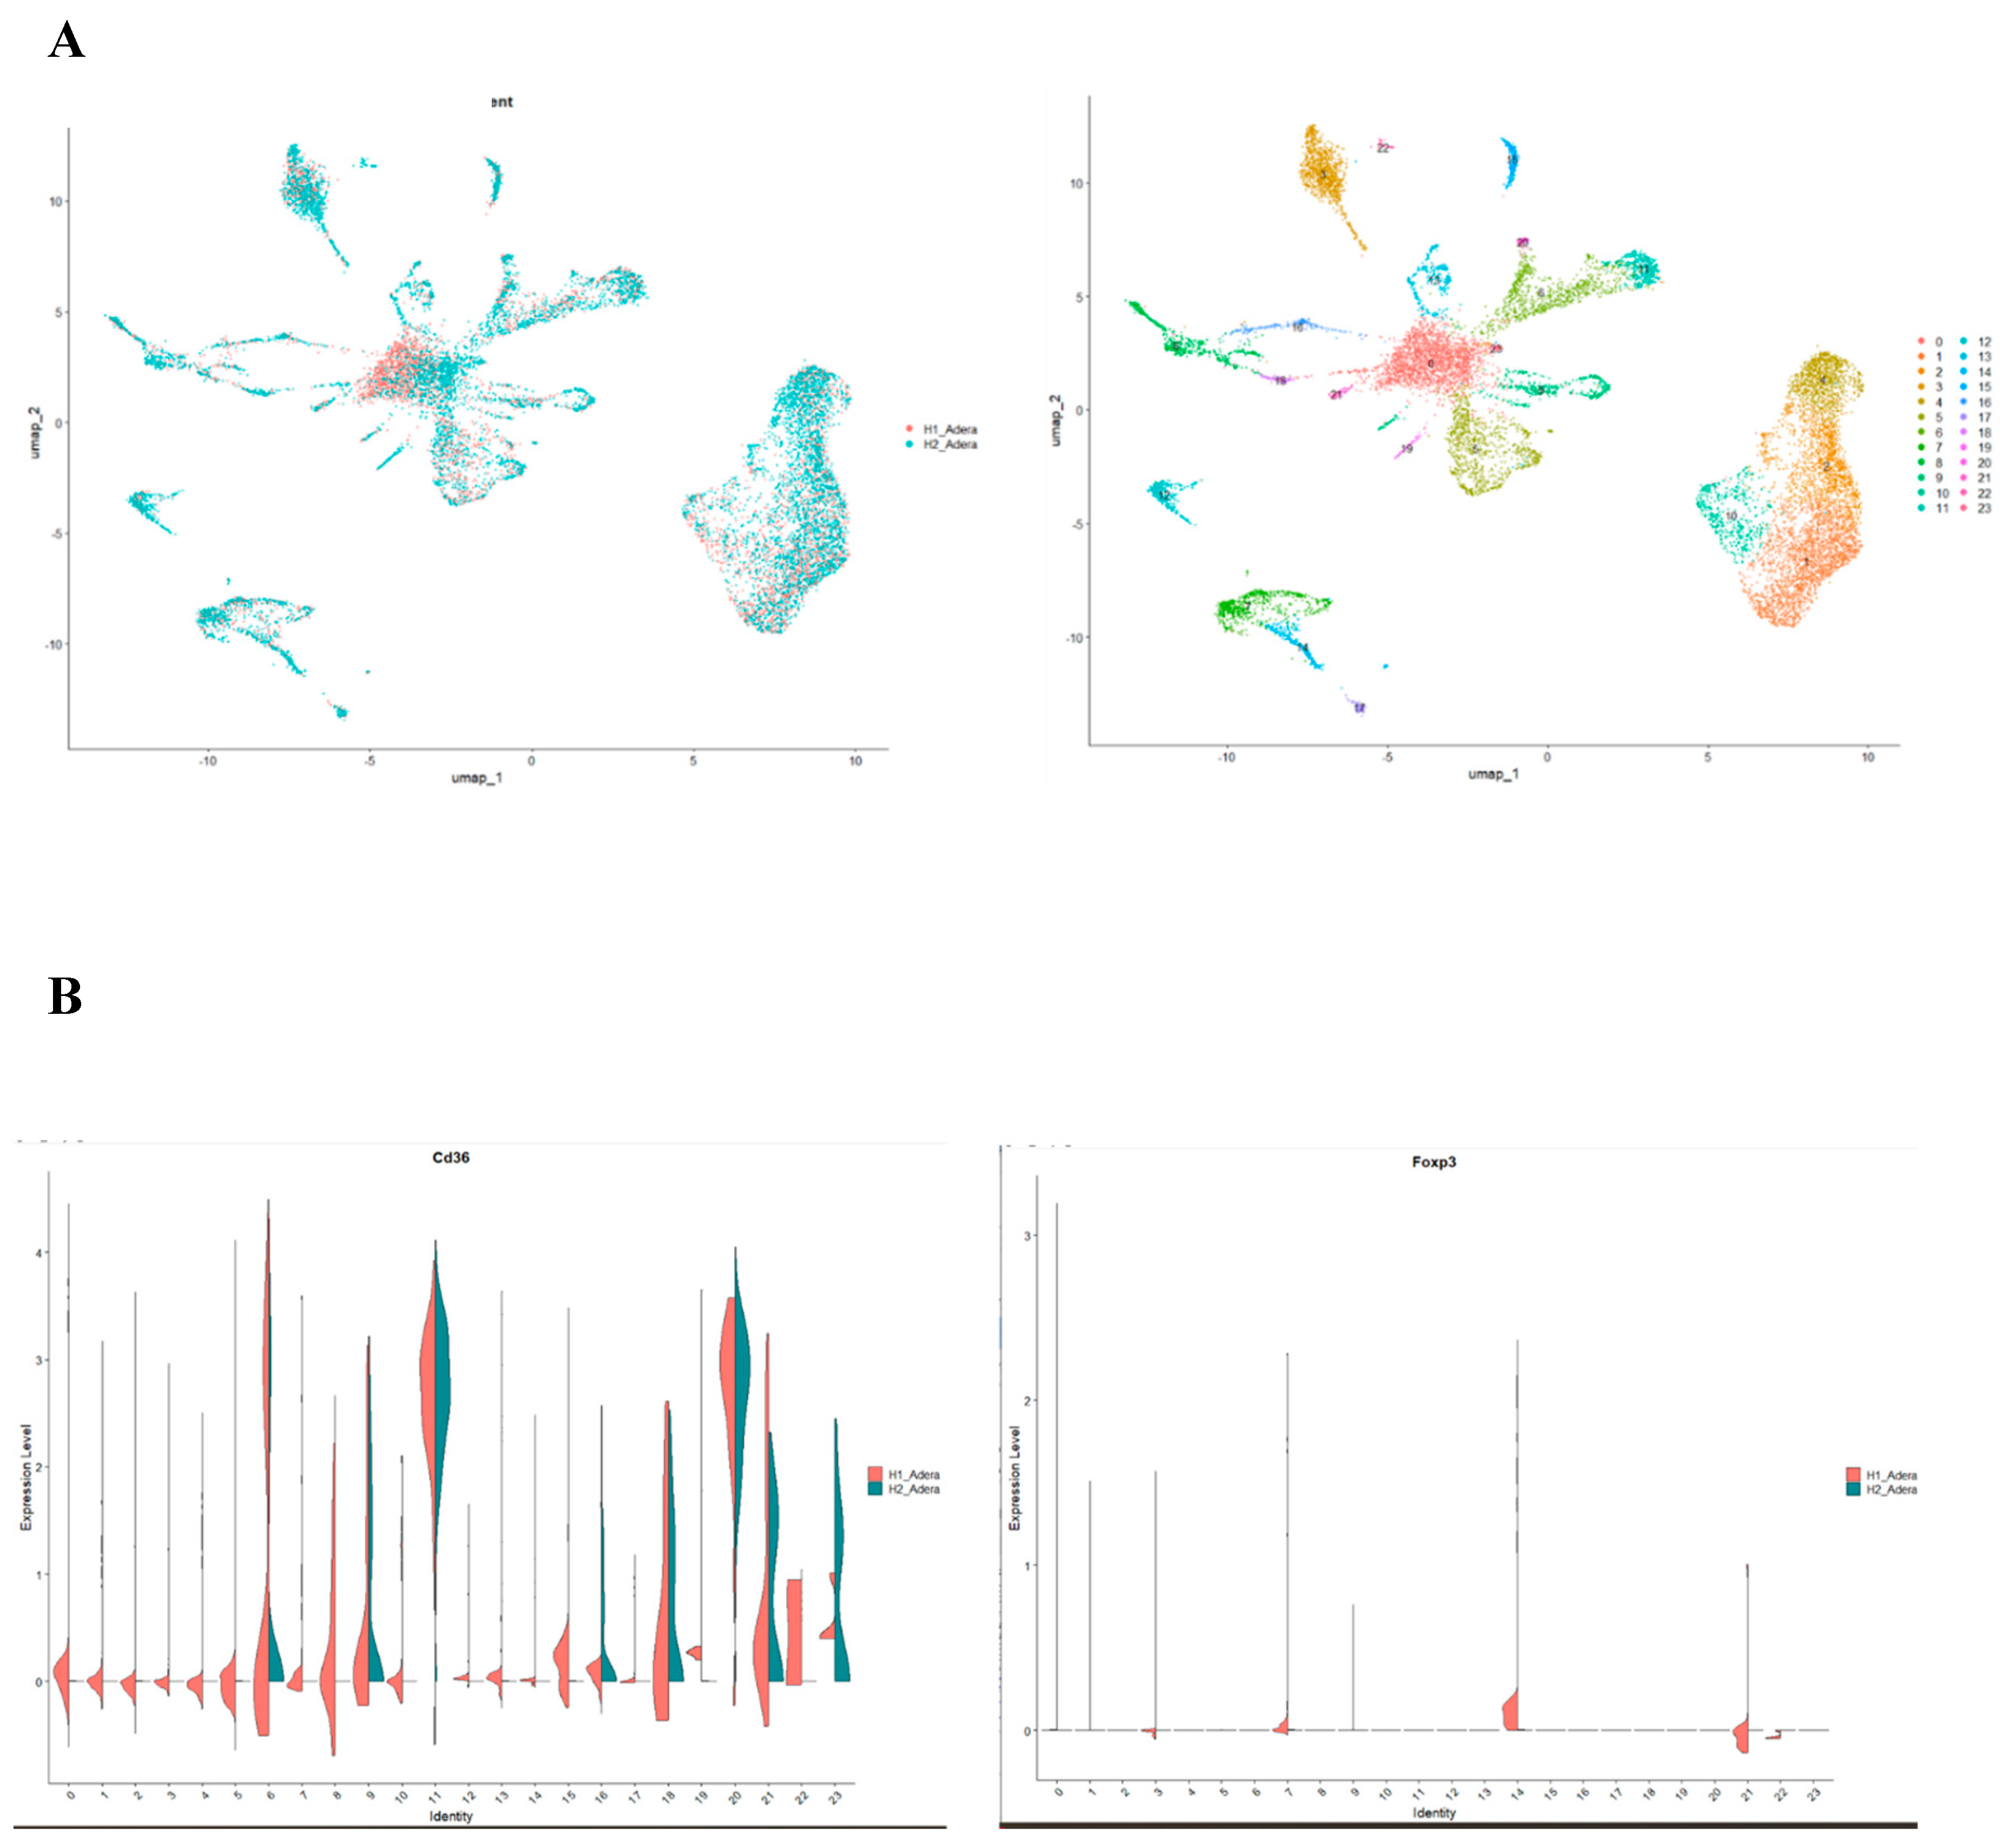
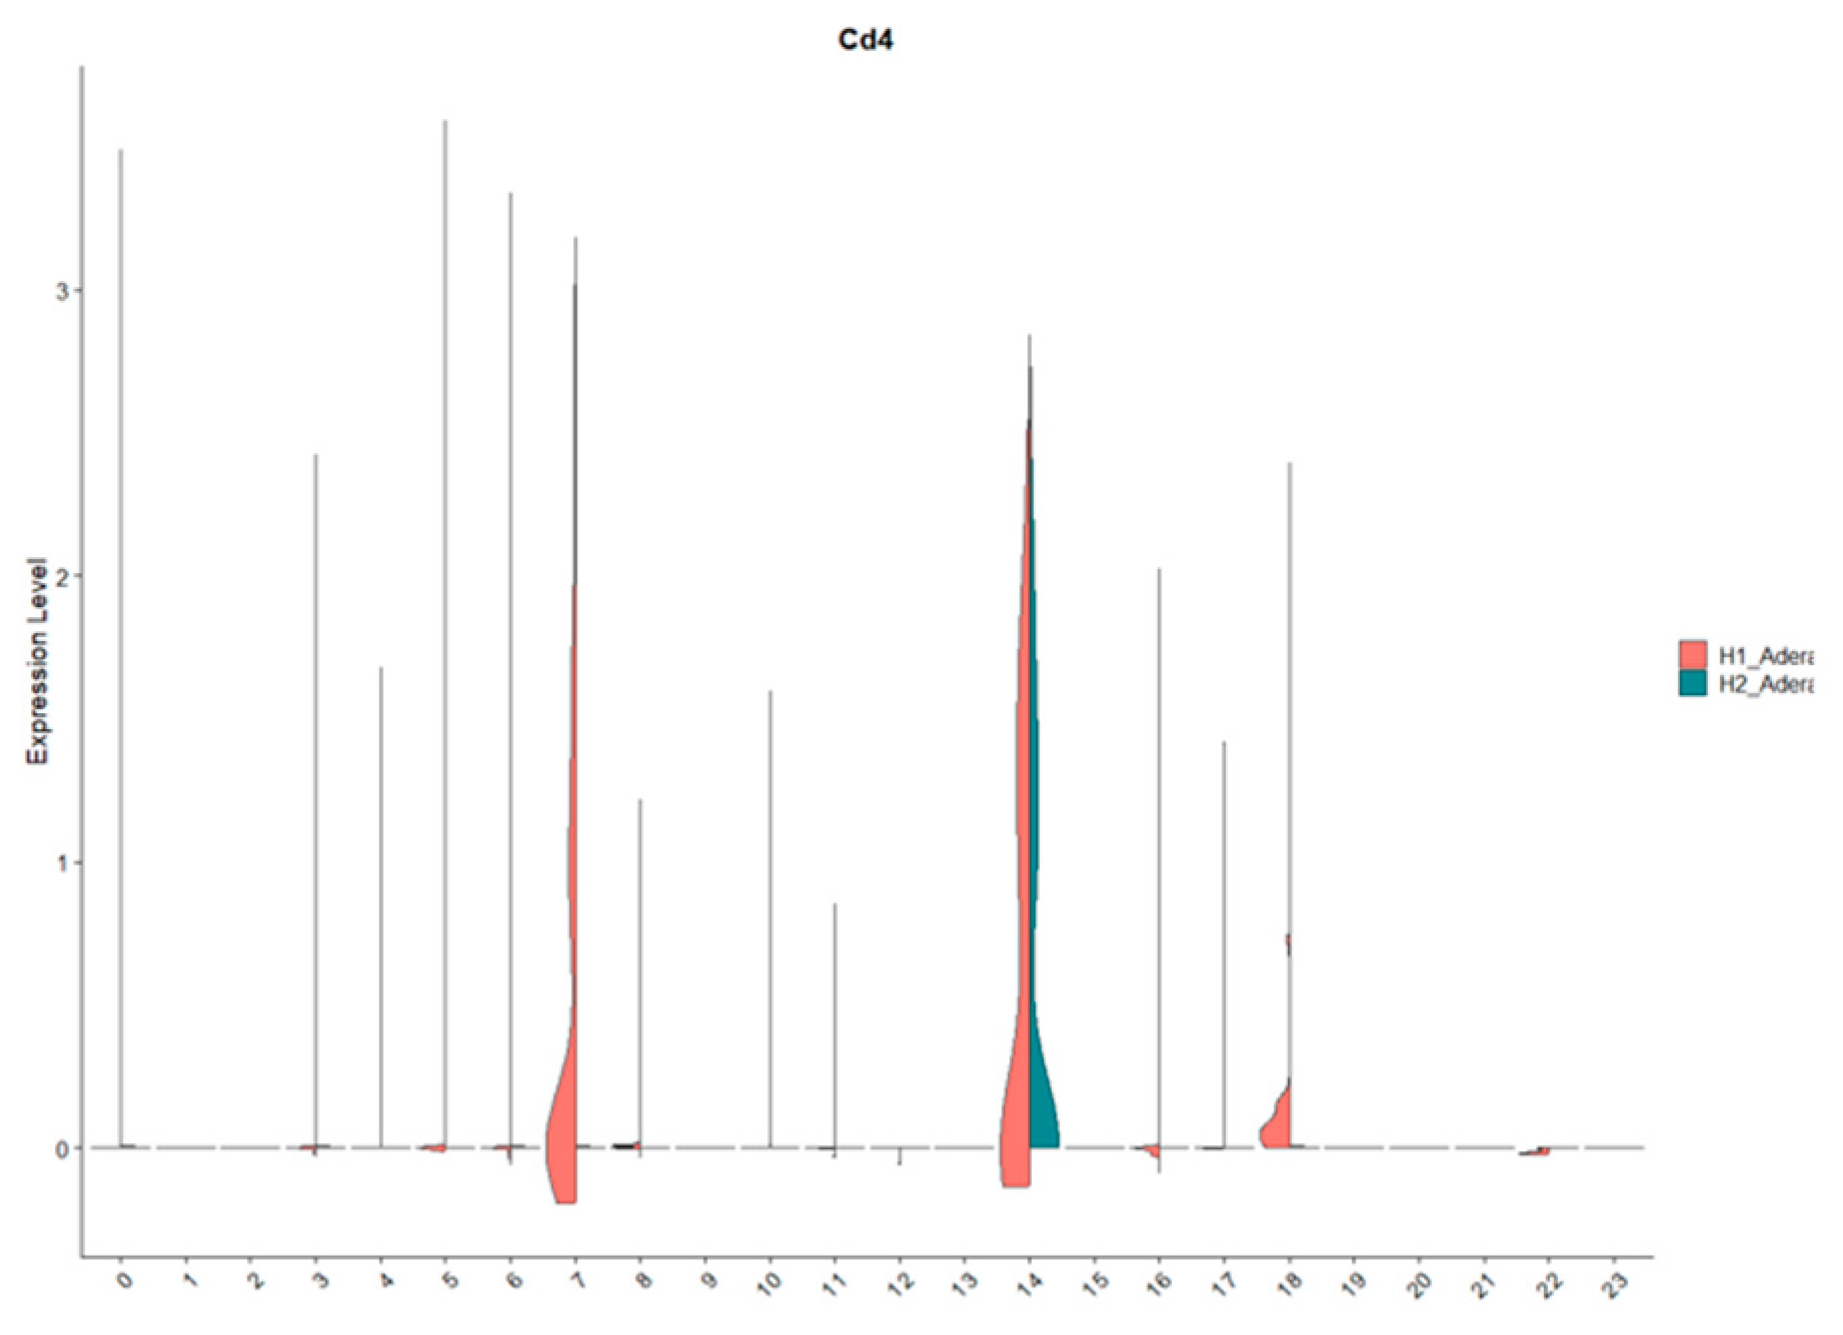
Finally, we investigated the effect of ACOD1 using scRNA-seq. In this interesting dataset, mice with Acod1 WT or Acod1-/- were infected to induce sepsis. Our results were able to identify 23 different cell clusters (Figure 6A). Interestingly, we found that FoxP3 expression is affected by knocking on ACOD1 in sepsis (Figure 6B,C). This downregulation was also seen in CD4 expression and downstream metabolic interactors of ACOD1, such as CD36 (Figure 6B,C).
Discussion
Our results revealed that various metabolic pathways are enriched in sepsis. Sepsis is a vicious disease that affects millions of lives around the world[23]. Its symptoms progress from a minor infection to sequential organ failure, which can end in mortality. The etiology of sepsis consists of three main phases, namely, a cytokine storm followed by a malicious cycle of pro- and anti-inflammatory responses. The reason behind Treg's continuous activation in sepsis is currently unknown [9]. We investigated this question by conducting a bulk RNA-seq analysis using blood samples infected with sepsis-inducing microbes. Our results indicated that the IL4 and IL10 pathways are enriched in sepsis (Figure 1). One of the main functions of IL10 is that it can resist switching metabolic pathways induced by inflammatory stimuli, where it reduces oxidative phosphorylation and glycolysis [24,25]. Also, by suppressing mTOR activity, IL-10 encourages the process of mitophagy, which removes damaged mitochondria with high reactive oxygen species and low membrane potential.
Our investigation pinpointed the metabolic regulator ACOD1 as a primary actor in Tregs during sepsis. ACOD1, through the production of itaconate, contributes to signal transduction and metabolic reprogramming, as Itacnaote is a central source of acetyl-coA. To perform its function, various signal transduction networks such as TLRs and IFNAR, adapter proteins (e.g., MYD88), ubiquitin ligases (e.g., A20), and transcription factors (e.g., NF-κB, IRFs, and STATs) control ACOD1 expression, regulating itaconate production, oxidative stress, and antigen processing [26]. However, whether ACOD1 plays a role in Treg toward sepsis is not yet known. Our results showed that ACOD1 and FoxP3 seem to be specifically expressed in Treg-like cells (Figure 2 and Figure 3). FoxP3 and ACOD1 seem to mutually regulate each other's expression (Figure 2 and Figure 6). During sepsis, our study showed that ACOD1 and FoxP3 are upregulated in Treg-like cells (Figure 4 and Figure 5).
Our report results show that ACOD1 is associated with another metabolite regulator; CD36. CD36 is a class B scavenger receptor found on the surfaces of various immune cells, including macrophages, monocytes, and non-immune cells. It binds to various extracellular ligands, including thrombospondin domain proteins, long-chain fatty acids (LCFAs), and molecules with molecular patterns [27]. Recent studies have linked LCFA binding and transport to a potential binding pocket in the CD36 extracellular domain, although the atomic structure of CD36 remains unsolved [28]. CD36 is upregulated by cytokines such as CSF, IL4, and IL10 [29,30]. In Tregs, CD36 acts as a pattern recognition receptor that facilitates fatty acid (LCFA) transport. LCFA binding to CD36 triggers intracellular signaling events, adjusting lipid metabolism, including dissociation of SFK Fyn and enrichment of liver kinase B1, activating the AMPK pathway, and upregulating fatty acid oxidation (FAO) [31,32,33]. In turn, FAO drives acetyl-CoA production from Itaconate [34]. Interestingly, our results show that knocking out ACOD1 reduced the level of CD36 (Figure 6). We hypothesize that during sepsis, the transport of LCFAs to the cell is mediated by CD36. Oxidization of LCFAs leads to the conversion of itaconate produced by ACOD1 to acetyl-CoA. Itaconate further activates FoxP3 and mediates the production of IL10 and IL4. These anti-inflammatory cytokines maintain the activation of CD36, leading to a vicious cycle of anti-inflammatory responses in sepsis. Taken together, our results indicate that targeting ACOD1 can potentially ease the sepsis prognosis.
Acknowledgments
We would like to thank Macarious Abraham and Mary Joachim for their visionary directions.
Conflict of interest
The authors claim no conflict of interest exists.
References
- Montero-Jodra, A.; de la Fuente, M.Á.; Gobelli, D.; Martín-Fernández, M.; Villar, J.; Tamayo, E.; Simarro, M. The Mitochondrial Signature of Cultured Endothelial Cells in Sepsis: Identifying Potential Targets for Treatment. Biochim. Biophys. Acta - Mol. Basis Dis. 2024, 1870, 166946. [Google Scholar] [CrossRef]
- Polat, G.; Ugan, R.A.; Cadirci, E.; Halici, Z. Sepsis and Septic Shock: Current Treatment Strategies and New Approaches. Eurasian J. Med. 2017. [Google Scholar] [CrossRef]
- Grondman, I.; Pirvu, A.; Riza, A.; Ioana, M.; Netea, M.G. Biomarkers of Inflammation and the Etiology of Sepsis. Biochem. Soc. Trans. 2020.
- Ebrahim, G.J. Sepsis, Septic Shock and the Systemic Inflammatory Response Syndrome. J. Trop. Pediatr. 2011.
- Delano, M.J.; Ward, P.A. The Immune System’s Role in Sepsis Progression, Resolution, and Long-Term Outcome. Immunol. Rev. 2016.
- Boomer, J.S.; Green, J.M.; Hotchkiss, R.S. The Changing Immune System in Sepsis. Virulence 2014. [Google Scholar] [CrossRef]
- Christaki, E.; Anyfanti, P.; Opal, S.M. Immunomodulatory Therapy for Sepsis: An Update. Expert Rev. Anti. Infect. Ther. 2011.
- Hein, F.; Massin, F.; Cravoisy-Popovic, A.; Barraud, D.; Levy, B.; Bollaert, P.-E.; Gibot, S. The Relationship between CD4+CD25+CD127- Regulatory T Cells and Inflammatory Response and Outcome during Shock States. Crit. Care 2010, 14, R19. [Google Scholar] [CrossRef]
- Cao, C.; Ma, T.; Chai, Y.; Shou, S. The Role of Regulatory T Cells in Immune Dysfunction during Sepsis. World J. Emerg. Med. 2015. [Google Scholar] [CrossRef]
- Drechsler, S.; Osuchowski, M. Cecal Ligation and Puncture. In Methods in Molecular Biology; 2021.
- Taylor, A.L.; Llewelyn, M.J. Superantigen-Induced Proliferation of Human CD4+CD25− T Cells Is Followed by a Switch to a Functional Regulatory Phenotype. J. Immunol. 2010. [Google Scholar] [CrossRef]
- Bhaumik, S.; Łazarczyk, M.; Kubick, N.; Klimovich, P.; Gurba, A.; Paszkiewicz, J.; Teodorowicz, P.; Kocki, T.; Horbańczuk, J.O.; Manda, G.; et al. Investigation of the Molecular Evolution of Treg Suppression Mechanisms Indicates a Convergent Origin. Curr. Issues Mol. Biol. 2023, 45, 628–648. [Google Scholar] [CrossRef]
- Jiang, L.N.; Yao, Y.M.; Sheng, Z.Y. The Role of Regulatory T Cells in the Pathogenesis of Sepsis and Its Clinical Implication. J. Interf. Cytokine Res. 2012.
- Bergmann, C.B.; Beckmann, N.; Salyer, C.E.; Hanschen, M.; Crisologo, P.A.; Caldwell, C.C. Potential Targets to Mitigate Trauma- or Sepsis-Induced Immune Suppression. Front. Immunol. 2021. [Google Scholar] [CrossRef]
- Monneret, G.; Venet, F.; Pachot, A.; Lepape, A. Monitoring Immune Dysfunctions in the Septic Patient: A New Skin for the Old Ceremony. Mol. Med. 2008.
- Rizzo, A.; Giovangiulio, M. Di; Stolfi, C.; Franze, E.; Fehling, H.J.; Carsetti, R.; Giorda, E.; Colantoni, A.; Ortenzi, A.; Rugge, M.; et al. RORGT-Expressing Tregs Drive the Growth of Colitis-Associated Colorectal Cancer by Controlling IL6 in Dendritic Cells. Cancer Immunol. Res. 2018, 6, 1082–1092. [Google Scholar] [CrossRef]
- Mickael, M.E.; Bhaumik, S.; Chakraborti, A.; Umfress, A.A.; van Groen, T.; Macaluso, M.; Totenhagen, J.; Sorace, A.G.; Bibb, J.A.; Standaert, D.G.; et al. RORγt-Expressing Pathogenic CD4 + T Cells Cause Brain Inflammation during Chronic Colitis. J. Immunol. 2022, 208, 2054–2066. [Google Scholar] [CrossRef]
- Cakir, T.; Pir, P.; Vis, D.; Linde, J.; Dix, A.; Hünniger, K.; Weber, M.; Guthke, R.; Kurzai, O. Biomarker-Based Classification of Bacterial and Fungal Whole-Blood Infections in a Genome-Wide Expression Study. Front. Microbiol. | www.frontiersin.org 2015, 6, 171. [Google Scholar] [CrossRef]
- van der Veeken, J.; Campbell, C.; Pritykin, Y.; Schizas, M.; Verter, J.; Hu, W.; Wang, Z.-M.; Matheis, F.; Mucida, D.; Charbonnier, L.-M.; et al. Genetic Tracing Reveals Transcription Factor Foxp3-Dependent and Foxp3-Independent Functionality of Peripherally Induced Treg Cells. Immunity 2022, 55, 1173–1184.e7. [Google Scholar] [CrossRef]
- Kubick, N.; Pajares, M.; Enache, I.; Manda, G.; Mickael, M.-E. Repurposing Zileuton as a Depression Drug Using an AI and In Vitro Approach. Molecules 2020, 25, 2155. [Google Scholar] [CrossRef]
- Mickael, M.E.; Kubick, N.; Łazarczyk, M.; Sacharczuk, M.; Marchewka, J.; Urbański, P.; Horbańczuk, J.O. Transcriptome Analysis of the Th17/Treg Axis Reveals Multiple Pathways That Ensure Distinct Differentiation Patterns. Anim. Sci. Pap. Reports 2023, 41, 79–93. [Google Scholar]
- Satija, R.; Farrell, J.A.; Gennert, D.; Schier, A.F.; Regev, A. Spatial Reconstruction of Single-Cell Gene Expression Data. Nat. Biotechnol. 2015. [Google Scholar] [CrossRef]
- Udwadia, F. Sepsis and Septic Shock. In Principles of Critical Care; Jaypee Brothers Medical Publishers (P) Ltd., 2014; pp. 185–185.
- Ip, W.K.E.; Hoshi, N.; Shouval, D.S.; Snapper, S.; Medzhitov, R. Anti-Inflammatory Effect of IL-10 Mediated by Metabolic Reprogramming of Macrophages. Science (80-. ). 2017. [Google Scholar] [CrossRef]
- Wang, H.; Wang, L.L.; Zhao, S.J.; Lin, X.X.; Liao, A.H. IL-10: A Bridge between Immune Cells and Metabolism during Pregnancy. J. Reprod. Immunol. 2022.
- Wu, R.; Chen, F.; Wang, N.; Tang, D.; Kang, R. ACOD1 in Immunometabolism and Disease. Cell. Mol. Immunol. 2020, 17, 822–833. [Google Scholar] [CrossRef]
- Chen, Y.; Zhang, J.; Cui, W.; Silverstein, R.L. CD36, a Signaling Receptor and Fatty Acid Transporter That Regulates Immune Cell Metabolism and Fate. J. Exp. Med. 2022.
- Hsieh, F.L.; Turner, L.; Bolla, J.R.; Robinson, C. V.; Lavstsen, T.; Higgins, M.K. The Structural Basis for CD36 Binding by the Malaria Parasite. Nat. Commun. 2016. [Google Scholar] [CrossRef]
- Huh, H.Y.; Pearce, S.F.; Yesner, L.M.; Schindler, J.L.; Silverstein, R.L. Regulated Expression of CD36 during Monocyte-to-Macrophage Differentiation: Potential Role of CD36 in Foam Cell Formation. Blood 1996. [Google Scholar] [CrossRef]
- Yang, P.; Qin, H.; Li, Y.; Xiao, A.; Zheng, E.; Zeng, H.; Su, C.; Luo, X.; Lu, Q.; Liao, M.; et al. CD36-Mediated Metabolic Crosstalk between Tumor Cells and Macrophages Affects Liver Metastasis. Nat. Commun. 2022. [Google Scholar] [CrossRef]
- Samovski, D.; Sun, J.; Pietka, T.; Gross, R.W.; Eckel, R.H.; Su, X.; Stahl, P.D.; Abumrad, N.A. Regulation of AMPK Activation by CD36 Links Fatty Acid Uptake to β-Oxidation. Diabetes 2015. [Google Scholar] [CrossRef]
- Wang, H.; Franco, F.; Tsui, Y.C.; Xie, X.; Trefny, M.P.; Zappasodi, R.; Mohmood, S.R.; Fernández-García, J.; Tsai, C.H.; Schulze, I.; et al. CD36-Mediated Metabolic Adaptation Supports Regulatory T Cell Survival and Function in Tumors. Nat. Immunol. 2020. [Google Scholar] [CrossRef]
- Horton, B.L.; Spranger, S. CD36 — the Achilles’ Heel of Treg Cells. Nat. Immunol. 2020. [Google Scholar] [CrossRef]
- Harber, K.J.; Neele, A.E.; van Roomen, C.P.; Gijbels, M.J.; Beckers, L.; Toom, M. den; Schomakers, B. V.; Heister, D.A.; Willemsen, L.; Griffith, G.R.; et al. Targeting the ACOD1-Itaconate Axis Stabilizes Atherosclerotic Plaques. Redox Biol. 2024, 70, 103054. [Google Scholar] [CrossRef]
Figure 1.
Pro-inflammatory and metabolism pathways are both enriched after 8 hours of infection. (A) A significant number of genes were differentially expressed between treated and non-treated groups. (B) Several genes associated with Tregs show upregulation patterns. (C) 8 hours post-treatment of healthy human blood from participants shows Treg-associated pathways, namely IL4 and IL10. (D) BiNGO analysis process shows upregulation of the metabolic process.
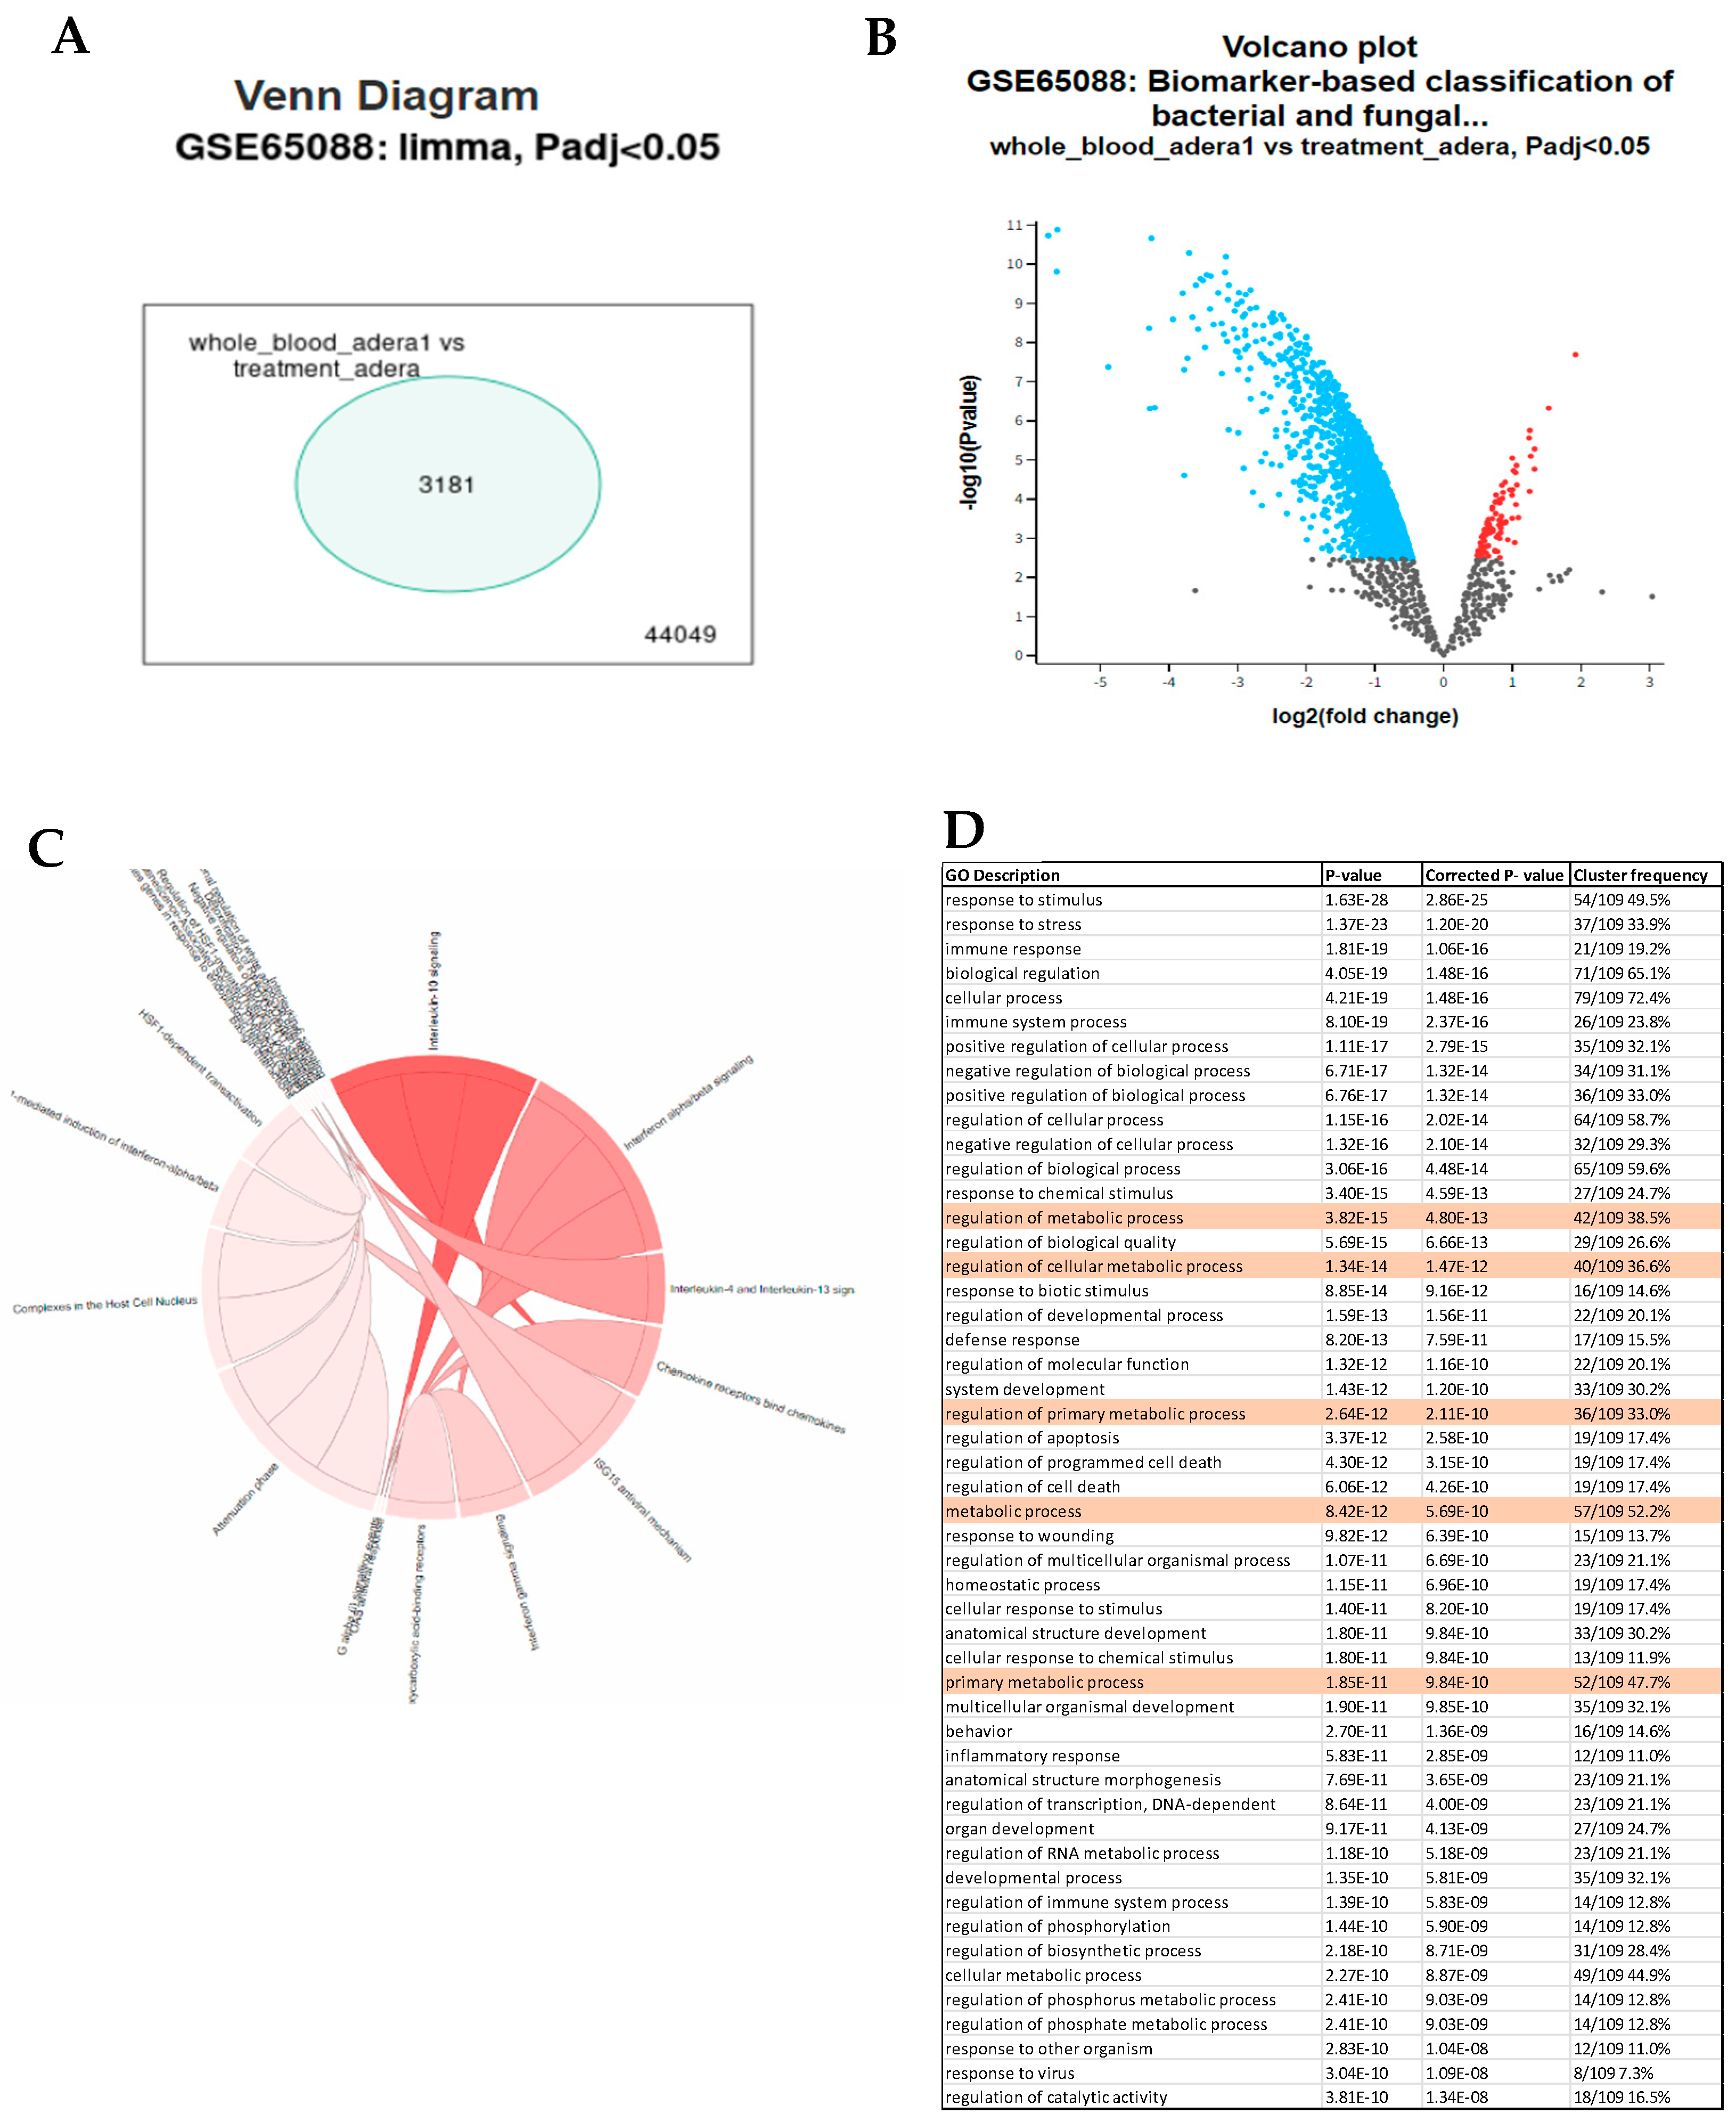
Figure 2.
Acod1 mediates Treg function. (A) PCA shows clear clustering of samples based on FoxP3 expression. (B&C) Volcano plot and heatmap showing upregulated genes. (D) Gene enrichment pathways showing Th17 regulation confirming selected genes role in Th17/Treg differentiation.
Figure 2.
Acod1 mediates Treg function. (A) PCA shows clear clustering of samples based on FoxP3 expression. (B&C) Volcano plot and heatmap showing upregulated genes. (D) Gene enrichment pathways showing Th17 regulation confirming selected genes role in Th17/Treg differentiation.
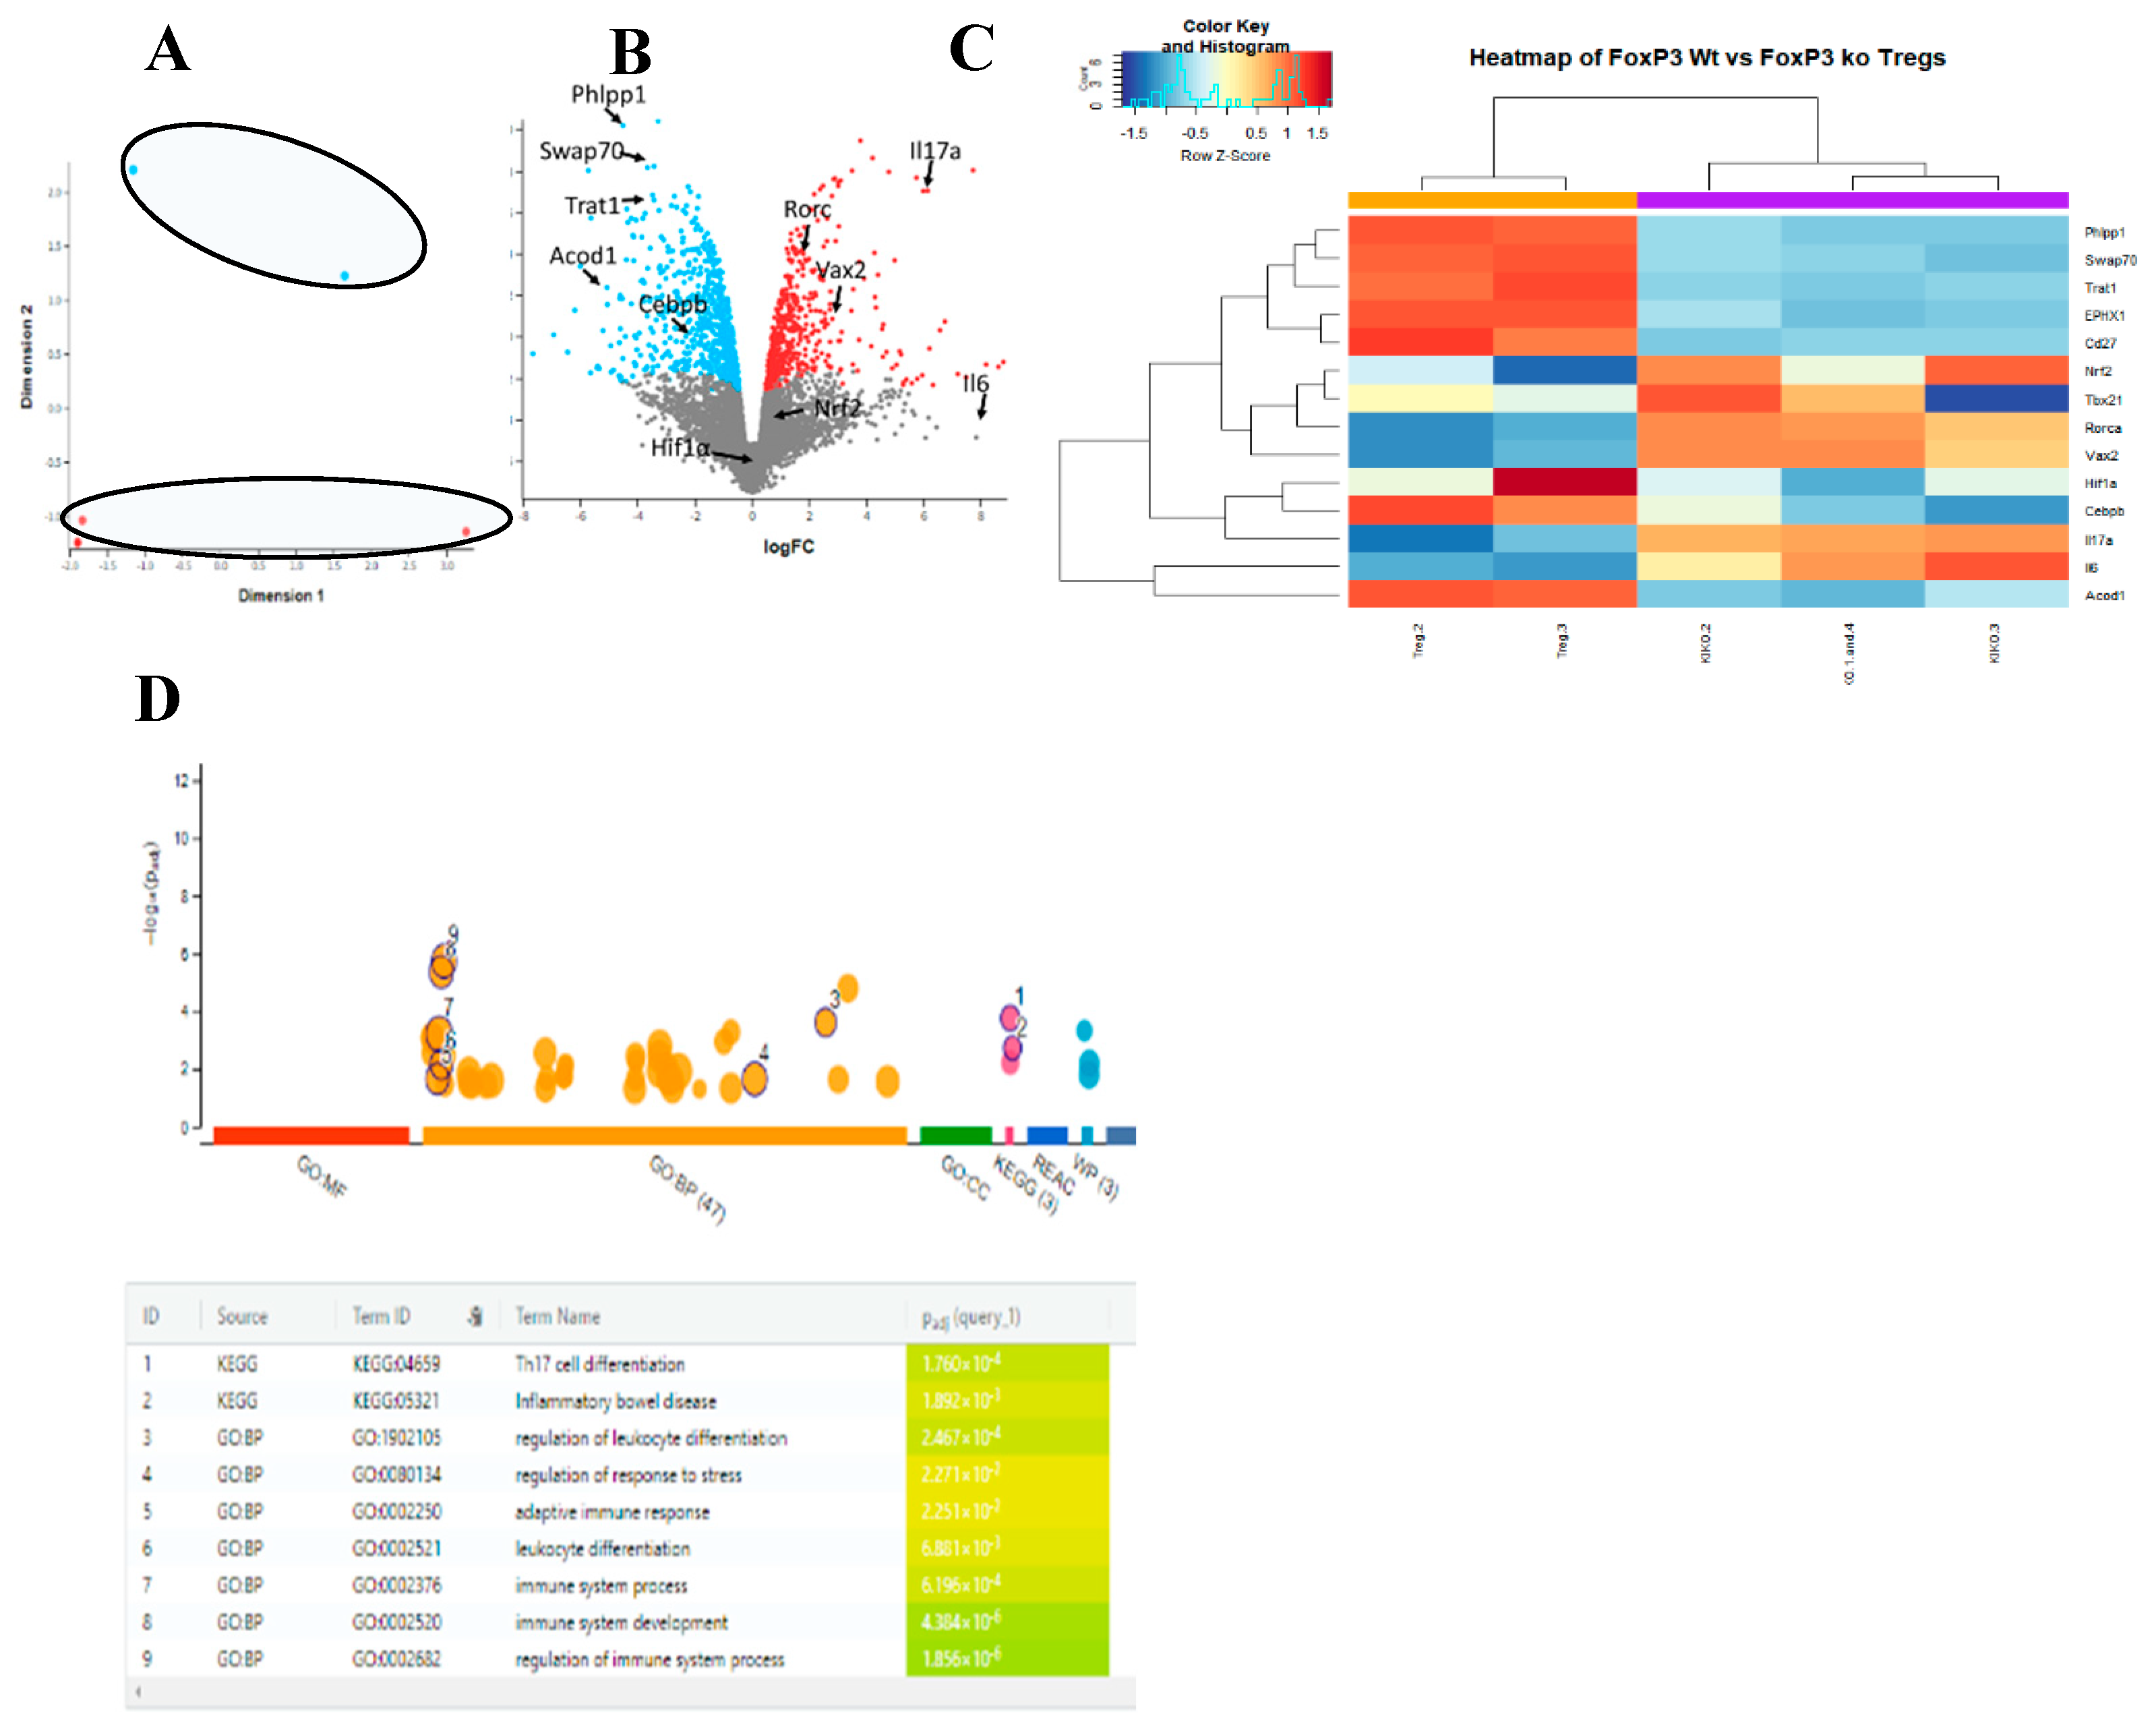
Figure 3.
Acod1 and FoxP3 share the same expression profile on a single cell level. (A) scRNA-seq of colon cells show that Acod1 and FoxP3, Trat1, IL10, IL2, CD27, CD25, and CD4 are co-expressed mainly in cluster number 10, which is highly likely to be Tregs.(B) Comparison of scRNA-seq expression between different clusters for Acod1 and genes associated with Tregs.
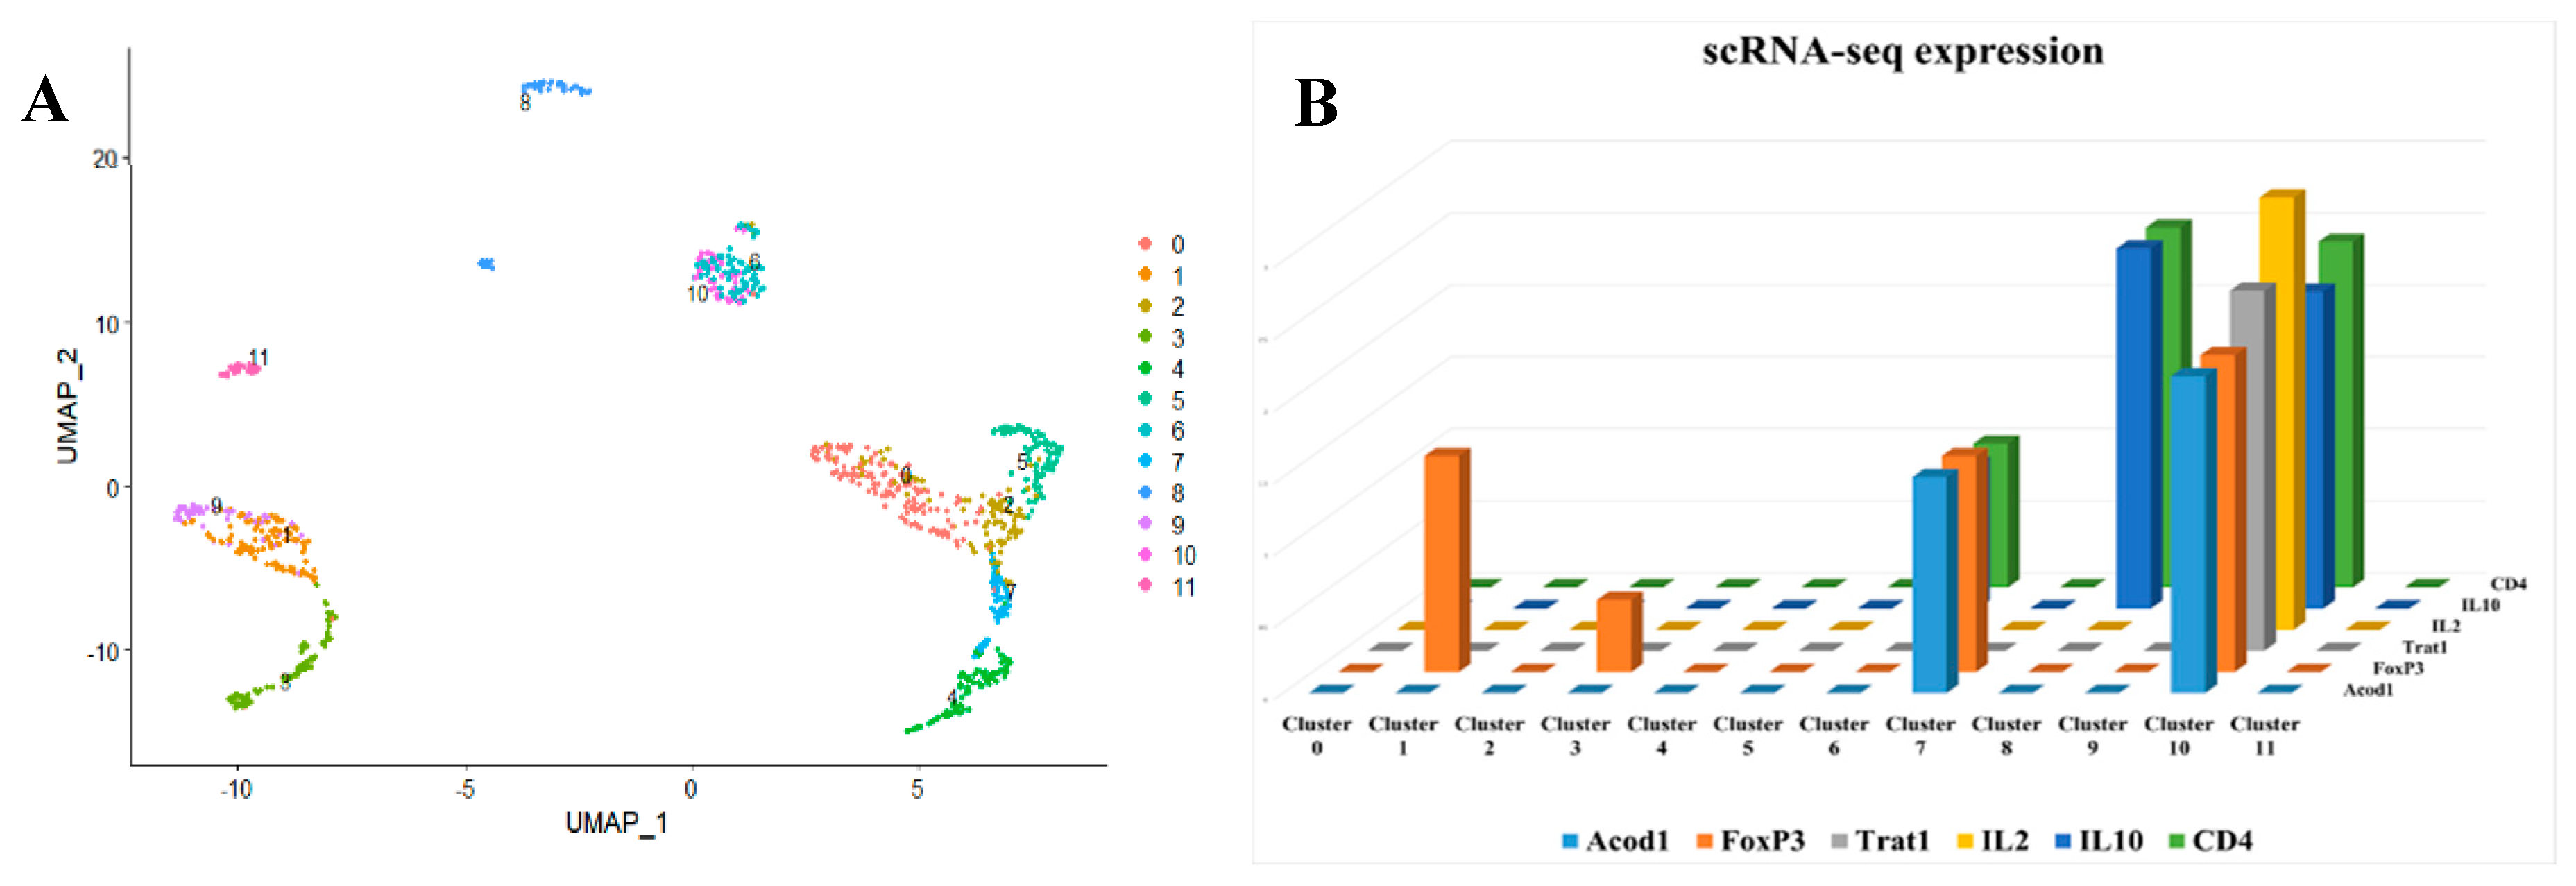
Figure 4.
Single-cell clustering using sepsis patients single-cell RNA seq. A) Our results identified 20 different cell clusters that are uniquely expressed in sepsis. B) FoxP3 and CD4+ are not ubiquitously expressed in all invested cell types; rather, they are specifically expressed in certain cell clusters, indicating that they could be phenotyped as Treg-like cells. C) ACOD1 is differentially expressed between the sepsis and control patients in a unique cluster marked by FOXP3+ CD4+.
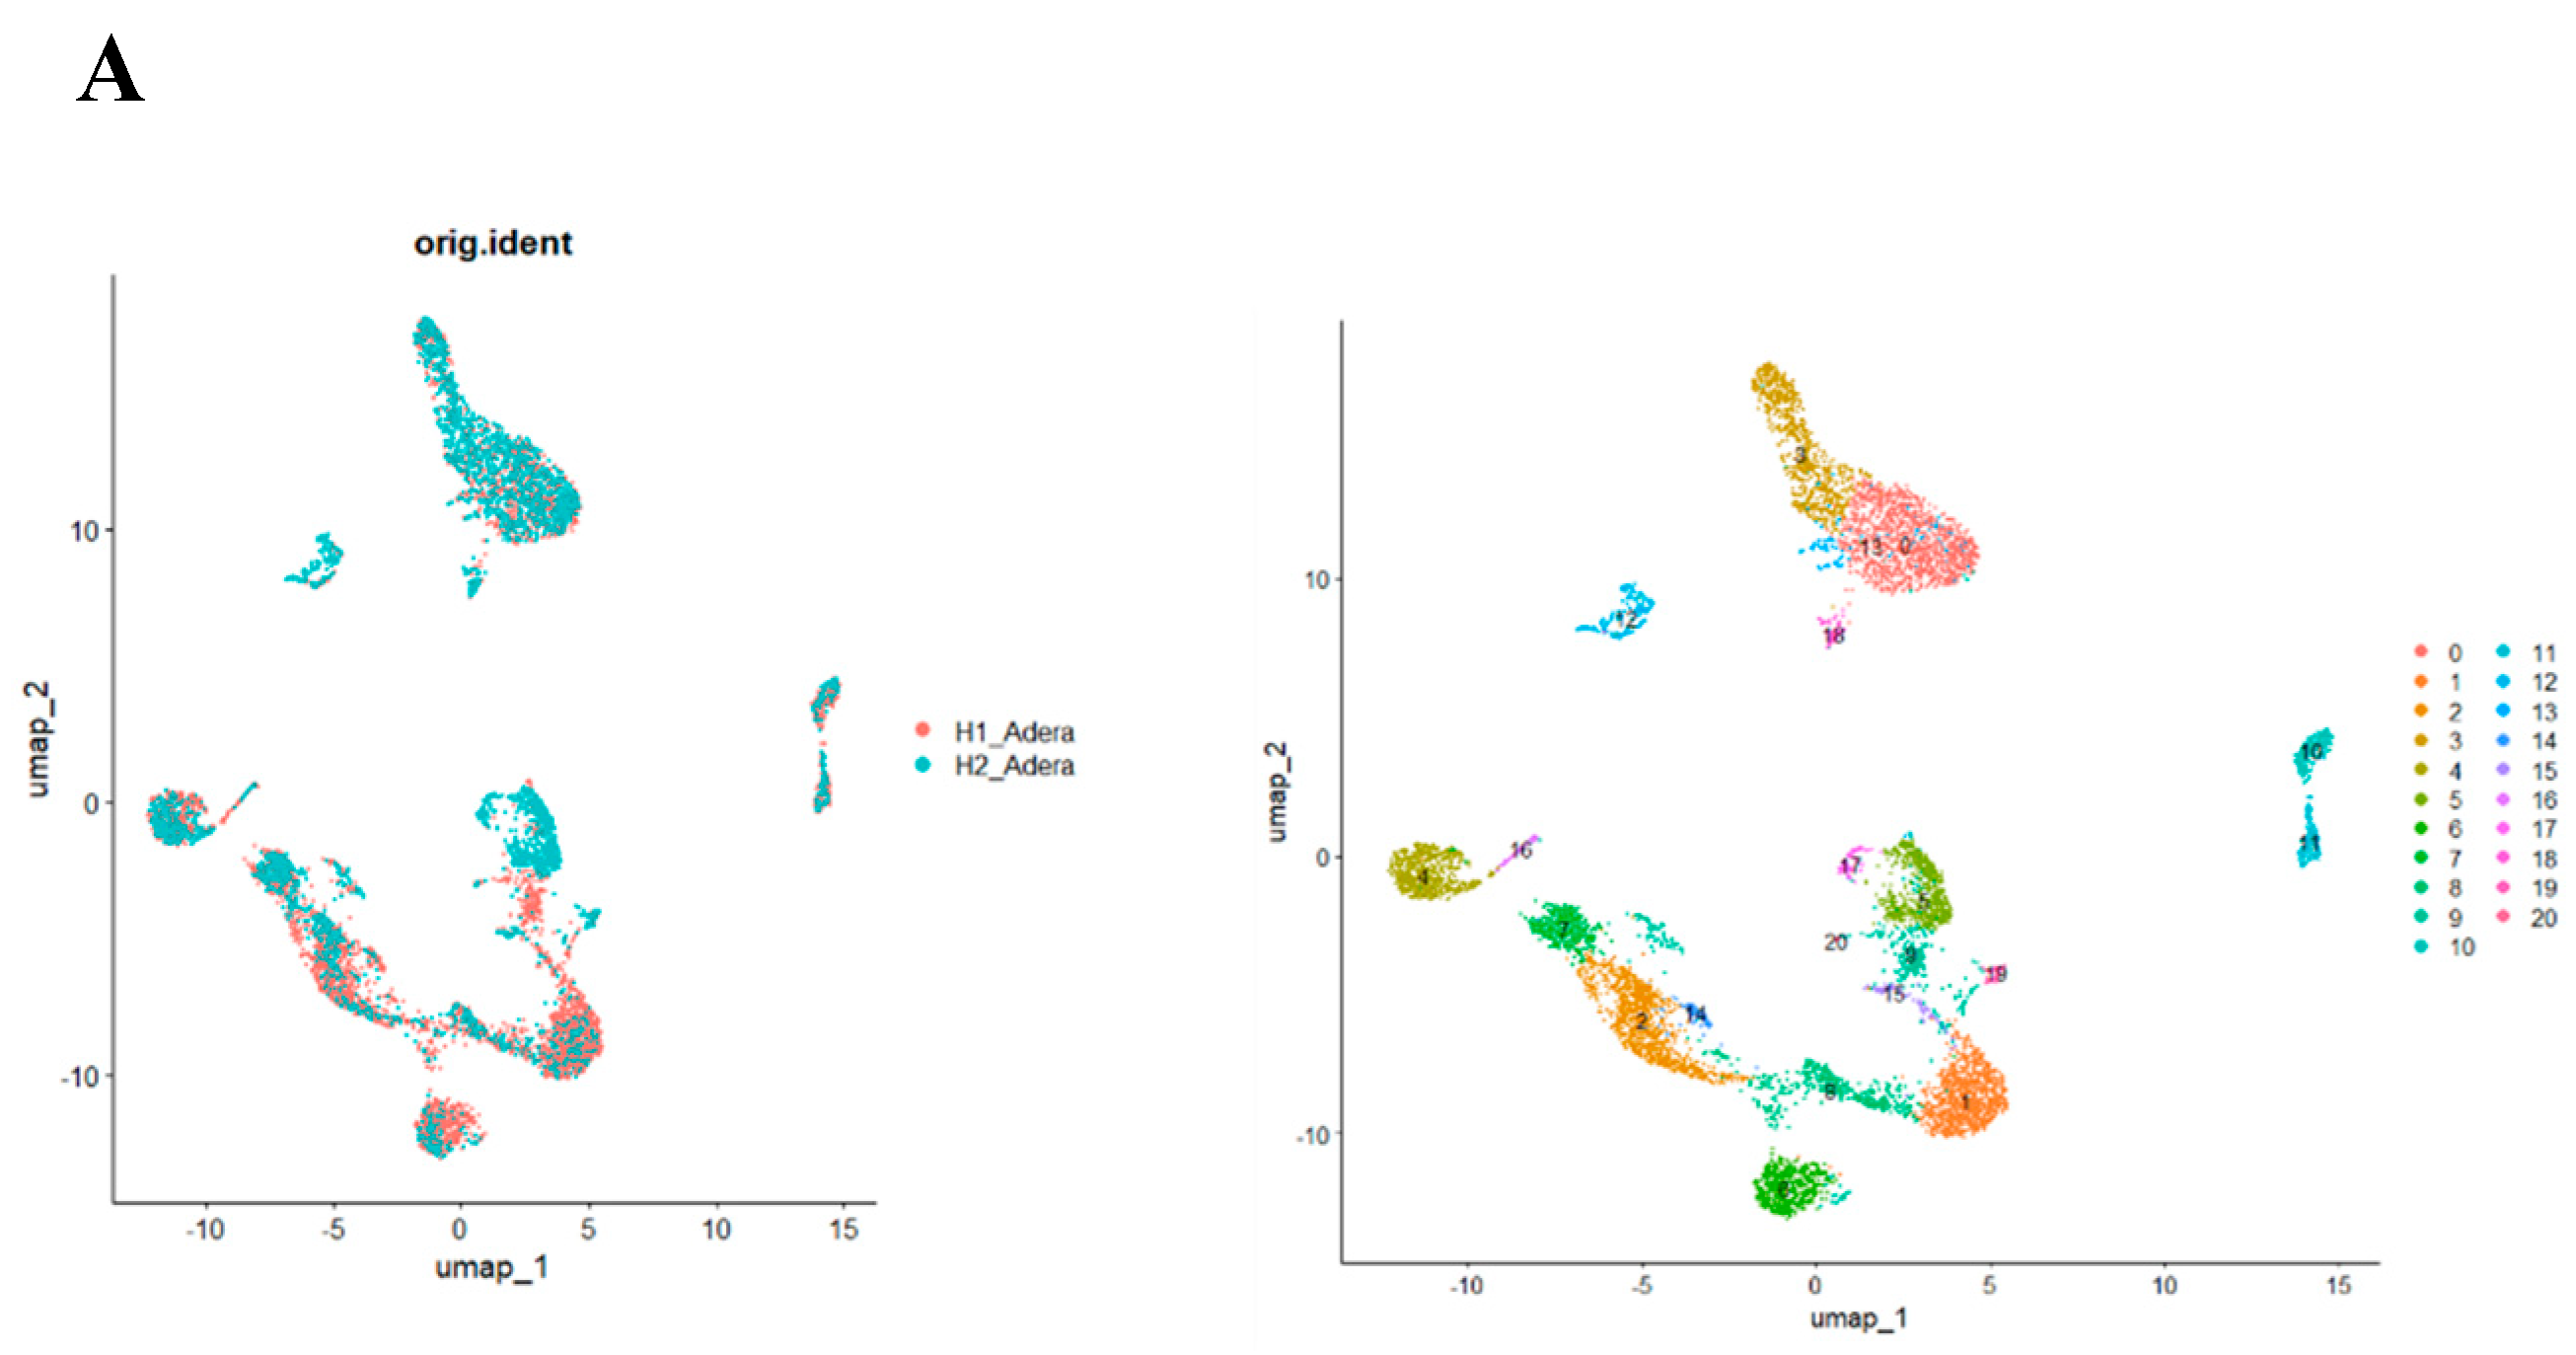
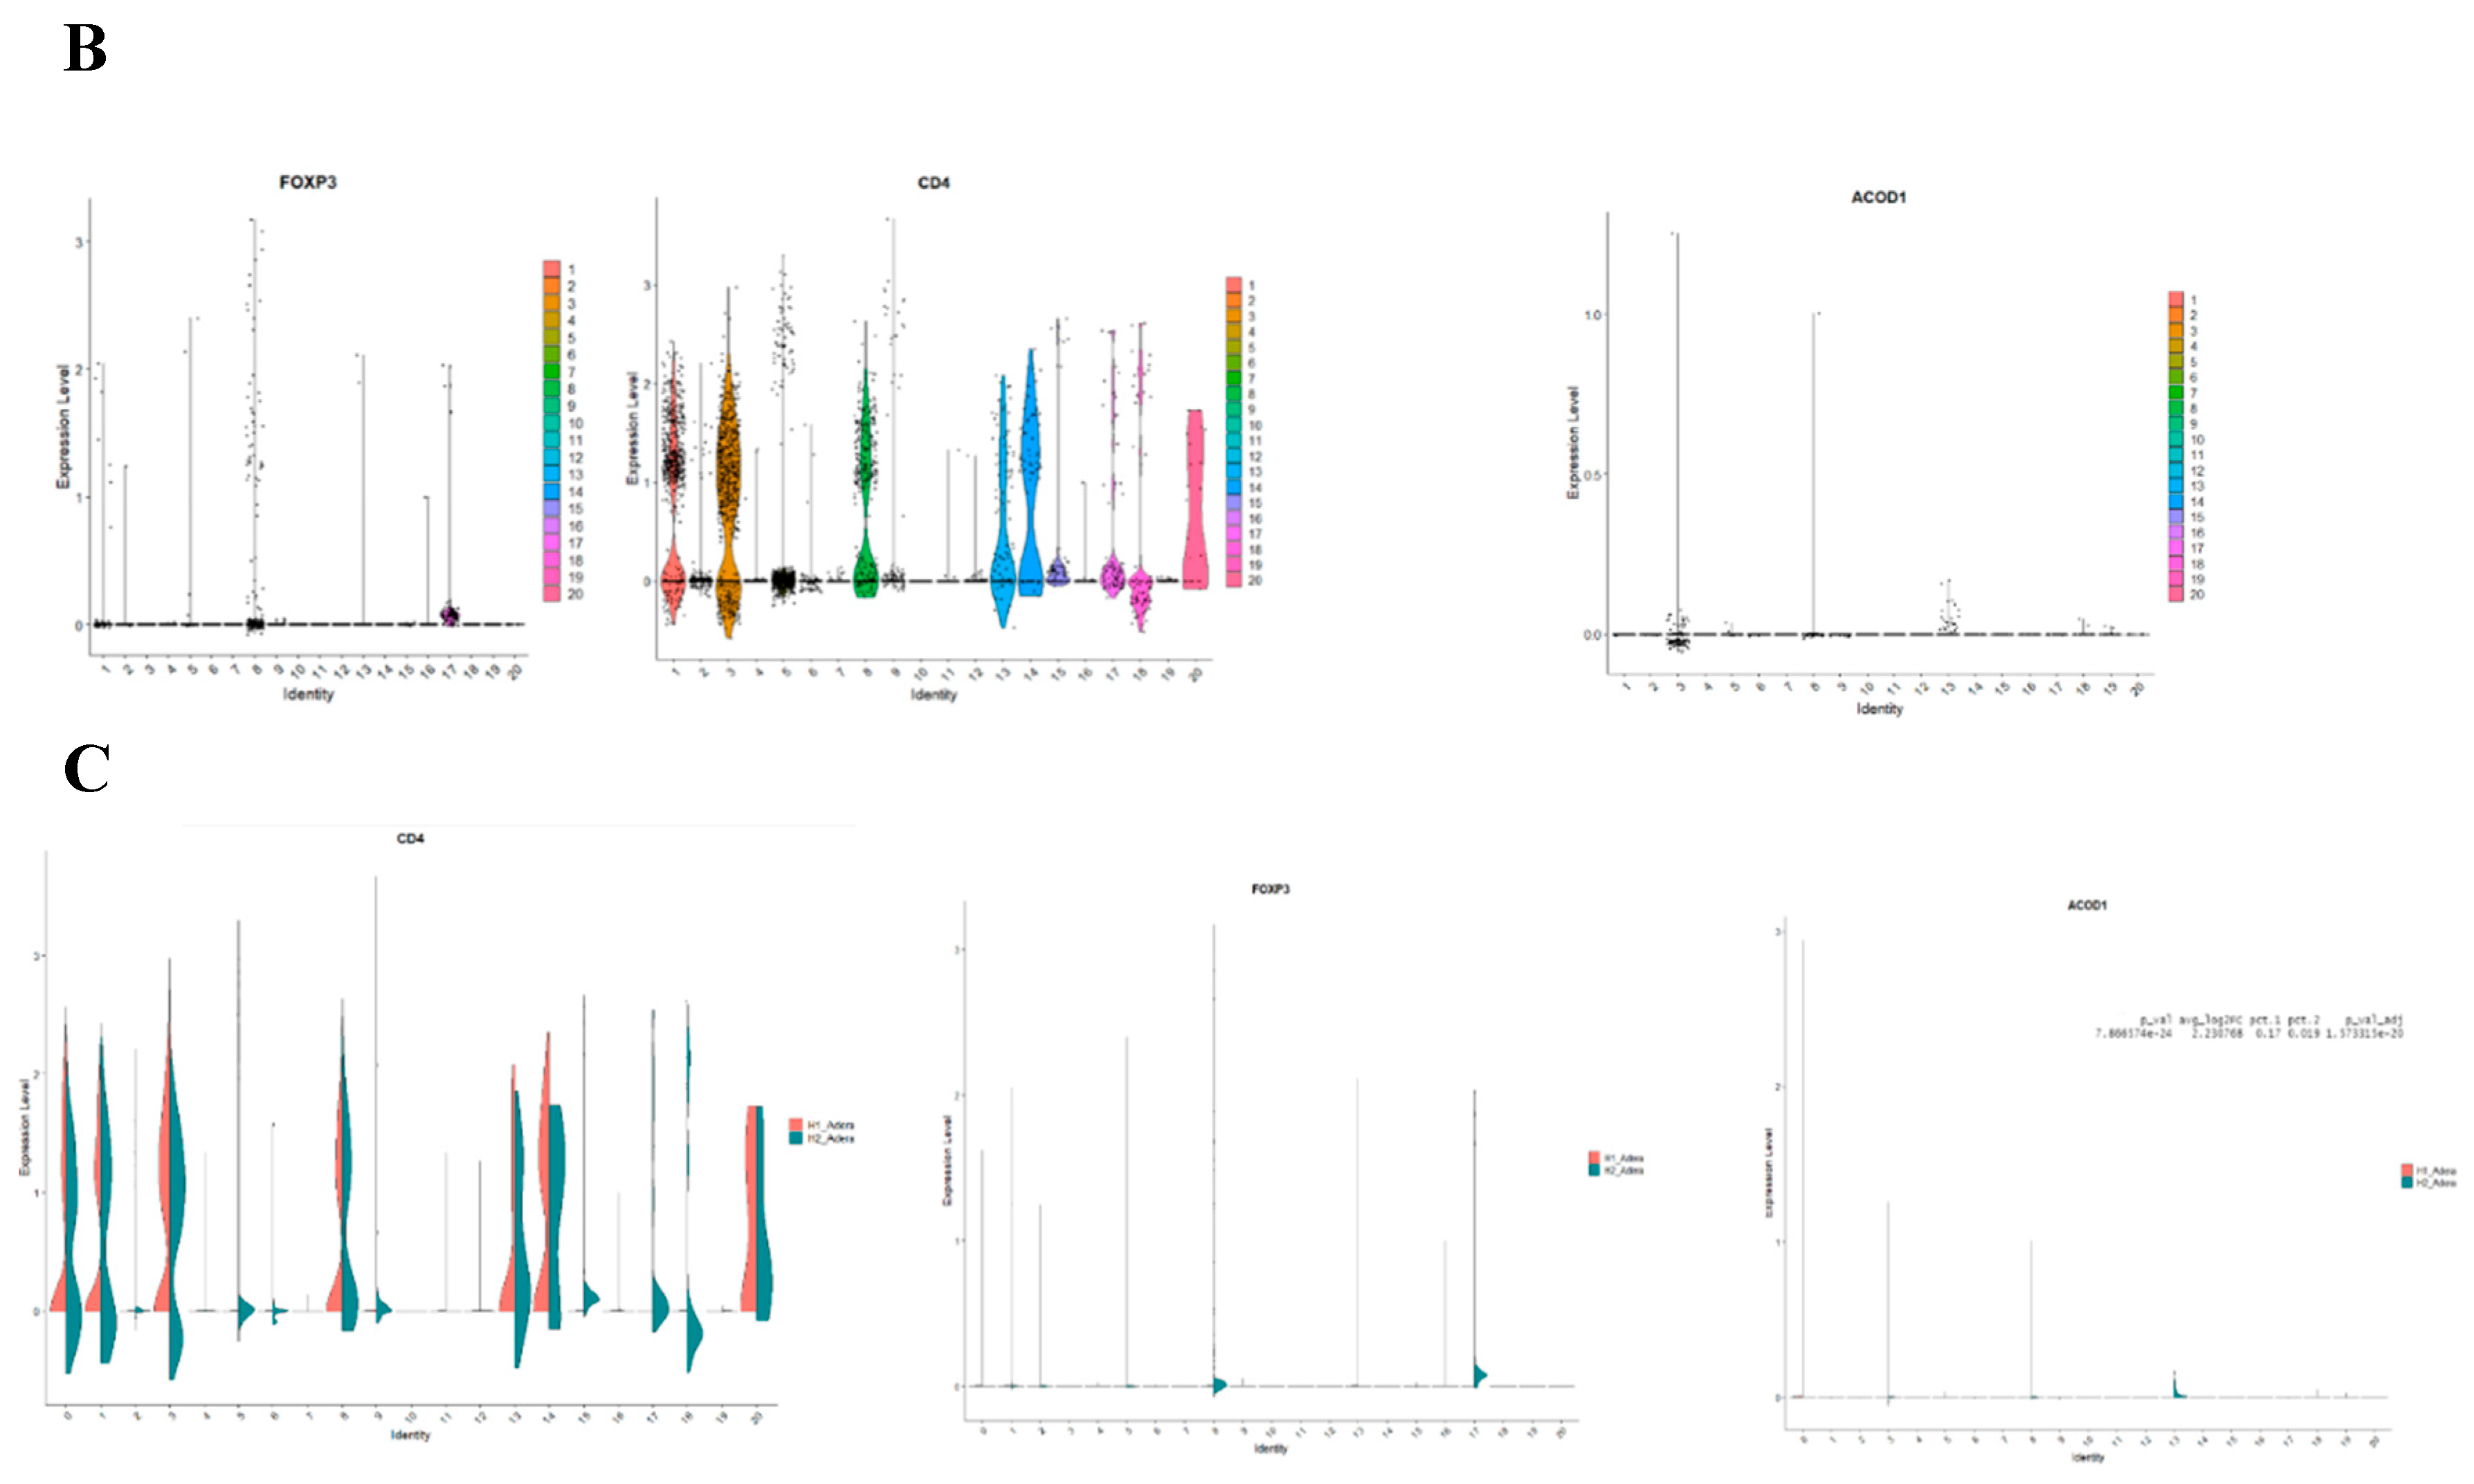
Figure 5.
Sepsis is associated with the upregulation of FoxP3 and various mitochondrial pathways including ACOD1. (A) The volcano plot of cluster 13 shows that in addition to ACOD1, several genes known to function in the mitochondrial metabolism axis are upregulated such as CD36. (B) Mining of expression of ACOD1 in the cells in Human Atlas(c) shows that ACOD1 is likely to be expressed in the mitochondria.
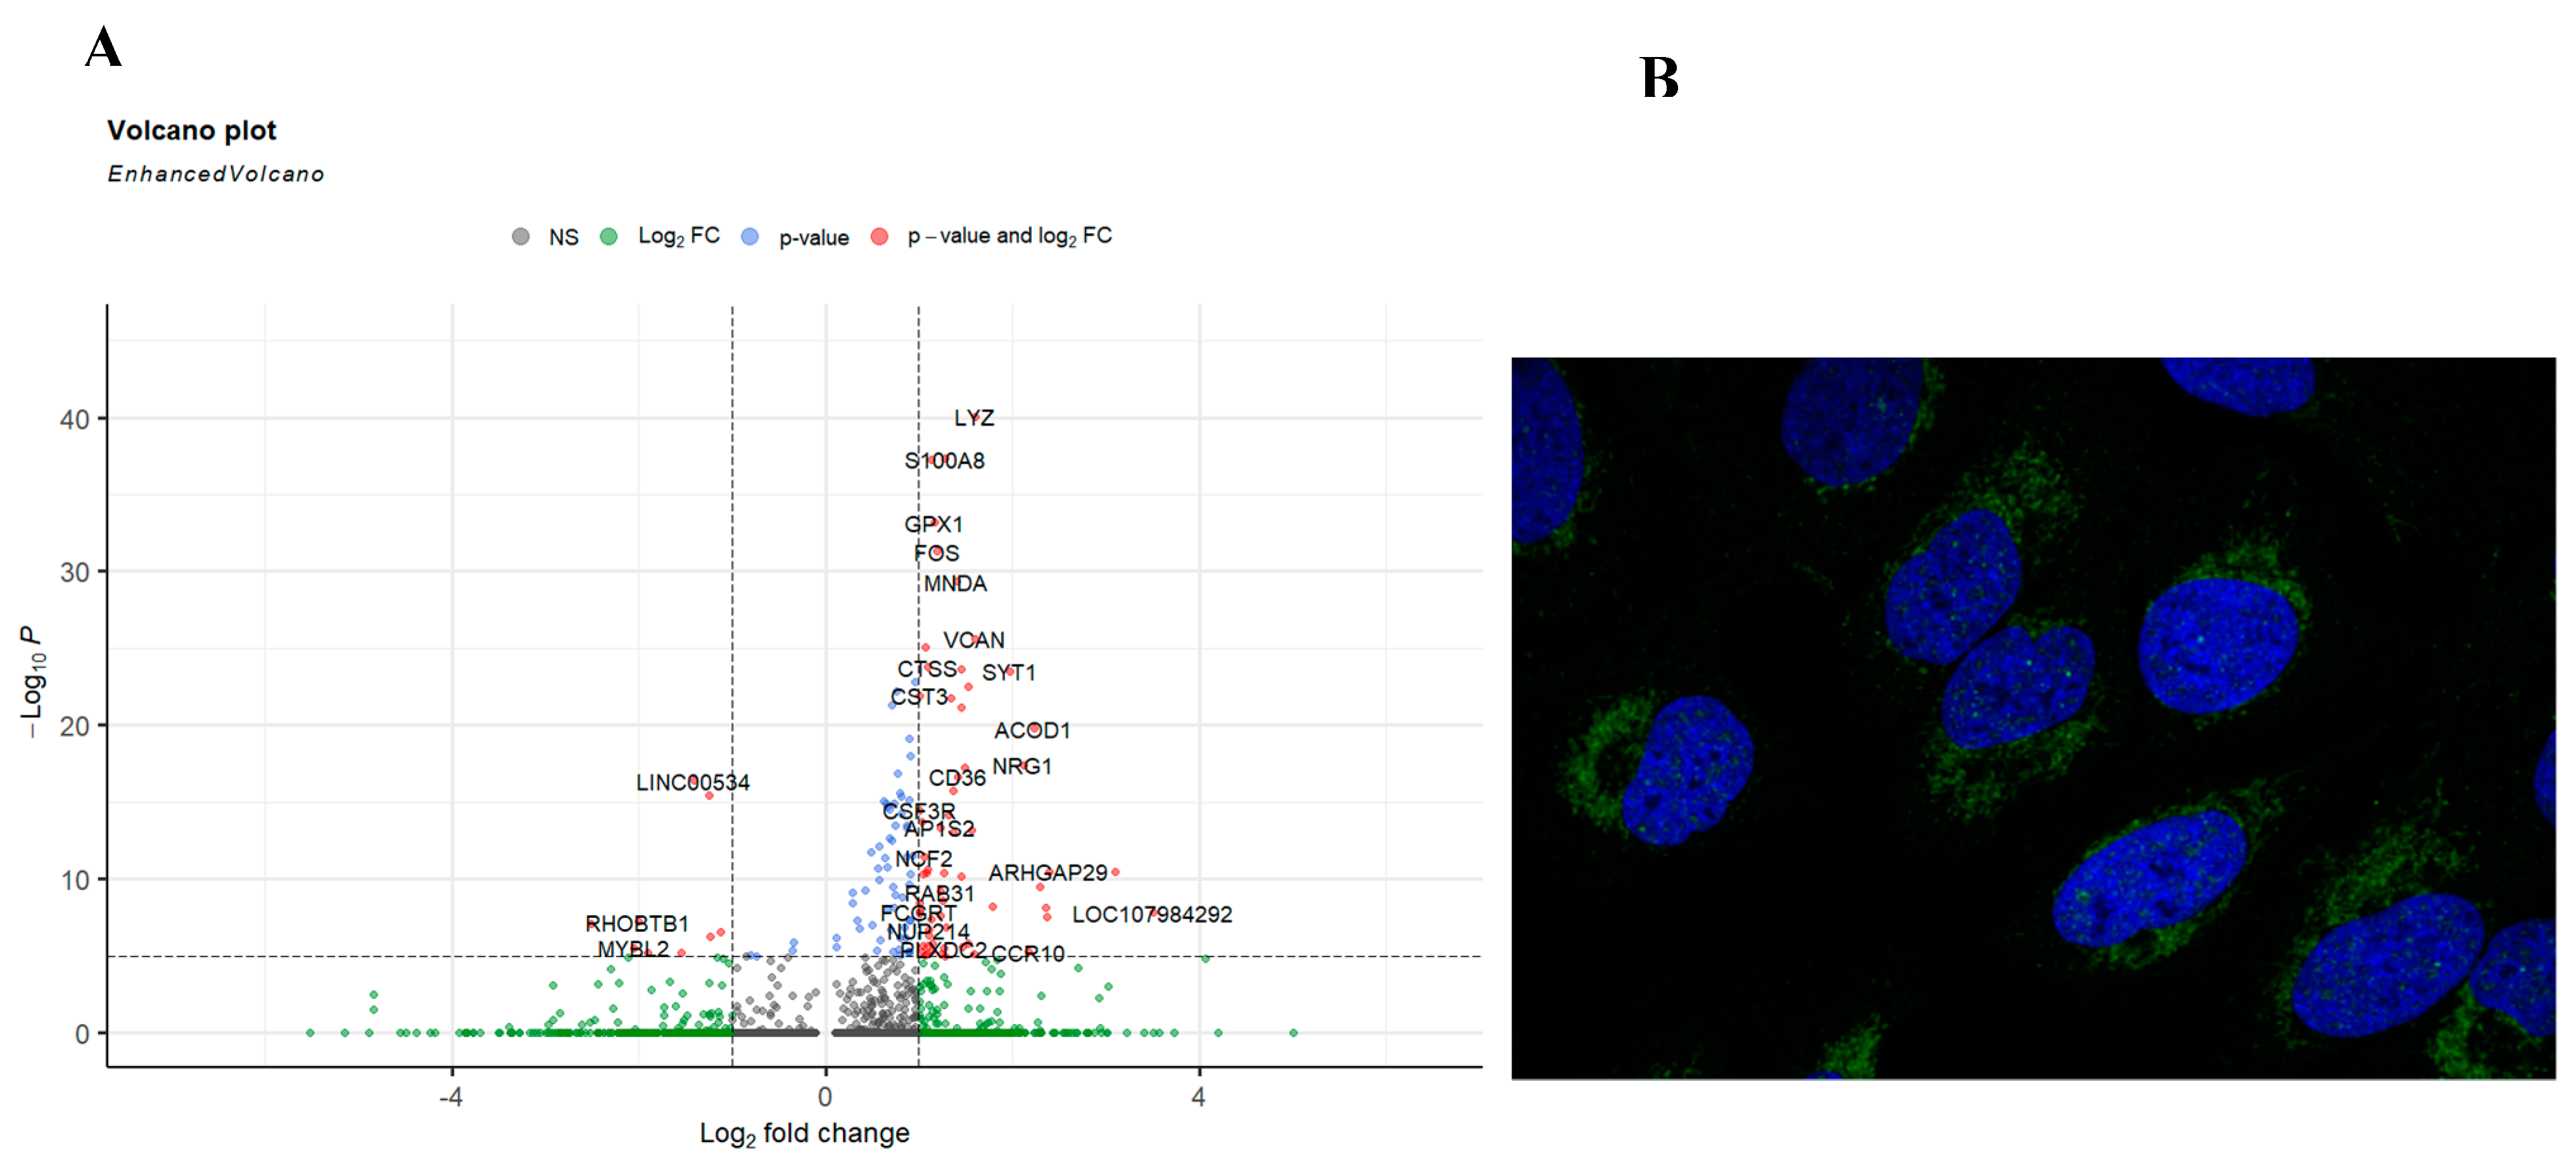
Figure 6.
There is a significant effect of knocking out ACOD1 on Treg function in sepsis. (A) Our single-cell RNA sequencing identified 23 unique cell clusters. (B) Looking closely into the change in each cluster's gene expression showed that FoxP3, CD4, and CD36 are downregulated in the Treg-like clusters.
Disclaimer/Publisher’s Note: The statements, opinions and data contained in all publications are solely those of the individual author(s) and contributor(s) and not of MDPI and/or the editor(s). MDPI and/or the editor(s) disclaim responsibility for any injury to people or property resulting from any ideas, methods, instructions or products referred to in the content. |
© 2024 by the authors. Licensee MDPI, Basel, Switzerland. This article is an open access article distributed under the terms and conditions of the Creative Commons Attribution (CC BY) license (https://creativecommons.org/licenses/by/4.0/).
Copyright: This open access article is published under a Creative Commons CC BY 4.0 license, which permit the free download, distribution, and reuse, provided that the author and preprint are cited in any reuse.


