Preprint
Article

Method and Simulation of a Power Supply System Operation Based on Methane Generator Supported by Energy Storage System, to Cover High Fluctuation Electrical Loads: Greenhouse Case Study

Altmetrics

Downloads

90

Views

26

Comments

0

This version is not peer-reviewed

Submitted:

07 February 2024

Posted:

07 February 2024

You are already at the latest version

Alerts
Abstract
The analysis presented is based on actual GHU energy demand. The special feature of this load is the existence of strong daily fluctuations in energy consumption, especially during the summer months. This study presents a methodology for managing such loads with the main objective of maximizing the operating efficiency of MG.
Keywords: 
Subject: Environmental and Earth Sciences  -   Sustainable Science and Technology

1. Introduction

The growth of the world's population causes not only issues of energy security but also issues of food security. In particular, the world's population has doubled since the early 1960s and is projected to exceed 9.8 billion by 2050 [1]. It is becoming apparent that companies engaged in the production of food to meet the nutritional needs of the world's population, play an important role in the proper management of food security issues. However, the business survival of companies engaged in food production depends strongly on the issues of energy security. More specifically, one of the most important risks that a company in this industry must face is the huge increase in energy costs. Focusing on the category of businesses that produce food using greenhouses, several energy saving efforts have been made by utilizing Renewable Energy Sources (RES). Several research groups are studying the integration in greenhouses of solar energy utilization systems to produce electrical and thermal energy. In particular, they have been studied passive solar systems [2], integrated photovoltaics (PV) [3,4,5] and PV Thermal (PVT) systems [6]. Moreover, the exploitation of geothermal fields in the area where the greenhouses will be installed is taken for granted [7,8]. Besides, it can be a significant criterion for choosing the specific installation location of the greenhouse. Finally, biomass has also been mentioned in the literature as RES that can be used for the production of thermal energy [9]. In fact, biomass is a by-product of the greenhouse itself, thus satisfying the principles of the circular economy [10]. Biomass can be used either directly (combustion) or with intermediate biogas production as studied in this paper.
In the present work, the utilization of methane – based generators (MG) in conjunction with an energy storage system (ESS) to meet the energy needs of a greenhouse unit (GHU) is studied. For the needs of the study, the actual load from a greenhouse of tomatoes and cucumbers production, was used [11].
According to the «Sustainability Report» published by the company for 2021 [12], its revenues were approximately €8.1M while operating expenses, including income tax, were approximately €6.4M. Part of the operating costs was reimbursed to cover the energy needs of the greenhouse. According to the same study, 9552 MWh were required to meet the energy needs of the greenhouse. The total amount of energy consumed within the company from renewable sources (geothermal) was 68.4% of the total energy needs while the remaining 31.6% concerned electricity consumption. According to the company's electricity consumption tariffs, the cost of energy in 2021 was 36.64€/MWh. This means that the cost of electricity consumed in 2021 was about 110 K€. In 2002, energy costs have almost increased sevenfold. This means that for the same amount of energy the company was charged with about € 710 K. In other words, the profit margin will be significantly reduced. In addition, if the cost of electricity continues to raise, a scenario very likely due to the energy crisis that exists, issues of company’s survival may be raised soon.
In order for the company to be able to manage such a risk, it should immediately take measures that will lead to a reduction in the cost of energy consumption. These measures concern the utilization of a greater percentage of RES. As mentioned above, 68.4% of the total energy needs of the greenhouse are covered using geothermal energy, which enables the company to cover all heating needs. Part of the remaining 31.6% could be covered by harnessing solar energy by installing a photovoltaic park. According to the "Sustainability Report" [12], the company has proceeded to such an investment by interconnecting to the grid a photovoltaic park of 8 acres and a capacity of 500kWp.
An additional investment that the company could proceed concerns the exploitation of residues from crops for energy production, thus adopting the principles of the circular economy. In particular, 75 tons of greenhouse waste (biomass) [12] could, with proper treatment, lead to the production of biogas [13,14]. This article studies the management strategy of the electricity produced from methane (biogas or biomethane) based generators in conjunction with ESS.
The contribution of this work focuses on the design and study of a power supply system operation that combines the parallel operation of methane generators with energy storage systems. A literature search reveals the existence of many articles in which the operation of power systems that combine photovoltaics-batteries-generators is studied. Indicatively, we can mention the [15,16,17,18]. Far fewer articles concern the study of only a (mainly diesel) generator with an energy storage system [19,20,21,22,23]. However, to the best of my knowledge, no article deals with the study of the parallel operation of power systems that combine a methane generator with an energy storage system to cover electricity loads that fluctuate strongly in specific months of the year. In order to cover these intense load fluctuations, a methodology for the parallel operation of power systems combining methane generators with an energy storage system is presented and the optimal point of load satisfaction without the need of redundancy is identified. In other words, the appropriate power system is designed that combines methane generators with an energy storage system to fully meet the energy needs of a greenhouse unit (GHU).
In Section 2 of this work, the procedure that was followed for the logging of the Greenhouse’s electrical energy requirements is presented. In Section 3 the load profile is presented, the operating algorithm is described, and the various energy management scenarios are discussed.

2. Materials and Methods

2.1. Experimental Setup for Power Measurements

In the context of optimal energy management, measuring devices, such as power analyzers, which monitor and record the electrical demand in real time, are applied. They are used to measure the power output in an electrical system. Generally, power analyzers are applied in a variety of electrical power systems. Due to the many applications, modern types of power analyzers often have data-logging capabilities. They can store the data in internal memory for processing and display later. It is also possible to remotely control the analyzer with a computer and receive data via Ethernet or Wi-Fi. The ultimate goal is to create an energy consumption profile. Accordingly, a power analyzer was installed in the general low-voltage switchboard, at the supply point from the medium-voltage network of the consumer, depicted in position LVS of the electrical one-line drawing of Figure 1.
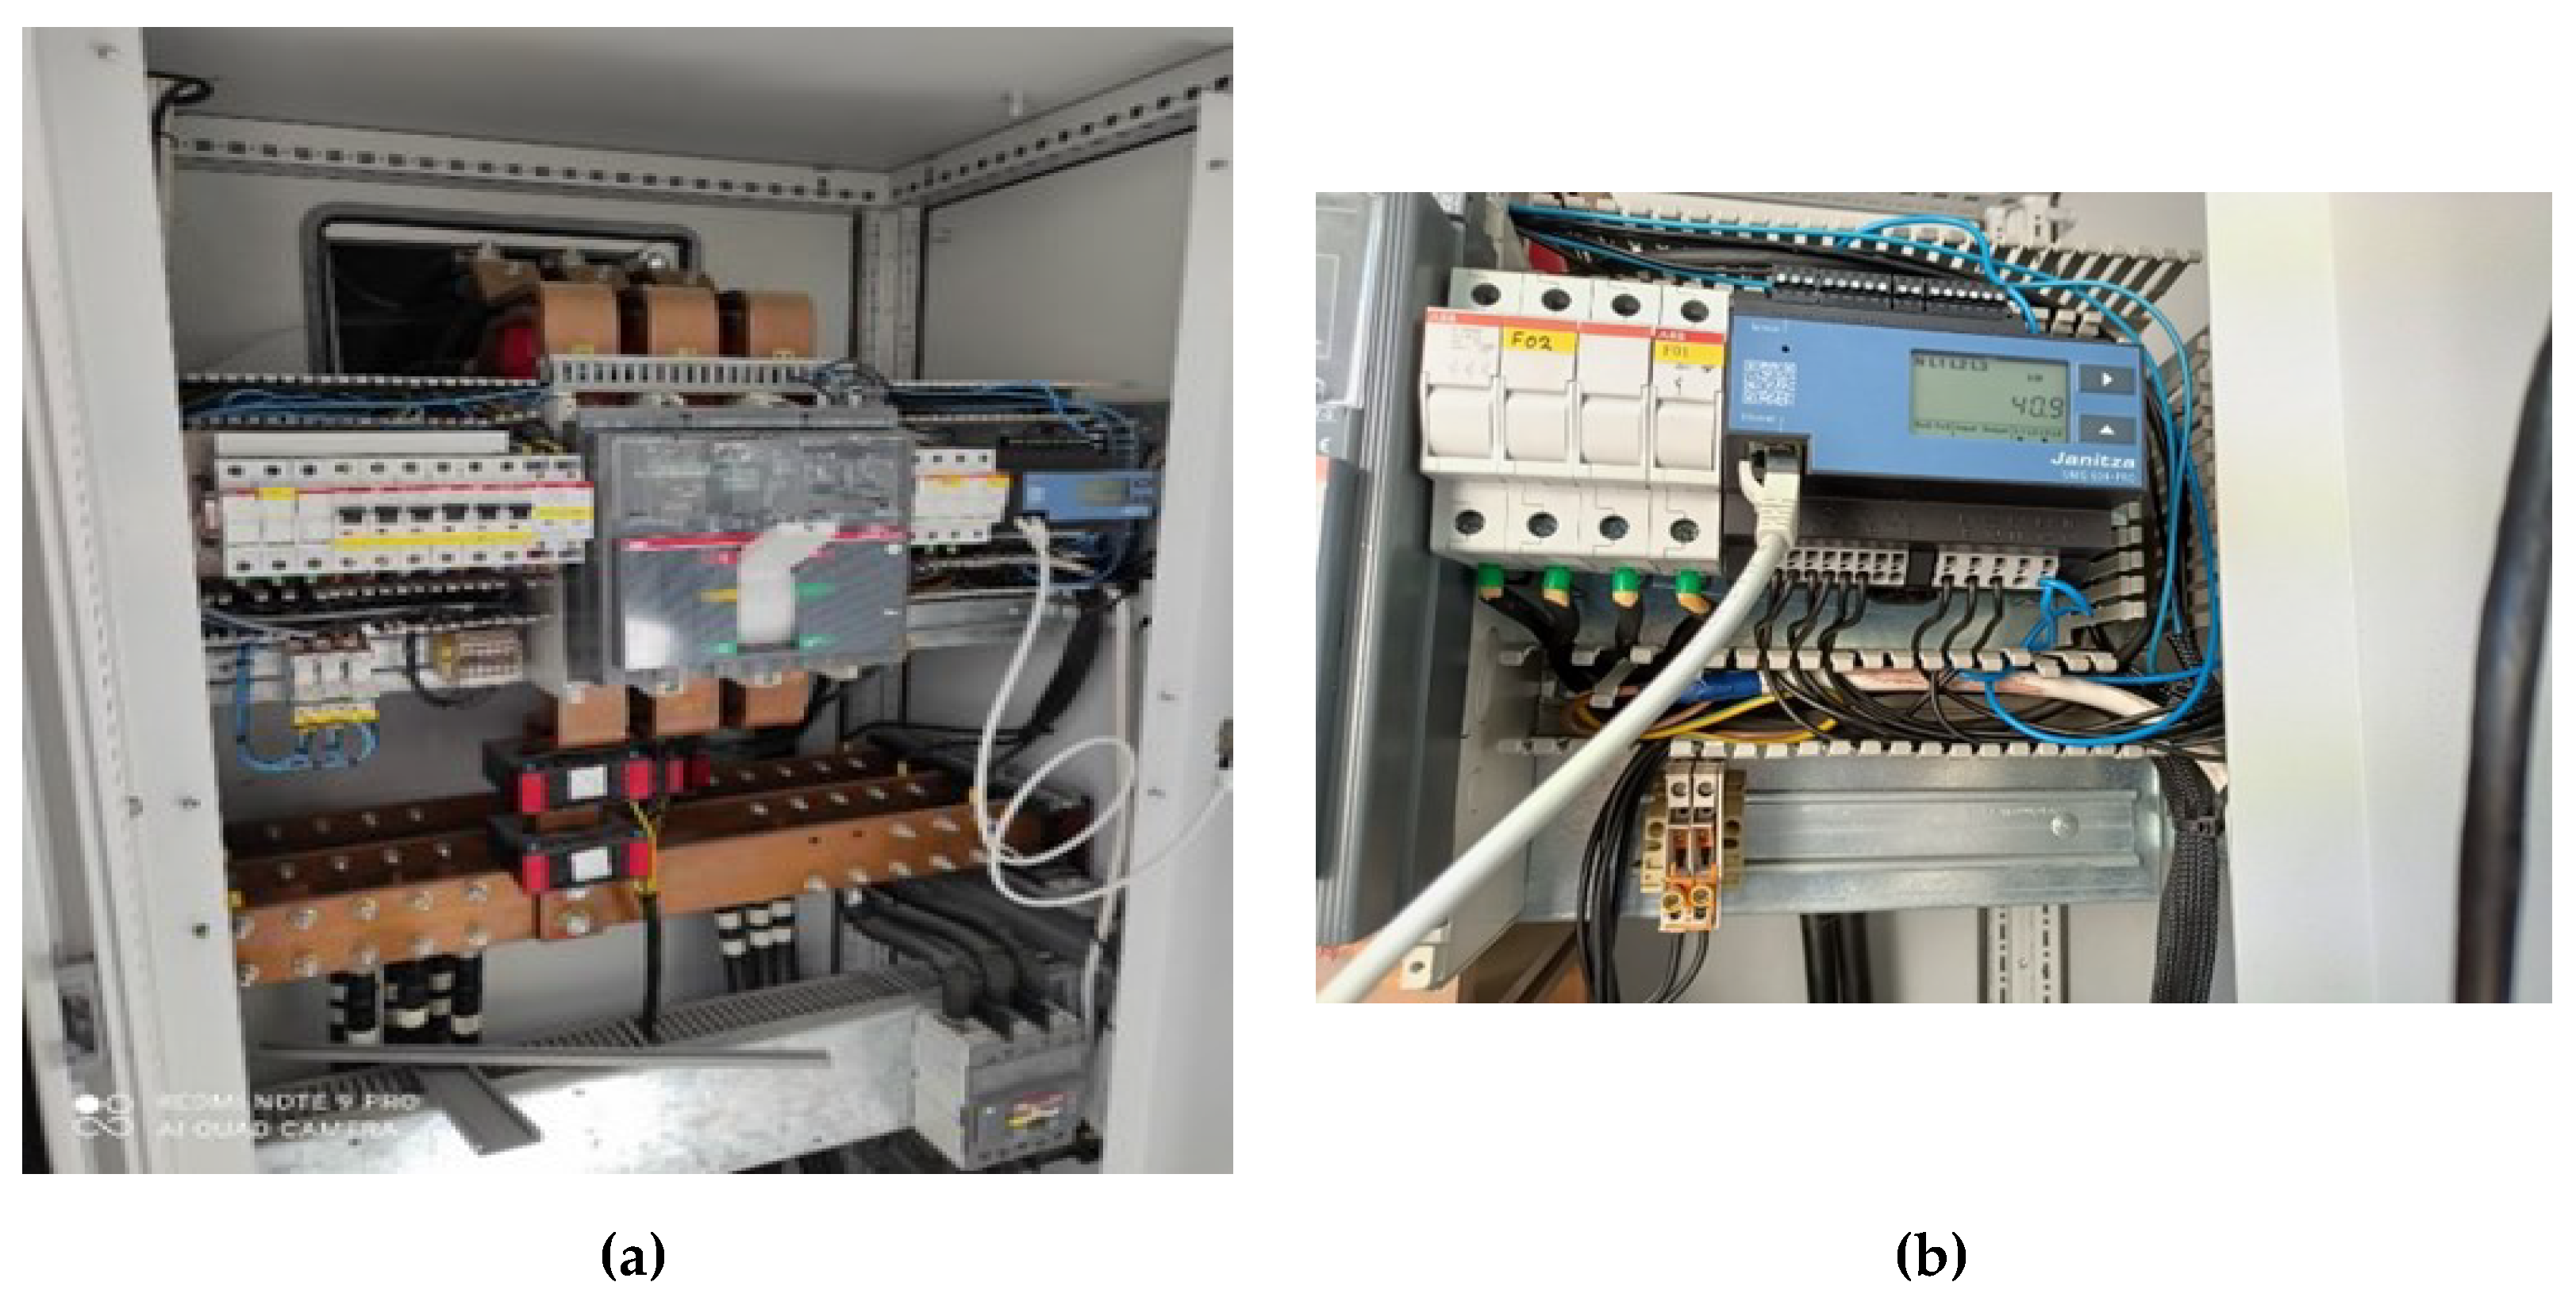
The instrument used is the "Power analyzer UMG 604-PRO" from the German company Janitza. It measures and calculates electrical variables such as voltage, current, power, and energy, in building installations, distribution units, and low voltage networks where nominal voltages of up to 300 V (Phase to Ground) and overvoltages may occur. It required the use of current transformers in the ratio of 1200 to 5 A. Measurements are acquired every 15 minutes, displayed, read and further processed via the Ethernet interface of the device. The current installation setup is depicted in Figure 2.
Through the GridVis software, time series of Voltage, Current, Active and Reactive Power measurements were extracted, per phase, on the side of the low-voltage network. These time series were stored as Excel files on the PC where the software is running and compose the expected energy consumption profile.
Table 1 shows the monthly energy consumption before the transformer, EBT (Figure 1) as recorded by the electricity provider as well as the monthly energy consumption as recorded by the metering equipment (Figure 2) installed after the transformer, EAT (Figure 1).
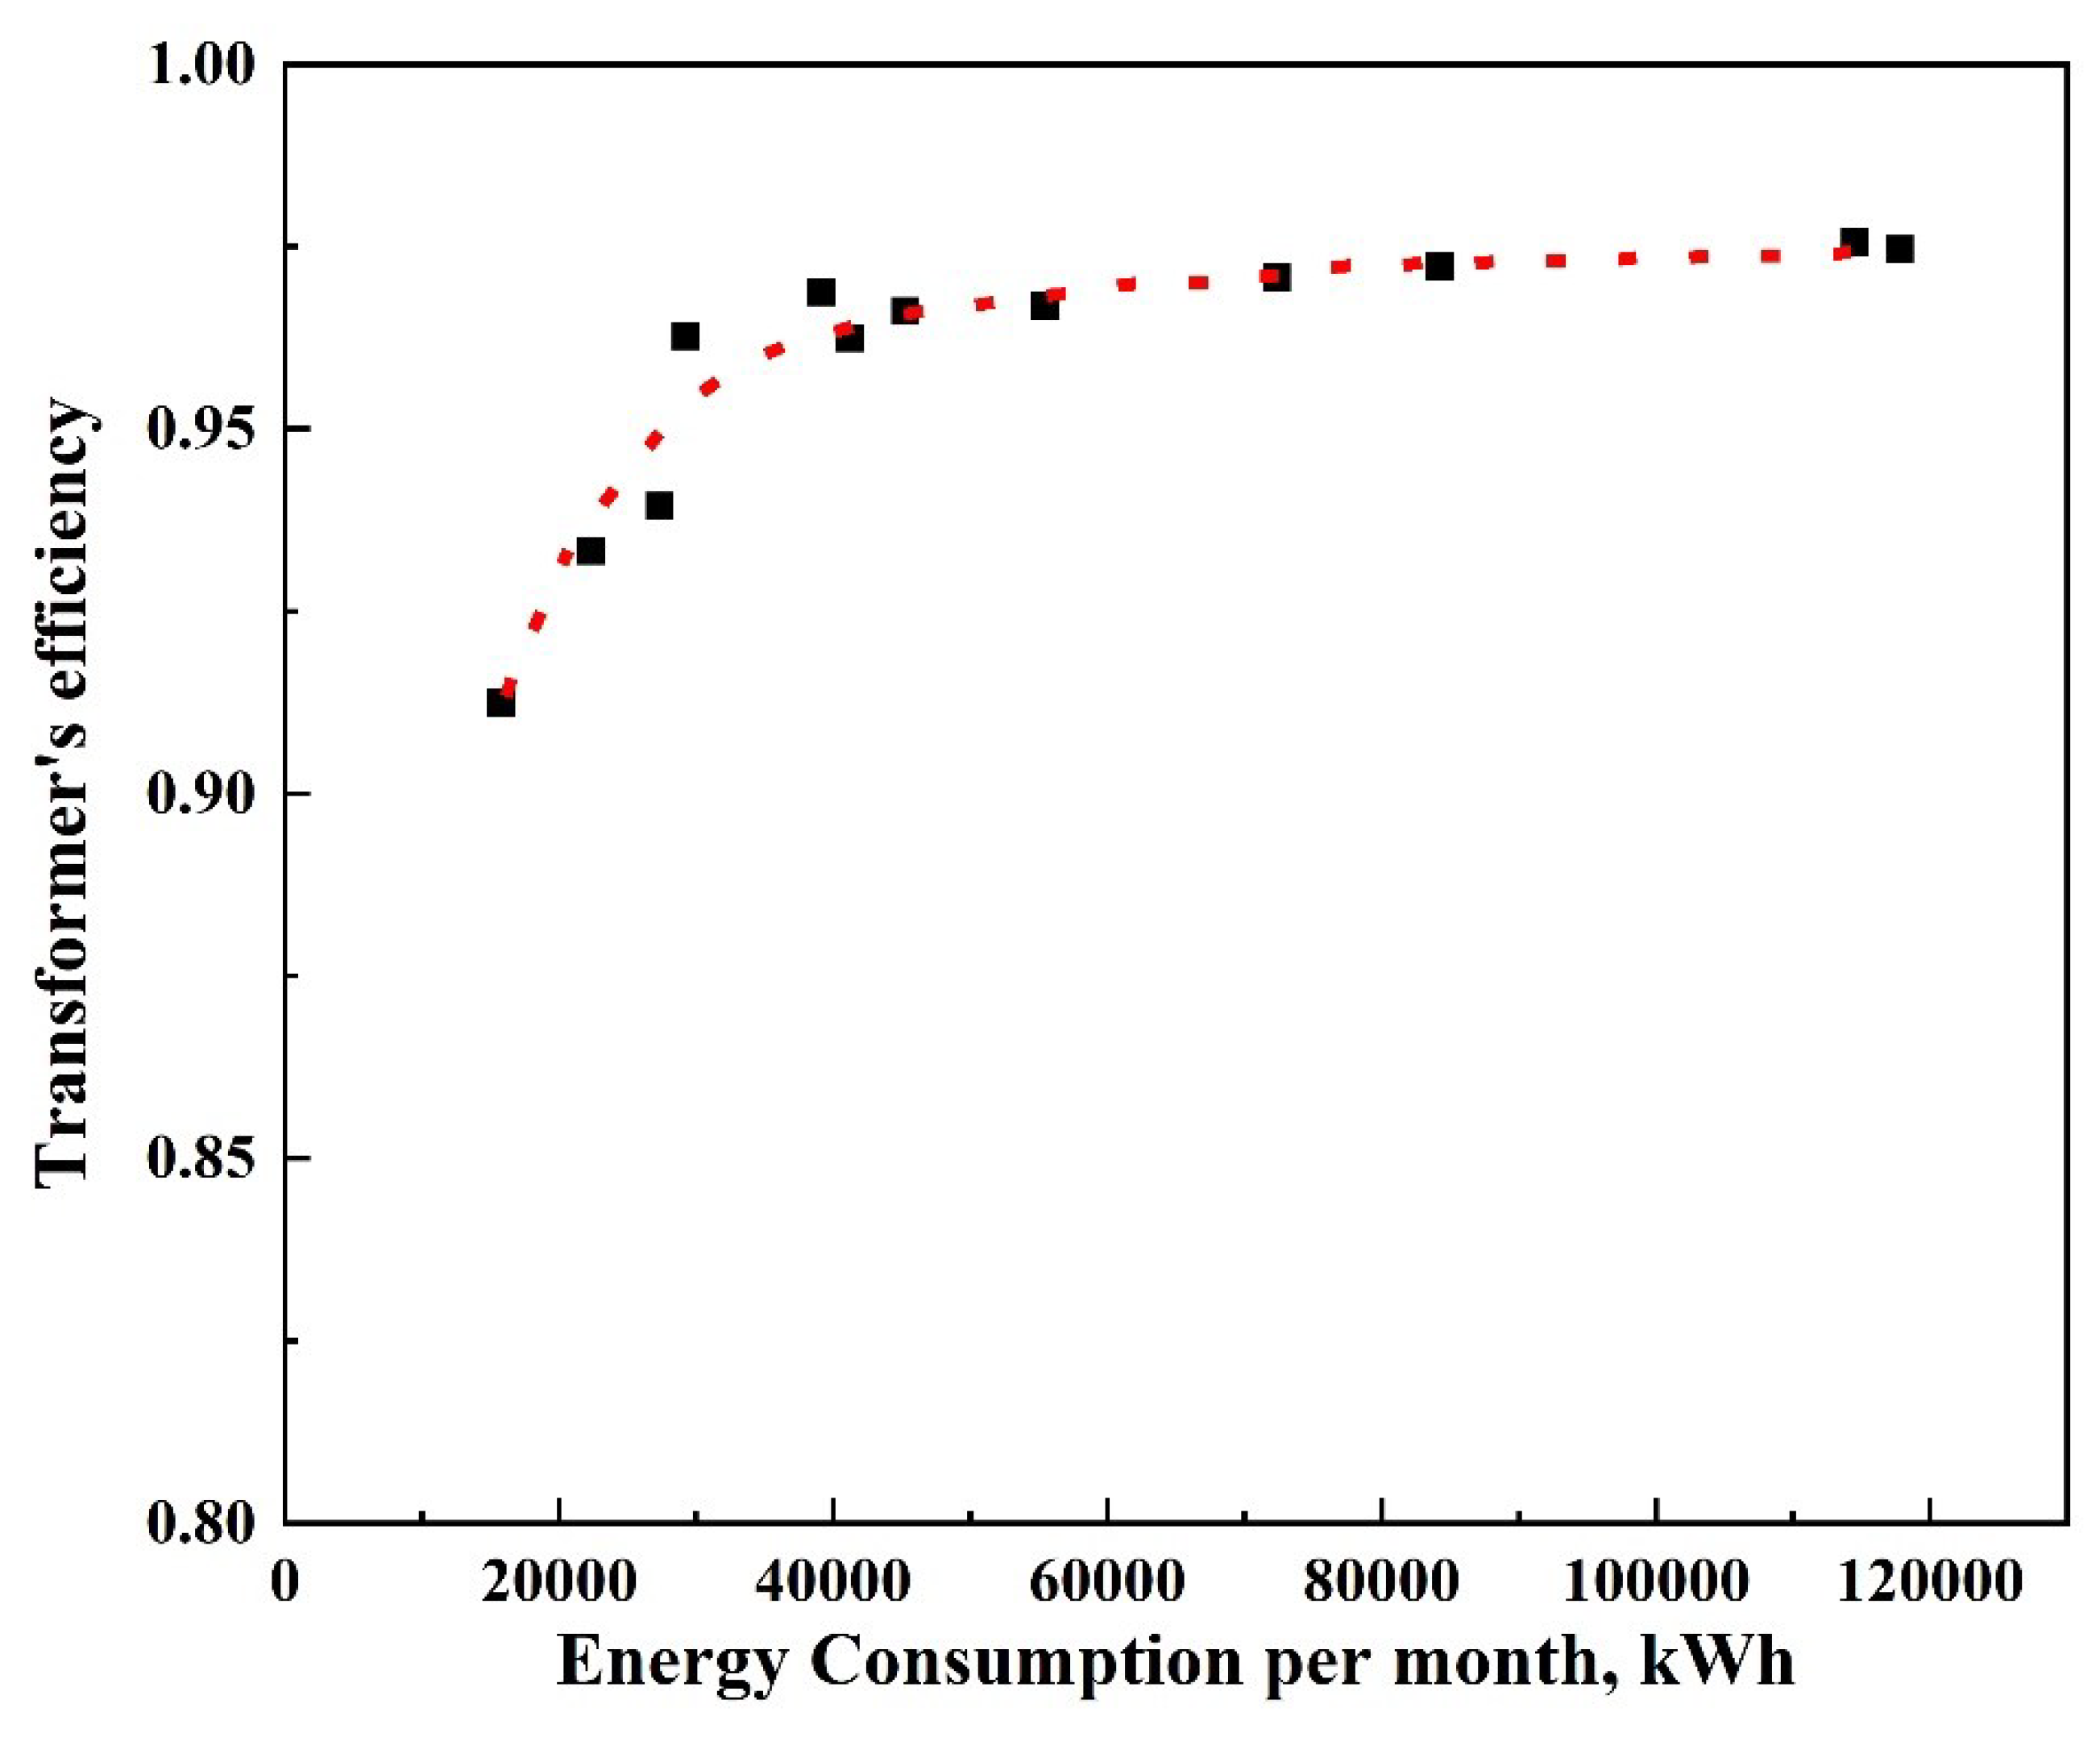
Figure 3 shows the change in the EAT/EBT ratio, which essentially represents the mean efficiency of the transformer, as a function of the energy consumed each month, measured before the transformer.
It becomes obvious that when the energy requirement of the GHU is not high (<40MWh) then the efficiency of the transformer is less than 97-98%. Optimum efficiency (97-98%) occurs when the energy requirement exceeds 40MWh per month.

3. Results and Discussion

3.1. Analysis of Load Profile

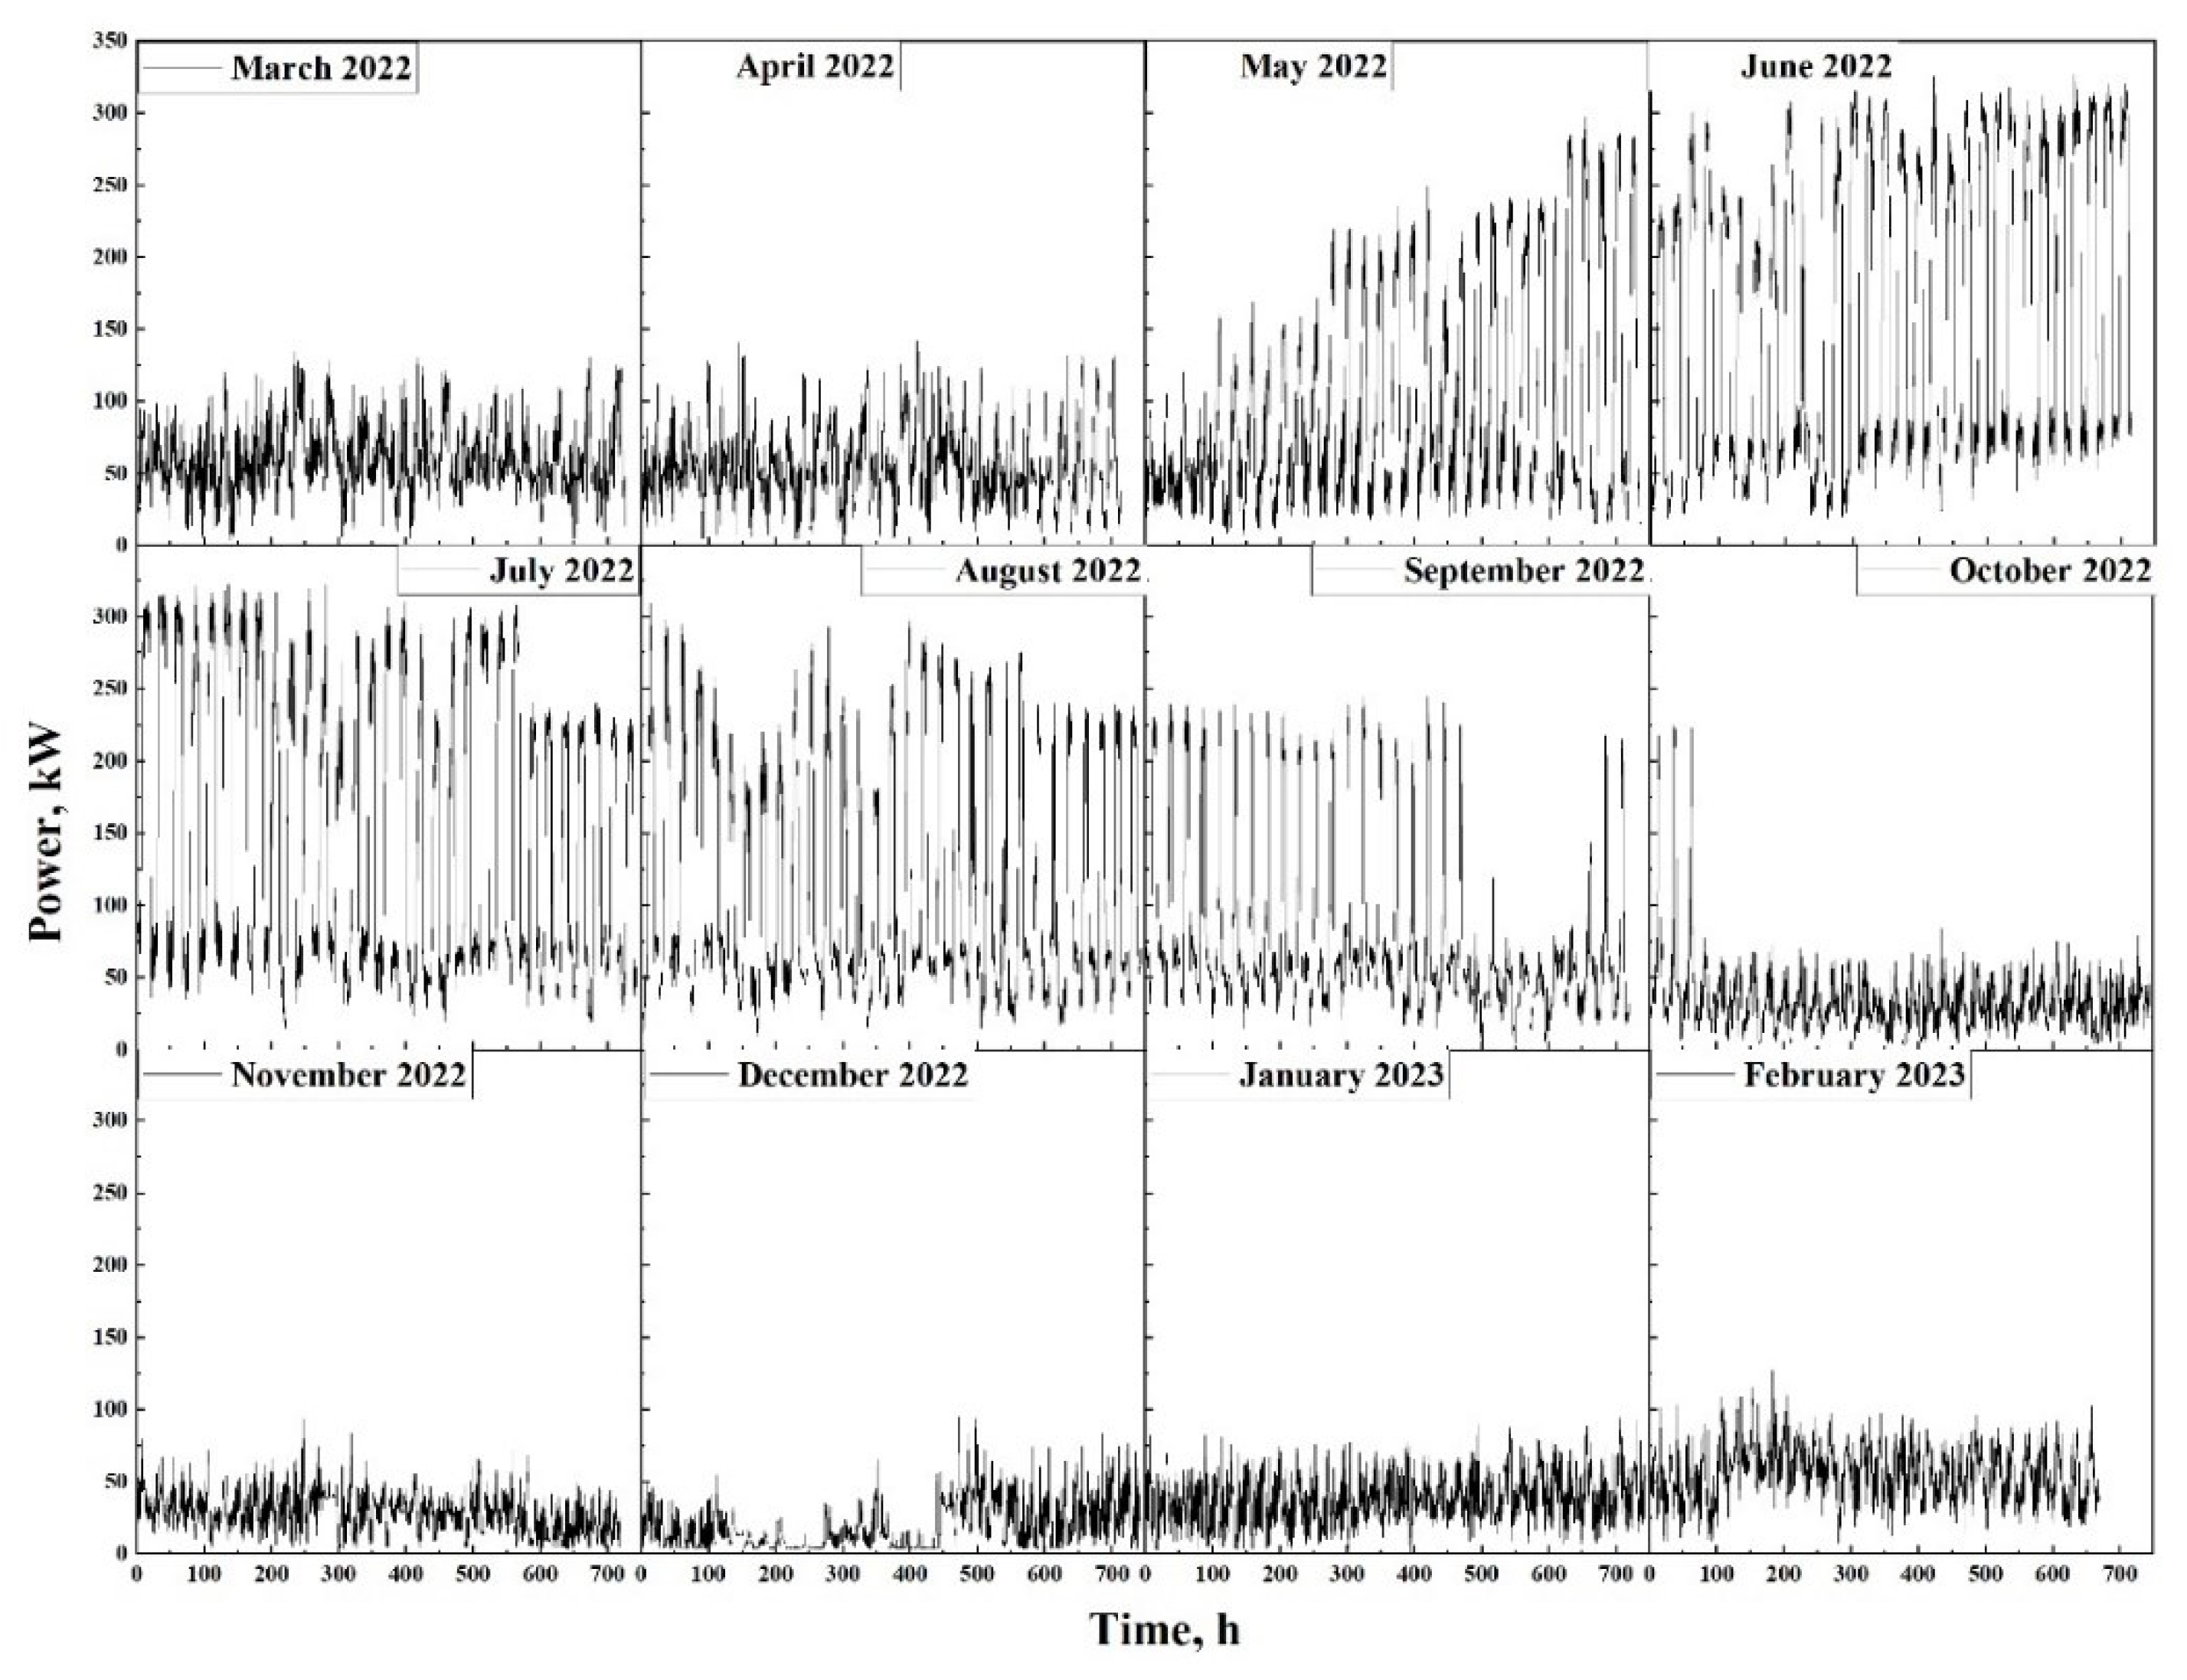
Figure 4 depicts the GHU energy consumption profile for a whole year. The energy recordings cover the period from 1/3/2022 until 28/2/2023 with sampling every 15 minutes.
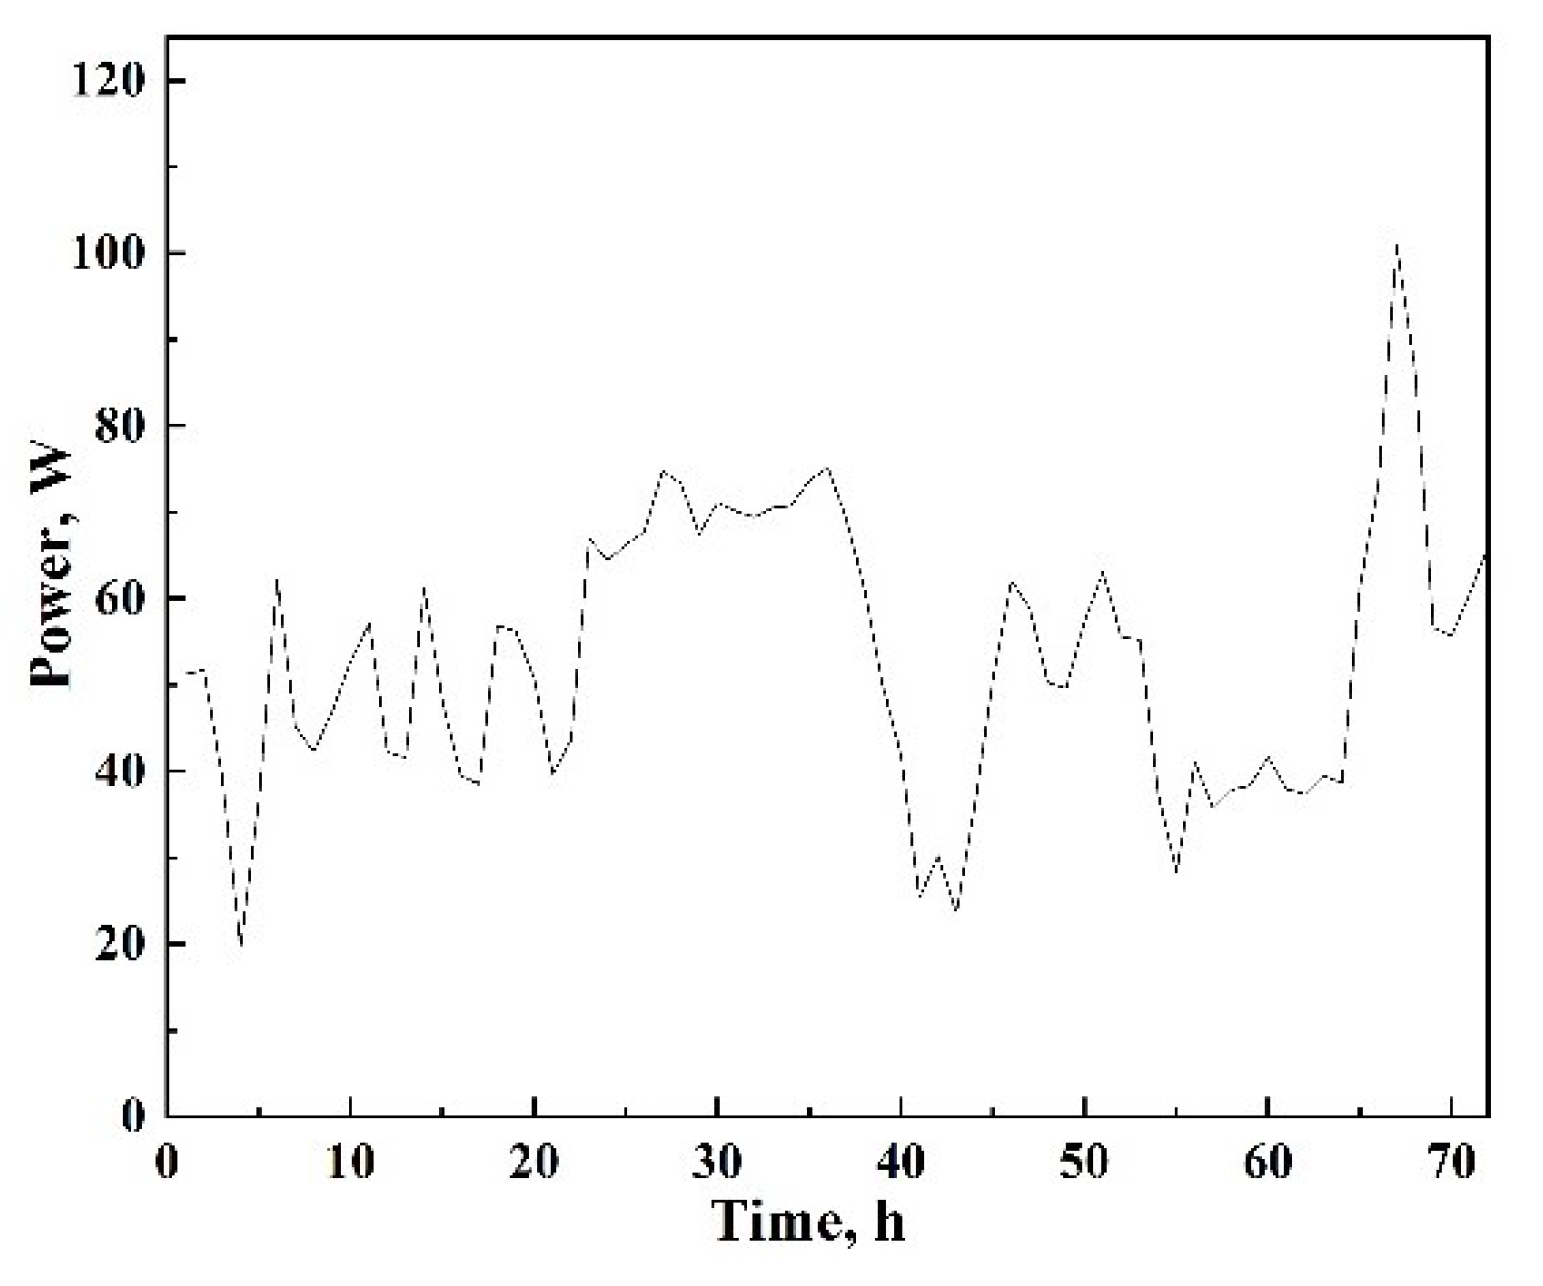
According to the monthly energy consumption requirements, two periods can be distinguished. One period concerns the months October to April, and another that concerns the months May to September. In the first period, the maximum power requirement during the 15-minute recording period shall not exceed 125 kW. During this particular period, the temperature control inside the GHU is mainly done with geothermal energy, so there is not much demand for electrical energy. A typical profile of three consecutive days at this period is shown in Figure 5.
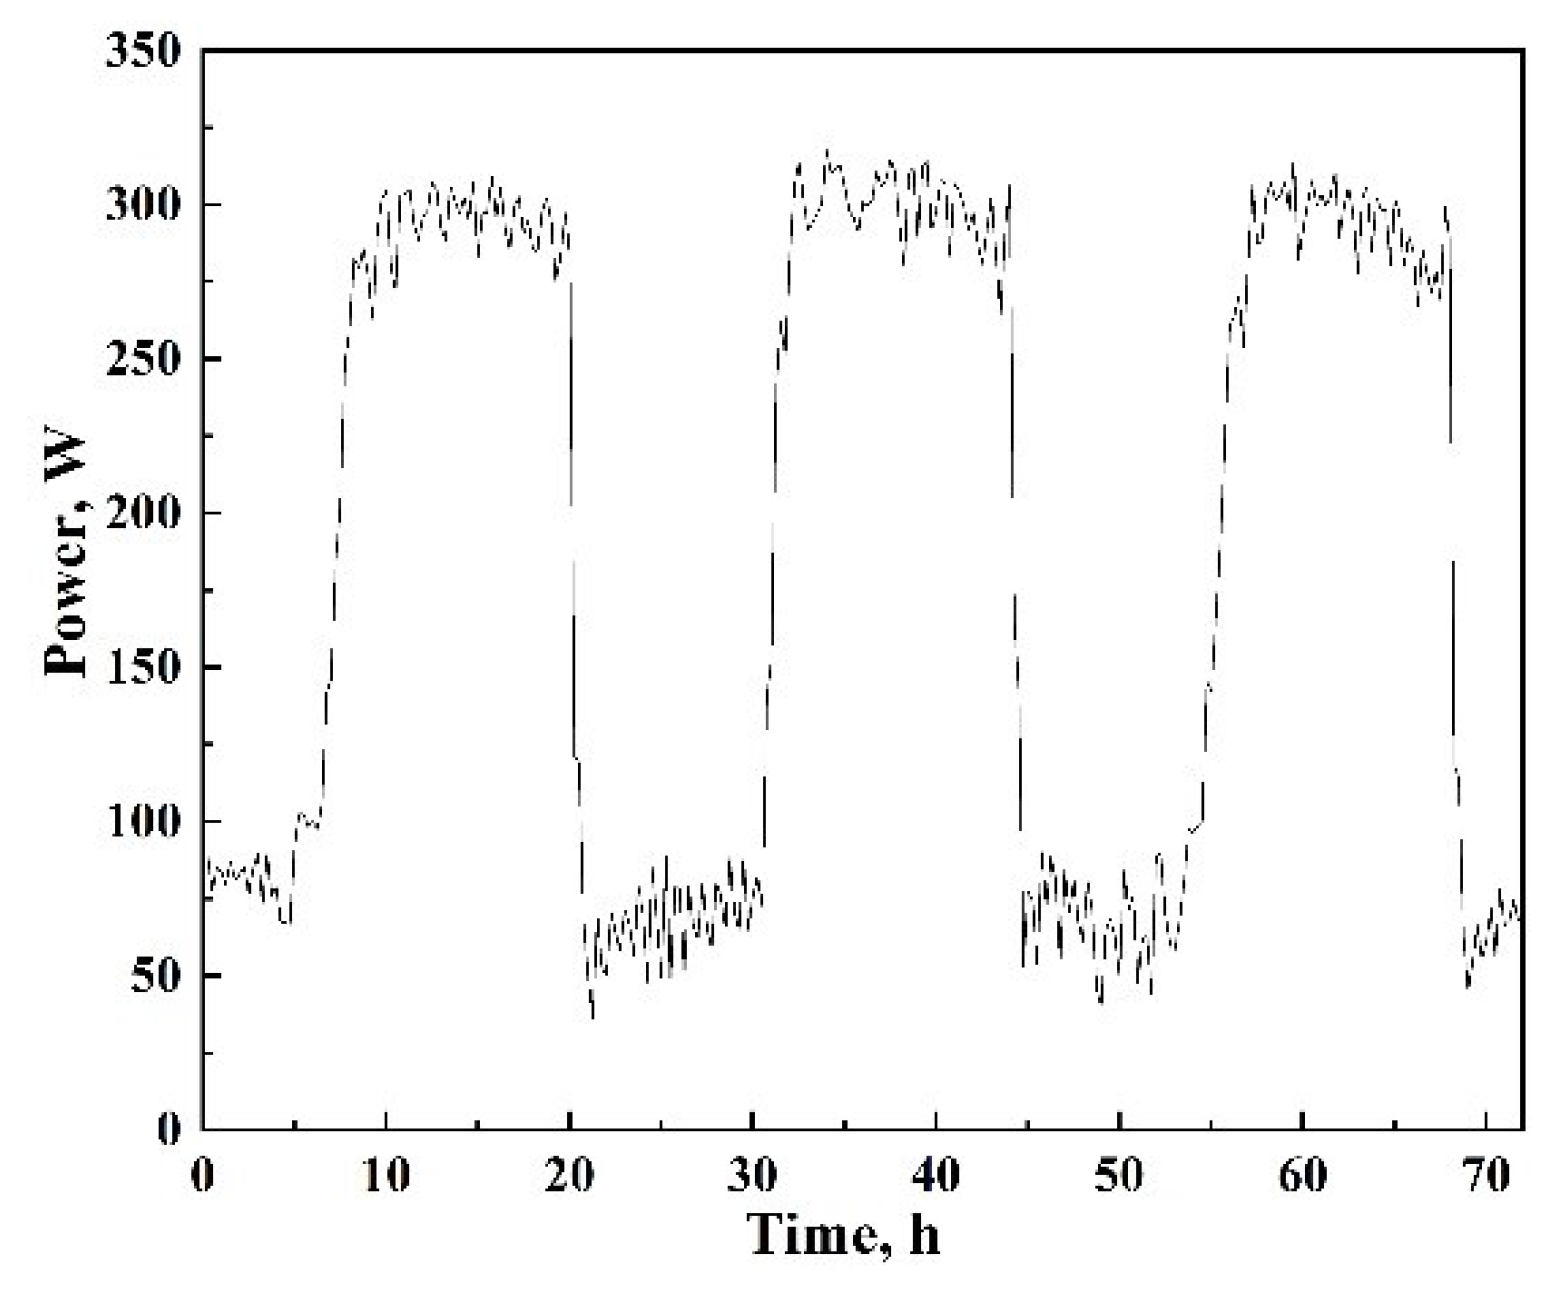
In the second period, i.e. during the summer months, temperature control is done using fans that operate mainly during daytime. Ιn Figure 6 the energy consumption profile for the first three days of July is given, which is typical for the entire period of GHU ventilation with fans (Months May to September, Figure 4). The use of fans takes place between 8:00 and 20:00. The power requirement ranges, for most of this interval, between 200 and 325 kW. For the rest of the day (20:00 – 8:00) the power requirement is reduced and ranges between 50 to 100kW.
Thus, over a year we could distinguish three areas of GHU load demand. The first range from 0 to 125kW, the second range from 125 – 200kW, and the third range from 200 – 350kW. The first area of energy consumption is observed all days of the year. However, there is a difference between the periods noted above. In the period from October to April it is the predominant load demand throughout the day, while in the period May – September the GHU requires power in this area only during the hours from 20:00 – 8:00. The second and third load demand areas occur only in the second period, i.e. from May to September.
The present study focuses on the use of a natural gas or biomethane generator to meet the energy needs of the GHU. The choice of this fuel is based on a recent study by the company concerning its estimation of Greenhouse residues’ biogas production [13,14]. The possibility of using constant generator power in the three load-demand areas will be studied. This will be firstly achieved, using three MGs. When the load demand belongs to the first range (0-125kW) one generator will operate. If the load needs belong to the second range (125 – 200kW), two generators will be activated. The generator of the first area, which will operate at maximum power, with one more generator. Finally, when the load requirements appear in the third range (200 – 350kW) then three generators will be activated. The two generators will operate for the first two areas (both at maximum power) and one more. In order to ensure the constant operation of the generators, it is necessary to use an energy storage system. More specifically, using only generators, their rated power should be equal to the maximum power of each of the areas defined above. That is, the first generator had a nominal power of 125kW, the second 75kW (because the second area has an upper limit of 125+75=200kW) and the third 150kW (because the third area has an upper limit of 125+75+150 = 350kW). This means that for long periods the generators would run at very low efficiency to cover very low loads. One way to avoid large fluctuations in generator operation is to select the power of each generator at an intermediate value of each operating area which will remain constant. Using a battery, energy will be absorbed when the load needs are less than the constant power of the generator in the respective operating range. If, on the contrary, the load requirements are higher than the power of the generator, then the battery will be discharged to fully service the load. It becomes obvious that in this way we keep the power of the generator stable and at the highest possible efficiency levels. The objective, therefore, is to identify the optimal combination of MGs and ESS and the optimal mode of operation (in terms of MGs’ efficiency and autonomous operation) of the MG-ESS system to meet the annual energy needs.

3.2. Operation algorithm

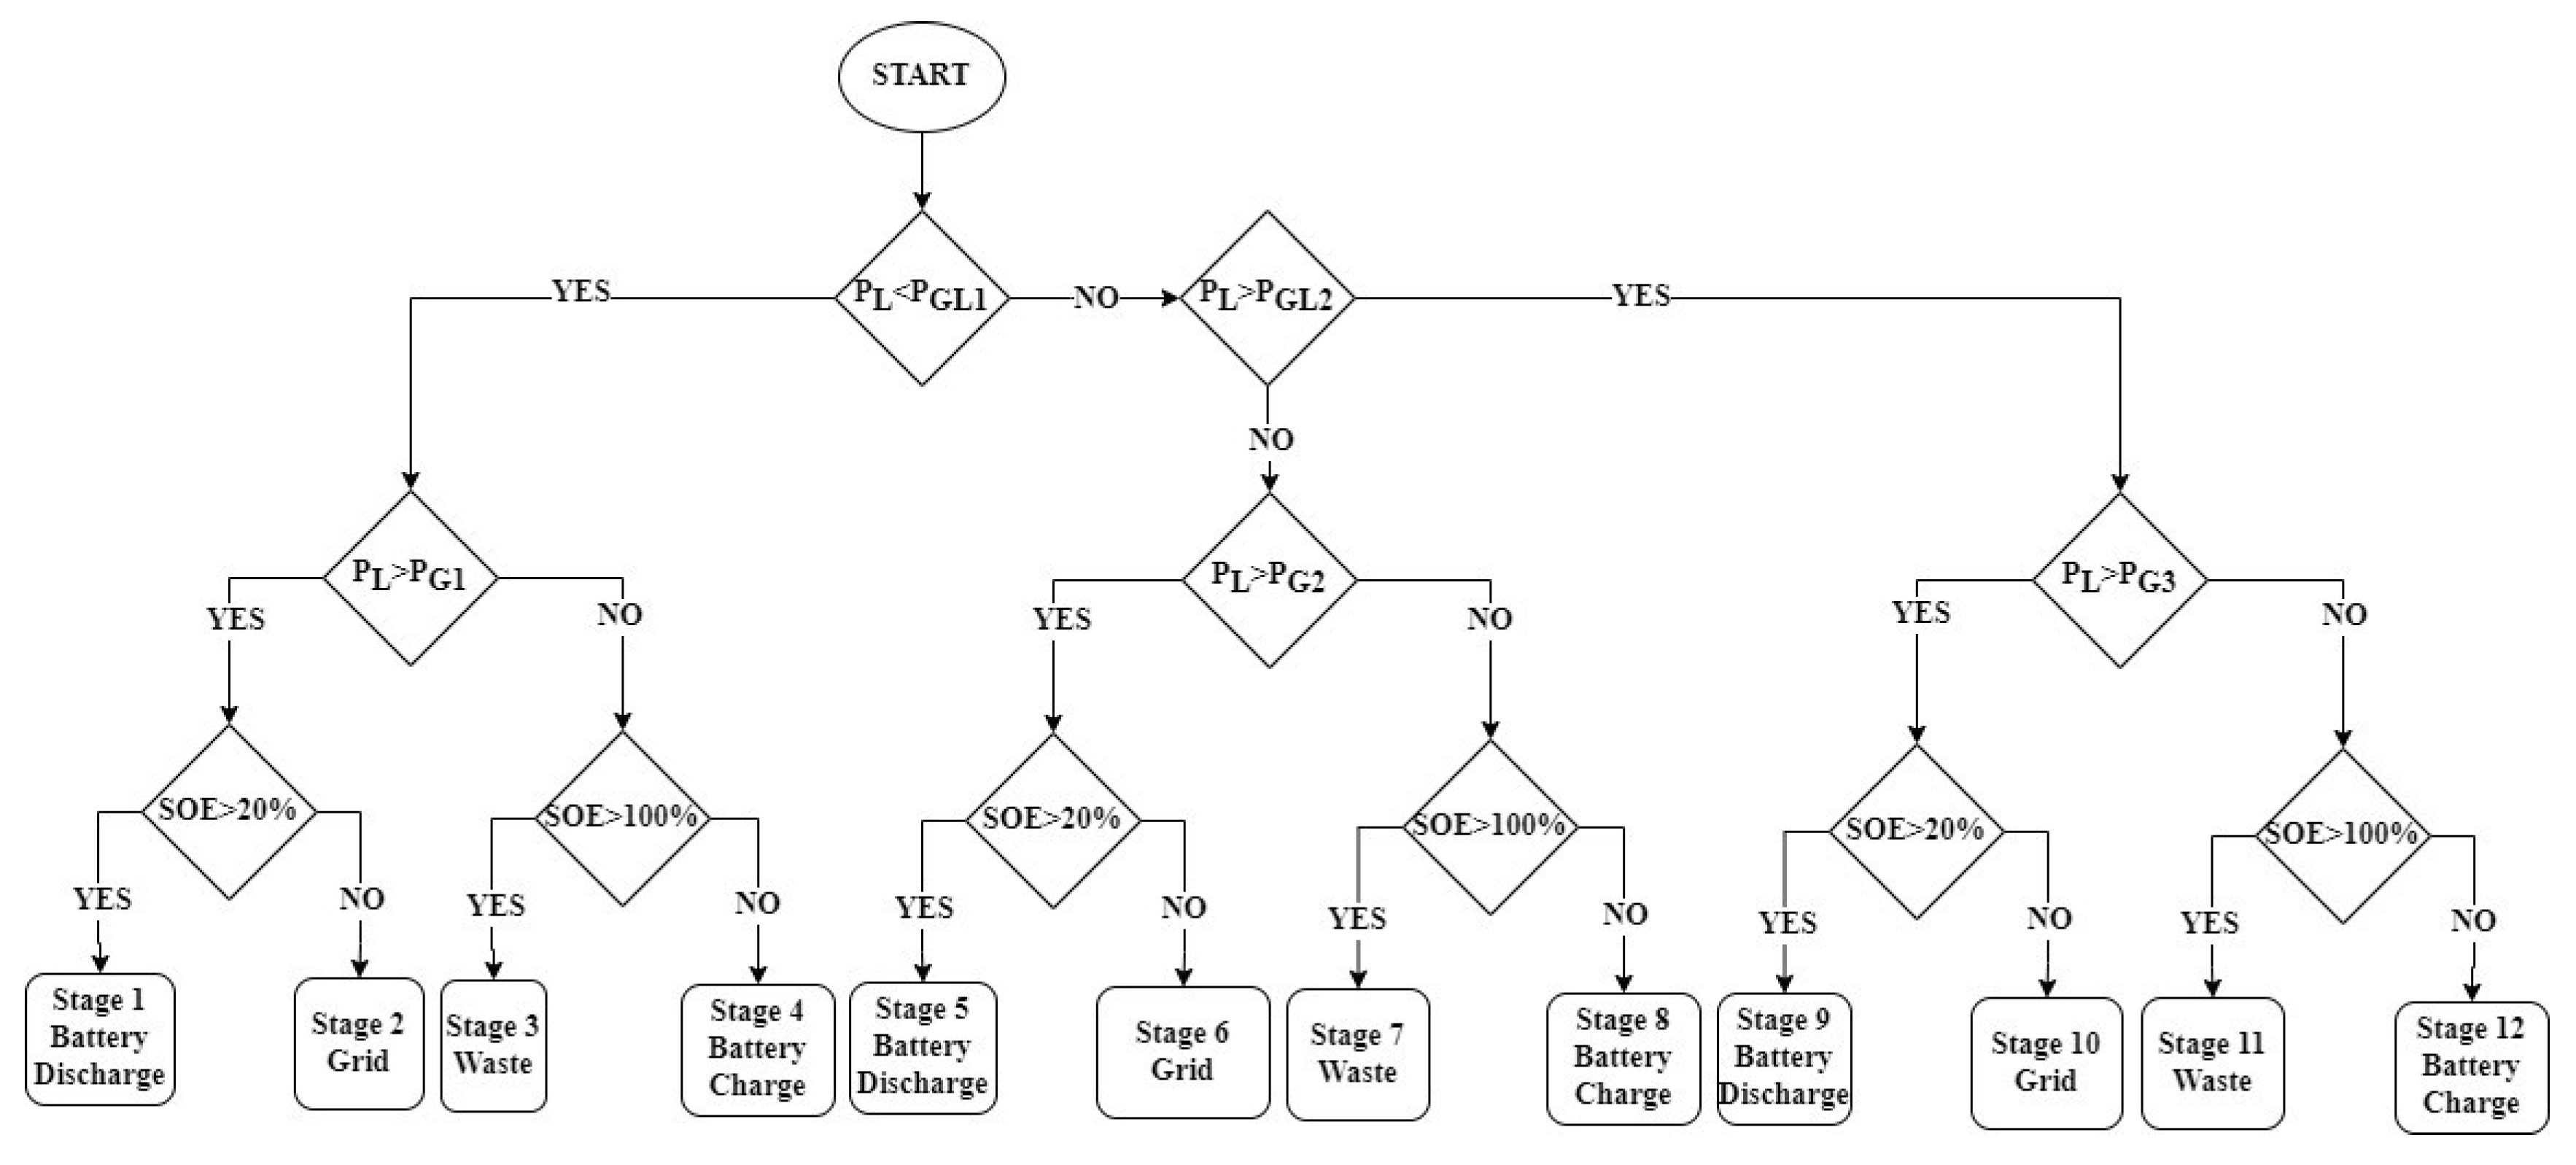
Figure 7 shows the operating algorithm of the MG-ESS system. Initially, values are given to the variables shown in Table 2 which are also the design parameters of the MG-ESS system. These design parameters remain constant until the completion of the algorithm, i.e. after 35040 checks.
As mentioned in a previous chapter three power regions (0 1 s t   R e g i o n 125kW 2 n d   R e g i o n 200kW 3 r d   R e g i o n 350kW) can be distinguished. We define PGL1 = 125kW and PGL2 = 200kW, the two power values that separate the first from the second region and the second from the third region, respectively. According to the discussion in Chapter 3.1, the algorithm first seeks the power region where the load demand belongs. When the algorithm detects the operating zone, the value of the demand load power (PL) is compared with the value of the generator’s operating power (PGi where i=1 or 2 or 3 the three operating regions – Design Parameter). If PL is higher than the PGi value, then the battery should contribute to cover the needs of the load together with the generator. However, it should be checked if the battery is able to support the power gap between the PL and the PGi. This is done by checking the battery state of energy (SOEt) at the time interval t, which is defined by the equation:
S O E t =   E B A T , t E B A T , N
With   E B A T , t the energy content of the battery at time t. To discharge the battery should S O E t > 20 %   . This limit was set for the safe operation of the battery [24]. Otherwise ( S O E t   20%) a backup power source should be used which should work in parallel with the generator to meet the needs of the load.
In case PL is less than the value of PGi then the system exhibits excess energy which should either be absorbed by the battery (battery charging) or should be discarded. The variable that the algorithm calculates to choose one of the two directions is again S O E t .    If S O E t 100% then the energy is discarded otherwise ( S O E t < 100%) the excess energy is used to charge the battery.
The same process takes place in whichever power range the demand power of the load belongs. So according to Figure 7, we can distinguish the following operating modes, which can occur in any region:
1st mode – Battery discharge (Stages 1, 5, 9)
When the difference (PGi – PL) is negative and S O E t 2 0% then the battery will be discharged. The amount of energy that will be used by the battery (EBAT,disch) to meet the needs of the load the time period Δt is:
EBAT,disch = (PL – PGi).Δt / ninv
Where ninv is the efficiency of the inverter with a value of 0.95. So, the energy required by the load (EL) at the specified time interval Δt (=15min) will be calculated by:
EL = PLΔt = PGi Δt + [(PL – PGi) Δt] / ninv
2nd mode – Energy deficit (Stages 2, 6, 10)
When the difference (PGi – PL) is negative and the S O E t < 2 0% then the reserve should be used to provide the required amount of energy (EBack):
ΕΒack = (PL – PGi) Δt
3rd mode – Waste of energy (Stages 3, 7, 11)
When the difference (PGi – PL) is positive and the SOEt 100% then excess energy should be disposed of. The amount of energy to be discarded (Ewaste) the time interval Δt is:
Ewaste = (PGi – PL) Δt
4th mode – Battery charging (Stages 4, 8, 12)
When the difference (PGi – PL) is positive and the SOEt < 100% then the excess energy will be used to charge the battery. The amount of energy that will be used to charge the battery (EBAT,ch) the time interval Δt, is:
EBAT,ch = (PGi – PL).ninv.nbat Δt
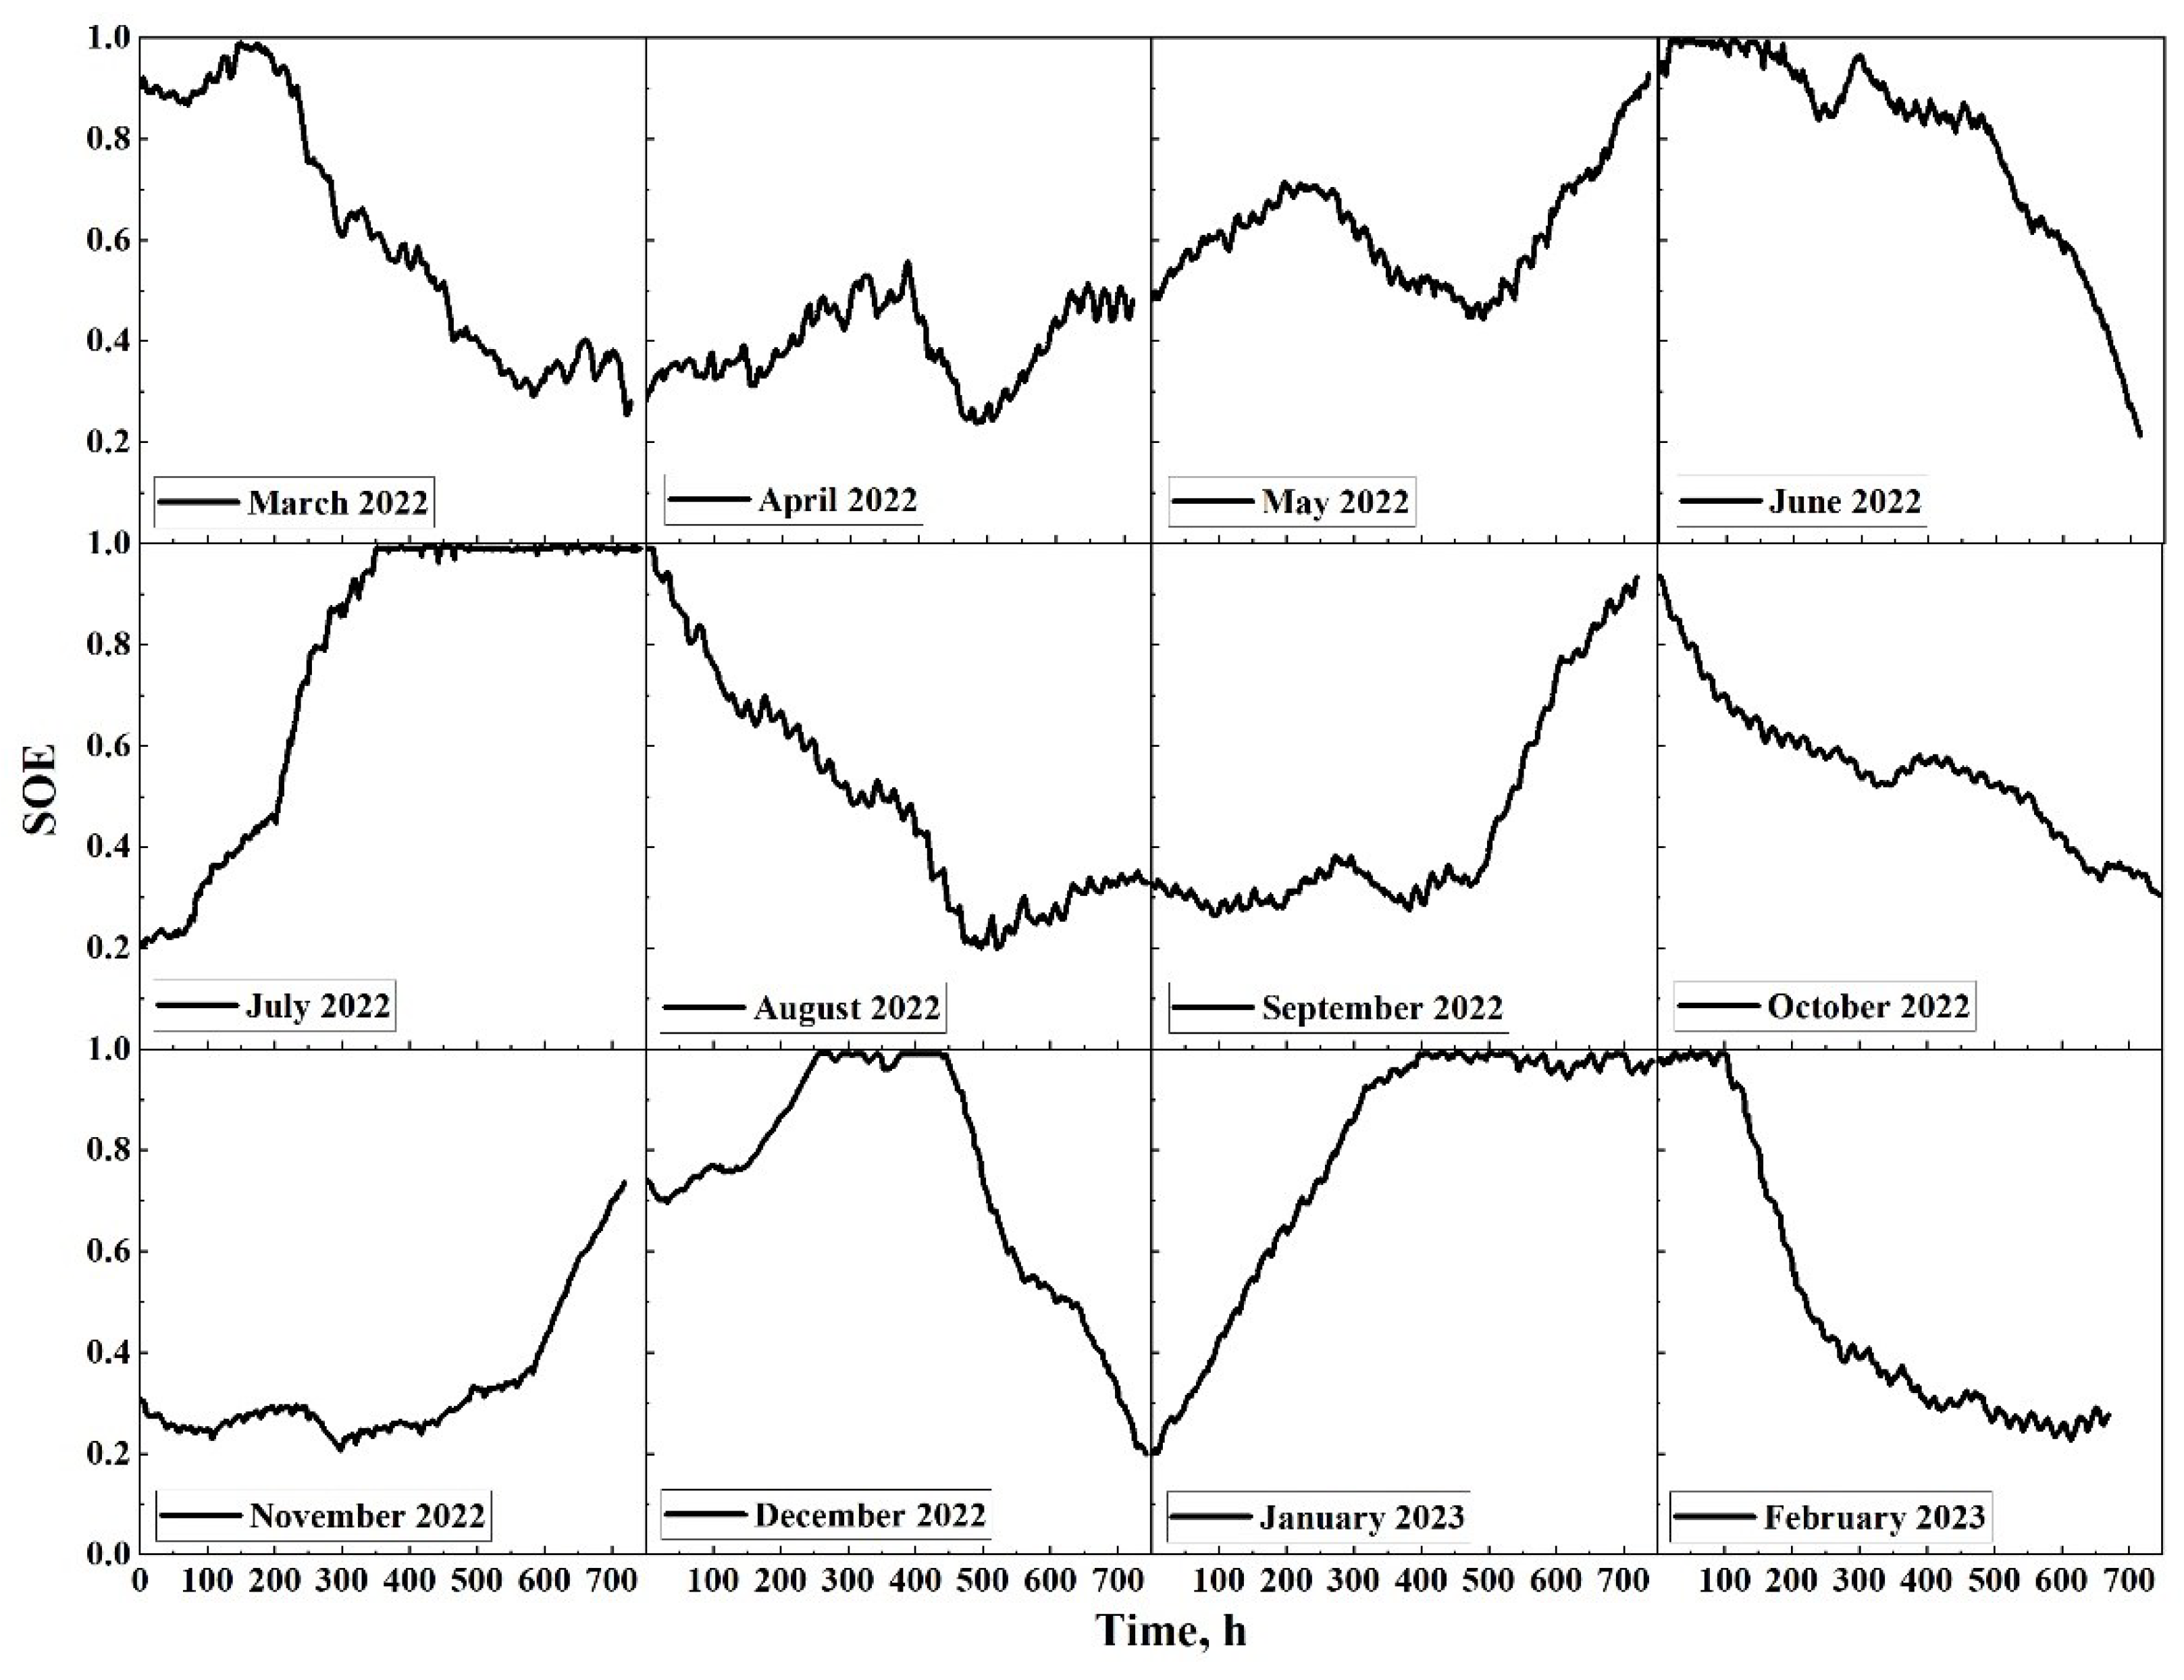
Where nbat is the energy efficiency, which is considered equal to 0.9 [25]. The study of the algorithm’s operation was done using the software excel and with the use of the add-in solver the optimal point of system’s operation was identified. The search for the optimal point was done by locating the operating point of the system (with regard to PGi and EBAT,N) so that the EBack and Ewaste approach zero. In other words, to ensure that the system operates autonomously (Εback = 0) with the least possible discard of energy (Ewaste = 0). Also, finding the optimal operating point was done for each month separately. The battery SOE at the start of each month was derived from the last period of the previous month as shown in Figure 8.
As shown in Figure 8, the battery SOE ranges between 20 and 100% throughout the year. Although zero energy deficit (EBack = 0) was achieved, this was not possible for excess energy. In other words, the system can operate autonomously but will not avoid energy rejection.
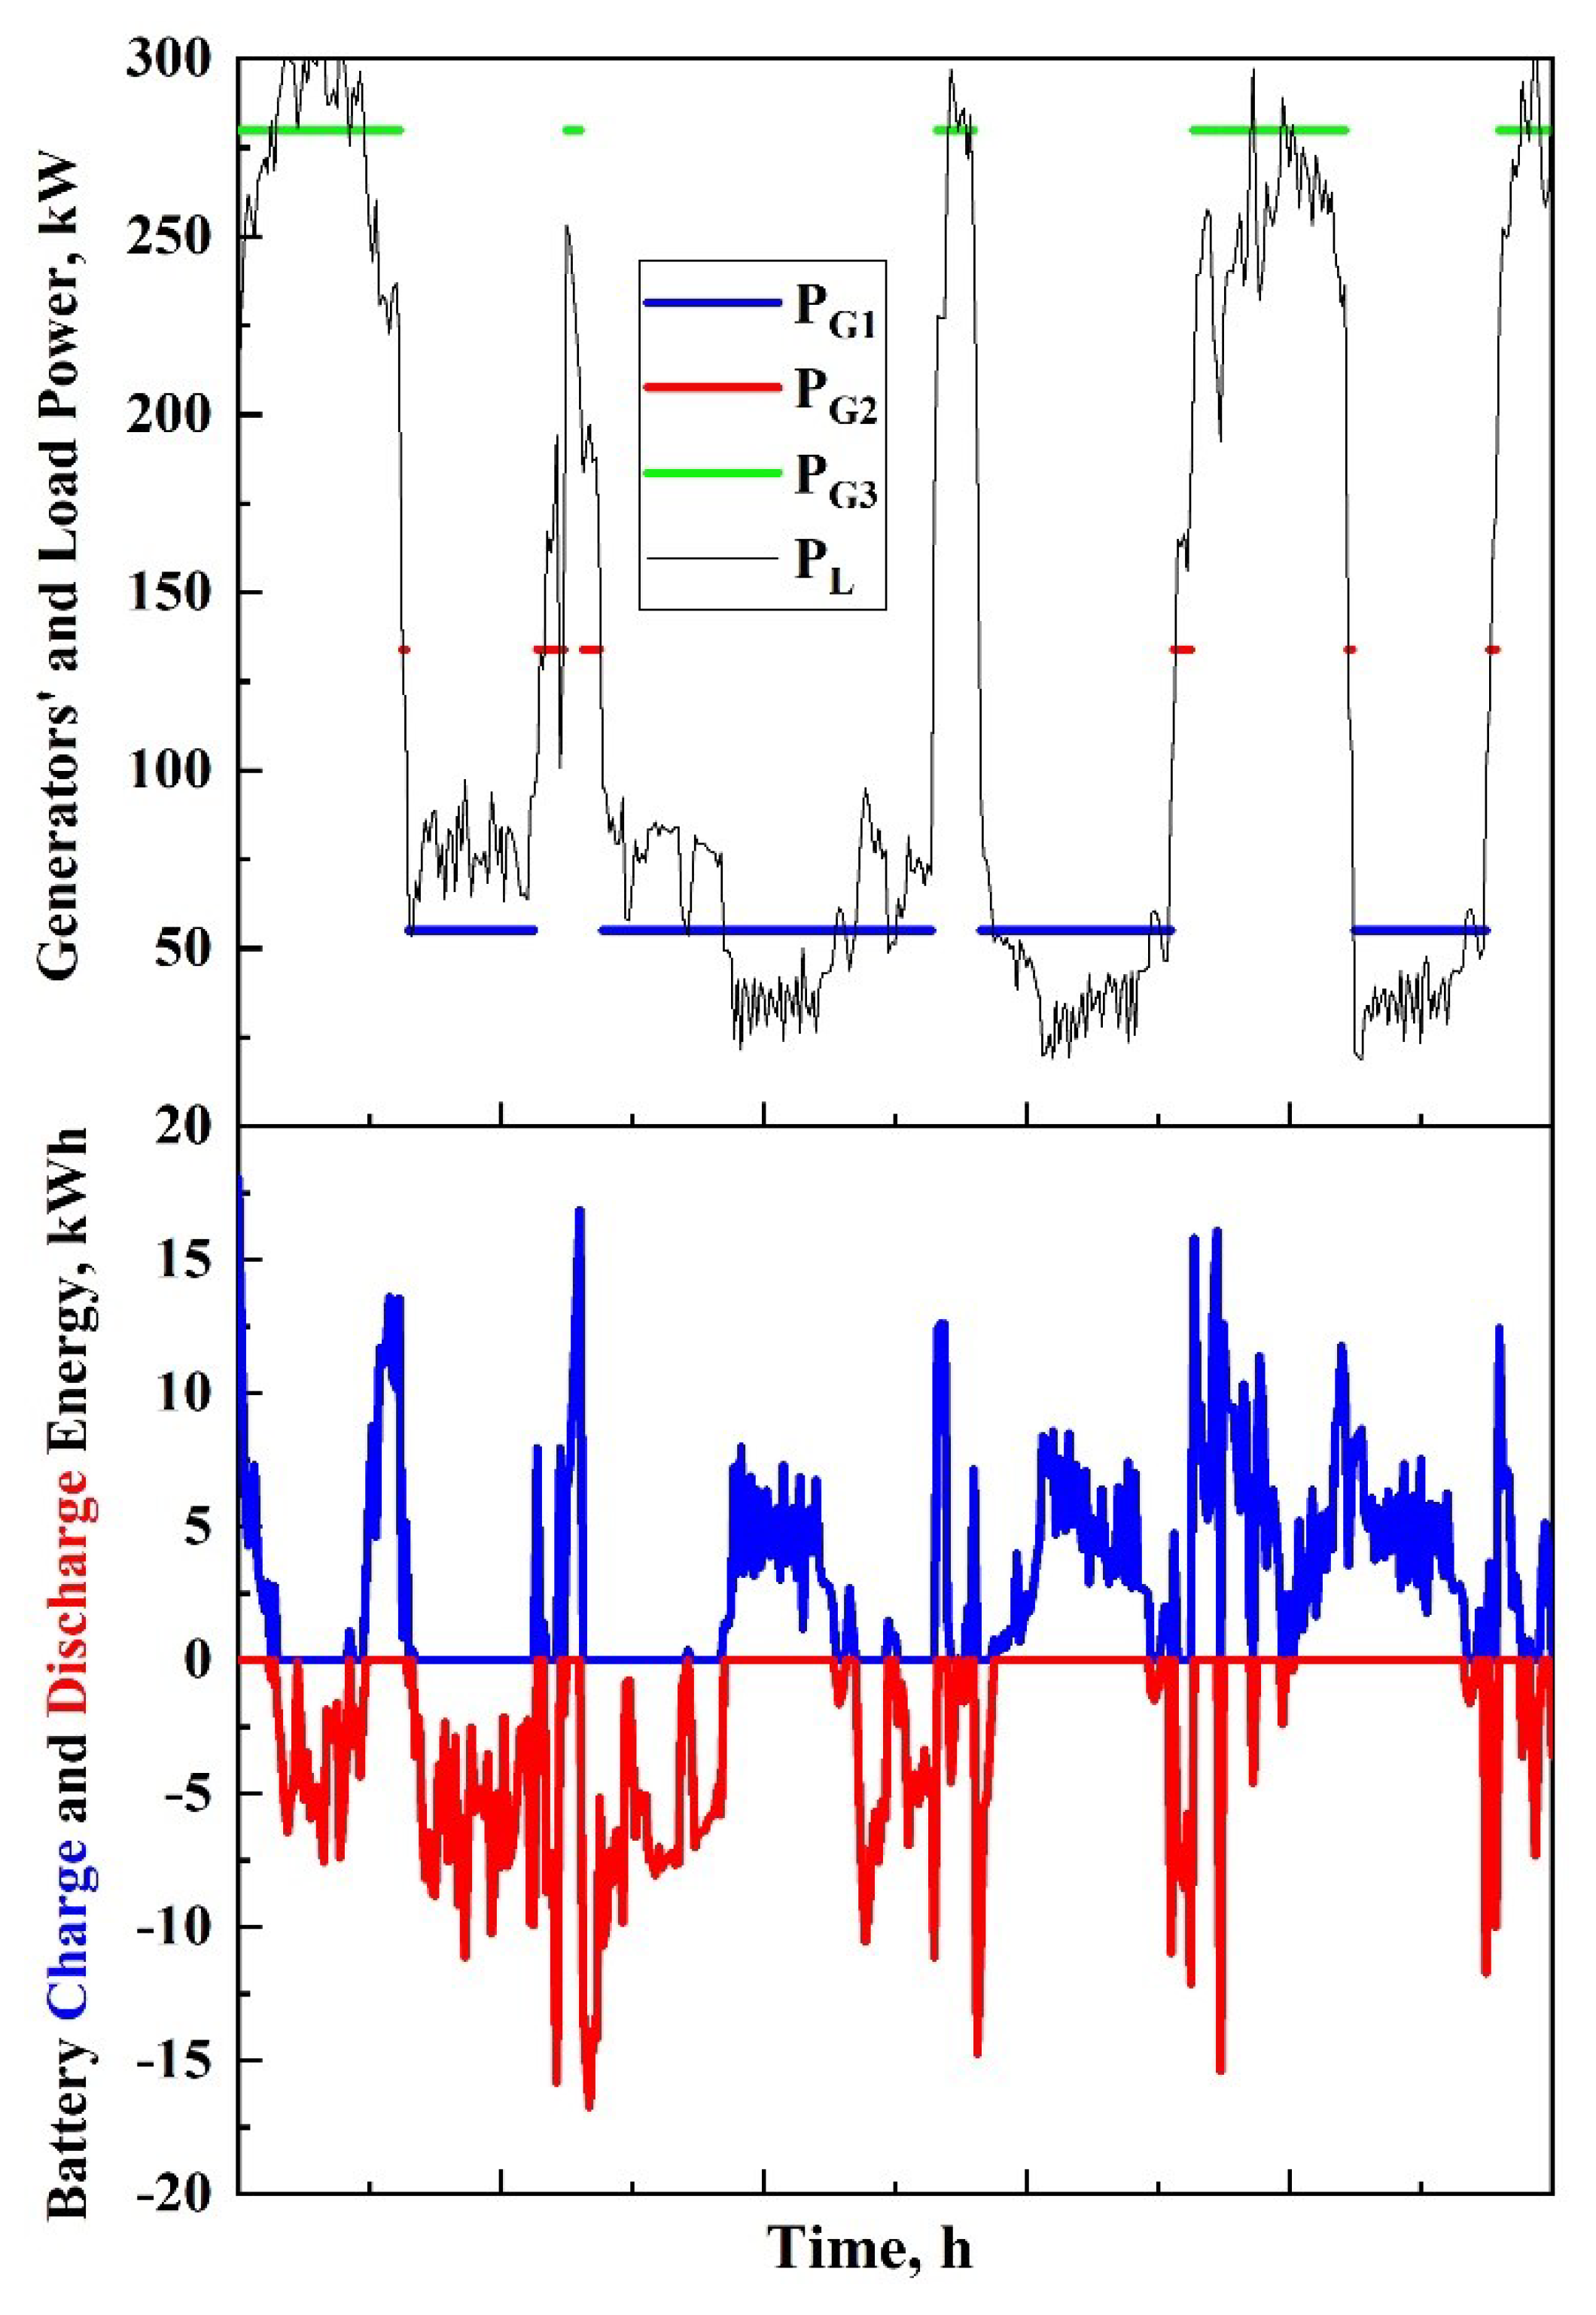
Figure 9 shows the results of the optimal operation of the algorithm for five consecutive days of June. Specifically, Figure 9a shows the operating intervals of the generators in the three operating areas for these five consecutive days of June.
The blue color (Figure 9a) refers to the stable operation of the first generator in the range 0 – 125kW. The red line refers to the periods of stable operation of the two generators in the range 125 – 200kW. Finally, the green line concerns the operation of all three generators in the range 200 – 350kW. In the second area (red curve), which is essentially the transitional state from the first to the third area, the generators operate for a short period of time ranging from 30 to 135 minutes. Figure 9b shows the energy charging the battery (blue curve) when the operating power of the generators is greater than the load demand power and the discharge energy of the battery (red curve) when the operating power of the generators is less than the load demand power.
Table 3 shows the maximum constant power that the generator should have in order for the power supply system to operate optimally in the three different zones (PG1, PG2 and PG3), as discussed above.
In the first range, the generator always operates. The maximum power, according to the simulation, will not exceed 75kW for this range. This level of power was detected in July. In other words, when the generator operates in that month in the first region, it works at a constant power of 75 kW. The minimum level of operation of the generator concerns the month of December. When it should operate only in the first range, it should be set to work constantly at 18kW. As can be seen from Table 3, the generator should operate in the second and third areas during the months of May to October. This was expected according to the consumption profile (Figure 4) and the way the algorithm works (Figure 7). In the second area, the generator will operate at a constant power of 150kW in September and October. While for the months of May to August the constant operating power of the generator in the second range will be between 130 – 149.7kW. Similarly, for the third region, the generator operates at a constant power in a range of 209.7 to 295 kW. Specifically, in July, when the generator needs to operate in the third region, it will constantly operate at 295kW.
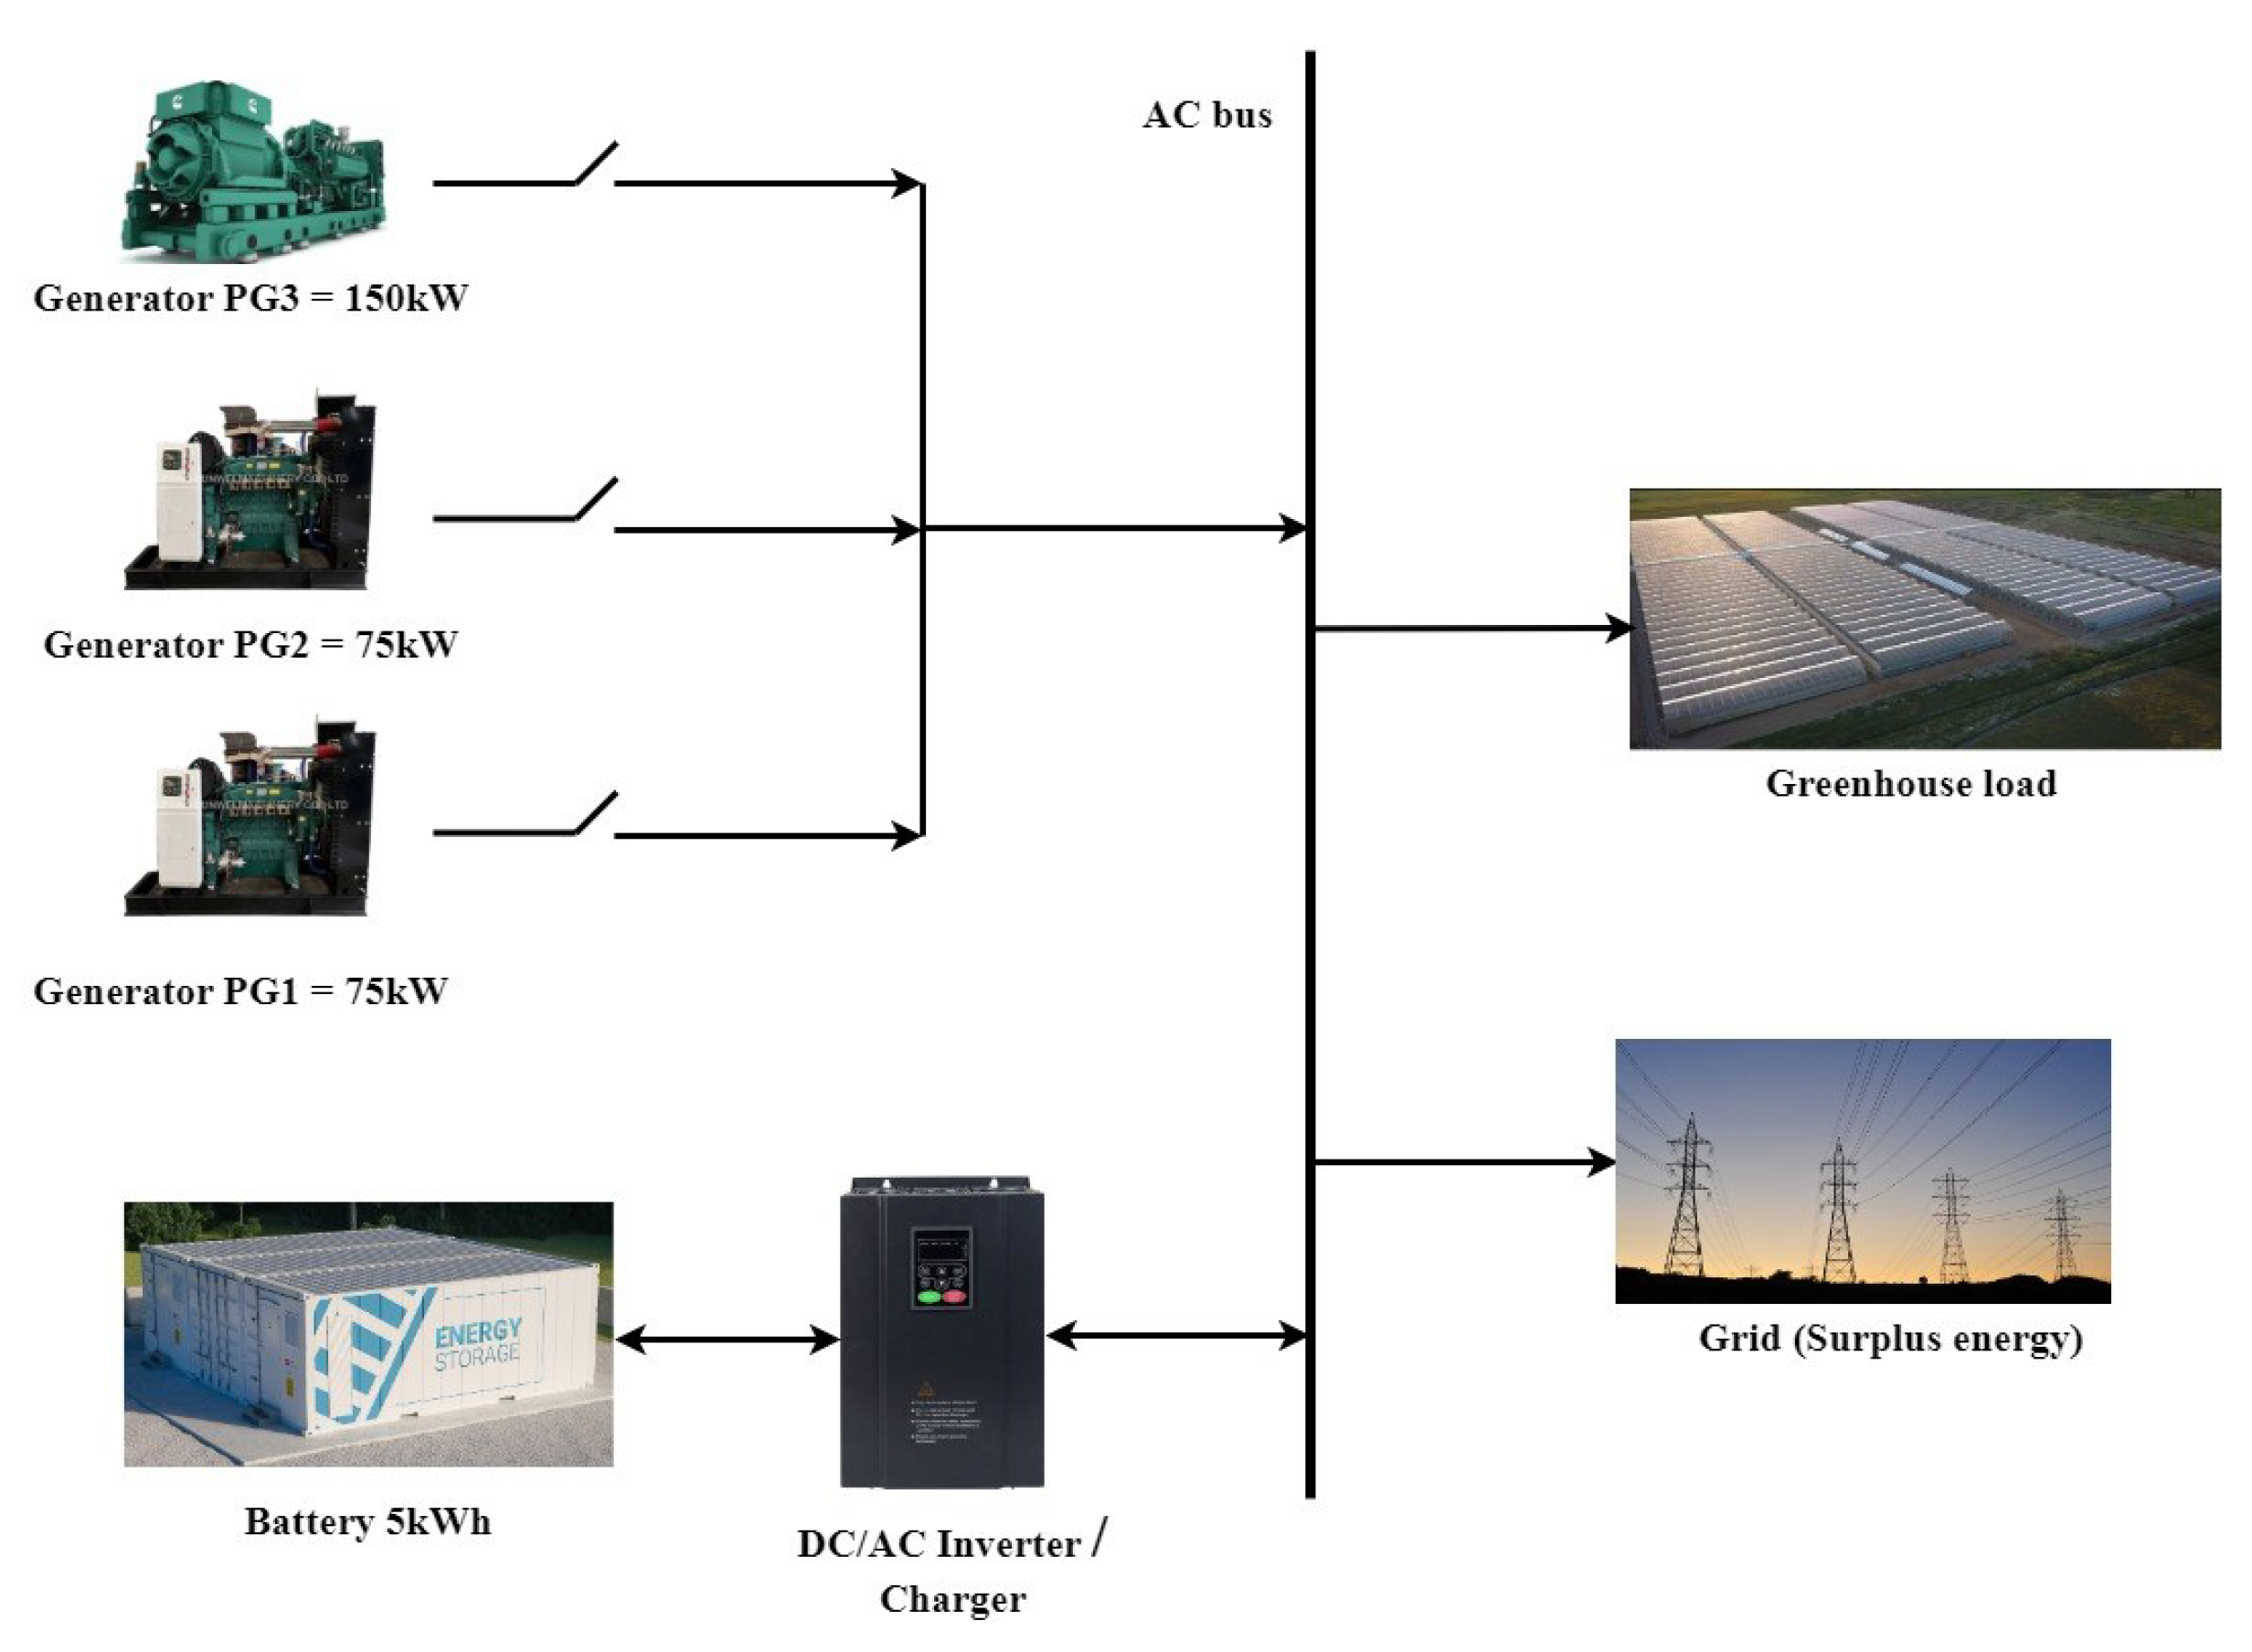
In practice, it would be possible to meet GHU energy needs by using two generators with a maximum power of 75kW and one generator with a maximum power of 145-150kW. In the first rwgion, only one 75kW generator would operate, while in the second region the two 75kW generators would operate. One would operate at full power (75kW) while the second would operate at power required to cumulative satisfy the power shown in the second column of Table 3. In the third zone, all three generators would work together. The two 75 kW generators shall operate at full capacity and the rest of the load requirement, as exhibited in the third column of Table 3, shall be covered by the third generator. A simple connection of the three generators with the battery is shown in Figure 9.
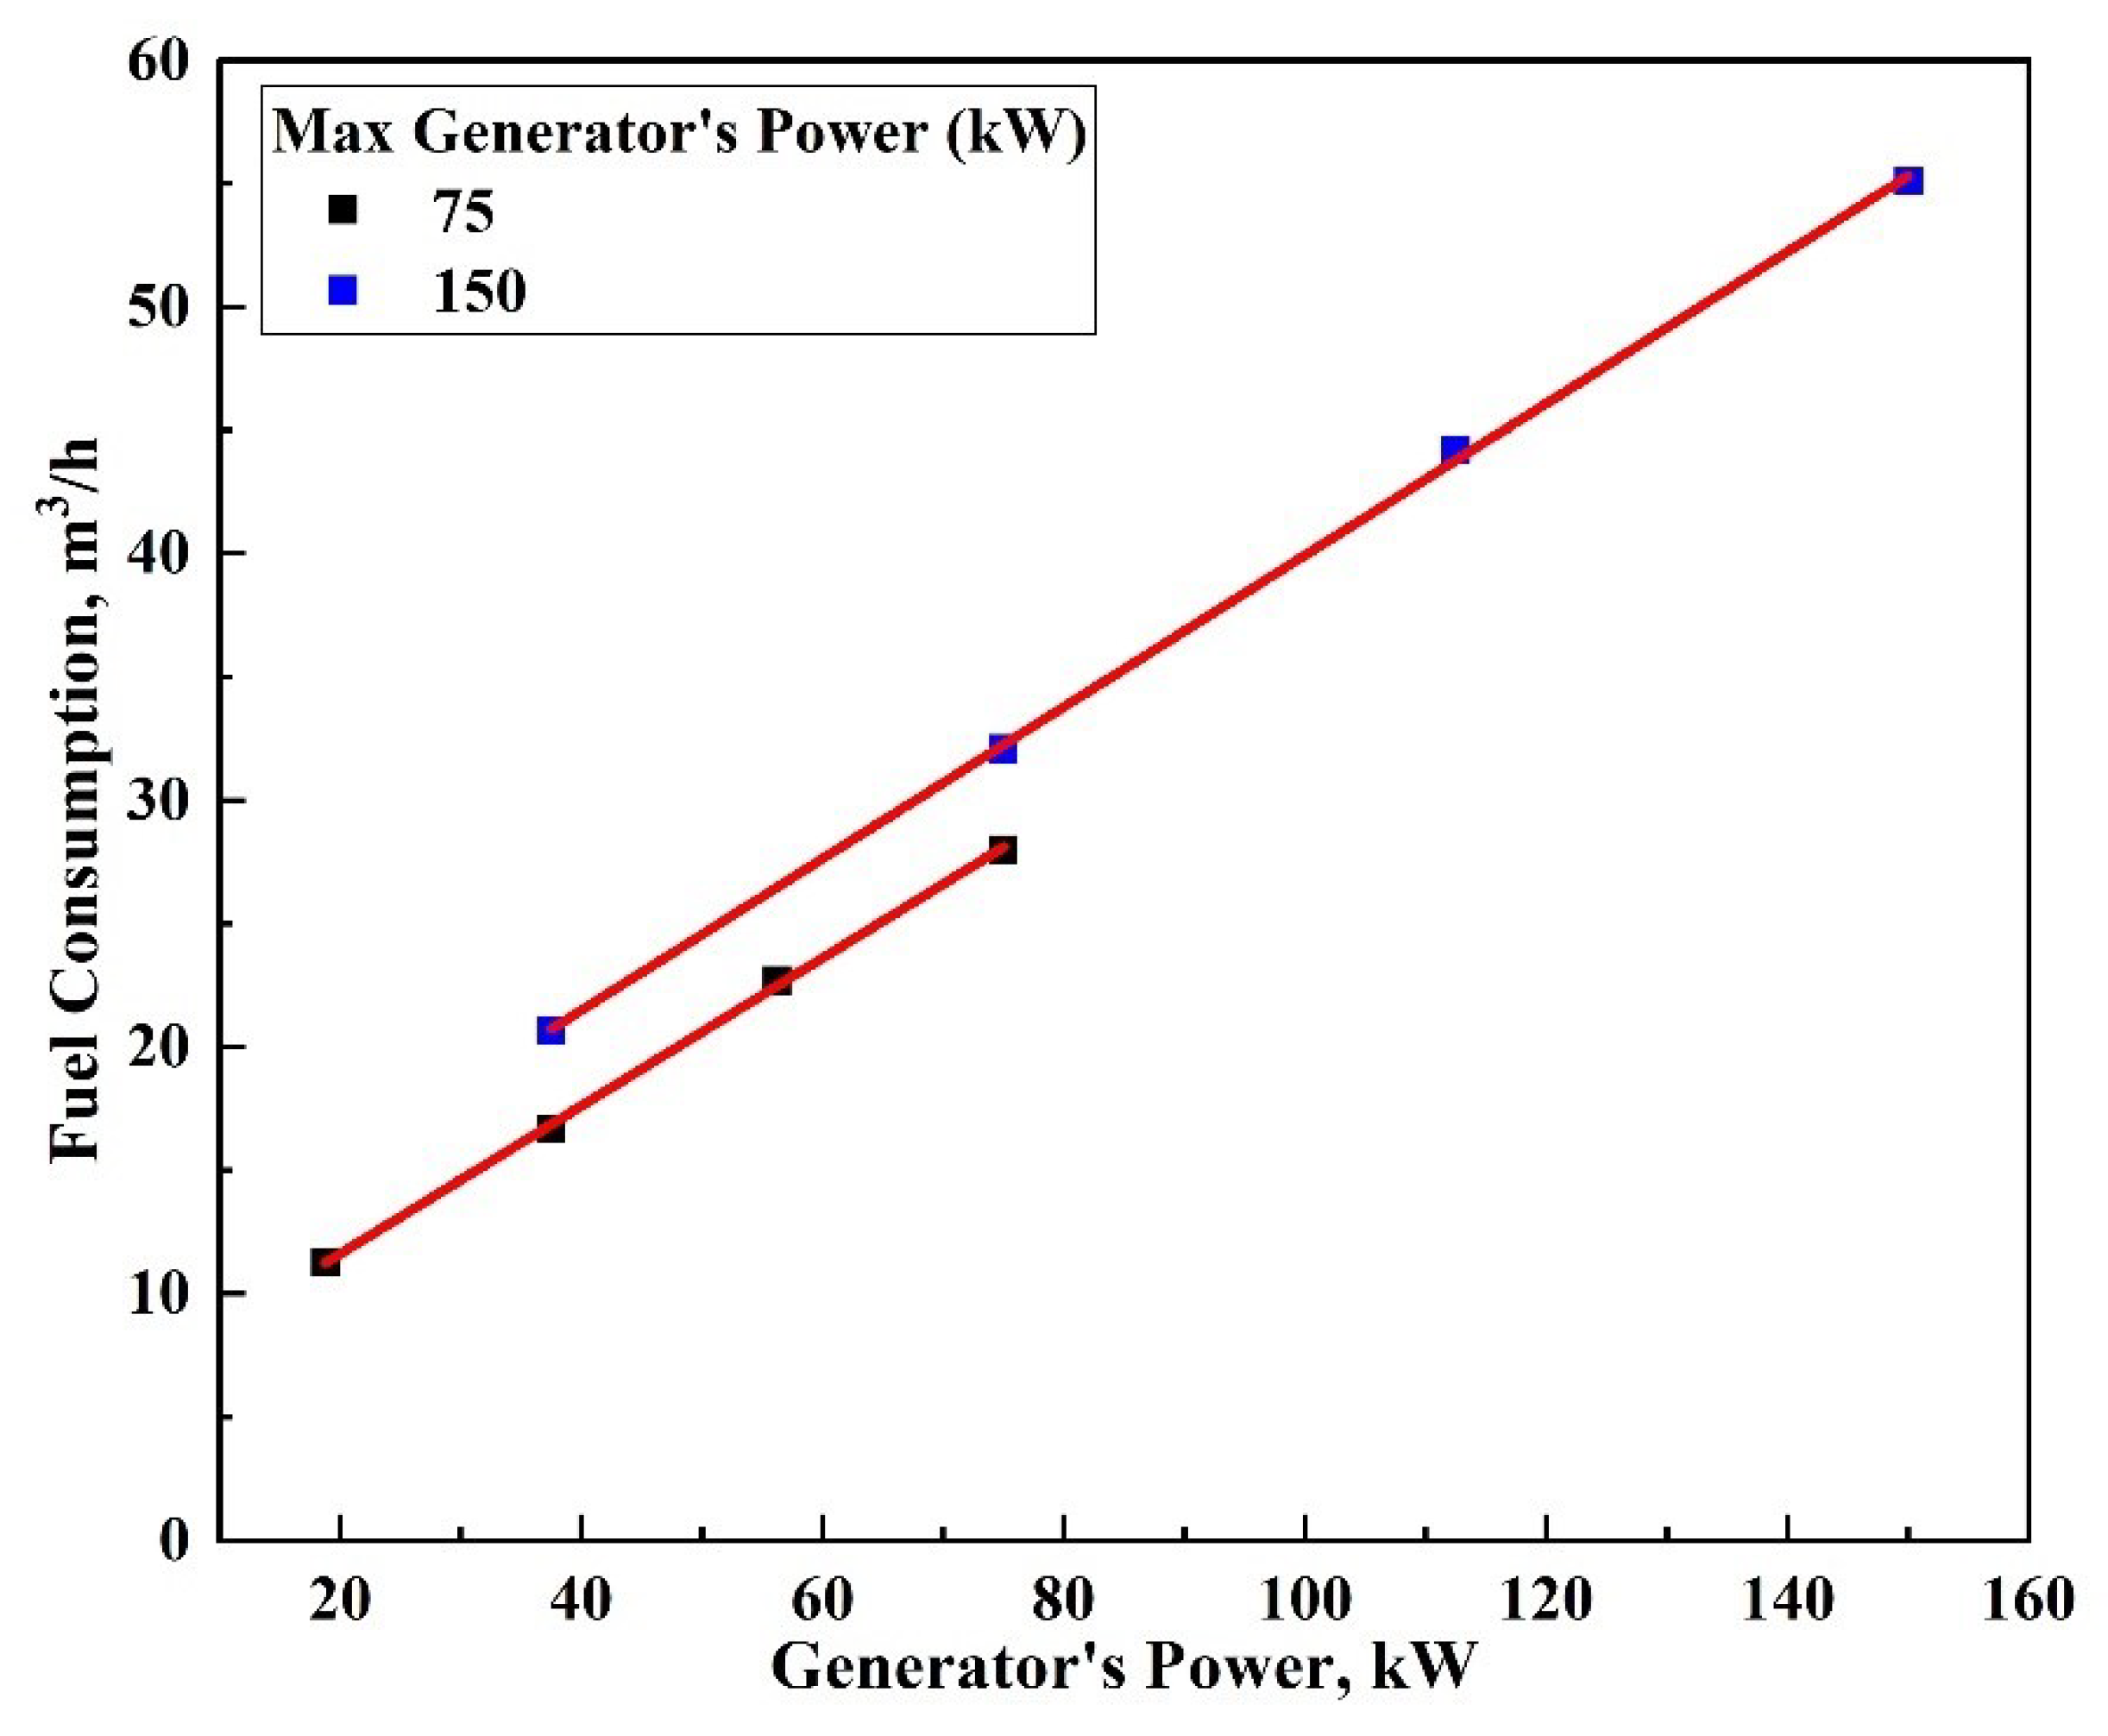
The market investigation led to the selection of 75 and 150 kW natural gas generators with the consumption characteristics presented in Table 4.
From Table 4, Figure 10 is created showing the change in MG fuel consumption as a function of operating power.
The equations that describe the change in natural gas consumption (FC) as a function of the operating power of the generator (P) are:
Generator’s max power 75kW:   FC75 = 5.63505 + 0.29978 P
Generator’s max power 150kW:FC150 = 9.2 + 0.30747 P
Using the above equations, it was possible to calculate fuel consumption for all months of the year and for all operating areas, which is presented in Table 5.
A percentage of the required amount of fuel, according to Table 5, could be covered by biogas production, utilizing the produced biomass of the greenhouse [13,14]. The rest will be covered by the supply of natural gas from the network. The cost of supplying this quantity of natural gas depends on the supplier and the negotiation that will take place. Nevertheless, the cost of fuel should be considerably lower than the cost of supplying electricity from the existing provider. According to the company's data, the cost of electricity consumption of this GHU for the period of the study (March 2022 – February 2023) was approximately € 252K. In order the investment to be profitable, in terms of operating costs, the cost of generator’s fuel should be lower than (252,000 €/year /257,681 m3/year =) ~1€/m3. In fact, it should be well below this value in order to be able to achieve the depreciation of the equipment’s purchase and installation. At least, imports from natural gas suppliers in Greece are made at prices much lower than 1€/m3 [27].
As far as operating costs are concerned, another weak point (apart from securing fuel for generators) of the proposed system is the battery and specifically its frequency of replacement. This depends on the operating mode and charge-discharge cycles. As for the former, it becomes obvious (Figure 8) that half the time it is not sufficiently charged. Adequate charge can only be ensured when the system shows excess energy. So, for six months the battery will operate on a partial state of charge. The question is how harmful is this mode to the battery? This question was addressed by researchers who studied the effect of operating the battery on a partial state of charge on total charge-discharge cycles [28,29,30]. These studies concluded that this mode of operation could benefit the battery.
According to the simulation, the energy discharged from the battery in one year was 61.8MWh. In addition, the results of the optimization showed that optimal operation is achieved when the rated battery energy is 5MWh. Thus, it could be estimated that the battery charge/discharge cycles (assuming 100% Depth of Discharge, DoD) are 61.8/5 ≈ 12 in a year. In the literature, it is reported that the cycle life of the lithium-ion battery exceeds 1000 for 80% DOD [31]. In other words, the operating conditions of the battery in this system will not create the necessary conditions for its replacement during the investment period (e.g. 15-20 years). Therefore, the significant financial burden of this investment will result from the purchase and installation of the MGs and the ESS.
In the next paper, an attempt will be made to estimate the levelized cost of energy and the net present value to answer the question of whether this investment is profitable.

Conclusion

In the present work, the design and study of a power supply system operation that combines the parallel operation of methane generators with energy storage systems took place to meet the energy needs of a greenhouse that fluctuate significantly. In order to support these intense load fluctuations, a methodology for the parallel operation of power systems combining methane generators with an energy storage system is presented and the optimal point of load satisfaction without the need of redundancy is identified. In other words, the appropriate power system is designed that combines methane generators with an energy storage system to fully meet the energy needs of a greenhouse unit.
The method is based on splitting the electricity consumption profile into regions where methane generators would operate at constant power. Optimizing the mode of operation of the power system focuses on locating the operating point of the methane-based generators so that charging and discharging the battery allows the energy autonomy of the greenhouse.

Author Contributions

Conceptualization, methodology, validation, formal analysis, data curation, writing—review and editing, C.E.

Funding

This research received no external funding.

Institutional Review Board Statement

Not applicable.

Informed Consent Statement

Not applicable.

Data Availability Statement

The data presented in this study are available on request from the corresponding author. The data are not publicly available due to the large amount.

Acknowledgments

The author would like to thank the company Thrace Greenhouses [11] for allowing the installation of the electricity metering system and obtaining the data analyzed in this paper.

Conflicts of Interest

The author declares no conflict of interest.

References

  1. Gorjian, S., Calise, F., Kant, K., Ahamed, M. S., Copertaro, B., Najafi, G., Zhang, X., Aghaei, M., & Shamshiri, R. R. (2021). A review on opportunities for implementation of solar energy technologies in agricultural greenhouses. Journal of Cleaner Production, 285. [CrossRef]
  2. Santamouris, M., Balaras, C. A., Dascalaki, E., & Vallindras, M. (1994). Passive solar agricultural greenhouses: A worldwide classification and evaluation of technologies and systems used for heating purposes. Solar Energy, 53(5), 411–426. [CrossRef]
  3. Zhang, K., Yu, J., & Ren, Y. (2022). Research on the size optimization of photovoltaic panels and integrated application with Chinese solar greenhouses. Renewable Energy, 182, 536–551. [CrossRef]
  4. Zhang, K., Yu, J., & Ren, Y. (2022). Demand side management of energy consumption in a photovoltaic integrated greenhouse. International Journal of Electrical Power and Energy Systems, 134, 107433. [CrossRef]
  5. Li, C., Wang, H., Miao, H., & Ye, B. (2017). The economic and social performance of integrated photovoltaic and agricultural greenhouses systems: Case study in China. Applied Energy, 190, 204–212. [CrossRef]
  6. Nayak, S., & Tiwari, A. (2007). Performance evaluation of an integrated hybrid photovoltaic thermal (PV/T) greenhouse system. In International Journal of Agricultural Research (Vol. 2, Issue 3, pp. 211–226). [CrossRef]
  7. Boughanmi, H., Lazaar, M., & Guizani, A. (2018). A performance of a heat pump system connected a new conic helicoidal geothermal heat exchanger for a greenhouse heating in the north of Tunisia. Solar Energy, 171(June), 343–353. [CrossRef]
  8. Zhang, M., Yan, T., Wang, W., Jia, X., Wang, J., & Klemeš, J. J. (2022). Energy-saving design and control strategy towards modern sustainable greenhouse: A review. Renewable and Sustainable Energy Reviews, 164(April). [CrossRef]
  9. Gorjian, S., Ebadi, H., Najafi, G., Singh Chandel, S., & Yildizhan, H. (2021). Recent advances in net-zero energy greenhouses and adapted thermal energy storage systems. Sustainable Energy Technologies and Assessments, 43(November 2020), 100940. [CrossRef]
  10. Duque-Acevedo, M., Belmonte-Ureña, L. J., Plaza-Úbeda, J. A., & Camacho-Ferre, F. (2020). The management of agricultural waste biomass in the framework of circular economy and bioeconomy: An opportunity for greenhouse agriculture in Southeast Spain. Agronomy, 10(4). [CrossRef]
  11. Thrace Greenhouses, Available online: https://www.thracegreenhouses.com/gr/en/home/ (accessed on 5/2/2024).
  12. Sustainability report, Available online: https://www.thracegreenhouses.com/gr/en/aeiforos-anaptiksi/#ekthesi-viosimis-anaptiksis (accessed on 5/2/2024).
  13. Gioulounta, Κ.; Kosmadakis, Ι.; Elmasides, C.; Diamantis, V.; Piskilopoulos, A.; Amiridis, I.; Stamatelatou, K. Energy valorisation of the residual biomass from greenhouses in the framework of a circular economy. In Proceedings of the Earth and Environmental Science Conference, Athens, Greece, 22-23 October 2022. [CrossRef]
  14. Gioulounta, K., Matska, M., Piskilopoulos, A., & Stamatelatou, K. (2023). Greenhouse Residues’ Potential for Biogas Production. Applied Sciences (Switzerland), 2023; 13: 5445. [CrossRef]
  15. Bortolini, M., Gamberi, M., Graziani, A., & Pilati, F. Economic and environmental bi-objective design of an off-grid photovoltaic-battery-diesel generator hybrid energy system. Energy Conversion and Management, 2015; 106: 1024. [CrossRef]
  16. Dhundhara, S., Verma, Y. P., & Williams, A. Techno-economic analysis of the lithium-ion and lead-acid battery in microgrid systems. Energy Conversion and Management, 2018; 177: 122. [CrossRef]
  17. Ahmed, M. M., Das, B. K., Das, P., Hossain, M. S., & Kibria, M. G. Energy management and sizing of a stand-alone hybrid renewable energy system for community electricity, fresh water, and cooking gas demands of a remote island. Energy Conversion and Management, 2024; 299: 117865. [CrossRef]
  18. Mohammed, C., Mohamed, M., Mohamed Larbi, E., Manale, B., Hassan, Z., Jalal, B., & Smail, Z. Extended method for the sizing, energy management, and techno-economic optimization of autonomous solar Photovoltaic/Battery systems: Experimental validation and analysis. Energy Conversion and Management, 2022; 270:116267. [CrossRef]
  19. Premadasa, P. N. D., Silva, C. M. M. R. S., & Chandima, D. P. (2021). An optimal configuration of diesel generator and battery storage system for off-grid residential applications. 2021 IEEE Electrical Power and Energy Conference, EPEC 2021, 486–491. [CrossRef]
  20. Hsu, D., & Kang, L. (2014). Dispatch analysis of off-grid diesel generator-battery power systems. International Journal of Emerging Electric Power Systems, 2014; 15: 161. [CrossRef]
  21. Arun, P., Banerjee, R., & Bandyopadhyay, S. (2008). Optimum sizing of battery-integrated diesel generator for remote electrification through design-space approach. Energy, 2008; 33: 1155. [CrossRef]
  22. Kiray, V., Orhan, M., & Chijioke, J. N. (2021). Significant increase in fuel efficiency of diesel generators with lithium-ion batteries documented by economic analysis. Energies, 2021; 14(21). [CrossRef]
  23. Stamatellos, G., & Stamatelos, T. (2023). Study of an nZEB Office Building with Storage in Electric Vehicle Batteries and Dispatch of a Natural Gas-Fuelled Generator. Energies, 16(7). [CrossRef]
  24. Gracia, L., Casero, P., Bourasseau, C., & Chabert, A. (2018, November 13). Use of Hydrogen in Off-Grid Locations, a Techno-Economic Assessment. Energies, 11(11), 3141. [CrossRef]
  25. Schimpe, M., Naumann, M., Truong, N., Hesse, H. C., Santhanagopalan, S., Saxon, A., & Jossen, A. Energy efficiency evaluation of a stationary lithium-ion battery container storage system via electro-thermal modeling and detailed component analysis. Applied Energy, 2018;210,211. [CrossRef]
  26. Approximate Natural Gas Consumption Chart https://www.generatorsource.com/Natural_Gas_Fuel_Consumption.aspx (accessed on 5/2/2024).
  27. Regulatory Authority for Energy, Waste and Water (RAEWW), Available online: https://www.rae.gr/genika-nea/76548/ (accessed on 5/2/2024).
  28. de Vries, H., Nguyen, T. T., & Op Het Veld, B. Increasing the cycle life of lithium ion cells by partial state of charge cycling. Microelectronics Reliability, 2015;55, 2247. [CrossRef]
  29. Chen, E. (2021). The effectiveness of charge limiting and partial charge limiting. 2021 IEEE Transportation Electrification Conference and Expo, ITEC 2021, 401–406. [CrossRef]
  30. Saxena, S., Hendricks, C., & Pecht, M. Cycle life testing and modeling of graphite/LiCoO2 cells under different state of charge ranges. Journal of Power Sources. 2016;327,394. [CrossRef]
  31. Arshad, F., Lin, J., Manurkar, N., Fan, E., Ahmad, A., Tariq, M. un N., Wu, F., Chen, R., & Li, L. Life Cycle Assessment of Lithium-ion Batteries: A Critical Review. In Resources, Conservation and Recycling. 2022;180,106164. [CrossRef]
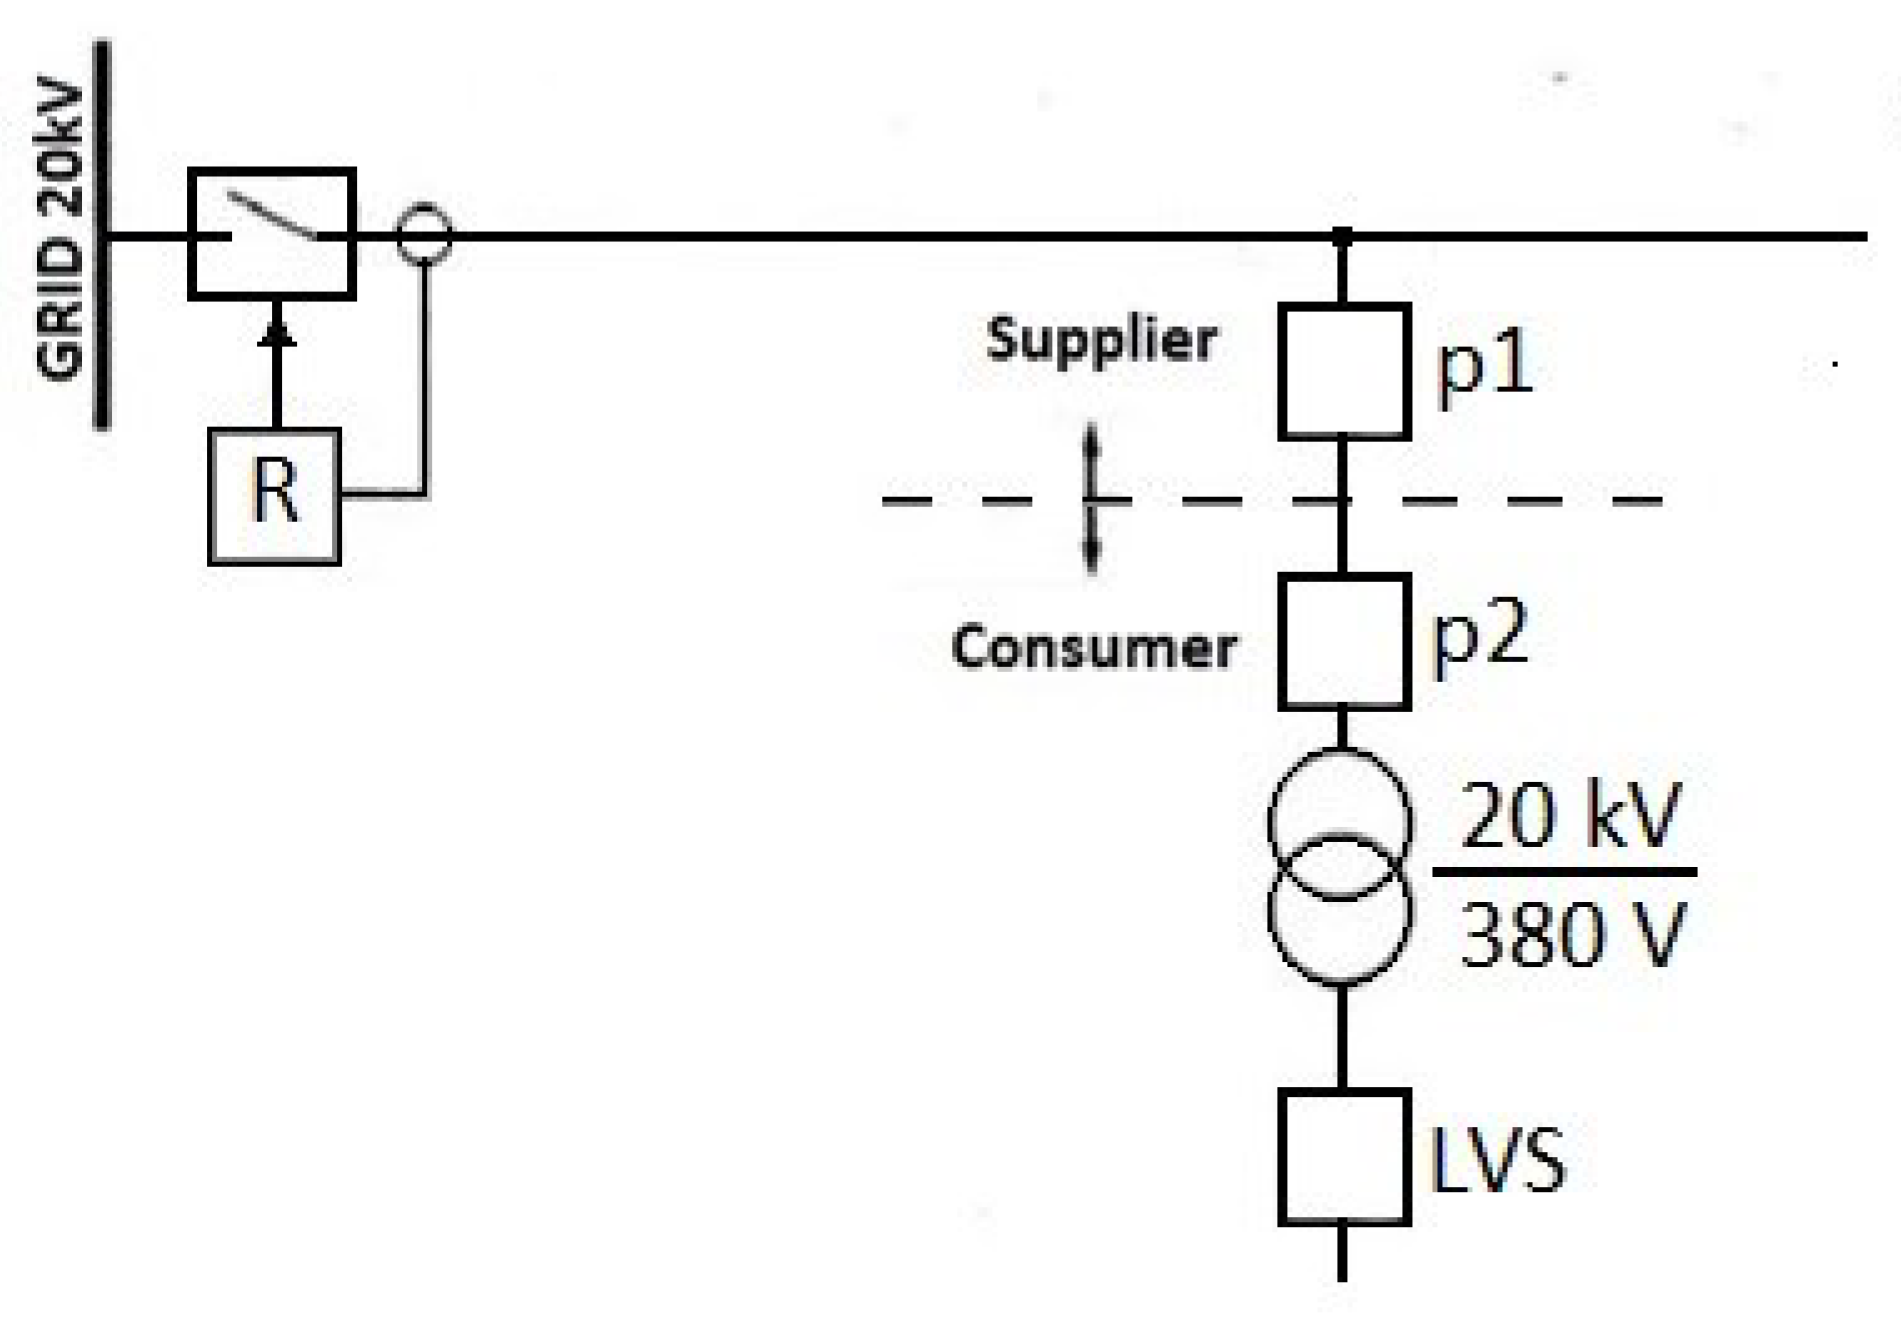
Figure 1. The Medium Voltage distribution line with a power supply branch to the consumer, in accordance with the power supply structure of the Greek Distribution System Operator. Depicted is the relay line trip protection (R), the consumer branch protection (p1), the protection of the medium voltage installation of the consumer (p2), and the general low voltage switchboard (LVS).
Preprints 98424 g001
Figure 2. (a) The image shows the interior of the General Low Voltage Panel. The UMG604Pro power analyzer is mounted on the top DIN rail, to the right of the master switch. Below the master switch, the current transformers surrounding the 3phase copper busbars are wired to the current inputs of the power analyzer. (b) Close-up of the UMG604Pro analyzer. To the left of the analyzer is the fuse disconnect, with the four required analyzer fuses. The analyzer is connected to the local Ethernet network, for remote control and extraction of the energy data via the proprietary GridVis software of Janitza.
Preprints 98424 g002
Figure 3. Transformer’s efficiency.
Preprints 98424 g003
Figure 4. Monthly electricity consumption profile of GHU.
Preprints 98424 g004
Figure 5. A typical electricity consumption profile in the GHU for three consecutive days of the period from October to April.
Preprints 98424 g005
Figure 6. A typical electricity consumption profile in the GHU for three consecutive days of the period from May to September.
Preprints 98424 g006
Figure 7. Operating algorithm of the MG-ESS system.
Preprints 98424 g007
Figure 8. Change in SOE over time for optimal MG-ESS combination.
Preprints 98424 g008
Figure 9. Change in load power and operation of generators in the three areas (9a) and corresponding change in the charging and discharging energy of the ESS (9b).
Preprints 98424 g009
Figure 10. Flowchart of Power Supply System.
Preprints 98424 g010
Figure 11. MG fuel consumption as a function of operating power.
Preprints 98424 g011
Table 1. Monthly energy consumption before and after the transformer.
Month Energy before transformer, EBT (kWh) Energy after transformer, EAT (kWh)
March-22 45268 43735
April-22 41234 39689
May-22 72321 70204
June-22 117751 114766
July-22 114516 111732
August-22 84246 81912
Septemper-22 55447 53614
October-22 27340 25684
November-22 22285 20798
December-22 15814 14431
January-23 29259 28170
February-23 39168 37946
Table 2. Design parameters.
Variable Description
PG1 Operating power of the MG in Region 1, 0 - 125kW
PG2 Operating power of the MGs in Region 2, 125 - 200kW
PG3 Operating power of the MGs in Region 3, 200 - 350kW
Ebat,N Rated energy of ESS, kWh
Table 3. Optimal operating constant power of the generators in the three zones.
PG1 (kW) PG2 (kW) PG3 (kW)
January 45 - -
February 54 - -
March 56 - -
April 57 - -
May 55 130 280
June 55 134 280
July 75 134 295
August 60.14 149.7 209.7
September 57.95 150 210
October 28.92 150 210
November 32.5 - -
December 18 - -
MAX Power 75 150 295
Table 4. Approximate Natural Gas Consumption Chart [26].
Generator size (kW) ¼ Load (m3/h) ½ Load (m3/h) ¾ Load (m3/h) Full Load (m3/h)
75 11.3 16.7 22.7 28.0
150 20.7 32.1 44.2 55.1
Table 5. Methane consumption for all months of the year and for all operating areas.
Month Fuel Consumption of PG1 (m3) Fuel Consumption of PG2 (m3) Fuel Consumption of PG3 (m3) Total Fuel Consumption (m3/month)
January 14229 - - 14229
February 14616 - - 14616
March 16335 - - 16335
April 16201 - - 16201
May 10724 8076 9179 27980
June 7433 3601 30755 41789
July 10692 3459 29508 43659
August 10927 6850 12486 30263
September 13816 2432 5947 22195
October 10528 155 489 11172
November 11057 - - 11057
December 8185 8185
Total Fuel Consumption (m3/year) 257681
Disclaimer/Publisher’s Note: The statements, opinions and data contained in all publications are solely those of the individual author(s) and contributor(s) and not of MDPI and/or the editor(s). MDPI and/or the editor(s) disclaim responsibility for any injury to people or property resulting from any ideas, methods, instructions or products referred to in the content.
Copyright: This open access article is published under a Creative Commons CC BY 4.0 license, which permit the free download, distribution, and reuse, provided that the author and preprint are cited in any reuse.
Prerpints.org logo

Preprints.org is a free preprint server supported by MDPI in Basel, Switzerland.

Subscribe

© 2024 MDPI (Basel, Switzerland) unless otherwise stated