1. Introduction
Unmanned Aerial Vehicles (UAV) have been increasing in popularity in the last decades, with broad scientific, industrial and military usages [
1]. From a wide-range of urban applications [
2], to topographic mapping and surveillance operations [
3], useful for agricultural purposes [
4] for example, these aircraft are undeniable aids, and are becoming virtually indispensable in many fields. It is natural that a given application may influence the requirements for the UAV to be used. Rotor-craft are usually chosen when high manoeuvrability is intended, whilst fixed-wings are more common when needing to cover large distances due to their higher endurance, with each having their own drawbacks [
5]. As a middle-ground between these two types of aircraft, hybrid UAVs have also been a subject of intense research [
6], aiming to combine the advantages of fixed-wings and rotor-craft, simultaneously avoiding or diminishing their shortcomings. These sort of vehicles are also commonly designated as Vertical Take-Off and Landing (VTOL) aircraft, as they have the capability of taking off vertically and then perform a transition to cruise flight, and then transition back to vertical flight for landing operations. These UAVs can be classified according to a number of aspects, namely how they perform their transition maneuvers, for example, rotating their rotors or wings, respectively for tilt-rotors or tilt-wing aircraft, or tilting themselves in landing maneuvers, such as tail-sitters, that owe their denomination to the fact that they land on their tails. The reviews in [
5,
6,
7] provide additional insights over VTOL aircraft. From the different hybrid and convertible UAVs mentioned in these works, tail-sitters have a simplified mechanical design, in general requiring less actuators and moving parts, although at the cost of being susceptible to crosswinds when performing vertical flight as the wing is perpendicular to the ground, and thus requiring complex transition maneuvers [
6].
The state-of-the-art on aircraft control starts on model-based linear feedback controllers: a nonlinear model of the system is designed, comprising its different subsystems with a varying degree of complexity, which is then linearized at a certain operating point, usually hovering flight for rotorcraft, or constant airspeed leveled flight for fixed-wings. Afterwards, linear controllers are designed using adequate methods, of which Proportional-Integral-Derivative (PID) and Linear Quadratic Regulators (LQR) are examples [
8,
9]. However, the performance of these controllers is highly influenced by nonlinearities and model mismatches, both of which not infrequent in UAVs that face large angles-of-attack. Furthermore, as the models used to compute such controllers depend heavily on the airspeed and air density, these linear control strategies are commonly paired with a scheduling mechanism [
10,
11], which may become computationally expensive for the flight controller. As a way of circumventing many of these issues, nonlinear strategies are the object of development and discussion in flight control, as they allow to incorporate the nonlinearities of the model in the control design phase, thus being less-susceptible to the aforementioned loss of performance [
12,
13]. The Nonlinear Dynamics Inversion (NDI) is a well-known example used in aircraft stabilization, which works by inverting the model - along with many of its nonlinearities - in order to determine the control action to take, leading to more robust controllers [
14,
15]. Notwithstanding, NDI, along with similar nonlinear control strategies like Backstepping [
16], still require an accurate model of the UAV to be controlled, thus requiring extensive parameters identification either in wind tunnel or flight testing, and being susceptible to model inaccuracies [
17]. As a way to counteract such limitations, a reformulation of these control strategies can be performed so that they rely more on sensor data instead of the information provided by the model, leading to incremental versions of these controllers - INDI [
18,
19] and IBKS [
20,
21]. These control strategies have the advantage of only requiring the modeling of the actuation components - like propellers, rotors and control surfaces - to compute the control action, and have demonstrated to be more robust to model mismatches and parameter uncertainty [
22,
23,
24]. In particular, tail-sitters benefit from control strategies that are less model dependant, as they face high angles-of-attack (AOA) and complex propeller-fuselage interactions, both of which are difficult aspects to portray. Some previous research works address the application of incremental control laws to tail-sitters [
25,
26,
27,
28], but these do not draw a comparison with conventional nonlinear controllers in order to highlight the advantages of their incremental versions.
This work provides a thorough model of the E-Flite/Horizon Hobby X-Vert VTOL, a small and highly-manoeuvrable bi-rotor tail-sitter UAV, which has been previously modeled in [
29], together with a systematic comparison of the performance of different controllers in the presence of sensor noise and possible model mismatches.Three control strategies were considered: i) a simplified version of the nonlinear control strategy proposed in [
29], consisting on an adaptation to specific conditions of vertical flight, and designated as Benchmark Nonlinear Controller (BNC), ii) the conventional Nonlinear Dynamics Inversion, and iii) its incremental counterpart, INDI. These controllers are implemented to control the X-Vert when performing vertical flight, and compared in three distinct environments: i) in simulation, considering the comprehensive model of the tail-sitter, in order to provide for a baseline comparison of the controllers performance, ii) in Hardware-In-The-Loop (HITL), where these control solutions are implemented in a micro-controller unit (MCU) enabling to control the computer-simulated aircraft by an external flight controller using Ethernet communications which was specifically designed and assembled for the control of the X-Vert VTOL, and iii) in a controlled indoor environment, in order to assess the controllers performance and robustness when controlling the real UAV to perform simple maneuvers in vertical flight.
2. Aircraft Simulator
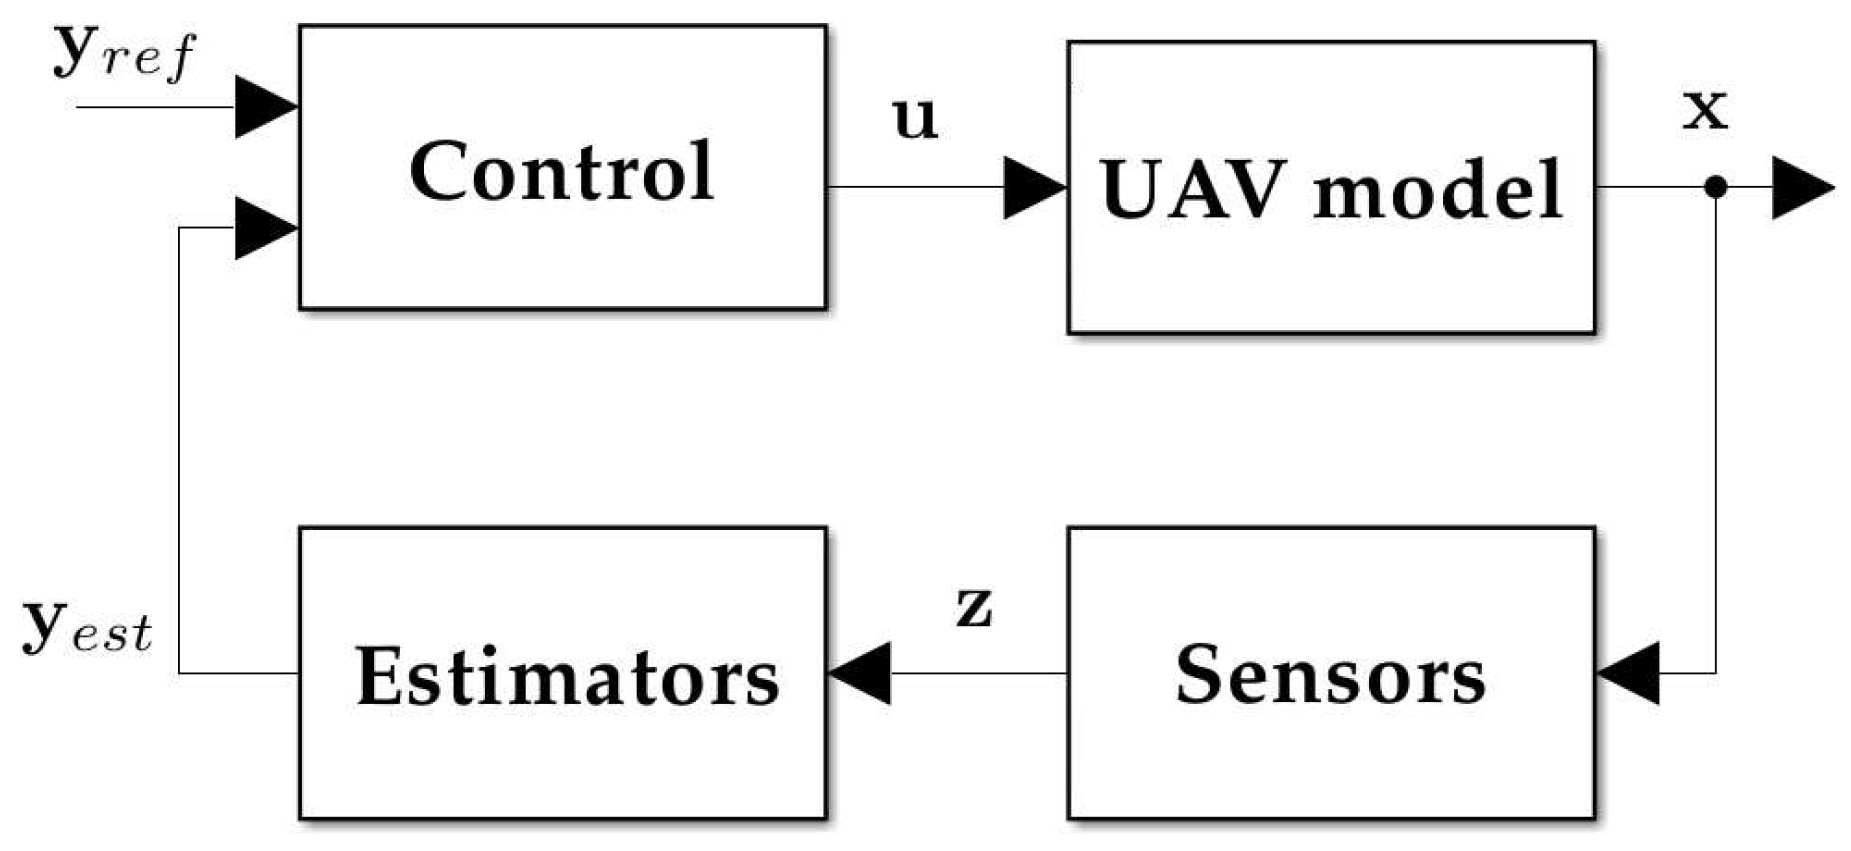
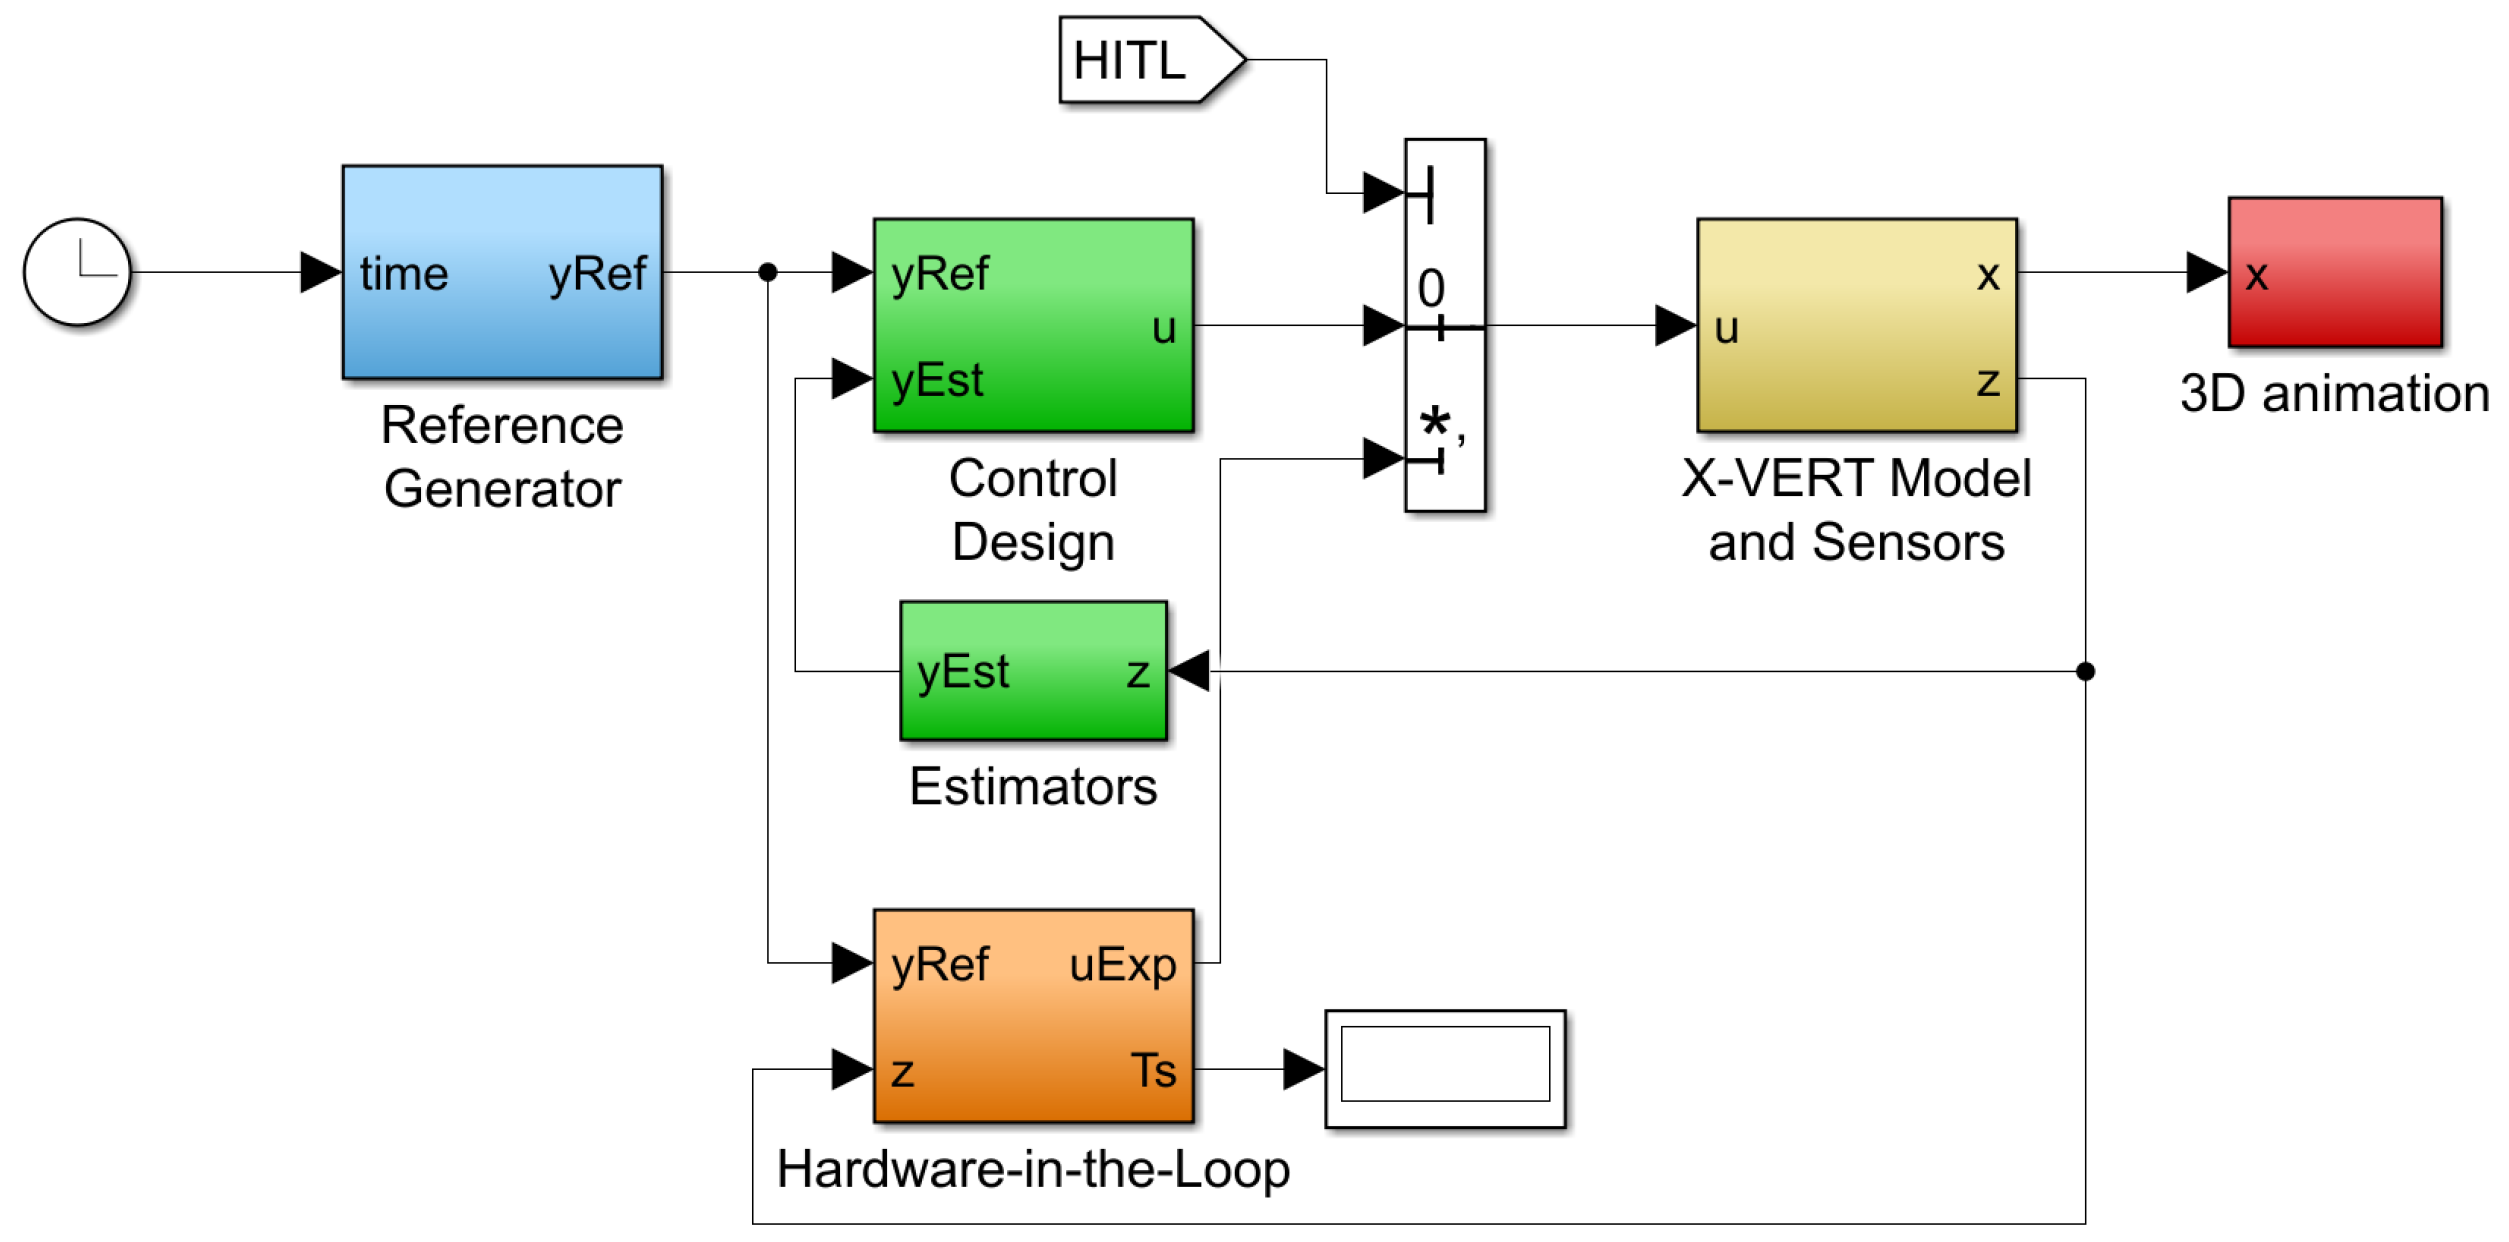
The simulator developed in this work encompasses a model of the X-Vert tail-sitter UAV as well as the necessary elements to replicate an experimental scenario. A generic overview of the simulation environment is provided in
Figure 1, accounting for these diverse components, where
,
and
respectively stand for the state, input and output vectors. The subset of
that is used for vertical flight control is represented by
, and thus
and
are used to respectively denote its reference and estimation.
The current section addresses the X-Vert model, starting with a short description of this UAV, then describing the equations of motion of the model in detail, accounting for its aerodynamics, propulsion system, ground contact forces and gravity. Since the sensors do not yield direct measurements for all the components of
, an estimation step, described in the end of this section, is necessary, allowing to reconstruct the remaining necessary states from the available sensor data. The control block, representing the centerpiece of this research work, is addressed separately in
Section 3.
consists on a set of simple maneuvers in vertical flight, which are described in detail in
Section 4.
Throughout this section, multiple constants and coefficients will be defined and used to describe the simulated aircraft, but their values are omitted for presentation purposes, being provided in
Appendix A with their respective sources.
2.1. Tail-Sitter Prototype and Nonlinear Model
The X-Vert VTOL is a radio-controlled aircraft manufactured by E-Flite/Horizon Hobby [
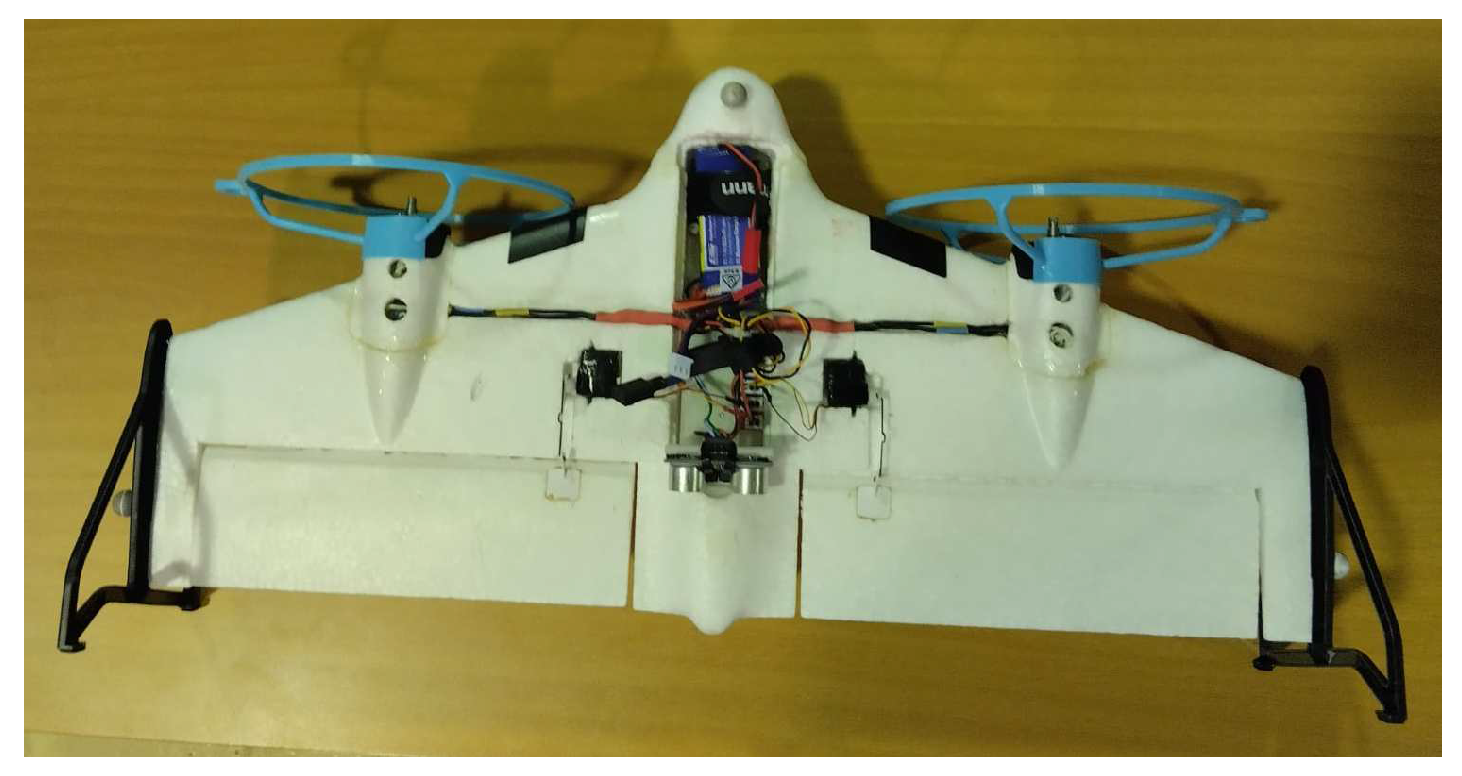
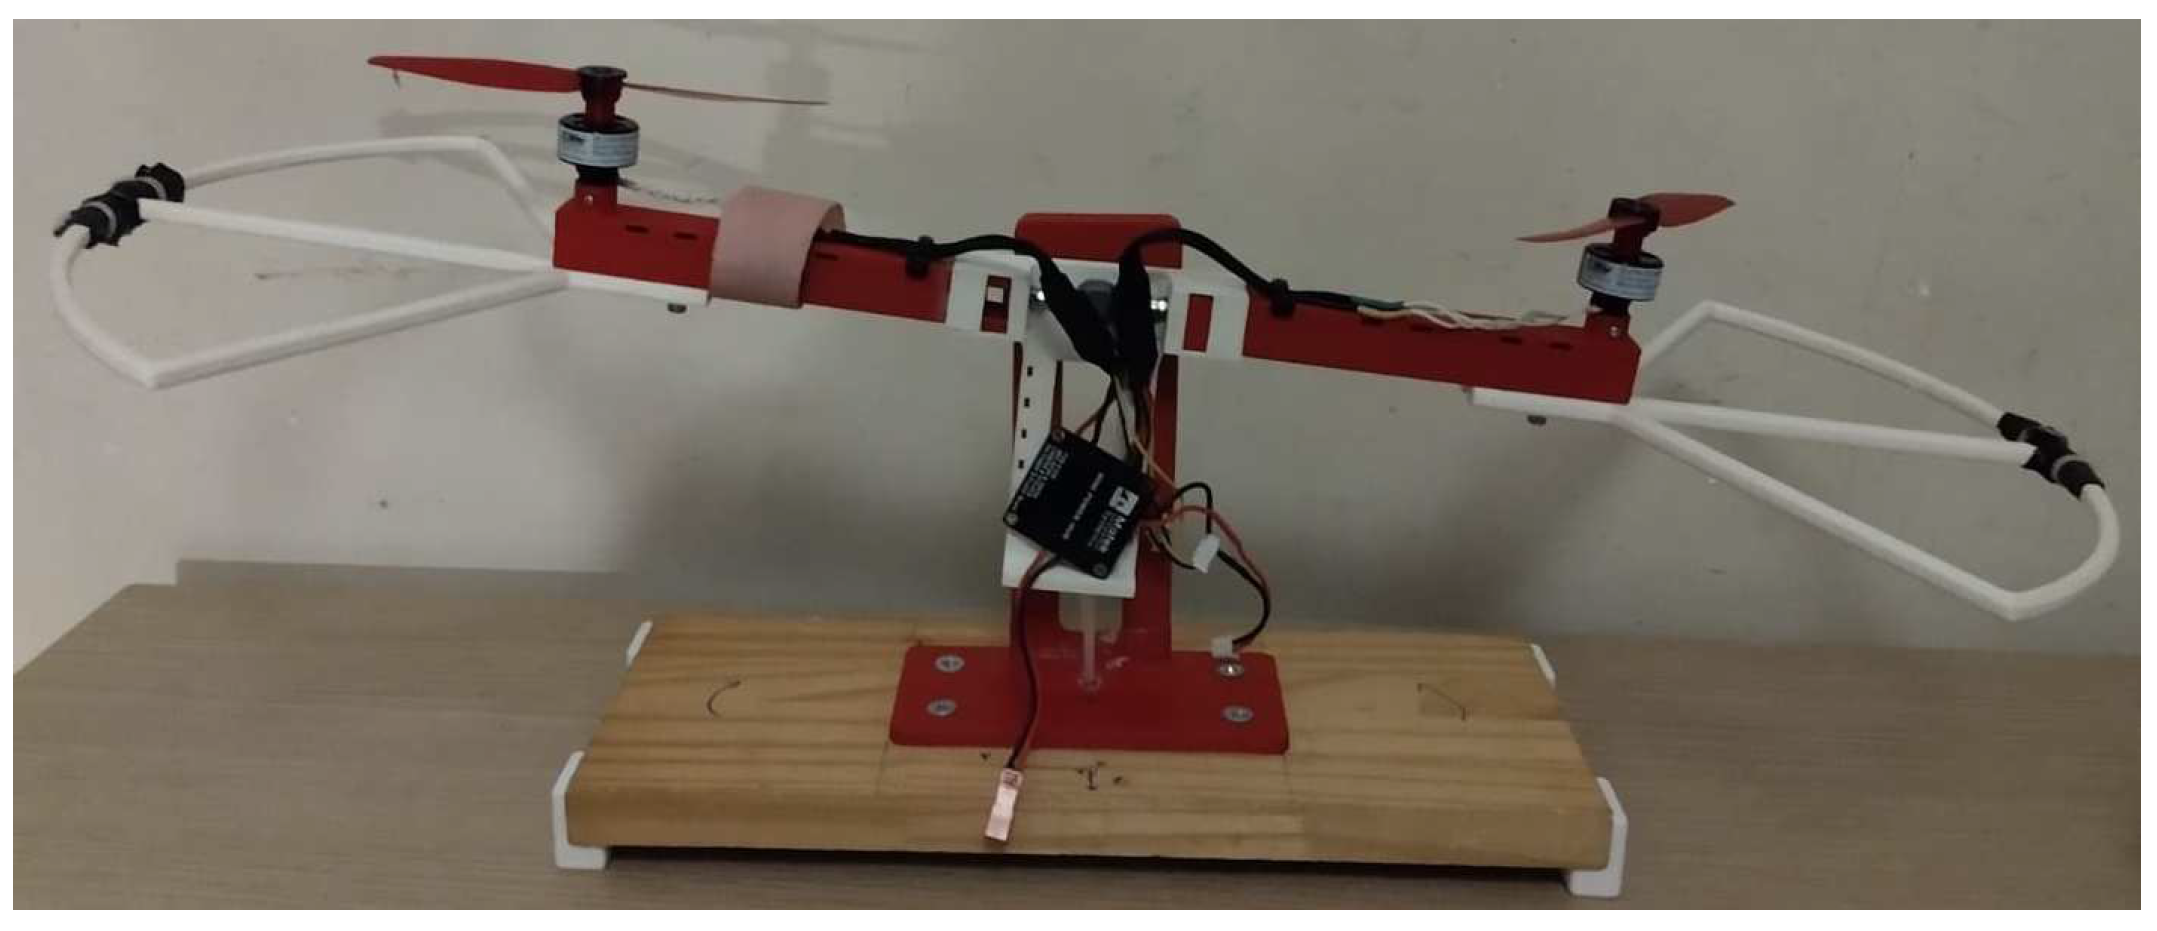
30]. It is a half-meter wingspan tail-sitter with two elevons - control surfaces that combine the traditional functions of aileron and elevator - and two proprotors - which also have their denomination as they work simultaneously as rotors and propellers. This aircraft was chosen for this research work due to its VTOL capabilities and small dimensions, allowing for indoor flight. The prototype used for this work was retrofitted with additional sensors and electronics that are described in
Section 5, and is shown in
Figure 2, where the elevons and proprotors can be seen.
2.1.1. Equations of Motion
The aircraft model used in the developed simulator is largely based in [
29] as it already provides a comprehensive model for the specific tail-sitter UAV used in this work, the X-Vert VTOL. This model is described briefly, with additional emphasis on the aspects that differ from the aforementioned model.
This UAV requires four inputs, these being the deflections of the two elevons,
and
, and the throttle signals for the two proprotors,
and
, with the subscripts "
R" and "
L", denoting the
right and
left side of the wing, respectively. Notwithstanding, it is more convenient to represent these inputs as the more traditional ones in flight control:
and
for respectively standing for the differential and simultaneous elevon deflection, representing the functions of
ailerons and
elevator; and
and
being the analogous application to the proprotors, taking the role of
rudder and
throttle. Therefore, the input vector
can be obtained from the original four inputs
by an adequate transformation [
31], and is represented by:
The state vector
is represented by the linear and angular velocity vectors in relation to the ground and expressed in the body-frame,
and
, respectively, the position of the aircraft in the North-East-Down (fixed) frame,
, and its orientation in relation to this same frame, expressed in quaternion form,
. Naturally, the usage of quaternions for attitude representation intends to avoid the well-known singularity issues related to more familiar representations, like the Euler angles [
31]. Two additional states are included in
to account for the angular velocities of the left and right motors that rotate the proprotors, represented briefly by
.
It should be noted that it is common to represent aforementioned velocity vectors with respect to the air -
and
- especially when accounting for the effects of aerodynamics, as these are impacted by the wind by providing additional components for these velocities,
and
. Although this work assumes negligible wind and therefore resulting in
and
, the subscript
a will still be kept when air velocities should be used for generalisation purposes. Examples of this are the angle-of-attack (AOA)
, the sideslip angle
, and airspeed
, which are computed using the air velocity vector
[
31,
32,
33].
The dynamics and kinematics of the UAV are expressed by
where
represents the mass of the X-Vert and
its inertia matriX, whilst
and
stand for the resulting force and moment vectors acting on it. Additionally,
and
denote auxiliary matrices that depict the influence of
and
respectively in
and
, having been gathered from [
31].
Four different aspects contribute to the forces and moments acting on the UAV, these being the propulsion system, the aerodynamics, the ground contact effects and the gravity. Since it is assumed that the force and moment balances are expressed in the Center-of-Gravity (CG) of the aircraft, the moment that results from the gravity effects is neglected, and therefore
and
are expressed by
with each of the components being described in the following sections.
2.1.2. Propulsion Forces and Moments
The rotation of each proprotor of the X-Vert generates a thrust
T and a torque
Q, which influence the propulsion force
and moment
accounting for the position of the right and left proprotors [
29]:
In turn, the thrust and torque of each proprotor depend on its angular velocity and incoming airspeed. Taking
as the vectorial norm of
and defining
as the angle this vector makes with the rotational axis of each proprotor, the advance ratio
J is obtainable, which can then be used to compute the thrust and power coefficients required for
T and
Q [
29]:
It should be noted that
and
depend on the advance ratio by a second-order equation following the form
, and these are the parameters provided for the aircraft in
Appendix A.
The relationship between the angular velocity of the motors
and the throttle input
is modelled as the dynamics of a Brushless Direct Current (BLDC) electric motor regulated by an Electronic Speed Controller (ESC) [
34], but a simplification is made by assuming the steady-state solution for the dynamics of the electric current, resulting in the first-order model
which assumes a constant battery voltage
of 7.4 V, and with the torque constant,
; the back-electromotive force,
; the motor resistance,
; the rotational inertia of the proprotor,
; and the damping constant
. The values for these constants were gathered from a similar motor to the one that is used in the X-Vert, and it can be verified that the steady-state solution of (7) agrees with the motor model in [
29] for the aforementioned value of
.
Lastly, the rotation of the proprotors originates an induced airspeed
dependant on the generated thrust and inflow airspeed, which can be found solving [
35]:
Once
is computed, the slipstream velocity
and radius
are determined by:
assuming fully-developed flow. The aerodynamic angles for the slipstream,
and
, and the absolute slipstream airspeed,
are obtainable from
[
31,
32].
2.1.3. Aerodynamic Forces and Moments
The wing of the X-Vert is modeled as a set of flat-plate segments for the left and right sides, following a similar approach to the ones taken in [
29,
36,
37], but including additional aerodynamic derivatives to account for lateral aerodynamics and effects of the angular rates [
31]:
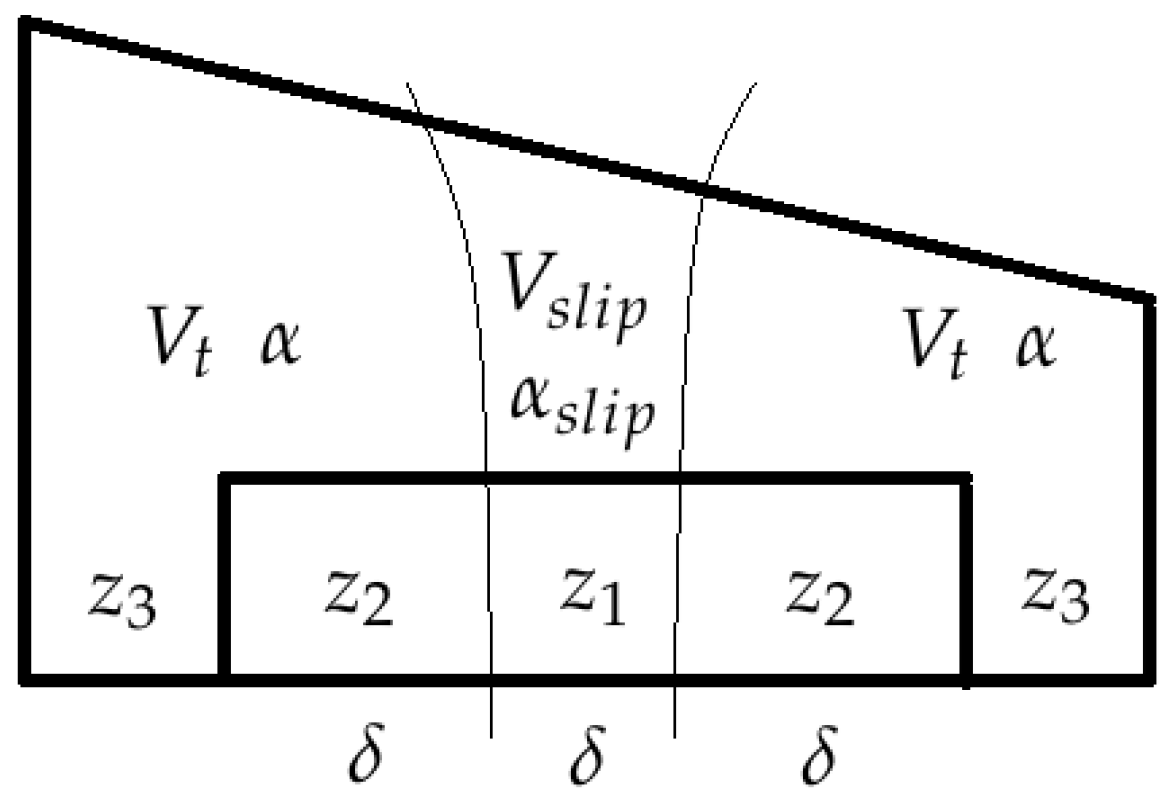
Each side of the wing is divided into three zones for the computation of aerodynamic forces and moments, as illustrated in
Figure 3: zone 1 (
) - the elevon section which is in the slipstream of the proprotors; zone 2 (
) - the elevon section outside said slipstream; and zone 3 (
) - the remainder of the side of the wing.
Accounting for such division, the drag
D, lift
L and pitching moment
m for each zone can be expressed in the body frame as
where
introduces the influence of the angle-of-attack and sideslip angles,
and
, and
takes on an analogous role but for the angles for zone 1,
and
, which account for the slipstream effects. The distance of the aerodynamic centre (AC) of the right and left sides of the wing are denoted respectively by
and
, which are assumed to be the same for each side of the wing, regardless of the zone.
The drag, lift and pitching moment for each zone are obtained using the data for the aerodynamic coefficients -
,
and
- from [
29] for the angle-of-attack and elevon deflection, and combining it with the airspeed at each zone and its span. For example, zone 1 has a span of
, it is influenced by the slipstream air velocity
, and the aerodynamic coefficients account for the slipstream AOA
and elevon deflection
, resulting in:
where
denotes the mean aerodynamic chord (MAC) of the wing and
denotes the air density, both assumed to be constant. Zones 2 and 3 use
for the airspeed value and
as the angle-of-attack to obtain the aerodynamic coefficients, but zone 2 accounts for the elevon deflection whilst zone 3 does not. The spans for each zone to be used in analogous computations to (12) are defined directly from the wingspan of the X-Vert,
, and elevon span,
:
,
.
The last aspect of (10) to describe is the influence of lateral aerodynamics and aerodynamic derivatives by the means of
and
given by:
having been adapted from [
31] but modified to allow for larger values of
.
Since no specific data for the X-Vert was available for these coefficients, the values were gathered from a flying-wing UAV [
38] and used according to (13). Despite the fact that the aircraft in the aforementioned research work is not the X-Vert, it is still a flying-wing UAV which the X-Vert resembles, and thus the resulting values for the coefficients should be satisfactory since adequate determination of these often requires experimental identification and/or computational methods [
31], which undoubtedly fall out of the scope of this work. This may lead to the introduction of eventual modeling errors, but it is acknowledged for the purpose of designing control strategies for the X-Vert, expecting these should be robust to eventual model mismatches.
2.1.4. Ground Contact Forces and Moments
The interaction of the ground is gathered from [
29], which employs a spring-damper analogy for representing the ground contact force at each contact point
k, expressed in the inertial frame:
where
stands for the depth of point
k, and
its velocity expressed in the inertial frame, with
being the position of the point in relation to the CG, where "
c" denotes "
contact".
and
are gains for the spring-damper system, and their values were kept from [
29].
also accounts for an upped limit of zero, representing the loss of contact with the ground for each point.
Five contact points were used, corresponding the four corners of the main wing and the noise of the UAV as shown in
Appendix A, and thus the ground force and moment vectors can be computed by expressing
for each in the body frame:
2.1.5. Gravity Force
The last force acting on the simulated model of the X-Vert is the gravity. As explained before, it is assumed that this force acts on the CG of the UAV, thus producing no moment, and therefore its effects can be modeled by:
where
m/s
2 denotes the gravity acceleration vector expressed in the fixed frame.
2.2. Sensors
The simulator used in this work also accounts for the sensors onboard the UAV (see
Figure 2, namely an accelerometer and gyroscope - a common combination for estimating the attitude of aircraft - and a sonar used to assist in the vertical takeoff and landing maneuvers. The output vector
comprises the acceleration vector provided by the accelerometer,
, the angular velocity from gyroscope readings,
, and distance measured by the sonar,
, all expressed in the body frame. It is noted that the sensors are assumed to be coincident with the centre of gravity (CG) of the UAV.
The models for the accelerometer and gyroscope [
39] are provided respectively by:
where
denotes the bias of the respective sensor and
its zero-mean Gaussian noise vector.
The sonar is mounted in the underside of the X-Vert and pointing to its tail, parallel to the
x axis of the body frame, and its model is given by
where
represents the measurements of the sensor,
is the Down coordinate expressed in the NED frame,
depicts the orientation vector of the sonar expressed in this same frame,
and
represent the respective unit vectors and
denotes the noise of the sensor.
When it comes to implementing the models of these sensors, some considerations should be provided regarding their respective biases and noise vectors. Firstly, the biases are assumed to be constant and capable of being removed by means of a suitable calibration process in an experimental scenario. Consequently, they take null values for simulation purposes, as shown in
Appendix A. Secondly, regarding the specific noise characteristics of each sensor, these are usually characterized by their respective variance
, where a combination of theoretical values from [
31] and measurements from the real sensors were used (see
Section 5). Since the goal is not extensive sensor identification but only to portray the effects of their characteristic noise for simulation purposes, their specific values are illustrative but kept in their respective order of magnitude.
2.3. Attitude and Vertical Velocity Estimators
For the purpose of stabilization of the X-Vert in vertical flight, the variables related with the attitude -
and
- and altitude -
and
- require observation, and therefore the estimated output vector is defined as
In order to save computational resources, a choice was made to use simple and fast methods to estimate these states of complementary nature. Starting with the attitude, an estimate of
is obtainable through the combination of accelerometer and gyroscope data using the Madgwick algorithm [
40]:
where
is an objective function to be minimised and
its Jacobian matrix, the expressions of both having been omitted in this work but readily available in the original research [
40]. This estimator includes the accelerometer readings
in
and combines it with the integration of the gyroscope measurements
, balancing the relative weight between both with the scalar
, which takes the role of the single design variable for adjusting this estimator. Since the accelerometer does not perceive any change in a rotation over an axis aligned with the gravity vector, the estimator is subject to some drift as it relies only on the gyroscope integration for these cases. Nonetheless, for small flight times it provided satisfactory results, presenting a fast and simple estimation strategy for the attitude in vertical flight, whilst acting as a filter for the noise present in the sensors.
Following an analogous reasoning, the readings from the accelerometer, discarding the gravity contribution, can be integrated to estimate the velocity over the
x-axis of the UAV, whilst another estimate of it is obtainable by deriving sonar readings. Pairing both of these in the form of a more conventional complementary filter [
31], the longitudinal velocity
can be computed by filtering and combining both of these estimates according to
in which
is a design variable, and where
and
are the previously described estimates of
from the sonar and accelerometer, respectively, defined by:
and
and
denote respectively
Low-Pass Filter and
High-Pass Filter, both first-order as defined in [
31]. Despite being a somewhat rudimentary estimation method when compared to more complex sensor-fusion algorithms like the Kalman filter [
31], the combination of these two estimators provide observations of all the necessary variables, at a relatively low computational cost, with the added benefit of requiring only two design variables -
and
.
Conclusions
In this research work, a simulator for a tail-sitter UAV was developed, allowing for the testing of different control strategies in a simulated scenario. The attitude controllers tested were of nonlinear nature, one from a previous work developed for the same aircraft [
29], one based on Nonlinear Dynamics Inversion principles, and the last being its incremental version, INDI. The controllers and estimators were implemented in an Arduino board and integrated into the simulated environment, in order to enable hardware-in-the-loop testing of the control solutions. The simulation and HITL results for performing standard maneuvers in vertical flight demonstrated that all the implemented controllers manage to track the references, although with the INDI control strategy standing out by providing a far smoother actuation.
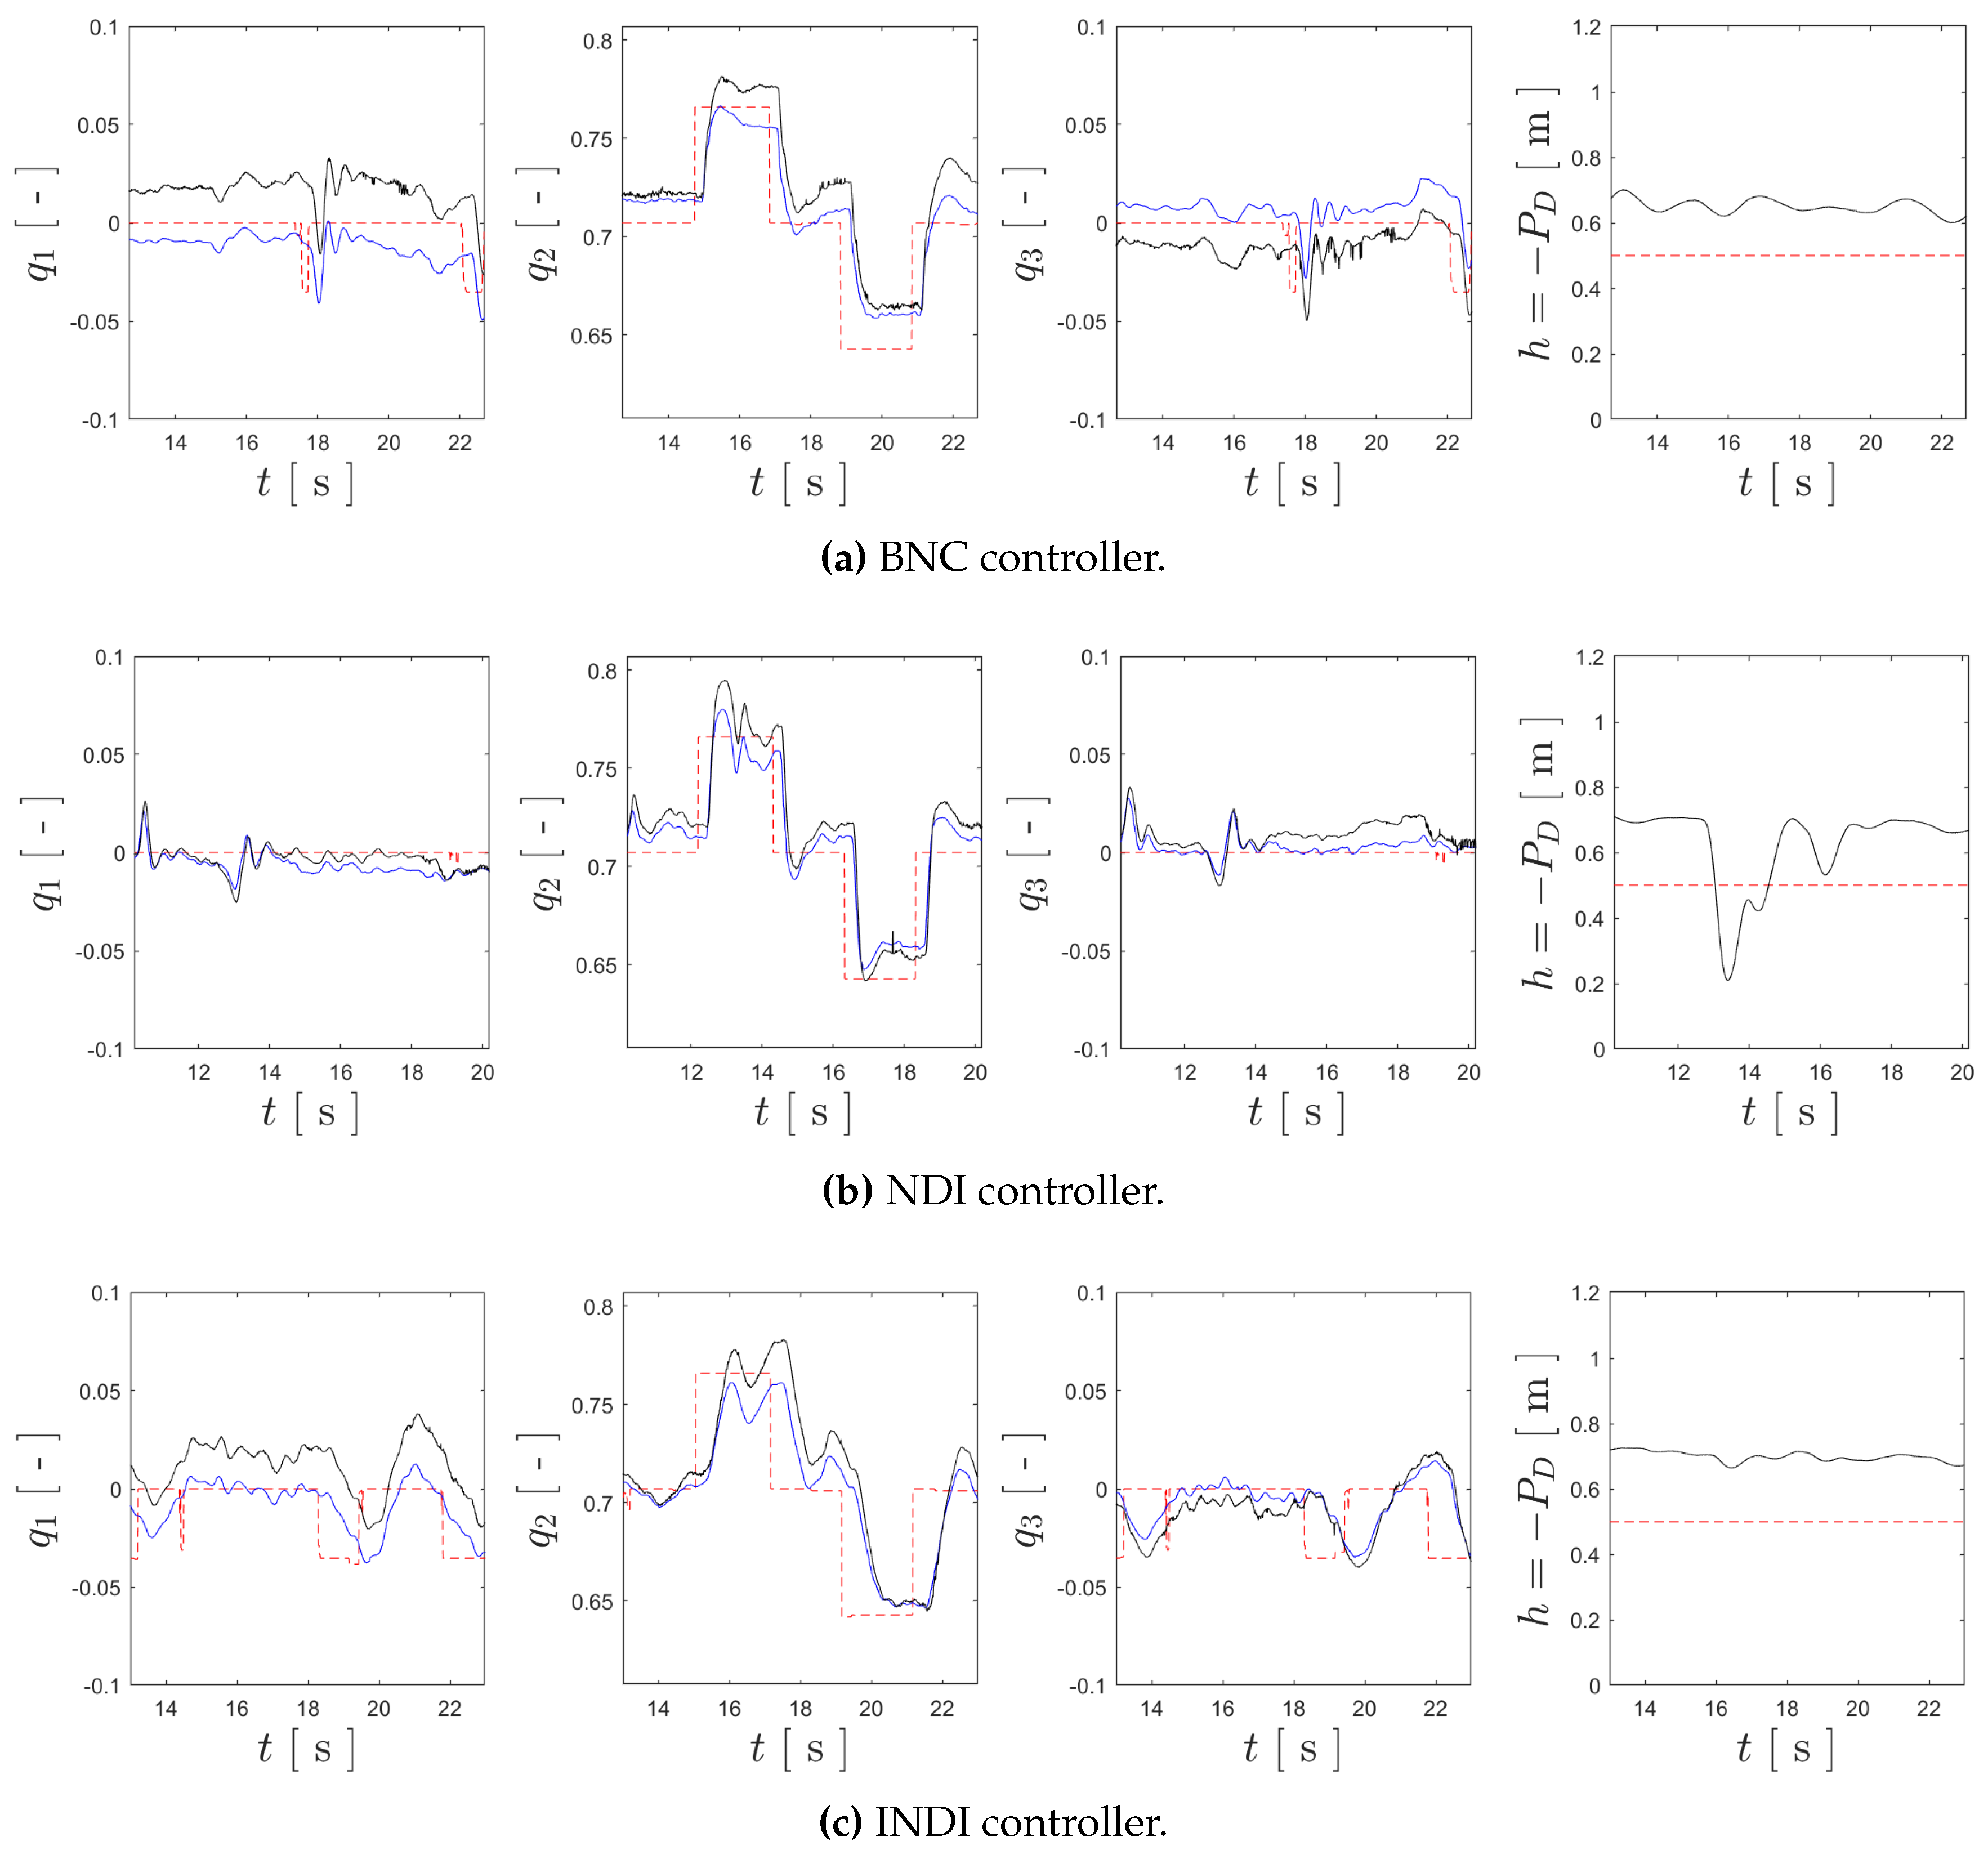
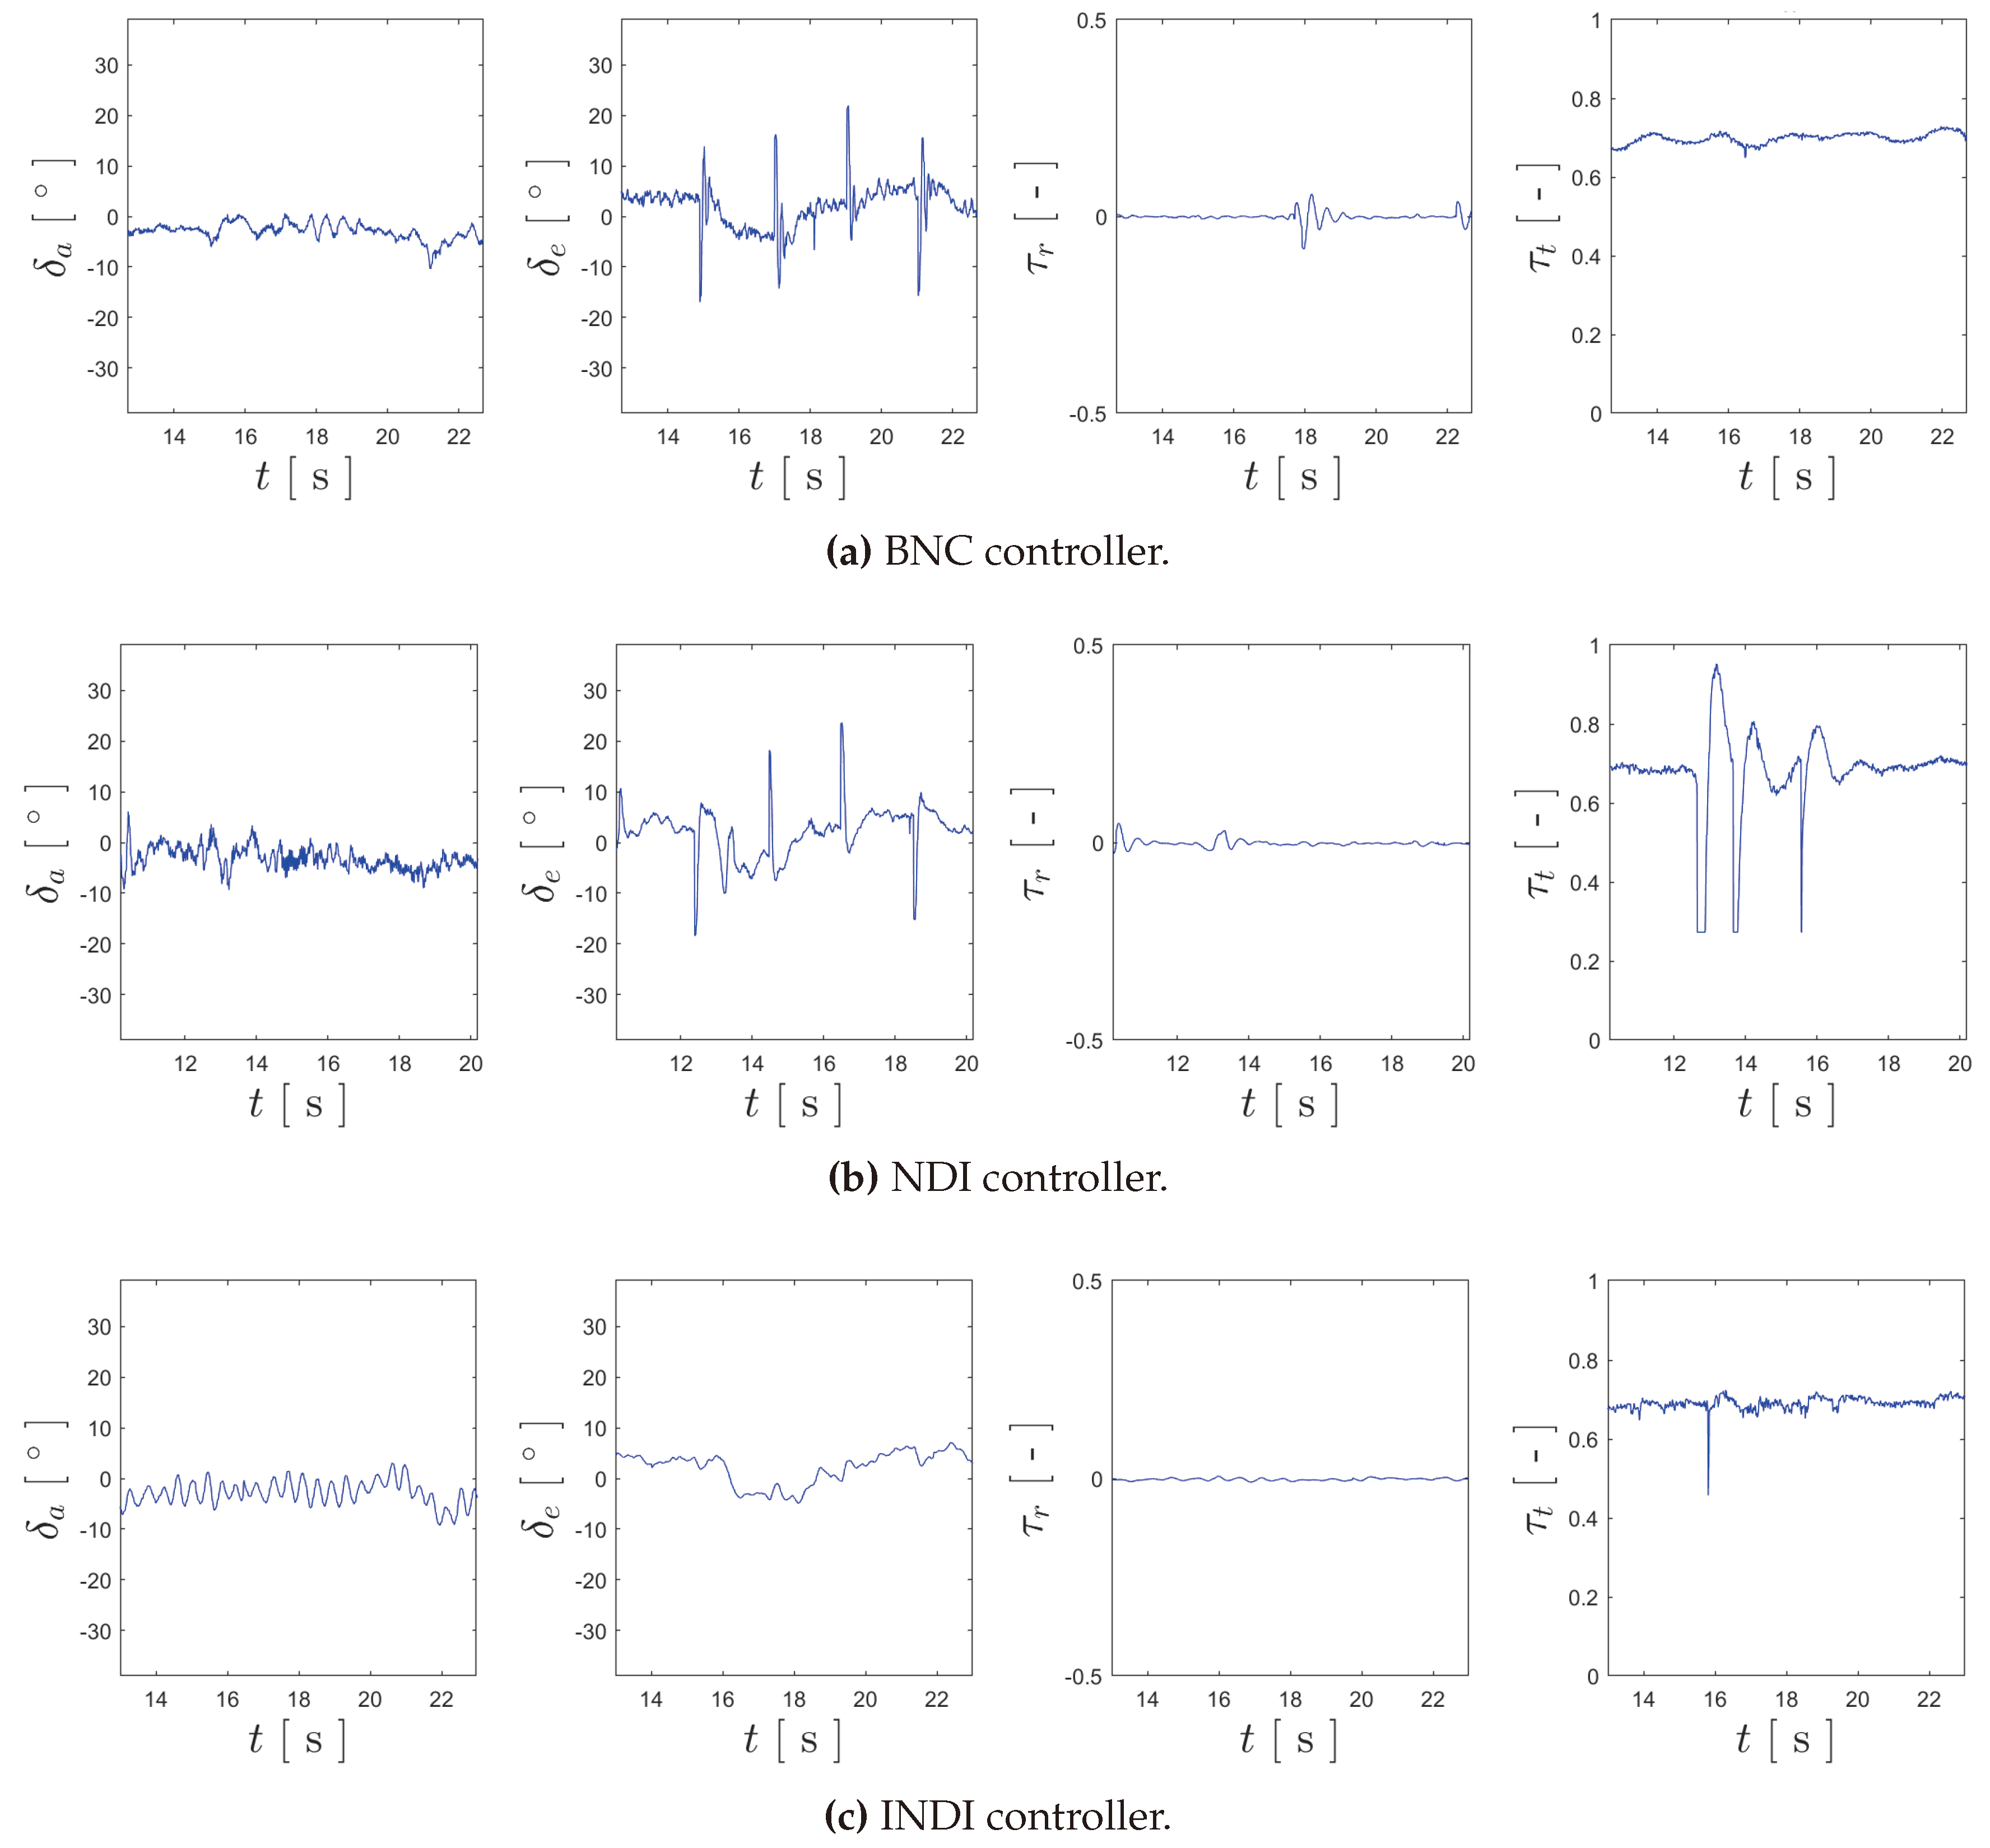
Advancing to an experimental scenario, a tail-sitter was adapted in order to accept the Arduino-based flight controller, and indoor experimental trials for vertical flight were conducted. The results of these highlight once again the smoothness of actuation of the INDI control strategy, nonetheless demonstrating that all the implemented controllers are capable of stabilizing the X-Vert in vertical flight.
Author Contributions
Conceptualization, A.A., A.M. and J.R.A.; methodology, A.A., A.M. and J.R.A.; software, A.A. and J.R.A.; validation, A.M. and J.R.A.; formal analysis, A.A.; investigation, A.A.; resources, A.M.; data curation, A.A.; writing—original draft preparation, A.A.; writing—review and editing, A.M. and J.R.A.; visualization, A.A.; supervision, A.M. and J.R.A.; project administration, A.M.; funding acquisition, A.M.. All authors have read and agreed to the published version of the manuscript.
Figure 1.
Simulation environment.
Figure 1.
Simulation environment.
Figure 2.
Experimental prototype based on the frame of the X-Vert VTOL.
Figure 2.
Experimental prototype based on the frame of the X-Vert VTOL.
Figure 3.
Division of wing into three zones, for the computation of the aerodynamic forces and moments according to different angles-of-attack and airspeed values, as well as elevon deflection.
Figure 3.
Division of wing into three zones, for the computation of the aerodynamic forces and moments according to different angles-of-attack and airspeed values, as well as elevon deflection.
Figure 4.
Block diagram representing the implementation of the INDI controller: the angular acceleration is estimated from gyroscope measurements using the second-order derivative filter, and compared to the desired dynamics , and the difference is used to compute the required control increment. This is then added to the value of the control action of the previous time-step, and then filtered by the command-filter and subject to actuator saturation.
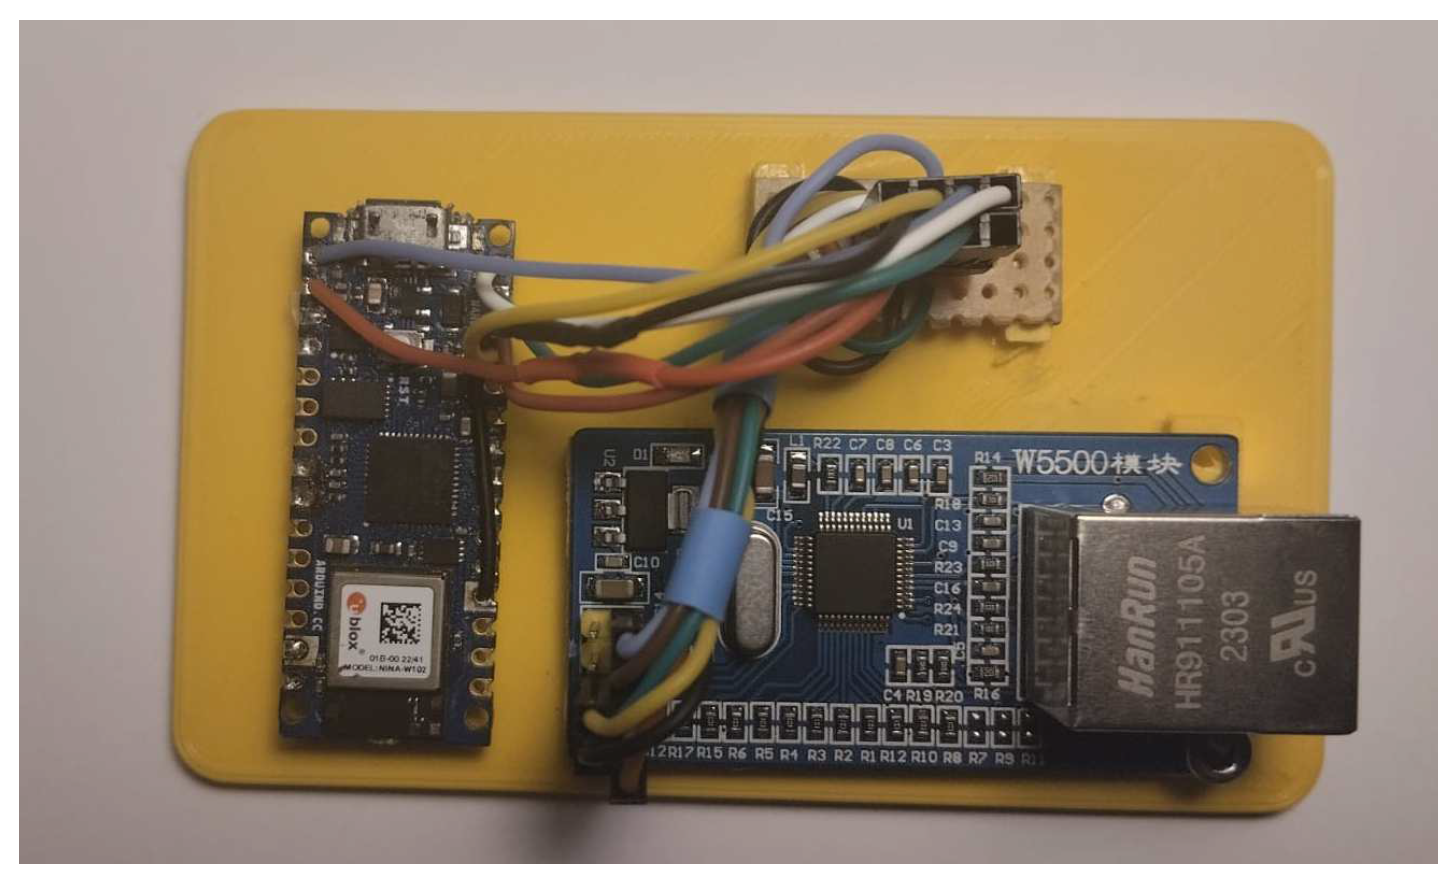
Figure 5.
Assembly designed for the HITL development comprising the Arduino Nano 33 IOT board on the left, the W5500 Ethernet adapter on the bottom-right, and the adapter PCB on the top-right.
Figure 5.
Assembly designed for the HITL development comprising the Arduino Nano 33 IOT board on the left, the W5500 Ethernet adapter on the bottom-right, and the adapter PCB on the top-right.
Figure 6.
References for the benchmark maneuver for vertical flight. From left to right, in dashed pink: references for , , and altitude ().
Figure 6.
References for the benchmark maneuver for vertical flight. From left to right, in dashed pink: references for , , and altitude ().
Figure 7.
Overview of the simulated environment developed for testing the attitude control solutions in Simulink.
Figure 7.
Overview of the simulated environment developed for testing the attitude control solutions in Simulink.
Figure 8.
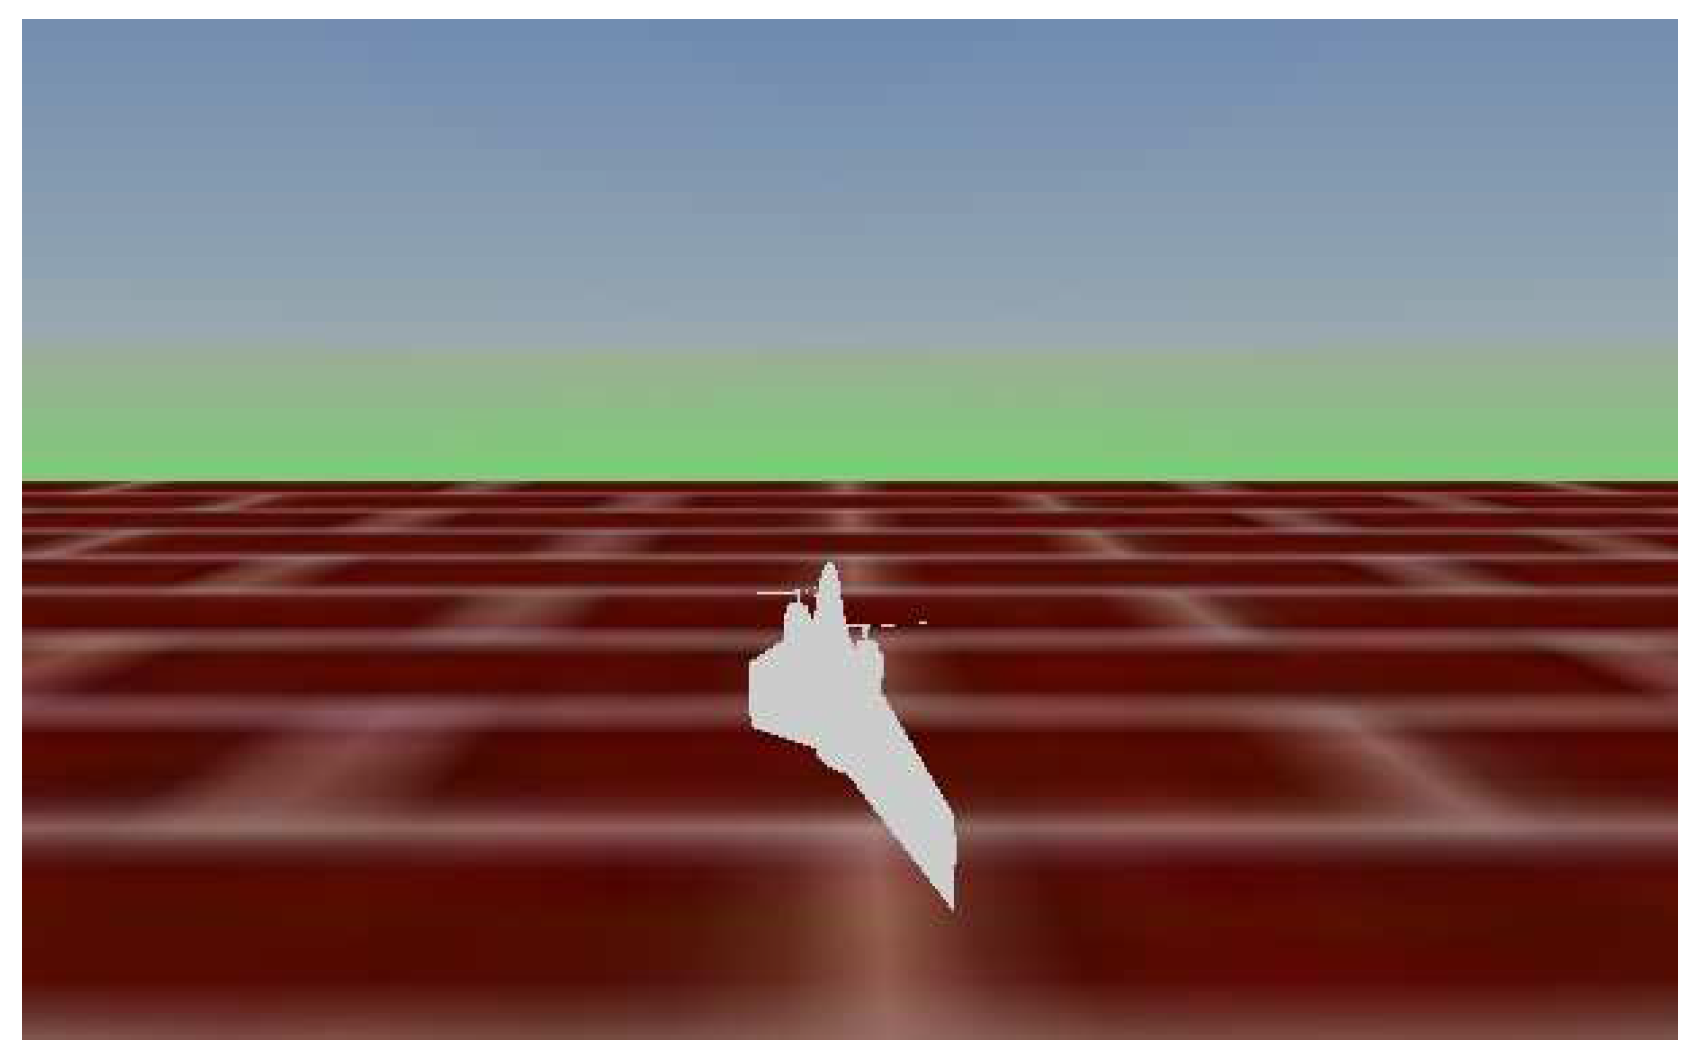
Simulink 3D environment with a tailsitter model [
46].
Figure 8.
Simulink 3D environment with a tailsitter model [
46].
Figure 9.
Tracking results for , and , respectively from left to right. The references are shown in dashed pink, the results for the BNC, NDI, and INDI are represented in red, blue and black, respectively.
Figure 9.
Tracking results for , and , respectively from left to right. The references are shown in dashed pink, the results for the BNC, NDI, and INDI are represented in red, blue and black, respectively.
Figure 10.
Plots for , and , respectively from left to right. The inputs generated by the BNC controller are represented in red, the ones from the NDI are shown in blue, and INDI in black.
Figure 10.
Plots for , and , respectively from left to right. The inputs generated by the BNC controller are represented in red, the ones from the NDI are shown in blue, and INDI in black.
Figure 11.
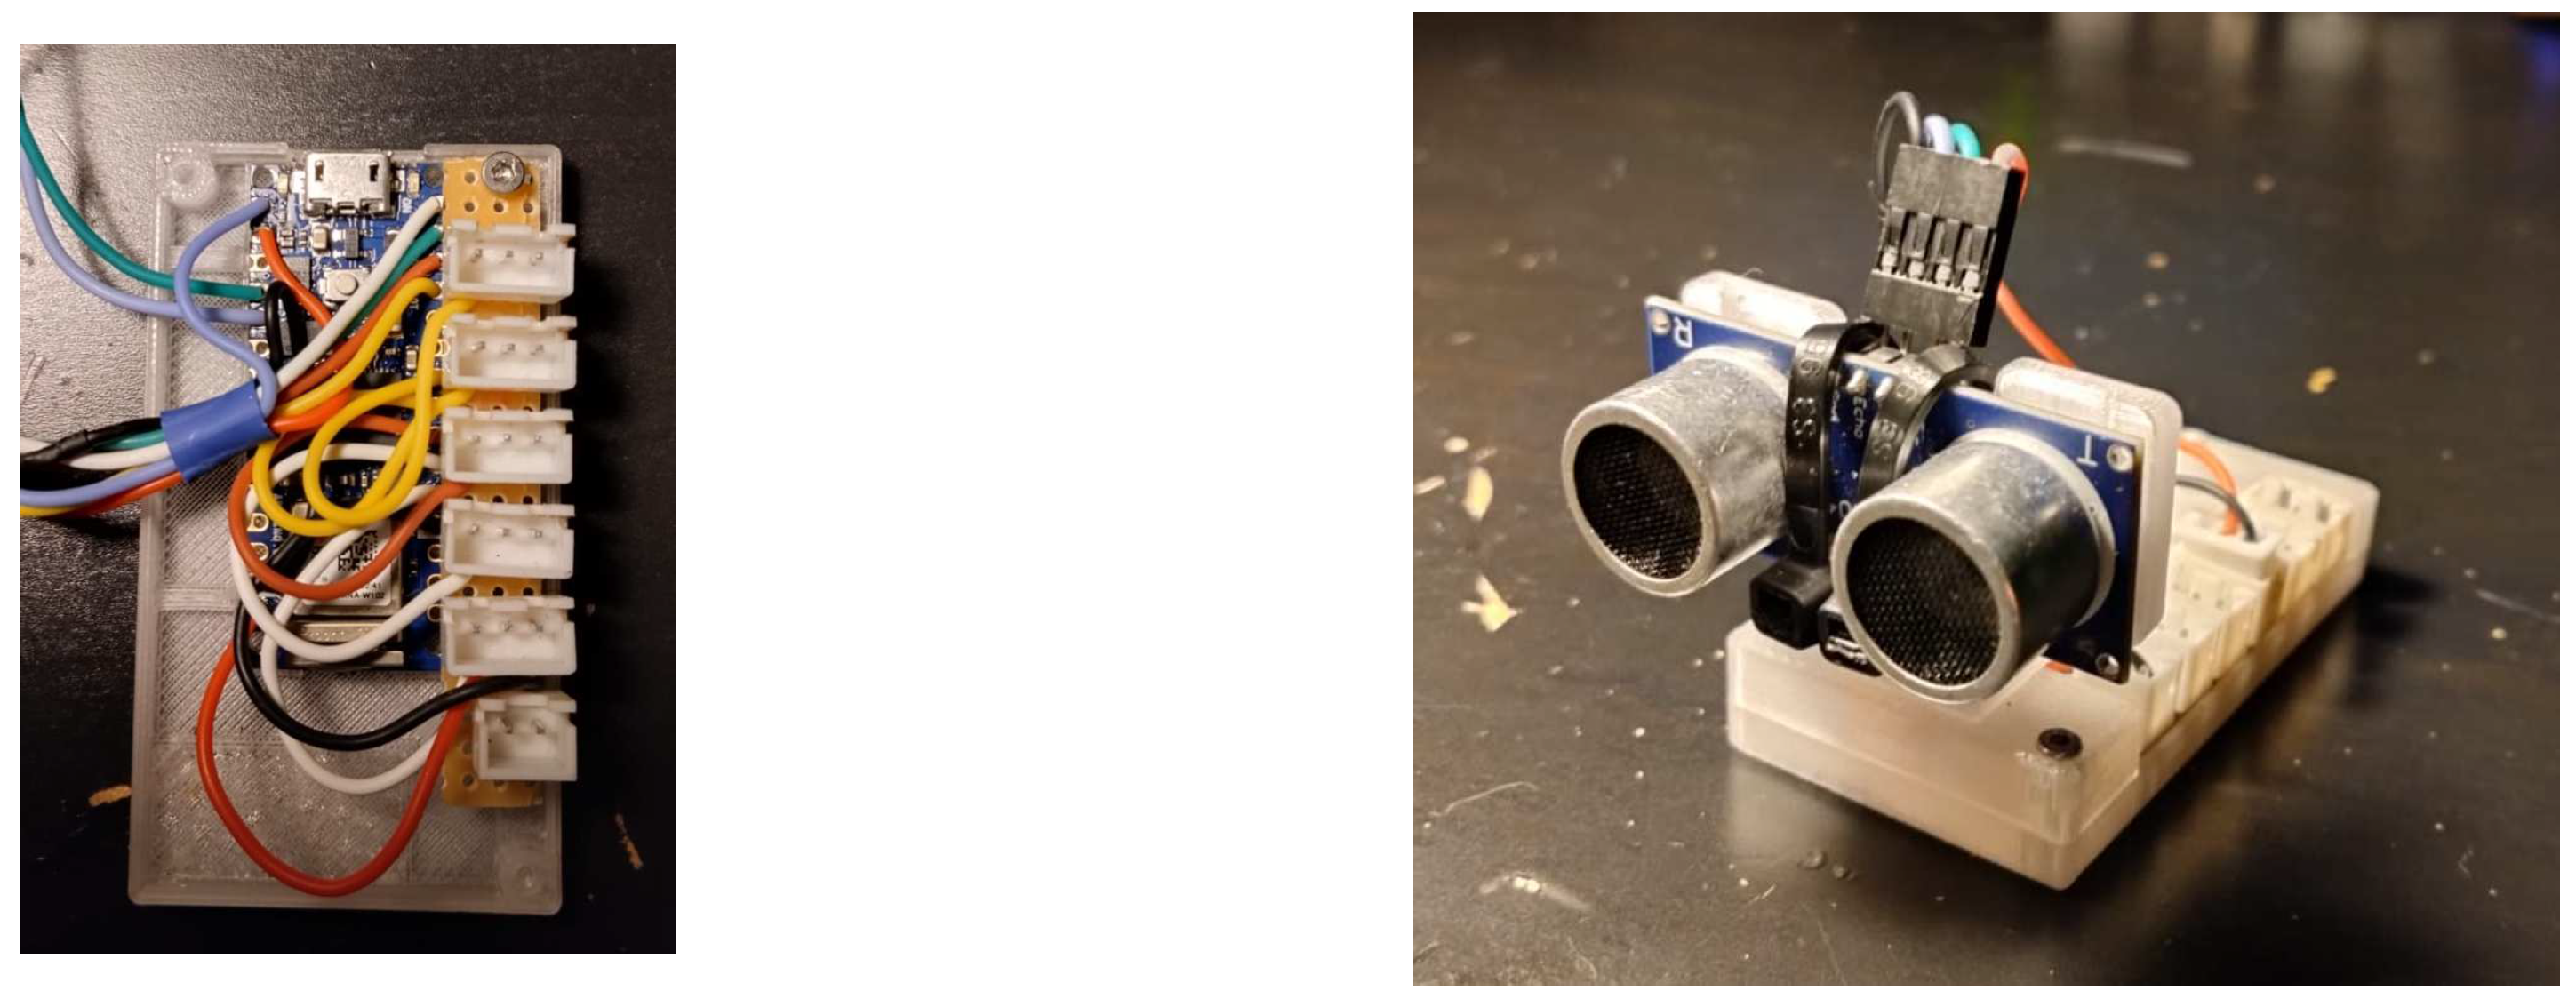
Flight controller based on the Arduino Nano 33 IOT (left) and the HC-SR04 ultrasonic sensor (right).
Figure 11.
Flight controller based on the Arduino Nano 33 IOT (left) and the HC-SR04 ultrasonic sensor (right).
Figure 12.
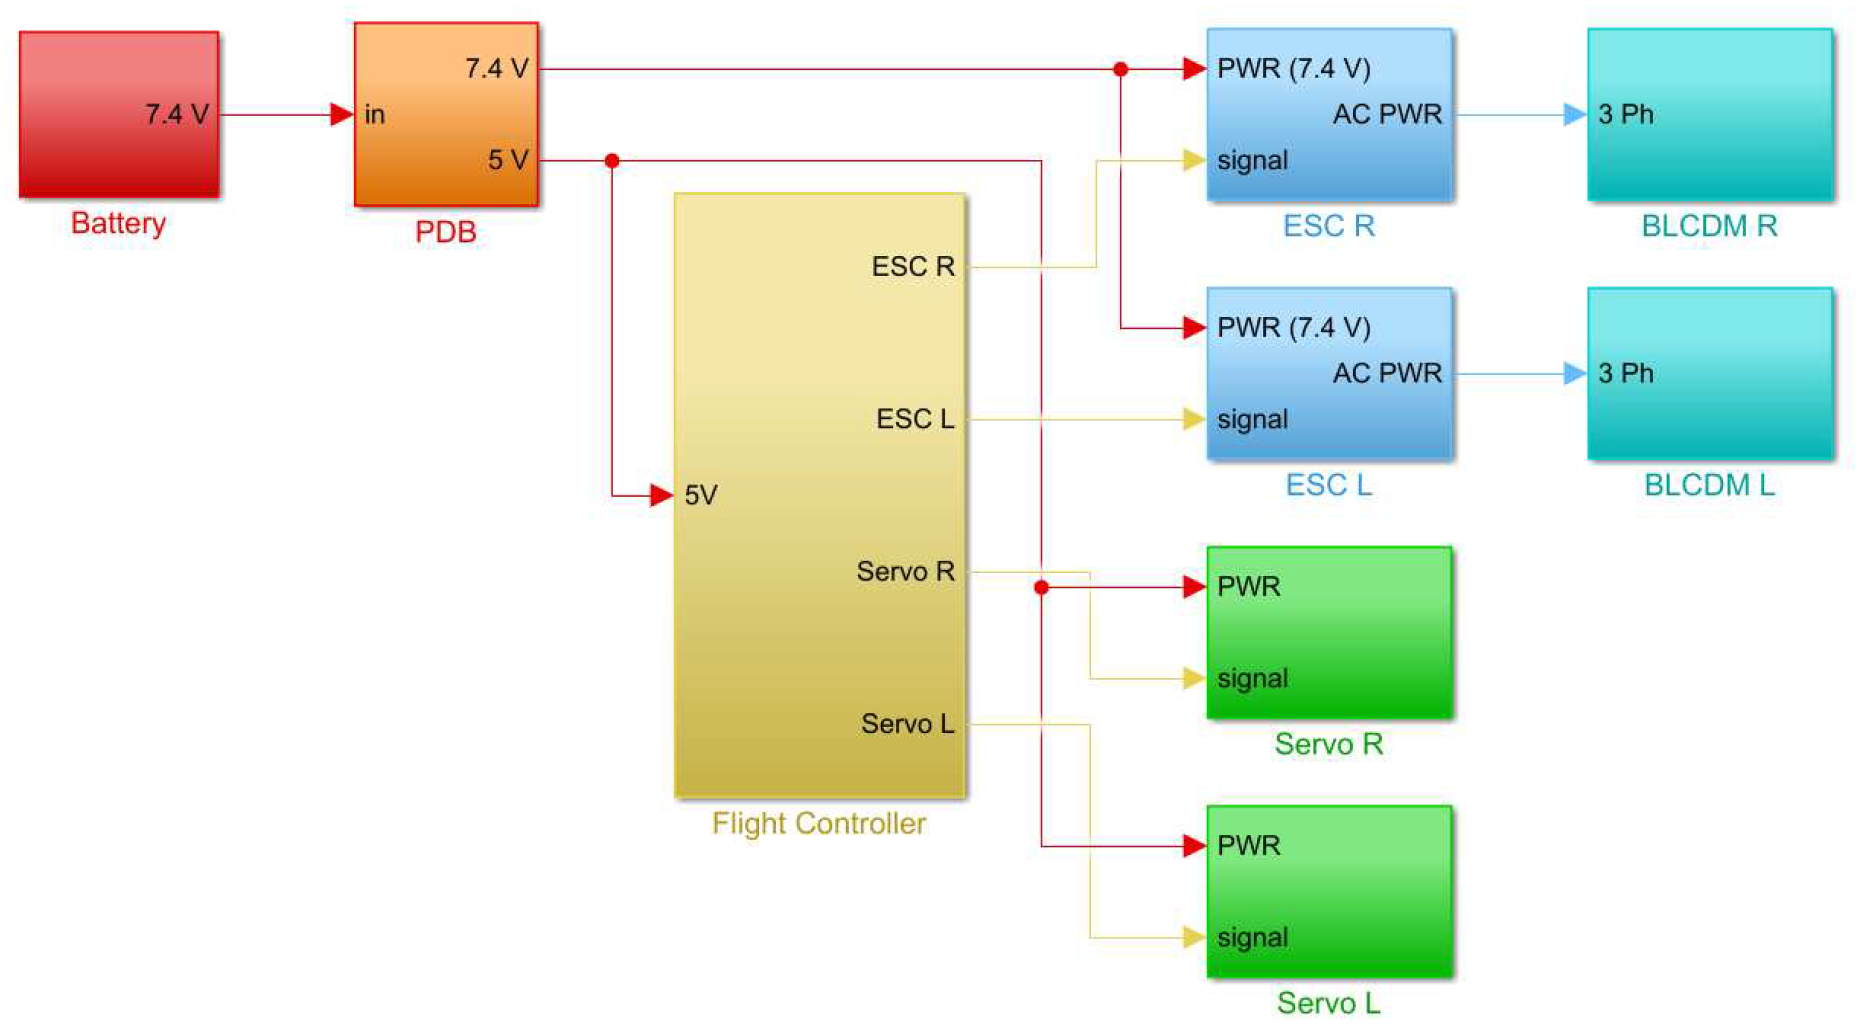
Diagram of electronics of the experimental assembly. From left to right: battery (red); PDB (orange); FC (yellow); ESCs (blue) and BLDC motors (cyan); and servos (green). The power supply lines can be seen in red displaying the respective voltage levels, the signal lines are shown provided from the FC are shown in yellow, and the three-phase ones are shown in blue.
Figure 13.
3D printed test assembly, designed to validate the communications and controller implementation.
Figure 13.
3D printed test assembly, designed to validate the communications and controller implementation.
Figure 14.
On the left: 12-by-4 meter net-protected arena used. On the right: 3D reconstruction of the X-Vert using the MCS.
Figure 14.
On the left: 12-by-4 meter net-protected arena used. On the right: 3D reconstruction of the X-Vert using the MCS.
Figure 15.
References for the experimental trial for the BNC controller.
Figure 15.
References for the experimental trial for the BNC controller.
Figure 16.
Full-length experimental trial for the BNC controller, where the references are shown in dashed red, the ground-truth is represented by black, and the estimated values are presented in blue.
Figure 16.
Full-length experimental trial for the BNC controller, where the references are shown in dashed red, the ground-truth is represented by black, and the estimated values are presented in blue.
Figure 17.
Tracking results for the different attitude controllers, where the references are shown in dashed red, the ground-truth is represented by black, and the estimated values are presented in blue.
Figure 17.
Tracking results for the different attitude controllers, where the references are shown in dashed red, the ground-truth is represented by black, and the estimated values are presented in blue.
Figure 18.
Plots of each component of recorded for the flight trials of each controller.
Figure 18.
Plots of each component of recorded for the flight trials of each controller.
Table 1.
Simulation results.
Table 1.
Simulation results.
| Cont. |
|
|
|
|
|
|
|
|
| BNC |
0.0133 |
0.0139 |
0.0116 |
0.0129 |
0.0273 |
0.0176 |
0.0104 |
0.0184 |
| NDI |
0.0178 |
0.0072 |
0.0221 |
0.0157 |
0.0122 |
0.0216 |
0.0011 |
0.0116 |
| INDI |
0.0171 |
0.0119 |
0.0166 |
0.0152 |
0.0012 |
0.0007 |
0.0001 |
0.0007 |
Table 2.
Hardware-in-the-Loop results.
Table 2.
Hardware-in-the-Loop results.
| Cont. |
|
|
|
|
|
|
|
|
| BNC |
0.0246 |
0.0215 |
0.0142 |
0.0201 |
0.0295 |
0.0182 |
0.0108 |
0.0195 |
| NDI |
0.0201 |
0.0117 |
0.0227 |
0.0182 |
0.0117 |
0.0083 |
0.0011 |
0.0070 |
| INDI |
0.0212 |
0.0143 |
0.0188 |
0.0181 |
0.0028 |
0.0011 |
0.0003 |
0.0014 |
Table 3.
Experimental results in tracking .
Table 3.
Experimental results in tracking .
| Cont. |
|
|
|
|
| BNC |
0.0219 |
0.0292 |
0.0149 |
0.0220 |
| NDI |
0.0071 |
0.0264 |
0.0115 |
0.0150 |
| INDI |
0.0271 |
0.0352 |
0.0232 |
0.0285 |
Table 4.
Experimental results in oscillation of .
Table 4.
Experimental results in oscillation of .
| Cont. |
|
|
|
|
| BNC |
0.0056 |
0.0213 |
0.0018 |
0.0095 |
| NDI |
0.0144 |
0.0156 |
0.0012 |
0.0104 |
| INDI |
0.0039 |
0.0018 |
0.0002 |
0.0020 |
