Submitted:
08 February 2024
Posted:
08 February 2024
You are already at the latest version
Abstract
: Human settlements have historically thrived near rivers for navigation, trade, and availability of water supply and resources. Night light data, representing economic activities provide a novel approach to studying the interactions between human activity and rivers over time. Here, we use the Defense Meteorological Satellite Program (DMSP) stable night light data from 2000-2013 as a proxy for human presence and activities to quantify the statistical relationships between night light presence and intensity in the Indus Basin, Asia. We test how these data are affected by proximity to trunk channels and by channel type (single/multi-thread) in the study area. We find that night light presence is enhanced by 26% within a 0 to 5 km proximity range of the Indus River and its tribu-taries, relative to the basin as a whole. We interpret this to represent increased human presence and activity within this zone. However, the mean intensity is lower near the river and higher away from the river signifying denser settlements, such as towns and cities which are preferentially located away from the Indus and its tributaries. Moreover, the enhancement of lit pixels signifying human presence and activities is increased by 18% near single-thread sections of the Indus River, compared to segments of the Indus displaying multi-thread morphologies. We suggest that this is due to the enhanced stability of single-threaded channels, relative to mobile multi-threaded channel reaches. This study demonstrates how night lights are an important tool to constrain the relationship between human presence and river dynamics in large catchments such as the Indus, and we suggest this data will have an important role in assessing differential flood spatial and social vulnerability at a regional scale.
Keywords:
Night lights
; DMSP
; Floods
; Channel-pattern
; Indus
; Anthropogenic activities
; Geomorphology
1. Introduction
Since the beginning of human civilization, rivers have influenced landscape evolution and population dynamics [1]. From ancient times, early humans have settled in the proximity of rivers for navigation, trade, and availability of water supply and resources. However, over time these areas have become more susceptible to the catastrophic effects of flooding because of the rapid increase in the human population and anthropogenic activities on a global scale that have impacted the environment [2,3]. Thus, an in-depth understanding of the role of geomorphology in shaping human settlements through time is required. The Indus Basin is one of the world’s largest and most populous basins. However, the river system in the basin poses a significant threat due to urbanization and related human activities [4]. This study aims to explore the influence of terrain and geomorphology on human presence to understand the vulnerability of humans to natural hazards like floods.
Analysis of satellite images is an effective and cost-efficient way to investigate spatial patterns of the populations of landscape in a basin at a relatively recent timescale. Traditionally, human presence has been analysed using optical data like NASA-provided LANDSAT and MODIS data [2]. But the conventional processing and the multispectral classification make it hard to identify or extract the urban areas from the bare soil [5]. Thus, as an alternative, we use the Defense Meteorological Satellite Program (DMSP) stable night light data as a proxy for human presence (see also Section 3) [6]. Stable night lights are cloud-free digital products signifying the absence of lights and distinct luminosity. In the past 20 years, the DMSP-OLS night lights data have increasingly been explored for demographic, economic, and environmental purposes [7,8,9,10,11,12]. Importantly, recent efforts toward analyzing applications of night light data have indicated their value for determining human exposure and vulnerability to natural hazards compared to traditional approaches.
For instance, Ceola et al. provided night lights as a proxy for the assessment of human exposure to floods by associating them with the river network and identifying flood-subjected areas worldwide [13]. Following this approach, Gómez et al. used night lights to investigate the temporal variation of the spatial distribution of the exposure to hydrometeorological hazards in the Samala River in Guatemala [14]. Ceola et al. also quantified the temporal evolution and spatial distribution of urban settlements in the proximity of streams and rivers at a global scale [2]. Mård et al. used stable night lights to understand the human-environment interactions by studying the relationship between catastrophic flood events, flood protection levels, and long-term changes to human proximity to rivers [15]. Additionally, Fang et al. explored the river’s geomorphic structure and human settlement patterns at a global scale using night lights and identified preferential downstream clustering of settlements across six continents, suggestive of distributions related to trade and transport purposes in the studied river basins [16]. Recently, Masrur et al. demonstrated the assessment of the human presence and flood exposure in proximity to rivers in Bangladesh using the multi-temporal satellite nighttime light (NTL) [17]. Their study showed emerging hotspots of night lights and population near the Indus River under flood-exposure risk.
These studies all demonstrate the value of night light data in quantifying human presence within river basins. Yet, to date, most research using night light data in this context has been on a global scale and research has been limited at the scale of individual catchments and as a function of different geomorphic parameters. Compared to prior studies, the novelty in our contribution, therefore, lies in characterising the detailed relationship between river patterns, terrain, and human presence using the Indus Basin as a well-constrained natural laboratory. To study the relationship of human presence using night lights with respect to different geomorphic parameters we test two hypotheses. Our first hypothesis is that there is a higher human presence near the river in floodplains due to water availability and soil fertility. Thus, we test and evaluate the prediction that both night light presence and intensity should be higher near major tributaries for the Indus catchment, compared to the basin as a whole. Secondly, we hypothesize that human presence is also affected by the channel pattern type i.e., single-thread or multi-thread channel types. Given the documented stability of the channel banks for different channel patterns [18], we evaluate whether human presence is higher near single-thread or meandering river channel reaches rather than braided or multi-thread channels.
2. Study area
The Indus Basin is one of the major river basins of the world having a drainage area of > 1,100,000 km2 (Figure 1). The basin is shared by four countries of which 47% of the basin is occupied by Pakistan and nearly 39% by India. China and Afghanistan account for approximately 8% and 6% of the area of the basin [19]. Several tributaries transport the snowmelt, glacier melt, rainwater, and runoff from the Himalayas, Hindu Kush, and Karakoram mountain areas. The major tributaries of the Indus are the Kabul, Kurram, Jhelum, Ravi, Beas, Sutlej, and Chenab. The Indus River starts in western Tibet at an elevation of > 6700 m, initially flowing northwest and then southwest through Pakistan, and finally draining into the Arabian Sea. It has a total length of 3180 km [20]. In the Upper Indus Basin, which is upstream of Tarbela Dam in Pakistan [21], the river flows as alternating meandering single-channel reaches and reaches with multi-channel patterns in an initial length of 1125 km [20].
The Indus Basin climate varies from Alpine in the northern mountain highlands to semi-arid to temperate subhumid in the plains. The annual precipitation in mountainous areas of the basin is around 2000 mm and between 100-500 mm in the lowlands or plains [19]. The basin receives maximum rainfall during the monsoon period from July to September, which is the primary reason for the flooding [22]. The average rainfall over the lower plains is 125 mm and 500 m upstream [22]. According to UN Food and Agriculture Organization AQUASTAT data, the population of the Indus Basin is around 300 million [19]. The inhabitants of the basin are dependent on agriculture irrigation, industrial requirements, hydroelectric power, flood control, recharging of aquifers, transportation, fisheries, and domestic human consumption [23].
3. Data
3.1. DMSP Night Lights Data
Nighttime light time series (DMSP-OLS v4) are open-access digital products by the National Geophysical Data Center from the National Oceanic and Atmospheric Administration (NOAA) collected under the Defense Meteorological Satellite Program (DMSP) from 1992 to 2013 using the Operational Linescan System (OLS) [6]. The DMSP-OLS night light data are collected by six satellites - F10, F12, F14, F15, F16, and F18. These are cloud-free composites from sites that include cities, towns, and gas flares, excluding the sunlit and moonlit data observations from ephemeral sources like fires [2].
The Operational Linescan System (OLS) sensor acquires global daytime and nighttime images in two spectral bands: the thermal infrared band (TIR) from 10.5-13.4 µm and the visible and near-infrared band (VNIR) from 0.4-1.10 µm. The data is expressed in terms of average annual intensity denoted by Digital Number (DN) (DMSP data collected by the US Air Force Weather Agency). The digital number (DN) values in the visible band range from 0 to 63, whereas zero signifies the absence of lights and distinct luminosity (Figure 2). The OLS night light data represent a grid of 30 arc seconds spanning -180 to 180 degrees longitude and -65 to 75 degrees latitude. The spatial resolution is roughly 1 km at the equator. In years where two satellites were collecting data, two composites were produced. For example, in 1994 and from 1997 to 2007, two satellites simultaneously acquired two distinct sets of night light data. To obtain a unique night light value for each pixel in a year, the average luminosity pixel value can be calculated from the two overlapping satellite data for each year.
The program started in the mid-1960s and originally aimed to gather the global cloud cover day and night data. However, the usage of night lights remained limited within the remote sensing community until the 1990s because of the unavailability of data in digital form [24]. In 1992, the NOAA National Geophysical Data Center established a digital archive of the DMSP data, and now the data have usability for studying the human presence and settlement dynamics. Earlier work established a relationship between the “stable lights” data and measures of the population regardless of economic development [10]. Imhoff studied the correlation between the urban extent using the DMSP-OLS night lights and the population using census data [25]. However, the dataset was calibrated for radiance due to a lack of intensity information [26]. Thus, we use the calibrated data from the Earth Observation Group, Payne Institute for Public Policy, Colorado School of Mines, calibrated data can be directly downloaded from https://eogdata.mines.edu/products/dmsp.
Despite the advantages of the DMSP-OLS night lights data, there are some limitations associated with it including relatively low spatial resolution [27]; some inconsistency in the DMSP sensors due to the absence of onboard calibration [28]; light saturation in urban core areas [29]; and the blooming effect, which is the overestimation of night light values over the transition areas between urban and rural areas [29]. The average DN values are weaker in developing countries and thus, the threshold methods are not always valid [15]. Hence, the influence of these effects can be minimized by studying the trends in night lights over the long term rather than measuring absolute values or focusing on individual years [30].
4. Methods
4.1. Processing of the DMSP Night Lights (2000-2013)
We use the Defense Meteorological Satellite Program-Operational Linescan System (DMSP-OLS) stable night lights data in the Indus Basin from 2000 to 2013 to study human presence in the basin. Yearly global calibrated night lights were downloaded in GeoTIFF format for the period 2000 to 2013. From 2000 to 2009, two simultaneous satellites were operating and gathering the data. Thus, to obtain the unique values of a particular year, the average of the two satellite datasets was computed in ArcGIS.
To obtain the distribution of night lights over the Indus Basin, the basin boundary was extracted from the SRTM Digital Elevation Model (DEM) of 1 km spatial resolution, using the D8 algorithm in ArcGIS. Using the DEM as an input flow direction, flow accumulation, and channel network were extracted using the ArcHydro tools in ArcGIS. Thus, the Indus River, its major tributaries, and the catchment were delineated to understand the distribution of the night lights, as a proxy for human presence, with respect to the rivers in the basin. This study considers higher-order streams (6 and above) only as these are the major watercourses in the region.
The DMSP-NLS rasters for 14 years were cropped for the Indus Basin and projected into the WGS Albers 1984 projection for calculation purposes. Figure 3 represents the distribution of night lights over the Indus Basin for the years 2000, 2007, and 2013. To obtain the average distribution of night lights for further statistical analysis, the mean of the annual datasets was computed per pixel over the time in the basin in RStudio. Figure 4 shows the average distribution of night lights from 2000-2013 over the Indus Basin.
4.2. Processing of the LandScan Global Population Data
In this study, we use night lights as a proxy for human presence. The night lights include informal human settlements, for instance- industrial setups, workplaces, highways, etc., where a residing population is absent but which are representative of anthropogenic activities. Thus, to establish the extent to which night light data can be used as a direct proxy for the human population, we used the LandScan Global data, which is considered to have high spatial accuracy and estimated errors [31]. LandScan Global is a worldwide data that integrates geographic information systems (GIS), remote sensing technology, and machine learning to estimate the ambient population at a 30-arc-second resolution [32]. The data from 2000-2013 was downloaded from https://landscan.ornl.gov/ and reprojected into the WGS Alber 1984 projection using ArcGIS Pro. The raster data for 14 years were clipped to the basin boundary and the total population for each year was calculated. The population derived from the LandScan data was related to the sum of lights from the night lights dataset. Such a correlation between the night lights and the population density would specifically show the extent to which night lights record the human population as well as indicate human presence in the study area.
4.3. Presence or Absence of Night Lights across the Basin and Buffer Zones
We started with an evaluation of the basics of night light distribution as a proxy of human presence with respect to the catchment, as earlier studies have focused on very large-scale studies rather than considering the local terrain. Consequently, to understand the role of the proximity of the rivers on human presence and to test our hypothesis of preferential settlements and human activity near the river, four “buffer zones” of 5 km each were established for the Indus River and its major tributaries. We define buffer zones as areas within specific distances from the river channel. Four buffer zones: 0-5 km; 5-10 km; 10-15 km; and 15-20 km (as measured from the major water course) were extracted using the buffer tool in the Geoprocessing toolbox in ArcGIS Pro.
To investigate the distribution of lit pixels in the basin and buffer zones, their geographical area and the area of the lit pixels were calculated in km2 for each zone. Also, the area percentage (%) for the catchment area of the Indus was calculated (Table 1). Because the absolute area of each zone varied, the occurrence of lit pixels frequency was normalized by the spatial extent of each zone. This enabled us to determine whether the occurrence of lit pixels simply mirrored the area distribution of the different buffer zones or if some zones, for instance close to rivers, were associated with an enhanced probability of occurrence of lit pixels. We describe this ratio as an Enhancement Factor, Ef, which we obtained by dividing the percentage of lit pixels in a zone by the percentage of lit pixels across the basin as a whole (Equation 1). The enhancement factor indicates the occurrence of lit pixels independent of the geographical area of each buffer zone.
4.4. Night Light Intensity Distribution with Relation to River Channel Pattern
To explore the influence of channel patterns on human presence in the Indus Basin, the distribution of lit pixels adjacent to the Indus River was calculated with relation to channel pattern type - single thread versus multi-channel patterns. Single-thread and multi-thread reaches of the Indus River were identified through visual inspection on Google Earth Pro between 2000 to 2013 (Figure 5A and Figure 5B). The first-order channel pattern type was recognized based on detailed observation from Google Earth imagery, including the number of styles of channel threads. Multi-thread river segments had multiple channel bars separated by channels, whereas single-thread channel segments had a single channel with a sinuous planform typically characterised by high sinuosity [33]. Due to the area of the basin, the distribution of night lights across the pattern type of only the Indus River was studied for this analysis; we also do not consider local variations in planform over short distances (<500m). The points of change in the predominant pattern type of the Indus River were identified on Google Earth Pro. Four buffer zones of 0-5 km, 5-10 km, 10-15 km, and 15-20 km were created for each pattern type using the buffer tool in the Geoprocessing toolbox in ArcGIS Pro.
To understand the distribution of night lights across the two-channel pattern types, the geographical area and the lit pixel area were calculated within each buffer zone for each channel pattern. Table 2 represents the geographical and night light occupied area percentages for each buffer zone for the single thread channel. The total area represents the area occupied within the 20 km vicinity of the single-thread channel from its centreline. Similarly, geographical and night light-lit areas were calculated for the buffers for the multi-thread channel (Table 3). Further, the enhancement factor (Ef) was computed by dividing the percentage of lit pixels in each class of channel pattern type by the percentage of lit pixels of the total area of the respective channel pattern type (Equation 2 and 3). This enables a normalized relation between the presence of lit pixels and the distance from the river for different channel pattern types to be analysed (Table 2 and Table 3).
5. Results
5.1. How Well Do Night Light Data Serve as a Proxy for Human Activity?
To establish how well night lights data approximate human presence and activity in our study area, we compared the sum of lights derived from night lights data with population density data over the Indus Basin derived from the Landscan Global population dataset. The sum of lights is the summation of the lit pixel values over the study area. This enables us to evaluate the extent to which night light data serves as a reasonable proxy for human presence and activity. We note that the sum of lights represents data captured from four different satellite sensors – F14, F15, F16, and F18 - capturing the night lights data between 2000-2013 (Figure 6- red, blue, green, and yellow colors respectively).
Figure 6 shows an overall positive correlation between summed night lights and population with a linear correlation coefficient (R) of 0.655 over 14 years and R2 of 0.429. To further test its statistical significance, we computed the p-value which was found to be 0.011, less than the significance level of 0.050. This provides evidence against the null hypothesis of variables being not dependent, as there is less than a 5% probability the null is correct (and the results are random). Therefore, we reject the null hypothesis and accept the alternative hypothesis of variables being dependent. Thus our results suggest that the night light data provide a good proxy for human presence in the study area (red-dash line, Figure 6).
5.2. Relation between Night Light Distribution and Proximity to Rivers
To investigate the proximity of human presence to the main rivers in the Indus Basin we examined the relation between the occurrence of lit pixels and distance to rivers. In Figure 7 we compare the spatial distribution of lit pixels in each of the four buffer zones progressively moving outwards from the river centreline with the geographical area covered by each of the buffer zones. The buffer zone geographical area percentage with respect to the basin area was 9.64%, 8.95%, 8.47%, and 7.89% for the 0-5 km, 5-10 km, 10-15 km, and 15-20 km buffer zones respectively (Figure 7A). Figure 7B shows the area (in km2) of lit pixels across these different buffer zones. Around 533,200 km2 of the Indus Basin is occupied with night lights, equivalent to 46% of the area of the basin, indicating extensive human presence across the basin. The percentage area of the lit pixels with respect to the total lit pixels area of the basin across the four buffer zones are 12.19%, 9.93%, 8.72%, and 7.80% for the 0-5 km, 5-10 km, 10-15 km, and 15-20 km buffer zones respectively. The lit pixels area is higher within the 0-5 km river network buffer, signifying a larger number of lit pixels in proximity to the river.
To characterize the degree of enhancement of lit pixels independent of the geographical area of the buffer zone, an enhancement factor, Ef was calculated as described in Equation 1. Figure 7C shows that the number of lit pixels is enhanced by 26% (a factor of Ef = 1.26) within 5 km of the river network in the Indus Basin, compared to the data set as a whole. Moreover, the number of lit pixels is enhanced by 11% and 3% within the 5-10 km and 10-15 km buffer zone respectively. However, the distribution of night lights in the 15-20 km zone is approximately the same as the whole basin (Ef = 0.99). Consequently, our data suggest that at more than 15 km away from the Indus and its major tributaries, human presence or activity recorded in night light data is not statistically different from the basin as a whole. Figure 7C also demonstrates that human presence is significantly enhanced near major rivers in the basin, with a particular concentration within 5 km of the drainages analysed.
5.3. How Does the Intensity of Night Lights Vary in Proximity to Rivers?
Figure 7C demonstrates a statistically significant increase in the occurrence of lit pixels in proximity to rivers in the Indus Basin. We now turn to an exploration of whether the intensity of these lit pixels captured in the data set behaves similarly. The relationship between the intensity of the lit pixels and the occurrence of lit pixels is explored by a comparison of the frequency distribution of lit pixel digital number (DN) across the basin and the four buffer zones of 0-5 km, 5-10 km, 10-15 km, and 15-20 km. DN is a proxy for night light intensity. Figure 8 shows histograms plotting of the frequency of occurrence of DN values in the overall Indus Basin and the various designated buffer zones outward of river centrelines. These plots represent the variation in the frequency of the intensity of night lights across the buffer zones. Importantly the histograms in Figure 8 indicate that the distribution of intensities (DN value) within the basin and the buffer zones identified for this study are not the same shape as the frequency of lit pixels differs.
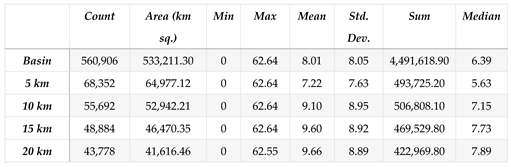
Descriptive statistics for the lit pixels in the buffer zones were calculated in Table 4. The mean DN of the basin is 8.0, and the median is 6.4. Figure 9, shows the cumulative frequency of the lit pixels as a function of DN intensity in the night light data. The median intensity (DN) of lit pixels over the 5 km buffer zone closest to the major rivers is 5.6; this increases to 7.15 in the 5-10 km zone; 7.7 in the 10-15 km and 7.9 in the 15-20 km buffer zone, values which are greater than the median for the basin (=6.4) as a whole. Thus, all five distributions are offset from each other. To further test the statistical significance of varying night lights distribution two sample KS-tests were computed. This allowed us to reject the null hypothesis that these distributions were similar at a 95% confidence level showing that night light intensity was greater further from the river.
To understand the relationship between the distance to the river and the mean intensity of night lights, the mean intensity (DN) of the lit pixels was plotted against the count of lit pixels across each buffer zone (Figure 10). We recover a quadratic relationship that shows that as the distance from the river increases, the number of lit pixels decreases whereas the mean intensity (DN) increases. For instance, in the 0-5 km buffer zone, the mean intensity was 7.2 and the total number of lit pixels was 68,000 compared to the 15-20 km buffer zone where the mean intensity was 9.7 and the total number of lit pixels was 44,000. This variation in intensity and count of lit pixels is important as it clearly shows that while the number of lit pixels near the Indus and its tributaries is enhanced relative to the basin as a whole, the intensity of lit pixels is greatest in zone 10-20 km away from the river. We hypothesize, based on this observation, that the relation between intensity and night light presence may be an important parameter to understanding settlement density in proximity to rivers and we return to this idea in the discussion.
5.4. Channel Pattern Influence on Human Presence
To evaluate the hypothesis that human presence as indicated by night light data is also influenced by the planform river channel pattern, we used a conceptual framework to illustrate and focus on the planform of the trunk channel-Indus River in the basin. To do this we calculate enhancement factors for each buffer zone comparing across single-thread and multi-thread channels of the Indus River (Figure 11). We investigate the relationship between the occurrence of lit pixels, distance to the river, and the channel pattern type by calculating the geographical area for each channel pattern (Figure 11A & Figure 11D) and the area of lit pixels in each buffer zone (Figure 11B & Figure 11E).
For the multi-thread channel zones, the geographical area mapped was ~ 24,400 km2 (Figure 11A). The area of the lit pixels in the multi-thread channel across the four buffer zones are ca. 5,100 km2, 5,600 km2, 5,500 km2, and 5,100 km2 for the 0-5 km, 5-10 km, 10-15 km, and 15-20 km buffer zones respectively (Figure 11B). The lit pixels area is higher across the 5-10 km river network buffer, signifying a larger number of lit pixels. When the spatial occurrence of night lights in each class is normalized independently of the geographical area (Figure 11C), we find an enhancement of lit pixels by 7% in the 5-10 km zone for the multi-thread channels. Whereas, for the 0-5 km buffer zone, the lit pixel occurrence is reduced by 8% relative to the multi-thread river channel area. However, at a distance of more than 10 km from the river, lit pixels are within 5% of what we observe across the basin.
For single-thread channels, the total area of the buffer zones is ca. 81,400 km2 (Figure 11D). The area of lit pixels across the single-thread channel buffer zones are 10,000 km2, 7,800 km2, 6800 km2, and 6700 km2 for the 0-5 km, 5-10 km, 10-15 km, and 15-20 km zones. To understand the occurrence of lit pixels independent of the geographical area, an enhancement factor of 1.18 was computed for the 0-5 km zone (Figure 11F), representing an 18% enhancement of lit pixels near the single-thread channel of the Indus River. For 5-10 km the lit pixels occurrence is the same as that of the total area of the single-thread channel. Whereas, for distances more than 10 km from the river the enhancement factor, Ef is 0.9, signifying a decrease of 10% of the lit pixel presence relative to the basin as a whole.
The variation in night lights distribution across the buffer zones of multi-thread and single-thread channels are interpreted to be representative of the preferential human presence in these two different geomorphic settings. We hypothesize that this is related to the differing channel dynamics and mobility of braided versus single-thread channels and we return to this below in the discussion. Thus, our analysis indicates that the combination of channel type and proximity to the river plays an important factor in determining the human presence in alluvial basins.
6. Discussion
6.1. What Do Night Lights Reveal about Human Presence and Activity in the Indus Basin?
In this study, we investigated the application of DMSP night lights data from 2000-2013 across the Indus Basin to characterise human presence and activity as a function of proximity to rivers and the geomorphic style of the river.
We demonstrated that the night lights serve as a useful proxy for human presence and activity in the Indus Basin. The DMSP-night light distribution shows a moderate correlation (R= 0.655) with the population derived from the LandScan Global population dataset. The possible reason for moderate correlation could be inconsistencies in the different satellites capturing the night lights data, sensor degradation, and sensor settings for the period 2000 to 2013 [24]. Also, unlike other measures of obtaining population data, night lights reflect signatures from a broad range of zones of human activities - such as cities, towns, industrial setups, streets, residential areas, etc. [29]. From our analysis, we find that around 92% of the distribution of the night lights across the Indus Basin is concentrated within the plains of the basin with an elevation of less than or equal to 800 meters. This demonstrates preferential settlement within the plains regions. The availability of census data in developing nations can be a limitation in estimating population. However, recent advancements in night lights have enabled spatial correlation with population density in developing nations even with limited census data [34]. Thus, our approach at the basin scale enables us to understand how hydrological and geomorphic processes can reflect human settlement patterns within a specific river catchment and how these can be quantified using night light data.
6.2. What Is the Relation between Geomorphological Parameters and Night Lights Distribution?
To explain how geomorphology plays a driving role in the distribution of night lights signifying human activities, we analysed the normalized night light distribution within each buffer of the basin and the channel-patterns as well. Based on our first hypothesis that preferential human presence occurs in proximity to rivers, we show that night light luminosity is enhanced by 26% within the 0 to 5 km buffer zone adjacent to a river and by 11% in the 5 to 10 km buffer zone. This finding suggests that human presence and activity are concentrated in proximity to major rivers in the basin. This signature of enhanced human presence and activity is not detectable in the night lights luminosity data set beyond 15 km of distance from the centreline of the major rivers studied. Our findings are consistent with previous independent findings from literature from other parts of the world which have inferred that people prefer settlement locations closer to the rivers [3,16,35]. Studies by Masrur et al. and Ceola et al. studied human presence and activity in near proximity to the river network consisting of all order streams. The stream network for their analyses was extracted from the HydroSHED data, which incorporates streams of all orders [2,17]. However, as a fact lower order streams do not practically cause floods [15]. Thus, our study aimed to assess human presence near the vicinity of higher-order streams of the major rivers in the basin, which are likely to cause large-scale flooding.
However, when we study the relation between intensity and the number of lit pixels, we observe greater pixel intensities and concomitant reduction in the percentage of lit pixels within the 15-20 km buffer zone compared to the 0-5 km buffer zone. We interpret this to indicate that denser settlements (with higher intensity luminosity), such as towns and cities are preferentially located away from the Indus River and its tributaries in the basin. Historically, it may be the case that large settlements like towns and cities developed away from close proximity to rivers where they were less susceptible to river flooding. A similar independent study in China by Cao et al. provides further evidence of high population density away from the river in the basins having relatively large plains area percentage [35]. Similarly, Fang and Jawitz found that people living in regions constituting plains in the US preferred to live away from the rivers [36]. This implies that the presence of the river is a driver of the density of lit pixels and the spatial distribution of the lit pixels in our night light data set signifying varying human activities and presence. Thus, such an approach could help in the estimation of flood exposure near the river at a regional scale in contrast to the global approaches suggested by Fang et al., Ceola et al., and Kummu et al. which does not account for geomorphic variation in rivers within the basin [2,3,16].
To further demonstrate the relation between human activity and the channel patterns of the Indus River, we tested our second hypothesis which posits that human presence is enhanced in proximity to single-thread sinuous river channels compared to multi-thread channels of the Indus River. Multi-thread or braiding rivers are the most dynamic or rapidly changing river patterns due to their continuously shifting channels compared to single-thread channels having stable banks. Since rivers such as the Indus do not have a single planform type, we tried to correlate the distribution of human presence as derived from night lights data with different channel patterns. We analysed the night lights distribution in the Indus River's single-thread and multi-thread channels buffer zone. Due to the difference in the geomorphic setting of the channel pattern, the enhancement factor (Ef) varies within different buffer zones. Thus, in support of our null hypothesis, we observe an 18% enhancement of lit pixels signifying human presence and activity within the 0-5 km of the single-thread channel compared to multi-thread channels. We interpret this as representing small urban centers or towns located near single-thread reaches of the channel. This is possibly due to the relative stability of the channel banks as stable channels (single-thread channels) tend to migrate in an organized manner on their floodplains having a single set of bars on alternate sides, whereas the unstable channels (multi-thread channels) are in continuous movement and migrating across their floodplains [37]. Thus, mobile braided or multi-thread river channels are laterally shifting, making them less suitable for riverside human settlements compared to single-thread channels which are less mobile and are more suitable for human settlements [38].
However, within the 5-15 km buffer of the Indus River, multi-thread channel tends to have higher enhancement compared to single-thread channels. The repeated inundation in the case of multi-thread mobile channels tends to make the plains cultivable but the valley-margins building sites or terraces having river incision might be preferred sites for settlements [38]. Beyond 15 km, the distributions of lit pixels are similar to the whole basin. Thus, an important finding emerging from this study is the importance of channel type and proximity to the river in determining the human presence in an area as well as night lights as a tool to study this relationship.
6.3. Implications
The interplay between human presence, channel patterns, and distance to rivers can improve how we try to assess flood risk and vulnerability in a given region. While Earth scientists possess an increasingly comprehensive knowledge of river geomorphology and dynamics, our understanding of how geomorphological features influence human settlement patterns adjacent to river systems remains incomplete. In an endeavour to bridge this knowledge gap, our study aimed to elucidate the role of channel pattern type and proximity to rivers in determining where humans are present in a landscape.
This study presents a novel approach in the assessment of human presence near rivers by utilizing night lights data, building on previous studies that were either constrained by political boundaries or global-scale analyses that lacked specific regional detail [2,16]. The study shows the usefulness of the remotely sensed night lights dataset in providing a proxy for human presence near the rivers. Moreover, the study considered major rivers or higher-order streams of the basin for human presence in proximity to the rivers. Nevertheless, there are a few limitations that need to be considered. The data-driven methodology employed in this study incorporates data spanning the period from 2000 to 2013, primarily due to the availability of the Landscan Population and DMSP NLS datasets. Also, the temporal frequency of the DMSP NLS data is yearly, compared to the recent version of the night lights products like VIIRS and the Black Marble product suite which are available daily or monthly. The data used in this study provides a coarser resolution compared to recent versions of night light data, which might not be suitable for understanding human presence at a micro or lower administrative level.
Though this study is based on the Indus Basin, it provides a framework that can be used to identify the different socio-economic classes of people exposed to flood risk within the floodplains of the river. The occurrence of extreme flood events can lead to loss of life and infrastructure. As floodplains of the basin are prone to frequent flooding, this approach of studying human presence using earth observation data, specifically night lights, can be used to identify spatial vulnerability as well as social vulnerability to floods. For instance, floods often cause interruptions in electricity, thus affecting the distribution of lights during the disaster period [39]. Recent data with daily temporal frequency like the VIIRS/DNB sensor or the NASA Black-marble product can be used to evaluate the effect of floods in real-time [40].
This remote sensing study has implications for policymakers involved in assessing flood vulnerability and risk to human society at the basin scale, enabling the implementation of effective mitigation measures in high-risk areas. Such information in the long run can help planners to develop land-use plans and building codes that take into account differential channel patterns and distance from the river for flooding, reducing vulnerability to people and infrastructure, and ensuring developments that are less susceptible to flooding. By examining the influence of varying channel patterns on anthropogenic activities and settlements, this research sheds light on the complex interactions between natural river processes and human presence, enabling more informed flood management strategies.
7. Conclusions
To date, most research using night light data in the context of human presence near rivers has been on a global scale. Compared to prior studies, the novelty of our contribution lies in the detailed relationship between river patterns, proximity to the rivers, and human presence/activities using the Indus Basin as a detailed case study. We used remotely sensed DMSP-derived night lights to quantify statistically the enhancement of lit pixels which are a proxy for human presence and human activities with river systems offering a unique perspective of the influence of channel patterns and proximity to the river on humans. We establish that anthropogenic presence is enhanced by ca. 26% from the night lights data within a 0 to 5 km proximity range of the Indus River and its tributaries, relative to the basin as a whole. Also, away from the river, the mean intensity is higher and the number of lit pixels is lower compared to areas in close proximity to the river centreline. These data are interpreted to signify denser settlements, like towns and cities which are preferentially located away from the Indus and its tributaries due to lower susceptibility to flooding. Moreover, our study established enhanced human presence near single-thread channels of the Indus River of around 18%, compared to multi-thread channels likely because of stable channel banks and less channel mobility associated with single-thread channels. The seasonal inundation within the close reaches of multi-threaded channels makes it less preferred sites for settlements but valley margins or terraces further away from the river channels are preferred sites for settlements. Thus, we observe that enhancement beyond 5 km was greater for multi-thread channels. Our study provides new insight into understanding the dynamics of geomorphology in natural hazards using night lights as a proxy for human presence. As future work, it would be important to explore their role in evaluating flood risk spatially and in understanding the differential social vulnerability at a regional scale. We propose that this might provide a unique perspective of landscape dynamics for identifying flood-prone areas and vulnerable communities to devise mitigation measures.
Author Contributions
Ekta Aggarwal: Conceptualization, Formal analysis, Investigation, Methodology, Software, Visualization, Writing – original draft. Alexander C. Whittaker: Conceptualization, Methodology, Supervision, Writing – review & editing. Sanjeev Gupta: Conceptualization, Supervision, Writing – review & editing
Funding
This project has received funding from the European Union's Horizon 2020 research and innovation program under the Marie Sklodowska-Curie grant agreement No 860383.
Acknowledgments
We thank Earth Observation Group, Payne Institute for Public Policy, Colorado School of Mines for the Image and data processing of the DMSP data. The DMSP data was collected by the US Air Force Weather Agency. This study was made utilizing the LandScan (2000-2013)™ High Resolution Global Population Data Set copyrighted by UT-Battelle, LLC, operator of Oak Ridge National Laboratory under Contract No. DE-AC05-00OR22725 with the United States Department of Energy. The United States Government has certain rights in this Data Set. NEITHER UT-BATTELLE, LLC NOR THE UNITED STATES DEPARTMENT OF ENERGY, NOR ANY OF THEIR EMPLOYEES, MAKES ANY WARRANTY, EXPRESS OR IMPLIED, OR ASSUMES ANY LEGAL LIABILITY OR RESPONSIBILITY FOR THE ACCURACY, COMPLETENESS, OR USEFULNESS OF THE DATA SET.
Conflicts of Interest
The authors declare that they have no known competing financial interests or personal relationships that could have appeared to influence the work reported in this paper.
References
- Giosan, L.; Clift, P.D.; Macklin, M.G.; Fuller, D.Q.; Constantinescu, S.; Durcan, J.A.; Stevens, T.; Duller, G.A.; Tabrez, A.R.; Gangal, K.; Adhikari, R. Fluvial landscapes of the Harappan civilization. Proceedings of the National Academy of Sciences 2012, 109(26), E1688–E1694. [Google Scholar] [CrossRef] [PubMed]
- Ceola, S.; Laio, F.; Montanari, A. Human-impacted waters: New perspectives from global high-resolution monitoring. Water Resources Research 2015, 51(9), 7064–7079. [Google Scholar] [CrossRef]
- Kummu, M.; De Moel, H.; Ward, P.J.; Varis, O. How close do we live to water? A global analysis of population distance to freshwater bodies. PloS one 2011, 6(6), 20578. [Google Scholar] [CrossRef] [PubMed]
- UN. World Population Prospects: The 2015 Revision, Key Findings and Advance Tables 2015.
- Xu, H. Extraction of urban built-up land features from Landsat imagery using a thematic-oriented index combination technique. Photogrammetric Engineering & Remote Sensing, 2007, 73(12), 1381-1391. [CrossRef]
- NOAA - Earth Observation Group, 2013. Version 4 DMSP-OLS Nighttime Lights Time Series. NOAA's National Geophysical Data Center. Retrieved annual 2000-2013 from https://ngdc.noaa.gov/eog/dmsp/downloadV4composites.html.
- Bennie, J.; Davies, T.W.; Duffy, J.P.; Inger, R.; Gaston, K.J. Contrasting trends in light pollution across Europe based on satellite-observed night time lights. Scientific Reports, 2014, 4(1), p.3789. [CrossRef]
- Chand, T.K.; Badarinath, K.V.S.; Elvidge, C.D.; Tuttle, B.T. Spatial characterization of electrical power consumption patterns over India using temporal DMSP-OLS night-time satellite data. International Journal of Remote Sensing, 2009, 30(3), 647–661. [CrossRef]
- Chen, X.; Nordhaus, W.D. Using luminosity data as a proxy for economic statistics. Proceedings of the National Academy of Sciences, 2011, 108(21), 8589–8594. [CrossRef]
- Elvidge, C.D.; Baugh, K.E.; Kihn, E.A.; Kroehl, H.W.; Davis, E.R. Mapping City Lights With Nighttime Data from the DMSP Operational Linescan System. Photogrammetric Engineering and Remote Sensing, 1997, 63(6), 727–734.
- Elvidge, C.D.; Sutton, P.C.; Ghosh, T.; Tuttle, B.T.; Baugh, K.E.; Bhaduri, B.; Bright, E. A global poverty map derived from satellite data. Computers & Geosciences, 2009, 35(8), 1652–1660. [CrossRef]
- Small, C. Global population distribution and urban land use in geophysical parameter space. Earth Interactions, 2004, 8(8), 1-18. [CrossRef]
- Ceola, S.; Laio, F.; Montanari, A. Satellite nighttime lights reveal increasing human exposure to floods worldwide. Geophysical Research Letters, 2014, 41(20), 7184–7190. [CrossRef]
- Gómez, A.; di Baldassarre, G.; Rodhe, A.; & Pohjola, V. Remotely Sensed Night Lights to Map Societal Exposure to Hydrometeorological Hazards. Remote Sensing, 2015, 7(9), 12380–12399. [CrossRef]
- Mård, J.; Di Baldassarre, G.; Mazzoleni, M.; Nighttime light data reveal how flood protection shapes human proximity to rivers. Science Advances, 2018, 4(8), p.eaar5779. [CrossRef]
- Fang, Y.; Ceola, S.; Paik, K.; McGrath, G.; Rao, P. S. C.; Montanari, A.; Jawitz, J. W. Globally Universal Fractal Pattern of Human Settlements in River Networks. Earth’s Future, 2018, 6(8), 1134–1145. [CrossRef]
- Masrur, A.; Dewan, A.; Botje, D.; Kiselev, G.; Murshed, Md. M. Dynamics of human presence and flood-exposure risk in close proximity to Bangladesh’s river network: an evaluation with multitemporal satellite imagery. Geocarto International, 2022, 1–19. [CrossRef]
- Schumm, S. A. Evolution and response of the fluvial system, sedimentologic implementation. In Recent and Ancient Nonmarine Depositional Environments. SEPM (Society for Sedimentary Geology), 1981, (pp. 19–29). [CrossRef]
- Food and Agriculture Organization of the United Nations, 2011. AQUASTAT Transboundary River Basin Overview-Indus. www.fao.org/ (accessed November 2022).
- Sharma, A.; Kumar, K.; Laskar, A.; Singh, S. K.; Mehta, P. Oxygen, deuterium, and strontium isotope characteristics of the Indus River water system. Geomorphology, 2017, 284, 5–16. [Google Scholar] [CrossRef]
- Karim, A.; Veizer, J. Weathering processes in the Indus River Basin: implications from riverine carbon, sulfur, oxygen, and strontium isotopes. Chemical Geology, 2000, 170(1–4), 153–177. [CrossRef]
- Kumar, G.; Sinha, R.; Panda, P.K. The Indus flood of 2010 in Pakistan: a prospective analysis using remote sensing data. Nat Hazards, 2011, 59, 1815–1826. [Google Scholar] [CrossRef]
- Adeel, Z.; Wirsing, R.G. Imagining Industan. Water Security in a New World. Springer, Cham, 2000. [CrossRef]
- Levin, N.; Kyba, C.C.M.; Zhang, Q.; Sánchez de Miguel, A.; Román, M.O.; Li, X.; Portnov, B.A.; Molthan, A.L.; Jechow, A.; Miller, S.D.; Wang, Z.; Shrestha, R.M.; & Elvidge, C.D. Remote sensing of night lights: A review and an outlook for the future. Remote Sensing of Environment, 2020, 237. [CrossRef]
- Imhoff, M. Using nighttime DMSP/OLS images of city lights to estimate the impact of urban land use on soil resources in the United States. Remote Sensing of Environment, 1997, 59(1), 105–117. [CrossRef]
- Elvidge, C.D.; Baugh, K.E.; Dietz, J.B.; Bland, T.; Sutton, P.C.; Kroehl, H.W. Radiance Calibration of DMSP-OLS Low-Light Imaging Data of Human Settlements. Remote Sensing of Environment, 1999, 68(1), 77–88. [CrossRef]
- Huang, Q.; Yang, X.; Gao, B.; Yang, Y.; Zhao, Y. Application of DMSP/OLS nighttime light images: A meta-analysis and a systematic literature review. Remote Sensing, 2014, 6(8), pp.6844-6866. [CrossRef]
- Li, X. and Zhou, Y. A stepwise calibration of global DMSP/OLS stable nighttime light data (1992–2013). Remote Sensing, 2017, 9(6), p.637. [CrossRef]
- Zhao, M.; Zhou, Y.; Li, X.; Cao, W.; He, C.; Yu, B.; Li, X.; Elvidge, C.D.; Cheng, W.; Zhou, C. Applications of satellite remote sensing of nighttime light observations: Advances, challenges, and perspectives. Remote Sensing, 2019, 11(17), p.1971. [CrossRef]
- Stathakis, D.; Tselios, V.; & Faraslis, I. Urbanization in European regions based on night lights. Remote Sensing Applications: Society and Environment, 2015, 2, 26–34. [CrossRef]
- Yin, X.; Li, P.; Feng, Z.; Yang, Y.; You, Z.; Xiao, C. Which gridded population data product is better? Evidences from mainland Southeast Asia (MSEA). ISPRS International Journal of Geo-Information, 2021, 10(10). [CrossRef]
- Dobson, J.E.; Bright, E.A.; Coleman, P.R.; Durfee, R.C.; Worley, B.A. LandScan: a global population database for estimating populations at risk. Photogrammetric engineering and remote sensing, 2000, 66(7), pp.849-857.
- Zhou, X.; Wang, H. Application of Google Earth in modern river sedimentology research. Journal of Geoscience and Environment Protection, 2015, 3(08), p.1. [CrossRef]
- Kabanda, T. H. Using land cover, population, and night light data to assess urban expansion in Kimberley, South Africa. South African Geographical Journal, 2022, 104(4), 539–552. [CrossRef]
- Cao, W.; Liu, J.; Ceola, S.; Mao, G.; Macklin, M.G.; Montanari, A.; Ciais, P.; Yao, Y.; Tarolli, P. Landform-driven human reliance on rivers in imperial China. Journal of Hydrology, 2023, 620, p.129353. [CrossRef]
- Fang, Y.; Jawitz, J.W. The evolution of human population distance to water in the USA from 1790 to 2010. Nature communications, 2019, 10(1), p.430. [CrossRef]
- Eaton, B.C.; Millar, R.G.; & Davidson, S. Channel patterns: Braided, anabranching, and single-thread. Geomorphology, 2010, 120(3–4), 353–364. [CrossRef]
- Macklin, M.G.; Lewin, J. The rivers of civilization. Quaternary Science Reviews, 2015, 114, pp.228-244. [CrossRef]
- Levin, N. Using Night Lights from Space to Assess Areas Impacted by the 2023 Turkey Earthquake. Remote Sensing, 2023, 15(8), p.2120. [CrossRef]
- Zhao, X.; Yu, B.; Liu, Y.; Yao, S.; Lian, T.; Chen, L.; Yang, C.; Chen, Z.; Wu, J. NPP-VIIRS DNB daily data in natural disaster assessment: Evidence from selected case studies. Remote Sensing, 2018, 10(10), p.1526. [CrossRef]
Figure 1.
ESRI world imagery showing the Indus basin, Indus River (dark blue), and its major tributaries (blue). The red dots are the major cities/urban centers in the study area. The Indus River and its major tributaries- Satluj, Chenab, Ravi, Beas, Jhelum, Soham, Shyok, Kabul, Kurram, Tochi, Gumal, Kundar, Zhob, are represented in the figure. The inset in the top-right of the figure shows the location of the study area within Asia.
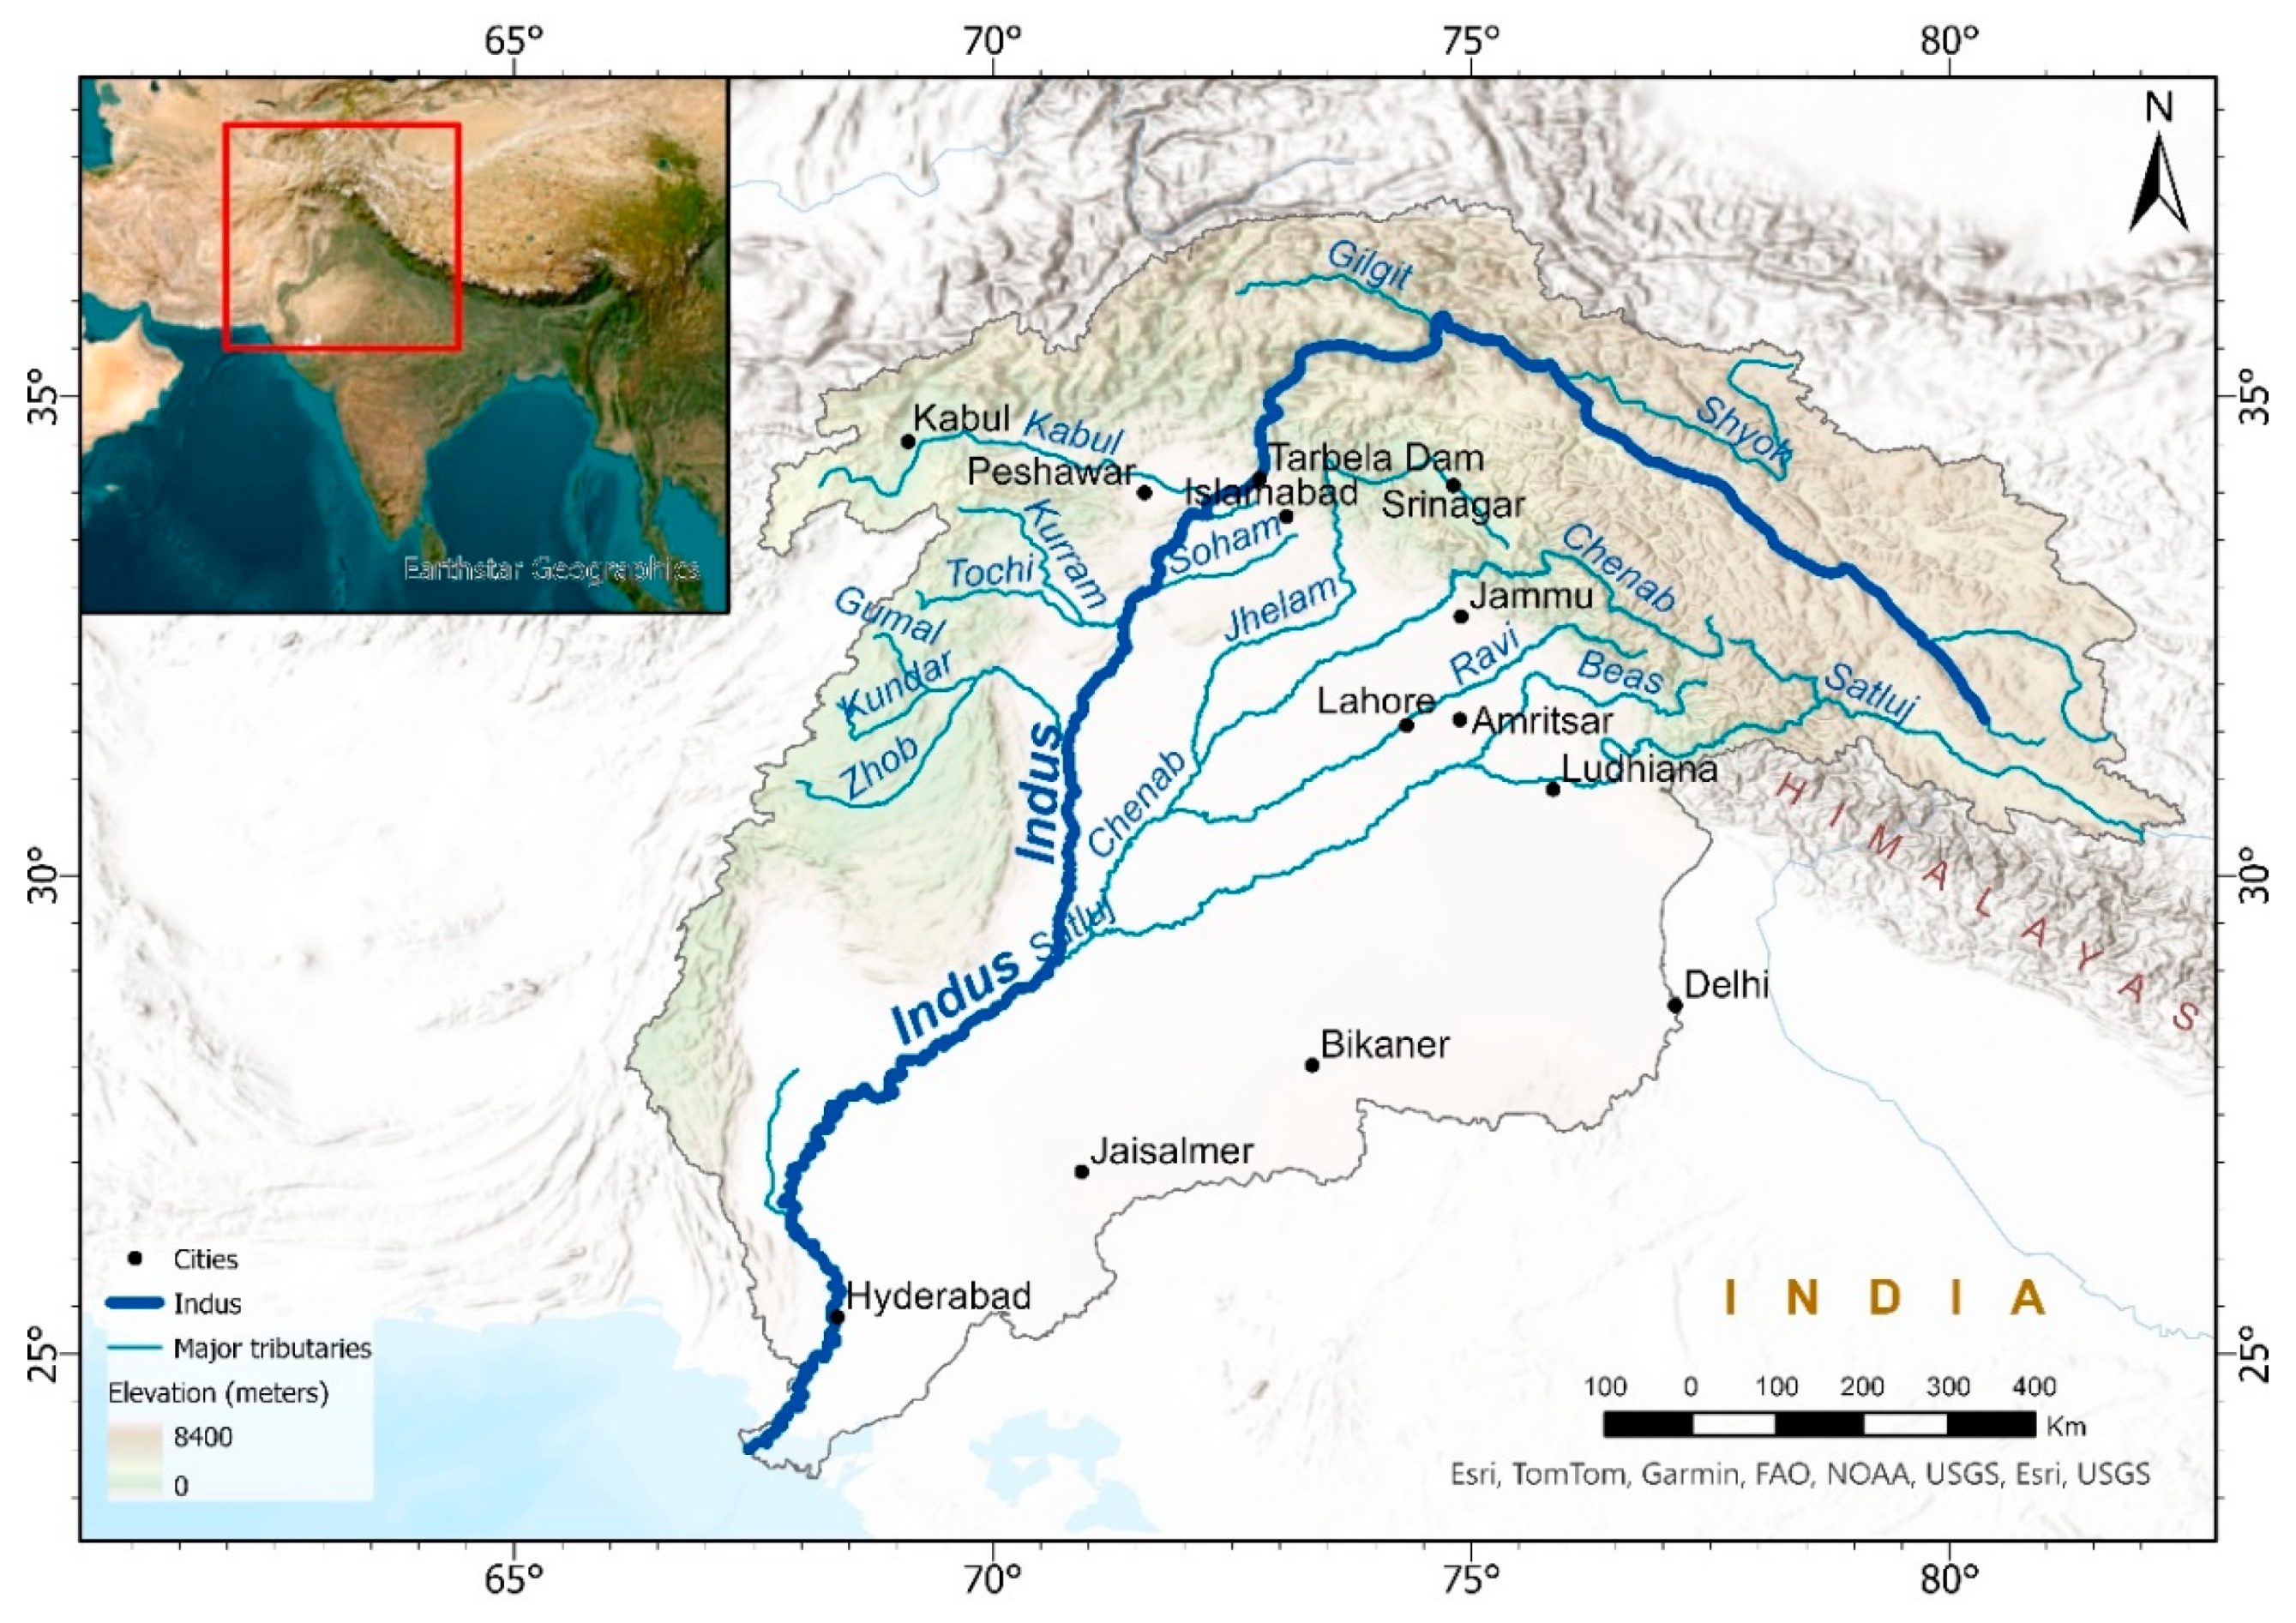
Figure 2.
Distribution of the DMSP-night lights across the Indian subcontinent in the year 2013. White areas correspond to high-intensity areas, while black areas correspond to the absence of night lights (Image and data processing by NOAA's National Geophysical Data Center. DMSP data collected by US Air Force Weather Agency).
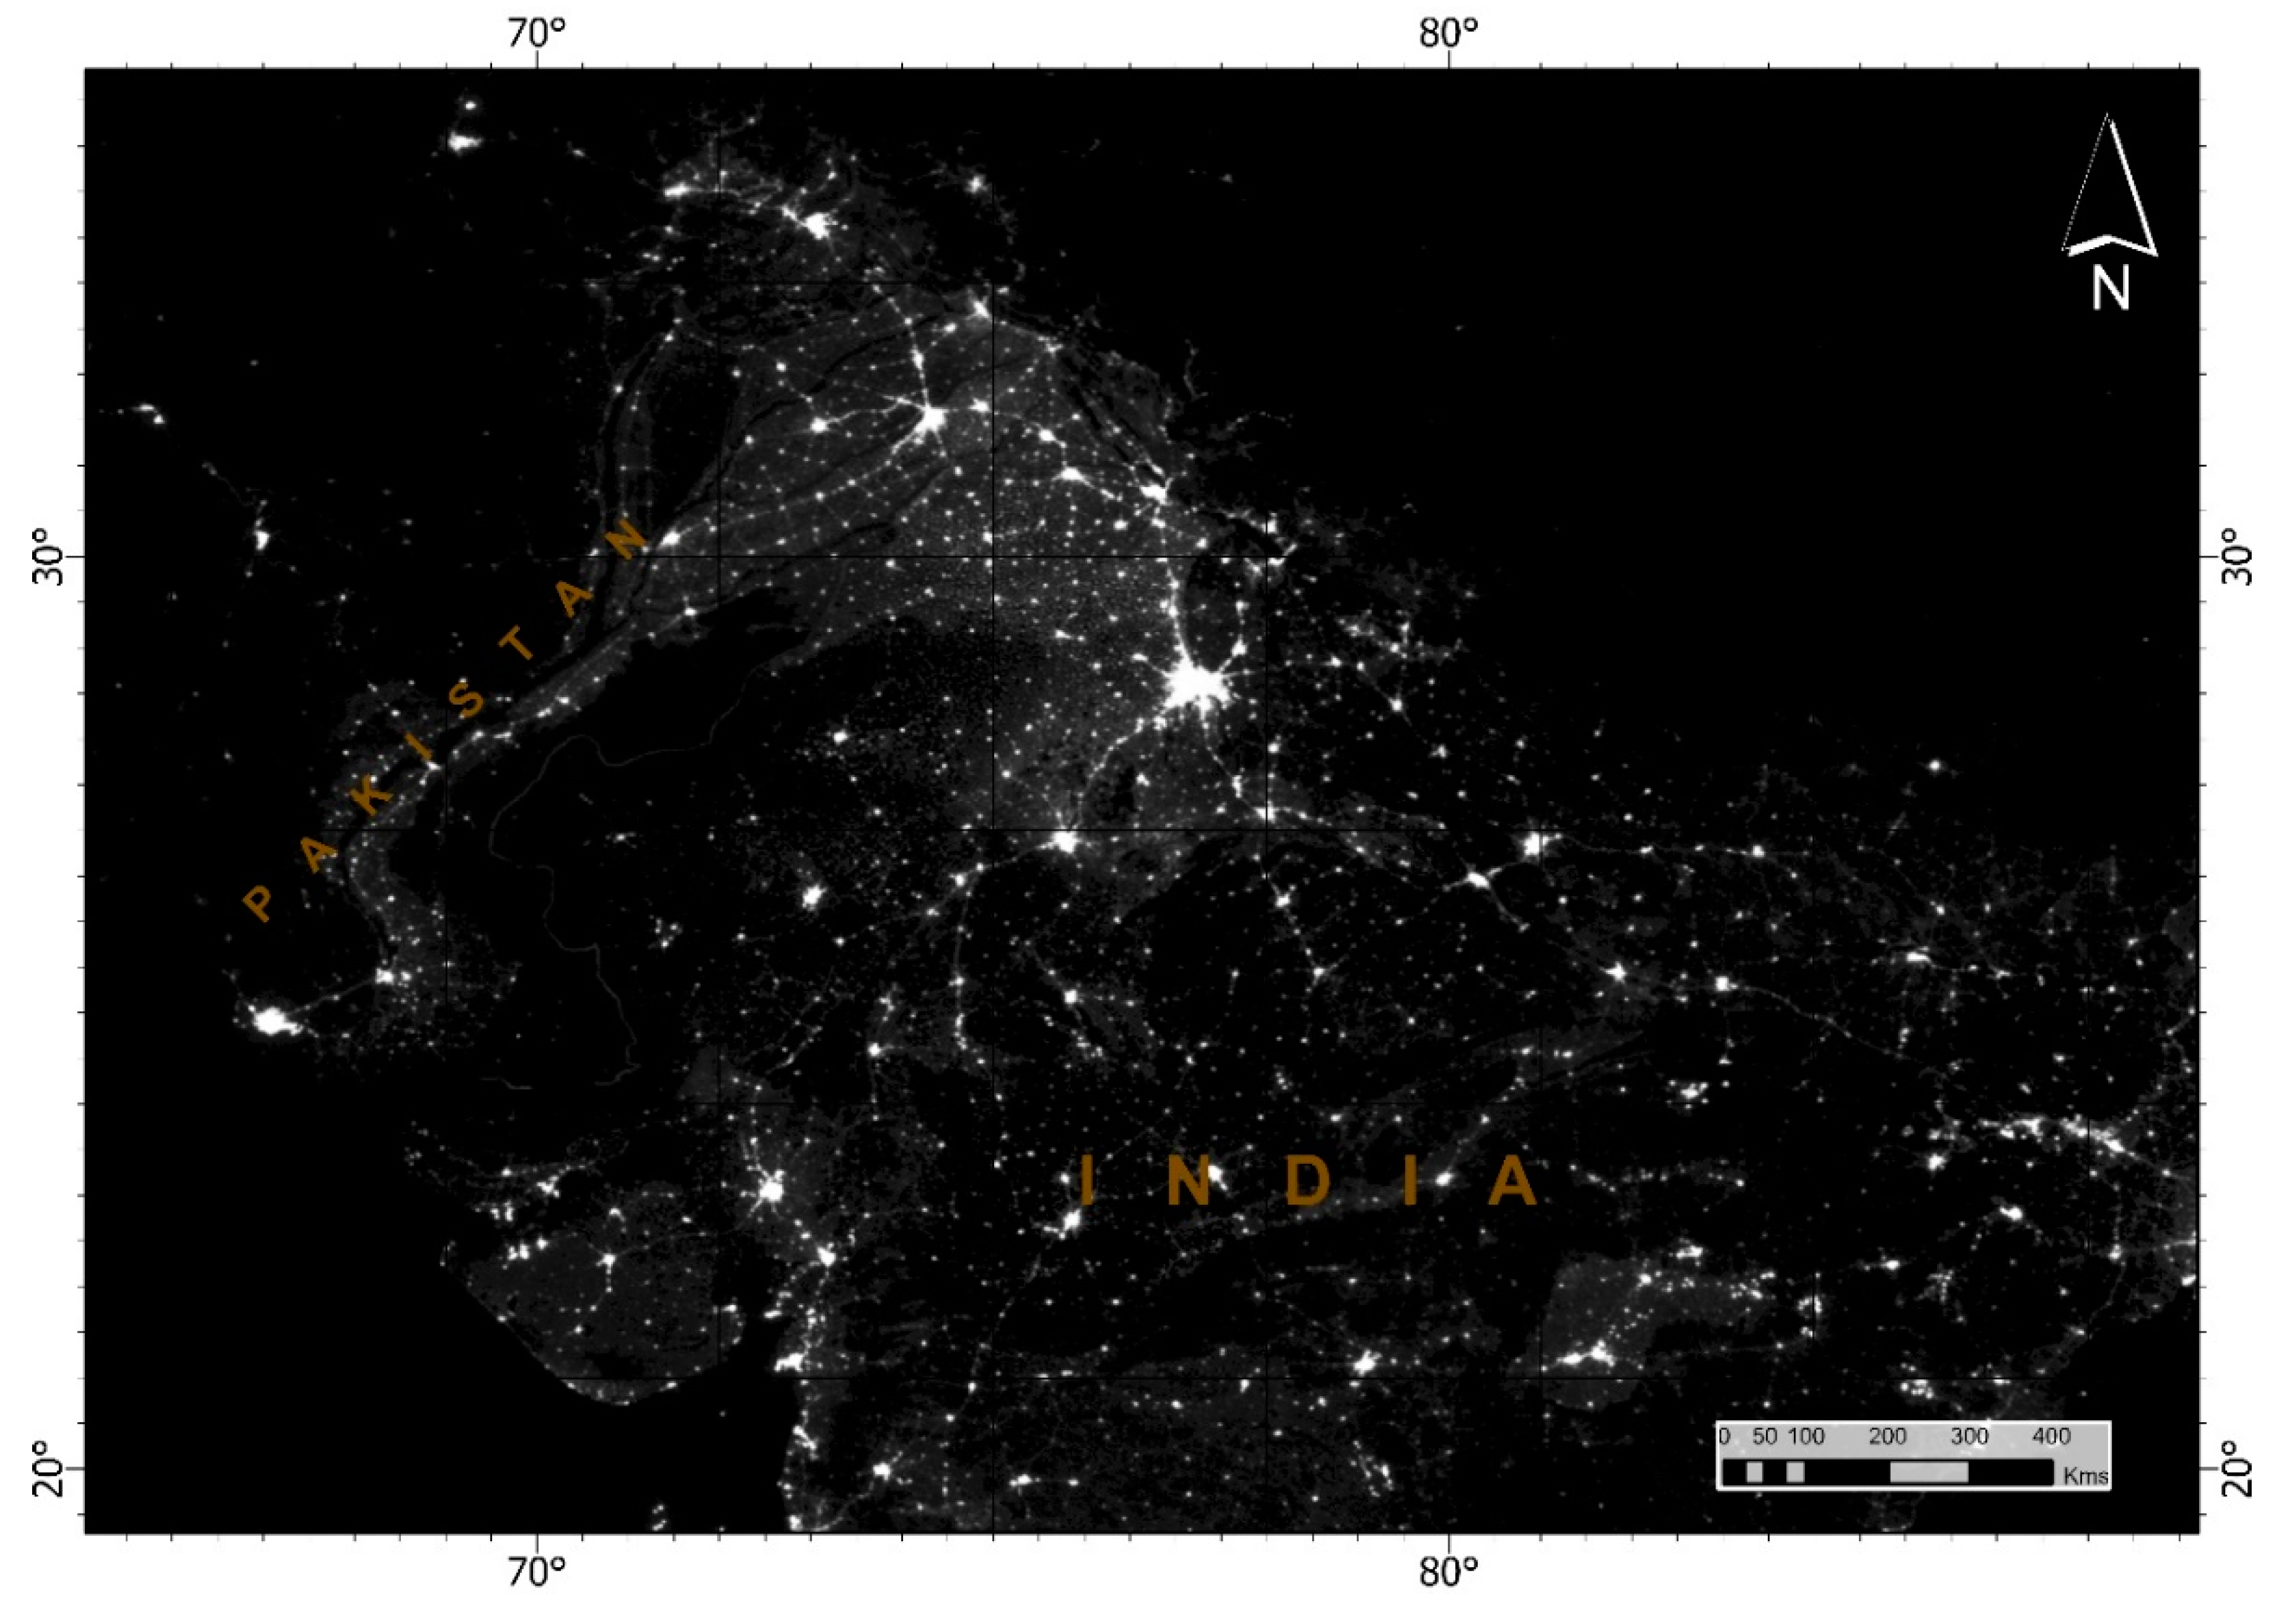
Figure 3.
Distribution of DMSP-night lights data over the Indus basin for the year (A) 2000, (B) 2007, and (C) 2013 over the same color scale. The lighter yellow pixels represent higher-intensity areas, usually towns, cities, or urban centers, and the dark pixels represent the absence or lower-intensity night light areas. Legend numbers denote the number range of the intensity of the pixels represented by Digital Number (DN).
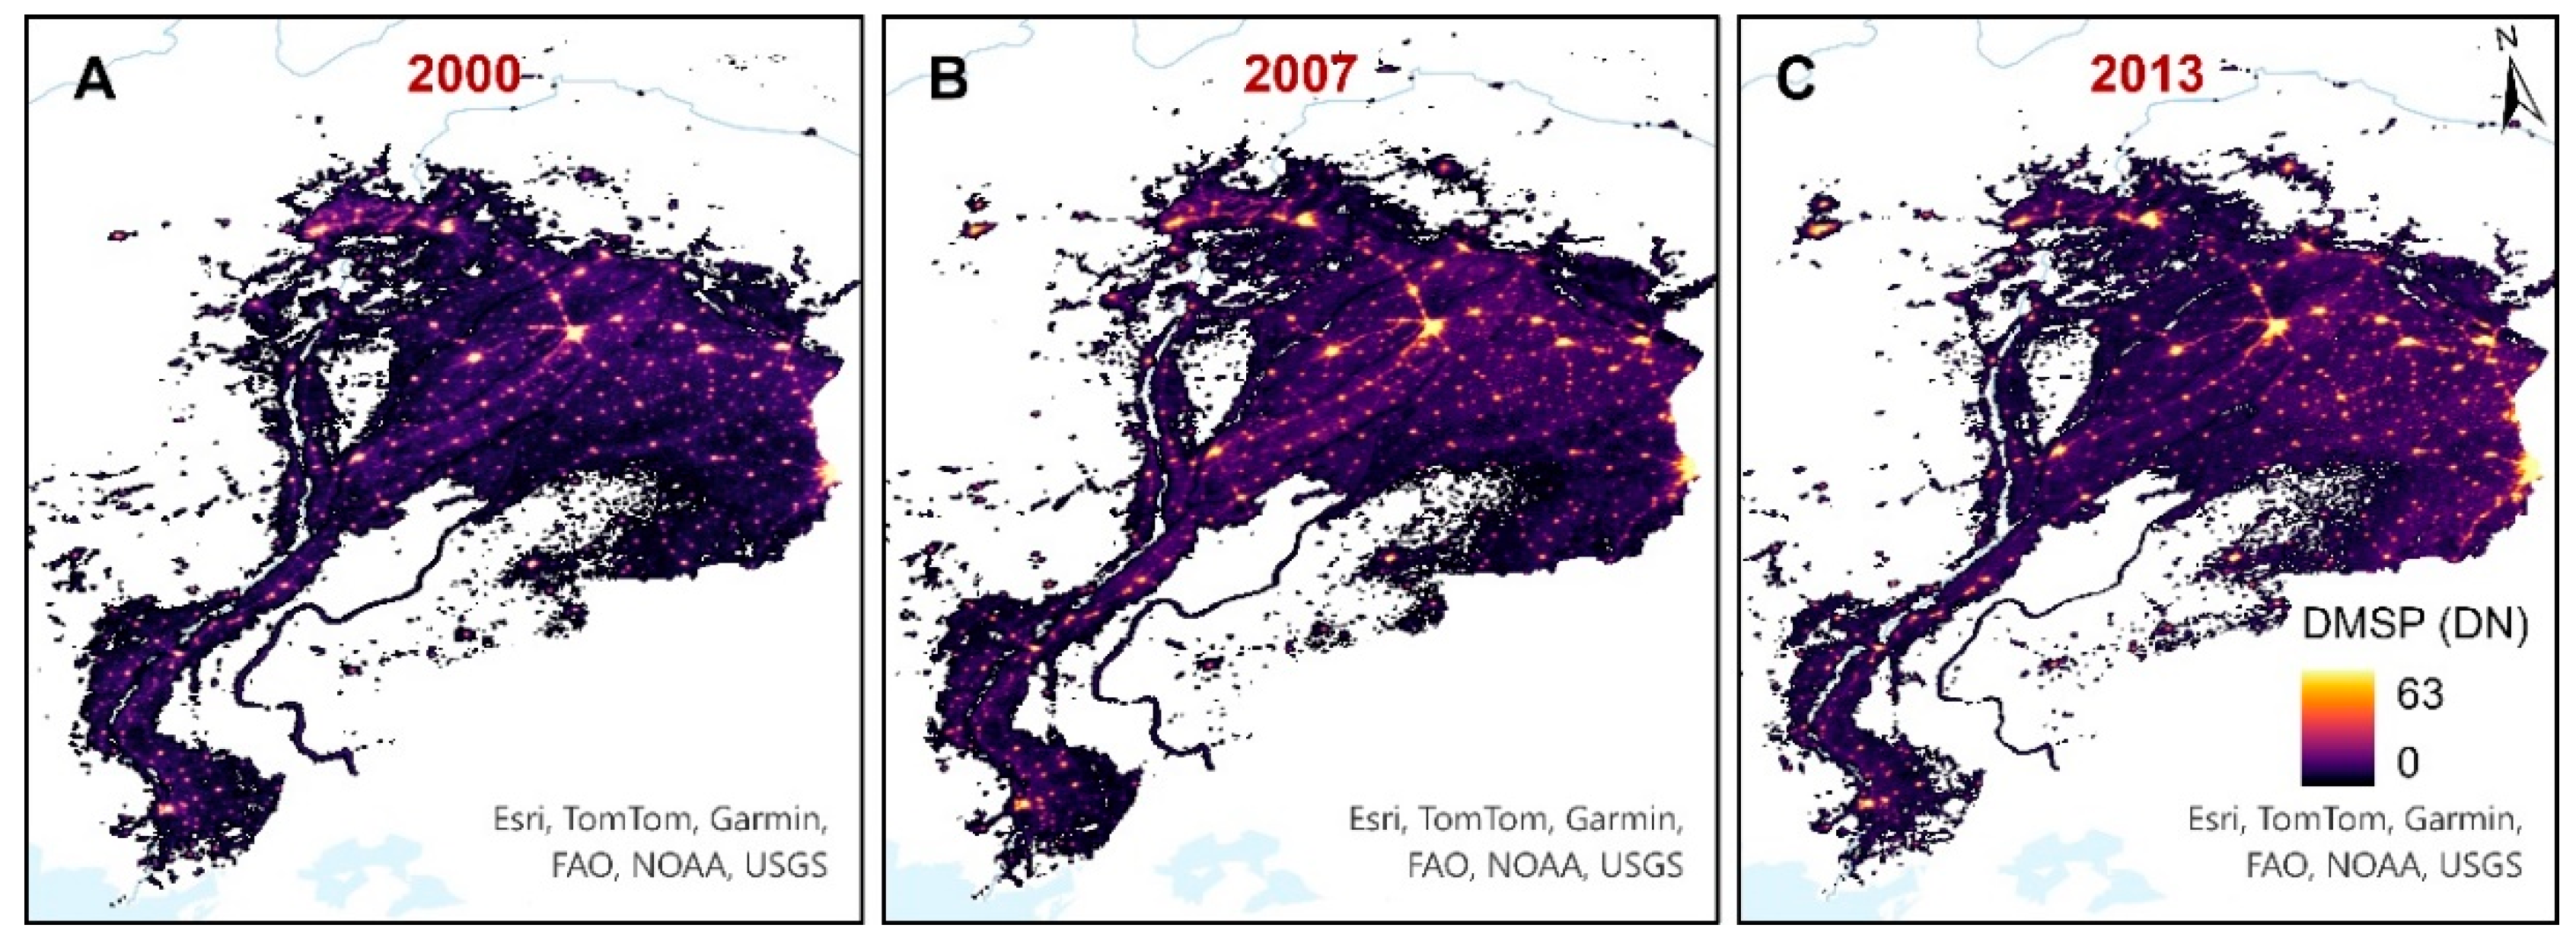
Figure 4.
Average distribution of the DMSP night lights from 2000-2013 in the Indus Basin (black boundary). The darker red pixels represent higher-intensity areas and the lighter color pixels represent absence or lower-intensity night light areas. The black dots are the major cities/urban centers in the area. The Indus River and its major tributaries- Satluj, Chenab, Ravi, Beas, Jhelum, Soham, Shyok, Kabul, Kurram, Tochi, Gumal, Kundar, Zhob, are represented in the figure. .
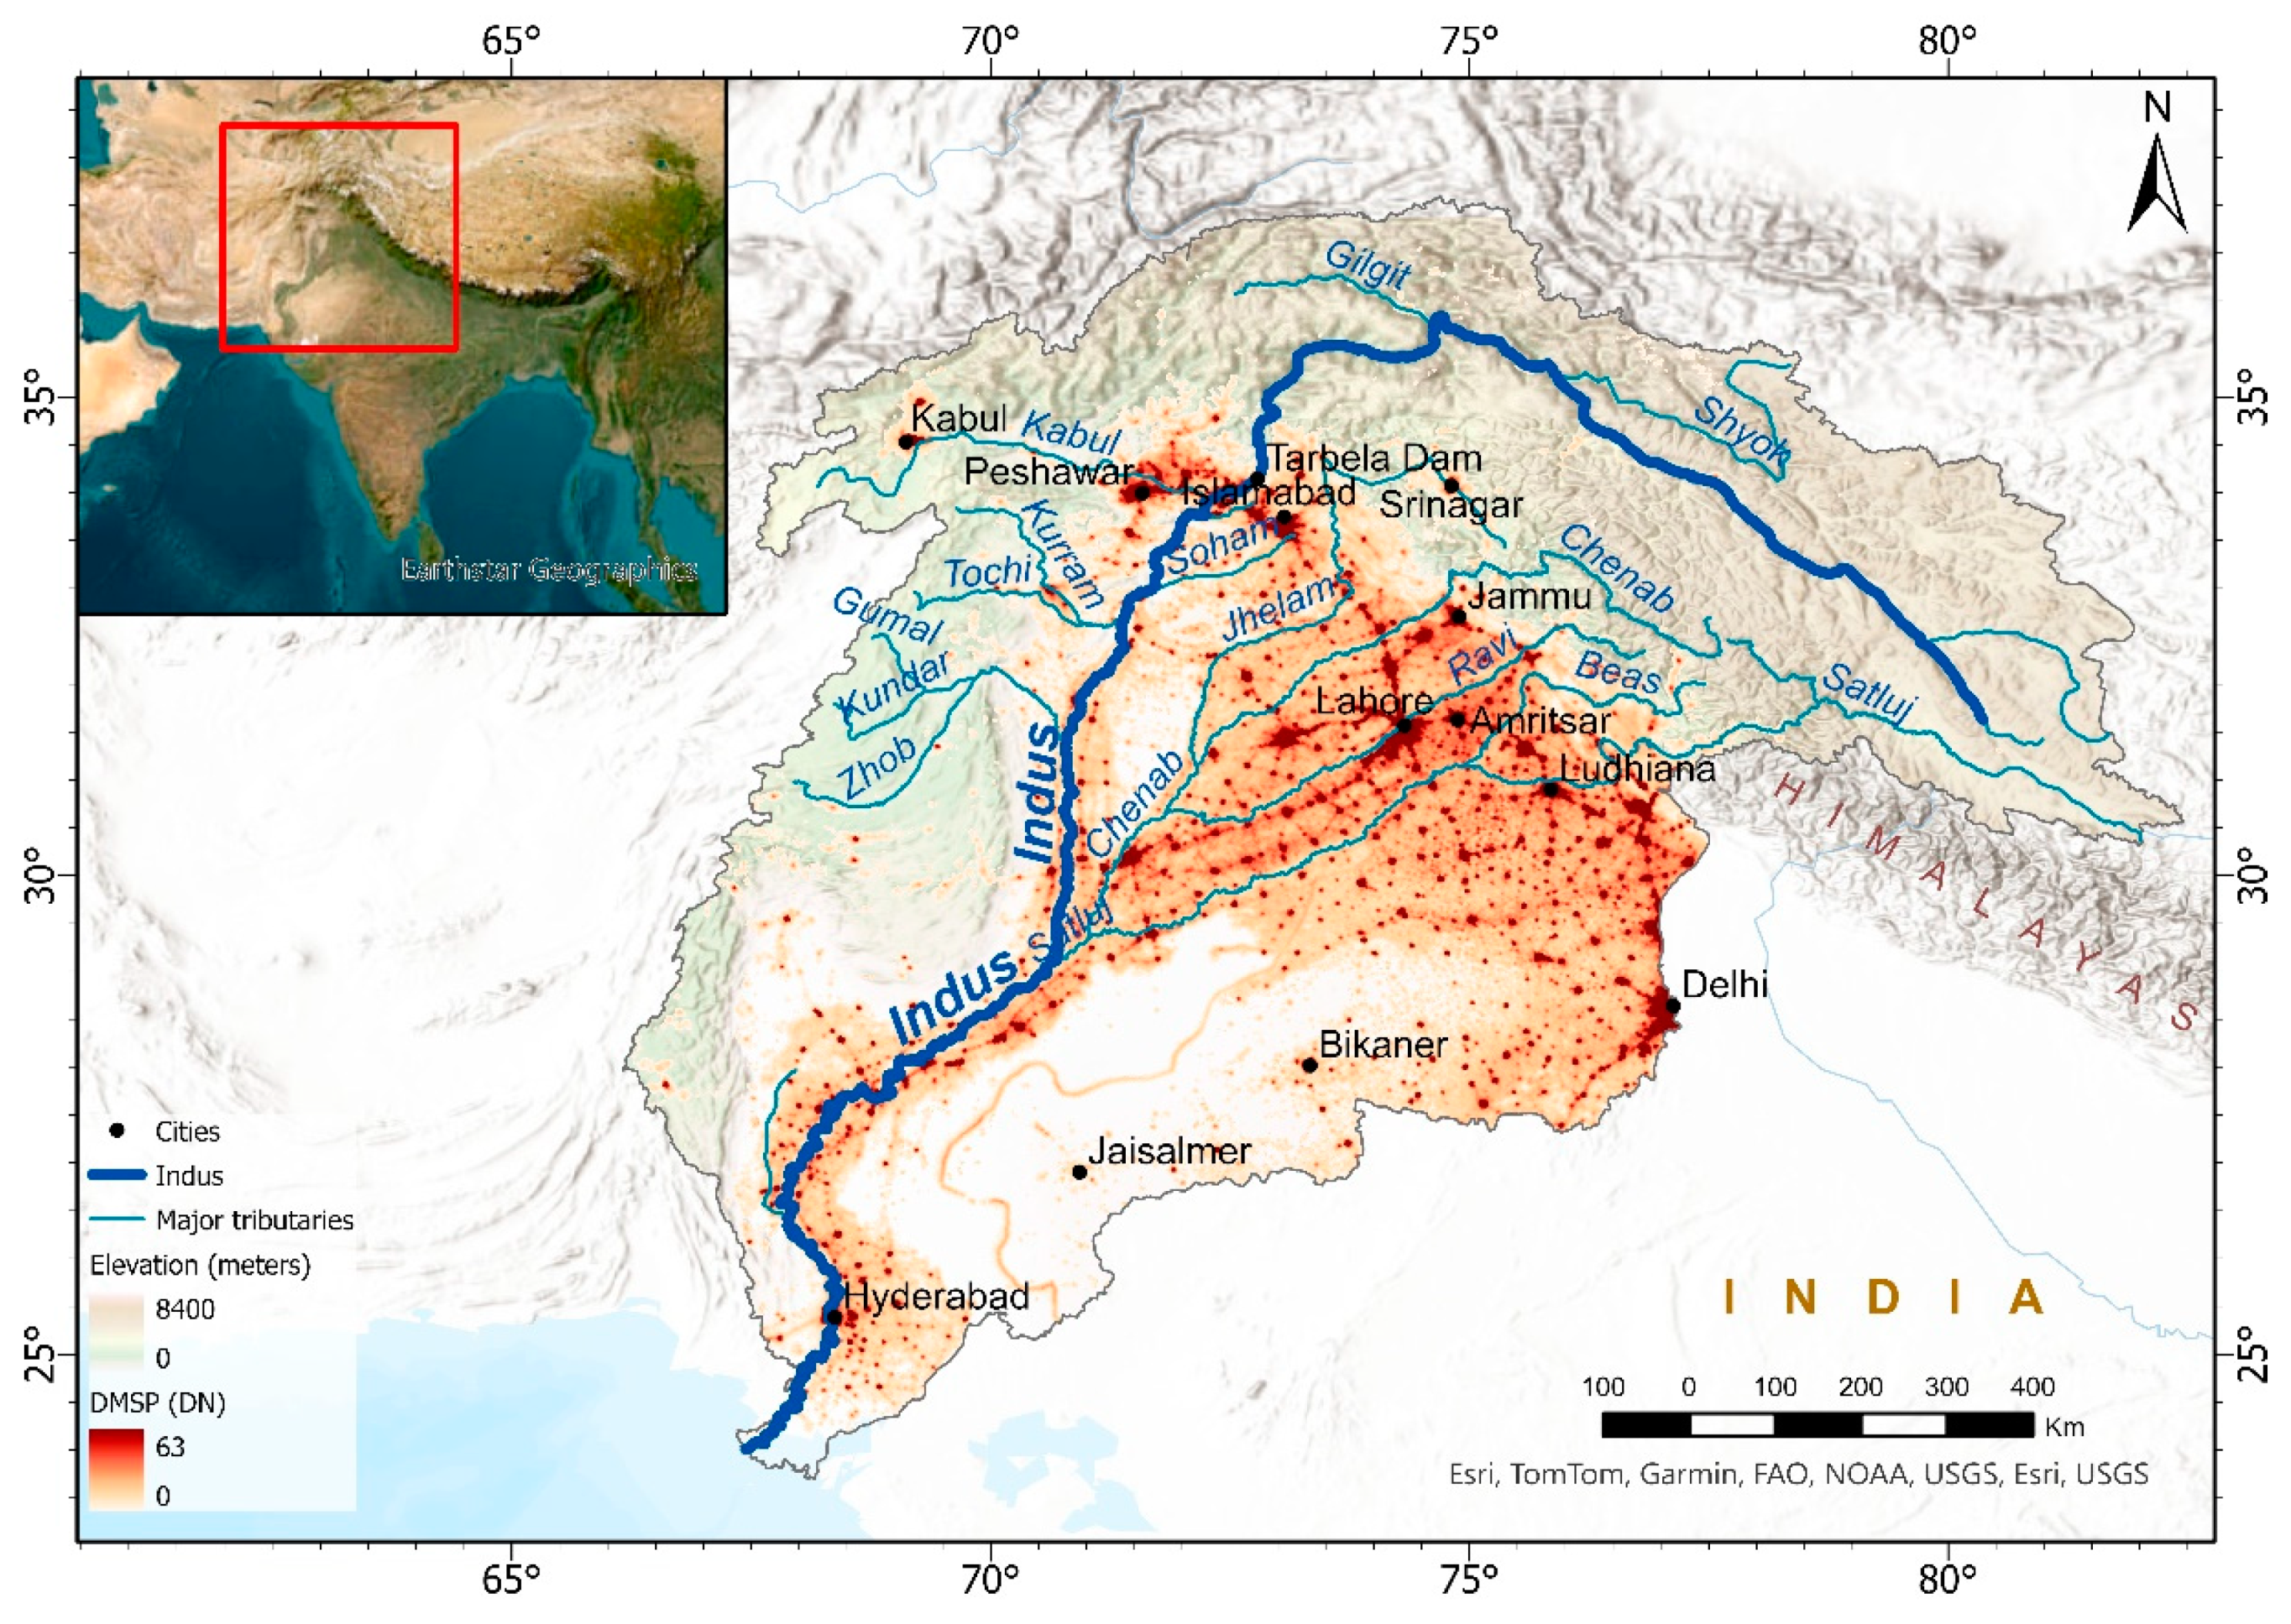
Figure 5.
(A) Single-thread Channel pattern of the Indus River; (B) Multi-thread Channel pattern of the Indus River. Source – ESRI, Maxar Technologies 2022.
Figure 5.
(A) Single-thread Channel pattern of the Indus River; (B) Multi-thread Channel pattern of the Indus River. Source – ESRI, Maxar Technologies 2022.

Figure 6.
Scatter plot (blue dots) between the DMSP-derived sum of lights and the Landscan-derived population data. The red dashed line is the regression line, the correlation coefficient is 0.66 and R2 is 0.43. The figure also shows the different DMSP satellite sensors as different color bands which occupied data from 2000 to 2013. The data points in the red region were collected between 2000-2003 by F14 and F15, in the blue region between 2004-2007 by F15 and F16, in the green region between 2008-2009 by F16, and in the yellow region between 2010-2013 by F18.
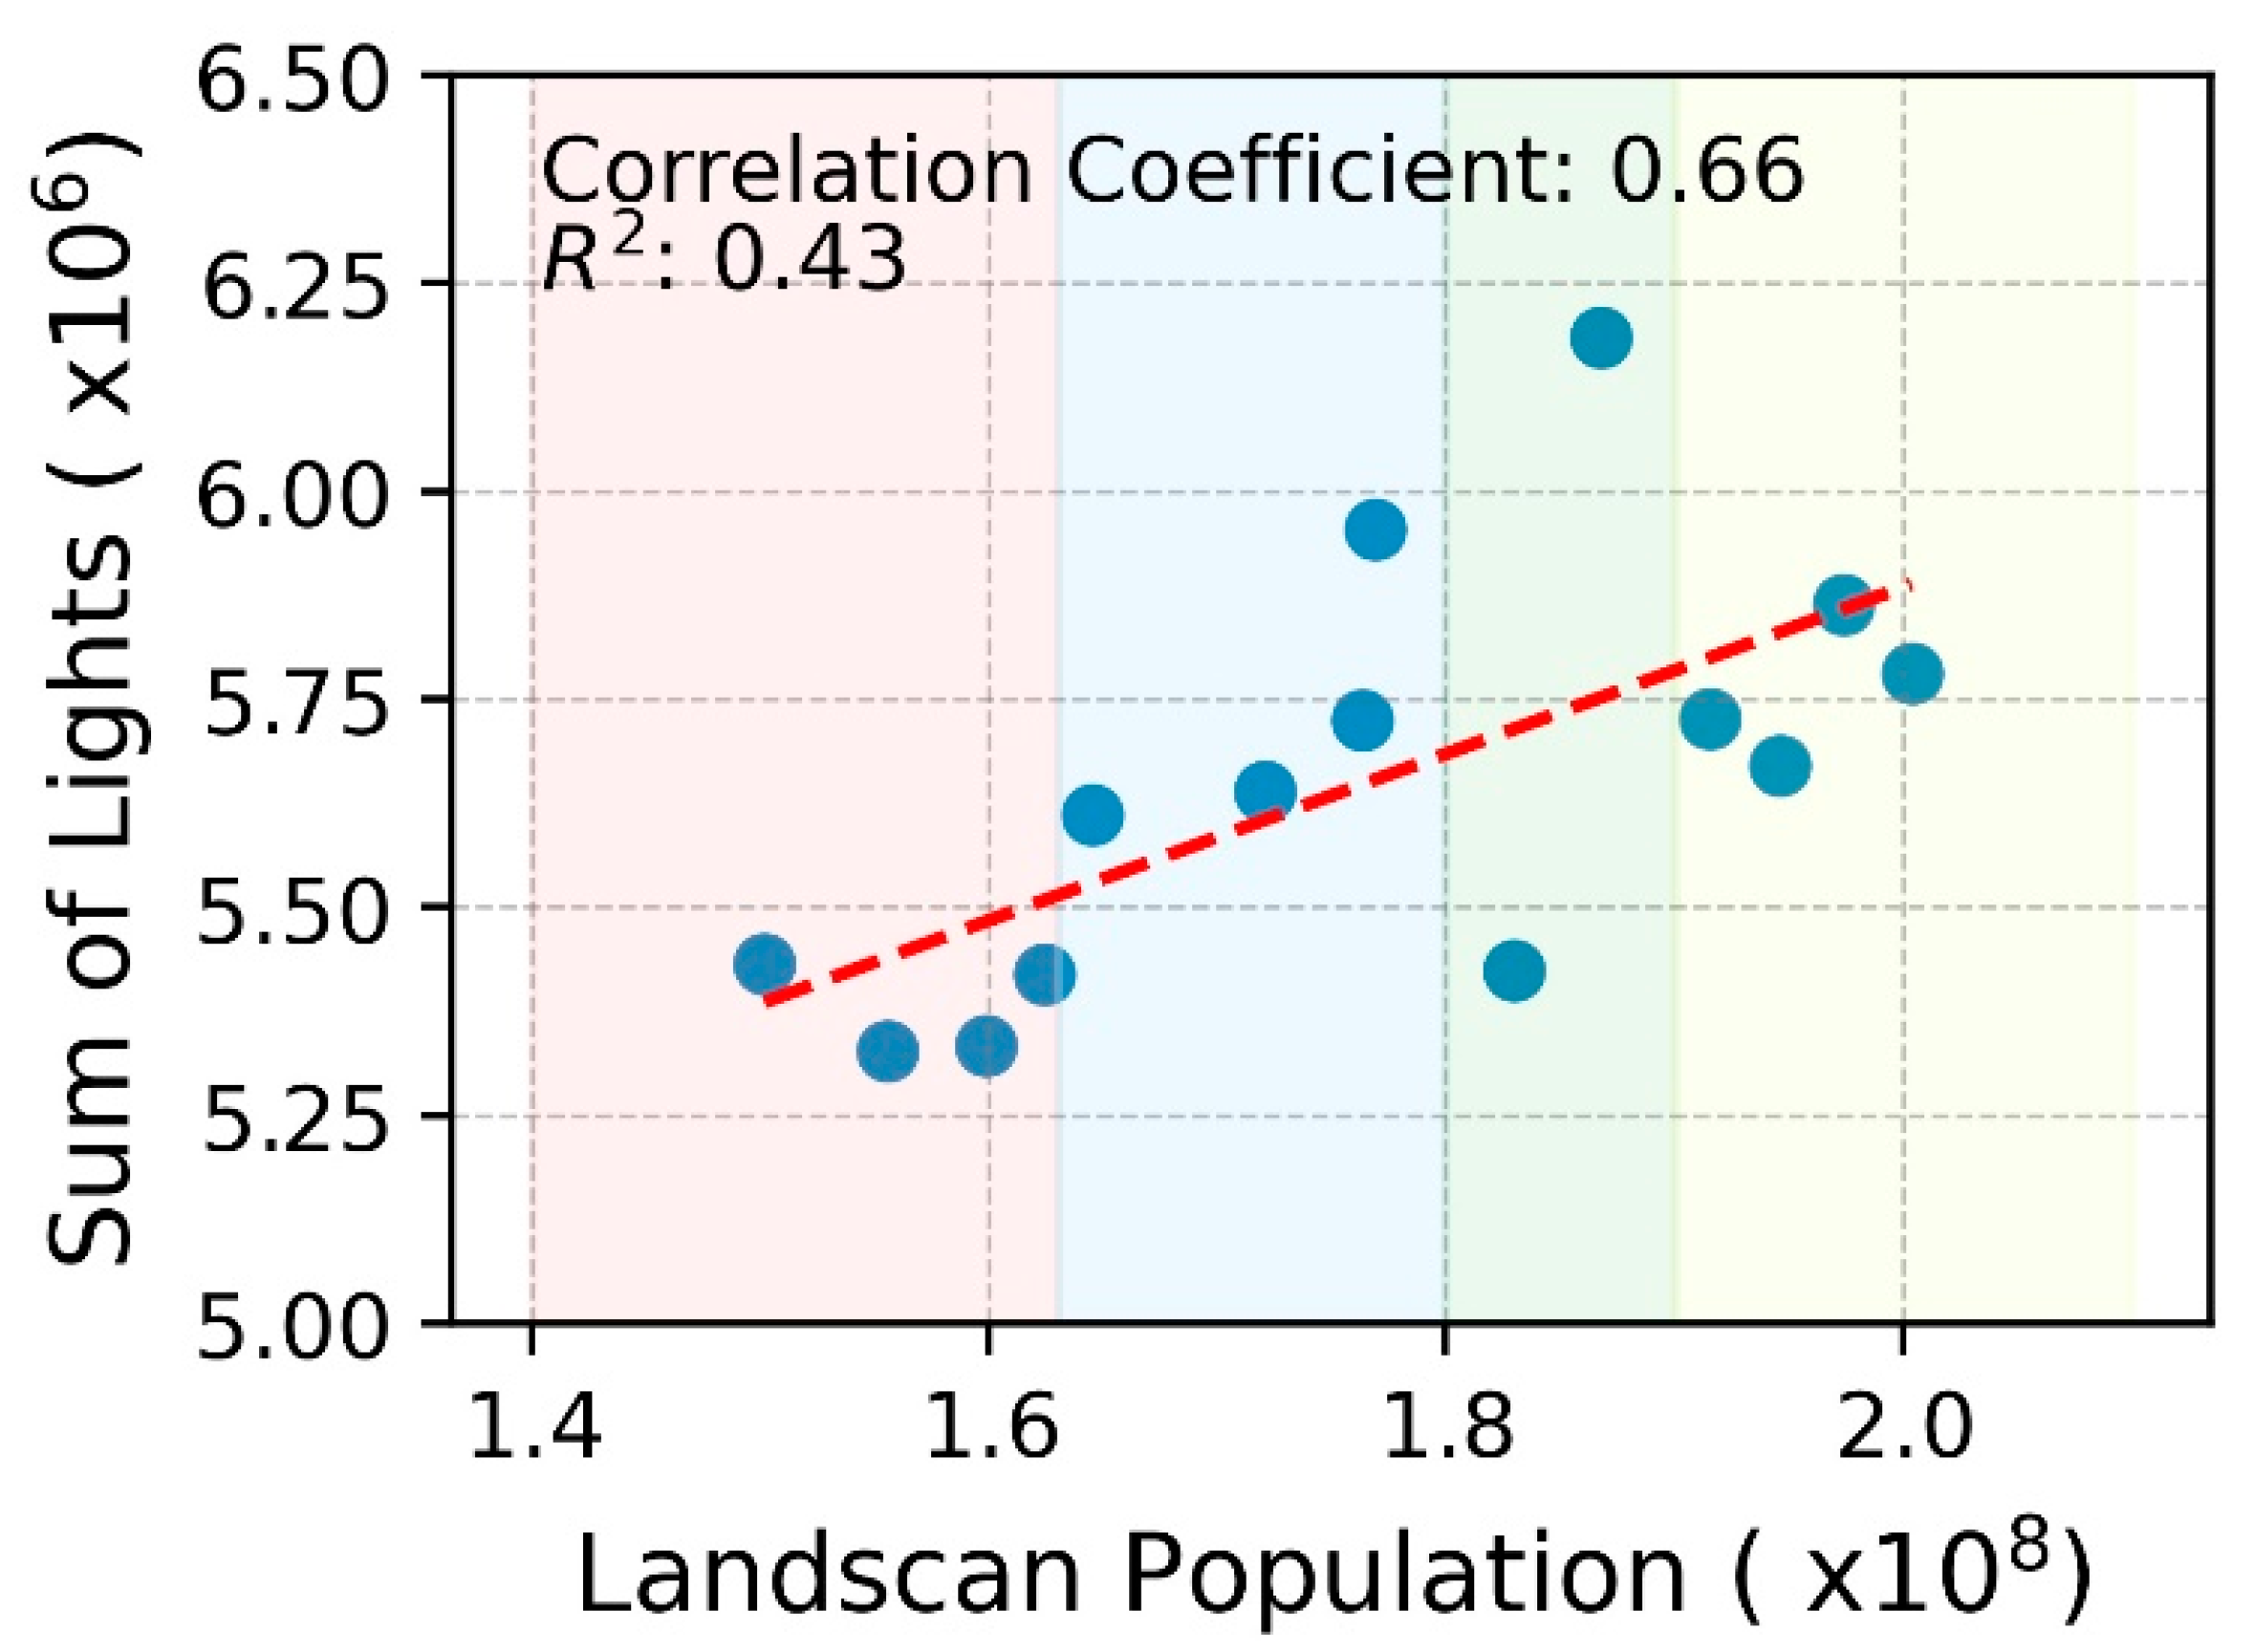
Figure 7.
(A) Bar plot of the geographical area of the Basin (teal green), 0-5 km (turquoise), 5-10 km (orange), 10-15 km (gold), and 15-20 km (grey) buffer zones. (B) Bar plot of the DMSP night lights derived lit pixels area in the Basin, 0-5 km, 5-10 km, 10-15 km, and 15-20 km buffer zones. (C) Bar plot of the enhancement factor (Ef) of the basin and 4 buffer zones, denoting the normal occurrence of lit pixels independent of the geographical area of each buffer zone.
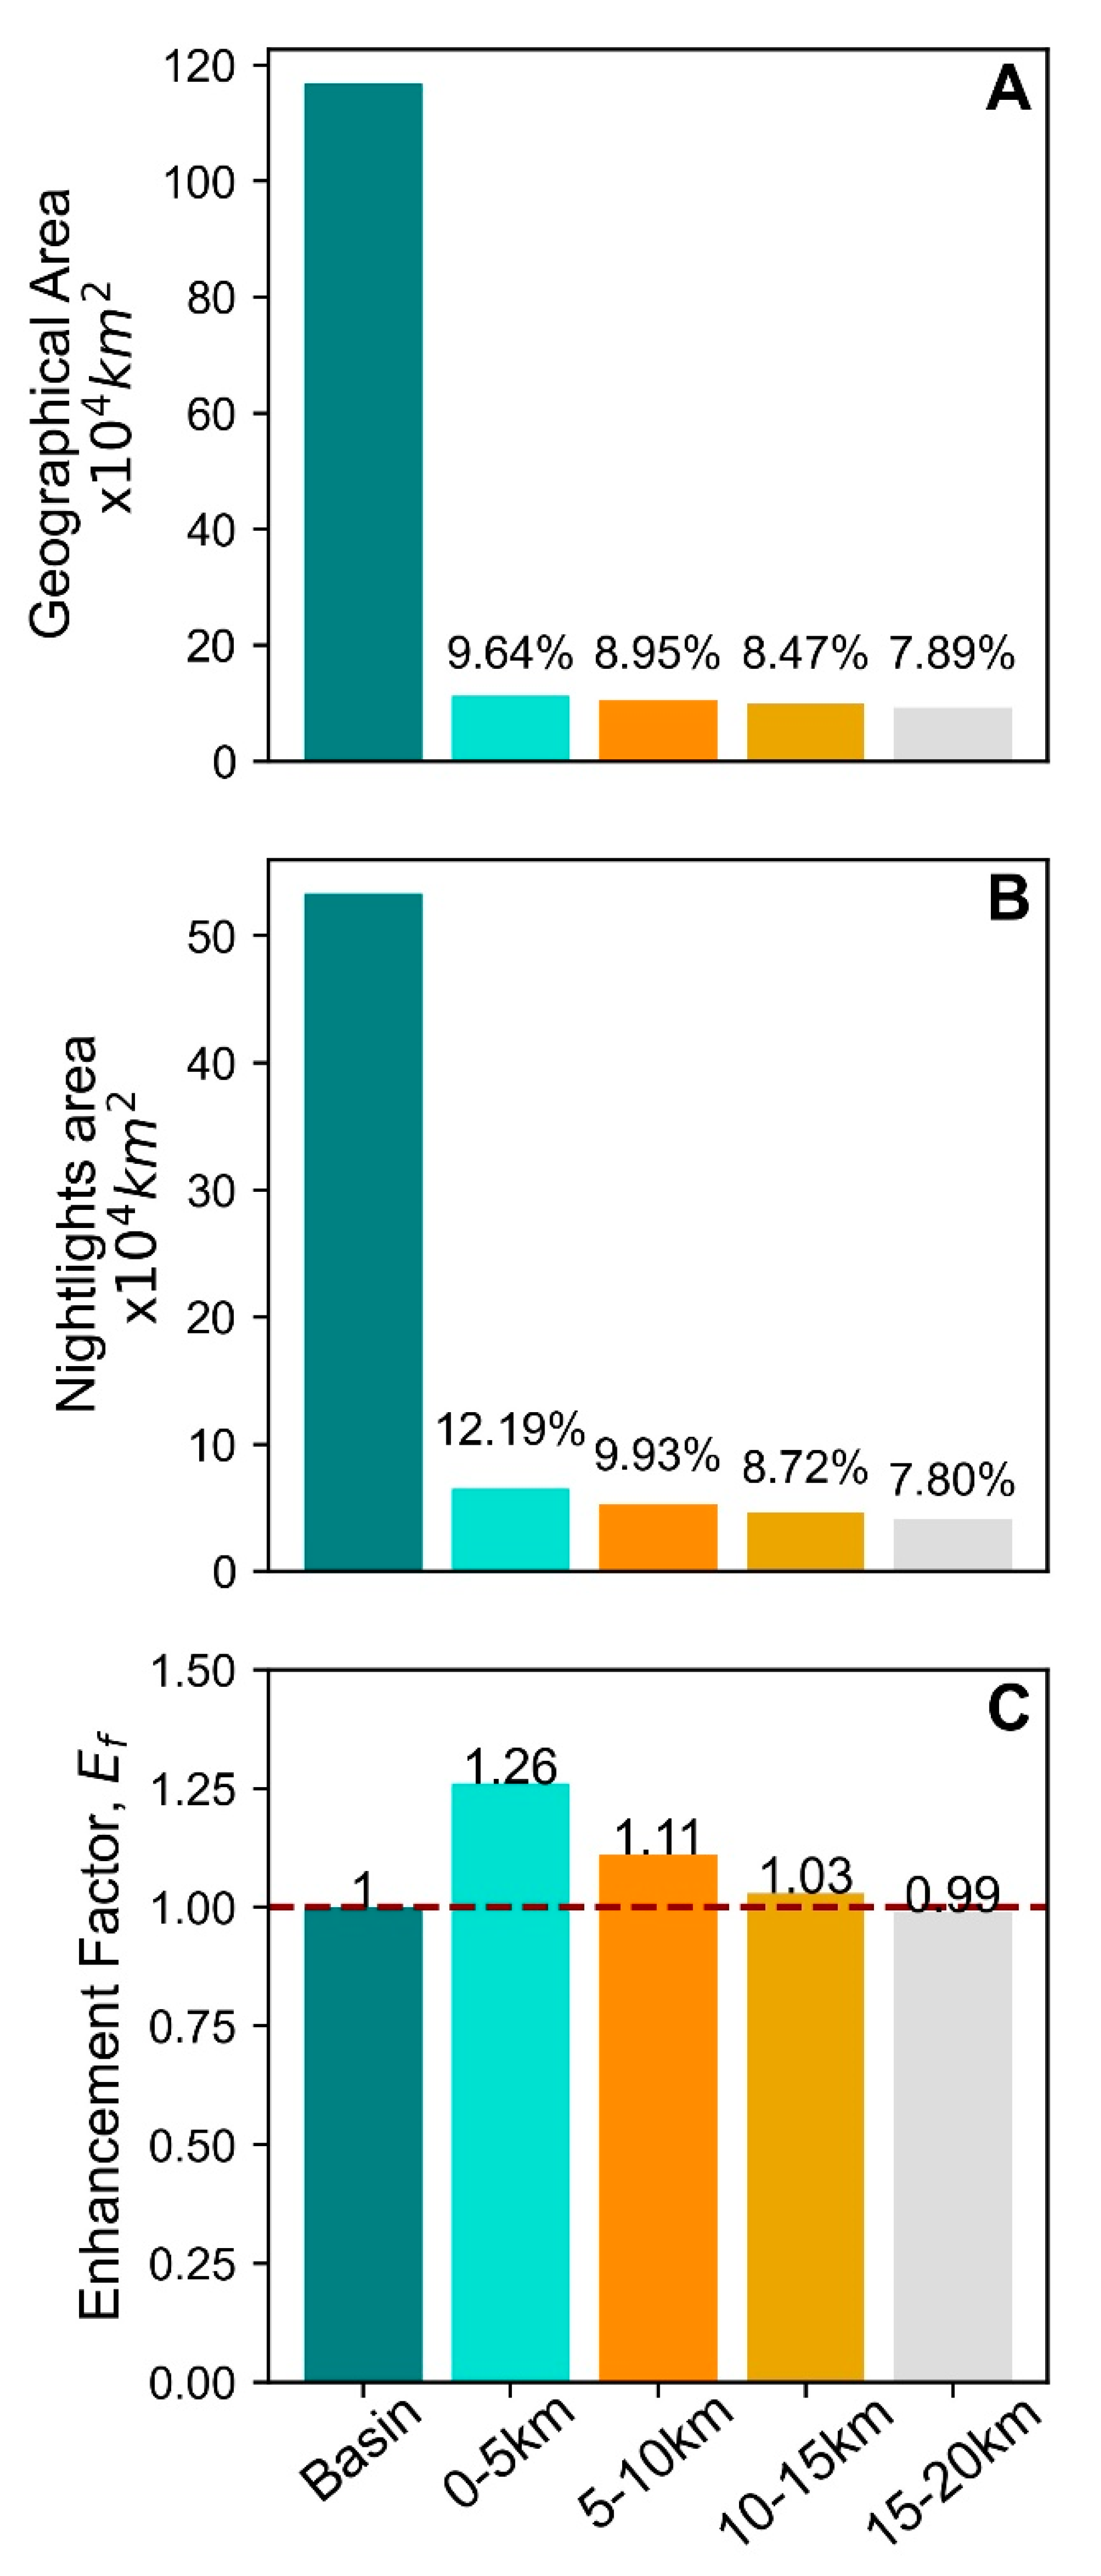
Figure 8.
Frequency plots of lit pixels as a function of the intensity of the lit pixels (represented by Digital number, DN) for the Indus Basin and the 4 buffer zones. The red line in the plots represents the mean of the distribution. (A) Frequency distribution plot of the lit pixels in the basin (teal green). (B) Frequency distribution plot of the lit pixels within the 0-5 km buffer zone (turquoise). (C) Frequency distribution plot of the lit pixels within the 5-10 km buffer zone (orange). (D) Frequency distribution plot of the lit pixels within the 10-15 km buffer zone (gold). (E) Frequency distribution plot of the lit pixels within the 15-20 km buffer zone(grey).
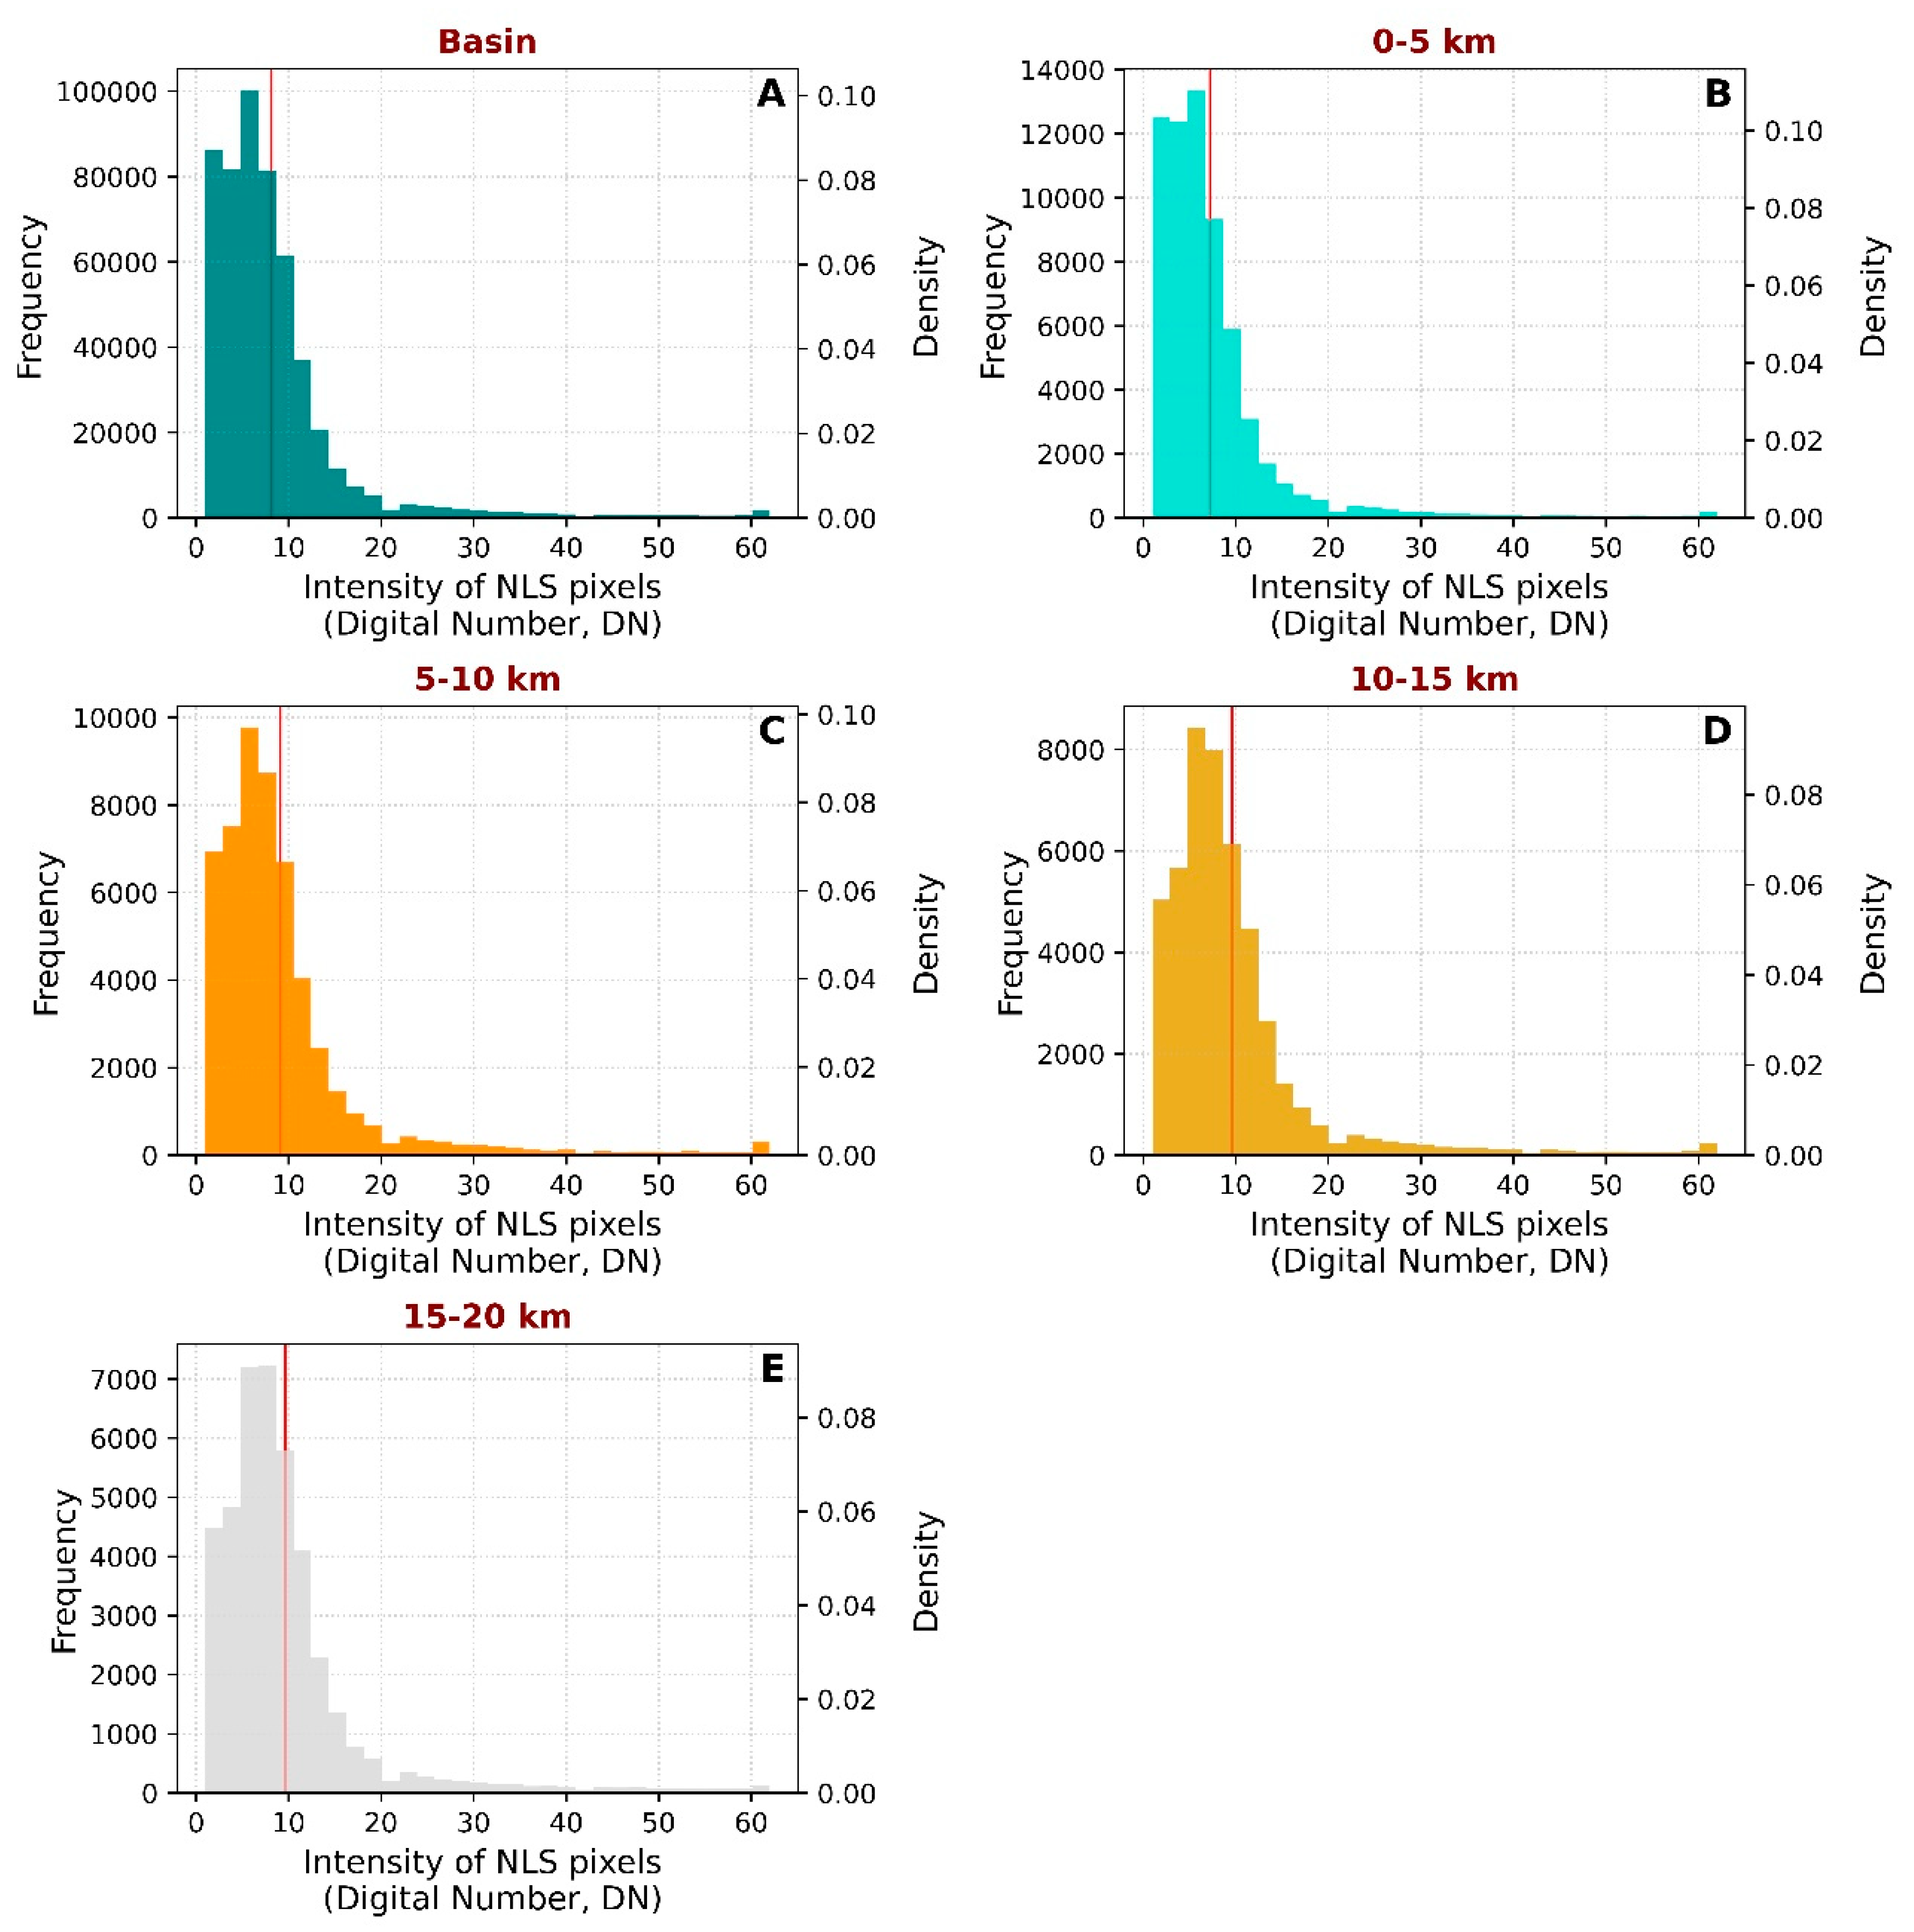
Figure 9.
Cumulative distribution plot of the basin and 4 buffer zones. The median of the basin, 5 km buffer zone, 10 km buffer zone, 15 km buffer zone, and 20 km buffer zone are 6.39, 5.63, 7.15, 7.73, and 7.89 respectively. Thus, 50% of lit pixels across the basin and four buffer zones have an intensity below 10.
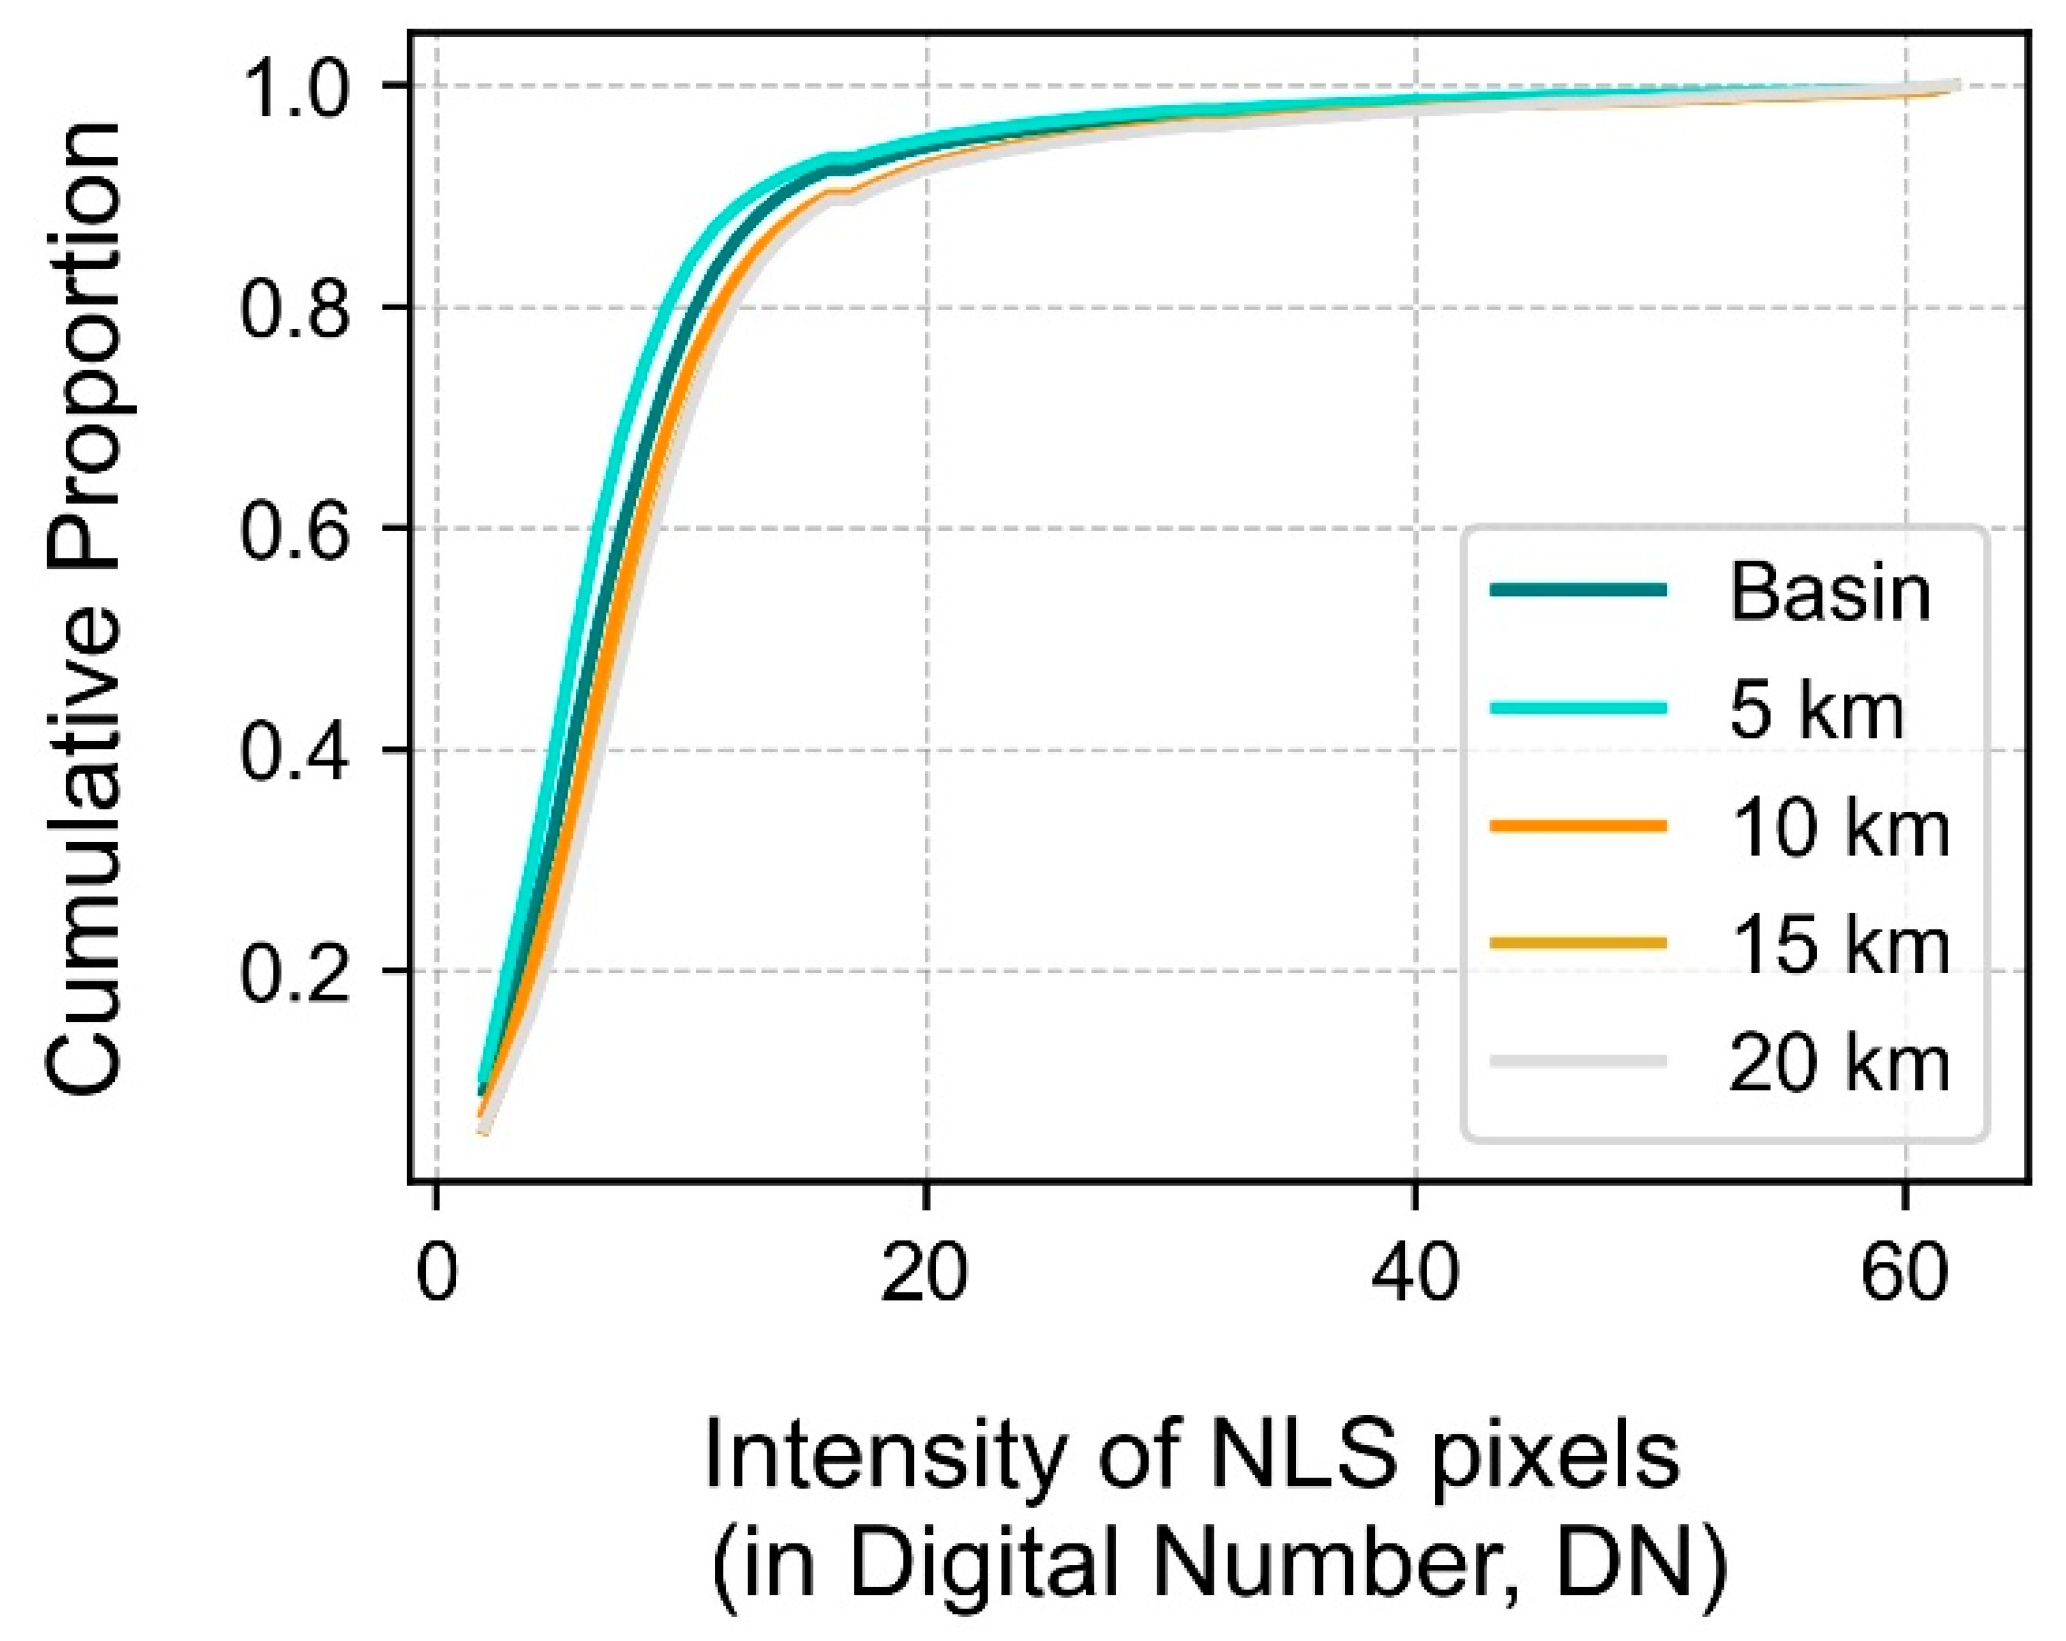
Figure 10.
Correlation plot between the DMSP-night lights derived mean intensity of lit pixels and the count of the lit pixels in the four buffer zones: 0-5 km, 5-10 km, 10-15 km, 15-20 km. The red dashed line shows the polynomial regression relationship between the mean intensity and the count of the night light pixels.
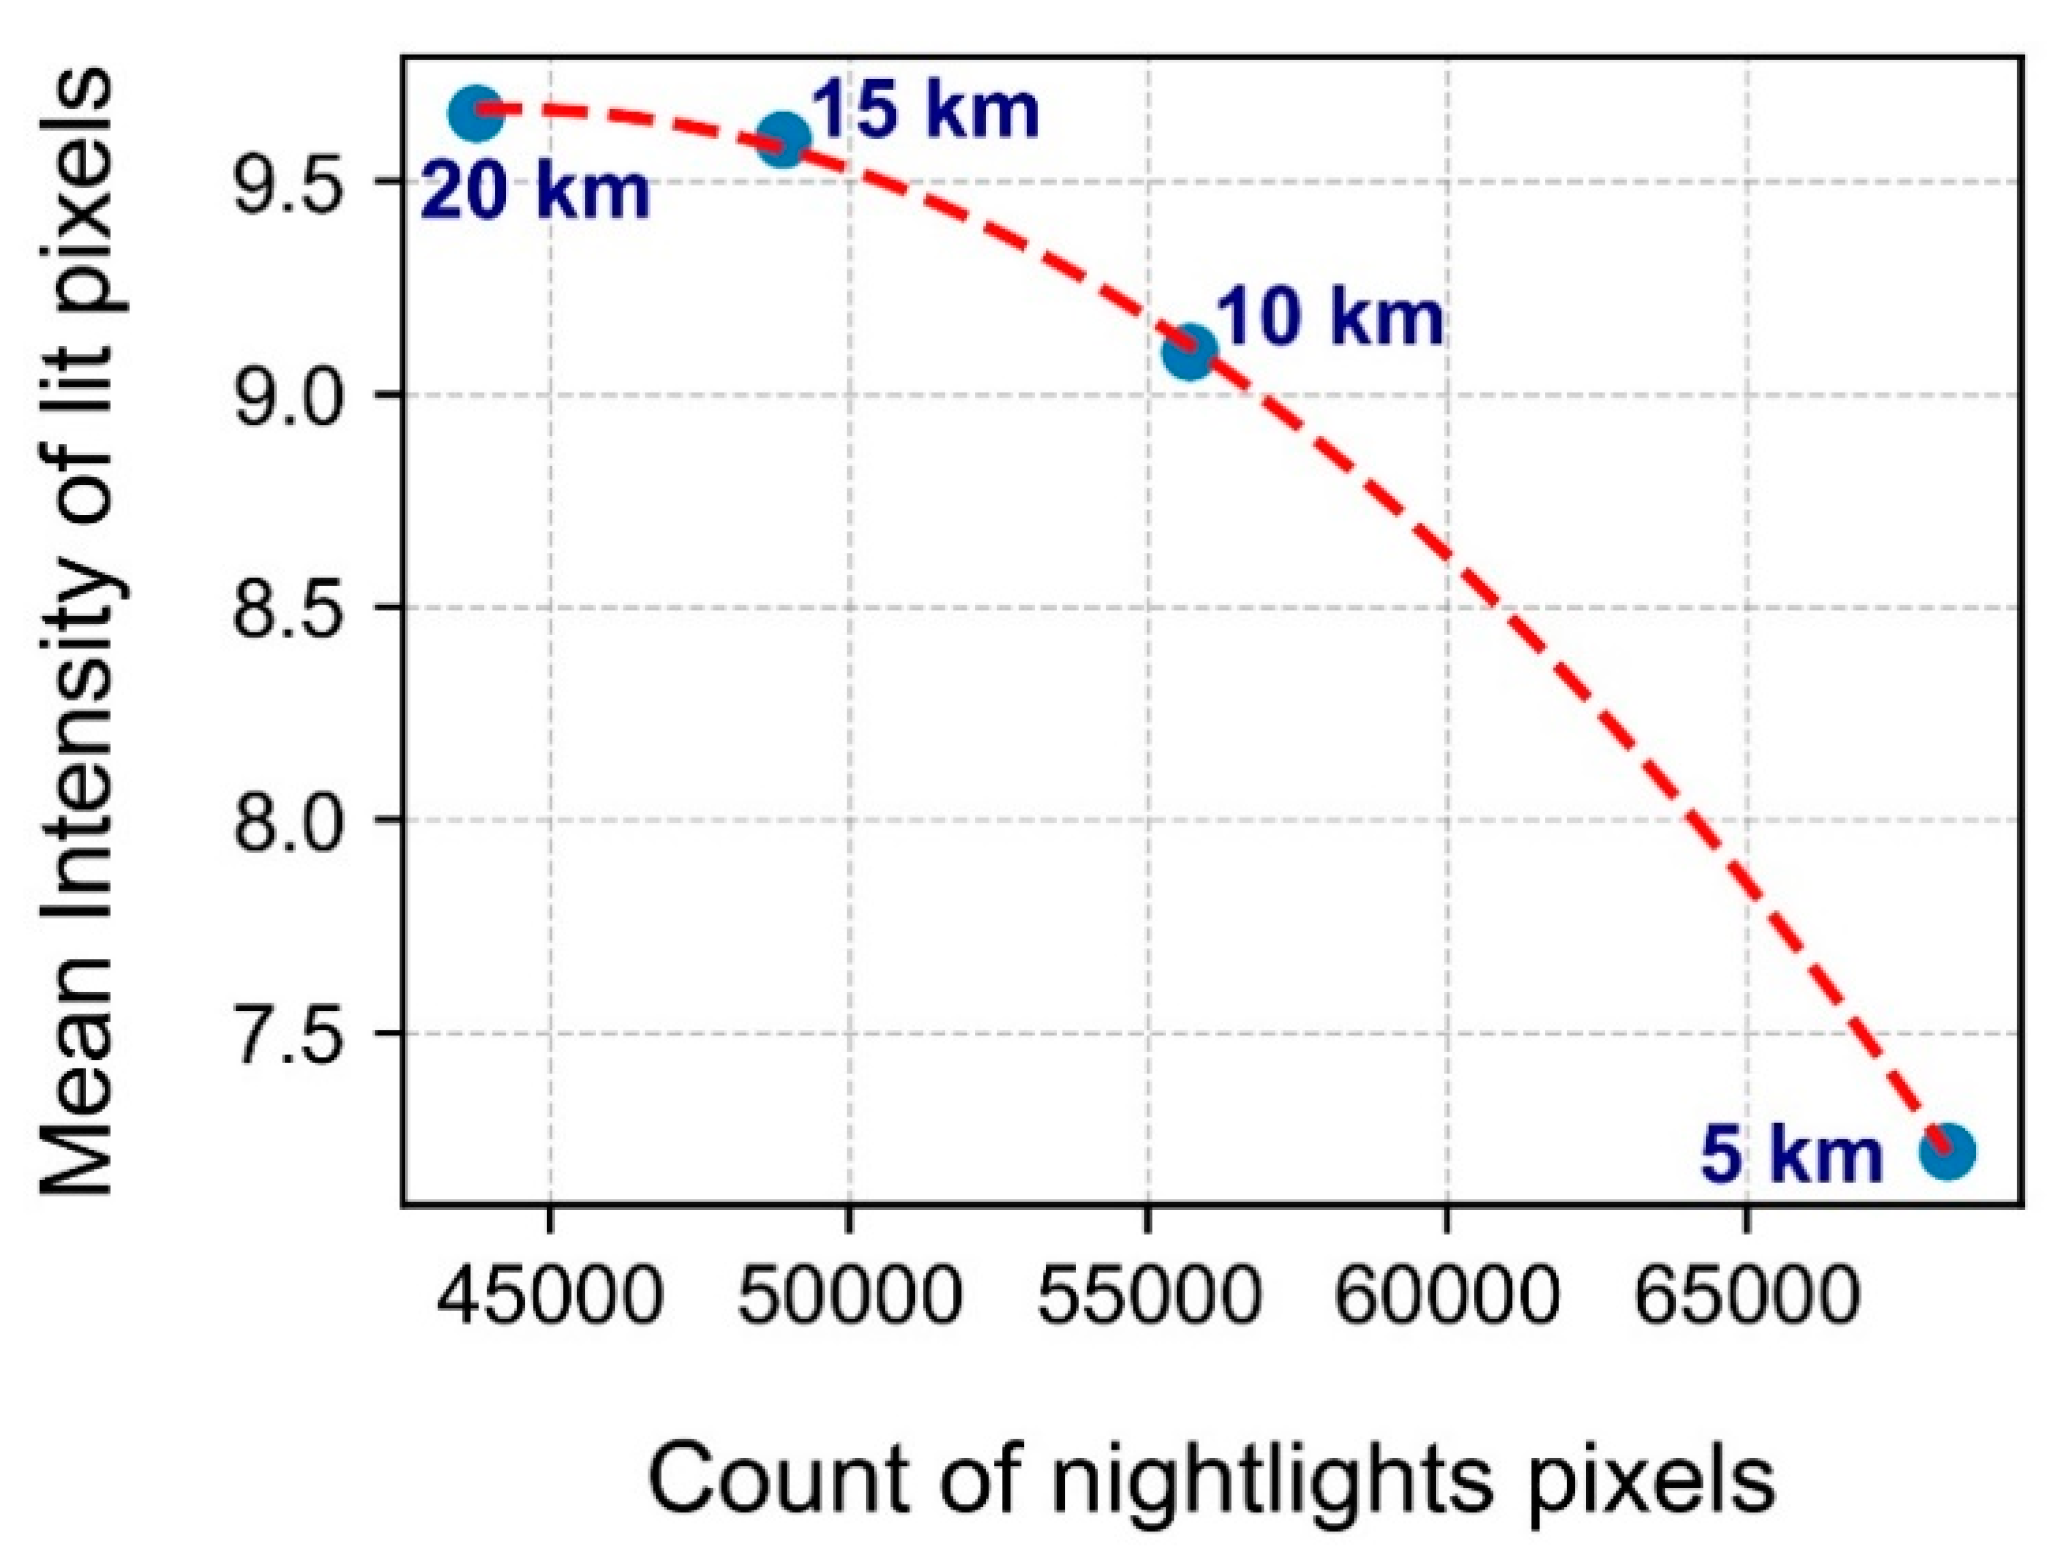
Figure 11.
(A, B, C) Bar plots for the multi-thread channels. The figure represents the geographical area, DMSP night lights derived lit pixels, and enhancement factor of the multi-thread channel and its four buffer zones: 0-5 km, 5-10 km, 10-15 km, and 15-20 km. (D, E, F) Histogram plots for the single-thread channels. The figure represents the geographical area, DMSP night lights derived lit pixels, and enhancement factor of the single-thread channel and its four buffer zones: 0-5 km, 5-10 km, 10-15 km, and 15-20 km.
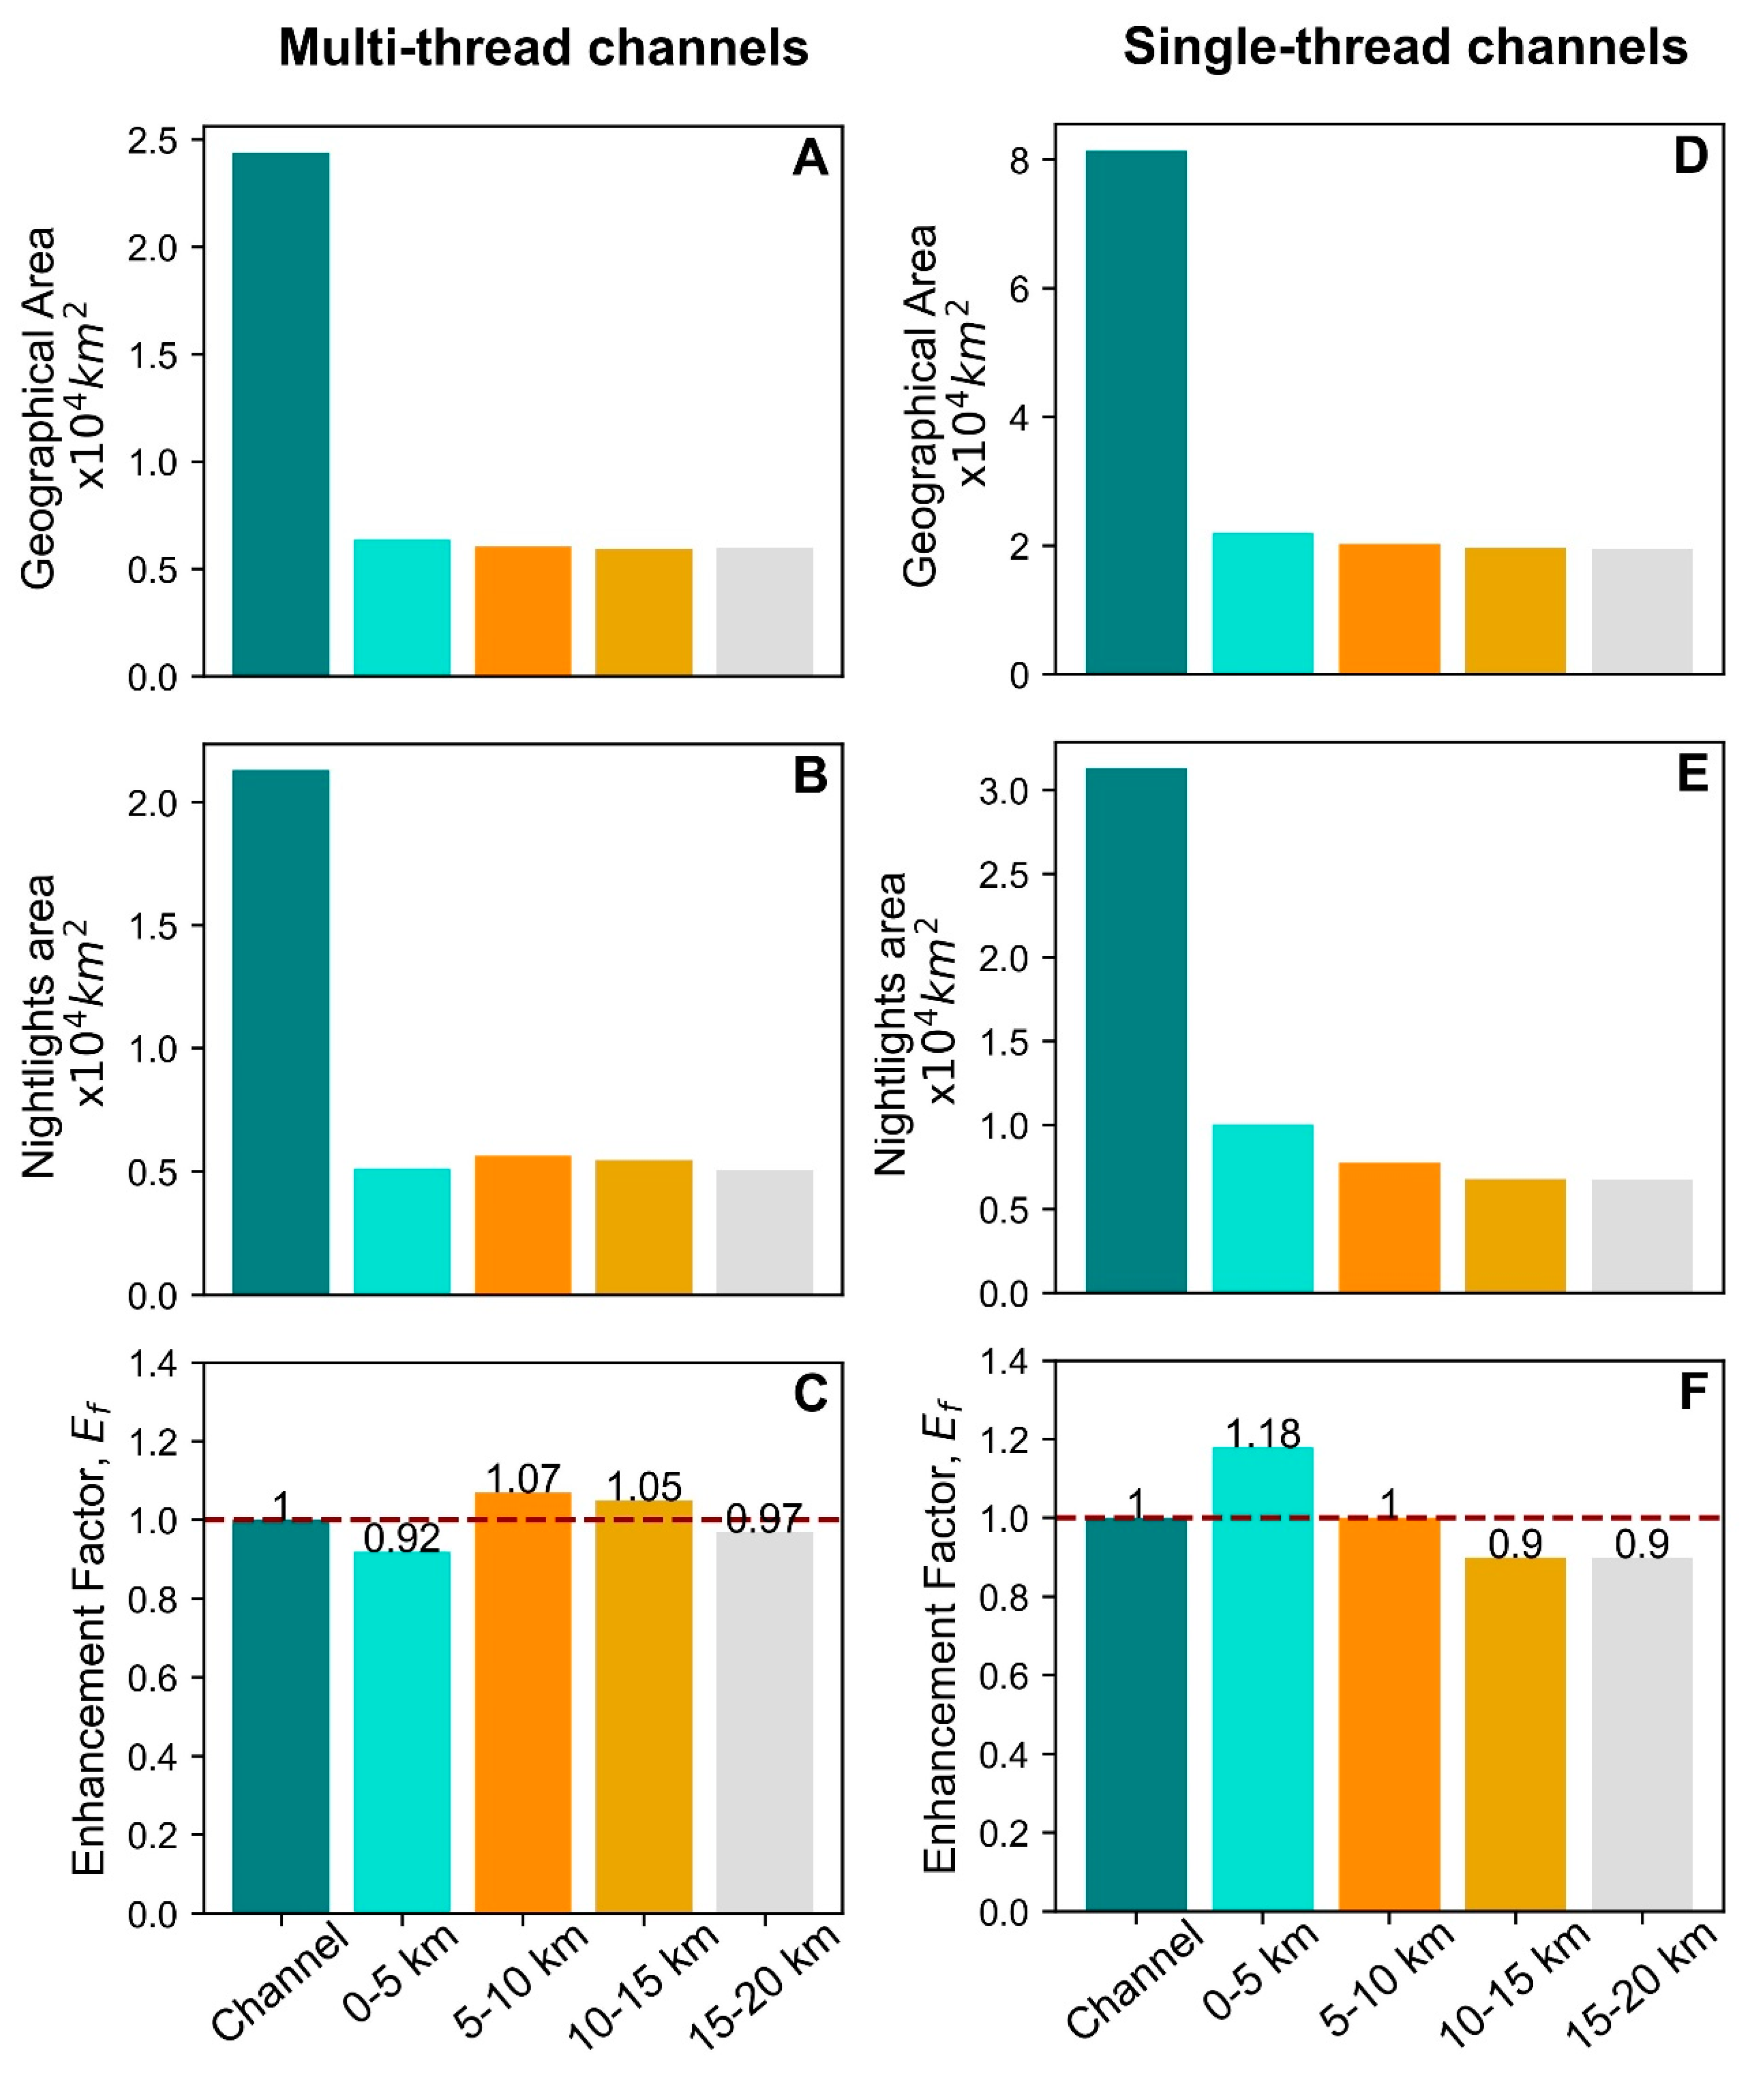

Table 1.
Geographical and DMSP-Night lights derived area for different proximity zones of the rivers in the Indus Basin.
Table 1.
Geographical and DMSP-Night lights derived area for different proximity zones of the rivers in the Indus Basin.
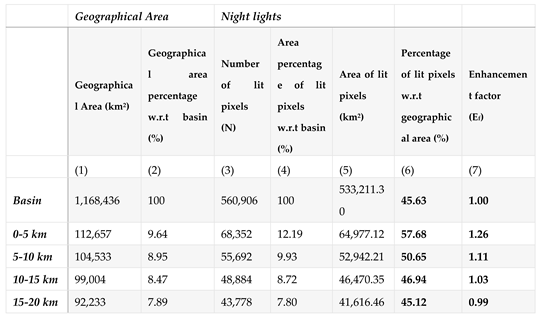 |
Table 2.
Geographical and DMSP-Night lights derived area for 4 proximity zones of the single-thread channel of the Indus River.
Table 2.
Geographical and DMSP-Night lights derived area for 4 proximity zones of the single-thread channel of the Indus River.
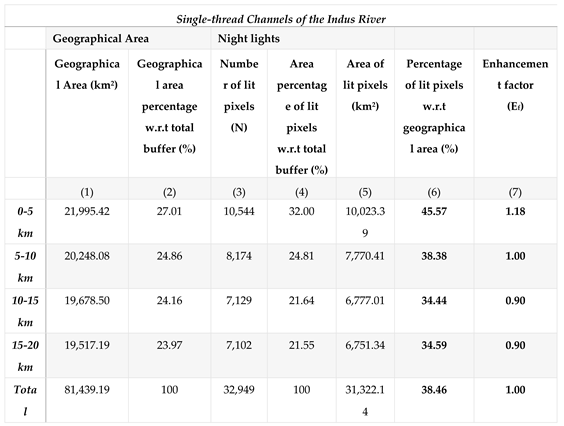 |
Table 3.
Geographical and DMSP-Night lights derived area for 4 proximity zones of the multi-thread channel of the Indus River.
Table 3.
Geographical and DMSP-Night lights derived area for 4 proximity zones of the multi-thread channel of the Indus River.
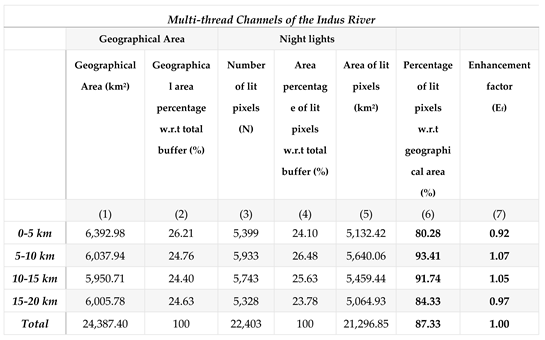 |
Table 4.
Descriptive statistics of the night light data for the basin and the four buffer zones.
 |
Disclaimer/Publisher’s Note: The statements, opinions and data contained in all publications are solely those of the individual author(s) and contributor(s) and not of MDPI and/or the editor(s). MDPI and/or the editor(s) disclaim responsibility for any injury to people or property resulting from any ideas, methods, instructions or products referred to in the content. |
© 2024 by the authors. Licensee MDPI, Basel, Switzerland. This article is an open access article distributed under the terms and conditions of the Creative Commons Attribution (CC BY) license (http://creativecommons.org/licenses/by/4.0/).
Copyright: This open access article is published under a Creative Commons CC BY 4.0 license, which permit the free download, distribution, and reuse, provided that the author and preprint are cited in any reuse.


