Submitted:
08 February 2024
Posted:
12 February 2024
You are already at the latest version
Abstract
Despite ample warning and significant lead time, global society has not acted sufficiently to combat climate change, and global carbon dioxide emissions are now about 60% higher today than in 1990 [1]. This paper uses marine fisheries as an analog model to compare with the many similar management issues faced with global climate change. Both marine fisheries and global climate change are complex systems that have similar properties that make management very difficult. A simple fishery prototype model is used to educate citizens about similar issues of dynamic complexity found in climate change models. We highlight how our slow reaction time to global climate change can be thought of as a mismatch between our cognitive abilities and the nature of global collective problems. Understanding the history and system structure of marine fisheries can provide insight into managing global climate change. We suggest ways to improve communication between science and citizens for updating mental models and changing climate policy.
Keywords:
Climate change
; system dynamics
; affective risk
; neoliberalism
; mental models
; socio-ecological systems
; sustainability
1. Introduction
The Paris Agreement was adopted by 196 Parties (participating countries) at the United Nations (UN) Climate Change Conference (COP21). The major goal of the Paris Agreement is to hold “the increase in the global average temperature to well below 2°C above pre-industrial levels” [2]. However, the Intergovernmental Panel on Climate Change (IPCC) now indicates that the 1.5° C threshold cannot be crossed without triggering far more severe climate impacts [3]. Achieving the goals of The Paris Climate Agreement requires a dramatic transformation of the global economy to carbon-neutral societies [4]. This change can be best conceptualized by computing a budget for CO2 emissions indicating the maximum amount that can be added to the atmosphere while still limiting the global temperature increase to 1.5 degrees Centigrade [5]. This computed budget indicates that striking reductions in CO2 output are required to keep the global climate within a more livable range and avoid crossing dangerous tipping points in the Earth system.
Despite the strong urging of the scientific community and three decades of political effort, global emissions have continued to rise and are now 58% higher today than they were in 1990 [6]. Recently, researchers have identified the leading role of power and influence, which is discernable in many forms, as a universal force that is fundamental to thwarting progress on climate change mitigation [1]. The influence of power from status quo fossil fuel companies and other vested interests has been termed the “new climate war” [7]. A central tactic used by vested interests is the spread of disinformation through various means to influence citizens and interfere with the political process [8].
Figure 1 shows a high-level view of the various system components involved with information flow, citizen involvement and government policy-making that is fundamental to solving the climate change problem. Implicit within this model are three major factors: (1) citizens’ actions (primarily voting in democratic societies) determine the nature and type of policy enacted by government, (2) the central importance of citizens’ thinking and mental models and how they are influenced by information flows from science and through vested interests, and (3) to fully understand the interactions and long-run dynamics between the human system and the Earth (or environmental) system one needs to use systems thinking and computer modeling with system dynamics.
1.1. High-level Climate Change Problem-Solving: How the system should properly work
All good systems require checks and balances. In Figure 1, feedback on the Earth System health is obtained and used by the science community to obtain knowledge. Knowledge should then be communicated properly back to the citizens who can then understand the situation (updating their mental models). Citizens (decision makers, voters) can then responsibly vote for public officials who can design effective policies (e.g. environmental regulations or carbon taxes or incentives to use renewable energy, etc.).
Citizens (box 3) occupy a central position and fundamental leverage point in the system. Unfortunately, this problem-solving system falls short because many citizens listen to incorrect sources of information as depicted in box 5 of Figure 1. Mental models are influenced by various information flows. Propaganda from fossil fuel companies and vested interests have kept a steady flow of disinformation to citizens.
2. Mental Models, Lock-in, World Views and Votes
A mental model is a cognitive representation of how the world is structured and organized. The concept of a mental model was initially developed by the psychologist Kenneth Craik [9] who advanced the idea that people carry in their minds a small-scale, simplified model of how the world basically works. Mental models are used for anticipation, prediction, reasoning and to provide explanatory narratives that describe past events [10].
Since there is widespread support for the view that a government’s major role is to provide support for job creation and help with economic development, a large percentage of citizens have adopted a mindset or mental model based on the neoliberal ideology [11]. Neoliberalism is an ideology that stresses economic growth as the single most important objective while also depicting government as an obstructive force impeding the free market [8,12]. This ideology supports policy to promote the free market, massive tax cuts (especially for businesses and high-income earners), reductions in social services, and the creation of new political institutions and think tanks designed to promote the neoliberal, pro-growth paradigm [12].
The neoliberal mindset in citizens has been strongly reinforced by corporate influence and propaganda, especially the large fossil fuel companies and their associated vested interests [11]. In addition, political leaders who get financial support from large corporations often become locked-in with this way of thinking and must enact policies consistent with this viewpoint or face the risk of losing their political power [11].
Many citizens are already predisposed to this type of information, because it fits their current thinking and because it keeps them attached to their social or tribal groups. This also forms a type of mental lock-in and is based on the neoliberal assumption that government regulation, taxes, and policies designed to combat climate change are harmful to economic growth. Thus, their belief that government restrictions and interference in the market are harmful, keeps this group opposed to climate change action. This closed-minded orientation is known as solution aversion [13]. Cultural cognition theory posits that individuals can be expected to form perceptions of risk that mirror and reinforce values that they share with others in their cultural group [14]. Interestingly, the pull of one’s own social group is so strong that people will actually reject rationality at the collective level that would otherwise promote their common welfare and instead use their intellect and rationality to maintain their cultural commitments at the individual level. This is seen as a form of short-termism. Individuals in this cultural group will bear the immediate harm of social group rejection if their beliefs are not consistent with their tribe. However, the benefits to the common good are in the future and not entirely certain [15]. Therefore, these future benefits are discounted.
Two world views are of particular interest in this context [15]. Cultural cognition theory speculates that people who hold a “hierarchical, individualistic” worldview will be skeptical of environmental and technological risks that would lead to restrictions on industry and economic activity. In contrast, people who hold a “egalitarian, communitarian” worldview that places greater weight on collective actions to securing individual needs, will tend to be more skeptical of commerce and industry. This worldview distrusts business as they see it as the source of unjust disparities in wealth and power [15]. Importantly, Kahan et al. [15] found that greater scientific literacy and numeracy were associated with greater polarization on the issue of climate change. This finding would suggest that simply giving more scientific literacy information on climate change will not likely move citizens to form a different and contrasting opinion from their particular worldview.
The neoliberal ideology can be thought of as consistent with the “hierarchical, individualistic” worldview that values business and industry. Meanwhile the “egalitarian, communitarian” worldview aligns more with progressive, democratic, and socialist political orientations. Neither worldview is complete. We contend that a more balanced, open view of our ecological and economic systems must be adopted if we are to make progress on climate change. This is necessary because of the many interdependencies in these tightly coupled systems and because citizen majorities determine policy.
3. Expanding our Mental Models with Systems Thinking and Stock and Flow Modeling
The mental models of many citizens are overly focused on the human system (an Anthropocentric view), Box 6 of Figure 1. Of course, our human socio-economic systems are completely dependent on our natural world, Box 7 of Figure 1. A more complete mental model that encompasses the important variables involved needs to be expanded to include both our human socio-economic system and the natural world or the Earth Climate System [11]. However, large complex systems are difficult to understand and often result in suboptimal performance by decision makers.
Many dysfunctions in dynamically complex systems are the result of misperceptions in feedback. The mental models people use to guide their decisions are dynamically deficient. Specifically, people generally adopt an event-based, open-loop view of causality, ignore feedback processes, fail to appreciate time delays between action and response and in the reporting of information, do not understand stocks and flows, and are insensitive to nonlinearities that may alter the strengths of different feedback loops as a system evolves [16](p. 305).(
Understanding the principles of stock and flow modeling allows one to appreciate the operation of complex systems. Systems can be conceived of and modeled as interconnections of stocks and flows. Stocks can be used to represent many abstract concepts such as inventory, natural populations, or accumulations of various amounts. For example, inventory stocks increase through production (inflows) and decrease through sales (outflows). Underlying equations represent the flows and determine how the stocks change through time [17]. Figure 2 shows two examples of stock and flow. In the Population stock example, the Population increases when the births (inflow) exceed the deaths (outflow). Similarly, if deaths exceed the births the Population stock decreases. If births equal deaths, then the Population remains in equilibrium. Separate equations typically govern various inflows and outflows because each is a separate process with their own causes. For example, in the case of the Global Average Temperature, melting ice sheets would cause more radiation to be absorbed and would increase the inflow of heat to Earth. Increasing the amount of carbon dioxide in the atmosphere would cause less heat loss, and thus less outflow. Global average temperatures have continued to increase because the inflow of heat is greater than the outflow.
3.1. The Climate System, Tipping Points, and Other Complexities
In Figure 1 the connection between the human system and the Earth system is a tightly coupled ecological and socio-economic system. This means of course that actions in our socio-economic system affect our Earth system. Energy used by our socioeconomic system that is based on fossil fuels will add CO2 to the atmosphere. Not visible in this diagram, however, are the many interconnected and interdependent components or subsystems within the Earth System. These interconnected links influence each other and beyond some threshold or tipping point will trigger strong reinforcing feedback leading to nonlinear, rapid change. Several of the most critical tipping points are: (1) melting perma-frost; (2) loss of Arctic and Antarctic sea ice, (3) water vapor increases, and (4) loss of forest cover
3.2. Climate Reinforcing Feedbacks
As the Earth system heats, perma-frost areas begin to melt. Once this occurs Methane gas is released which is a very potent greenhouse gas. This further causes heat trapping in the atmosphere leading to more permafrost melting and continuing the cycle. Similarly, as ice is lost at the poles, less ice cover leads to less albedo effect causing more solar heat to be absorbed by the Earth System. This causes more melting, and the cycle continues. Finally, as tropical forest cover is lost due to higher temperatures there is less reabsorption of CO2 leading to higher levels in the atmosphere and more heat trapping.
Reinforcing feedback in the system means that small, global temperature increases can lead to dramatic changes in the Earth System [18]. Reinforcing feedback and other aspects of complex systems such as stock and flow dynamics, nonlinear relationships and time delays make it exceedingly difficult for people to understand the full consequences of our actions [16]. Figure 3 highlights two important reinforcing feedbacks that can trigger runaway climate change. The ‘+’ symbol on the connections indicates the same direction of change, so an increase in global average temperature leads to an increase in water vapor inflow. As global water vapor increases this leads to less heat outflow (the ‘-‘ symbol here means opposite direction of change). Alternatively, if global average temperature were to decrease this would lead to a decrease in water vapor inflow (again the ‘+’ symbol indicates same direction of change in the connection).
So, with climate change, as global temperatures increase more water vapor is added to the atmosphere. Since water vapor is a heat trapping gas, this leads to less heat outflow from the Earth system. Less heat outflow leads to higher temperatures given the same heat inflow and then of course more water vapor being added back to the atmosphere in a reinforcing loop.
4. Looking Backward to See Ahead: Learning with a Smaller System Analog, A Fishery Prototype Model
Since climate change is a global problem affecting the entire planet, there is little opportunity to experiment with global systems and try different possibilities. Fortunately, we do have historical results of the many experiences with resource systems that can shed light on potential difficulties that management may encounter with climate change. Both climate change and fisheries are common pool resources (CPR). In addition, both climate change, with atmospheric CO2 as a stock, and a fishery, with ocean fish stocks, can be modeled as a renewable resource where inflows and outflows need to be managed for long-term sustainability.
The advantages of examining a smaller, tightly coupled ecological, socio-economic system are: (1) it is easier to understand and communicate the essential decision-making and system structure; (2) we can examine some of the system dynamics that have made human decision-making problematic; and lastly, (3) we can examine the current state of global fisheries to inform global climate change management. In most cases, it is advantageous to examine similar situations and look at base rates of success so that we can have realistic expectations from the general cases to our specific problem area [19] (pp. 146-155).
4.1. A Stock and Flow Model: A Simple Fishery Prototype
A marine fishery is a managed geographic area that is essentially a tightly coupled ecological and socio-economic system. Economic systems are primarily focused on growth in order to achieve the best outcomes for society. However, ecological systems are inherently designed for balance, stability, and long-term sustainability. Since economic systems interface with natural systems to extract resources and to dispose of waste, there are many interdependencies between these systems and how the systems interact to ultimately determine long-term behavior.
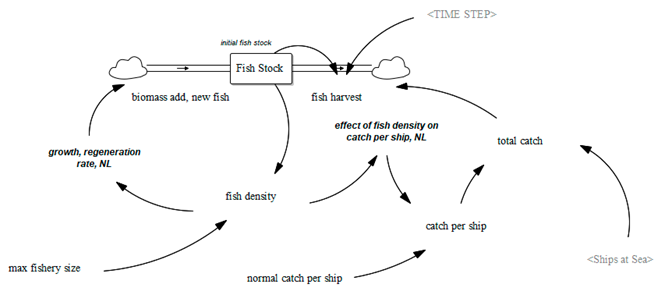
A stock and flow model based on [20] was used to examine some of the complexities of fishery management and to identify similarities with and to provide insights for climate change actions. Appendix A shows the stock and flow model and the interrelationships that drive the long-term behavior of the system. Appendix B lists the equations behind the simulation.
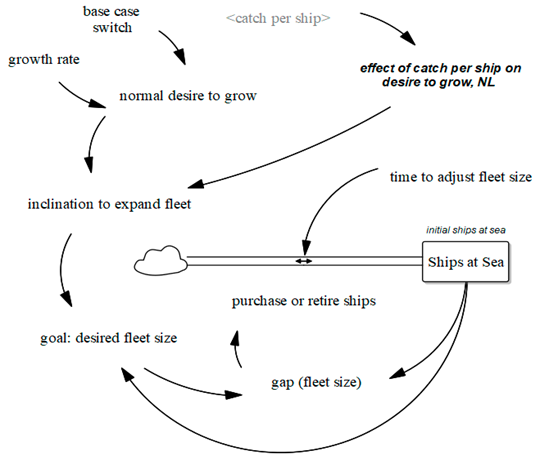
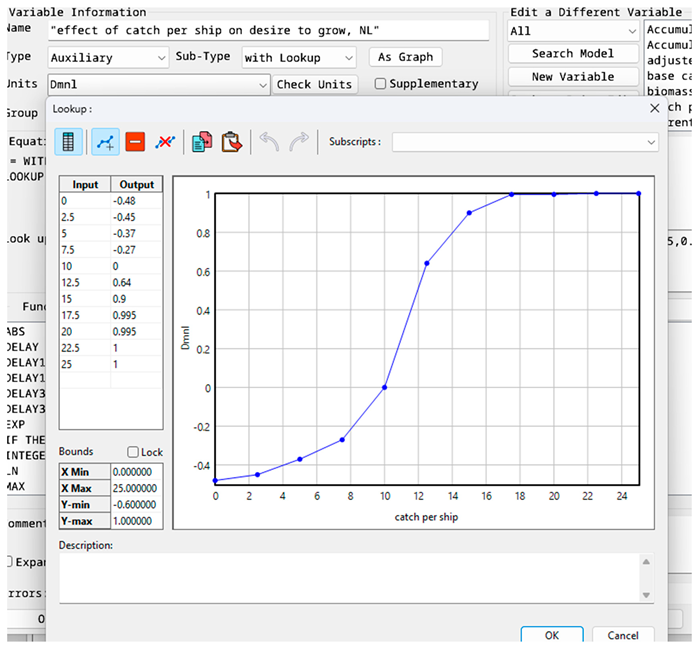
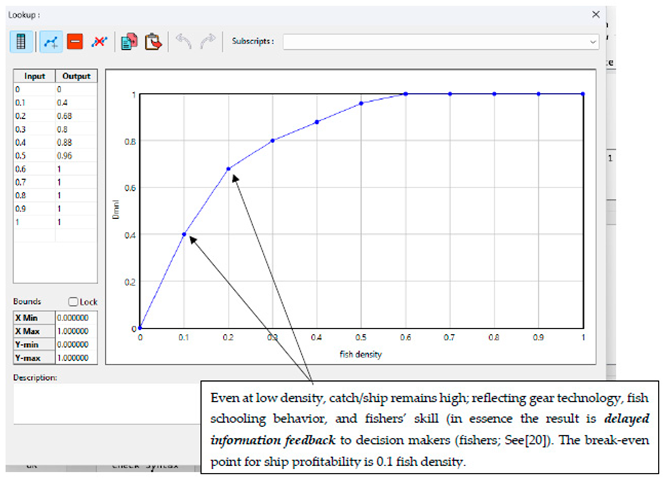
The first two views of the model, the Ecological view, and the Economics view, are strongly interlinked with one another and this interconnection gives rise to interesting dynamics. There are only two stocks involved, the “ships at sea” and the “fish stock.” Renewable resource systems such as timber or fish harvesting are sustainable if harvesting (outflow) does not exceed regeneration (inflow). In the Economics view of the simulation, fishers must decide when to add ships. Adding ships can be justified if it is efficient and profitable (i.e., revenue > expenses). Efficiency, measured as “catch per ship,” depends on the fish density. The variable “effect of fish density on catch per ship” has a nonlinear effect on catch efficiency (see Appendix B, equation 11 with graph). Essentially, if the fish stock level is sufficiently high then fish density is high and thus catch efficiency is high (catch per ship). When catch efficiency is high, fishing is profitable and there is incentive for fishers to add more ships. In the short term, profitability, output (catch), and implicitly, employment, all increase, meaning a positive effect.
The ability to maintain the fish stock at a reasonable level can ensure the long run sustainability of the fishery. The fishery prototype simulation used here assumes no competition. However, the actors in economic systems have incentives to maximize profits. The only major decision variable is the growth rate, how much the decision maker should push for business growth by adding ships.
5. Computer Simulation Results
5.1. Scenario 1: A Profitable Fishery with Low Growth Rates
An overly aggressive business or economic sector can send a renewable resources system to collapse if harvest rates (outflow) exceed the ability to regenerate the resource (inflow). However, we address the question of the impact of low growth rates on the fishery system. We run the fishery model with two scenarios to see how the model responds to a two percent (2%) growth incentive versus a three percent (3%) growth incentive.
Since business actors make decisions using metrics that take the time value of money into account, Figure 4 displays accumulated discounted profit over a 30-year time horizon. Additionally, Figure 5 shows yearly profit over 30 years.
As shown in the two graphs of profit, more aggressive actions to add capacity (ships) to the fishery result in greater profits and fishers are thus incentivized to seek higher growth. However, the short-term profits generated are deceiving because actions by fishers to generate profits can also lead to overharvesting of the resource. If the boats in the simulation were to mirror multiple fishing groups, each trying to maximize profits, then this is a typical tragedy of the commons result because of unconstrained growth against limits [21]. Regardless, even with no additional competition (all boats are operated by one fishing organization), a single fishing entity can still easily overharvest. In Figure 5, there is no evidence of overharvesting from feedback on profit for the 30-year period. This is what makes the renewable resource system (fishery) so difficult to manage. Catch rates and profits remain high and the status of the fish stock is hard to determine.
5.2. Scenario 2: Longer Timeframes, Profits and Resources
Figure 6 provides a clearer picture of long-term profit for these scenarios. Using the longer time frame a different and disastrous pattern emerges. Figure 7 shows the underlying impact and degradation of the fish stock under the three percent (3%) growth scenario. Unfortunately, this pattern of overharvesting a renewable resource (the fish stock) happens so often throughout history, that some researchers have concluded that resources are inevitably overexploited, often to the point of collapse or extinction [22].
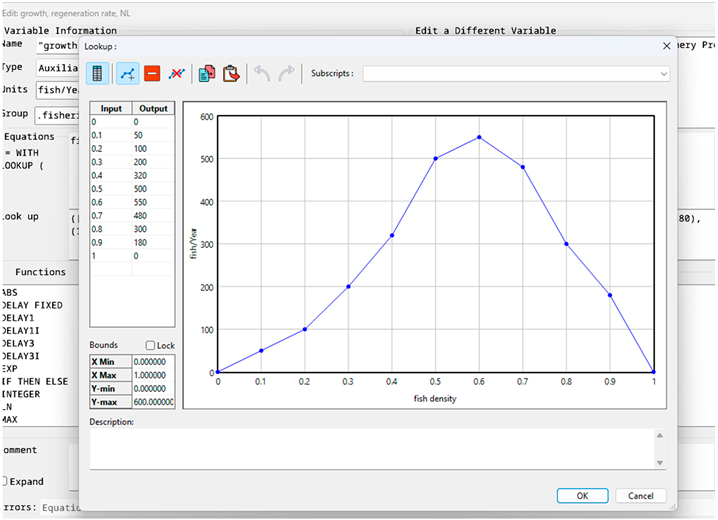
The degradation of the resource happens quietly in the background because there is inadequate feedback on the status of the Fish Stock. Interestingly, in year 38, profits remain fairly high while the stock has declined to a dangerous level. This is further described in Appendix B, in equation 11 for the variable "effect of fish density on catch per ship, NL,” and in equation 19 that shows the important nonlinear relationship between fish density and fish regeneration (variable = “growth, regeneration rate, NL”). The full effects of a stock crash from aggressive growth showing all of the important variables is detailed in Scenario 3 (see Appendix C).
Overall, fishers mainly rely on first-hand knowledge of catch rates (or catch per ship). Since catch per ship remains high even when the Fish Stock level is below optimal (below 0.5 density), fishers have no idea the Fish Stock is entering a phase of rapid decline (see Appendix B again, in particular equations 11 and 19 and graphs). In a managed fishery, convincing fishers to reduce fishing effort is difficult for fishery managers because fishers have visceral feedback (i.e., they can see the catch on their ship) and they must weigh that information against fishery scientists’ (abstract) information on Fish Stock status [20,23]. In decision environments where fishers can appeal to political powers, political officials are often reluctant to impose strict catch limits or other restrictions on a fishery due to economic harm to the community and loss of goodwill among voters.
5.3. Scenario 3: Growth in a Renewable Resource System Inevitably Generates a Crash
In the previous example, fishers were compelled to seek higher profits but the more aggressive growth at three percent (3%) generated a crash. However, even if a more cautious investment strategy is employed a crash is still inevitable when there is growth against a resource limit. Figure 8 shows the result of the more cautious investment at a 2% growth that still generates a resource crash when the timeframe is extended to sixty (60) years. A similar graph could be generated for 1% growth as well, with just a longer timeframe until the resource crashes.
6. From Fishery Prototypes to Global Climate Change Decisions
It is generally a wise strategy to examine the general class of problems to which the specific case belongs. The basic problem of global climate change refers to actions that harm a common pool resource. Climate change is caused by too much inflow of heat trapping gases to the atmosphere (stock) whereas a fishery is harmed by too much outflow (extraction) from the fishery (stock).
The prototype fishery simulation should serve as a cautionary analog or prototype for global climate change. In both cases, scientists need to convince the decision makers of the dangerous situation. In both cases, there is delayed information feedback. For example, adding CO2 into the atmosphere does not change the temperature or climate immediately because there are numerous buffers and delays in the global system. Decision delay in both cases can cause the underlying problem to worsen and eventually, as tipping points are crossed, lead to reinforcing feedback and to potential rapid declines and disasters. Table 1 overviews several selected fishery collapses. Typical problems that contributed to collapse include high natural system complexity and variability, over capitalized fisheries assisted by state subsidies, management delay and slow political decision-making, technology used as a tool to accelerate overfishing and harm to the ecosystem rather than solving the problem [24,25], and poor information feedback on the status of the environment to the decision makers.
6.1. Initiating Corrections and Rebuilding Fisheries: Lessons for Climate Change
The fact that a number of fisheries have completely collapsed draws attention to the numerous difficulties with managing a common pool resource. In particular, management and political delay combined with poor information feedback have led to disaster in some fisheries and these same conditions are found in the management of global climate change.
In terms of risk assessment, we have additional concerns with climate change. Most notably is the fact that we have continued to increase carbon dioxide emissions and global society must now make tremendous reductions in order to get in line with the Paris Agreement. Thus, the current status of global climate change more closely reflects the current need for rebuilding global fisheries. In a 2009 global assessment of marine fisheries, a study found that 63% of assessed fish stocks required rebuilding. Since then, a 2012 study reassessed and updated this to 68% of stocks have slipped below biomass targets for maximum sustainable yield and now require rebuilding [29]. This figure cannot be ignored. It represents the clearest picture of base rate success (32%) from a large sample of CPR systems.
Rebuilding fisheries requires sharp reductions in exploitation rates [30] and of course this means that there will be negative economic impacts in the short term, especially to local communities. Although significant short-term costs or reduced incomes are associated with rebuilding fisheries, there is the possibility of success with a proper strategy. A computer simulation of fishery rebuilding has demonstrated that both long term profitability and sustainability of the resource can be obtained by following a strict, precautionary policy [31]. The case of rebuilding a fishery follows a “worse before better” dynamic that is a common principle of complex systems [32].
Getting citizens to vote for political leaders who will promote policies that require some short-term sacrifice is a difficult task, especially in cultures dominated by a neoliberalism ideology. However, it is a necessary precondition to achieve good, long-term results.
6.2. Theory Blindness, Human Cognition, and Risk
The closed-minded orientation of those citizens who embrace a neoliberal ideology, results in solution aversion where individuals reject actions and new thinking because the solutions run counter to their fixed ideology [13]. Although proponents of environmental economics insist that we can implement environmental regulations, carbon pricing and other incentives to reduce our climate change impacts, the reality is that a significant proportion of citizens will resist any short-term costs despite evidence for potential long-term benefits.
Currently, a majority of citizens have been conditioned to hold a short termism thinking mode that has been reinforced in our culture through excessive consumerism, corporate propaganda, and political campaigning. Meanwhile climate scientists and the scientific community have urged global citizens to act on climate mitigation. What makes the scientific community assign a higher level of risk than the general public or business community? The answer to this question may be found in how humans reason and assess risk.
Our cognitive processes can be thought of as two kinds of reasoning: (1) system 1 is automatic thinking that takes place subconsciously and very quickly. This type of cognition uses associative memory and connects related concepts, images, and feelings. An interesting feature of system 1 cognition is that it is always available, and we are not aware of its influence on our thinking; (2) system 2 is our slow, deliberate thinking where we use logic, scientific reasoning, and where we consciously evaluate information and events, and can encode reality in abstract symbols, words, and numbers. An interesting feature of system 2 cognition is that it is lazy, and it is not always invoked in our thinking [19,33].
When decisions must be made quickly, our system 1 cognition makes use of heuristics, or mental short-cuts. Experts in a particular field often use heuristics effectively. Expert heuristics are developed based on many years of experience in a relatively narrow, non-random information feedback area, where they can match cues in the environment to reach good decisions [19] (p. 243). However, humans also arrive at decisions, often incorrectly, using heuristics (system 1 cognition) in domains where they have little expertise.
An additional type of mental lock-in centers on affective risk perception [23]. People not only make risk assessments based on what they think about a situation but also on how they feel about it [34]. In essence, people often make greater use of intuitive and automatic judgments (system 1 cognitive processing). Specifically, when individuals must make decisions where outcomes are visceral in nature, they produce strong feelings in the present moment, but those feelings are difficult, if not impossible, to recall or anticipate (Slovic et al. 2004). Thus, currently experienced visceral factors have a disproportionate impact on behavior. However, delayed visceral factors tend to be ignored or severely under-weighted in decision making [35] (p. 240).
In terms of climate change, use of intuitive, automatic modes of thinking would bias people to weigh immediate, short-term factors, such as economic survival and monetary rewards greater than longer-term rewards or costs. Climate change impacts are distant in time and space and would be weighted less or discounted in decision making. This is unfortunate because better economic outcomes result from both protecting renewable resources in general [31] and also from protecting our global common pool resources (oceans and atmosphere) from climate change [36]. Indeed, Stern [36] estimates that a failure to address climate change could cost up to 20% of global GDP.
Ultimately, climate change mitigation is not a politically partisan issue. It is important to all humans as it affects everyone. A strong business case can be made for stricter regulations that can appeal to all citizens including those with an individual/hierarchical worldview. A key factor is changing mental models of citizens to understand long-run dynamics and the win-win nature of a more balanced and precautionary approach to business through appropriate public policy [37].
7. Summary and Conclusions: Changing Mental Models
Lessons from history reveal that resources are relentlessly overexploited and often times result in complete collapse. Researchers have identified two major sources for this behavior: (1) wealth and its pursuit generates social and political support for its overdevelopment or mismanagement, and (2) an ability to optimize resource use is simply not achievable due to the overwhelming complexity and randomness of our complex biological and physical systems [22].
In this paper we first examine the basic structure of the interface between our business and economic environment and the natural world. The goals of our business world necessitate a drive for profitability, but our natural or ecological world demands a state of balance. Keeping a long-term interrelationship between these two systems requires strict limits placed on business activity. Fisheries management provides an analog and prototype model for the larger issue of global climate change mitigation. Historical data from fishery management further reveals a basic benchmark or base rate of success along with a number of cautionary examples of outright collapse. Ignoring base rates is a sign of optimistic bias and thinking inside your limited mental model [19].
Precaution is clearly needed in resource systems. The need to make dramatic reductions in CO2 output from our socio-economic activity is analogous to our current state of global overfishing.
Incremental changes made by the business sector will not allow global society to meet the goals of the Paris agreement. Changes to government policy are necessary to nudge business on a path to more substantial change. Such policies require the support and votes of citizens. Expecting meaningful progress without these fundamental changes is just wishful thinking.
Proper citizen mental models are integral for understanding the climate change problem and for taking swift action to reduce further global warming. Many citizen’ mental models exhibit two crucial shortcomings: (1) lack of understanding of complex system behavior and long-run dynamics, and (2) belief in the neoliberal ideology that views business regulations as harmful to their short-term financial interests (short-termism).
Changing mental models first requires adding information and education on system dynamics and system principles along with education on cognitive processing and decision making. This type of important information should be addressed in both our public-school systems and in higher education (Figure 1, box 2). Second, we need to address the improper communication of misinformation and propaganda that is distorting citizens’ thinking. Just as government regulation required the use of warnings on tobacco products because of harm to the public, a similar warning should accompany all advertisement and information from fossil fuel companies (Figure 1, box 5). Third, the use of public service media can be used to communicate the proper direction of our economy away from fossil fuel dependence and toward renewable energy (Figure 1, box 8).
Climate change involves a very large set of interacting complex systems with many decision points and a few potential high leverage points for intervention [4]. One avenue to understand this complexity is to prototype the climate system and interact with a computer simulation or gaming environment. Recent research evidence involving over 2,000 participants shows that the World Climate simulation, C-ROADS, is able to influence participants’ attitudes toward their sense of urgency about the problem and their intent to act. In fact, those participants who value the “individualism, hierarchical” world view made the greatest gains in changing their world view toward more support for climate action [38].
This paper has proposed a second avenue to help convince citizens of the urgency of taking action to reduce climate change impacts. Use of simple system dynamic models and fundamentals of cognitive processing can be used directly to educate the public about the need to incorporate effective information feedback on our natural world and climate system, and the need to nudge our socioeconomic system onto the proper path.
Conflicts of Interest
The authors declare no conflicts of interest.
Appendix A
Stock and Flow Model of a Simple Fishery (adapted from [20])
Ecological View
Economics (business) View
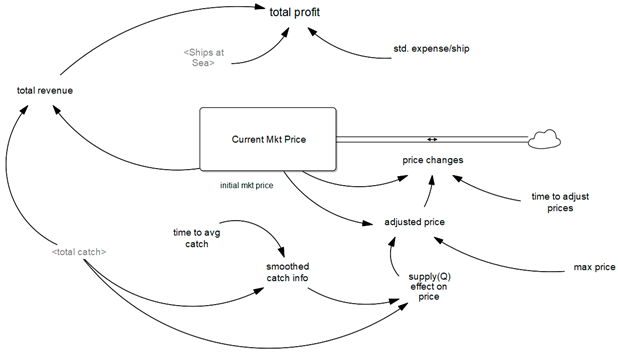
Appendix A. continued (Profit & Price)
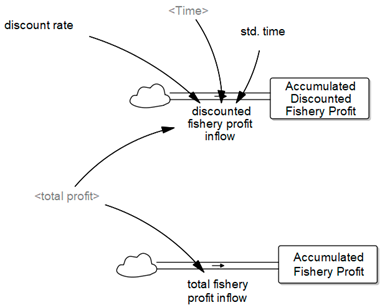
Long term Proft View
Appendix B
- Stock & Flow Equations
- (01) Accumulated Discounted Fishery Profit= INTEG (
- discounted fishery profit inflow,
- 0)
- Units: $
- (02) Accumulated Fishery Profit= INTEG (
- total fishery profit inflow,
- 0)
- Units: $
- (03) adjusted price=
- MIN(Current Mkt Price * "supply(Q) effect on price", max price)
- Units: $/fish
- Max price keeps the adjustment within a restricted zone of
- reasonable prices. Due to competition and substitute products,
- prices can only adjust so high. Outside market forces and
- competition will drive down the market price, especially with
- competition from Aquaculture.
- (04) base case switch=
- 1
- Units: Dmnl
- base case = 1, and we start the simulation with several vessels
- and then allow the investment to start at year 10. other cases =
- 0, when the switch is set to off, we allow investment from the
- start.
- (05) "biomass add, new fish"=
- "growth, regeneration rate, NL"
- Units: fish/Year
- (06) catch per ship=
- normal catch per ship * "effect of fish density on catch per ship, NL"
- Units: fish / ship / Year
- (07) Current Mkt Price= INTEG (
- price changes,
- initial mkt price)
- Units: $/fish
- (08) discount rate=
- 0.1
- Units: Dmnl
- 10% cost of capital, or discount rate.
- (09) discounted fishery profit inflow=
- total profit/(1+ discount rate)^(Time/"std. time")
- Units: $/Year
- (10) "effect of catch per ship on desire to grow, NL" = WITH LOOKUP (
- catch per ship,
- ([(0,-0.6)-(25,1)],(0,-0.48),(2.5,-0.45),(5,-0.37),(7.5,-0.27),(10,0),(12.5
- ,0.64),(15,0.9),(17.5,0.995),(20,0.995),(22.5
- ,1),(25,1) ))
- Units: Dmnl
-
- (11) "effect of fish density on catch per ship, NL" = WITH LOOKUP (
- fish density,
- ([(0,0)-(1,1)],(0,0),(0.1,0.4),(0.2,0.68),(0.3,0.8),(0.4,0.88),(0.5,0.96
- ),(0.6,1),(0.7,1),(0.8,1),(0.9,1),(1,1) ))
- Units: Dmnl
-
“… and shown below in graphic mode”
- (12) FINAL TIME = 40
- Units: Year
- The final time for the simulation.
- (13) fish density=
- Fish Stock / max fishery size
- Units: Dmnl
- (14) fish harvest=
- MIN(total catch, Fish Stock/TIME STEP)
- Units: fish/Year
- The fish harvest is equal to the computed catch. However, as the
- stock dwindles the biomass is reduced in a smoothed fashion.
- Similar to or based on, "all outflows require first order
- control," [17] (pp. 545-546). Generically, outflow =
- min (desired outflow, maximum outflow), where, maximum outflow =
- stock / minimum residence time.
- (15) Fish Stock= INTEG (
- "biomass add, new fish"-fish harvest,
- initial fish stock)
- Units: fish
- (16) "gap (fleet size)"=
- "goal: desired fleet size" - Ships at Sea
- Units: ships
- (17) "goal: desired fleet size"=
- Ships at Sea * (1 + inclination to expand fleet)
- Units: ships
- (18) growth rate=
- 0.1
- Units: fraction
- base rate = 10% rate of growth’ ... can be used for sensitivity
- analysis.
- (19) "growth, regeneration rate, NL" = WITH LOOKUP (
- fish density,
- ([(0,0)-(1,600)],(0,0),(0.1,50),(0.2,100),(0.3,200),(0.4,320),(0.5,500),
- (0.6,550),(0.7,480),(0.8,300),(0.9,180),(1,0) ))
- Units: fish/Year
-
“… and shown below in graphic mode.” Note: this also corresponds with the expected relationship between surplus production and biomass for the simple Schaefer biomass dynamic model [27] (p. 300).
- (20) inclination to expand fleet=
- normal desire to grow * "effect of catch per ship on desire to grow, NL"
- Units: Dmnl
- (21) initial fish stock=
- 3750
- Units: fish
- (22) initial mkt price=
- 200
- Units: $/fish
- (23) initial ships at sea=
- 10
- Units: ships
- (24) INITIAL TIME = 0
- Units: Year
- The initial time for the simulation.
- (25) max fishery size=
- 4000
- Units: fish
- (26) max price=
- 400
- Units: $/fish
- (27) normal catch per ship=
- 25
- Units: fish/ship/Year
- (28) normal desire to grow=
- IF THEN ELSE(base case switch, 0+STEP(growth rate, 11), growth rate)
- Units: fraction
- growth rate = 0.10 or 10% in the base case.
- (29) price changes=
- (adjusted price - Current Mkt Price)/time to adjust prices
- Units: $/fish/Year
- (30) purchase or retire ships=
- "gap (fleet size)" / time to adjust fleet size
- Units: ships / Year
- (31) SAVEPER =
- TIME STEP
- Units: Year [0,?]
- The frequency with which output is stored.
- (32) Ships at Sea= INTEG (
- purchase or retire ships,
- initial ships at sea)
- Units: ships
- (33) smoothed catch info=
- SMOOTHI(total catch, time to avg catch, total catch)
- Units: fish/Year
- (34) "std. expense/ship"=
- 2500
- Units: $/Year/ship
- (35) "std. time"=
- 1
- Units: Year
- (36) "supply(Q) effect on price" = WITH LOOKUP (
- total catch/smoothed catch info,
- ([(0.8,0.8)-(5,2)],(0.0366748,1.1),(0.268949,1.05),(0.525672,1.02),(1,1
- ),(1.50367,0.968421),(2.01711,0.947368),(2.02934,0.940351),(2.31051,0.933333
- ),(3,0.9),(4,0.89),(5,0.89) ))
- Units: Dmnl
- The supply effect on price is moderate. The market for fish is
- constrained by outside forces, substitutability, and other
- regional markets.\!Dmnl
- (37) TIME STEP = 1
- Units: Year [0,?]
- The time step for the simulation.
- (38) time to adjust fleet size=
- 1
- Units: Year
- (39) time to adjust prices=
- 1
- Units: Year
- (40) time to avg catch=
- 2
- Units: years
- (41) total catch=
- catch per ship * Ships at Sea
- Units: fish / Year
- (42) total fishery profit inflow=
- total profit
- Units: $/Year
- (43) total profit=
- total revenue - ("std. expense/ship" * Ships at Sea)
- Units: $/Year
- (44) total revenue=
- total catch * Current Mkt Price
- Units: $/Year
Appendix C. A Fishery Collapse from Aggressive Growth, 15% growth
Appendix C, Figure C1.
An Unregulated Fishery Collapse, Aggressive Growth Rate, 15%.
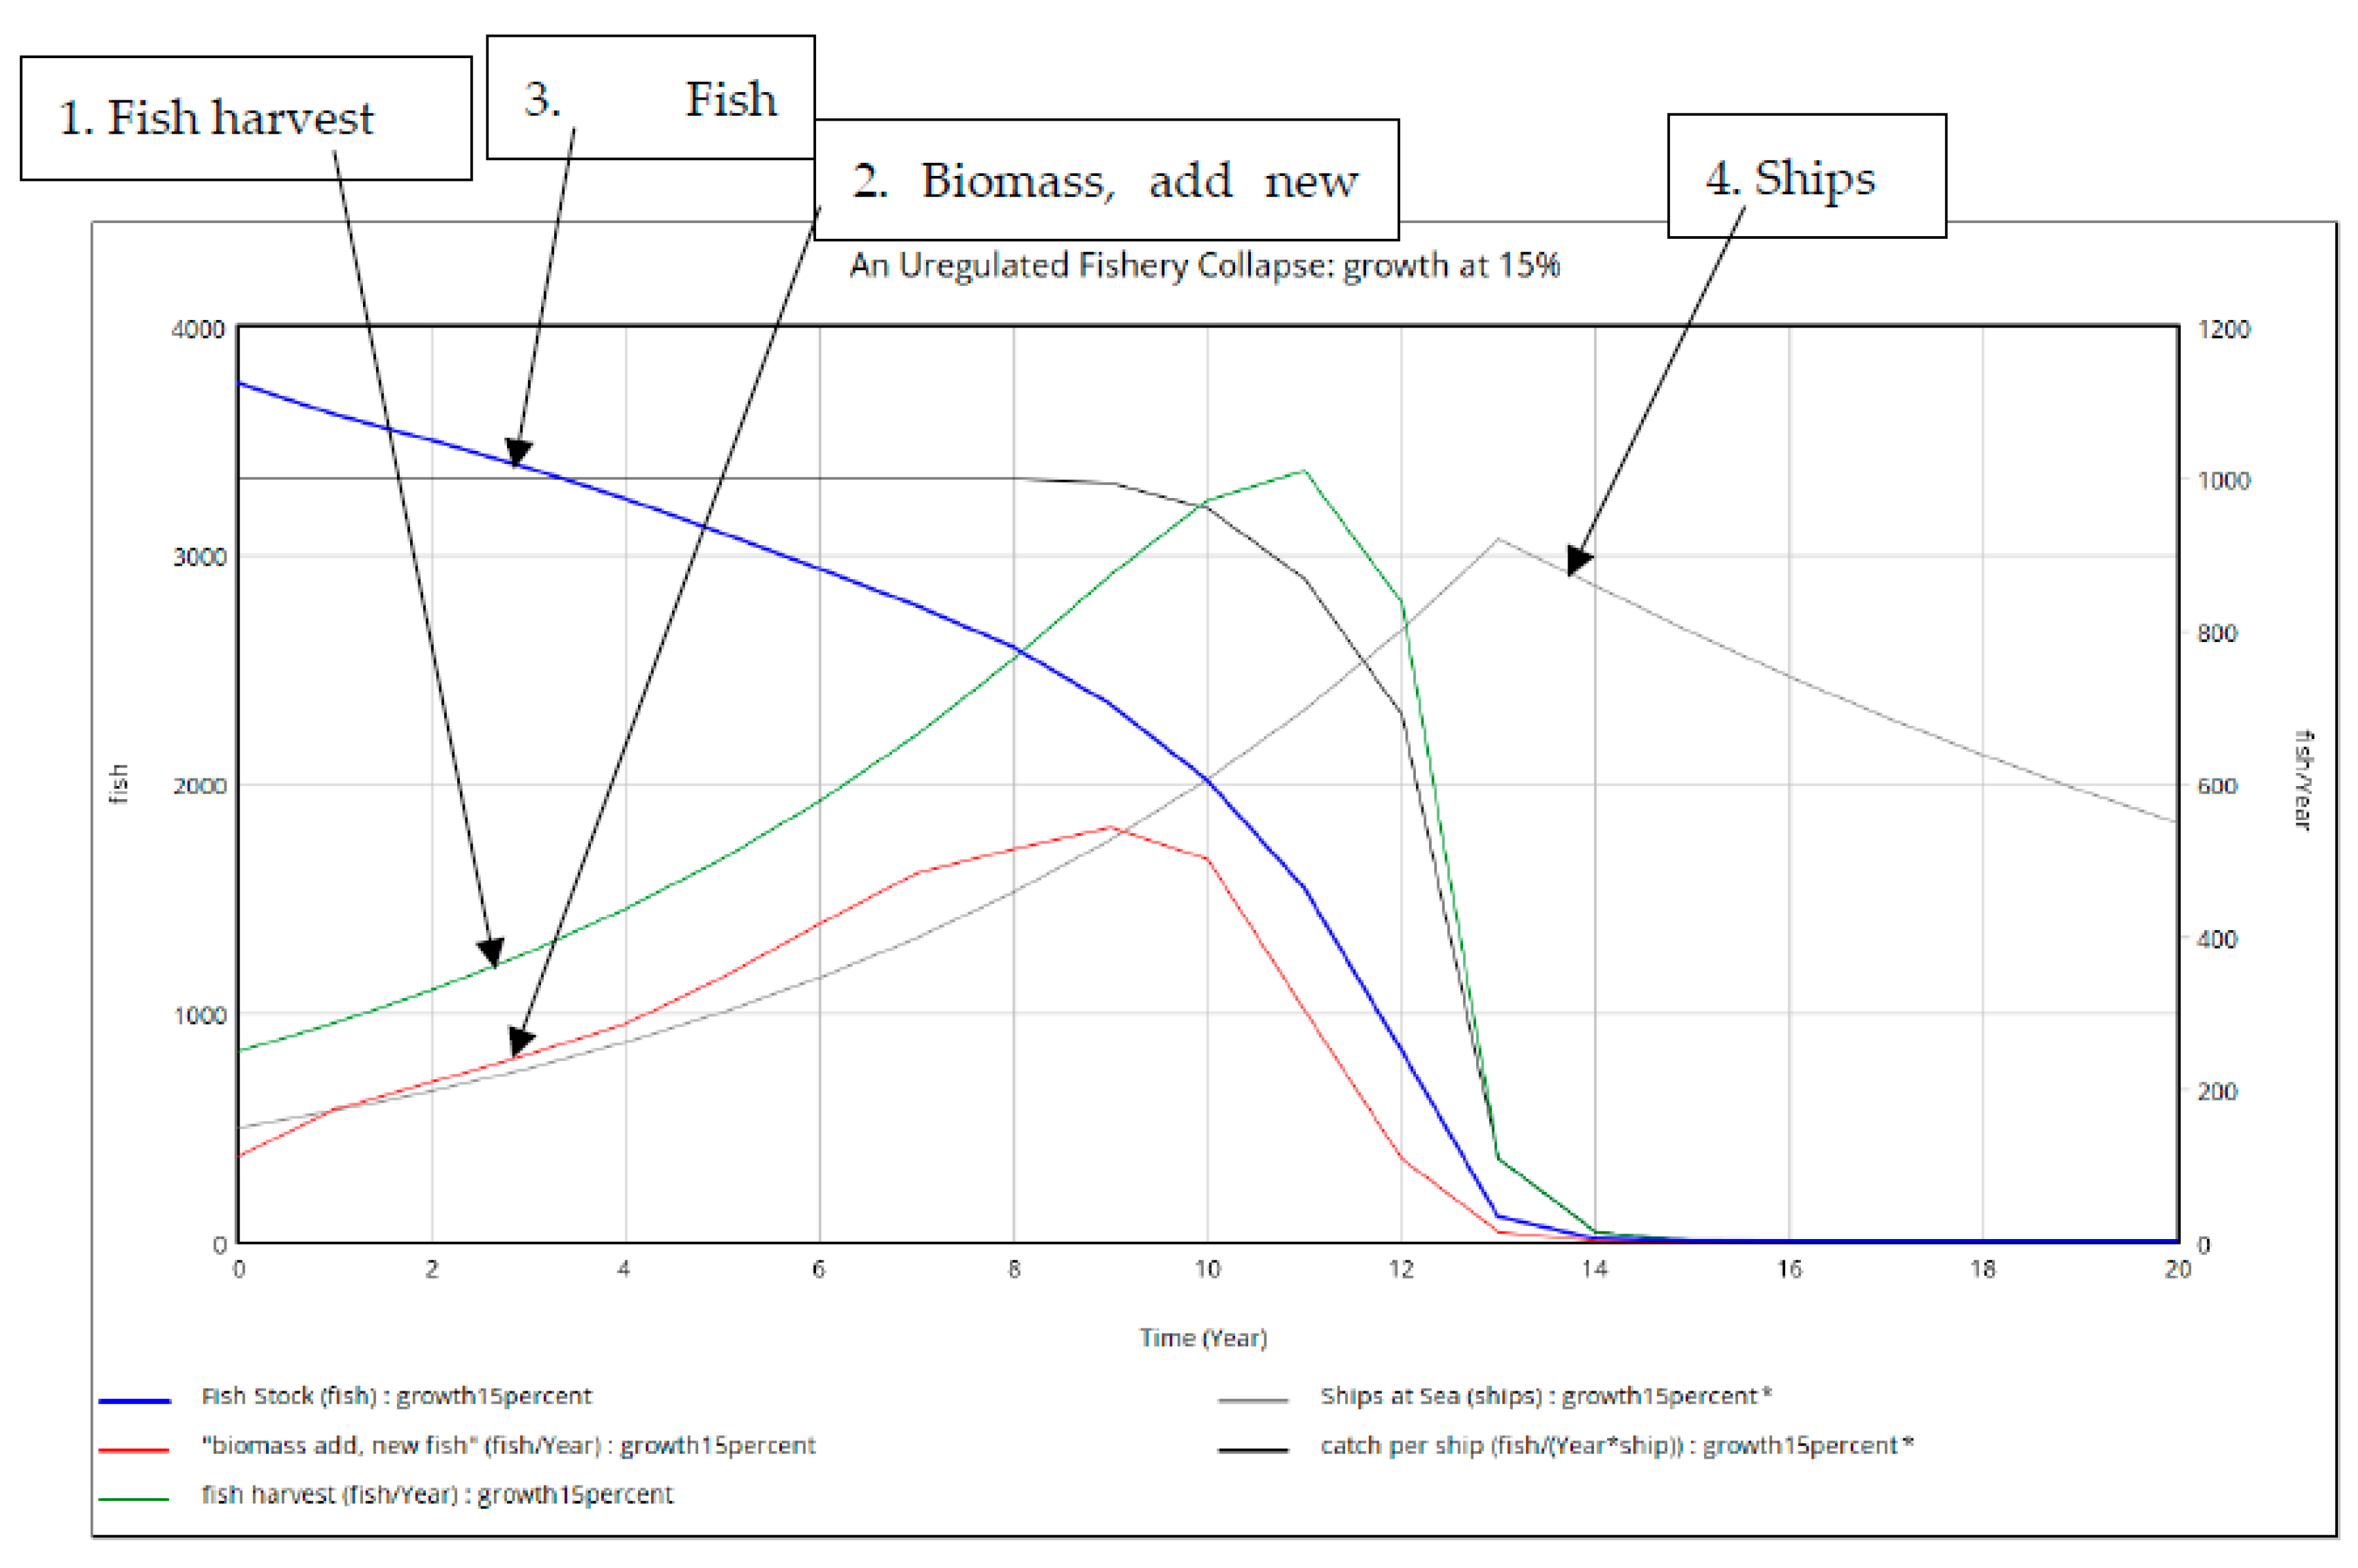
Additional Behavior Mode: An Aggressive Growth Rate, 15%
Once the stock level declines to a point where the fish density is below 0.5 (in Appendix B, equation 19), this leads to a lower inflow to the Fish Stock. If the inflow to the Fish Stock falls below the outflow (fish harvest) then this leads to a further decrease in Fish Stock and fish density, which then leads back to a lower Fish Stock. Once the tipping point is reached and the reinforcing feedback loop is triggered, the stock decline can happen very quickly.
Additional Details: This simulation run begins with ten (10) ships. In year 6, the fishery grew to twenty-three (23) ships and in year 12 there were fifty-three (53) ships. An aggressive growth strategy adds ships (capacity) too quickly and it results in too high of a fish harvest. The fish harvest (outflow from the Fish Stock) exceeds the addition of new fish (inflow to the Fish Stock). Since outflow exceeds inflow, the Fish Stock declines and then collapses. (this scenario closely mirrors Morecroft’s [20] base case crash). Ships are added even as the collapse is evident. This is due to a delay in feedback on stock status and delay in implementation.
References
- Stoddard, I.; Anderson, K.; Capstick, S.; Carton, W.; Depledge, J.; Facer, K.; Gough, C.; Hache, F.; Hoolohan, C.; Hultman; et al. Three decades of climate mitigation: Why haven’t we bent the global emissions curve? Annu Rev Env Resour 2021, 46, 653–689. [Google Scholar] [CrossRef]
- United Nations Paris Agreement 2015. Available online: https://unfccc.int/process-and-meetings/the-paris-agreement/the-paris-agreement (accessed on 11 December 2023).
- UNFCC United Nations Framework on Climate Change. Available online: https://unfccc.int/process-and-meetings/the-paris-agreement. (accessed on 12 December 2023).
- Otto, I.O.; Donges, J.F.; Cremades, R.; Bhowmik, A.; Hewitt, R.J.; Lucht, W.; Rockström, J.; Allerberger, F.; McCaffrey, M.; Doe, S.S.P.; et al. Social tipping dynamics for stabilizing Earth’s climate by 2050. PNAS 2020, 117, 2354–2365. [Google Scholar] [CrossRef] [PubMed]
- Figureres, C.; Schellnhuber, H.J.; Whiteman, G.; Rockstrom, J.; Hobley, A.; Rahmstorf, S. Three years to safeguard our climate. Nature 2017, 546, 593–595. [Google Scholar] [CrossRef] [PubMed]
- Global Change Data Lab. 2023. Available online: https://ourworldindata.org/co2-emissions (accessed on 14 December 2023).
- Mann, M. The new climate war: The fight to take back our planet; Hachette Book Group, Inc.: New York, NY, USA, 2021. [Google Scholar]
- Oreskes, N.; Conway, E. Merchants of doubt: How a handful of scientists obscured the truth on issues from tobacco smoke to global warming; Bloomsbury Press: New York, NY, USA, 2010. [Google Scholar]
- Craik, K.J.W. The nature of explanation; Cambridge University Press: Cambridge, UK, 1943. [Google Scholar]
- Jones, N.A.; Ross, H.; Lynam, T.; Perez, P.; Leitch, A. Mental models: An interdisciplinary synthesis of theory and methods. Ecol. Soc. 2011, 16, 46. [Google Scholar] [CrossRef]
- Garrity, E.J. Using systems thinking to understand and enlarge mental models: Helping the transition to a sustainable world. Systems 2018, 6, 15. [Google Scholar] [CrossRef]
- Steger, M.B.; Roy, R.K. Neoliberalism: A very short introduction; Oxford University Press: Oxford, UK, 2010. [Google Scholar]
- Campbell, T.H.; Kay, A.C. Solution aversion: On the relation between ideology and motivated disbelief. J. Personal. Soc. Psychol. 2014, 107, 809–824. [Google Scholar] [CrossRef]
- Douglas, M.; Wildavsky, A.B. Risk and culture: An essay on the selection of technical and environmental dangers; University of California Press: Berkeley, USA, 1982. [Google Scholar]
- Kahan, D.M.; Wittlin, M.; Peters, E.; Slovic, P.; Ouellette, L.L.; Braman, D.; Mandel, G.N. The tragedy of the risk perception commons: Culture conflict, rationality conflict, and climate change. Temple University Legal Studies Research Paper no. 2011-26, Cultural Cognition Project Working Paper No. 89. Available online: https://papers.ssrn.com/sol3/Papers.cfm?abstract_id=1871503 (accessed on 11 November 2023).
- Sterman, J.D. Learning in and about complex systems. Syst.Dyn. Rev. 1994, 10, 291–330. [Google Scholar] [CrossRef]
- Sterman, J.D. Business dynamics: Systems thinking and modeling for a complex world; Irwin/McGraw-Hill: Boston, USA, 2000. [Google Scholar]
- McKay, D.I.A.; Stall, A.; Abrams, J.F.; Winkelmann, R.; Sakschewski, B.; Loriani, S.; Fetzer, I.; Cornell, S.E.; Rockstrom, J.; Lenton, T.M. Exceeding 1.5°C global warming could trigger multiple climate tipping points. Science 2022, 377, eabn7950. [Google Scholar] [CrossRef]
- Kahneman, D. Thinking, fast and slow; Farrar, Straus, and Giroux: New York, USA, 2011. [Google Scholar]
- Morecroft, J. Strategic modeling and business dynamics: A feedback systems approach; John Wiley & Sons: West Sussex, UK, 2015. [Google Scholar]
- Hardin, G. Tragedy of the commons. Science 1968, 162, 1243–1248. [Google Scholar] [CrossRef]
- Ludwig, D.; Hilborn, R.; Walters, C. Uncertainty, resource exploitation, and conservation: Lessons from history. Science 1993, 260, 17–36. [Google Scholar] [CrossRef]
- Garrity, E.J. Individual transferable quotas (ITQ), rebuilding fisheries and short-termism: How biased reasoning impacts management. Systems 2020, 8, 7. [Google Scholar] [CrossRef]
- Palomares, M.L.D.; Pauly, D. On the creeping increase of vessels’ fishing power. Ecol. Soc. 2019, 24, 31. [Google Scholar] [CrossRef]
- Wikipedia. Collapse the Atlantic northwest Cod fishery. Available online: https://en.wikipedia.org/wiki/Collapse_of_the_Atlantic_northwest_cod_fishery (accessed on 21 December 2023).
- Ferguson-Cradler, G. Fisheries’ collapse and the making of a global event, 1950s–1970s. J. Glob. Hist. 2018, 13, 399–424. [Google Scholar] [CrossRef]
- Hilborn, R.; Walters, C.J. Quantitative fisheries stock assessment: Choice, dynamics, & Uncertainty; Kluwer Academic Publishers: Boston, USA, 2001; pp. 18–21. [Google Scholar]
- Dickey-Collas, M.; Nash, R.D.M.; Brunel, T.; van Damme, C.J.G.; Marshall, T.; Payne, M.R.; Corten, A.; Geffen, A.J.; Peck, M.A.; Hatfield, E.M.C.; et al. Lessons learned from stock collapse and recovery of North Sea herring: A review. ICES J. Mar. Sci. 2010, 67, 1875–1886. [Google Scholar] [CrossRef]
- Costello, C.; Ovando, D.; Clavelle, T.; Strauss, C.K.; Hilborn, R.; Melnychuk, M.C.; Branch, T.A.; Gaines, S.D.; Szuwalski, C.S.; Cabral, R.B.; et al. Global fishery prospects under contrasting management regimes. Proc. Natl. Acad. Sci. USA 2016, 113, 5125–5129. [Google Scholar] [CrossRef] [PubMed]
- Worm, B. Averting a global fisheries disaster. Proc. Natl. Acad. Sci. USA 2016, 113, 4895–4897. [Google Scholar] [CrossRef]
- Garrity, E.J. System dynamics modeling of individual transferrable quota fisheries and suggestions for rebuilding stocks. Sustainability 2011, 3, 184–215. [Google Scholar] [CrossRef]
- Forrester, J. System dynamics -the next fifty years. Syst. Dyn. Rev. 2007, 23, 345–358. [Google Scholar] [CrossRef]
- Kahneman, D. Maps of bounded rationality: Psychology for behavioral economics. Am. Econ. Rev. 2003, 93, 1449–1475. [Google Scholar] [CrossRef]
- Slovic, P.; Finucane, M.L.; Peters, E.; MacGregor, D.G. Risk as analysis and risk as feelings: Some thoughts about affect, reason, risk, and rationality. Risk Anal. 2004, 2, 311–322. [Google Scholar] [CrossRef]
- Lowenstein, G.F. A visceral account of addiction. In Getting Hooked: Rationality and Addiction; Elster, J., Skog, O., Eds.; Cambridge University Press: London, UK, 1999; pp. 235–264. [Google Scholar]
- Stern, N. The economics of climate change – the Stern review; Cambridge University Press: Cambridge, UK, 2007. [Google Scholar]
- Garrity, E.J. Transforming Business Education: It’s about Time: A Systems Perspective on Incorporating Climate Change, Sustainability, and the Care for Our Common Future. J. Manag. Glob. Sustain. 2022, 10, 3. Available online: https://archium.ateneo.edu/jmgs/vol10/iss2/3 (accessed on 23 December 2023).
- Rooney-Varga, J.N.; Hensel, M.; McCarthy, C.; McNeal, K.; Norfles, N.; Rath, K.; Schnell, A.H.; Sterman, J.D. Building Consensus for Ambitious Climate Action through the World Climate Simulation. Earth’s Future 2021, 9, e2021EF002. [Google Scholar] [CrossRef]
Figure 1.
High-level climate change system components (bold lines indicate strong connections, dotted line box indicates proposed addition).
Figure 1.
High-level climate change system components (bold lines indicate strong connections, dotted line box indicates proposed addition).
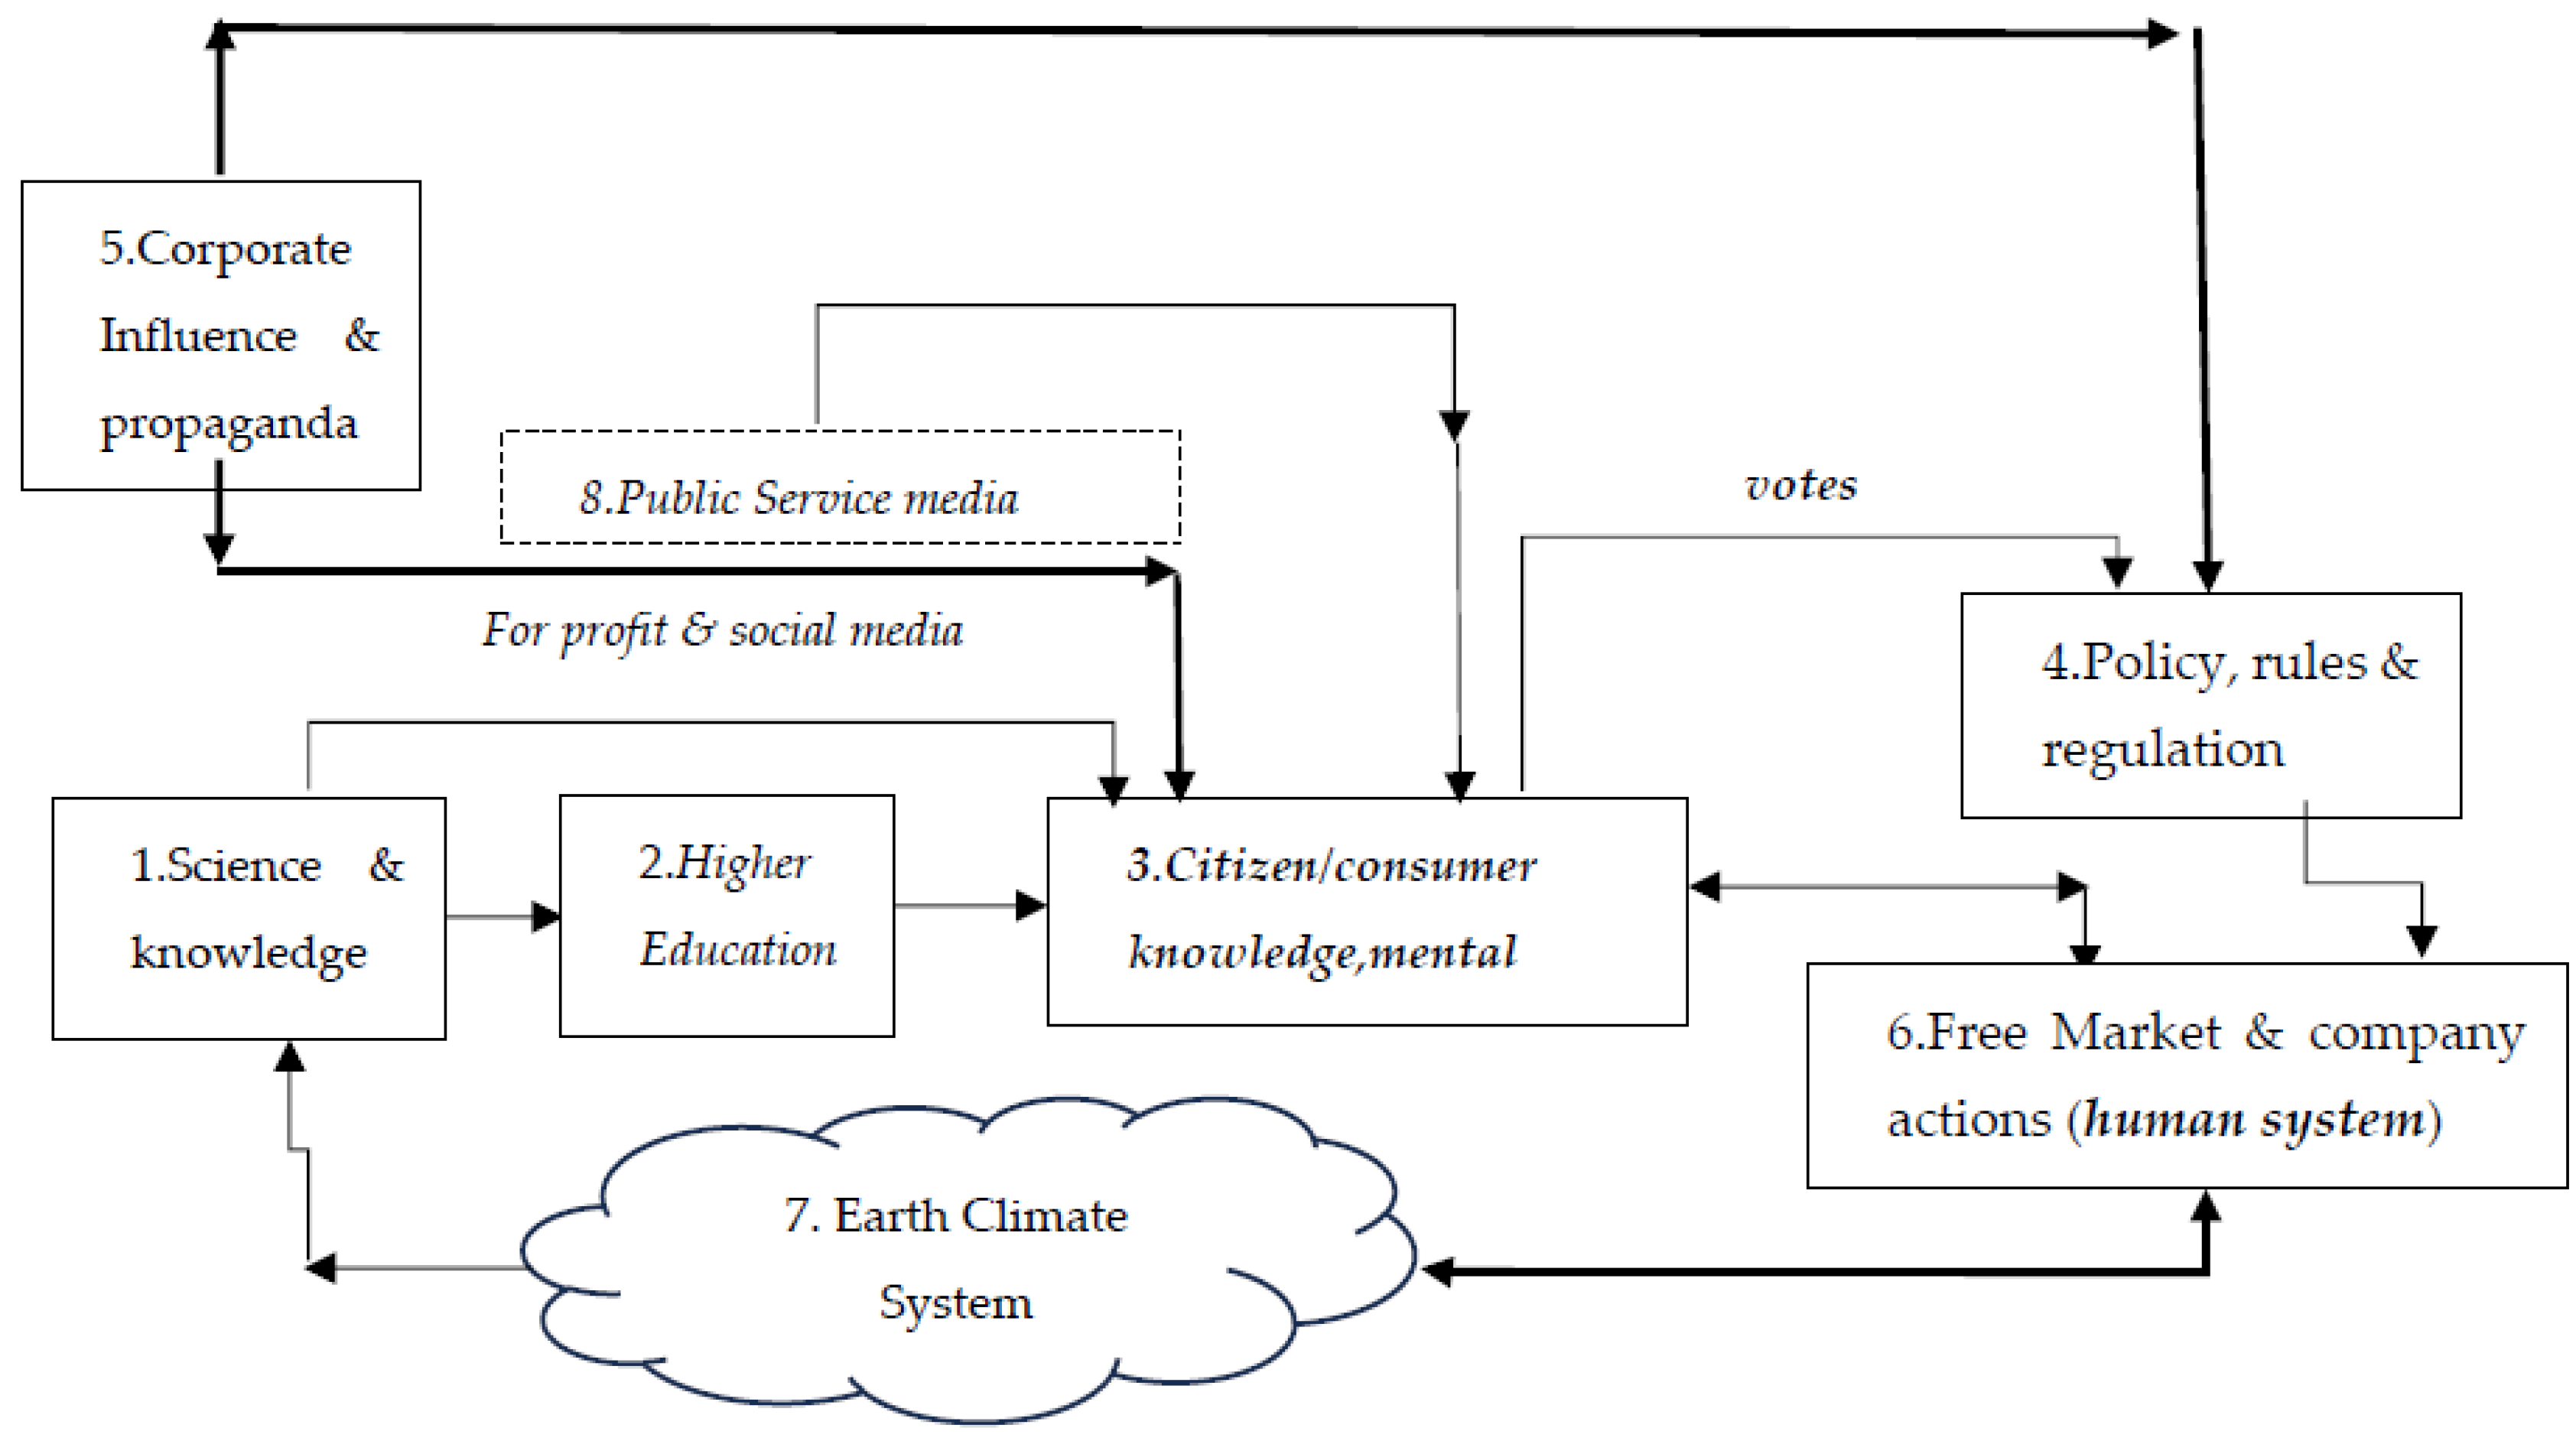
Figure 2.
Stock and Flow Examples.
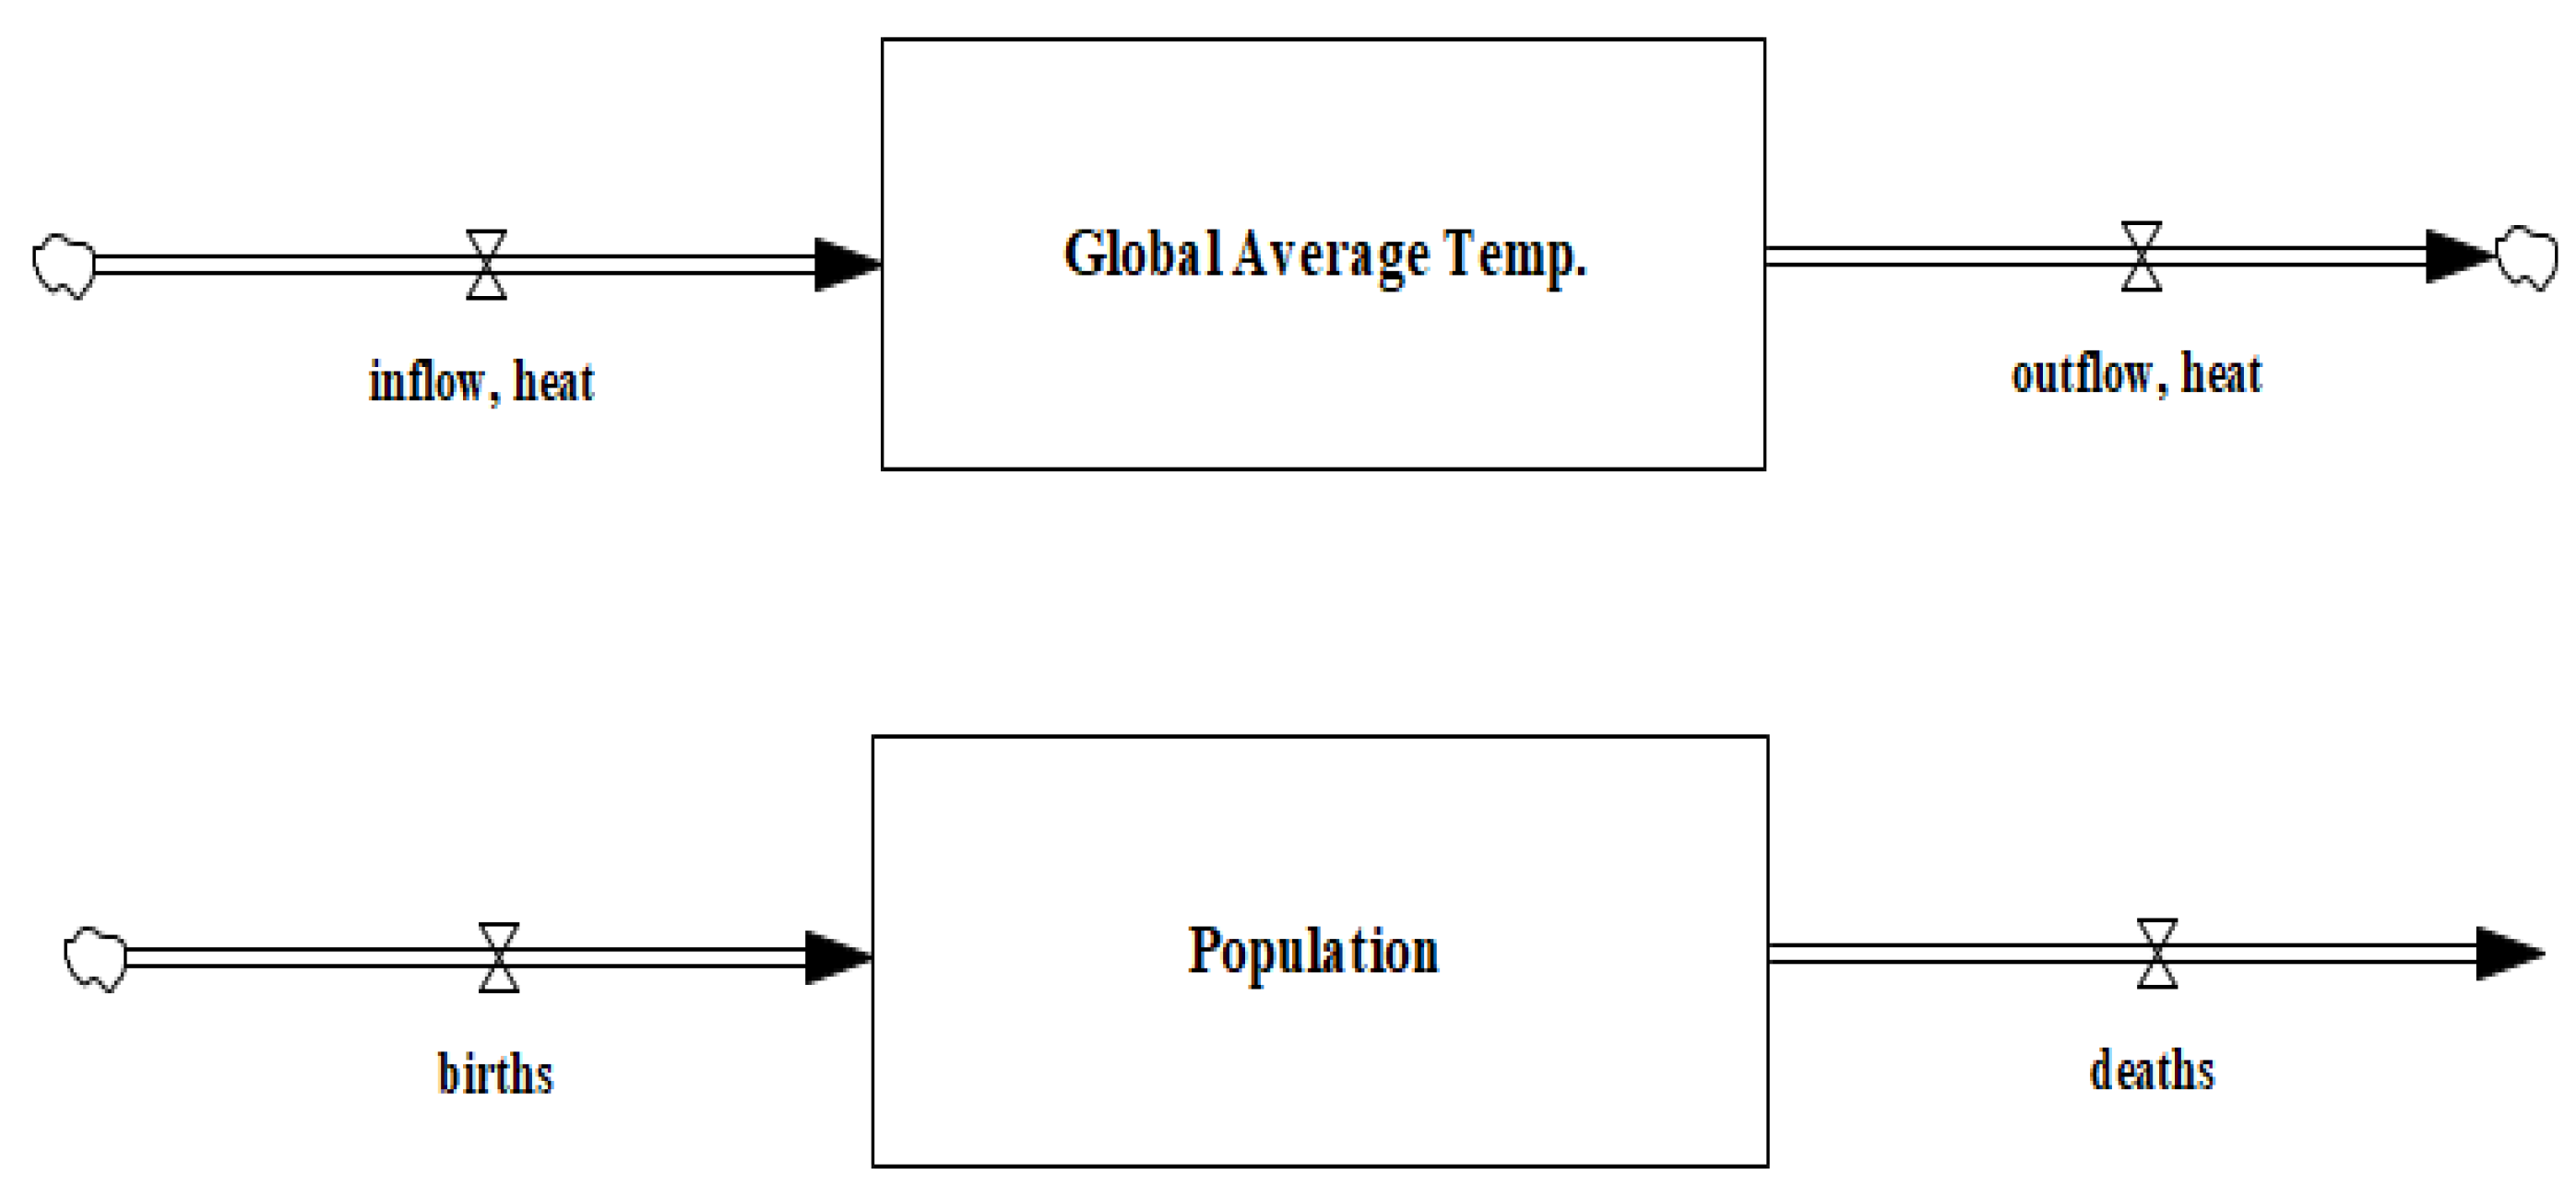
Figure 3.
Stock and Flow Example of Reinforcing Feedback with Climate System.
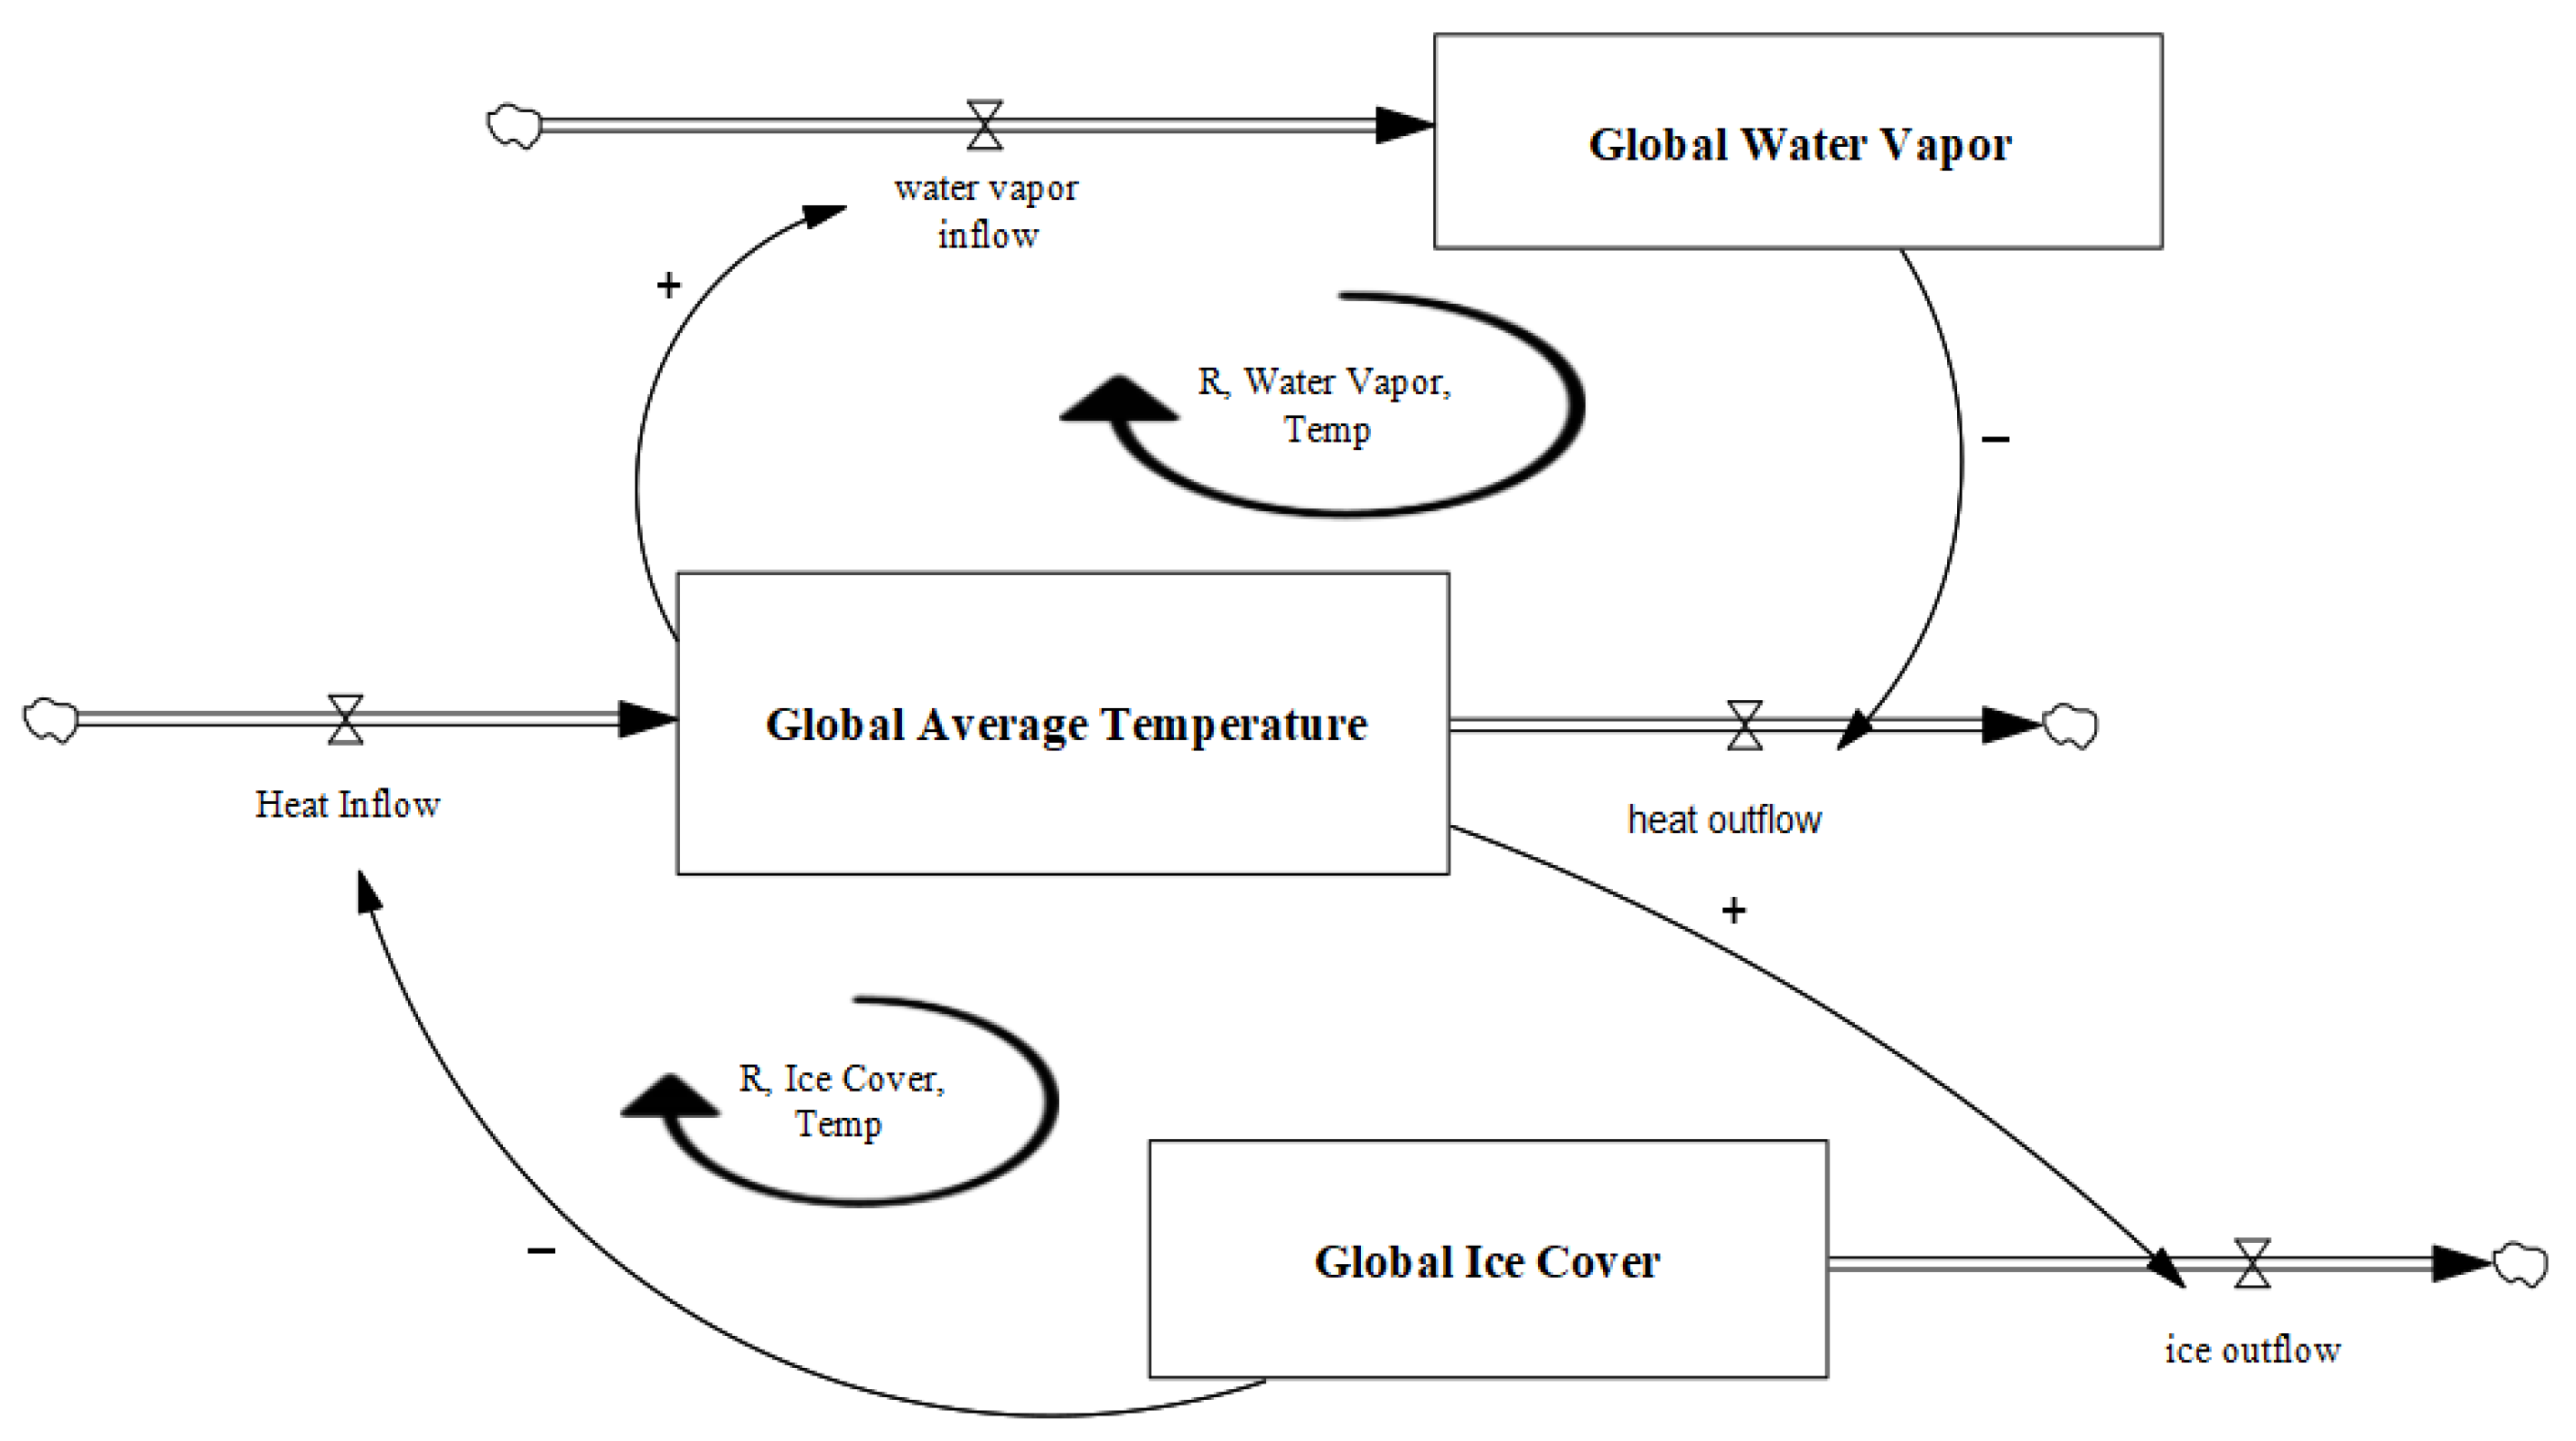
Figure 4.
Comparing 2% versus 3% growth on Accumulated Discounted Profit over 30 years.
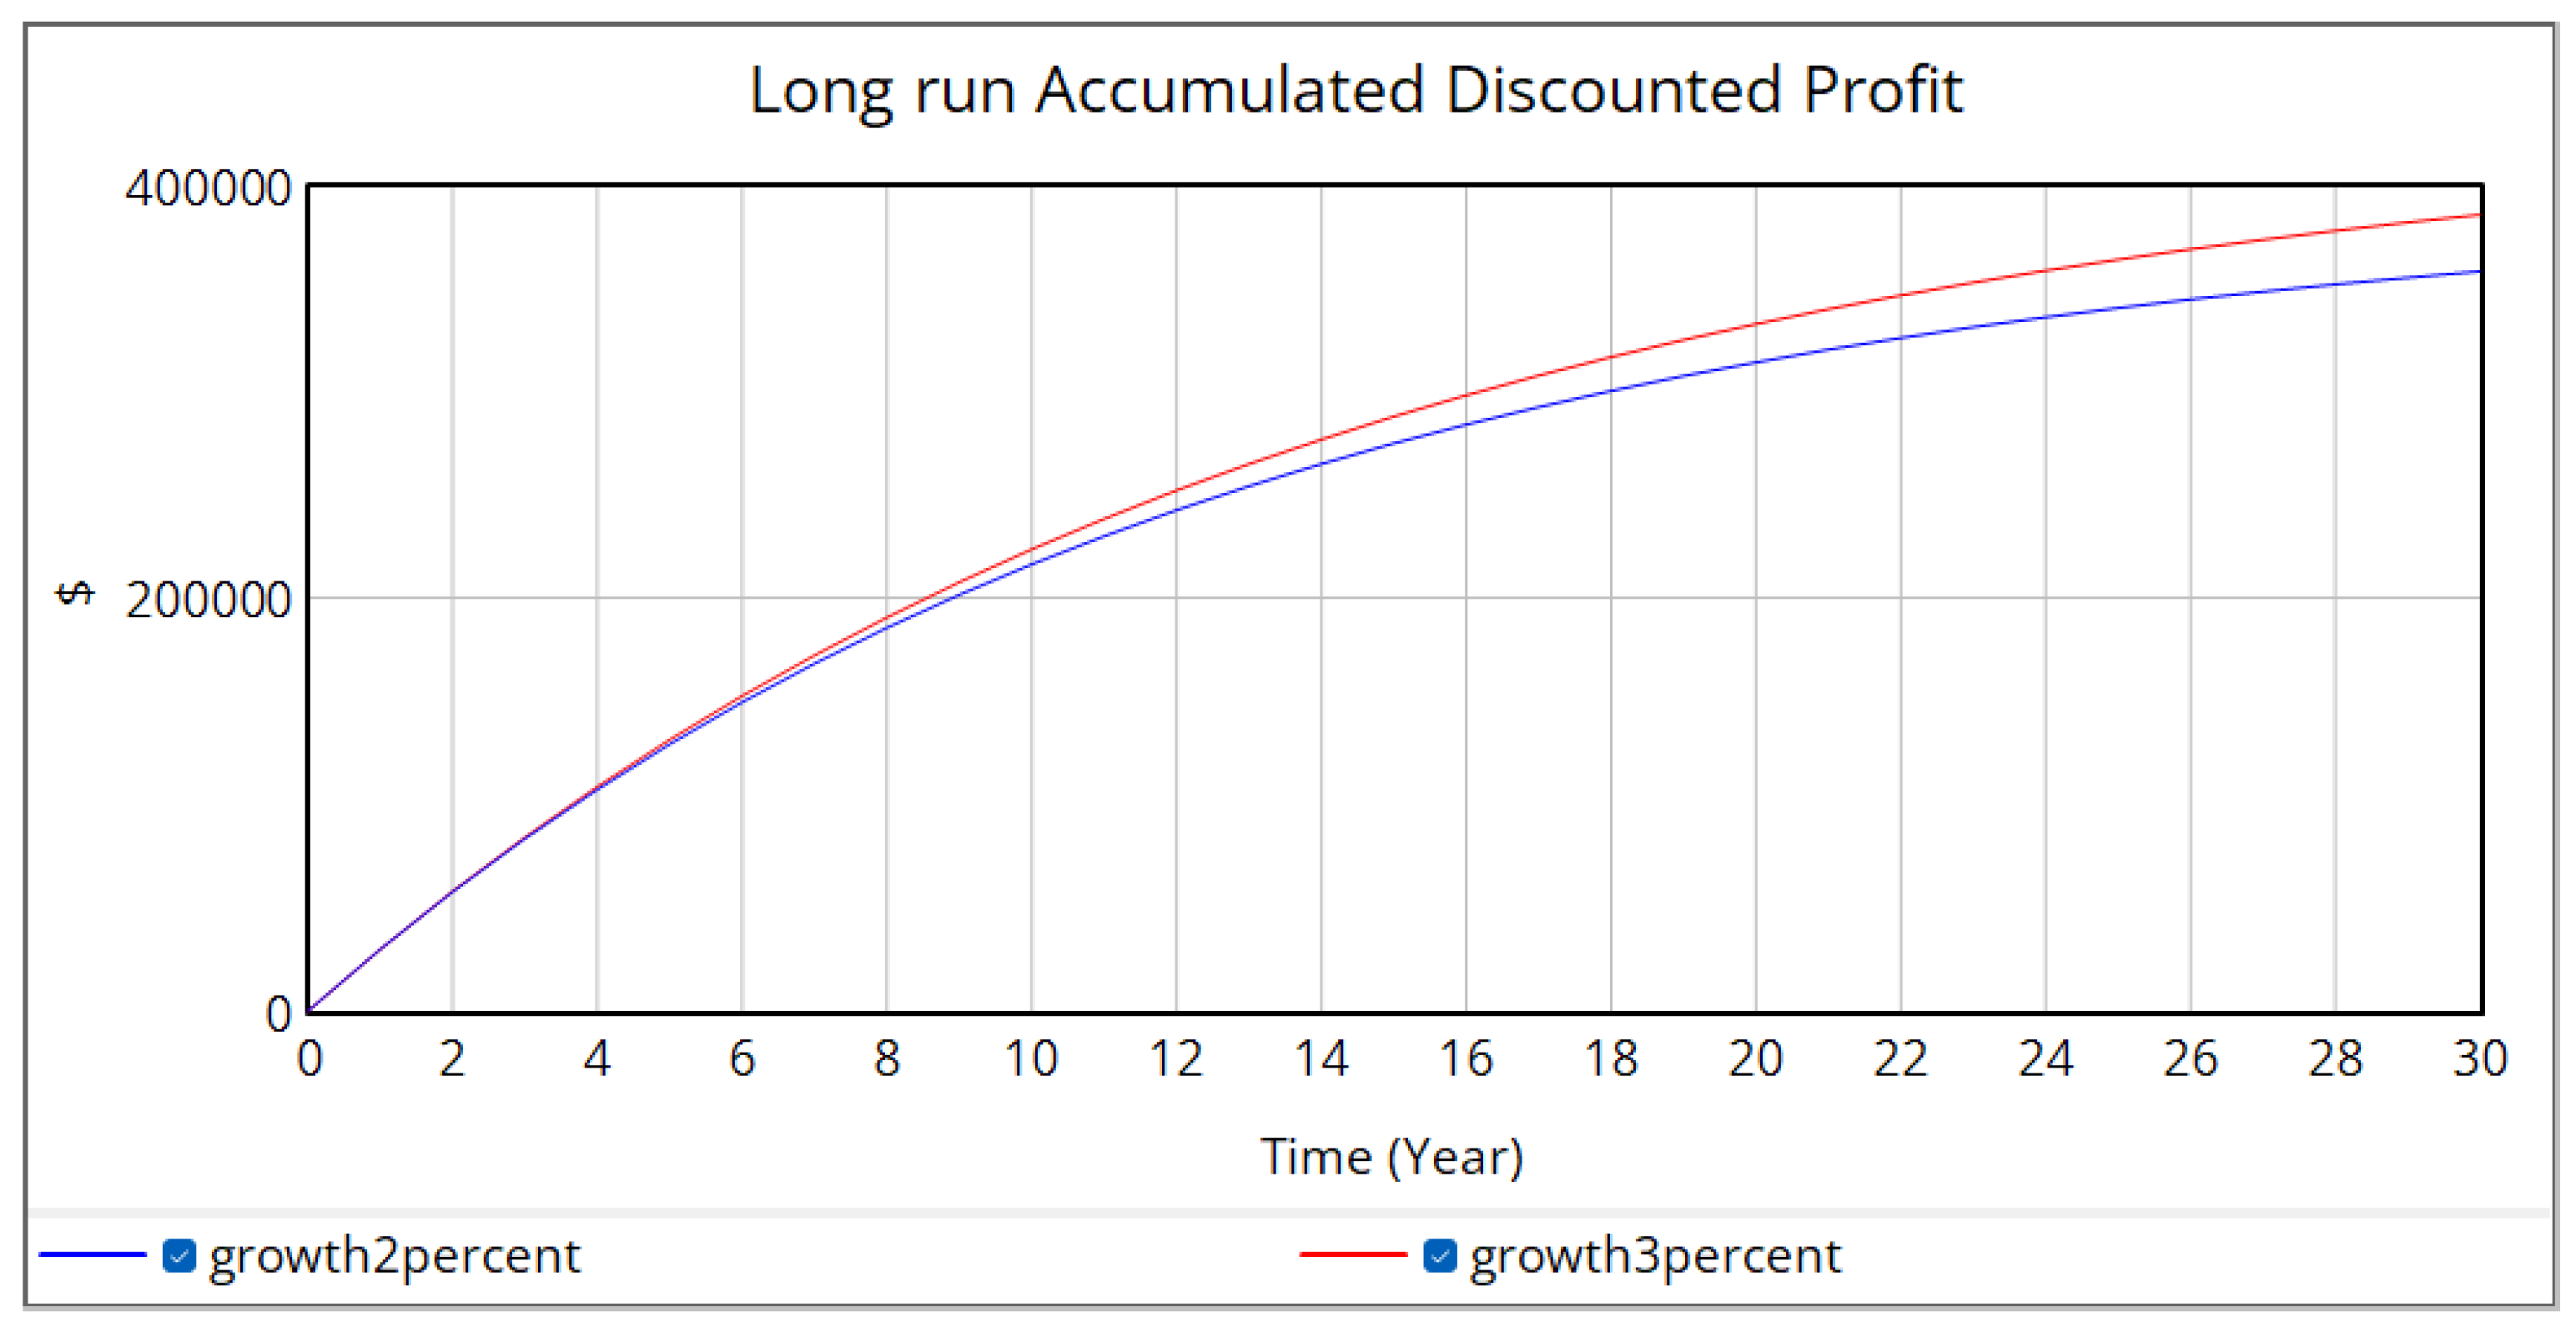
Figure 5.
Comparing 2% versus 3% growth on Yearly Profit over 30 years.
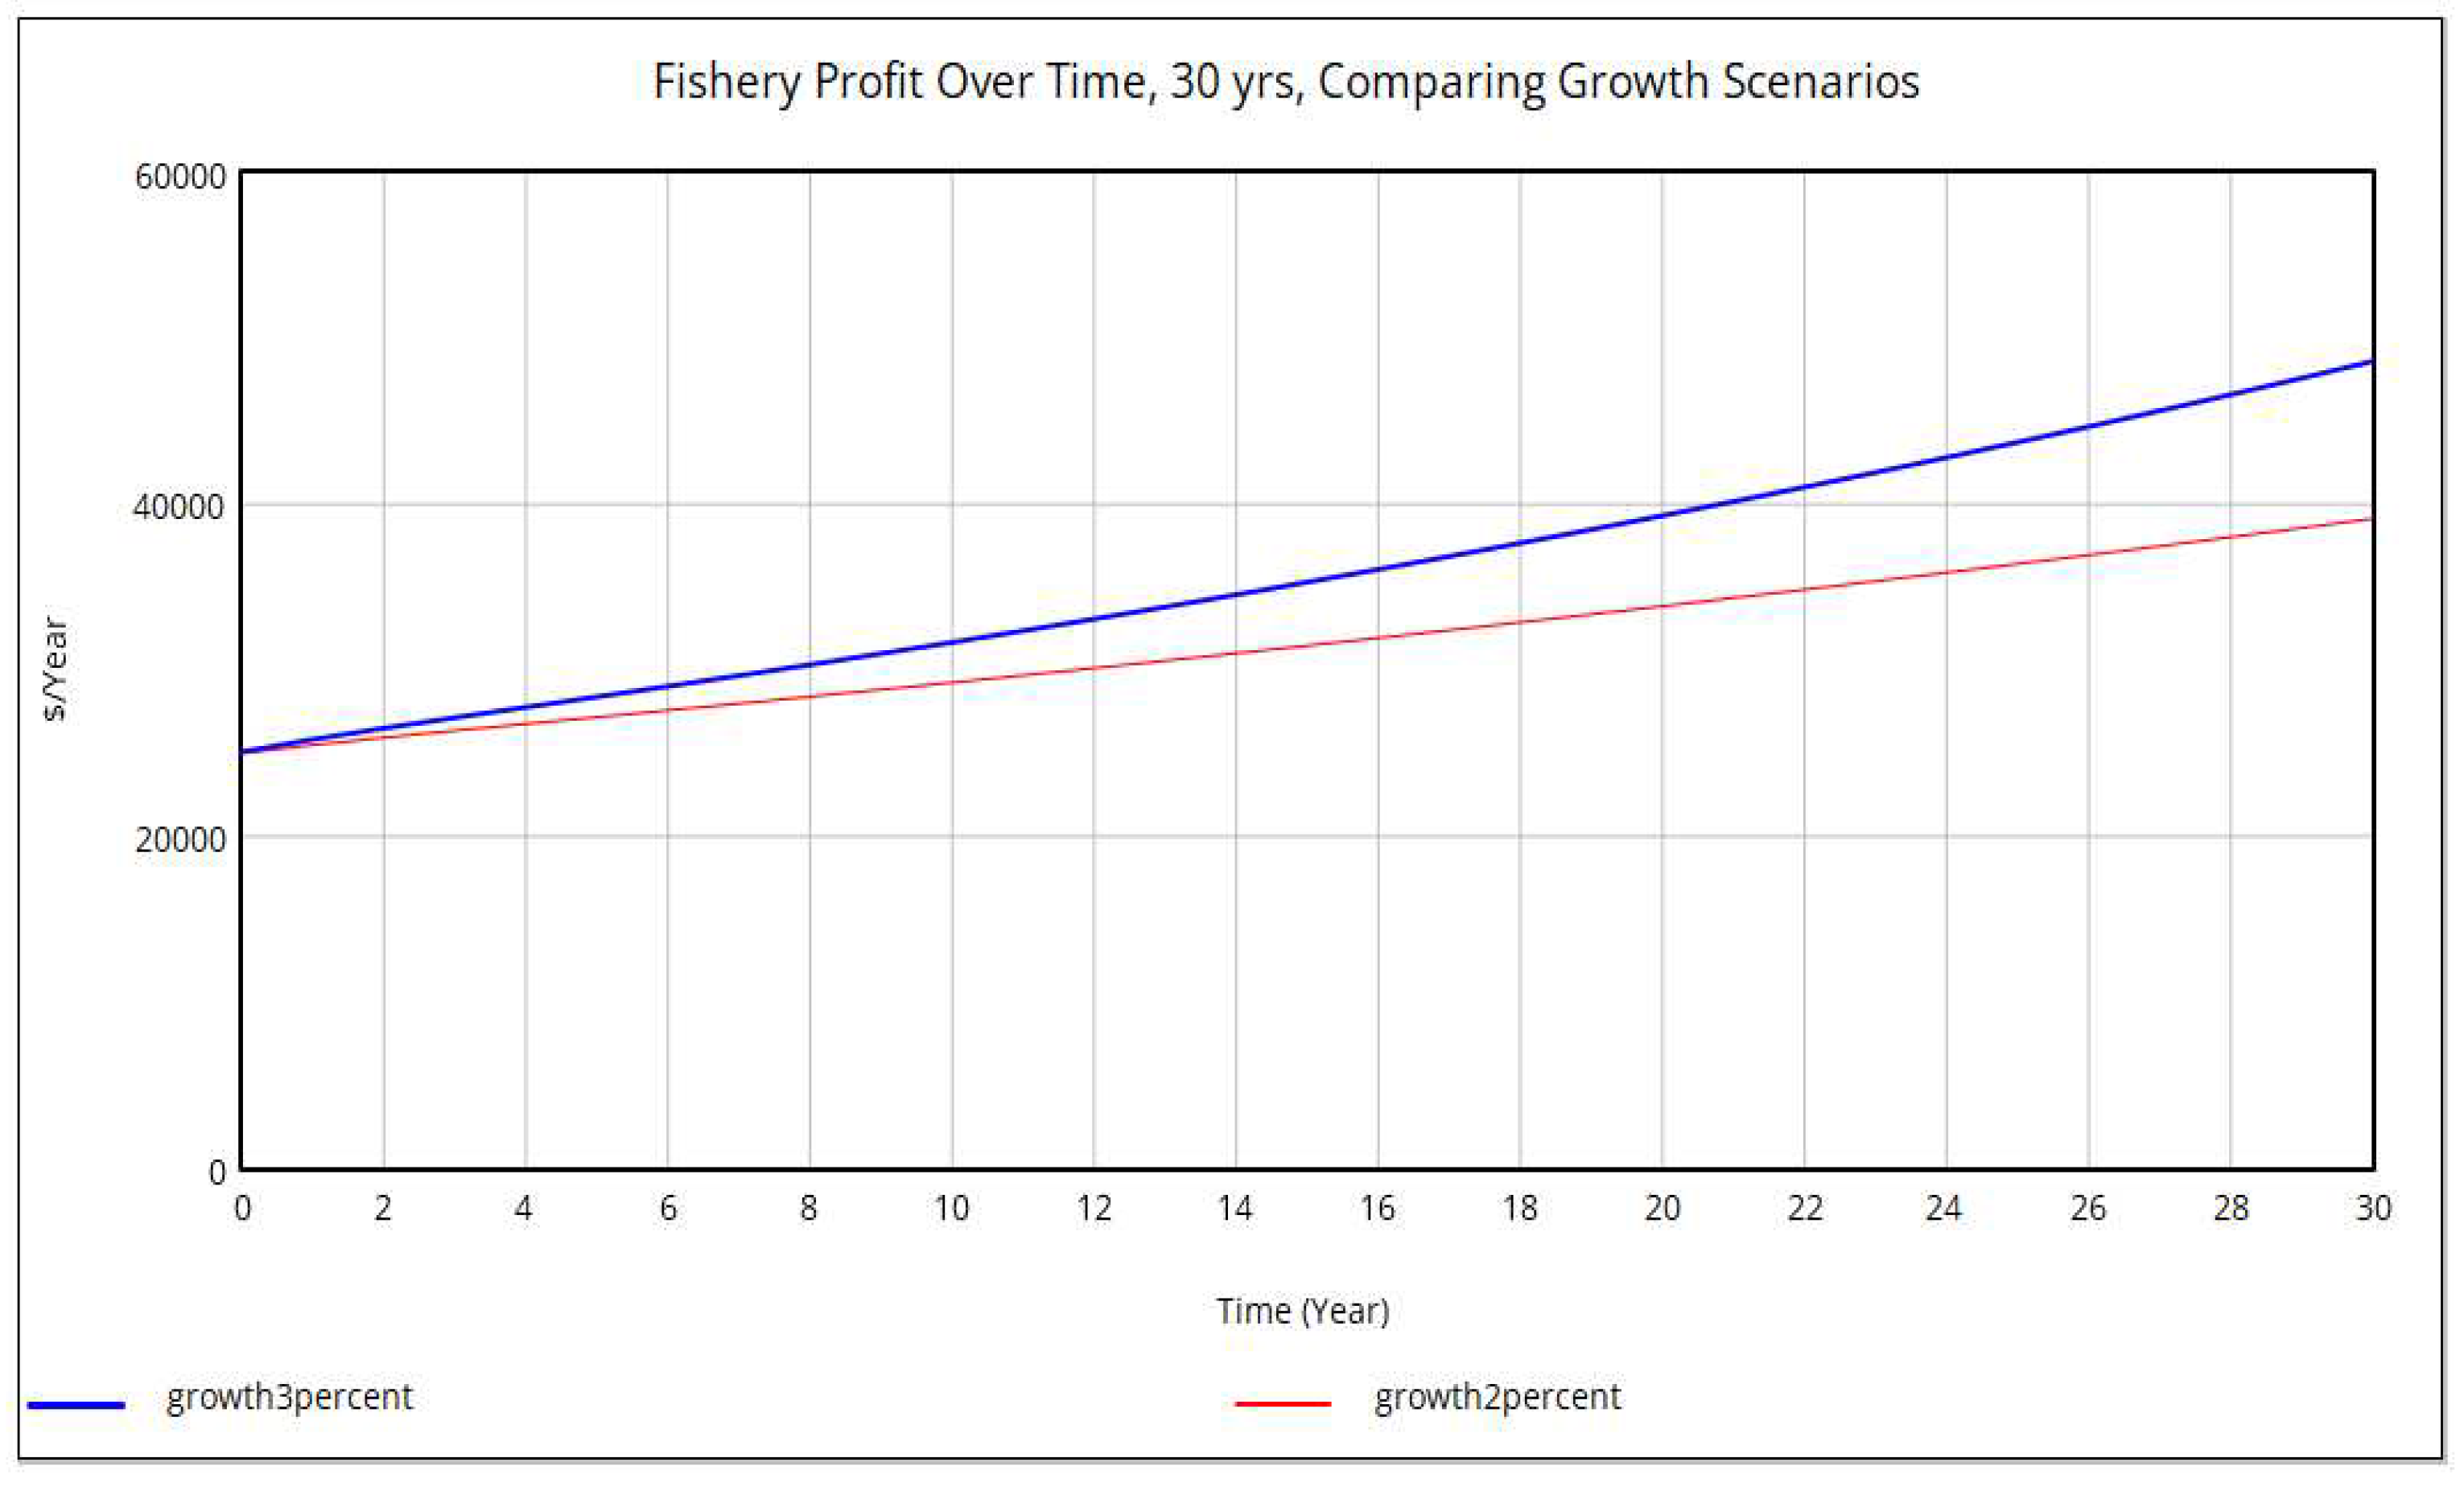
Figure 6.
Comparing 2% versus 3% growth on Yearly Profit over a Longer Timeframe, 40 years.
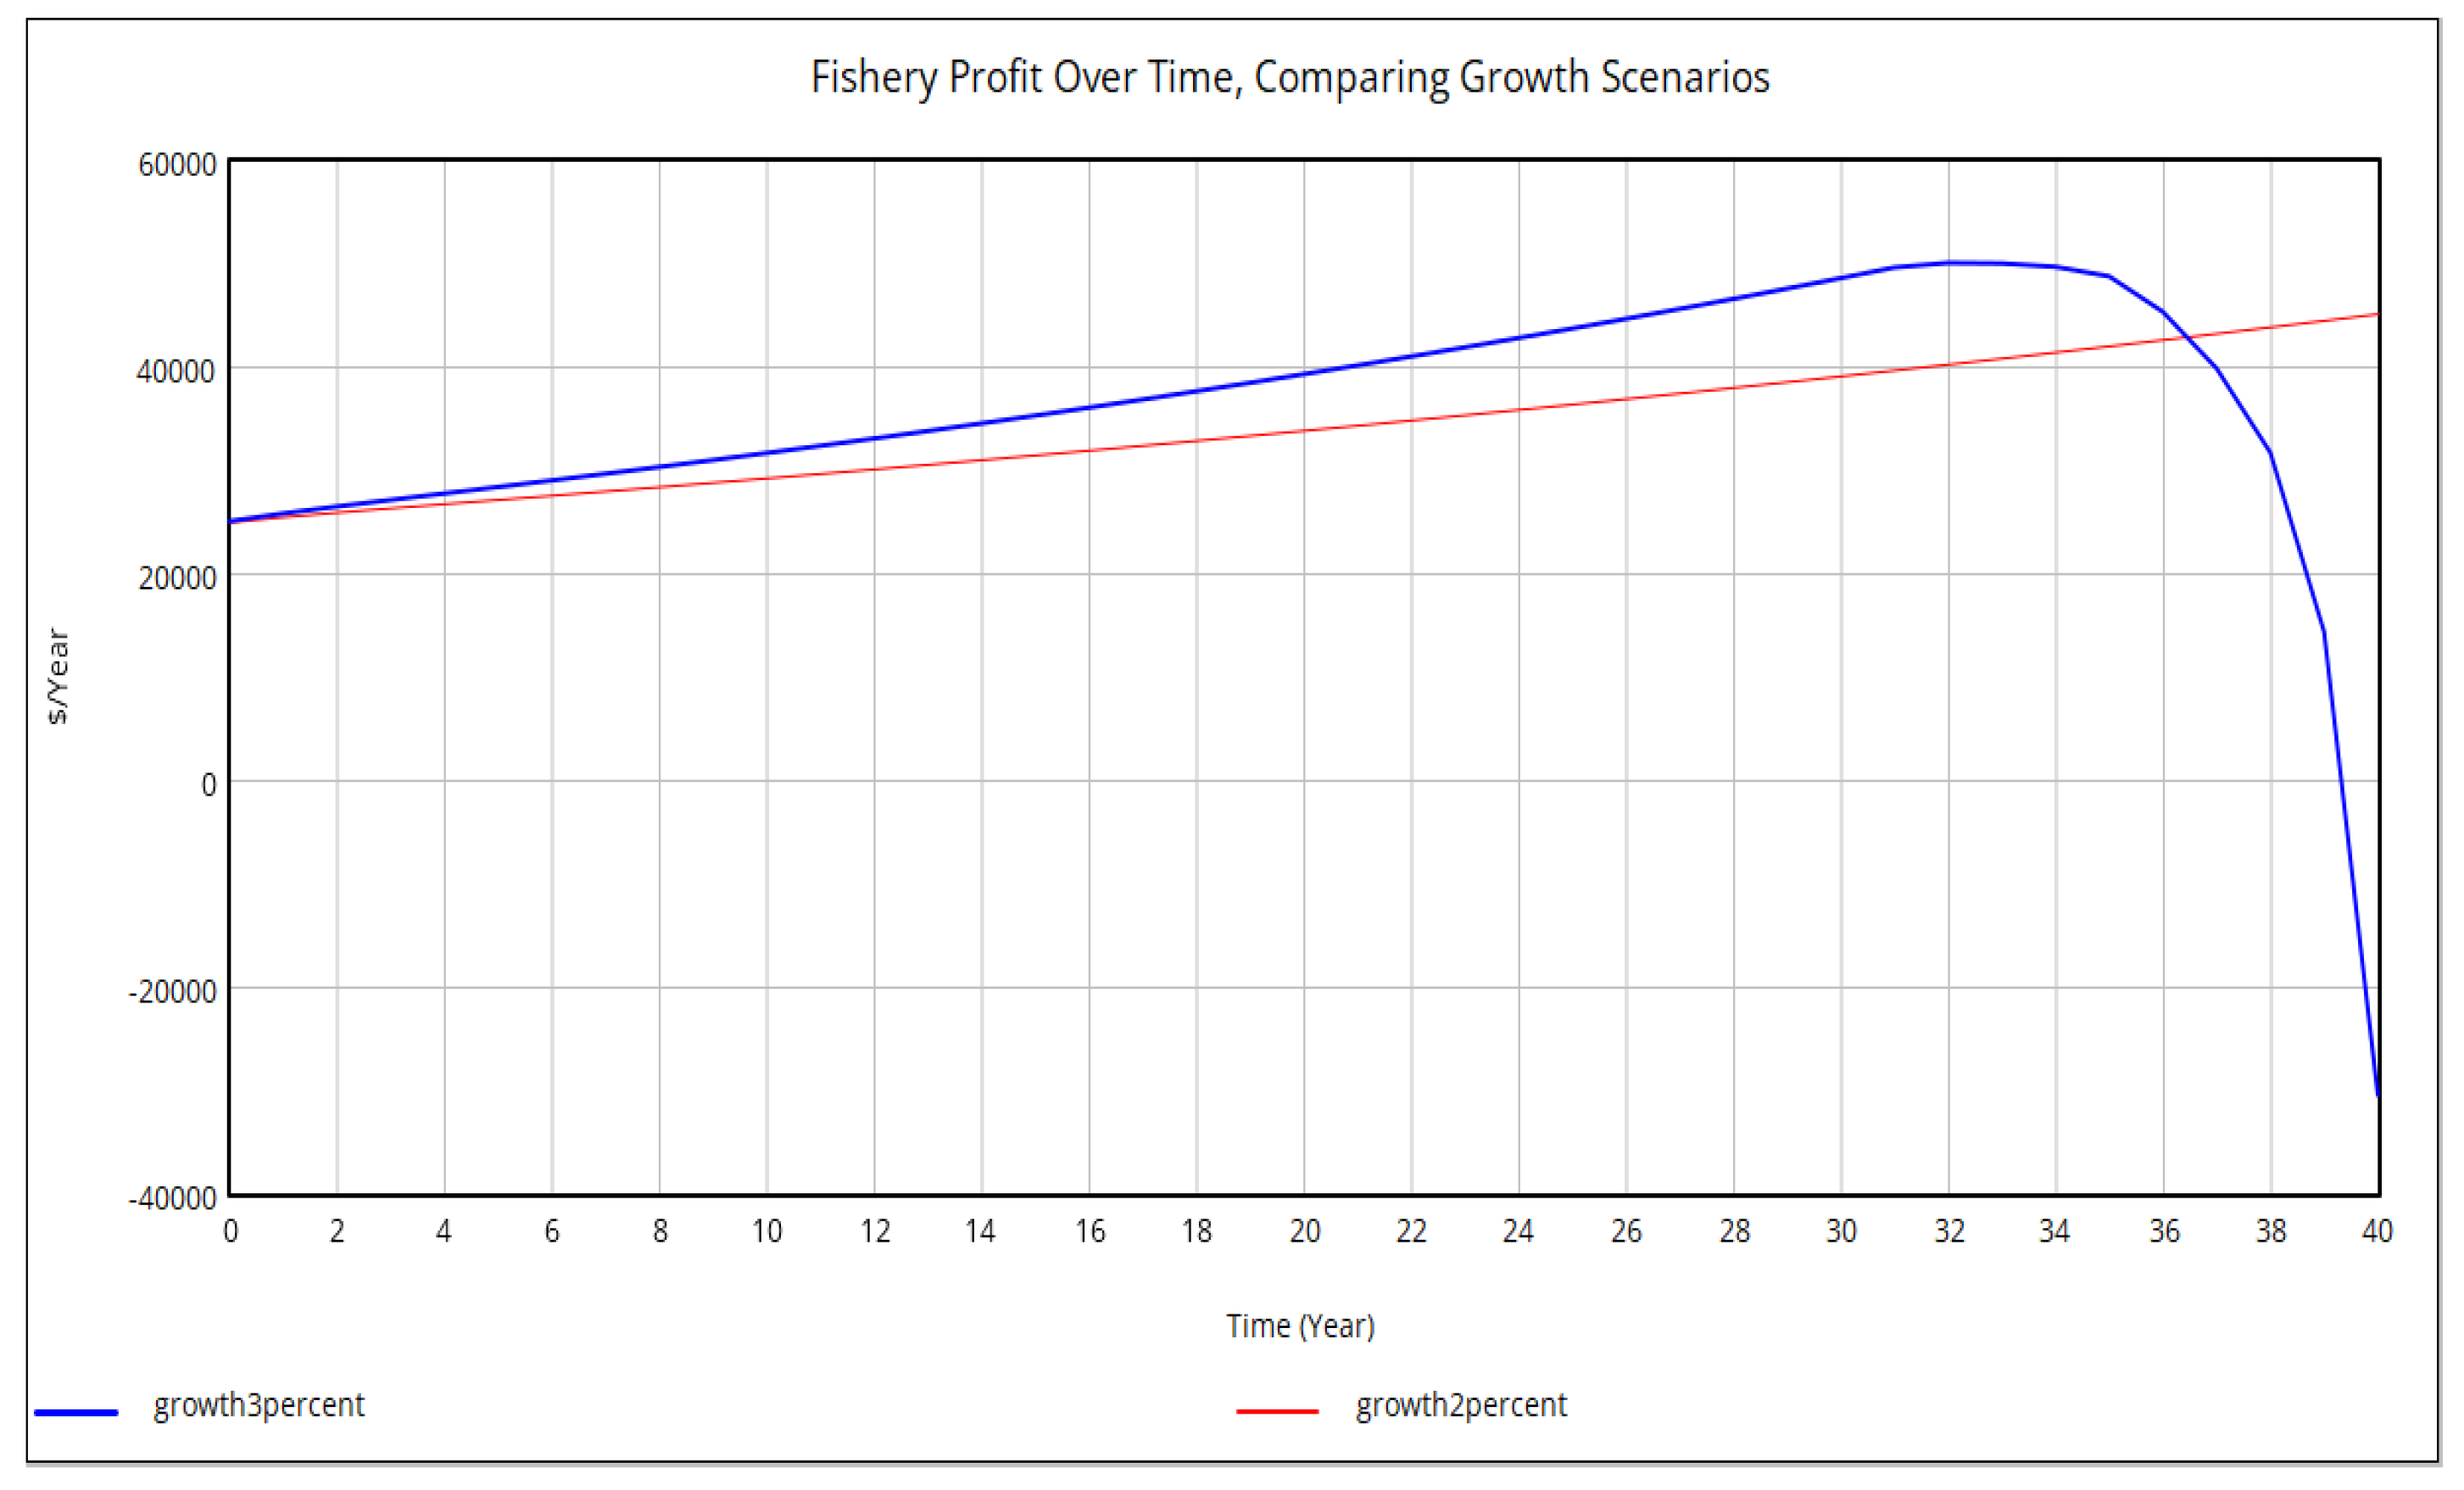
Figure 7.
Comparing 2% versus 3% growth on Fish Stock Level over a Longer Timeframe, 40 years.
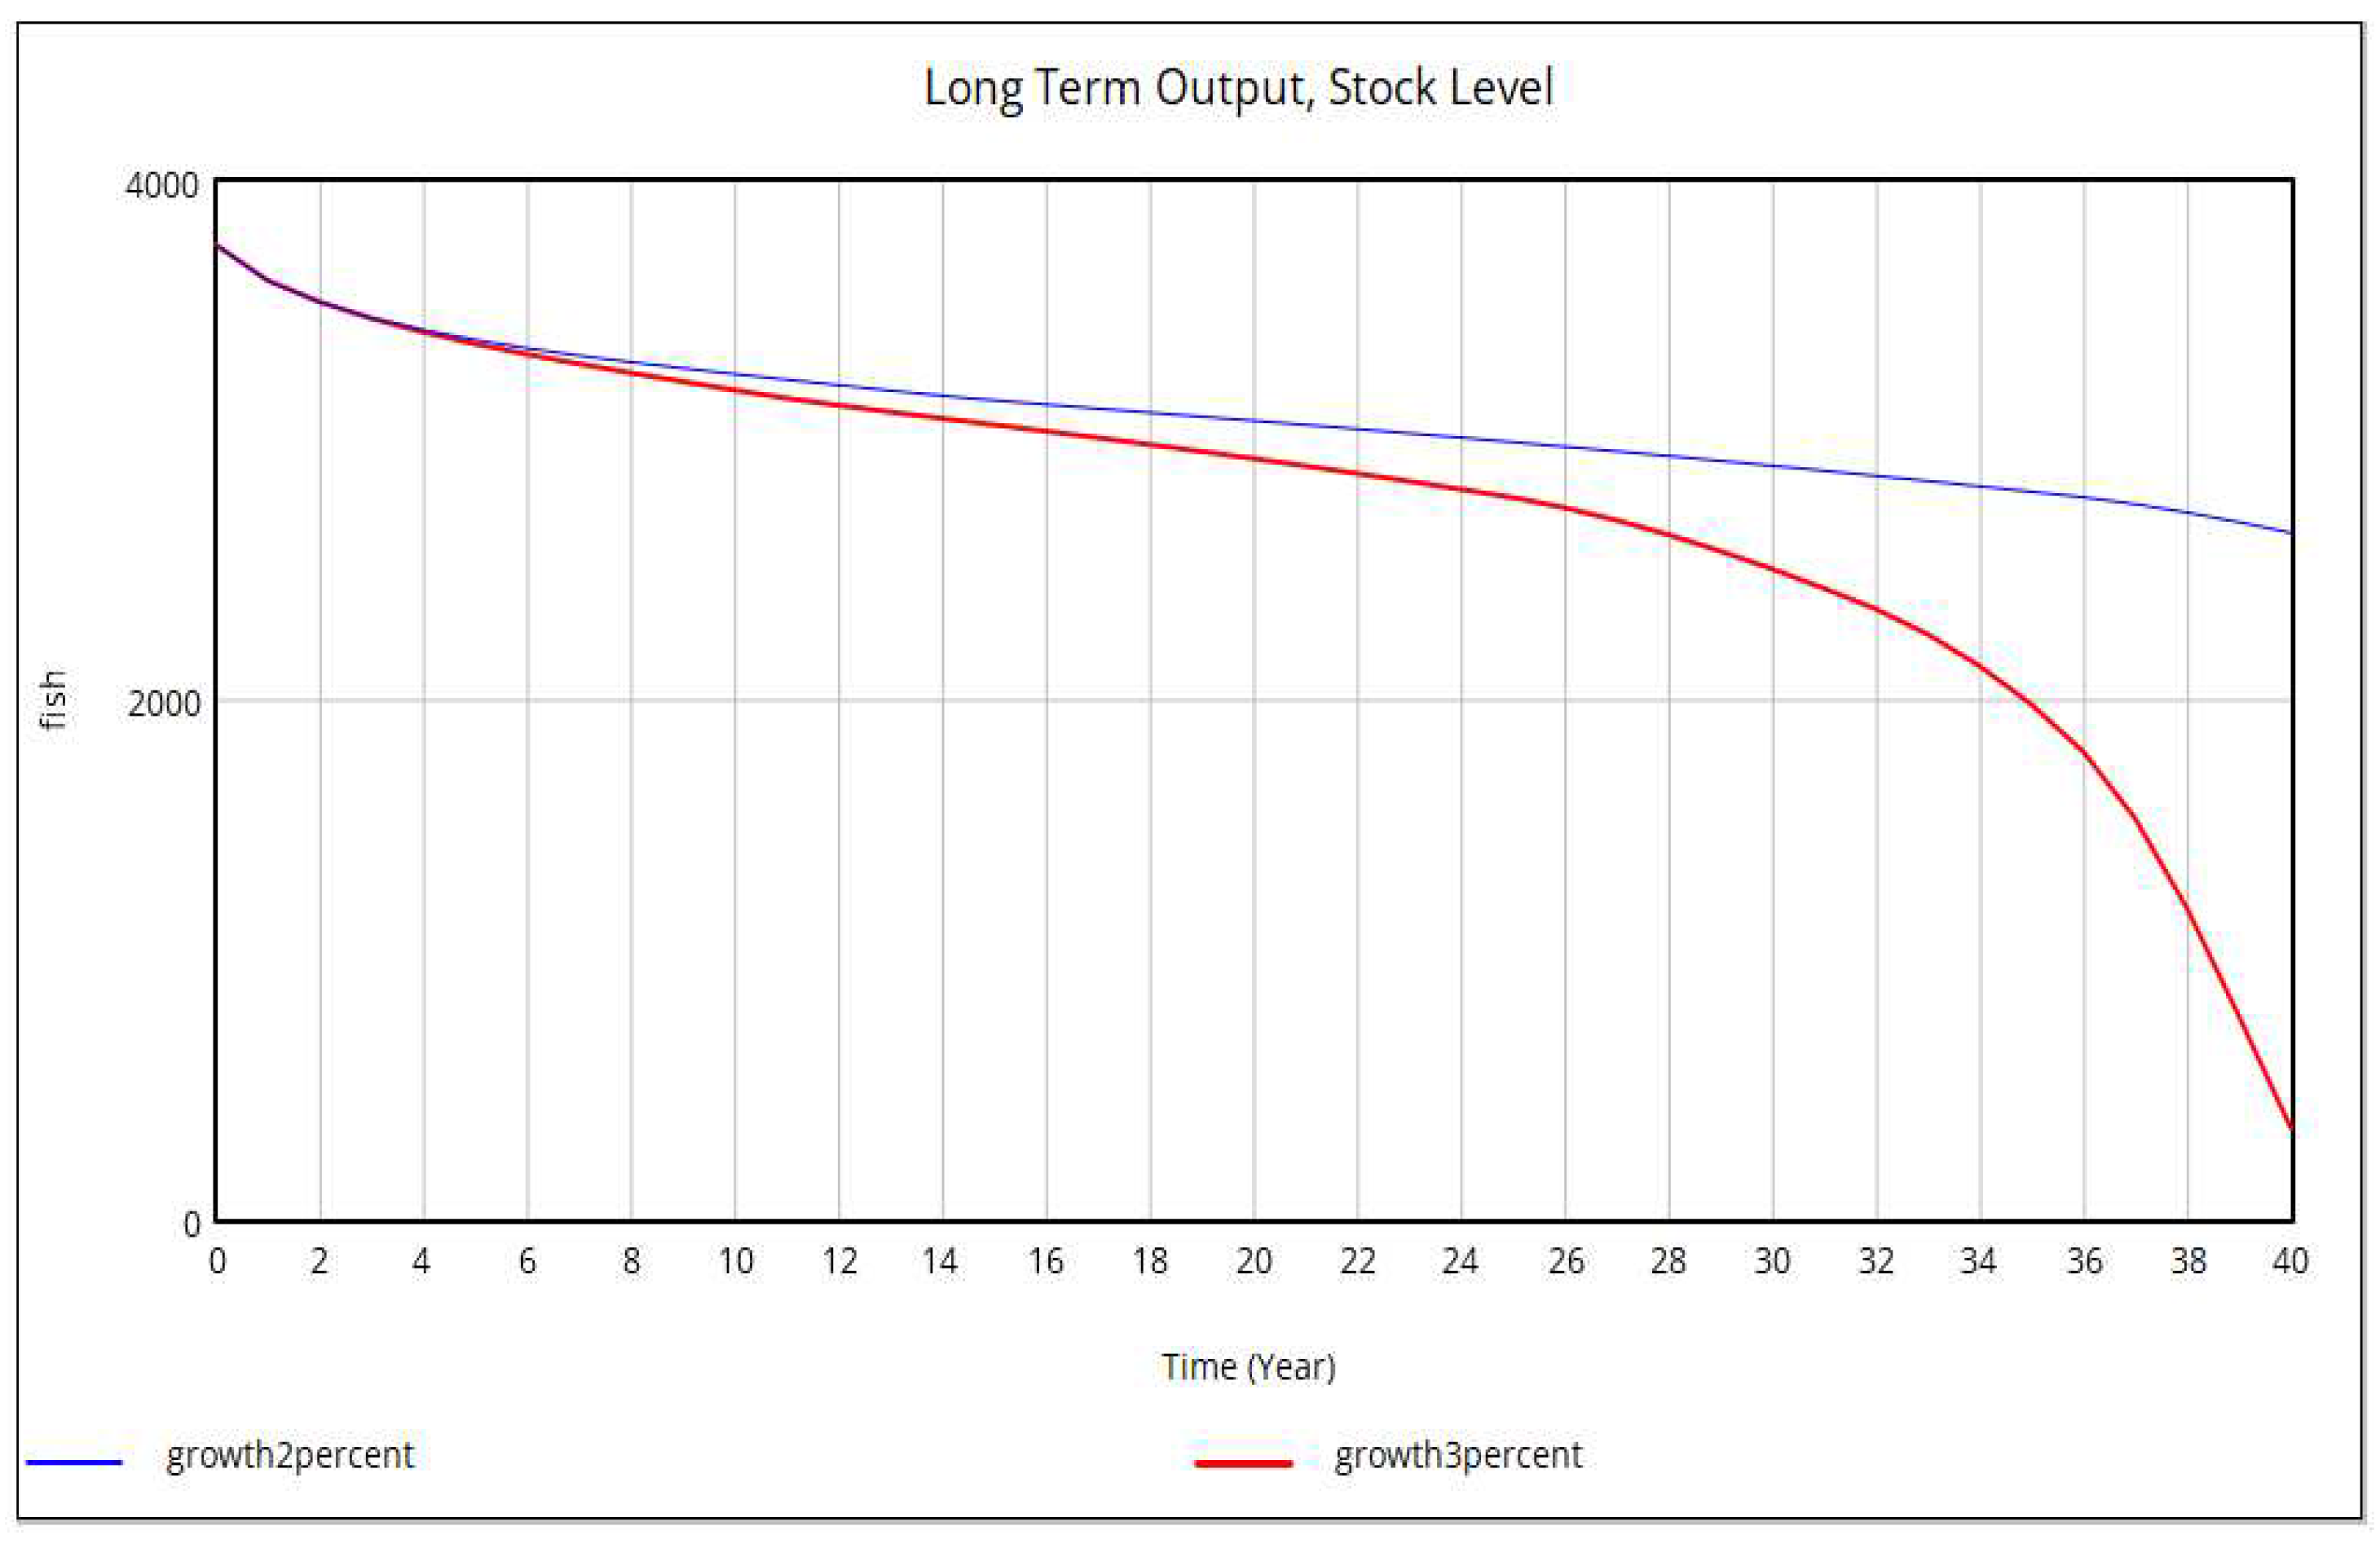
Figure 8.
Comparing 2% versus 1% growth on Yearly Profit Level over a Longer Timeframe, 60 years.
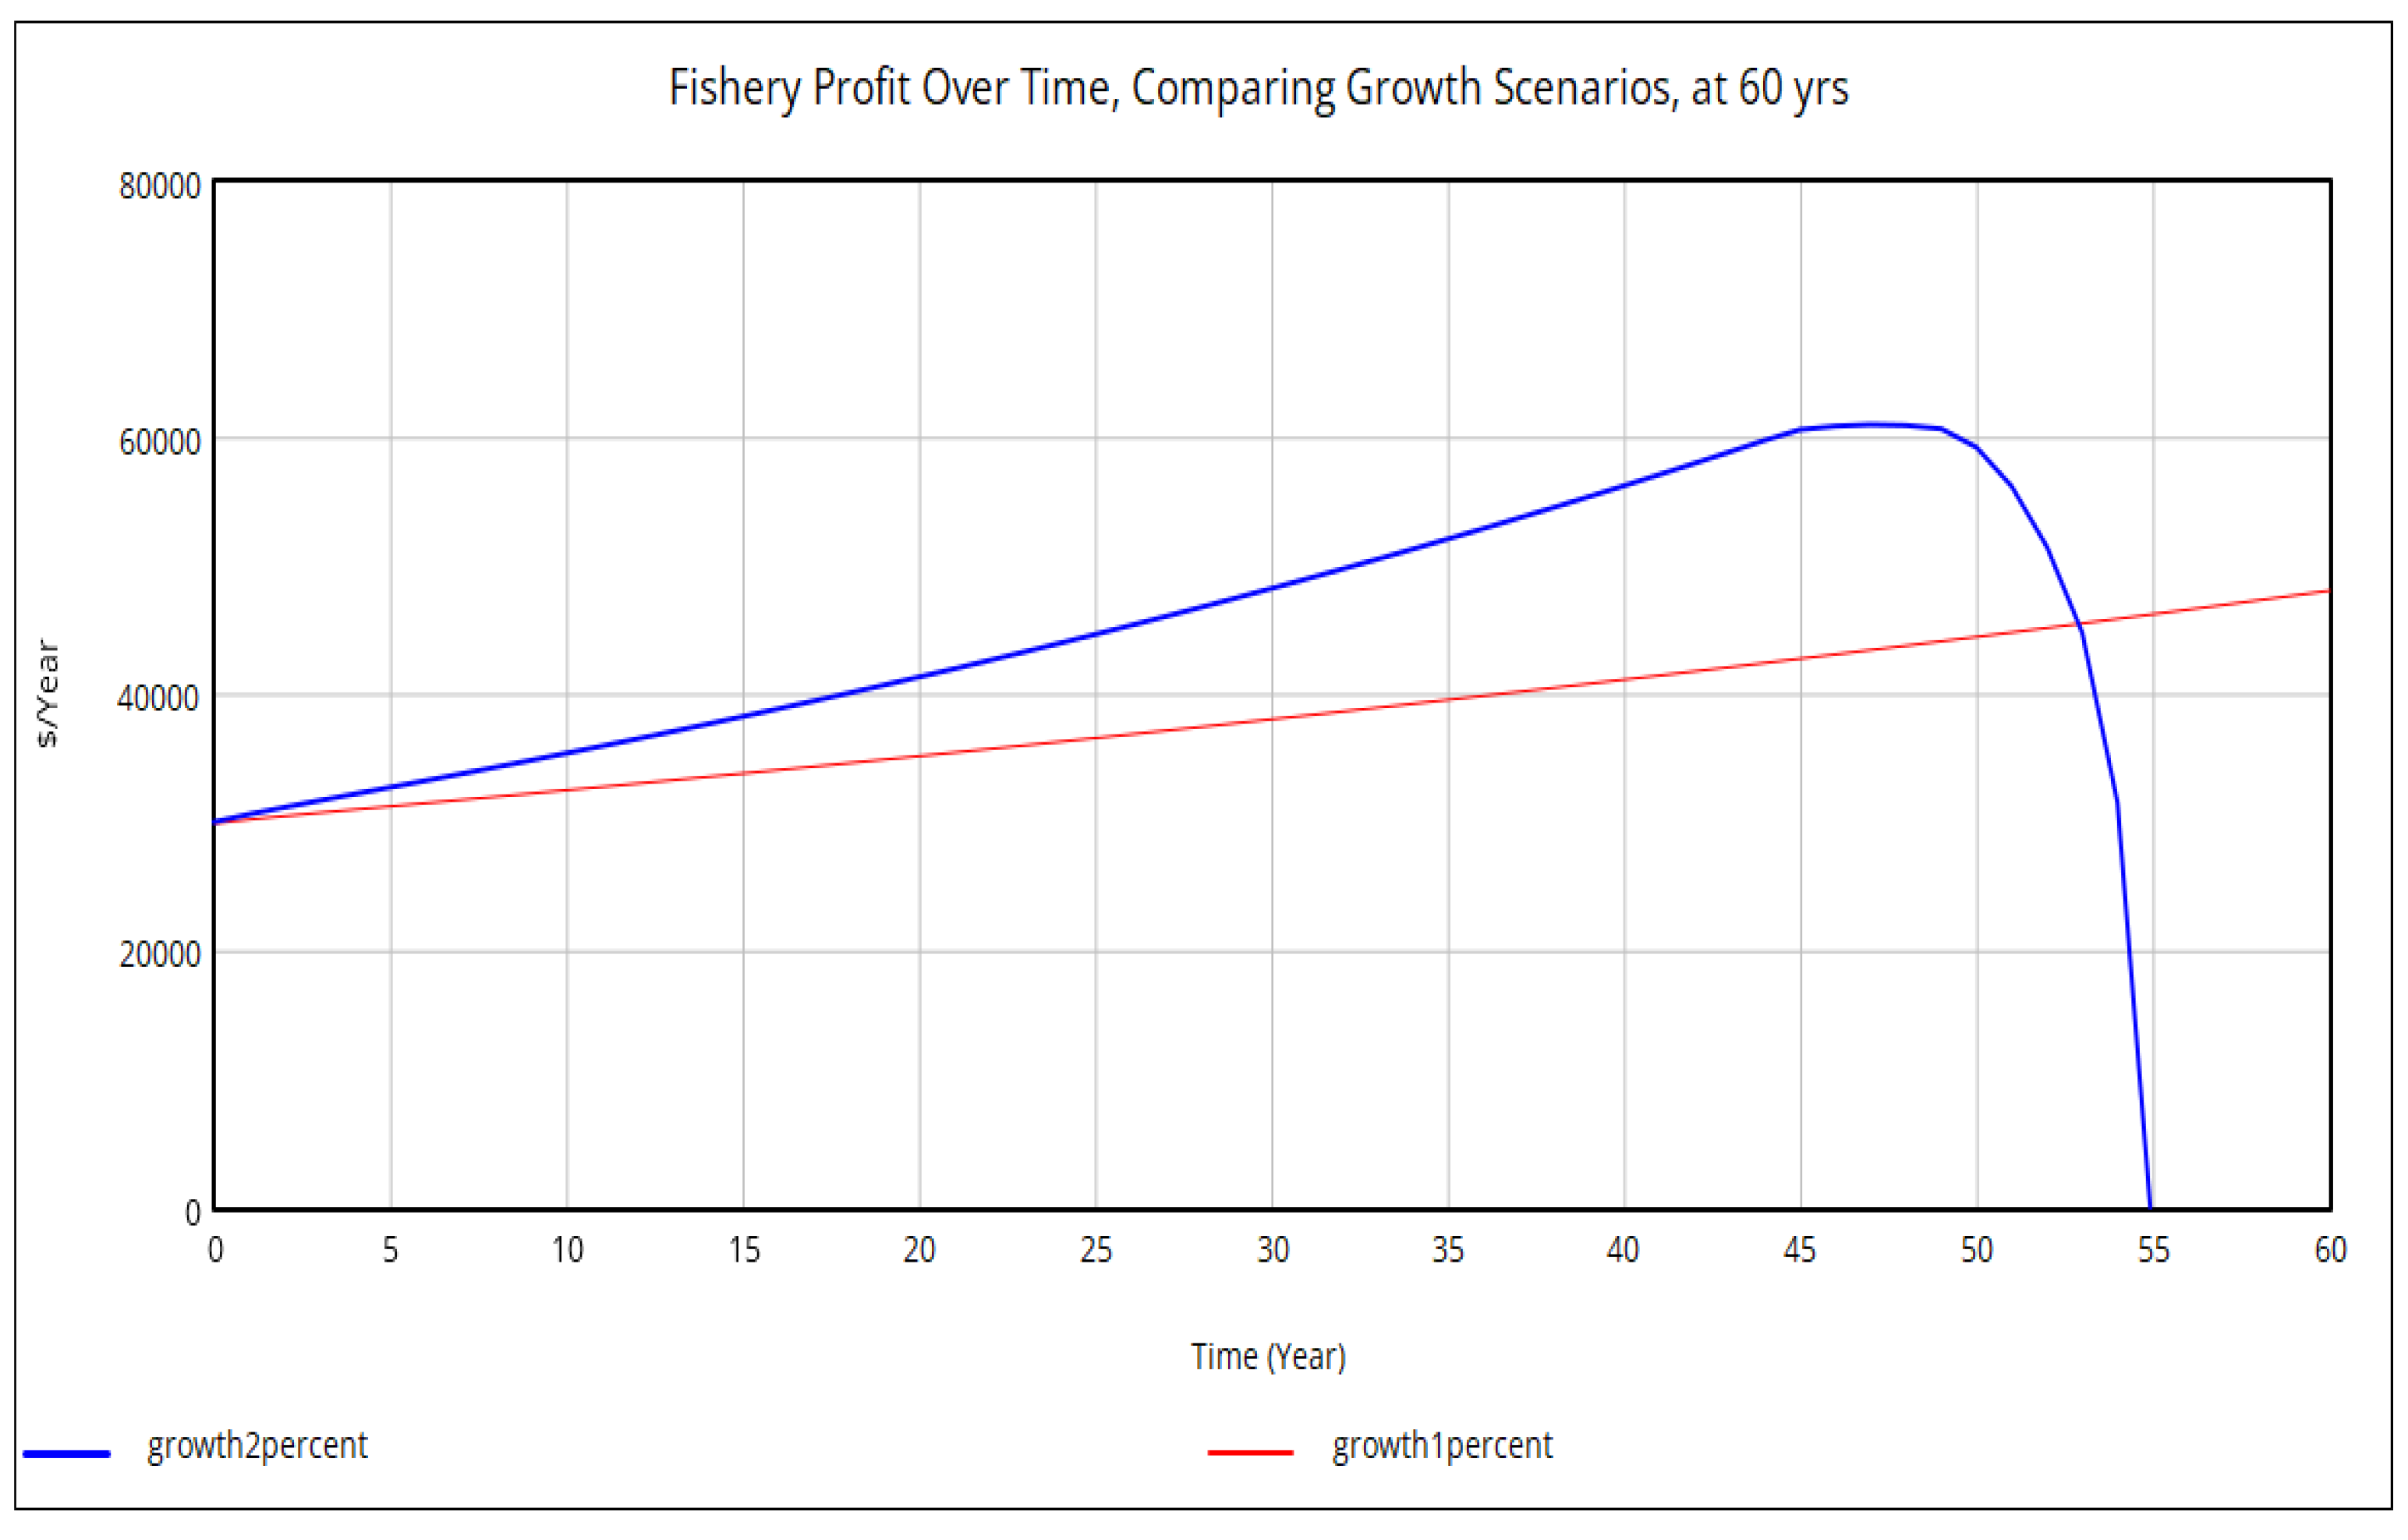

Table 1.
Selected Fishery Collapses.
| Fishery Collapse | Major Causes | Sources |
|---|---|---|
| Peruvian anchoveta, early 1970s | High natural stock variability | [26,27] |
| Atlanto-Scandian Herring, early 1970s | Numerous issues, state subsidies | [26] |
| North Sea Herring, late 1970s | Delay, slow political decisions, difficult stock assessment | [27,28] |
| Atlantic Northwest Cod, 1992 | Overfishing, technology stuffing, poor ecological knowledge | [25] |
Disclaimer/Publisher’s Note: The statements, opinions and data contained in all publications are solely those of the individual author(s) and contributor(s) and not of MDPI and/or the editor(s). MDPI and/or the editor(s) disclaim responsibility for any injury to people or property resulting from any ideas, methods, instructions or products referred to in the content. |
© 2024 by the author. Licensee MDPI, Basel, Switzerland. This article is an open access article distributed under the terms and conditions of the Creative Commons Attribution (CC BY) license (http://creativecommons.org/licenses/by/4.0/).
Copyright: This open access article is published under a Creative Commons CC BY 4.0 license, which permit the free download, distribution, and reuse, provided that the author and preprint are cited in any reuse.


