Submitted:
09 February 2024
Posted:
13 February 2024
You are already at the latest version
Abstract
Keywords:
1. Introduction
2. Materials and Methods
2.1. Sample Collection
2.2. 1H NMR Experiments
2.3. ERETIC Signal Calibration
2.4. Fourier-Transform Infrared Spectroscopy (FTIR)
2.5. Exploratory Analysis by PCA and HCA
3. Results and Discussion
3.1. Characterization of Lipid Profile by 1H NMR
3.2. Statistical Analysis
5. Conclusions
Author Contributions
Funding
Institutional Review Board Statement
Informed Consent Statement
Acknowledgments
Conflicts of Interest
References
- Yadav, G.G.; Manasa, V.; Murthy, H.N.; Tumaney, A.W. Chemical composition and nutraceutical characterization of Balanites roxburghii seed oil. J. Food Compos. Anal. 2023, 115, 104952. [Google Scholar] [CrossRef]
- Santos, M.O.; Camilo, C.J.; Macedo, J.G.F.; de Lacerda, M.N.S.; Lopes, C.M.U.; Rodrigues, A.Y.F.; da Costa, J.G.M.; Souza, M.M.A. Copaifera langsdorffii Desf.: A chemical and pharmacological review. Biocatal. Agric. Biotechnol. 2022, 39, 102262. [Google Scholar] [CrossRef]
- Nagy, M.M.; Wang, S.; Farag, M. Quality analysis and authentication of nutraceuticals using near IR (NIR) spectroscopy: A comprehensive review of novel trends and applications. Trends Food Sci. Technol. 2022, 123, 290–309. [Google Scholar] [CrossRef]
- Pandey, S.N.; Singh, G.; Semwal, B.C.; Gupta, G.; Alharbi, K.S.; Almalki, W.H.; Albratty, M.; Najmi, A.; Meraya, A.M. Therapeutic approaches of nutraceuticals in the prevention of Alzheimer's disease. J. Food Biochem. 2022, 46, e14426. [Google Scholar] [CrossRef]
- Santos, J.S.; Escher, G.B.; Pereira, J.M.S.; Marinho, M.T.; Prado-Silva, L.; Sant’Ana, A.S.; Dutra, L.M.; Barison, A.; Granato, D. 1H NMR combined with chemometrics tools for rapid characterization of edible oils and their biological properties. Ind. Crops Prod. 2018, 116, 191–200. [Google Scholar] [CrossRef]
- Kozub, A.; Nicolaichuk, H.; Przykaza, K.; Tomaszewska-Gras, J.; Fornal, E. Lipidomic characteristics of three edible cold-pressed oils by LC/Q-TOF for simple quality and authenticity assurance. Food Chem. 2023, 415, 135761. [Google Scholar] [CrossRef] [PubMed]
- do Nascimento, T.A.; Lopes, T.I.B.; Nazario, C.E.D.; Oliveira, S.L.; Braz, G.A. Vegetable oils: Are they true? A point of view from ATR-FTIR, 1H NMR, and regiospecific analysis by 13C NMR. Food Res. Int. 2021, 144, 1–9. [Google Scholar] [CrossRef]
- Mitrea, L.; Teleky, B-E.; Leopold, L-F.; Nemes, S-A.; Plamada, D.; Dulf, F.V.; Pop, I-D.; Vodnar, D.C. The physicochemical properties of five vegetable oils exposed at high temperature for a short-time-interval. J Food Compos. Anal. 2022, 106, 104305. [Google Scholar] [CrossRef]
- Jamwal, R.; Kumari, S.; Sharma, S.; Kelly, S.; Cannavan, A.; Kumar, D. Vibrational Spectroscopy Recent trends in the use of FTIR spectroscopy integrated with chemometrics for the detection of edible oil adulteration. Vib. Spectrosc. 2021, 113, 103222. [Google Scholar] [CrossRef]
- Galvan, D.; Tanamati, A.A.C.; Casanova, F.; Danieli, E.; Bona, E.; Killner, M.H.M. Compact low-field NMR spectroscopy and chemometrics applied to the analysis of edible oils. Food Chem. 2021, 365, 130476. [Google Scholar] [CrossRef]
- Jia, Z.; Liang, C. Molecular Dynamics and Chain Length of Edible Oil Using Low-Field Nuclear Magnetic Resonance. Molecules. 2023, 28, 197. [Google Scholar] [CrossRef]
- Mota, M.F.S.; Waktola, H.D.; Nolvachai, Y.; Marriott, P.J. Gas chromatography ‒ mass spectrometry for characterization, assessment of quality and authentication of seed and vegetable oils. Trends Anal. Chem. 2021, 138, 116238. [Google Scholar] [CrossRef]
- Gibson, M.; Percival, B.C.; Edgar, M.; Grootveld, M. Low-Field Benchtop NMR Spectroscopy for Quantification of Aldehydic Lipid Oxidation Products in Culinary Oils during Shallow Frying Episodes. Foods. 2023, 12, 1254. [Google Scholar] [CrossRef]
- Cai, S.; Zhang, Y.; Xia, F.; Shen, G.; Feng, J. An expert system based on 1H NMR spectroscopy for quality evaluation and adulteration identification of edible oils. J Food Compos. Anal. 2019, 84, 103316. [Google Scholar] [CrossRef]
- Pinto, V.S.; dos Anjos, M.M.; Pinto, N.S.; Liao, L.L. Analysis of thermal degradation of Brazilian palm oil by quantitative 1H NMR and chemometrics. Food Control. 2021, 130, 1–9. [Google Scholar] [CrossRef]
- Huang, Z-M.; Xin, J-X.; Sun, S-S.; Li, Y.; Wei, D-X.; Zhu, J.; Wang, X-L.; Wang, J.; Yao, Y-F. Rapid Identification of Adulteration in Edible Vegetable Oils Based on Low-Field Nuclear Magnetic Resonance Relaxation Fingerprints. Foods. 2021, 10, 3068. [Google Scholar] [CrossRef] [PubMed]
- Cui, C.; Xia, M.; Chen, J.; Shi, B.; Peng, C.; Cai, H.; Jin, L.; Hou, R. 1H NMR-based metabolomics combined with chemometrics to detect edible oil adulteration in huajiao (Zanthoxylum bungeanum Maxim.). Food Chem. 2023, 43, 136305. [Google Scholar] [CrossRef] [PubMed]
- Giraudeau, P. Quantitative NMR spectroscopy of complex mixture. Chem. Commun. 2023, 59, 6627–6642. [Google Scholar] [CrossRef] [PubMed]
- Akoka, S.; Barantin, L.; Trierweiler, M. Concentration measurement by proton NMR using the ERETIC method. Anal. Chem. 1999, 71, 2554–255. [Google Scholar] [CrossRef] [PubMed]
- Saglam, M.; Paasch, N.; Horns, A.L.; Weidner, M.; Bachmann, R. 1H NMR metabolic profiling for the differentiation of fish species. Food Chem. 2023, 4, 100602. [Google Scholar] [CrossRef]
- Pinto, V.S.; Flores, I.S.; Ferri, P.H.; Lião, L.M. NMR Approach for Monitoring Caranha Fish Meat Alterations due to the Freezing-Thawing Cycles. Food Anal. Methods 2020, 13, 2330–2340. [Google Scholar] [CrossRef]
- Jin, H.; Wang, Y.; Lv, B.; Zhang, K.; Zhu, Z; Zhao, D.; Li, C. Rapid Detection of Avocado Oil Adulteration Using Low-Field Nuclear Magnetic Resonance. Foods. 2022, 11, 1134. [Google Scholar] [CrossRef]
- Kalogiouri, N.P.; Aalizadeh, R.; Dasenaki, M.E.; Thomaidis, N.S. Application of High Resolution Mass Spectrometric methods coupled with chemometric techniques in olive oil authenticity studies - A review. Anal. Chim. Acta 2020, 1134, 150–173. [Google Scholar] [CrossRef]
- Gunning, Y.; Taous, F.; Ghali, T.E.; Gibbon, J.D.; Wilson, E.; Brignall, R.M.; Kemsley, E.K. Mitigating instrument effects in 60 MHz 1H NMR spectroscopy for authenticity screening of edible oils. Food Chem. 2022, 370, 131333. [Google Scholar] [CrossRef] [PubMed]
- Dhaulaniya, A.S.; Balan, B.; Yadav, A.; Jamwal, R.; Kelly, S.; Cannavan, A.; Singh, D.K. Development of an FTIR based chemometric model for the qualitative and quantitative evaluation of cane sugar as an added sugar adulterant in apple fruit juices. Food Addit. Contam. Part A 2020, 37, 539–551. [Google Scholar] [CrossRef] [PubMed]
- Vieira, F.L.M.; Benedito, L.E.C.; Moreira, A.C.O.; Braga, J.W.B.; de Oliveira, A.L. Applicability of NMR in combination with chemometrics for the characterization and differentiation of oil-resin extracted from Copaifera langsdorffii and Copaifera spp. Microchem. J. 2024, 197, 109850. [Google Scholar] [CrossRef]
- Choze, R.; Alcantara, G.B.; Filho, E.G.A.; Silva, L.M.; Faria, J.C.; Lião, L.M. Distinction between a transgenic and a conventional common bean genotype by 1H HR-MAS NMR. Food Chem. 2013, 141, 2841–2847. [Google Scholar] [CrossRef] [PubMed]
- Claridge, T.D.W. High-Resolution NMR Techniques in Organic Chemistry, 3rd ed.; Elsevier: Amsterdam, Netherlands, 2016; pp. 11–59. [Google Scholar]
- Kupriyanova, G.; Smirnov, M.; Mershiev, I.; Maraşli, A.; Okay, C.; Mozzhukhin, G.; Rameev, B. Comparative analysis of vegetable oils by 1H NMR in low and high magnetic fields. J Food Compos. Anal. 2024, 126, 105877. [Google Scholar] [CrossRef]
- Hasanpour, M.; Rezaie, A.; Iranshahy, M.; Yousefi, M.; Saberi, S.; Iranshahi, M. 1H NMR-based metabolomics study of the lipid profile of omega-3 fatty acid supplements and some vegetable oils. J Pharm. Biomed. Anal. 2024, 238, 115848. [Google Scholar] [CrossRef]
- Martínez-Yusta, A.; Goicoechea, E.; Guillén, M.D. Food Lipids Studied by 1H NMR Spectroscopy: Influence of Degradative Conditions and Food Lipid Nature. Compr. Rev. Food Sci. Food Saf. 2014, 13, 839–85. [Google Scholar] [CrossRef]
- Miyake, Y.; Yokomizo, K.; Matsuzaki, N. Determination of unsaturated fatty acid composition by high-resolution nuclear magnetic resonance spectroscopy. J Am. Oil Chem. Soc. 1998, 75, 1091–1094. [Google Scholar] [CrossRef]
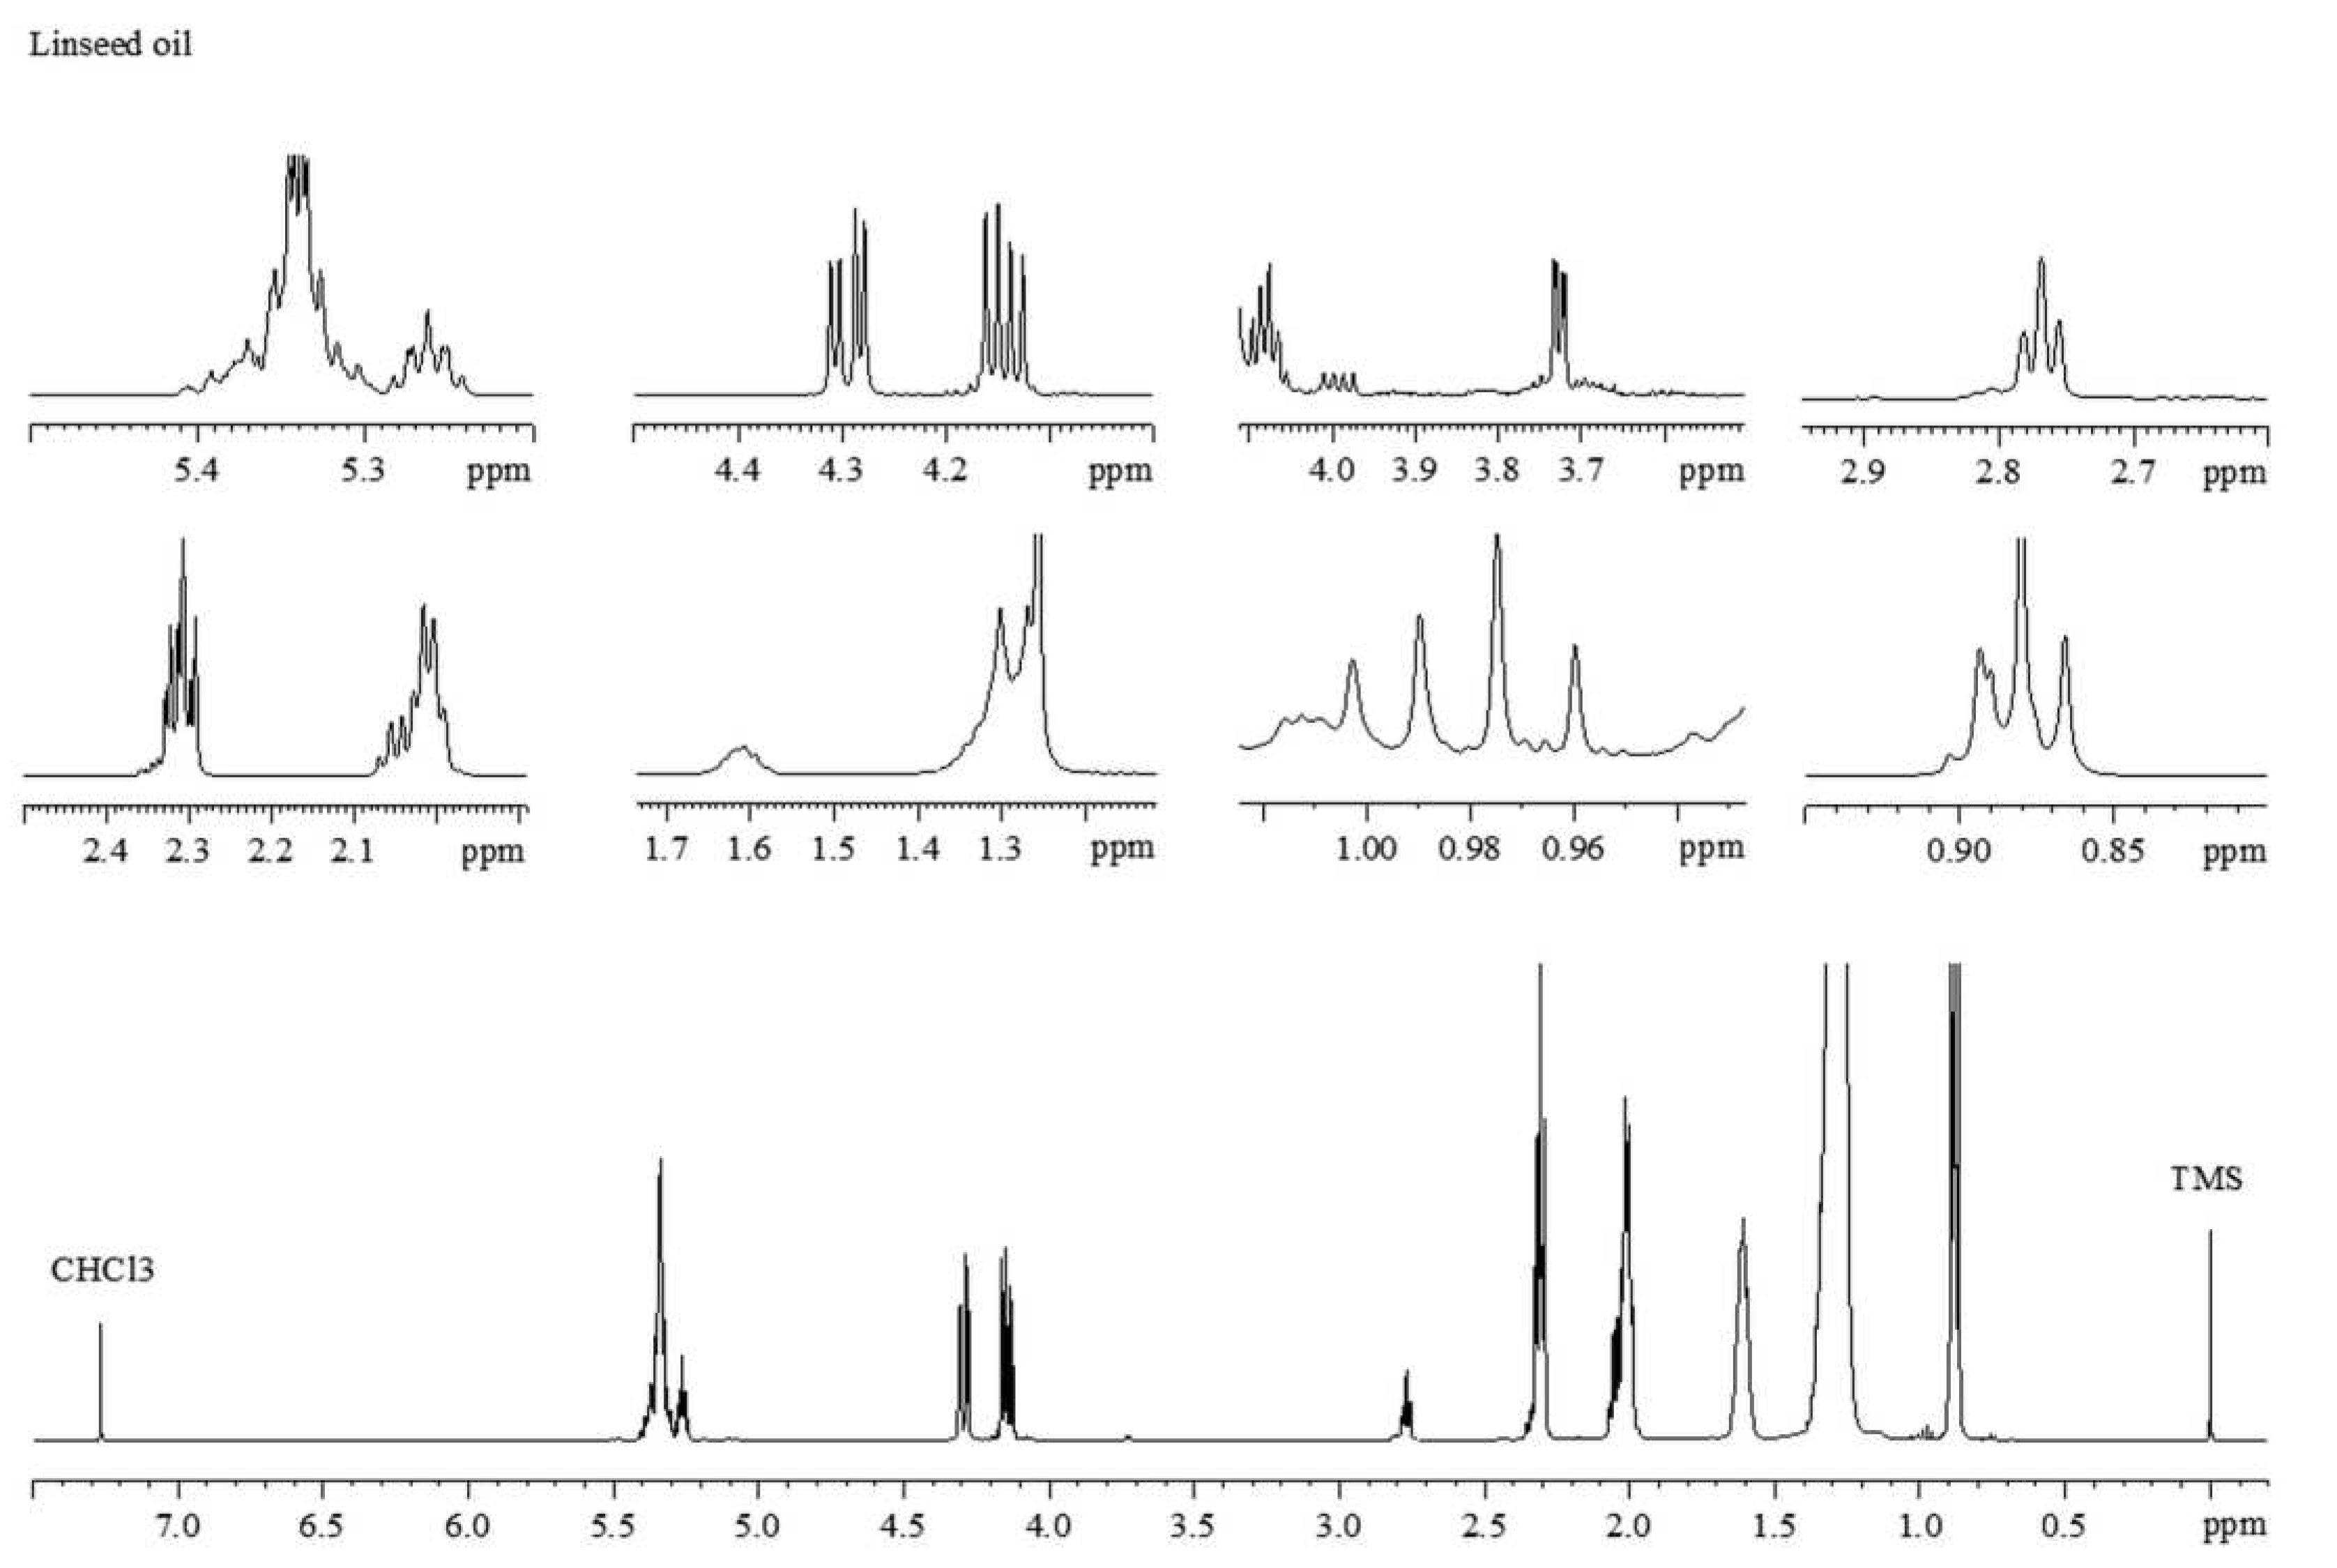
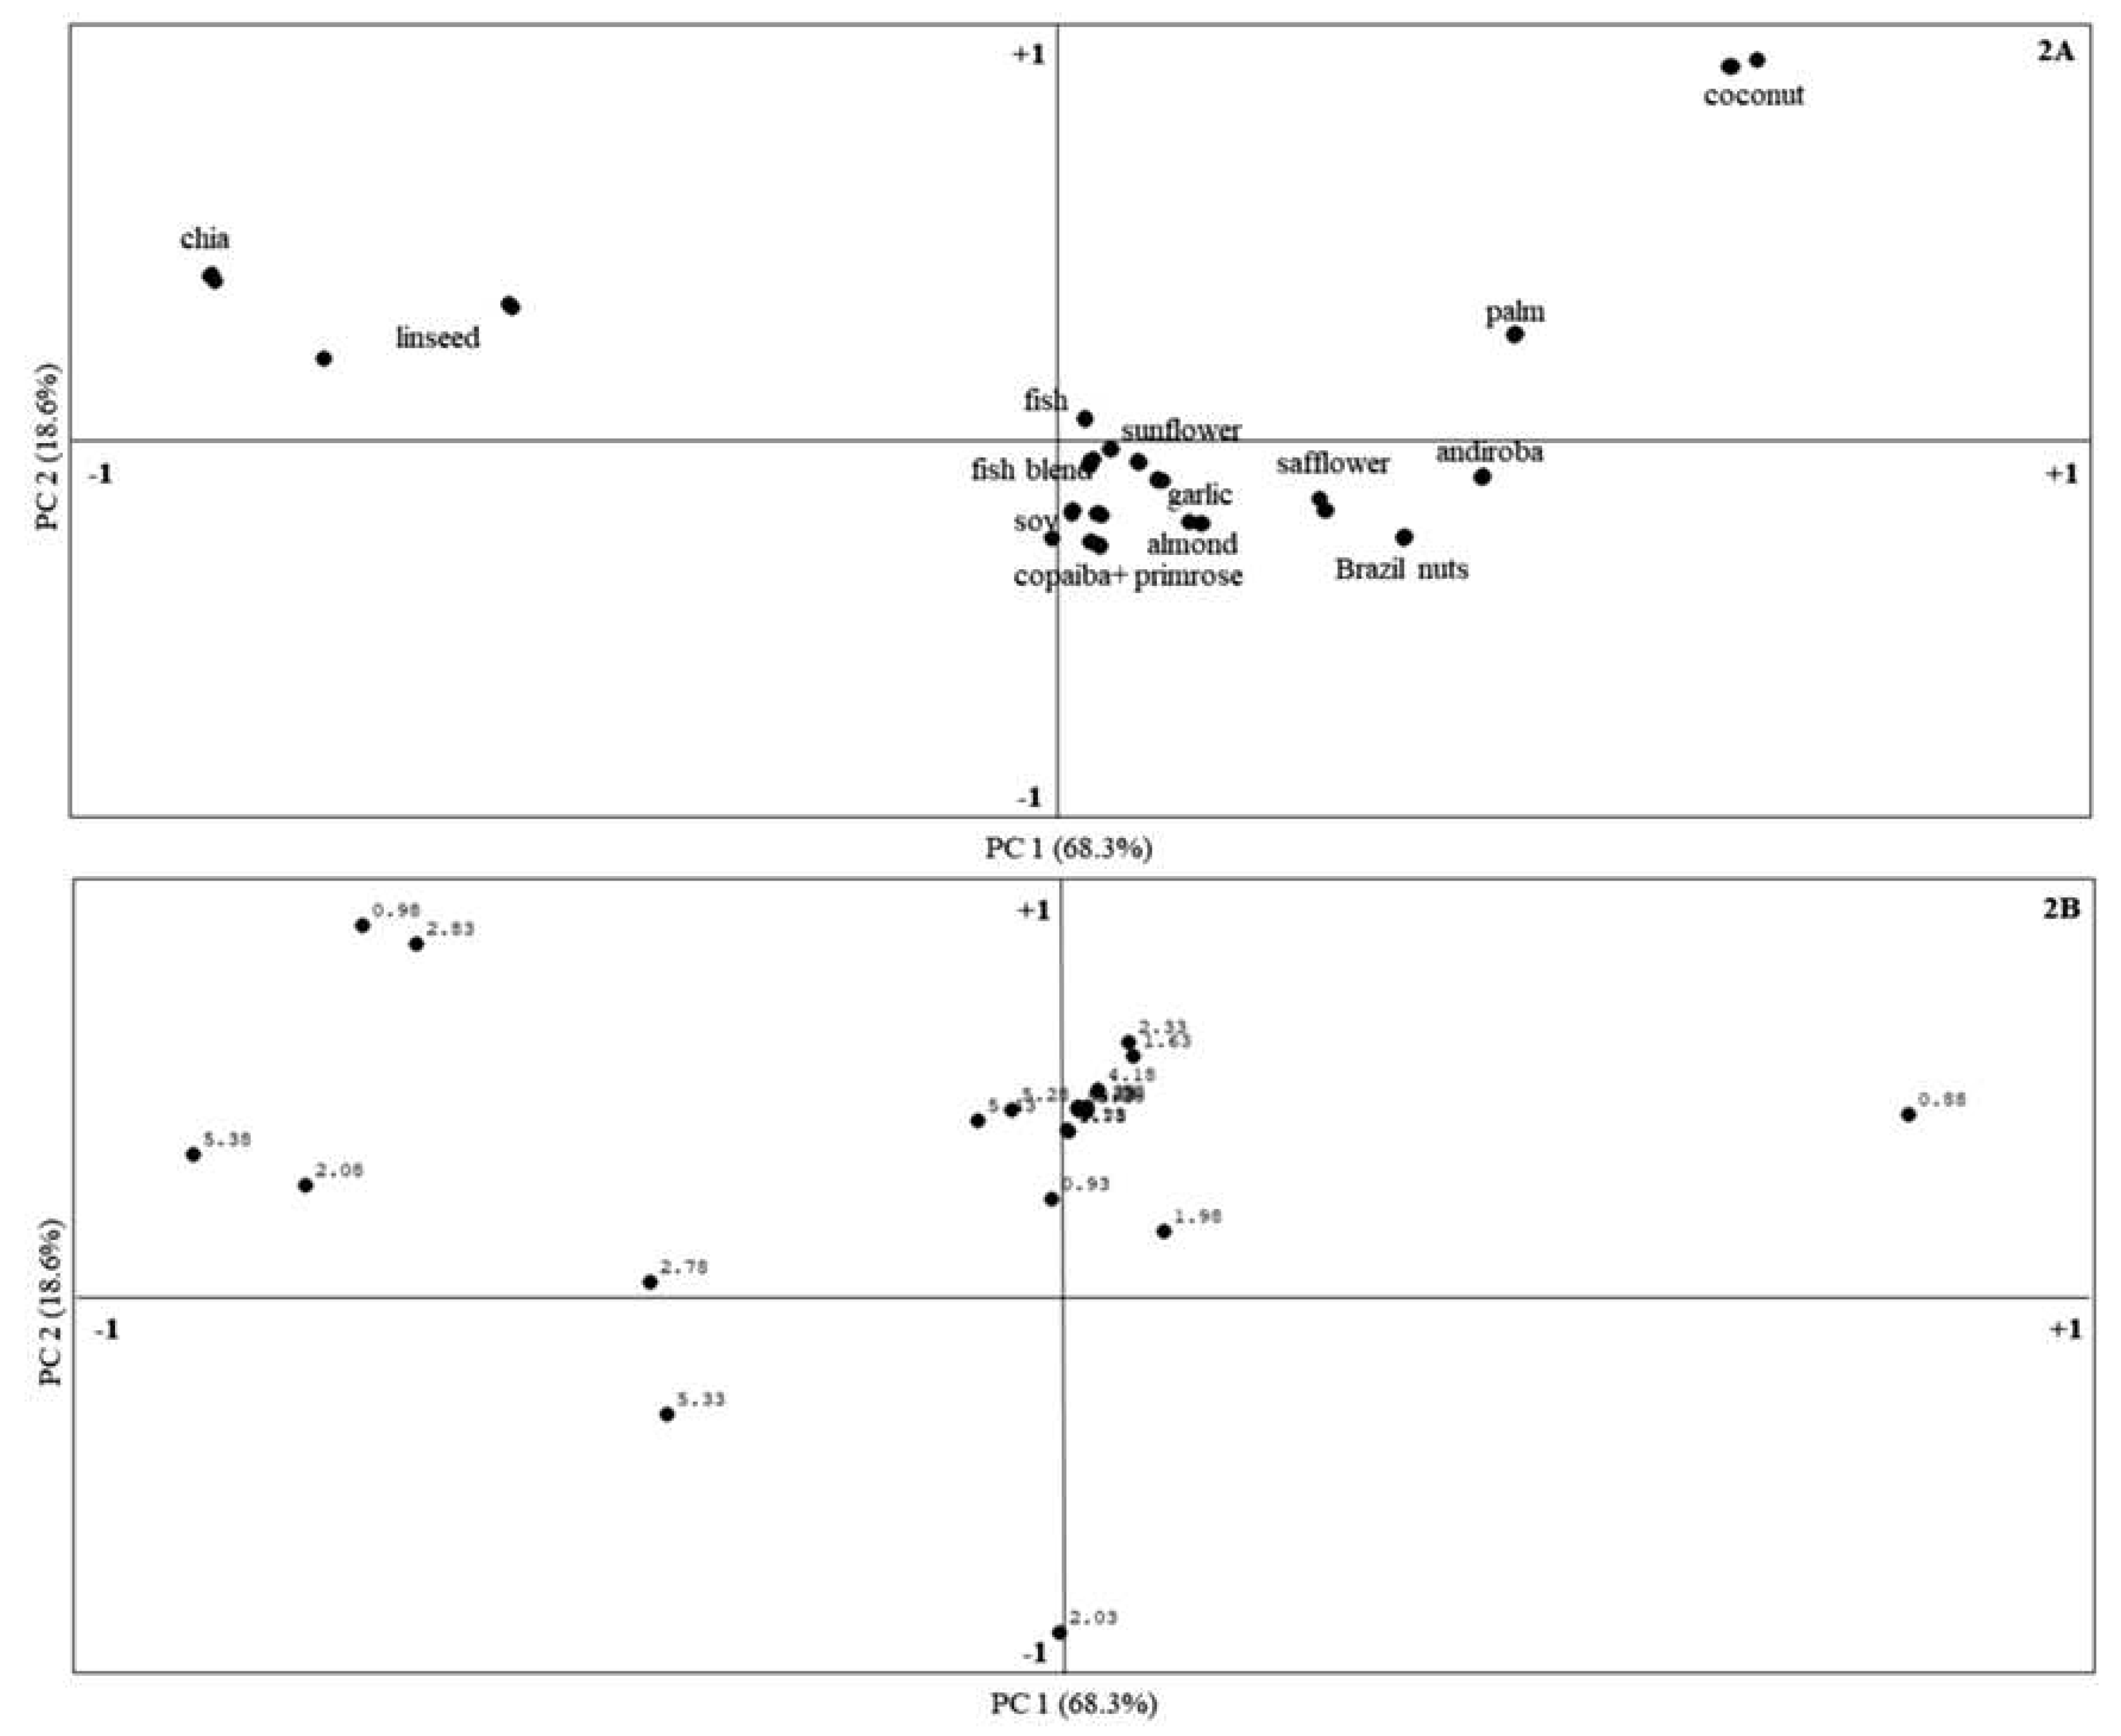
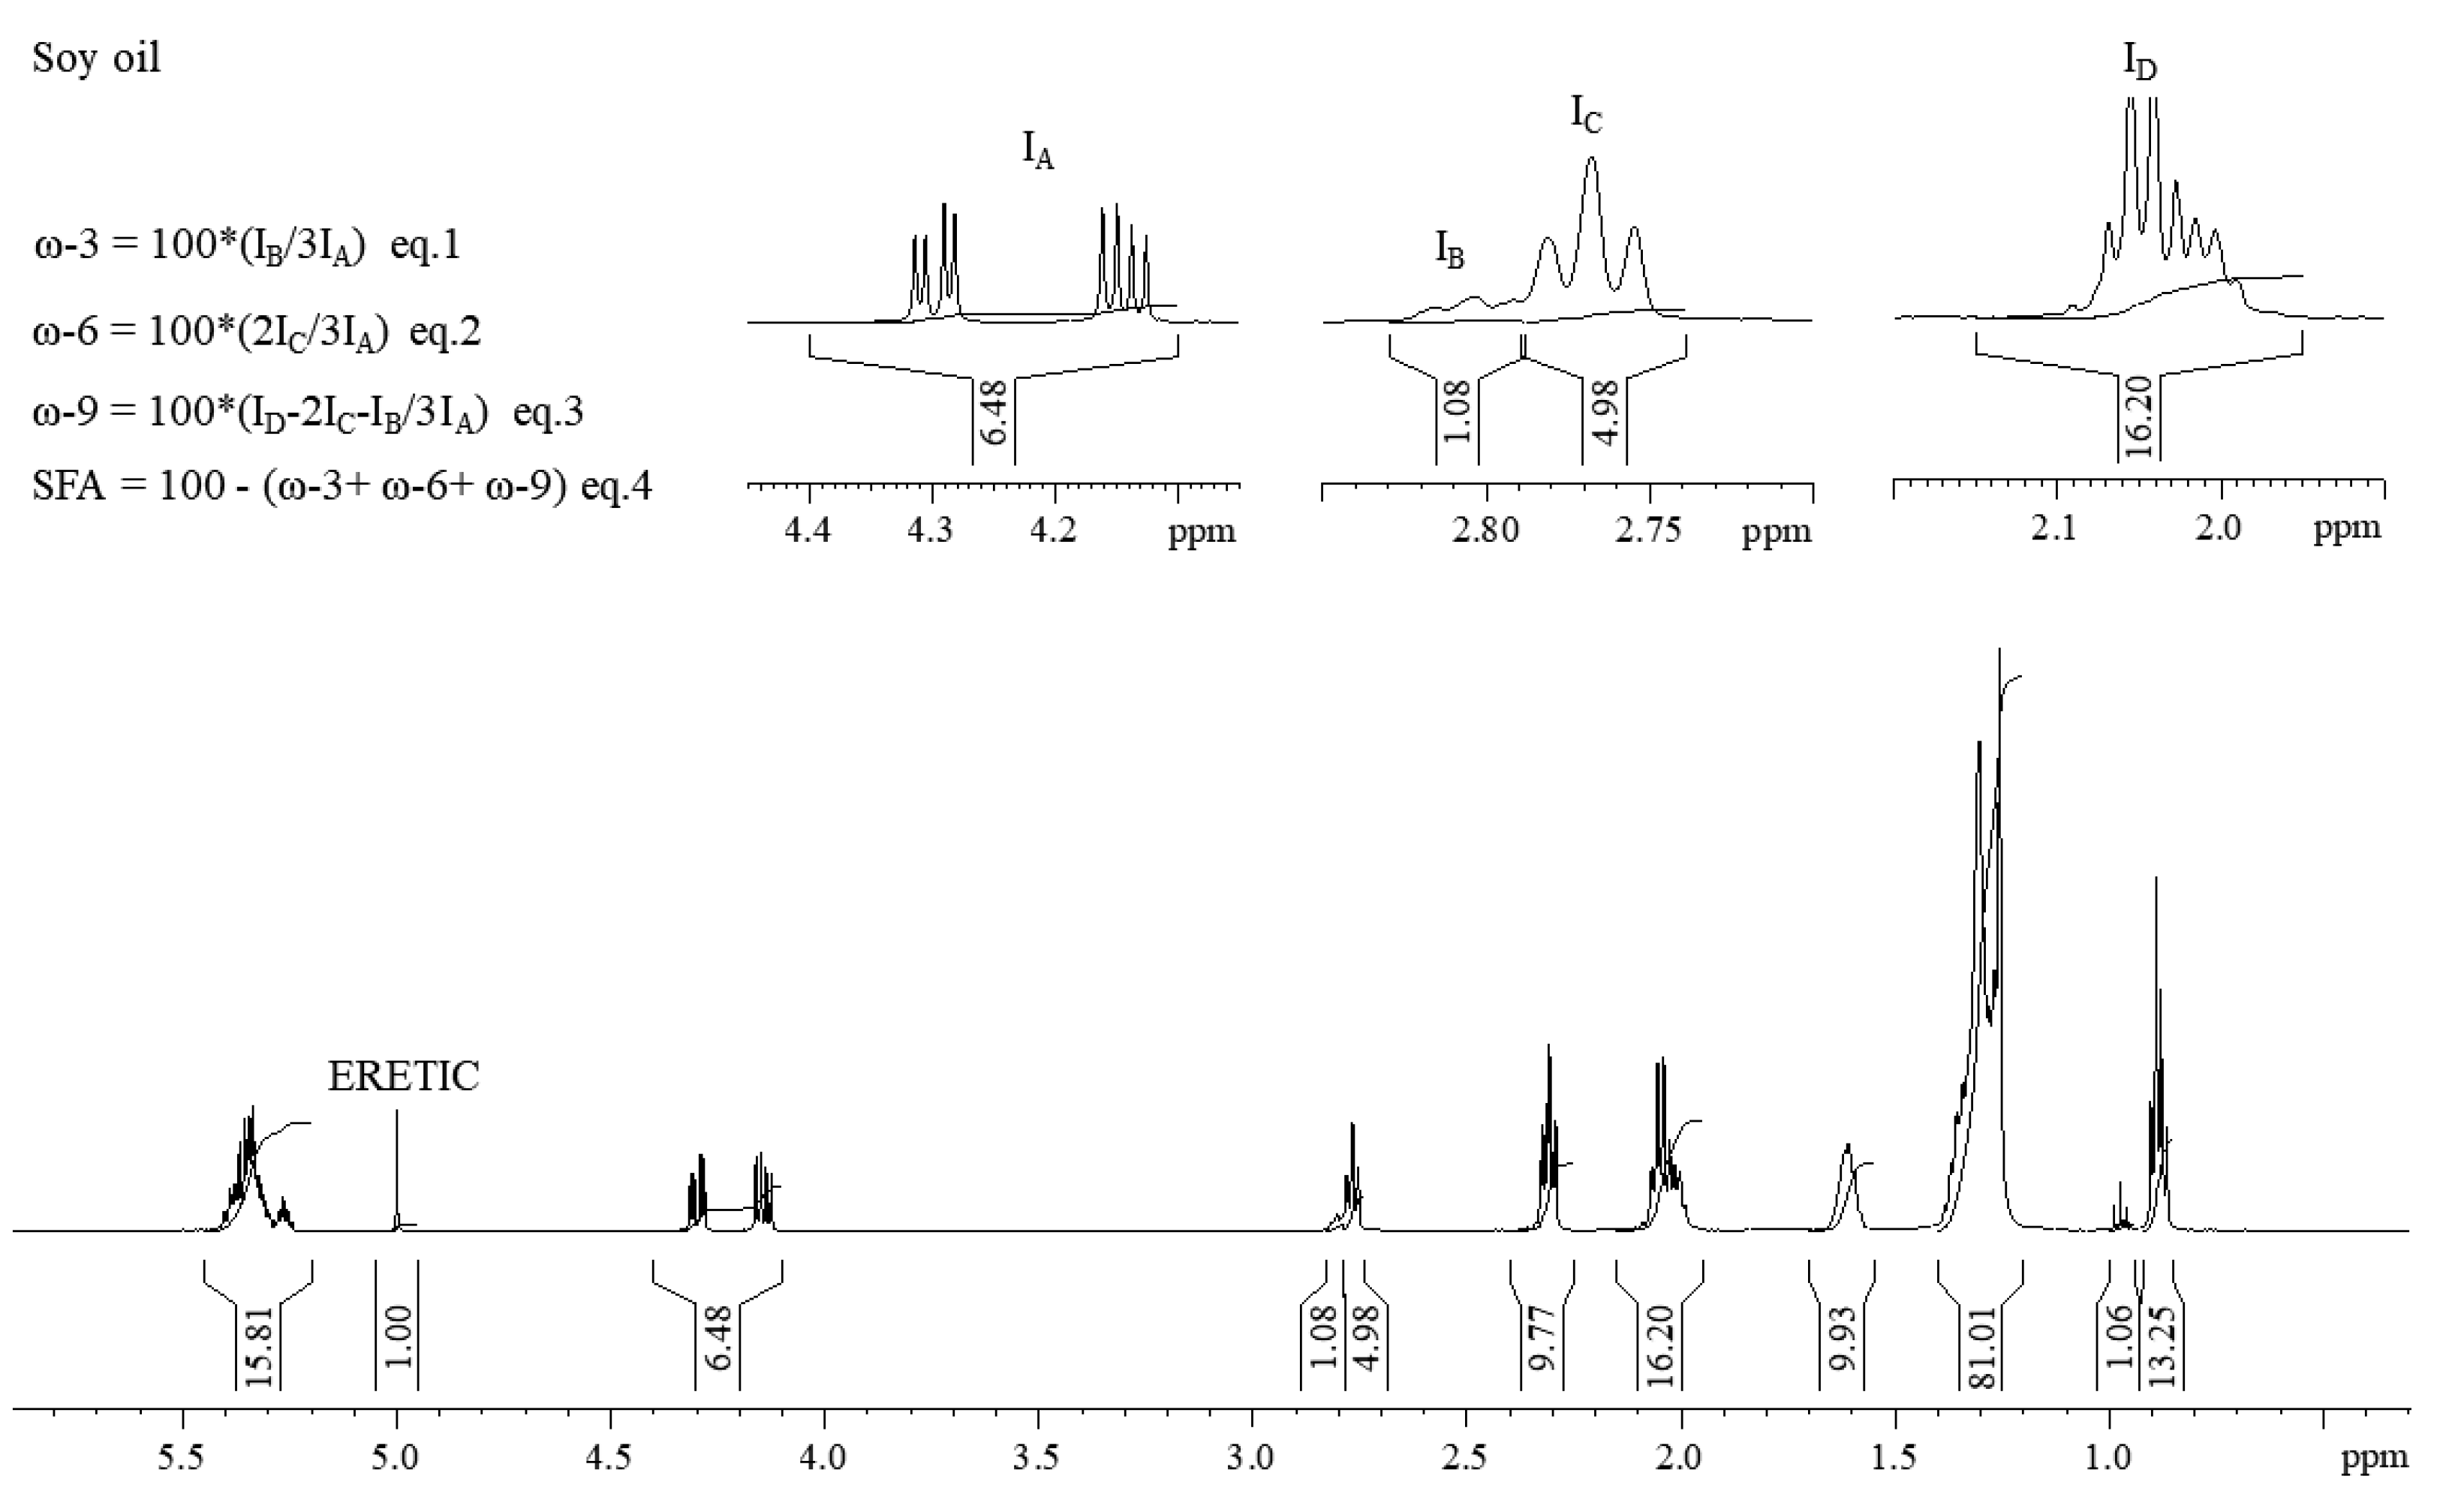
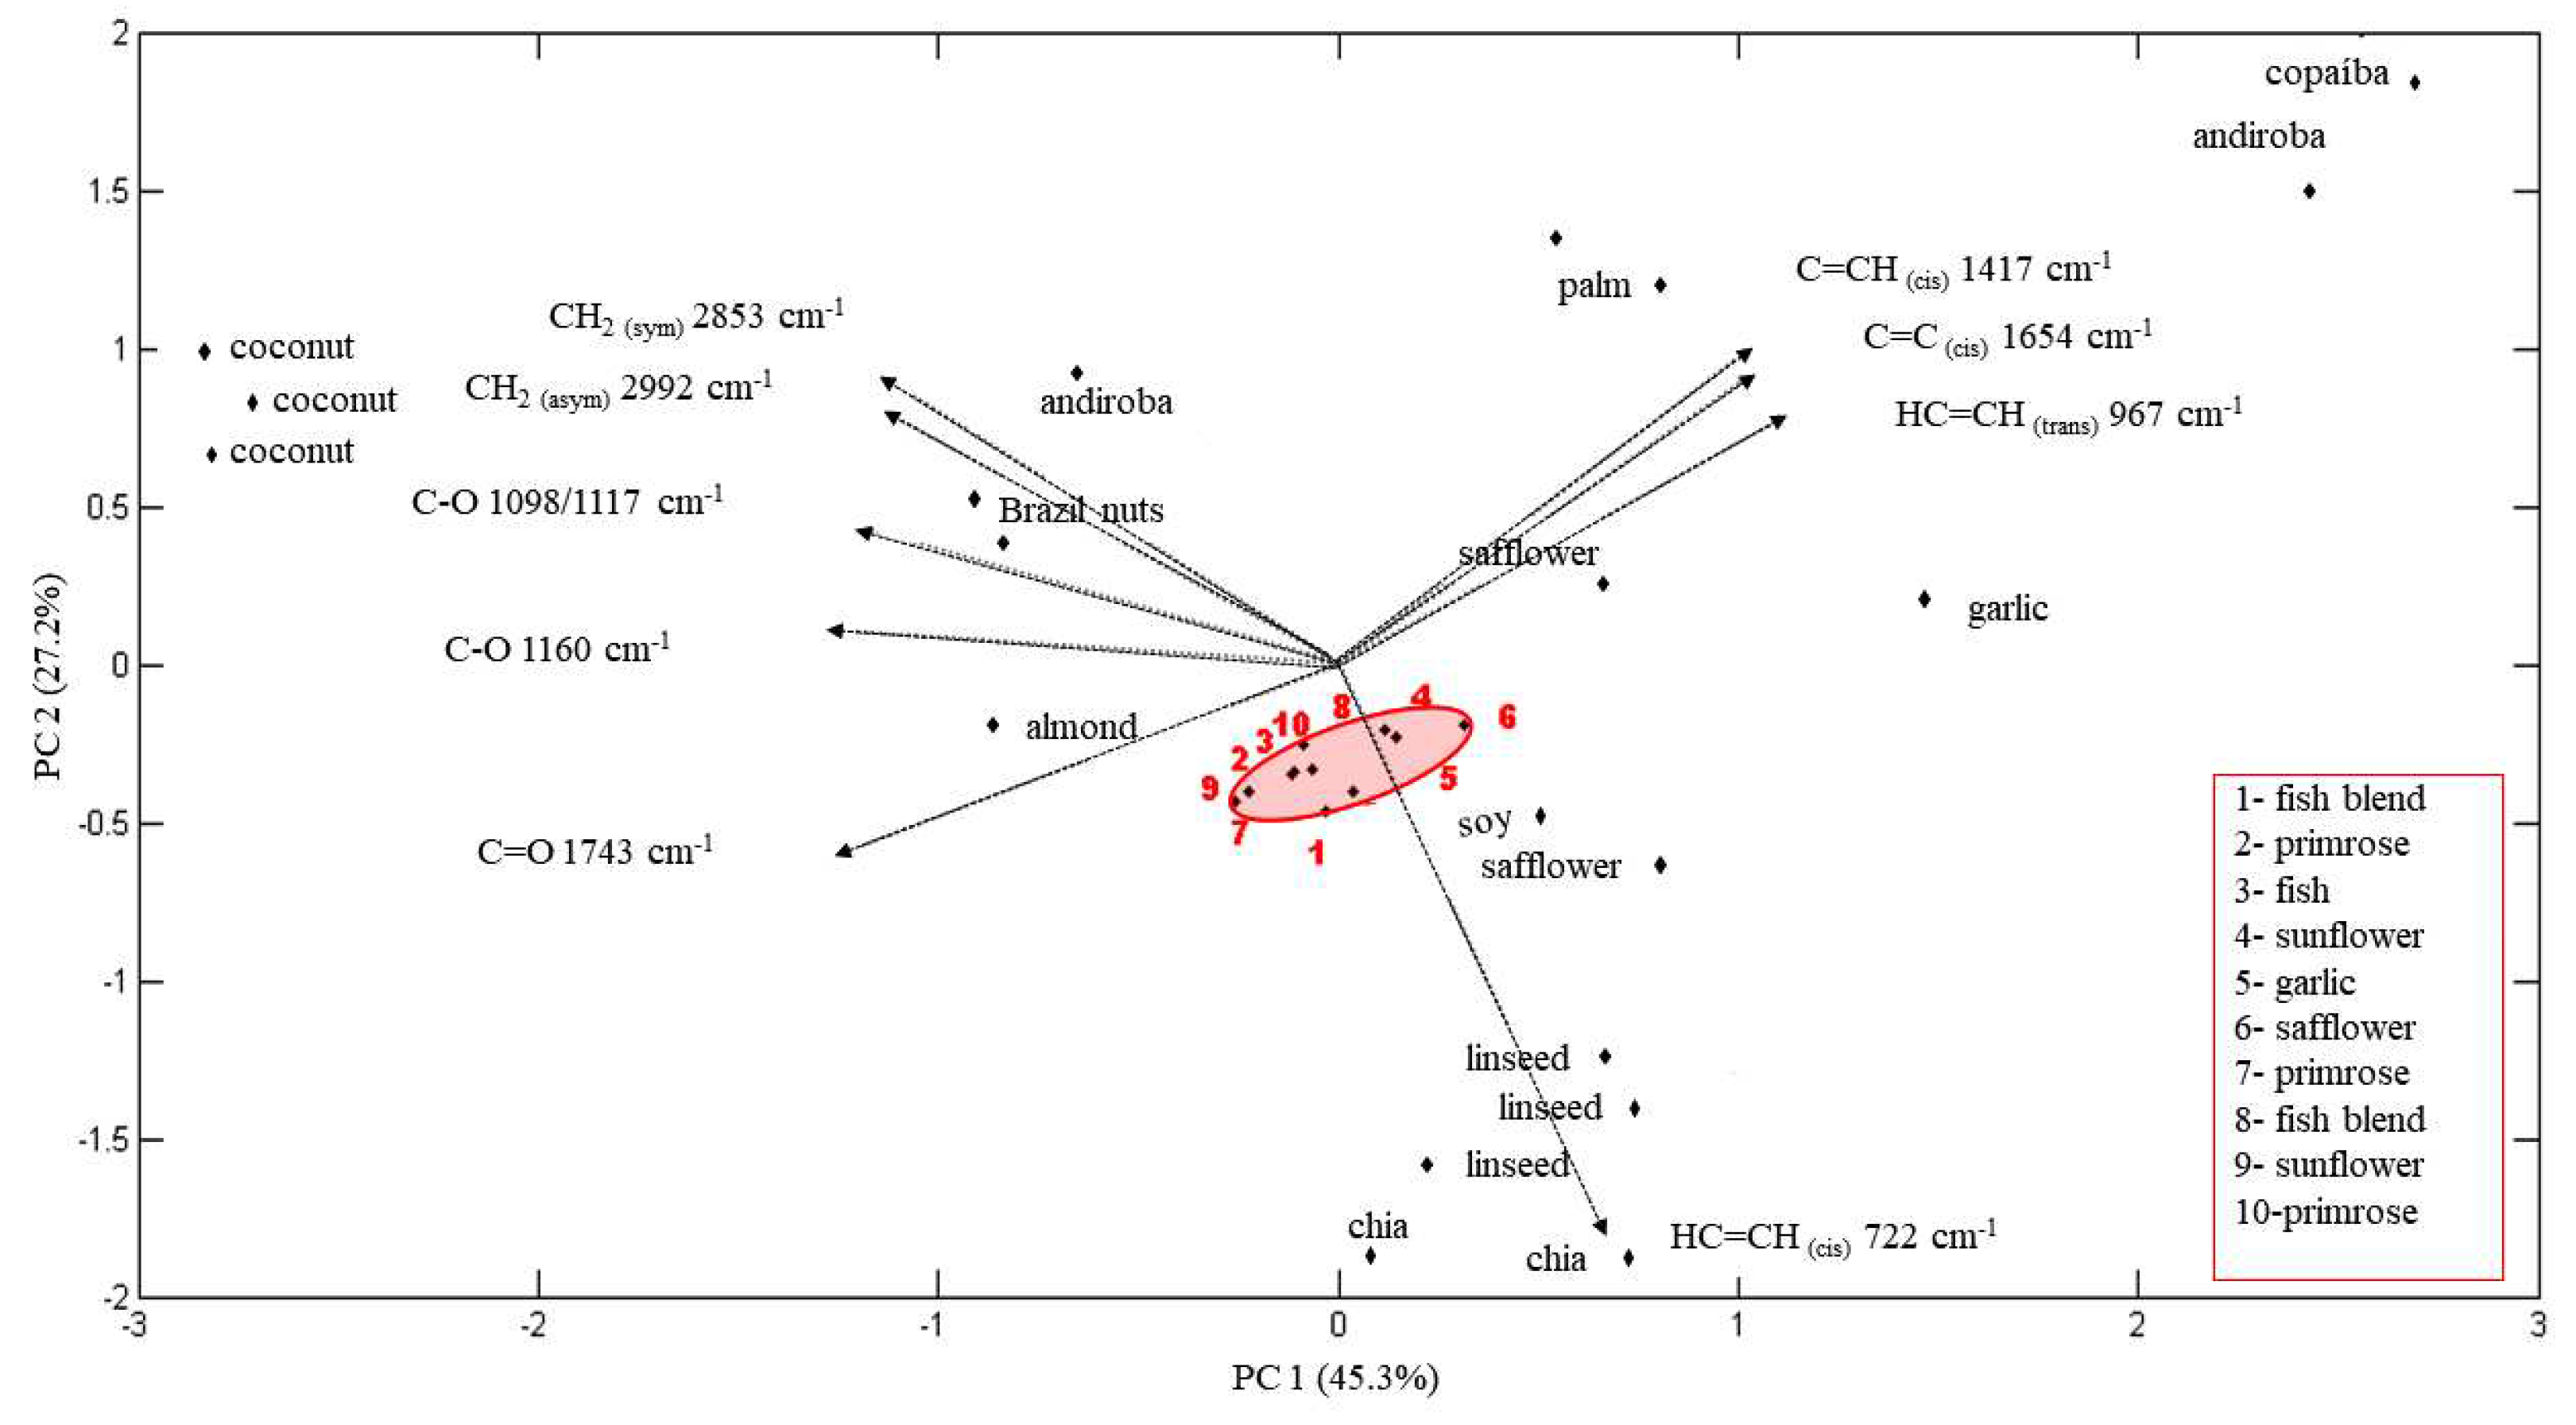
| δ 1H (ppm) | Multiplicities (J Hz) | Group | Assignment |
|---|---|---|---|
| 0.87 | t (6.7) | -CH3 | SFAs and MUFA (omega-9) acyl group |
| 0.89 | t (6.7) | -CH3 | linoleic acid (omega-6) acyl groups |
| 0.97 | t (7.5) | -CH3 | omega-3 acyl groups |
| 1.20-1.40 | m | -(CH2)n | acyl groups of all fatty acids |
| 1.55-1.65 | m | –CH2–CH2-COO- | PUFAs, except DHA |
| 1.95-2.10 | m | -CH2-CH=CH- | PUFAs, except for DHA |
| 2.30 | t (7.5) | –CH2-COO- | acyl group, except DHA |
| 2.33 | t (7.5) | –CH2-COO- | Free fatty acids |
| 2.43 | m | –CH2-COO- | DHA acyl group |
| 2.77 | t (6.5) | =HC-CH2-CH=- | bis-allylic hydrogen of omega-6 PUFAs |
| 2.80 | t (6.3) | =HC-CH2-CH=- | bis-allylic hydrogen of omega-3 PUFAs |
| 3.73 | dd (1.4, 4.9) | -CH2-OH | 1,2-diglycerides |
| 4.07 | m | -CH-OH | 1,3-diglycerides |
| 4.14 | dd (6.0, 11.8) | -CH2-OCOR- | glyceryl group of TG |
| 4.30 | dd (4.4,11.8) | -CH2-OCOR- | glyceryl group of TG |
| 5.26 | m | -CHOCOR | glyceryl group of TG |
| 5.34 | m | -CH=CH- | PUFAs acyl groups |
| Vegetable source | ||||
|---|---|---|---|---|
| Sample | SFA | PUFA (ω-3, %) | PUFA (ω-6, %) | MUFA (ω-9, %) |
| Almond | 45.3±1.0 | 4.8±1.5 | 10.7±0.7 | 39.1±0.9 |
| Andiroba | 57.5±0.6 | 3.4±0.3 | 12.3±1.1 | 26.8±0.7 |
| Brazil nut | 56.0±0.9 | 6.5±0.3 | 12.9±1.2 | 24.6±1.4 |
| Chia | 21.4±1.1 | 48.5±1.1 | 19.0±0.9 | 11.1±1.2 |
| Coconut | 68.8±0.4 | 3.7±0.5 | 2.0±0.2 | 30.5±0.5 |
| Copaiba | 39.8±0.8 | 6.4±0.5 | 29.6±1.0 | 24.2±1.1 |
| Garlic | 35.4±1.1 | 5.5±1.0 | 15.9±0.8 | 43.2±1.5 |
| linseed | 19.1±1.0 | 46.3±1.1 | 17.9±0.8 | 16.7±1.3 |
| Palm | 63.9±1.3 | 5.1±0.8 | 5.8±0.6 | 25.2±0.7 |
| Primrose | 21.6±0.5 | 50.9±0.5 | 4.2±0.4 | 12.8±0.8 |
| Safflower | 55.0±0.6 | 4.2±0.4 | 7.2±0.9 | 33.6±0.7 |
| Soy | 16.9±1.1 | 9.6±0.3 | 41.0±1.3 | 32.5±1.8 |
| Sunflower | 28.9±0.6 | 14.3±0.3 | 14.4±0.7 | 42.4±0.8 |
| Animal source | ||||
| Fish (blends) | 43.7±0.4 | 10.1±0.6 | 14.9±0.7 | 31.3±0.5 |
| Fish | 51.4±0.5 | 22.0±0.5 | 13.8±0.8 | 12.8±0.3 |
Disclaimer/Publisher’s Note: The statements, opinions and data contained in all publications are solely those of the individual author(s) and contributor(s) and not of MDPI and/or the editor(s). MDPI and/or the editor(s) disclaim responsibility for any injury to people or property resulting from any ideas, methods, instructions or products referred to in the content. |
© 2024 by the authors. Licensee MDPI, Basel, Switzerland. This article is an open access article distributed under the terms and conditions of the Creative Commons Attribution (CC BY) license (http://creativecommons.org/licenses/by/4.0/).


