Preprint
Article

Microbiome Dysbiosis Associates to Castration Resistance and Cancer Stemness in Metastatic Prostate Cancer

Altmetrics

Downloads

170

Views

93

Comments

0

A peer-reviewed article of this preprint also exists.

This version is not peer-reviewed

Submitted:

10 February 2024

Posted:

12 February 2024

You are already at the latest version

Alerts
Abstract
Prostate cancer is the second leading cause of death in males in America, with advanced prostate cancers exhibiting a 5-year survival rate of only 32%. Castration-resistance is often developed during the course of treatment, though its influences require further understanding. This study explores the human microbiome for its implications in castration-resistance and metastasis in prostate cancer. RNA sequencing data was downloaded for bone and soft tissue biopsies of patients with metastatic castration-resistant prostate cancer. These sequences were mapped to bacterial sequences to yield species-level abundance approximations. Numerous species were found to correlate to the expression of known markers of castration-resistance, including AR, PI3K, and AKT. Castration-resistance-associated signaling pathways were also enriched with these species, including PI3K-AKT signaling and endocrine resistance. For their implications in cancer aggression and metastasis, cancer stem cell markers were further explored for relation to these species. EGFR and SLC3A2 were widely downregulated with greater abundance of most species. Our results suggest that the microbiome is heavily associated with castration-resistance and stemness in prostate cancer. By considering the microbiome’s importance in these factors, we may better understand the highly aggressive and highly invasive nature of prostate cancer, allowing for needed improvement in the treatment of this disease.
Keywords: 
Subject: Medicine and Pharmacology  -   Oncology and Oncogenics

1. Introduction

Prostate cancer is the second leading cause of death in males in America [1,2]. It is estimated that roughly one in eight men will be diagnosed with prostate cancer in his lifetime [1,2]. These cancers are classified as either localized, regional, or distant based on the degree by which they’ve metastasized to other bodily sites. Localized and regional prostate cancers are rarely fatal, though distant prostate cancers exhibit a 5-year survival rate of only 32% [1]. Understanding the factors that promote the acquisition of the more aggressive stage is crucial to improving these patients’ survival.
The growth and proliferation of prostate cancers are known to be heavily mediated by testosterone signaling [3]. In a healthy individual, testosterone is capable of binding to and activating the androgen receptor (AR) protein, which then stimulates the production of secretory proteins in the prostate [4,5]. Through mechanisms less understood, AR signaling is also known to cause specific genomic deletions, amplifications, and translocations that promote the growth and proliferation of prostate cancers [4,5]. As such, androgen deprivation therapies are commonly implemented as treatments for high-risk prostate cancers [6]. These largely include medical and surgical castrations [6]. Nonetheless, these therapies yield fairly poor survival rates, as the patients who undergo castration likely have more advanced diseases [6,7]. Many patients develop castration-resistance (CR), which is defined by sustained growth of a cancer despite serum testosterone levels being at or below the level expected with castration. The mechanisms by which prostate cancers acquire this resistance are well characterized, with AR signaling being integral to many [8]. These involve mutations in AR, mutations in AR coactivators and corepressors, androgen-independent activation of AR, and alternate means of androgen biosynthesis [8]. In these cases, AR signaling inhibitors are often prescribed as an adjuvant treatment to androgen deprivation therapy [9,10,11,12,13,14]. However, many patients remain insensitive to these as well [15], with few treatment options available thereafter. The median survival length for non-metastatic castration-resistant prostate cancer (CRPC) cases is estimated to be 30.3 months, and that for metastatic CRPC cases is only 13.3 months. Understanding the factors that influence the acquisition of CR in prostate cancers may significantly improve our ability to treat these diseases. Understanding the influences of metastasis in CRPC may prove doubly useful.
Numerous genetic factors have been identified for their implications in CRPC, primarily comprised of mutations in the genes of the AR signaling pathway [8]. Metastatic contributors have been identified, too, and include the loss of PTEN, aberrations in the PI3K-AKT signaling pathway, and the acquisition of DNA repair defects [16]. The degree of stemness observed of a cancer is also known to influence CR and metastasis [17,18,19]. Cancer stem cells (CSC) are thought to compose only about 1% of tumor’s mass, though they are crucial toward the tumor’s growth and proliferation [20]. CSCs are believed to originate from epithelial cells through a process known as epithelial-mesenchymal transition (EMT) [21]. In this process, malignant epithelial cells gain mesenchymal-like traits, and become highly invasive in doing so [22]. The formation of CSCs through the process of EMT provides a tumor with a high capacity for colonization, ultimately promoting the cancer’s metastasis [17,18,19].
The influences of epigenetic factors in CRPC are less explored, though the human microbiome may be highly relevant. The human microbiome is a collection of microorganisms that populate the gastrointestinal system [23]. The microbiome has become increasingly implicated in human diseases, including inflammatory bowel disease, psoriasis, and diabetes among others [24,25]. The microbiome is thought to influence an array of biological pathways, largely through metabolite-mediated immune modulation [26,27]. As such, studies have also characterized the microbiome for its implication in various cancers, particularly colorectal cancers [28,29,30,31]. Less is known regarding the microbiome’s influence beyond the gastrointestinal system, though numerous studies have demonstrated the importance of the microbiome in the development and progression of prostate cancer [32,33]. Specific dysbioses of the gut microbiome have been identified between castration-sensitive (CS) and CR prostate cancers [33]. Moreover, antibiotic therapies and fecal transplants in mouse models have demonstrated the gut microbiome’s ability to modulate the effectiveness of androgen deprivation therapy [34]. The mechanisms of these relations are less understood.
Hence, this study attempts to characterize microbiome dysbioses for correlations to both CR and cancer stemness. RNA sequencing data was downloaded for bone and soft tissue biopsies of patients with metastatic CRPC across two studies: phs000915 (n = 147) and phs001141 (n = 143). These sequences were mapped to bacterial sequences to yield species-level abundance approximations in each sample. We identified exact correlations of these species to known transcriptional markers of CR and cancer stemness. Further, we observed enrichment of the AR, PI3K-AKT, and endocrine resistance signaling pathways with respect to these species’ abundances. Specific enrichment of EMT and pluripotency signaling was also observed. We propose that the human microbiome is heavily associated with CR and metastasis in prostate cancer. Through this investigation, we may better understand the pathology of metastatic CRPC, creating new avenues of research as to the treatment of this disease.

2. Results

2.1. Cross-Study Normalization and Contamination Correction

In order to account for variation in the sequencing procedures of the chosen datasets, cumulative sum scaling was performed as a means of normalization (see Materials and Methods). PCoA was conducted to demonstrate the effectiveness of this technique. In this analysis, the abundance values of all species in a sample are reduced into several arbitrary dimensions. The proximity of one sample to another is reflective of wholistic similarities in the samples’ abundance profiles. The samples were analyzed both before (Figure 1A) and after (Figure 1B) the normalization procedures were performed. After normalization, the samples were observed to be of closer proximity, with fewer outliers present. This served to confirm the compatibility of the chosen samples for further analyses. Cumulative sum scaling was similarly performed on the samples’ gene expression counts.
In tissue extraction and sequencing procedures, there remains the possibility for contaminant species to be introduced into a sample [35]. Contamination correction was performed to identify and exclude these species (see Materials and Methods). To visualize the phylogenic division of these species, they were grouped by class of phylum and plotted in a phylogenic tree (Figure 1C). The bone metastases were found to contain the greatest number of contaminant species, followed by the liver and lymph node metastases.

2.2. Species Abundance Correlates to Castration-Resistance Biomarker Expression

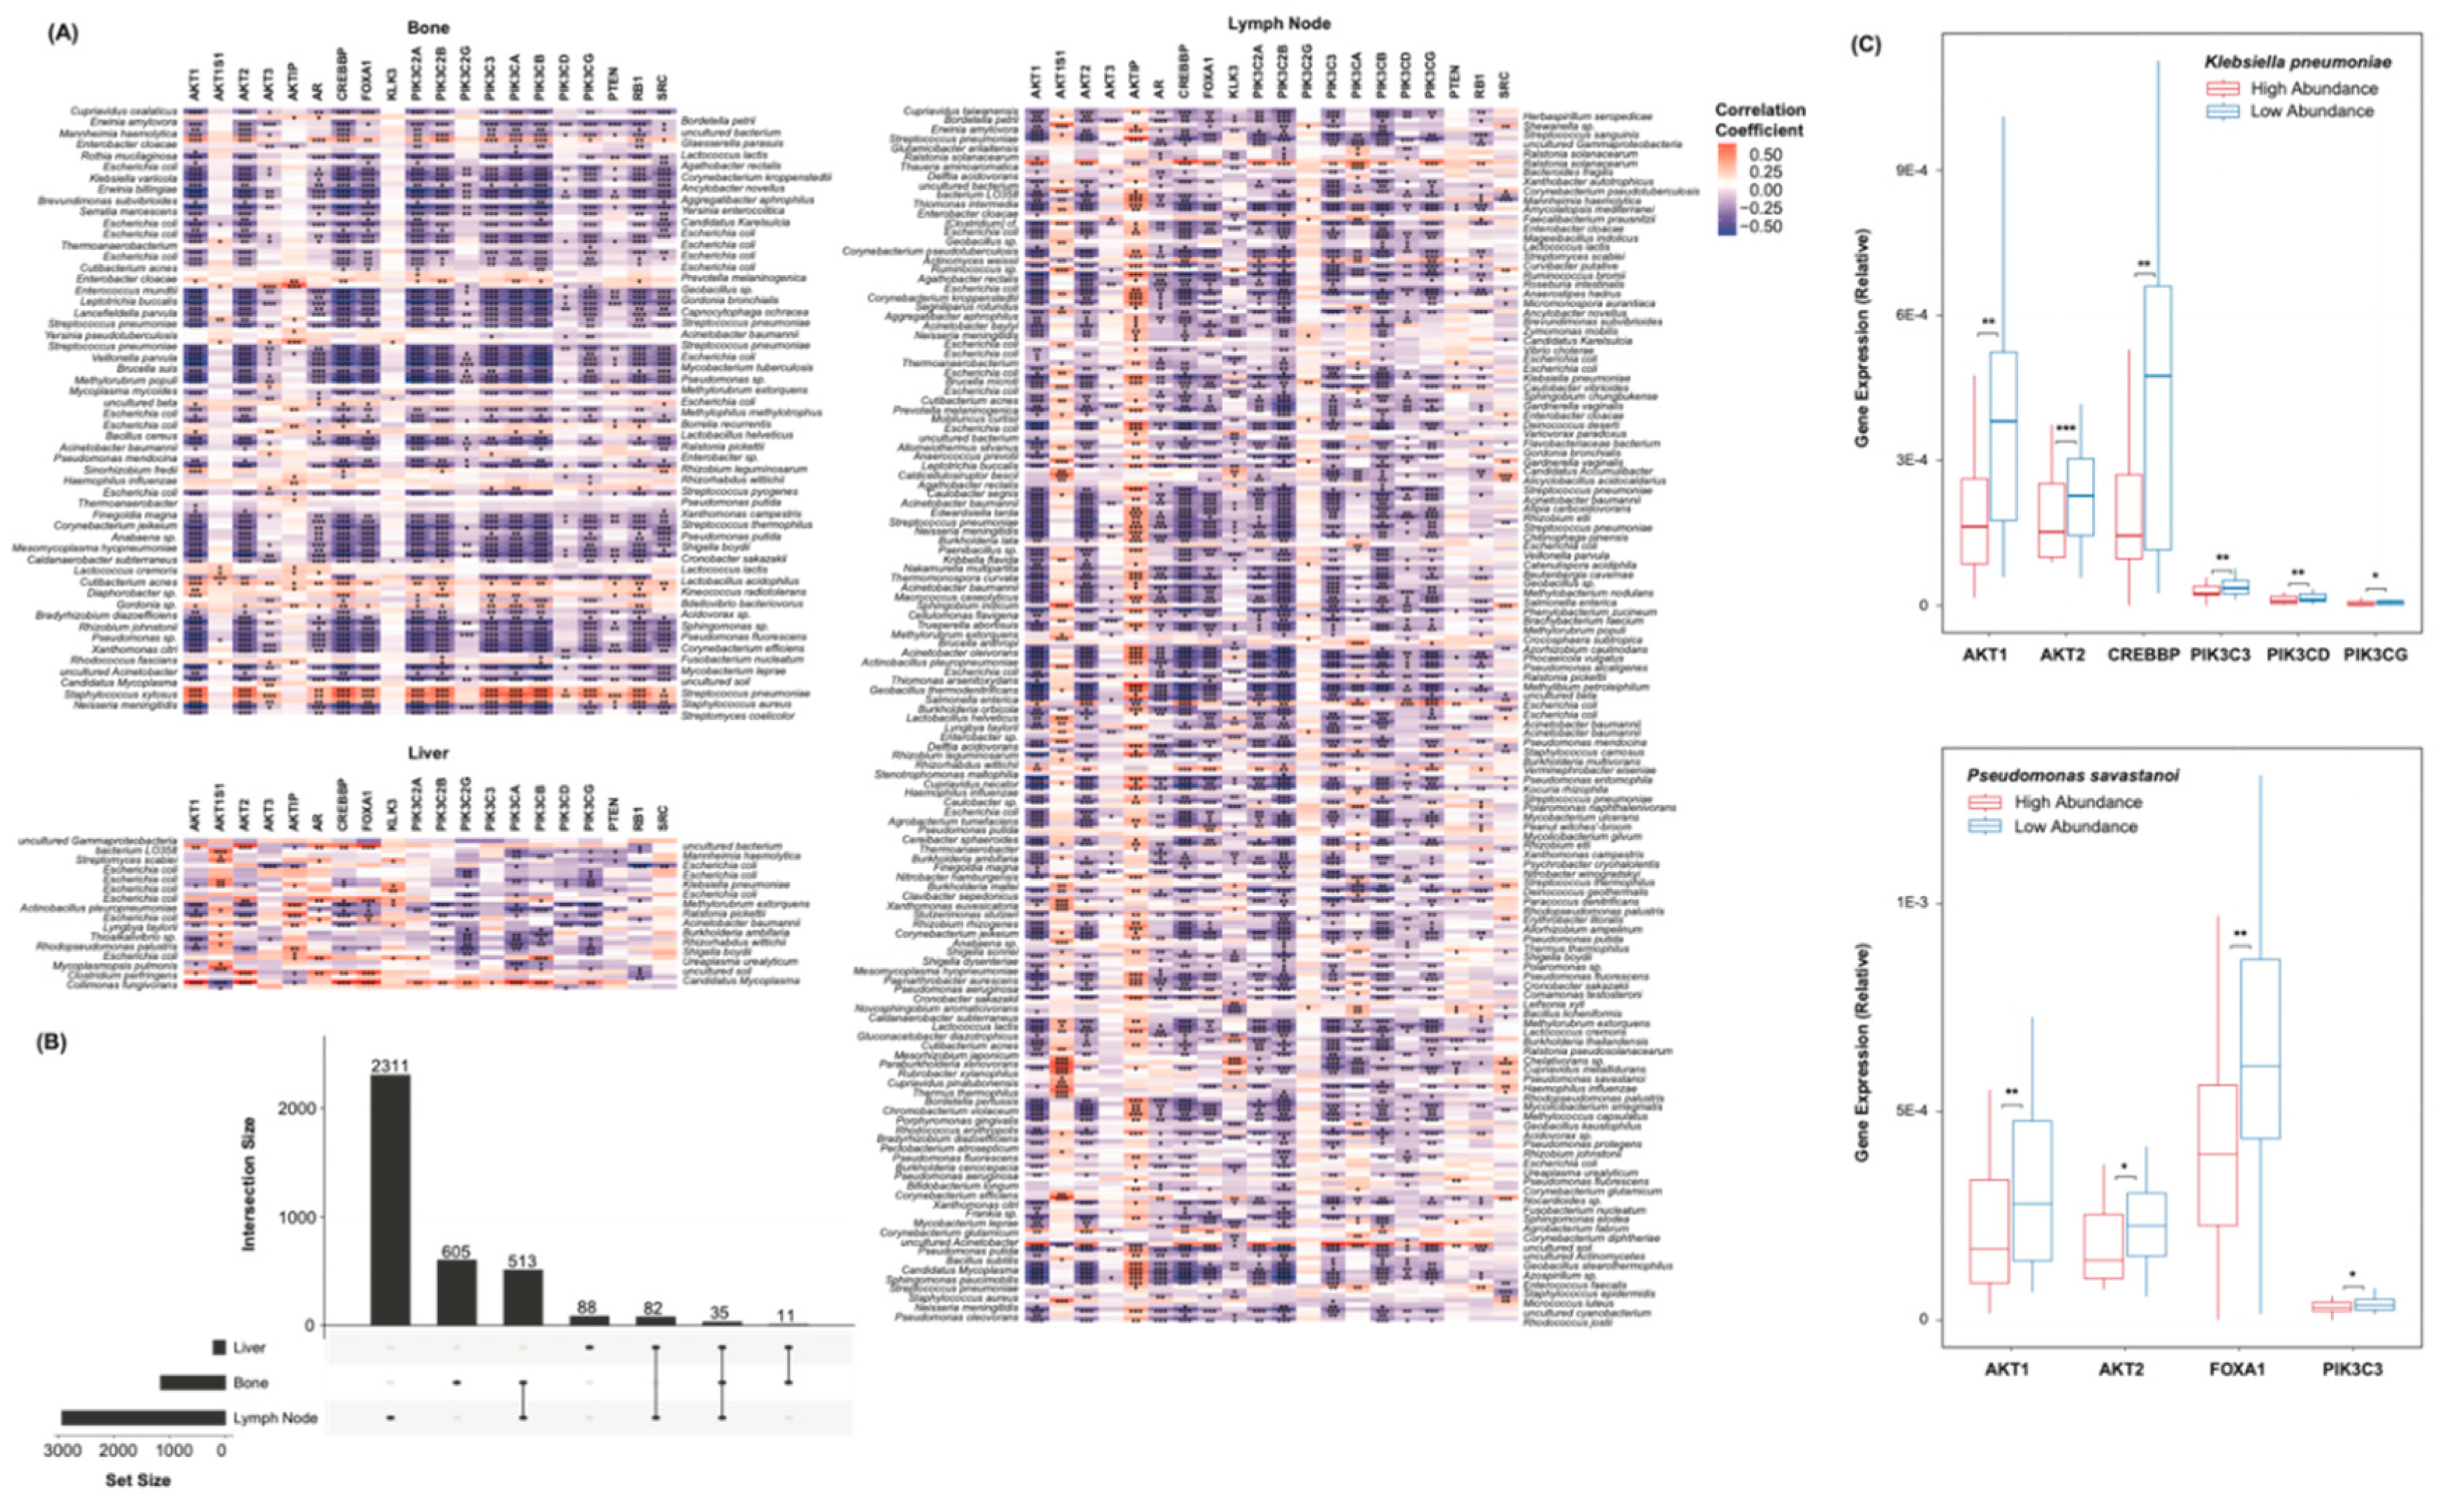
A list of markers known to be implicated in CR at a transcriptional level was collected from literature [16]. Among others, this includes AR, PTEN, several PI3K family genes, and several AKT family genes. Spearman’s correlations were used to assess the relationship between each marker and each species. Of the bone and lymph node cohorts, a remarkable number of species were significantly correlated to these markers (Figure 2A). Among others, greater abundance of Staphylococcus xylosus corresponded to an increase in the expression of all but few of the markers. Lesser abundance of Streptococcus pneumoniae and Veillonella parvula also corresponded to an increase in the markers’ expression. Significance in the liver cohort was less pronounced, though numerous correlations were still observed. The overlap in species-marker correlations between each cohort was further plotted (Figure 2B). 35 significant correlations were common to all sites of metastasis. The abundance values of each species were further simplified to binary “high” or “low” classifications, based on each sample’s relation to the median abundance of that species. The expression counts of several of markers were plotted with respect to the abundance of Klebsiella pneumoniae and Pseudomonas savastanoi (Figure 2C). Lesser abundance of these species corresponded to significantly greater expression of the AKT and PI3K family genes.

2.3. Castration-Resistance Pathway Enrichment

Select KEGG gene sets were chosen to model the cellular pathways of CR. The Prostate Cancer pathway contains many genes of which aberrations are indicative of CR, including AR, CREBBP, and PTEN [16]. PI3K-AKT signaling is known to be dysregulated in CRPC [16]. The Endocrine Resistance pathway was chosen to model resistance to androgen deprivation therapy.
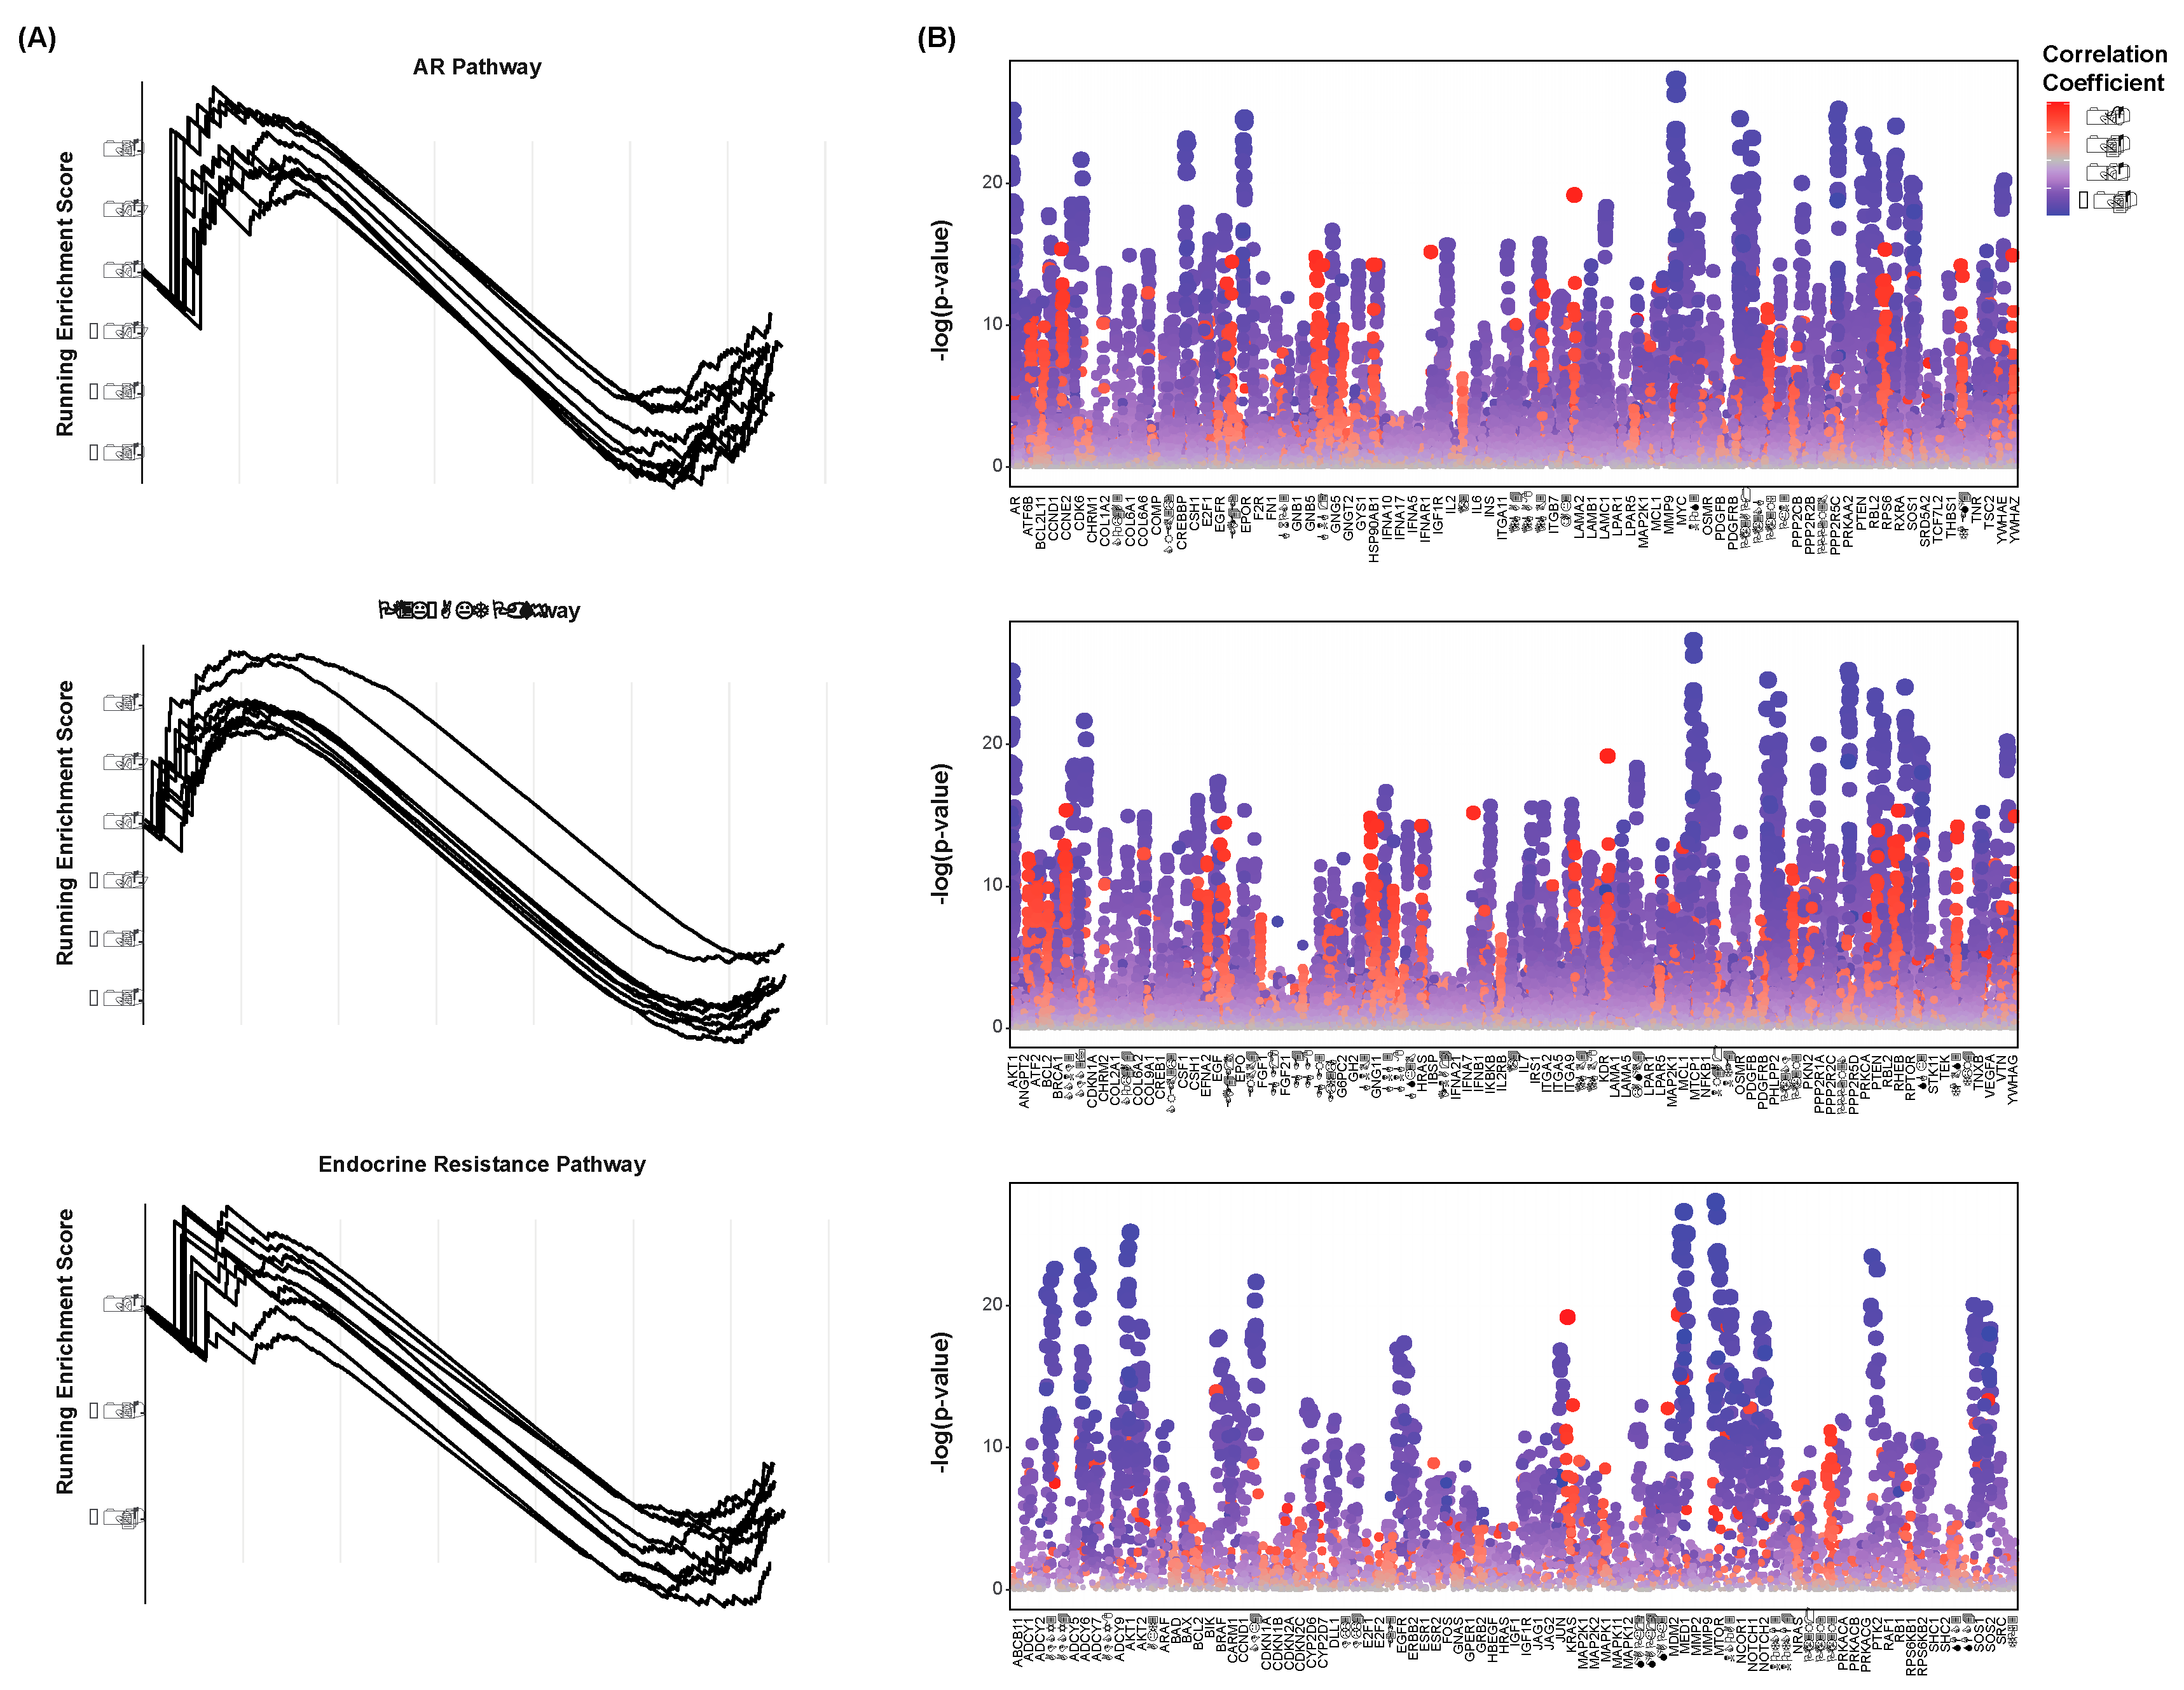
Gene set enrichment analysis was conducted to assess the extent by which each of these pathways was enriched with respect to each species’ abundance. Of the lymph node cohort, enrichment plots were created to visualize the running enrichment score of these pathways with each species (Figure 3A). Only the twenty species with the greatest number of significant correlations to the above CR markers are shown. The peak of each curve indicates the total enrichment score of the pathway. These pathways were found to be negatively enriched with respect to most species, meaning that lesser abundance of these species yields an increase in AR signaling, PIK3-AKT signaling, and endocrine resistance. The individual genes of each pathway were further assessed for correlation to these species’ abundances. This served to determine the significance by which each of the pathways’ components were enriched. Spearman’s correlations were computed between each gene’s expression and each species’ abundance. The resultant correlation coefficients and test statistics were combined for all cohorts and plotted (Figure 3B). Only the twenty species with the greatest number of significant correlations to the above CR markers are shown. When viewed individually, most genes can be noted for their consistently positive or consistently negative correlations to these species. AR and PTEN, for instance, are downregulated with greater abundance of all but few species. This may suggest that the microbiome is generally less diverse in high-risk CRPC patients. Whether these observations are mechanistically linked is unclear, as is the direction of their potential regulation.

2.4. Species Abundance Correlates to Cancer Stem Cell Marker Expression

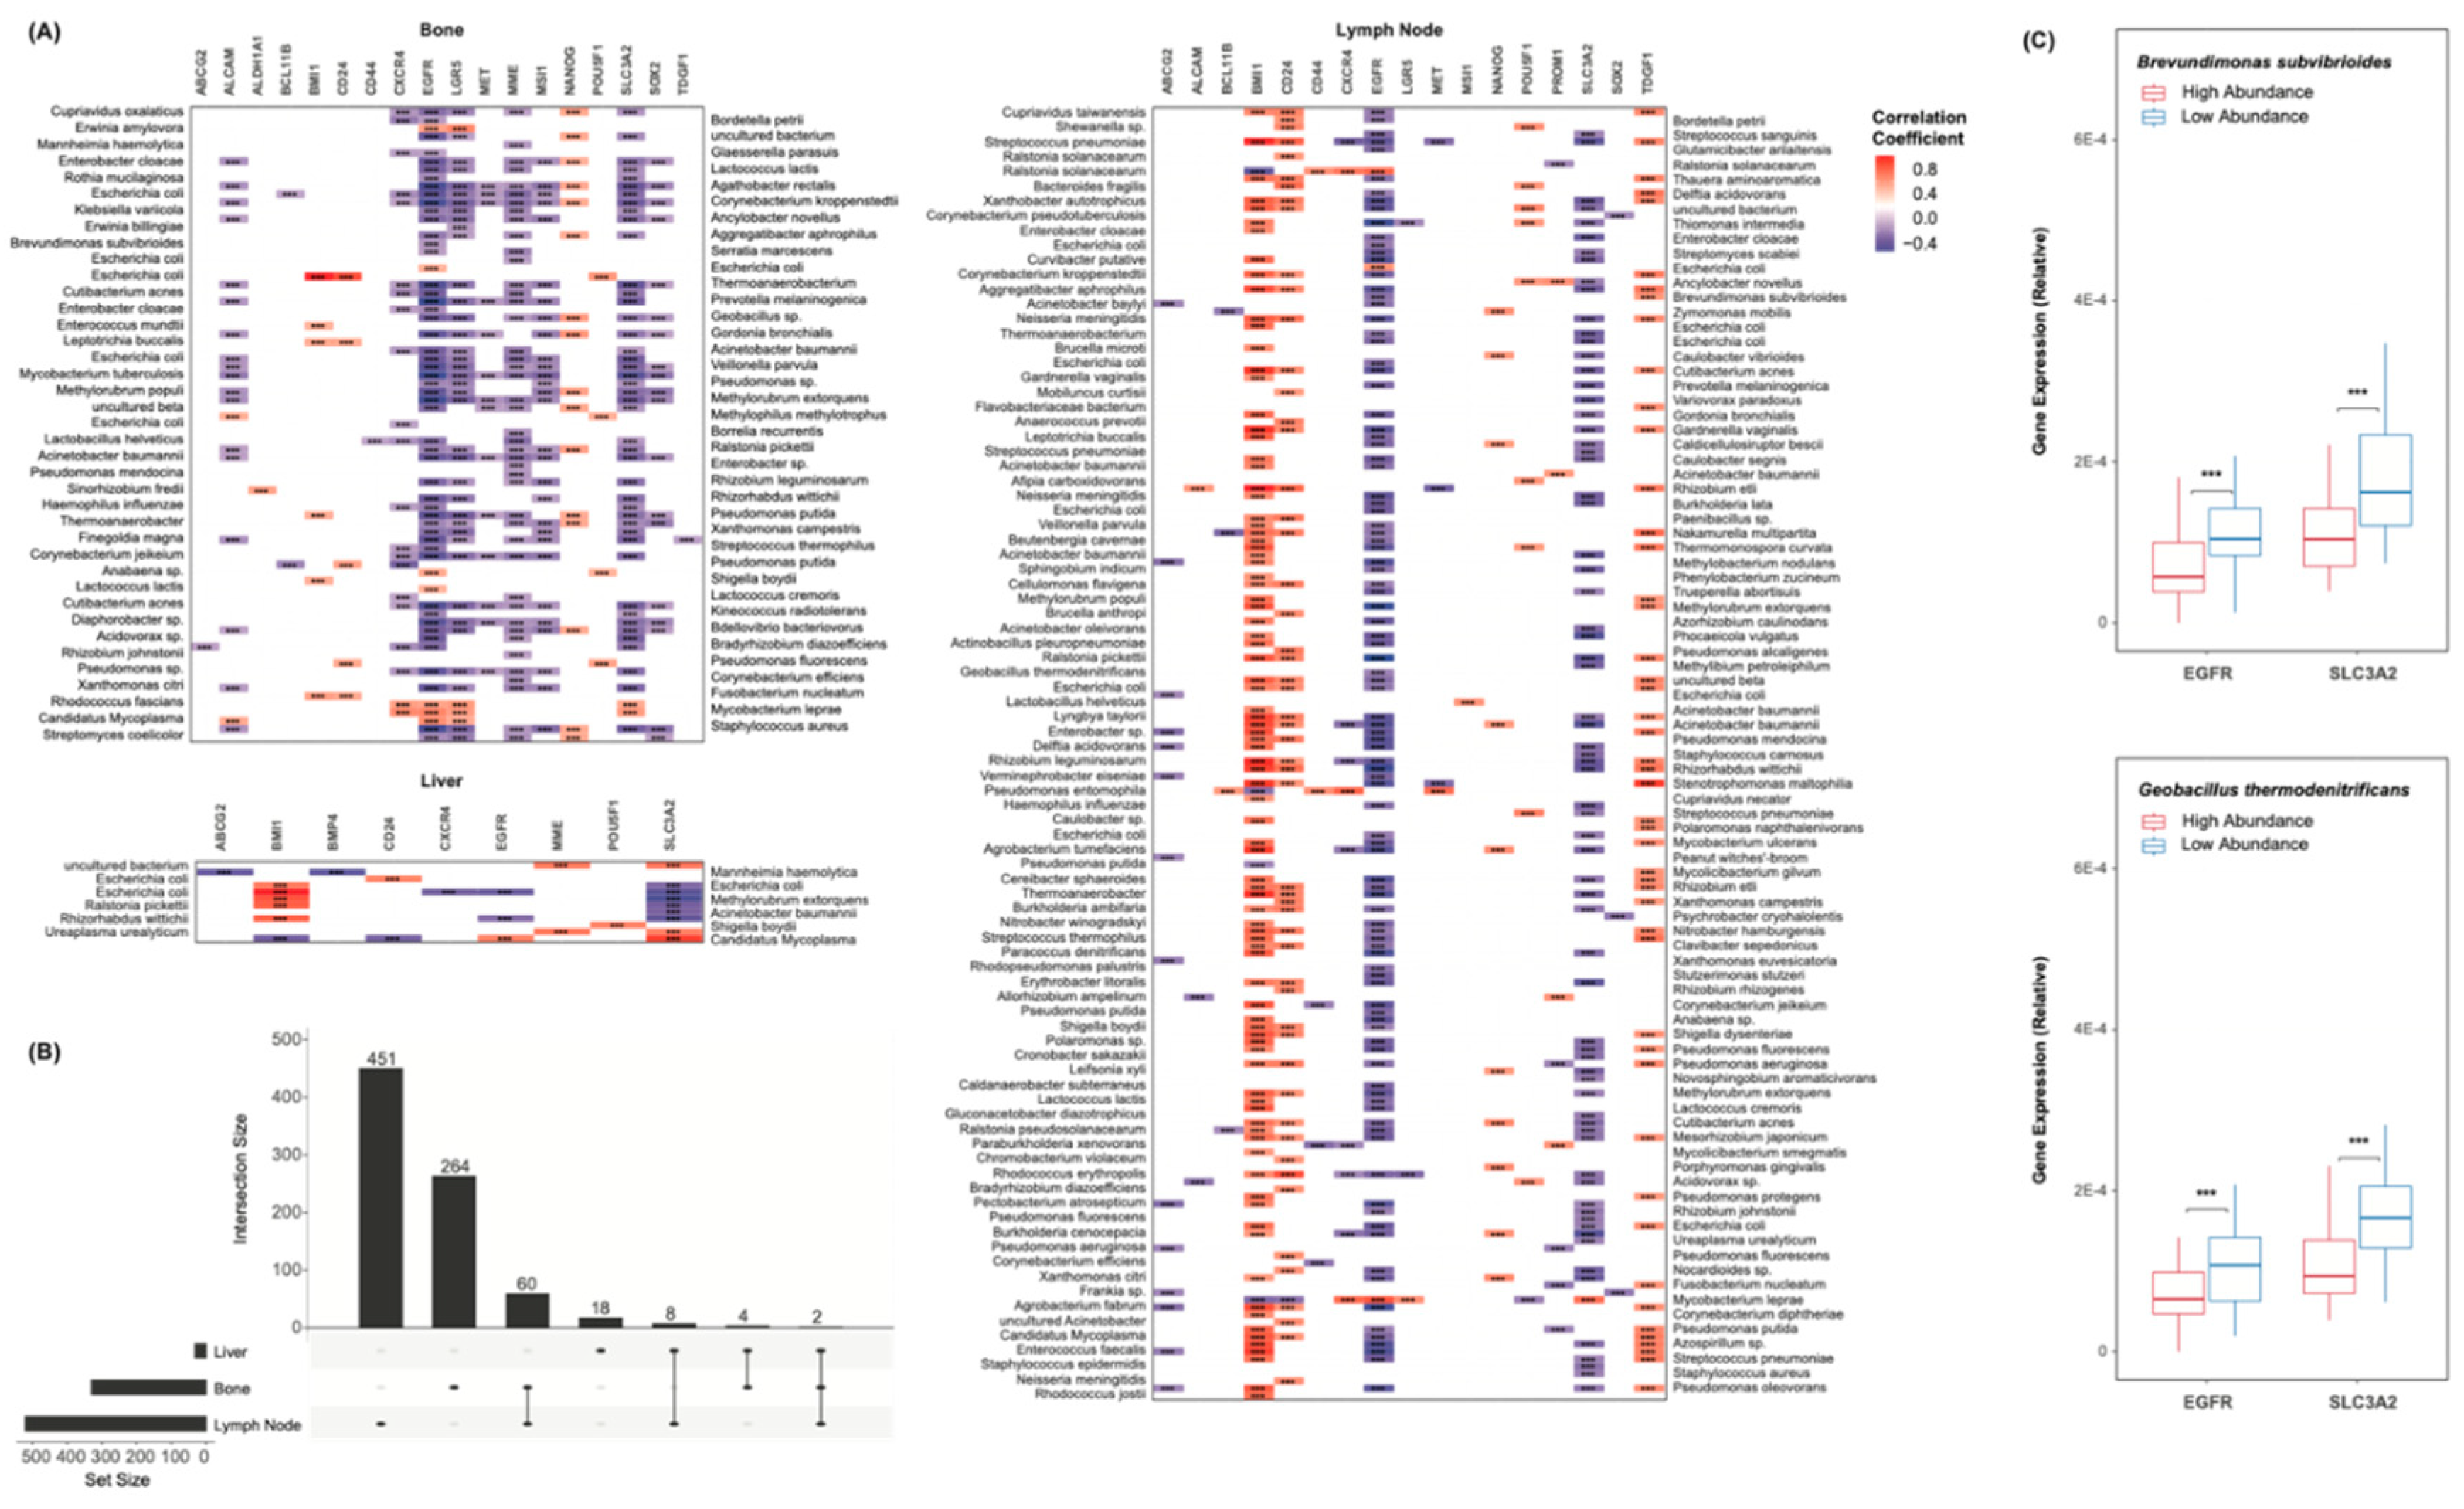
Cancer stemness is known to be heavily implicated in CR and metastasis [17,18,19]. To assess the microbiome’s relation to these factors, a list of transcriptional CSC markers was first collected from literature [36]. Among others, this includes CD44, CXCR4, SOX2, and NANOG. Spearman’s correlations were used to assess the relationship between each marker and each species. Of all cohorts, select markers appeared to be broadly upregulated or broadly downregulated with respect to these species (Figure 4A). EGFR expression was negatively correlated to the abundance of all but a few species, as was SLC3A2. BMI1, CD24, and TDGF1 were widely overexpressed with greater abundance of these species. It is unclear whether these genes are linked to the microbiome mechanistically, though the consistency in the correlations’ directions should be noted. The overlap in species-marker correlations between each cohort was further plotted (Figure 4B). Only 2 significant correlations were common to all sites of metastasis. The abundance values of each species were further simplified to binary “high” or “low” classifications, based on each sample’s relation to the median abundance of that species. The expression counts of EGFR and SLC3A2 were plotted with respect to the abundance of Brevundimonas subvibrioides and Geobacillus thermodenitrificans (Figure 4C). Lesser abundance of these species corresponded to significantly greater expression of these markers.

2.5. Epithelial Mesenchymal Transition and Pluripotency Regulation Pathway Enrichment

CSC formation is believed to be dependent on the invasion of epithelial cells through the process of EMT [21]. The microbiome’s relevance to these processes has been demonstrated [37,38], though not with regards to CR or metastasis in prostate cancer. Select KEGG gene sets were first chosen to model EMT and stemness. The Adherens Junction pathway contains many of the genes involved in EMT, and was chosen to model this process [39]. The Signaling Pathways Regulating Pluripotency of Stem Cells pathway was chosen to model stemness.
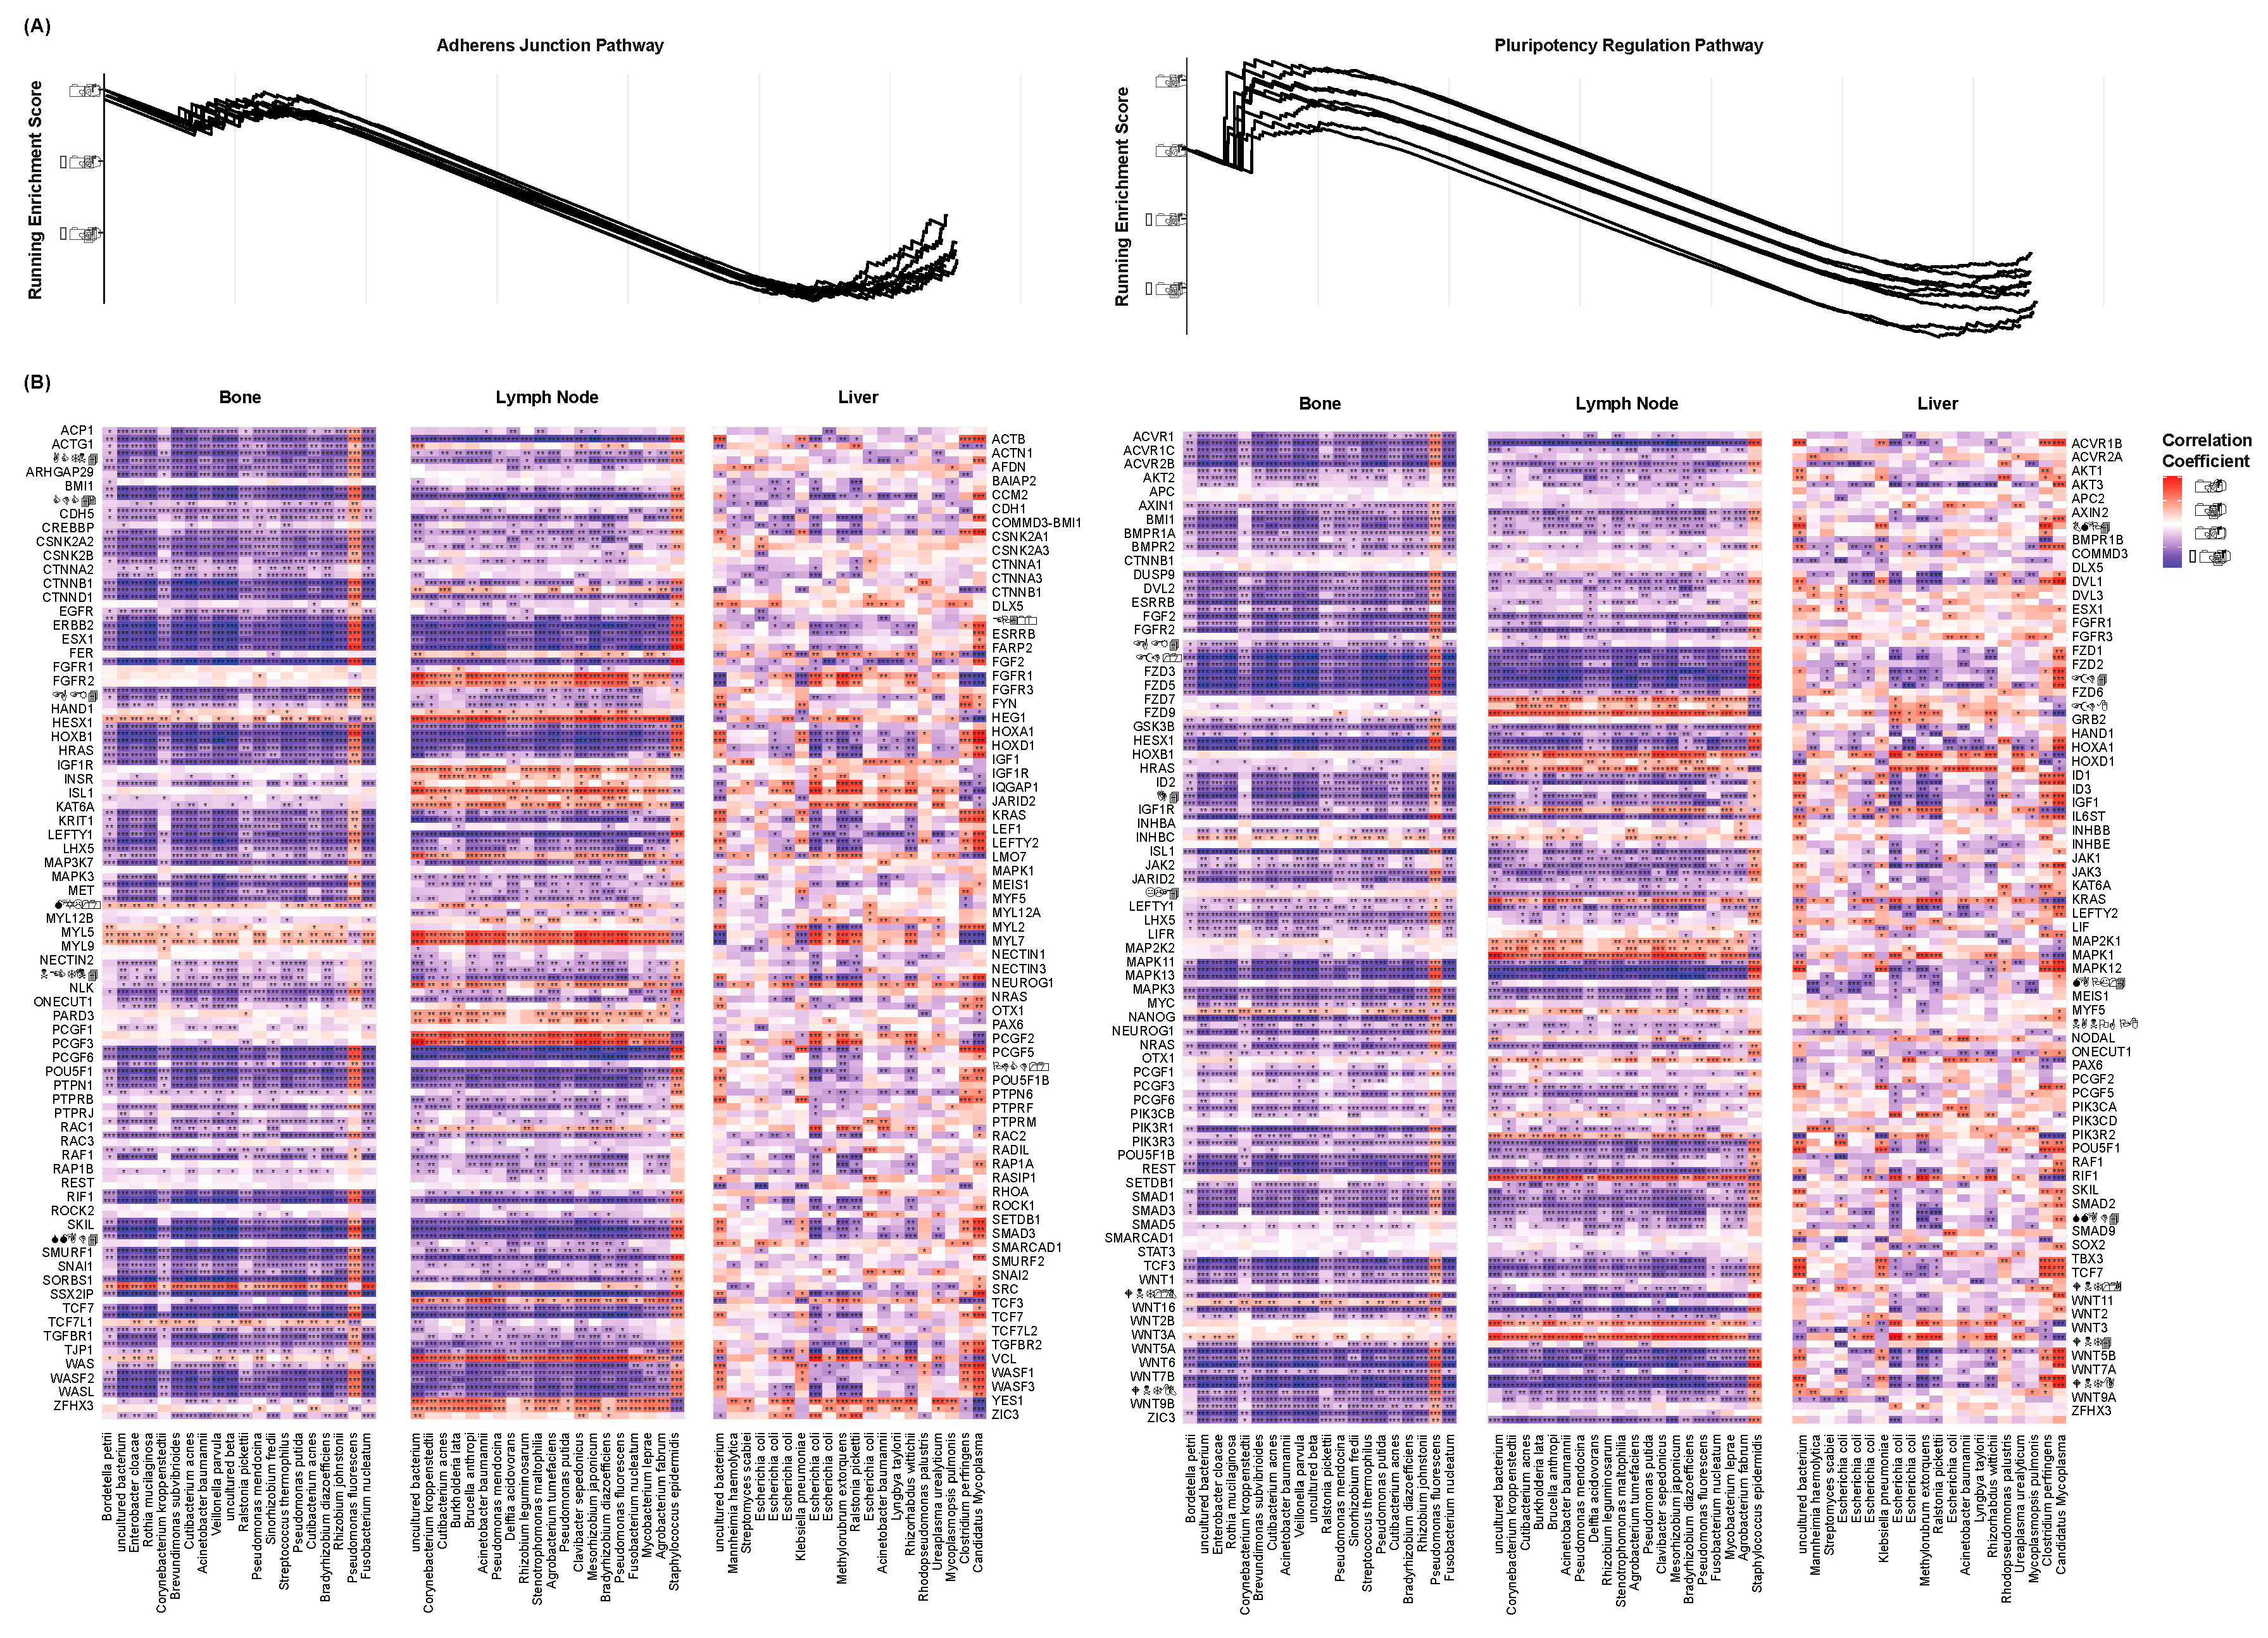
Gene set enrichment analysis was again conducted to assess these pathways for enrichment with respect to each species’ abundance. Of the lymph node cohort, enrichment plots were created to visualize the running enrichment score of these pathways with each species (Figure 5A). Only the twenty species with the greatest number of significant correlations to the above CSC markers are shown. Similar to the above pathways of AR signaling, PI3K-AKT signaling, and endocrine resistance, these pathways were negatively enriched with respect to all but few species. This may indicate that EMT and stemness are greater in patients with a lack of microbial diversity. The individual components of each pathway were further assessed for correlation to these species’ abundances. This served to determine the significance by which each of the pathways’ components were enriched. Spearman’s correlations were computed between each gene’s expression and each species’ abundance. The resultant correlation coefficients and test statistics were plotted for all cohorts (Figure 5B). Only the twenty species with the greatest number of significant correlations to the above CSC markers are shown. Of the bone and lymph node cohorts, the consistency in the genes’ correlational directions can again be noticed. Many of the Wnt family genes of the Adherens Junction pathway are negatively correlated to a majority of the species. This again may suggest the relation between decreased microbial diversity and an increased capacity for invasion and metastasis.

3. Discussion

Our results suggest that the tumoral microbiome is strongly connected to CR in prostate cancer. Of all cohorts, numerous species were observed to correlate significantly to the expression of the chosen CR markers. AR expression was significantly greater in samples with lesser abundance of Veillonella parvula and Streptococcus pneumoniae. The reverse was true of the genus Staphylococcus, which was previously reported to be of greater abundance in prostate cancers [40]. Species of the genus Shewanella were also observed to correlate positively to AR expression, and have been shown to be enriched in malignant prostate cancers [41]. The microbiome is known to be implicated in an array of human diseases, and is thought to exert its effects through the release of metabolites [24,25,26,27]. It is unknown whether these metabolites interact directly with AR or related proteins, though metabolomic analyses may speak to this influence.
Several PI3K and AKT family genes, too, were observed to correlate negatively to many of the species studied, namely Klebsiella pneumoniae and Pseudomonas savastanoi. The PI3K-AKT pathway as a whole was negatively enriched with these species, as well. The effects of probiotics on this pathway have been demonstrated [42]. It is thought that that metabolites of select species are capable of suppressing aberrant activation of this pathway, ultimately suppressing a cancer’s growth [42]. Further metabolomic analysis might confirm the extent by which this is true in CRPC. Nonetheless, the tumoral microbiome appears to closely follow the AR, PI3K-AKT, and endocrine resistance signaling pathways. Specific dysbioses of the microbiome may ultimately be involved in the acquisition of CR in prostate cancer.
We also observed similar microbial relations to cancer stemness and pluripotency. Numerous CSC markers were found to correlate significantly to the abundance of these species, including Brevundimonas subvibrioides and Geobacillus thermodenitrificans. Among these markers, EGFR and SLC3A2 were significantly downregulated with respect to greater abundance of most species. Hence, lesser abundance of these species may correlate to an increase in cancer stemness. Interestingly, androgen deprivation therapy is known to decrease the diversity of the gut microbiome, ultimately yielding a broad decrease in abundance [43,44]. Given the above species-marker correlations, this decrease may correlate to increased EGFR and SLC3A2 expression, increased EGFR and SLC3A2 signaling, and ultimately increased pluripotency [45,46]. Overexpression of EGFR has been shown to be implicated in the metastasis of prostate cancers to bone [47]. SLC3A2 has similarly been shown to regulate proliferation, migration, and therapy resistance in cancer cells [48]. Our analyses demonstrate the microbiome’s correlation to these factors, suggesting it may be involved in the rapid progression of CRPC.
We observed the microbiome’s correlation to the EMT and pluripotency regulation pathways studied, as well. These pathways were negatively enriched with respect to a majority of the species studied. Moreover, many of the pathways’ component genes were consistently downregulated with greater abundance of these species. This was especially pronounced for the Wnt family genes of the EMT pathway. Androgen deprivation therapy is known to decrease diversity of the microbiome [43,44]. Our analyses suggest that this decrease may correlate to enrichment of the EMT pathway, ultimately promoting the migration of epithelial cells into the mesenchyme. In this way, the microbiome may encourage the formation of CSCs, ultimately yielding an increase in a tumor’s colonizing capacity [17,18,19,21]. With the assumption that cancer stem cells only originate after EMT, the observed correlations of these species to pluripotency may only be coincidental and mediated by EMT. The microbiome and its metabolites are known regulators of EMT [37,38], though less is known of the microbiome’s relation to pluripotency. Investigation the interaction of microbial metabolites with the above CSC markers may be used to further test this hypothesis.
Our results are limited due to the correlational nature of this study. We are unable to claim a causal relationship between microbiome dysbiosis with CR. Further metabolomic analysis may serve to confirm these relations. The sample collection and sequencing procedures used by these studies also inherently differed. We attempted to mitigate these differences through the above normalization procedures, though the potentially confounding effects should be noted. Additionally, species-level profiling performed with the use of a reference sequence database will only capture culturable species and may omit species otherwise present. This is common to most microbiome studies that employ direct sequence alignment.

4. Materials and Methods

4.1. Data Acquisition

RNA sequencing data was downloaded from the dbGaP Data Browser (https://www.ncbi.nlm.nih.gov/gap/) for bone and soft tissue biopsies of patients with metastatic CRPC. These samples spanned two studies: phs000915 (n = 147) and phs001141 (n = 143). Only bone (n = 159), lymph node (n = 92), and liver (n = 39) metastases were analyzed, as the remaining sites contained insufficient sample sizes. Samples of each site were considered independently throughout the remainder of this study.

4.2. Bacterial Read Mapping

Sequences were mapped to bacterial species using the Pathoscope 2.0 software [49], with reference sequences sourced from the NCBI Nucleotide Database (https://www.ncbi.nlm.nih.gov/nucleotide/). Bacterial reads were targeted for quantification, and human reads were filtered. Standard parameters were chosen.

4.3. Gene Read Mapping

Sequences were mapped to the hg38 reference genome using the STAR software [50], with reference sequences sourced from the NCBI Nucleotide Database (https://www.ncbi.nlm.nih.gov/nucleotide/). Standard parameters were chosen.

4.4. Cross-Study Normalization

Cumulative sum scaling was performed to increase the validity of cross-study comparisons. In this technique, the expression value of a gene is divided by the sum of all genes’ expressions in that sample. This technique was similarly performed on species abundance values. Principle coordinate analysis (PCoA) was conducted to confirm the effectiveness of this technique. Sample dissimilarities were calculated by a Euclidean distance.

4.5. Microbial Contamination Correction

In tissue extraction and sequencing procedures, there remains the possibility for contaminant species to be introduced into a sample [35]. These species are not reflective of a patient’s tumoral microbiome, and are likely introduced in a fixed amount. As such, these species are expected to be of similar abundances in all samples, regardless of the total abundance of taxa in a sample. To identify and exclude these species, the total abundance of all species was summed in each sample. Spearman’s correlations were used to assess the relationship of each individual species to the total abundance of all species in each sample. Species that did not exhibit a significant relation (p < 0.05) were deemed contaminants and were excluded from further analyses.

4.6. Expression Correlation Analyses

A list of genes known to be implicated in CR at a transcriptional level was collected from literature [16]. A list of known CSC markers was similarly collected [36,47,48,51]. Spearman’s correlations were used to assess the relation of each species’ abundance to each gene’s expression.

4.7. Gene Set Enrichment Analyses

The clusterProfileR R package was used to assess pathway enrichment with respect to each species’ abundance [52]. Pathways were sourced from the KEGG PATHWAY Database (https://www.genome.jp/kegg/pathway.html). The Prostate Cancer (hsa05215), PI3K-AKT (hsa04151), and Endocrine Resistance (hsa01522) pathways were used to model CR. The Adherens Junction (hsa04520) and Signaling Pathways Regulating Pluripotency of Stem Cells (hsa04550) pathways were used to model EMT and stemness, respectively.

5. Conclusions

Our observations suggest that the microbiome is heavily associated with CR and stemness in prostate cancer. Numerous species were observed to correlate strongly to the expression of the CR and CSC markers studied. These species further correlated to enrichment of select signaling pathways involved in CR and cancer stemness. The potential regulation of these factors by the microbiome should be further investigated to explore the microbiome’s relevance in CRPC. Ultimately, this may provide great nuance as to the aggressive nature of this disease. By exploring the microbiome’s implications in CR, stemness, and metastasis, we may better understand the pathology of high-risk prostate cancers, allowing for needed improvement in the treatment of patients with these diseases.

Author Contributions

Conceptualization, W.M.O.; Data curation, M.U.; Formal analysis, M.U. and R.X.; Funding acquisition, W.M.O.; Investigation, M.U., R.X., and W.M.O.; Methodology, M.U., and W.M.O.; Project administration, W.M.O.; Resources, W.M.O.; Software, M.U. and R.X.; Supervision, W.M.O.; Visualization, M.U and R.X; Writing—original draft, M.U; Writing—review and editing, M.U., R.X., and W.M.O. All authors have read and agreed to the published version of the manuscript.

Funding

This work was supported by the UC San Diego Academic Senate Grant RG096651 to W.M.O.

Institutional Review Board Statement

Not applicable.

Informed Consent Statement

Not applicable.

Data Availability Statement

All data can be access through the dbGaP Data Browser (https://www.ncbi.nlm.nih.gov/gap/) under accessions phs000915 and phs001141.

Conflicts of Interest

The funders had no role in the design of the study; in the collection, analyses, or interpretation of data; in the writing of the manuscript; or in the decision to publish the results.

References

  1. Society, A.C. Facts & Figures 2023. Atlanta, Ga, 2023.
  2. Institute, N.C. SEER Cancer Stat Facts: Prostate Cancer.
  3. Huggins, C.; Hodges, C.V. Studies on prostatic cancer. I. The effect of castration, of estrogen and androgen injection on serum phosphatases in metastatic carcinoma of the prostate. CA Cancer J Clin 1972, 22, 232–240. [Google Scholar] [CrossRef] [PubMed]
  4. Fujita, K.; Nonomura, N. Role of Androgen Receptor in Prostate Cancer: A Review. World J Mens Health 2019, 37, 288–295. [Google Scholar] [CrossRef] [PubMed]
  5. Shafi, A.A.; Yen, A.E.; Weigel, N.L. Androgen receptors in hormone-dependent and castration-resistant prostate cancer. Pharmacol Ther 2013, 140, 223–238. [Google Scholar] [CrossRef]
  6. Institute, N.C. Prostate Cancer Treatment –Health Professional Version. Physician Data Query (PDQ), 2019.
  7. Garje, R.; Chennamadhavuni, A.; Mott, S.L.; Chambers, I.M.; Gellhaus, P.; Zakharia, Y.; Brown, J.A. Utilization and Outcomes of Surgical Castration in Comparison to Medical Castration in Metastatic Prostate Cancer. Clin Genitourin Cancer 2020, 18, e157–e166. [Google Scholar] [CrossRef]
  8. Chandrasekar, T.; Yang, J.C.; Gao, A.C.; Evans, C.P. Mechanisms of resistance in castration-resistant prostate cancer (CRPC). Transl Androl Urol 2015, 4, 365–380. [Google Scholar] [PubMed]
  9. Armstrong, A.J.; Szmulewitz, R.Z.; Petrylak, D.P.; Holzbeierlein, J.; Villers, A.; Azad, A.; Alcaraz, A.; Alekseev, B.; Iguchi, T.; Shore, N.D.; et al. ARCHES: A Randomized, Phase III Study of Androgen Deprivation Therapy With Enzalutamide or Placebo in Men With Metastatic Hormone-Sensitive Prostate Cancer. J Clin Oncol 2019, 37, 2974–2986. [Google Scholar] [CrossRef] [PubMed]
  10. Davis, I.D.; Martin, A.J.; Stockler, M.R.; Begbie, S.; Chi, K.N.; Chowdhury, S.; Coskinas, X.; Frydenberg, M.; Hague, W.E.; Horvath, L.G.; et al. Enzalutamide with Standard First-Line Therapy in Metastatic Prostate Cancer. N Engl J Med 2019, 381, 121–131. [Google Scholar] [CrossRef]
  11. Fizazi, K.; Tran, N.; Fein, L.; Matsubara, N.; Rodriguez-Antolin, A.; Alekseev, B.Y.; Özgüroğlu, M.; Ye, D.; Feyerabend, S.; Protheroe, A.; et al. Abiraterone acetate plus prednisone in patients with newly diagnosed high-risk metastatic castration-sensitive prostate cancer (LATITUDE): final overall survival analysis of a randomised, double-blind, phase 3 trial. Lancet Oncol 2019, 20, 686–700. [Google Scholar] [CrossRef] [PubMed]
  12. Hoyle, A.P.; Ali, A.; James, N.D.; Cook, A.; Parker, C.C.; de Bono, J.S.; Attard, G.; Chowdhury, S.; Cross, W.R.; Dearnaley, D.P.; et al. Abiraterone in "High-" and "Low-risk" Metastatic Hormone-sensitive Prostate Cancer. Eur Urol 2019, 76, 719–728. [Google Scholar] [CrossRef]
  13. Gravis, G.; Boher, J.M.; Joly, F.; Soulié, M.; Albiges, L.; Priou, F.; Latorzeff, I.; Delva, R.; Krakowski, I.; Laguerre, B.; et al. Androgen Deprivation Therapy (ADT) Plus Docetaxel Versus ADT Alone in Metastatic Non castrate Prostate Cancer: Impact of Metastatic Burden and Long-term Survival Analysis of the Randomized Phase 3 GETUG-AFU15 Trial. Eur Urol 2016, 70, 256–262. [Google Scholar] [CrossRef]
  14. Kyriakopoulos, C.E.; Chen, Y.H.; Carducci, M.A.; Liu, G.; Jarrard, D.F.; Hahn, N.M.; Shevrin, D.H.; Dreicer, R.; Hussain, M.; Eisenberger, M.; et al. Chemohormonal Therapy in Metastatic Hormone-Sensitive Prostate Cancer: Long-Term Survival Analysis of the Randomized Phase III E3805 CHAARTED Trial. J Clin Oncol 2018, 36, 1080–1087. [Google Scholar] [CrossRef] [PubMed]
  15. Yanagisawa, T.; Rajwa, P.; Thibault, C.; Gandaglia, G.; Mori, K.; Kawada, T.; Fukuokaya, W.; Shim, S.R.; Mostafaei, H.; Motlagh, R.S.; et al. Androgen Receptor Signaling Inhibitors in Addition to Docetaxel with Androgen Deprivation Therapy for Metastatic Hormone-sensitive Prostate Cancer: A Systematic Review and Meta-analysis. Eur Urol 2022, 82, 584–598. [Google Scholar] [CrossRef] [PubMed]
  16. Conteduca, V.; Mosca, A.; Brighi, N.; de Giorgi, U.; Rescigno, P. New Prognostic Biomarkers in Metastatic Castration-Resistant Prostate Cancer. Cells 2021, 10. [Google Scholar] [CrossRef]
  17. Castellón, E.A.; Indo, S.; Contreras, H.R. Cancer Stemness/Epithelial-Mesenchymal Transition Axis Influences Metastasis and Castration Resistance in Prostate Cancer: Potential Therapeutic Target. Int J Mol Sci 2022, 23. [Google Scholar] [CrossRef] [PubMed]
  18. Babaei, G.; Aziz, S.G.; Jaghi, N.Z.Z. EMT, cancer stem cells and autophagy; The three main axes of metastasis. Biomed Pharmacother 2021, 133, 110909. [Google Scholar] [CrossRef] [PubMed]
  19. Yin, W.; Wang, J.; Jiang, L.; James Kang, Y. Cancer and stem cells. Exp Biol Med (Maywood) 2021, 246, 1791–1801. [Google Scholar] [CrossRef] [PubMed]
  20. Moltzahn, F.R.; Volkmer, J.P.; Rottke, D.; Ackermann, R. "Cancer stem cells"-lessons from Hercules to fight the Hydra. Urol Oncol 2008, 26, 581–589. [Google Scholar] [CrossRef] [PubMed]
  21. Fang, D.; Kitamura, H. Cancer stem cells and epithelial-mesenchymal transition in urothelial carcinoma: Possible pathways and potential therapeutic approaches. Int J Urol 2018, 25, 7–17. [Google Scholar] [CrossRef]
  22. Kalluri, R.; Weinberg, R.A. The basics of epithelial-mesenchymal transition. J Clin Invest 2009, 119, 1420–1428. [Google Scholar] [CrossRef]
  23. Barko, P.C.; McMichael, M.A.; Swanson, K.S.; Williams, D.A. The Gastrointestinal Microbiome: A Review. J Vet Intern Med 2018, 32, 9–25. [Google Scholar] [CrossRef]
  24. Lynch, S.V.; Pedersen, O. The Human Intestinal Microbiome in Health and Disease. N Engl J Med 2016, 375, 2369–2379. [Google Scholar] [CrossRef] [PubMed]
  25. Manos, J. The human microbiome in disease and pathology. Apmis 2022, 130, 690–705. [Google Scholar] [CrossRef] [PubMed]
  26. Rooks, M.G.; Garrett, W.S. Gut microbiota, metabolites and host immunity. Nat Rev Immunol 2016, 16, 341–352. [Google Scholar] [CrossRef] [PubMed]
  27. Kayama, H.; Okumura, R.; Takeda, K. Interaction Between the Microbiota, Epithelia, and Immune Cells in the Intestine. Annu Rev Immunol 2020, 38, 23–48. [Google Scholar] [CrossRef] [PubMed]
  28. Song, M.; Chan, A.T.; Sun, J. Influence of the Gut Microbiome, Diet, and Environment on Risk of Colorectal Cancer. Gastroenterology 2020, 158, 322–340. [Google Scholar] [CrossRef] [PubMed]
  29. Sepich-Poore, G.D.; Zitvogel, L.; Straussman, R.; Hasty, J.; Wargo, J.A.; Knight, R. The microbiome and human cancer. Science 2021, 371. [Google Scholar] [CrossRef]
  30. Cullin, N.; Azevedo Antunes, C.; Straussman, R.; Stein-Thoeringer, C.K.; Elinav, E. Microbiome and cancer. Cancer Cell 2021, 39, 1317–1341. [Google Scholar] [CrossRef] [PubMed]
  31. Rebersek, M. Gut microbiome and its role in colorectal cancer. BMC Cancer 2021, 21, 1325. [Google Scholar] [CrossRef] [PubMed]
  32. Javier-DesLoges, J.; McKay, R.R.; Swafford, A.D.; Sepich-Poore, G.D.; Knight, R.; Parsons, J.K. The microbiome and prostate cancer. Prostate Cancer Prostatic Dis 2022, 25, 159–164. [Google Scholar] [CrossRef]
  33. Liu, Y.; Jiang, H. Compositional differences of gut microbiome in matched hormone-sensitive and castration-resistant prostate cancer. Transl Androl Urol 2020, 9, 1937–1944. [Google Scholar] [CrossRef]
  34. Pernigoni, N.; Zagato, E.; Calcinotto, A.; Troiani, M.; Mestre, R.P.; Calì, B.; Attanasio, G.; Troisi, J.; Minini, M.; Mosole, S.; et al. Commensal bacteria promote endocrine resistance in prostate cancer through androgen biosynthesis. Science 2021, 374, 216–224. [Google Scholar] [CrossRef] [PubMed]
  35. Salter, S.J.; Cox, M.J.; Turek, E.M.; Calus, S.T.; Cookson, W.O.; Moffatt, M.F.; Turner, P.; Parkhill, J.; Loman, N.J.; Walker, A.W. Reagent and laboratory contamination can critically impact sequence-based microbiome analyses. BMC Biol 2014, 12, 87. [Google Scholar] [CrossRef] [PubMed]
  36. Zhao, W.; Li, Y.; Zhang, X. Stemness-Related Markers in Cancer. Cancer Transl Med 2017, 3, 87–95. [Google Scholar] [PubMed]
  37. Marzano, M.; Fosso, B.; Piancone, E.; Defazio, G.; Pesole, G.; De Robertis, M. Stem Cell Impairment at the Host-Microbiota Interface in Colorectal Cancer. Cancers (Basel) 2021, 13. [Google Scholar] [CrossRef] [PubMed]
  38. Gupta, I.; Pedersen, S.; Vranic, S.; Al Moustafa, A.E. Implications of Gut Microbiota in Epithelial-Mesenchymal Transition and Cancer Progression: A Concise Review. Cancers (Basel) 2022, 14. [Google Scholar] [CrossRef] [PubMed]
  39. Peinado, H.; Quintanilla, M.; Cano, A. Transforming growth factor beta-1 induces snail transcription factor in epithelial cell lines: mechanisms for epithelial mesenchymal transitions. J Biol Chem 2003, 278, 21113–21123. [Google Scholar] [CrossRef] [PubMed]
  40. Cavarretta, I.; Ferrarese, R.; Cazzaniga, W.; Saita, D.; Lucianò, R.; Ceresola, E.R.; Locatelli, I.; Visconti, L.; Lavorgna, G.; Briganti, A.; et al. The Microbiome of the Prostate Tumor Microenvironment. Eur Urol 2017, 72, 625–631. [Google Scholar] [CrossRef] [PubMed]
  41. Salachan, P.V.; Rasmussen, M.; Fredsøe, J.; Ulhøi, B.; Borre, M.; Sørensen, K.D. Microbiota of the prostate tumor environment investigated by whole-transcriptome profiling. Genome Med 2022, 14, 9. [Google Scholar] [CrossRef] [PubMed]
  42. Mohseni, A.H.; Casolaro, V.; Bermúdez-Humarán, L.G.; Keyvani, H.; Taghinezhad, S.S. Modulation of the PI3K/Akt/mTOR signaling pathway by probiotics as a fruitful target for orchestrating the immune response. Gut Microbes 2021, 13, 1–17. [Google Scholar] [CrossRef]
  43. Kure, A.; Tsukimi, T.; Ishii, C.; Aw, W.; Obana, N.; Nakato, G.; Hirayama, A.; Kawano, H.; China, T.; Shimizu, F.; et al. Gut environment changes due to androgen deprivation therapy in patients with prostate cancer. Prostate Cancer Prostatic Dis 2023, 26, 323–330. [Google Scholar] [CrossRef]
  44. Wang, L. Changes in the gut microbial profile during long-term androgen deprivation therapy for prostate cancer. Prostate Cancer Prostatic Dis 2023. [CrossRef]
  45. Wee, P.; Wang, Z. Epidermal Growth Factor Receptor Cell Proliferation Signaling Pathways. Cancers (Basel) 2017, 9. [Google Scholar] [CrossRef]
  46. Tian, T.; Li, X.; Zhang, J. mTOR Signaling in Cancer and mTOR Inhibitors in Solid Tumor Targeting Therapy. Int J Mol Sci 2019, 20. [Google Scholar] [CrossRef]
  47. Day, K.C.; Lorenzatti Hiles, G.; Kozminsky, M.; Dawsey, S.J.; Paul, A.; Broses, L.J.; Shah, R.; Kunja, L.P.; Hall, C.; Palanisamy, N.; et al. HER2 and EGFR Overexpression Support Metastatic Progression of Prostate Cancer to Bone. Cancer Res 2017, 77, 74–85. [Google Scholar] [CrossRef]
  48. Xia, P.; Dubrovska, A. CD98 heavy chain as a prognostic biomarker and target for cancer treatment. Front Oncol 2023, 13, 1251100. [Google Scholar] [CrossRef]
  49. Hong, C.; Manimaran, S.; Shen, Y.; Perez-Rogers, J.F.; Byrd, A.L.; Castro-Nallar, E.; Crandall, K.A.; Johnson, W.E. PathoScope 2.0: a complete computational framework for strain identification in environmental or clinical sequencing samples. Microbiome 2014, 2, 33. [Google Scholar] [CrossRef]
  50. Dobin, A.; Davis, C.A.; Schlesinger, F.; Drenkow, J.; Zaleski, C.; Jha, S.; Batut, P.; Chaisson, M.; Gingeras, T.R. STAR: ultrafast universal RNA-seq aligner. Bioinformatics 2013, 29, 15–21. [Google Scholar] [CrossRef]
  51. Mei, W.; Lin, X.; Kapoor, A.; Gu, Y.; Zhao, K.; Tang, D. The Contributions of Prostate Cancer Stem Cells in Prostate Cancer Initiation and Metastasis. Cancers (Basel) 2019, 11. [Google Scholar] [CrossRef]
  52. Yu, G.; Wang, L.G.; Han, Y.; He, Q.Y. clusterProfiler: an R package for comparing biological themes among gene clusters. Omics 2012, 16, 284–287. [Google Scholar] [CrossRef]
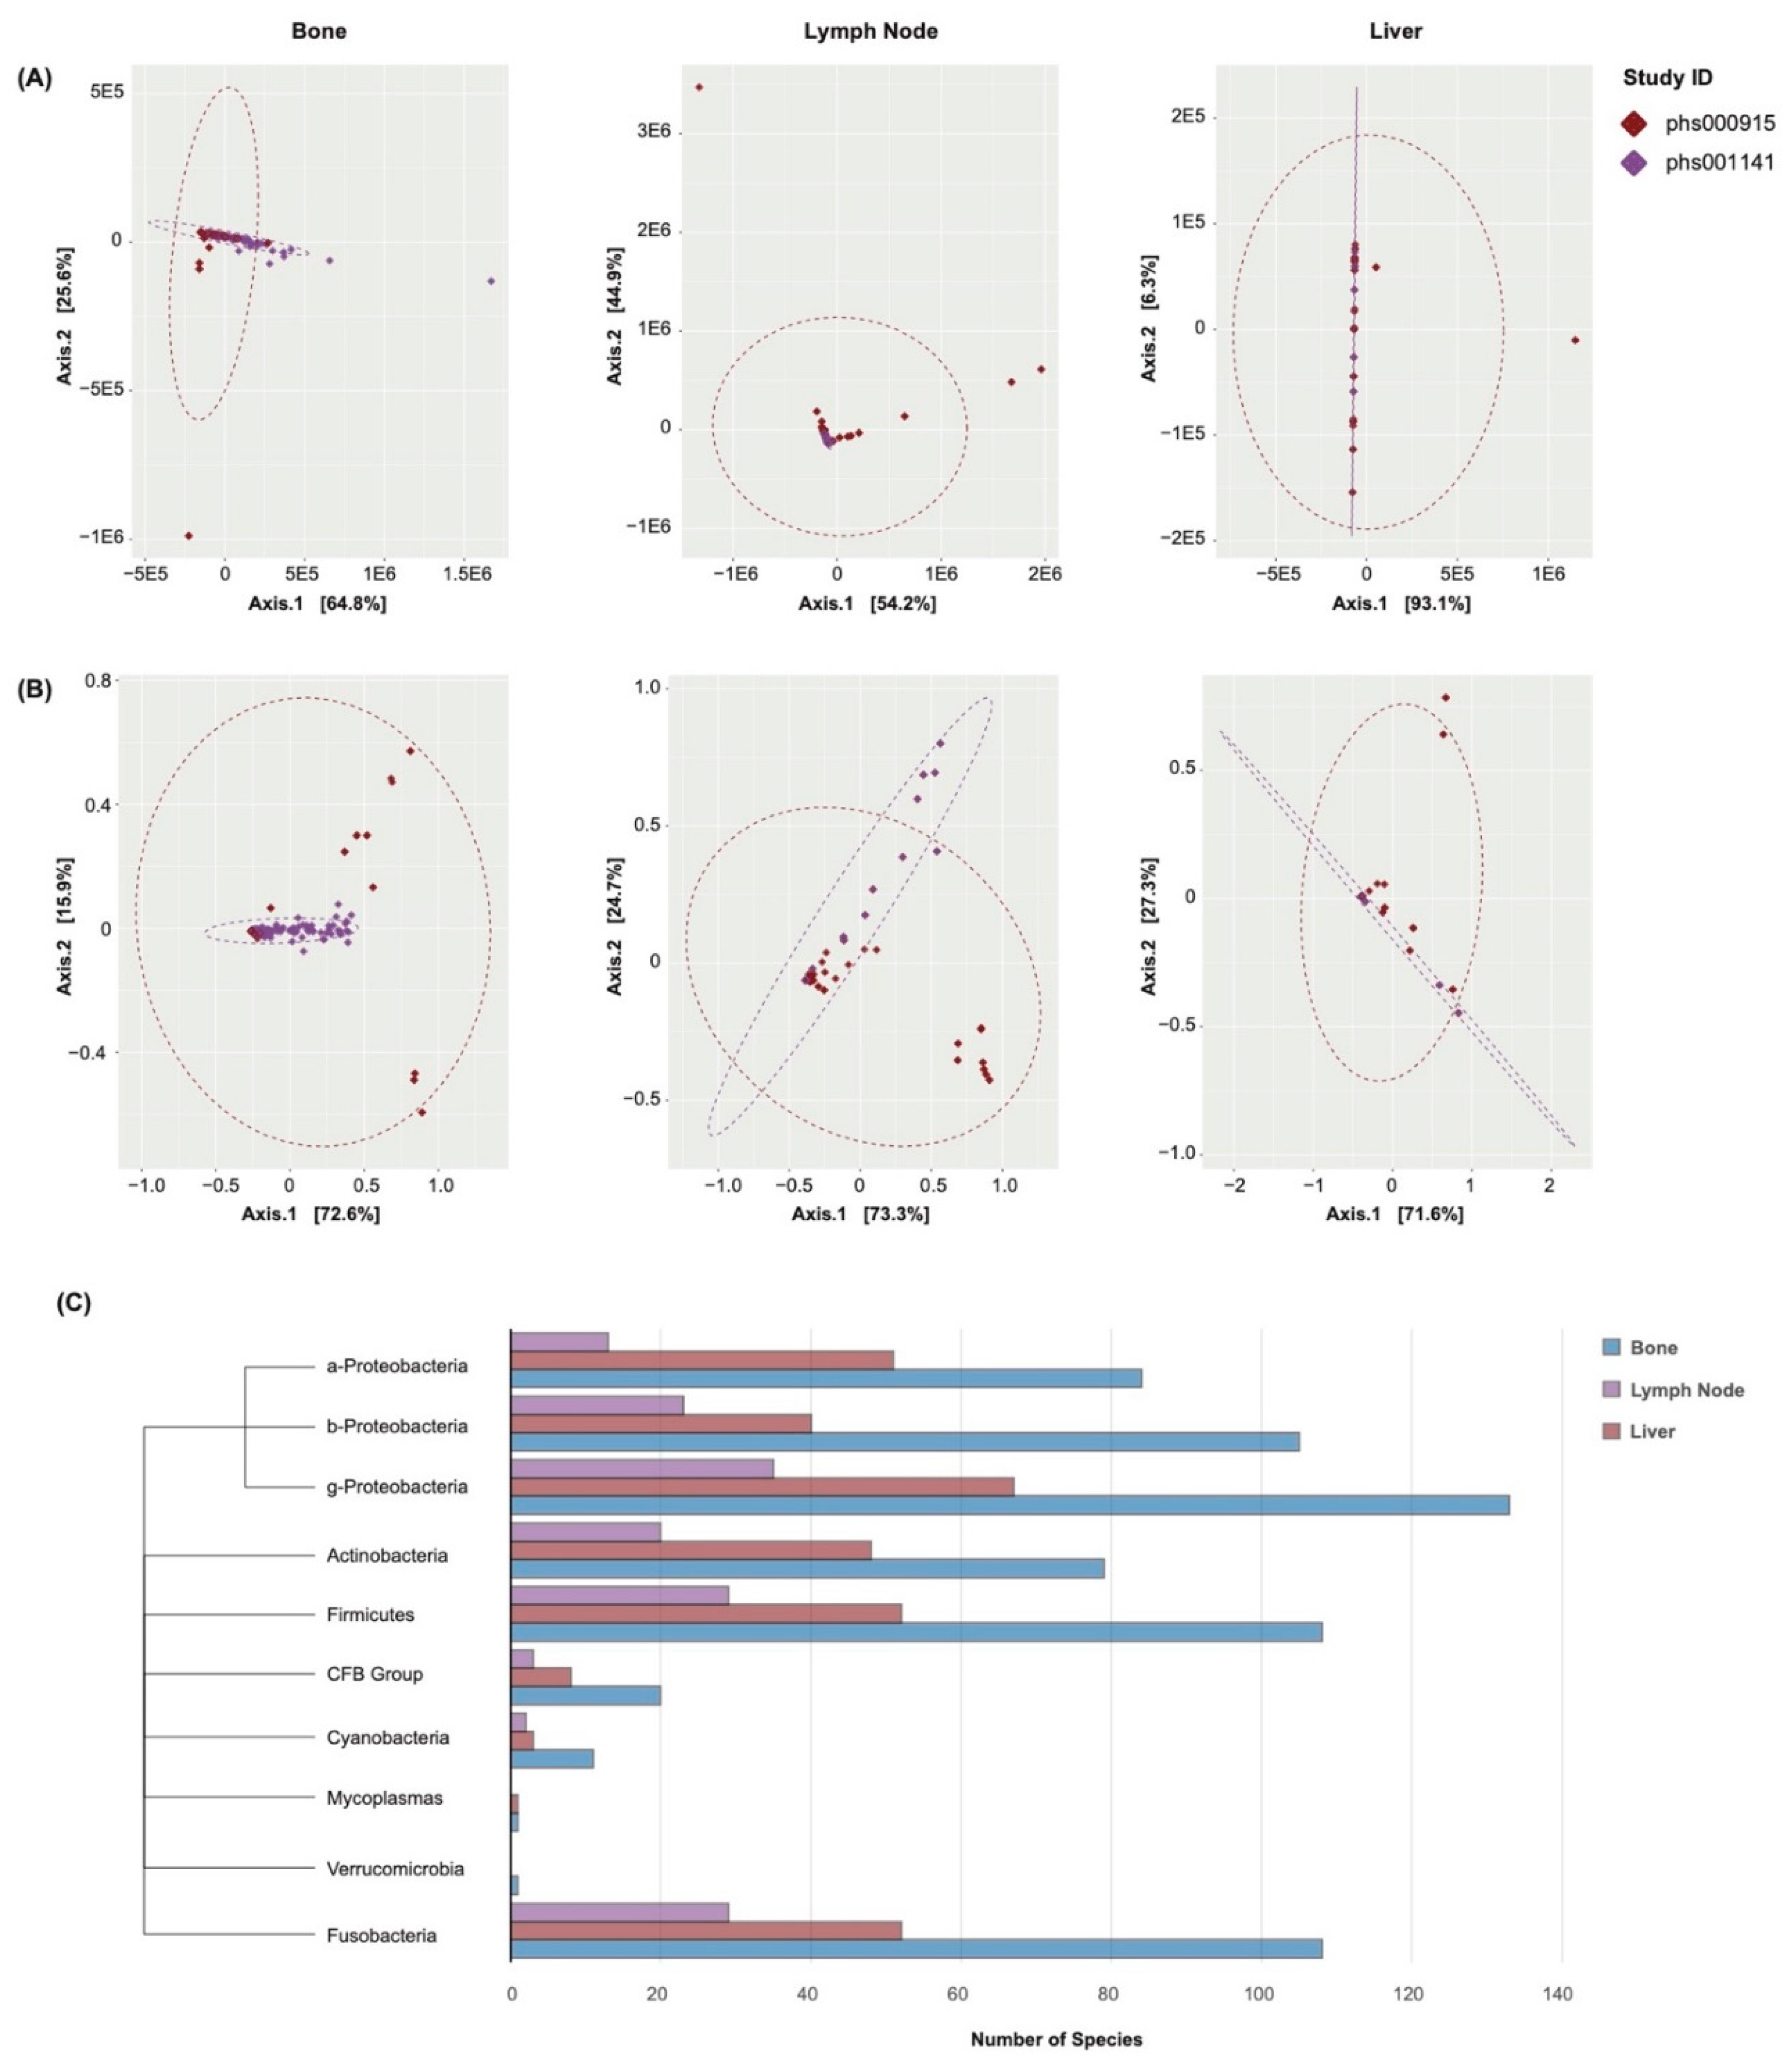
Figure 1. Cross-Study Normalization and Contamination Correction (A) PCoA plots of the samples’ abundance profiles before normalization, grouped by the site of metastasis. Points represent samples, colored by study. Further proximity indicates greater dissimilarity in the samples’ abundance profiles. (B) PCoA plots of the samples’ abundance profiles after normalization. Closer proximity indicates greater similarity in the samples’ abundance profiles, and greater compatibly for subsequent analyses. (C) Phylogenic tree and bar chart of contaminant species. Divisions are by class or phylum. Colors indicate the site of metastasis.
Preprints 98706 g001
Figure 2. Species Castration-Resistance Marker Correlations (A) Heatmaps showing species correlations to CR marker expression, grouped by the site of metastasis. Colors indicate the strengths of correlations. * p < 0.05, ** p < 0.01, *** p < 0.001. (B) UpSet plot showing the number of species-marker correlations common to each site of metastasis. 35 correlations were common to all sites. (C) Box plots showing the expression of AKT1, AKT2, CREBBP, PIK3C3, PIK3CD, PIK3CG, and FOXA1 with respect to the abundance of Klebsiella pneumoniae and Pseudomonas savastanoi. Samples were grouped based on their relation to the median abundance of each species. * p < 0.05, ** p < 0.01, *** p < 0.001.
Preprints 98706 g002
Figure 3. Species-Associated Enrichment of Castration-Resistance Pathways (A) Enrichment plots of the AR (top), PI3K-AKT (middle), and endocrine resistance (bottom) signaling pathways. Each line represents a species, The peak of each curve indicates the total enrichment score of the pathway with respect to each species’ abundance. Only the twenty species of the lymph node cohort with the greatest number of significant correlations to the above CR markers are shown. (B) Strip plots showing the correlation of each species to the expression of the component genes of the AR (top), PI3K-AKT (middle), and endocrine resistance (bottom) signaling pathways. Points represent species. Colors indicate the strengths of correlation, and heights indicates the significance in correlation. Only the twenty species of each cohort with the greatest number of significant correlations to the above CR markers are shown.
Preprints 98706 g003
Figure 4. Species Cancer Stem Cell Marker Correlations (A) Heatmaps showing species correlations to CSC marker expression, grouped by the site of metastasis. Colors indicate correlation coefficients. * p < 0.05, ** p < 0.01, *** p < 0.001. (B) UpSet plot showing the number of species-marker correlations common to each site of metastasis. 2 correlations were common to all sites. (C) Box plots showing the expression of EGFR and SLC3A2 with respect to the abundance of Brevundimonas subvibrioides and Geobacillus thermodenitrificans. Samples were grouped based on their relation to the median abundance of each species. * p < 0.05, ** p < 0.01, *** p < 0.001.
Preprints 98706 g004
Figure 5. Species-Associated Enrichment of Cancer Stemness Pathways (A) Enrichment plots of the EMT (left) and pluripotency regulation (right) signaling pathways. Each line represents a species, The peak of each curve indicates the total enrichment score of the pathway with respect to each species’ abundance. Only the twenty species of the lymph node cohort with the greatest number of significant correlations to the above CSC markers are shown. (B) Heatmaps showing the correlation of each species to the expression of the component genes of the EMT (left) and pluripotency regulation (right) signaling pathways, grouped by the site of metastasis. Colors indicate correlation coefficients. Only the twenty species of each cohort with the greatest number of significant correlations to the above CSC markers are shown. * p < 0.05, ** p < 0.01, *** p < 0.001.
Preprints 98706 g005
Disclaimer/Publisher’s Note: The statements, opinions and data contained in all publications are solely those of the individual author(s) and contributor(s) and not of MDPI and/or the editor(s). MDPI and/or the editor(s) disclaim responsibility for any injury to people or property resulting from any ideas, methods, instructions or products referred to in the content.
Copyright: This open access article is published under a Creative Commons CC BY 4.0 license, which permit the free download, distribution, and reuse, provided that the author and preprint are cited in any reuse.
Prerpints.org logo

Preprints.org is a free preprint server supported by MDPI in Basel, Switzerland.

Subscribe

© 2024 MDPI (Basel, Switzerland) unless otherwise stated