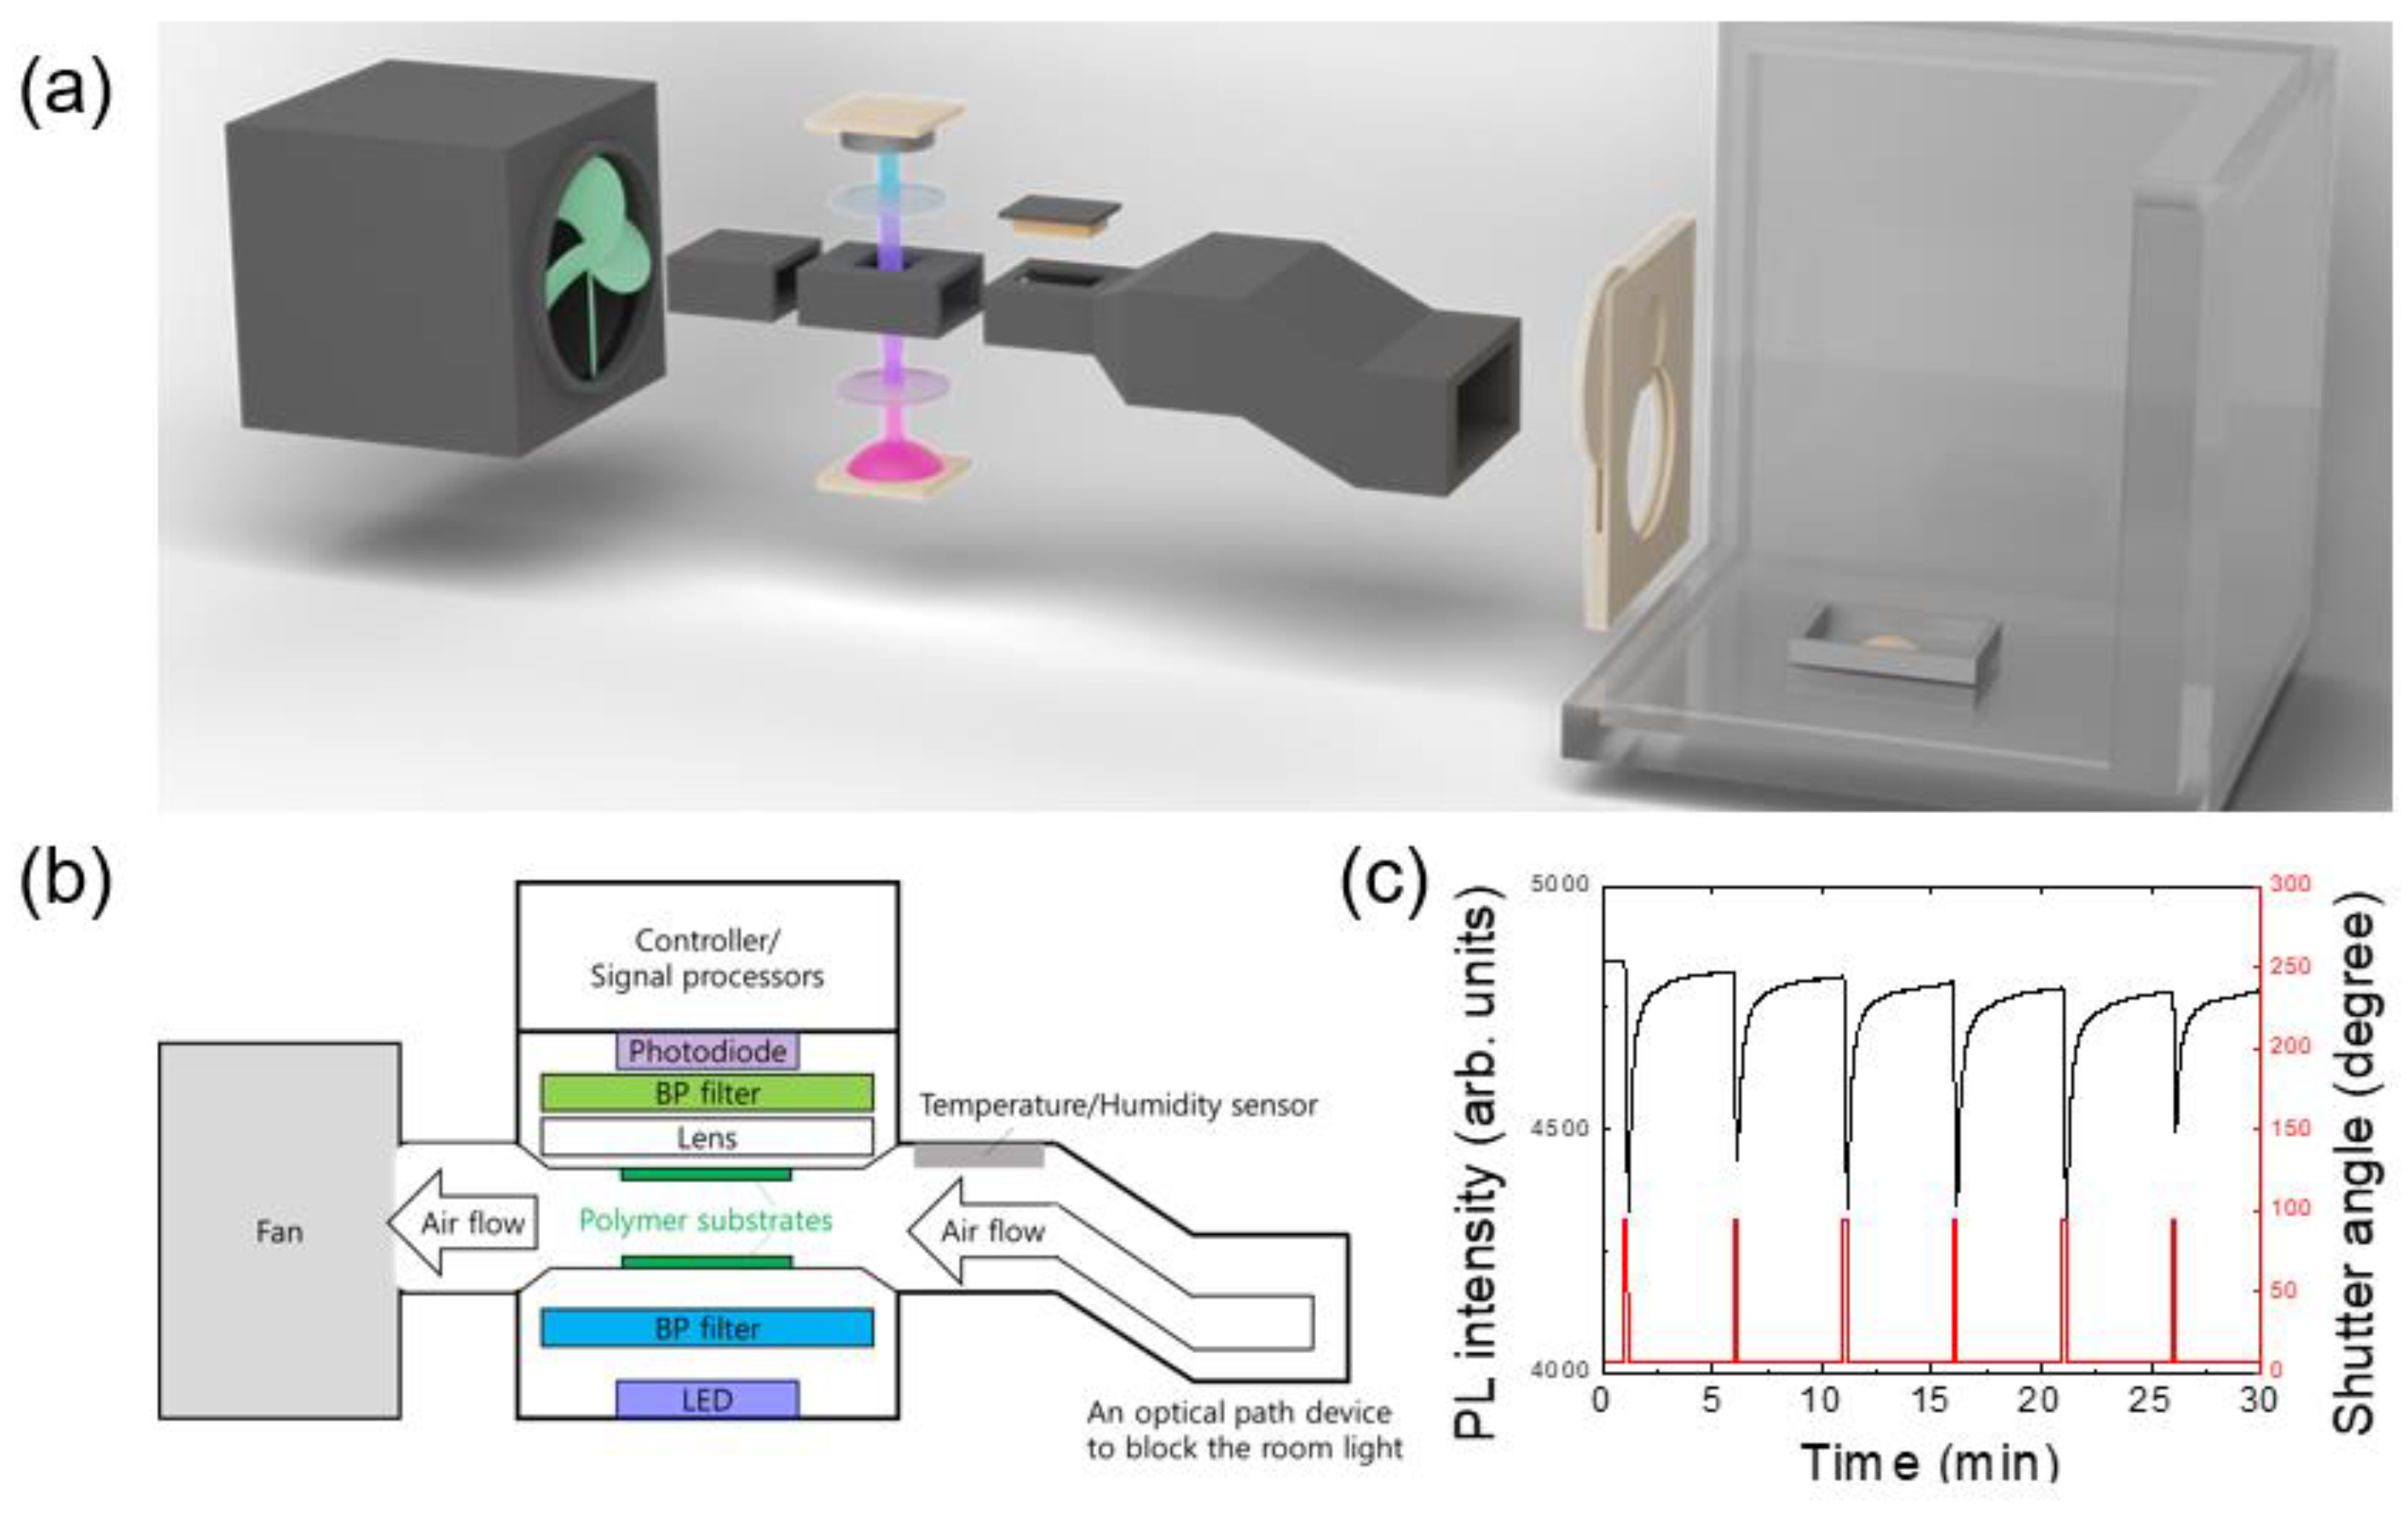
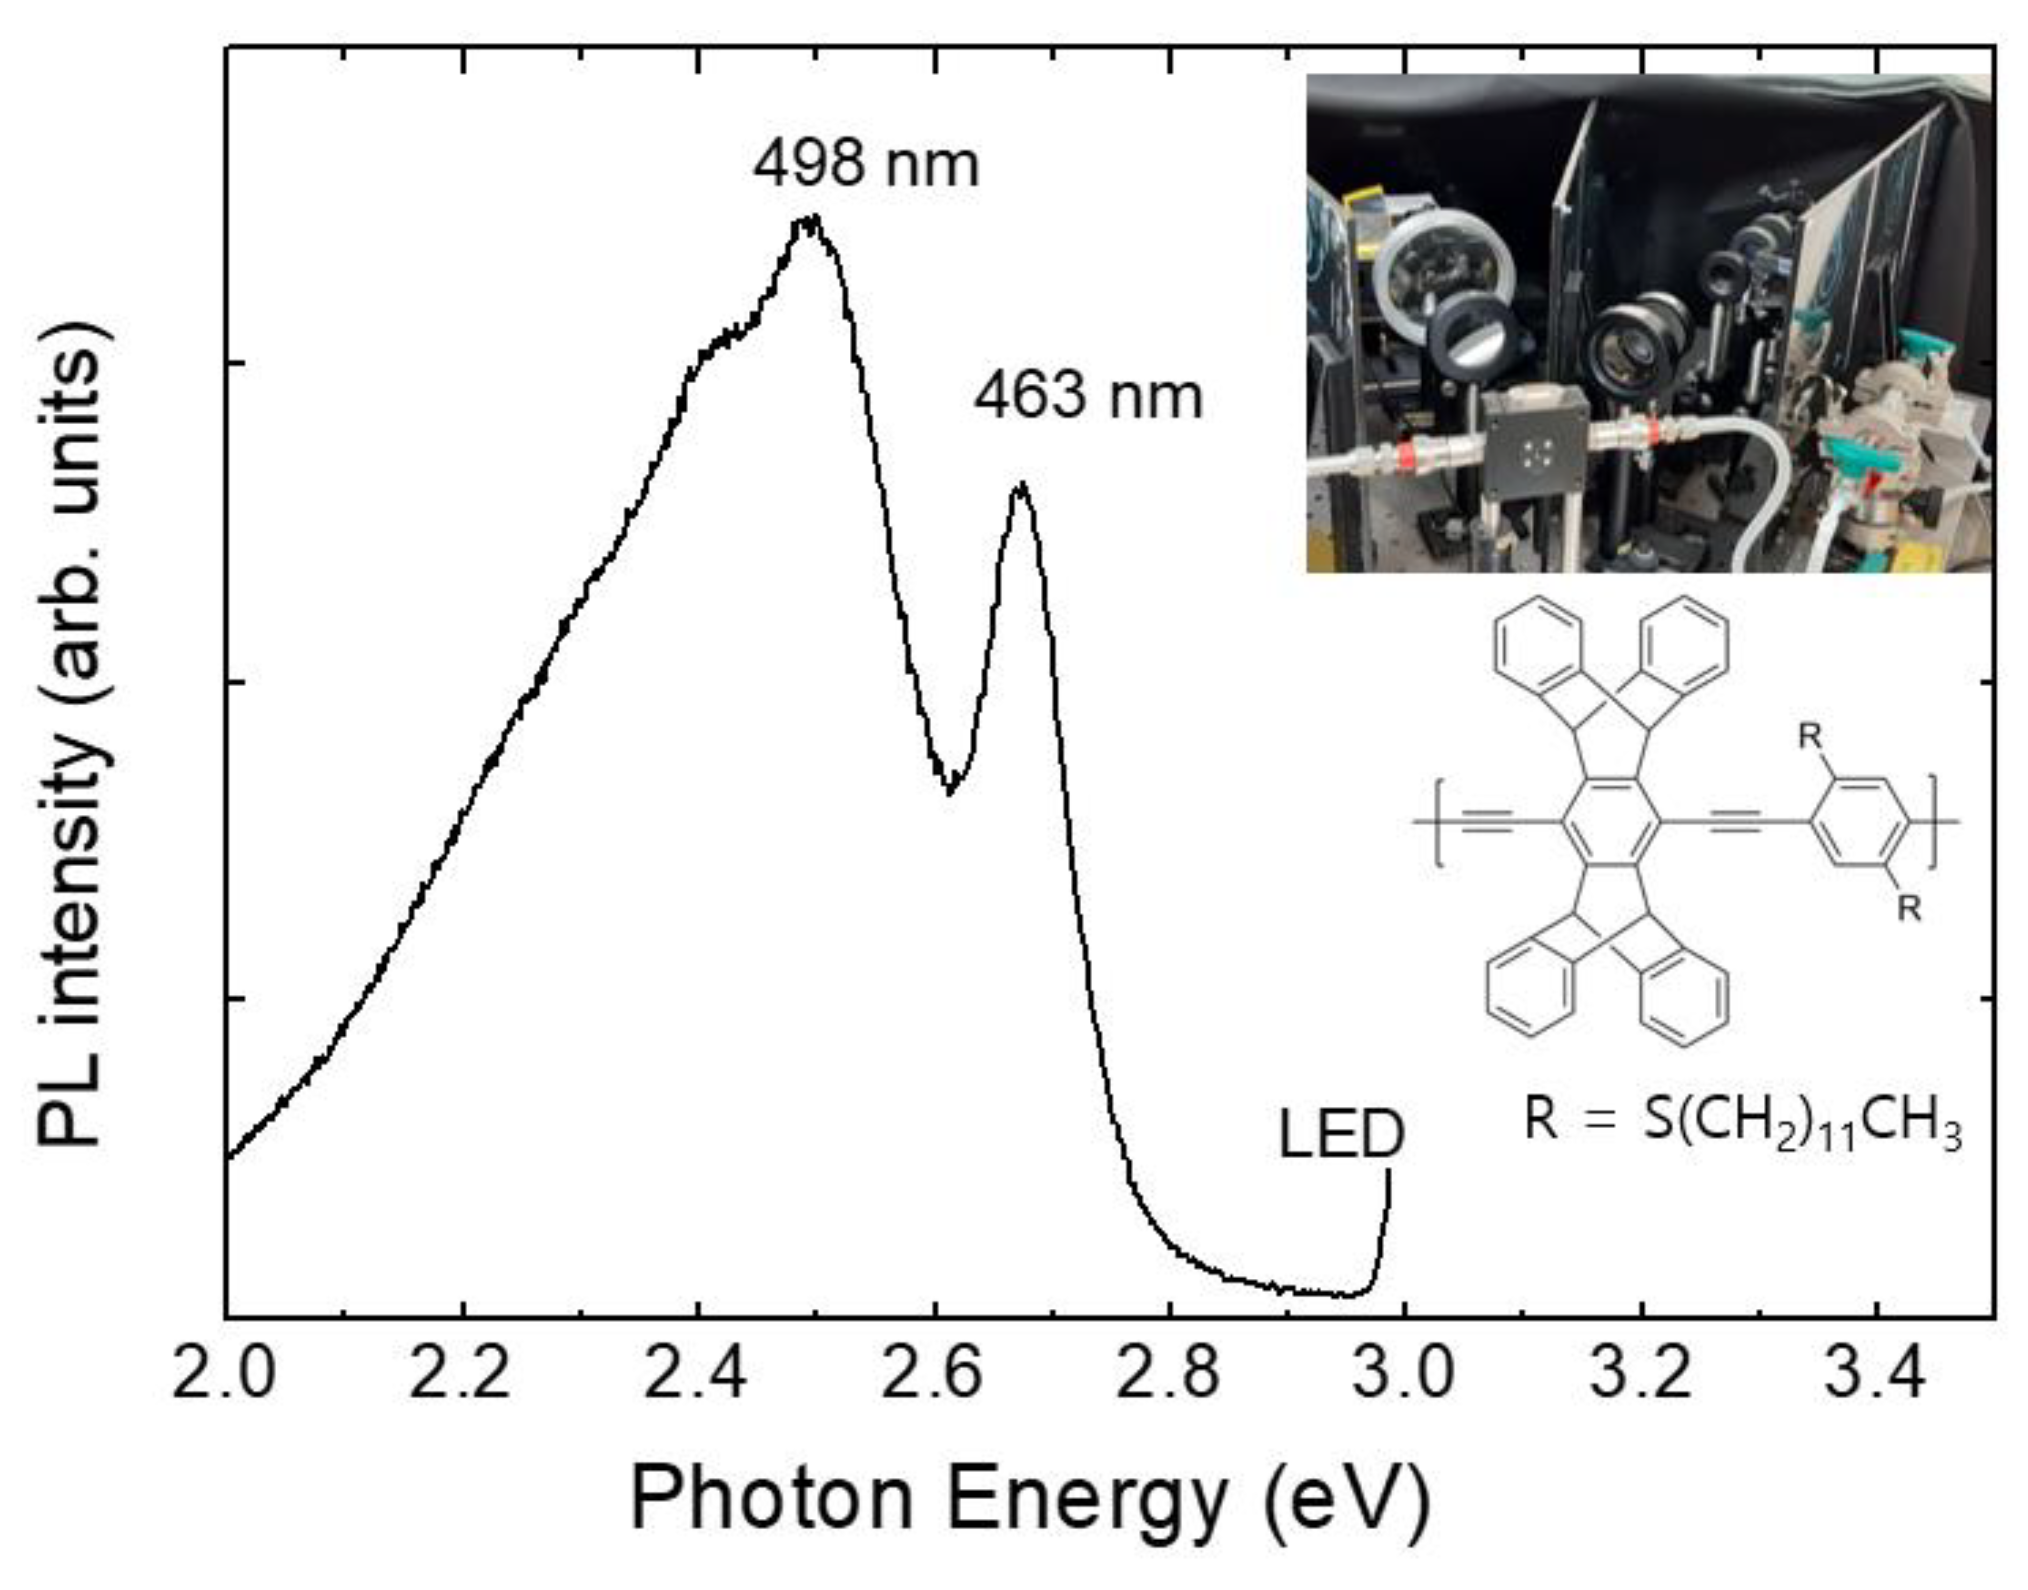
Most measurements were started in the evening and the air of the lab. was ventilated in the next morning by opening the windows. After using a polymer film over one month, the PL intensity gradually decreased, but the sensing performance was not noticeably decreased until the PL intensity became about 1/3 of the initial value. Even when no measurements were carried out for 10 days, the PL intensity was found to be slightly decreased. For this reason, spin-coated polymer films were usually stored in a vacuum-sealed box and were covered with aluminum foil to block the lights.
3.2. Response time analysis
In this section, we discuss the temporal PL behavior during quenching and recovering responses. We started with the classical Langmuir adsorption model for the analyte mass transport and utilized the exciton diffusion model for quenching efficiency calculation.
In some cases, the dynamics of analyte molecules in PL quenching were explained by molecular diffusion into sensing films. After the sensing films were exposed to quencher vapors, swelling and mass increase of the polymer films were reported through neutron scattering and in-situ QCM measurements, which supported a specific diffusion mechanism of analyte molecules, the so-called case 2, or super case 2 [
13,
14,
15,
16]. In addition, as a result of these studies, it was argued that molecular diffusion may be more important than exciton diffusion [
15], but most of these diffusion studies have been conducted under conditions such as exposure to analyte vapor for several minutes or longer. In our cases with repeated exposure to diluted analyte(2,4-DNT) vapor, it is unclear how much exciton diffusion and analyte diffusion contribute to quenching, respectively, and a cautious approach may be necessary.
Regardless of the molecular diffusion and adsorption mechanism, desorption of adsorbed/absorbed molecules does not ensure complete recovery of PL intensity. We note here that in most polymer/dendrimer PL quenching sensors the PL intensity of a film once exposed to the DNT analytes may not recover to its original value despite the decrease in adsorption/absorption mass [
15,
16]. This phenomenon is probably related to the binding affinity between the analyte molecules and the polymers as well as the molecular diffusion behavior in the film, and the quenching efficiency may also be affected by the binding affinity [
13].
To obtain a sufficient amount of data without significant DNT diffusion into the sensing film, we chose a rather short exposure time (10 s) and a time interval of 5-min. We try to understand the temporal response of PL and environmental effects on PL under such simple conditions first. Then an incomplete recovery of the PL, which was more pronounced for higher DNT vapor pressures and longer DNT exposures, will be discussed in
Section 3.4.
We start with the classical Langmuir adsorption model to explain the molecular dynamics of the analyte vapor molecules. In the model, the adsorption and desorption processes can be expressed by the following equations:
To relate the surface coverage and the quenching efficiency, we make use of a 1-D exciton diffusion model.
If we consider only the quenching sites at the surface (x=d), the differential equation for the diffusion model will have the form:
With boundary conditions:
At the surface (), the amount of exciton diffusion flux is proportional to the rate of the quenching reaction.
The solution of this differential equation is:
where
Then, PL intensity I(t) becomes:
If we combine the exciton diffusion model with the Langmuir adsorption model, the PL intensity is
Then the expression for PQ in adsorption becomes:
where
The fitting parameter
represents the effect of polymer film thickness and exciton diffusion length, which is independent of other parameters. For photovoltaic conversion in organic photovoltaics, exciton diffusion is important since excitons need be collected before the recombination of excitons [
17]. In case of PL quenching for sensing applications, PQ will be affected by the exciton diffusion since the photo-electrons which are generated within the diffusion length from the film surface can diffuse to the surface where the sensing molecules are adsorbed.
In this model, we assumed that there is a finite number of binding sites on the surface. In these expressions, some effects were not taken into consideration, such as photo-induced PL enhancement, photo-degradation, and diffusion (out-diffusion) of DNT molecules into (from) the inner part of the polymer films.
To take care of these effects, we modified as follows:
Here, the variable ‘a’ represents PL intensity recovered during the refresh period with respect to Io. If PL is completely recovered, a=1. A non-zero value of 1-a means that the DNT molecules are strongly bound at the surface, or the DNT molecules from the inner part of the polymer films do not diffuse out completely. The parameter ‘b’ represents a slow linear term which may be due to other temporal responses including photo-induced PL enhancement and photo-degradation.
In
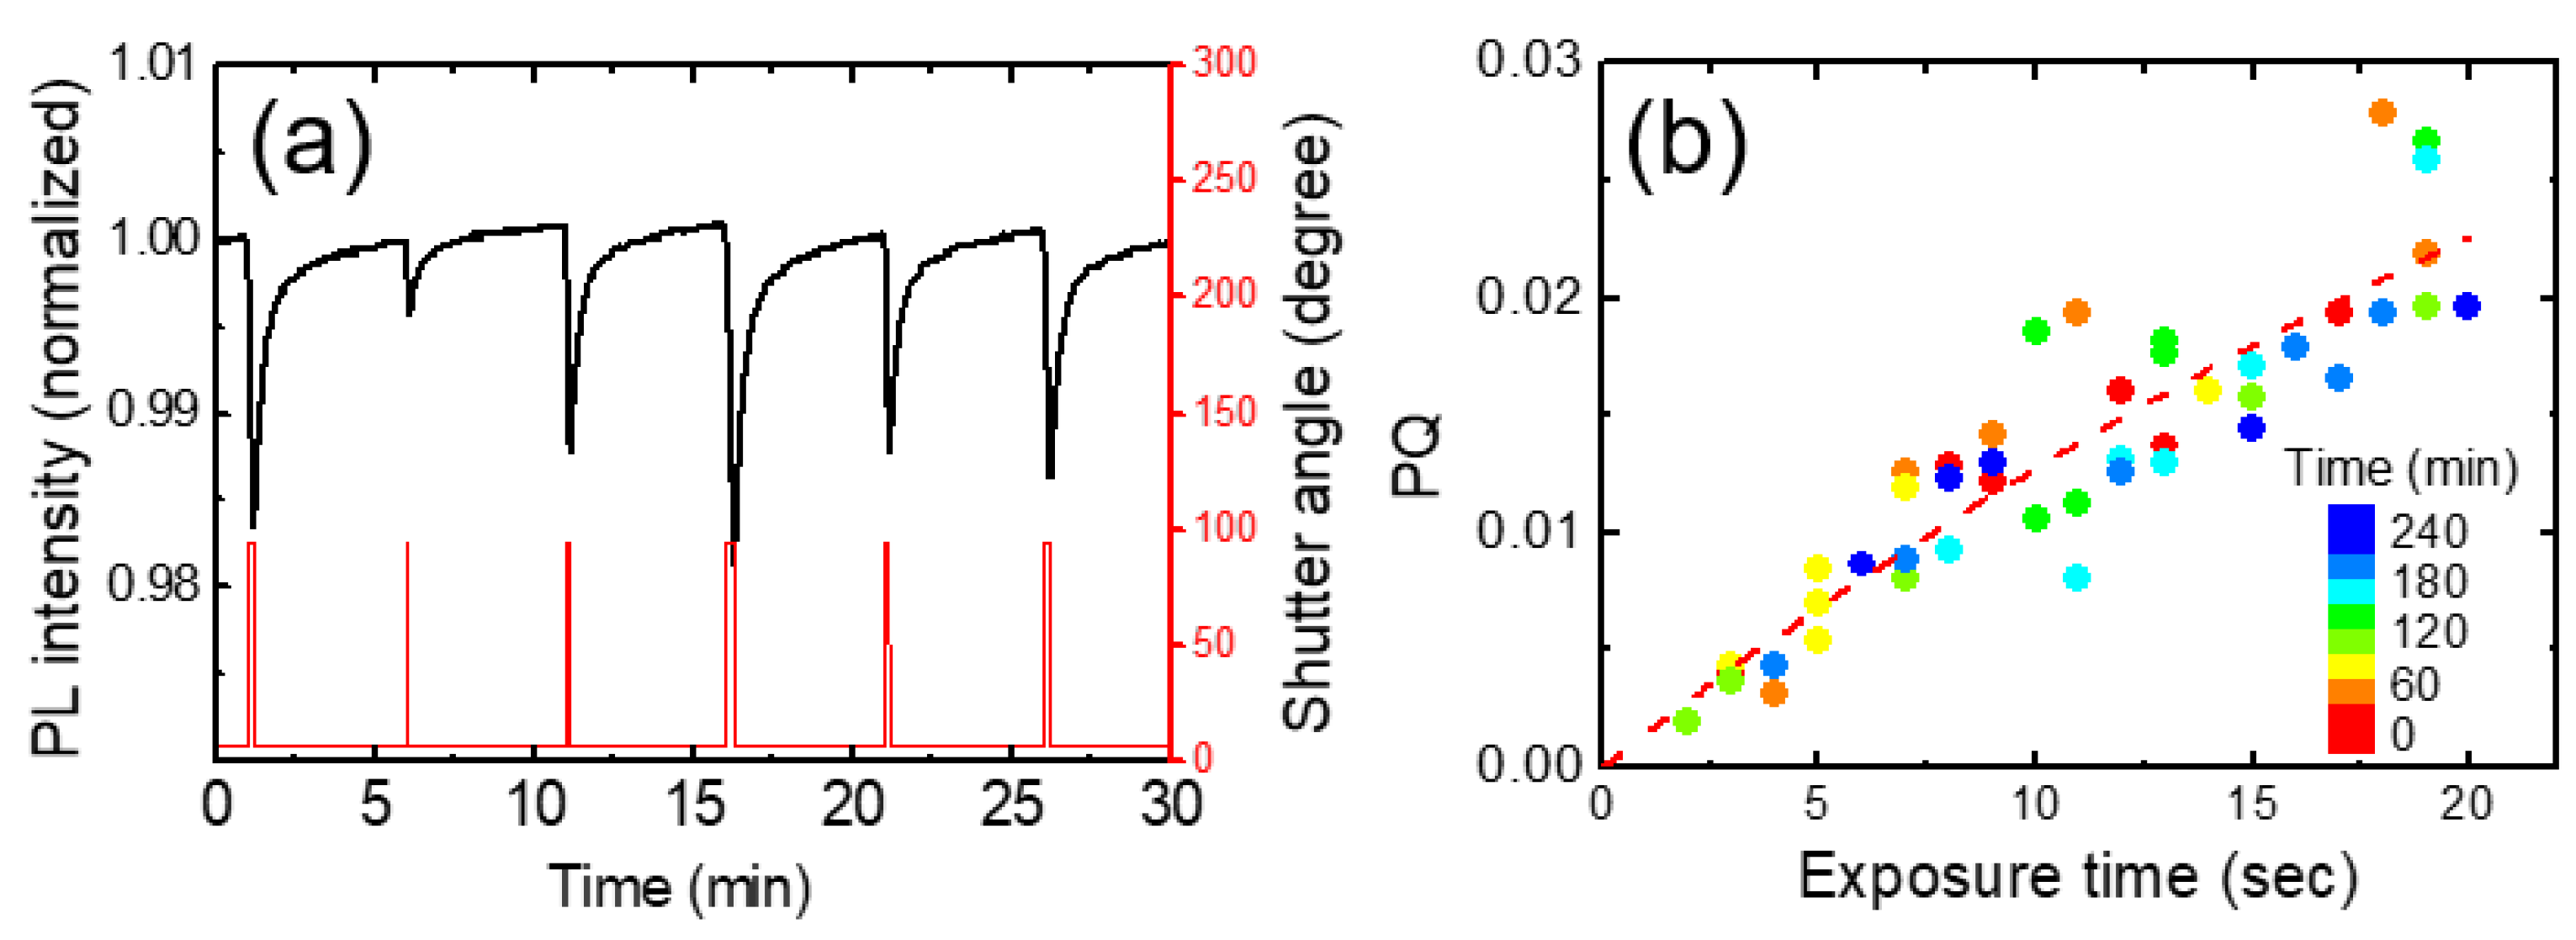
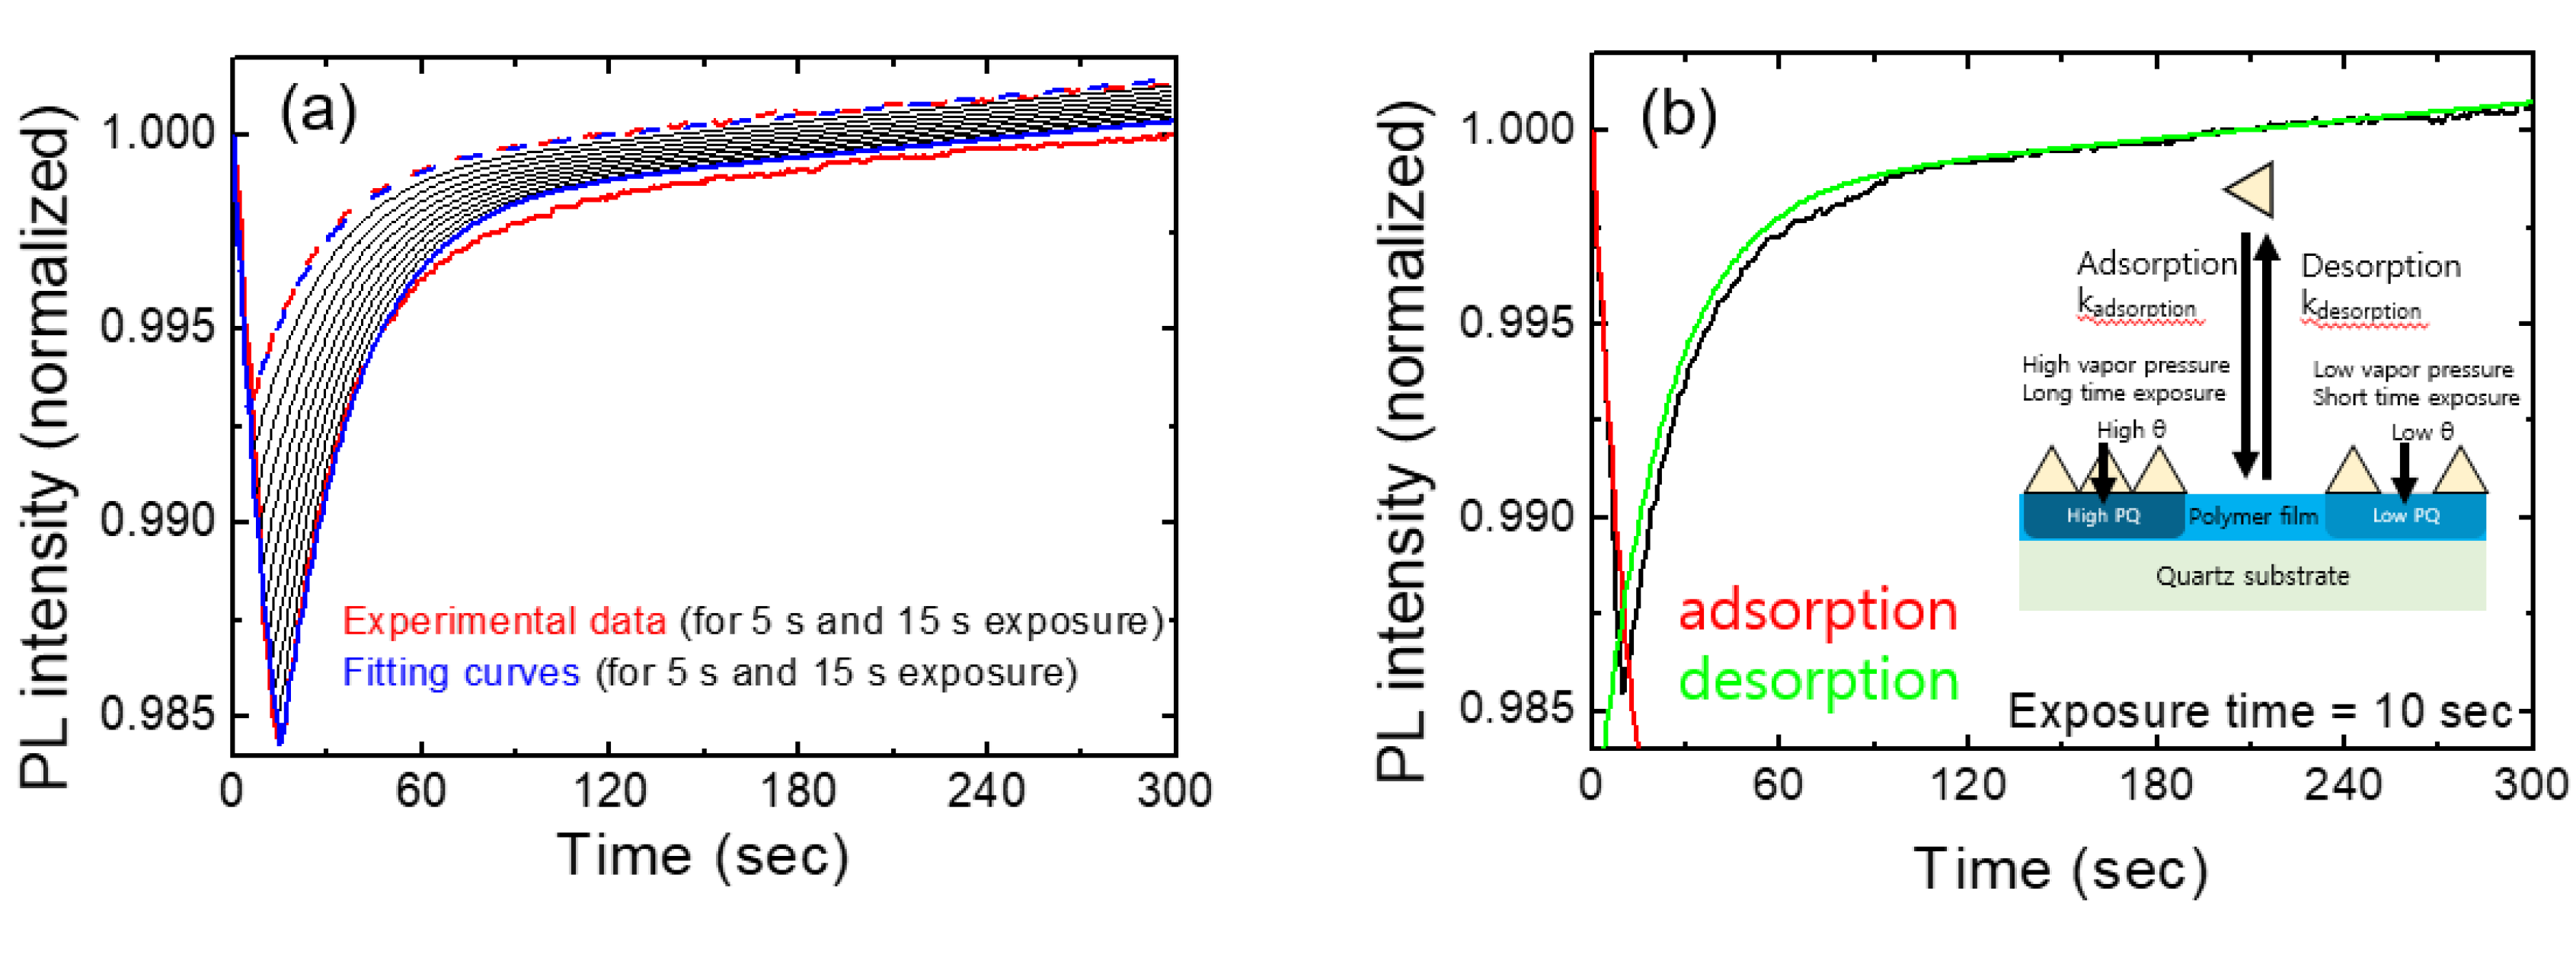
Figure 5a, we show the temporal behavior of normalized PL intensities for various exposure times. The red curves represent experimental results for exposures of 5 s and 15 s, while the blue curves depict the model-predicted PL intensities for the corresponding exposure times. Additionally, black curves illustrate the expected PL intensities at 1 s intervals, ranging from 6 s to 14 s. These calculations were performed using fitting parameters derived from the 10 s exposure data.
As we checked the value of the linear term of bt in the Table, the linear contribution was significantly smaller than the other two terms, as expected. Despite many assumptions and simplifications, this model seemed to well explain the experimental results at least under the conditions of short exposure times (up to 15 seconds) and for relatively low vapor concentrations.
Table 1 shows the fitting parameters used for
Figure 5. Instead of the individual values of ‘k
adsorption’, ‘k
q’, and dilution factor ‘P
r’, the value of ‘τk
q[S]k
adsorptionP
2,4-DNTP
r’ represents the quenching speed. P
2,4-DNT is the equilibrium vapor pressure of DNT and the dilation factor ‘P
r’ is to take care of the fact that the vapor pressure of DNT molecules is significantly lower than that of the equilibrium vapor pressure at a given temperature due to the small amount of powders inside of the box; another factor for the dilation of the DNT vapors was due to the mixture of the air from the box and the air in the lab.
As the exposure time and the vapor pressure increase, the degradation of the polymer film may become severe, and hence it will be difficult to describe the temporal behavior of the PL intensity with this simplified model. Swelling and mass increase of polymer thin films exposed to high concentrations of quencher molecules have been reported.
In this study, the surface adsorption by exposure to low vapor pressure for a short time and the desorption of the adsorbed molecules were our main concerns, and the experiment was conducted under the condition that PL intensity was restored by more than 80% after the five-minute refresh time; the effect of molecular diffusion into the thin film was not our primary factor.
To explain the change in PL intensity due to continuous excitation light illumination and the incomplete recovery of the PL intensity in the quenching reaction, a and b parameters were introduced into the equation for the fitting process.
3.3. Effect of temperature and humidity
In this section, we discuss the temperature and humidity dependence of the polymer PL intensity and the real-time variation of the PL intensity, rather than of the quantitative characteristics of quenching behaviors.
It is well-known that PL intensity decreases with increasing temperature since the lattice vibrations, or phonons induce non-radiative recombination of photo-excited electrons. In addition to the PL intensity, other properties such as PL spectra [
18], the adsorption of target molecules, and the efficiency of the quenching reaction can also be affected, and thus great efforts are needed to resolve all these issues. Of course, temperature has a great impact on the vapor pressure of target molecules, which will be discussed shortly at the end of this paper.
Although various temperature-dependent properties can affect sensing, PL intensity change with temperature is particularly important and also easy to monitor because the intensity changes even without the presence of analyte vapor. On the other hand, in the case of adsorption or reaction rate change, it is difficult to distinguish whether the effect is due to the vapor pressure or due to the reaction rate, and the temperature dependence of the reaction rate is not considered in this study.
In general, reducing the effect of humidity is an important issue for chemical sensors. In many cases, water molecules can induce oxidation or degradation of materials, and they can cause variations in the PL intensity for many materials including perovskites and polymers [
19,
20]. To prevent this, an additional hydrophobic protective layer or functionalization can be introduced [
21], but the change due to moisture is still an important factor because such a protective layer can affect the sensing characteristics.
The optical properties of polymers are influenced by various factors such as molecular conformations, aggregation, and degree of crystallization [
22,
23]; the infiltration of water molecules into sensing materials can have a significant impact on those characteristics. One extreme example is a hydrogel, where its structure can be affected by humidity [
24]. Not only for hydrophilic polymers but also for hydrophobic polymers, it is important to consider the influence of humidity on PL intensity.
On the contrary to most DNT sensing systems in a lab., our experiments were carried out in a near-open system, where the air from the box was mixed with the air in the lab.
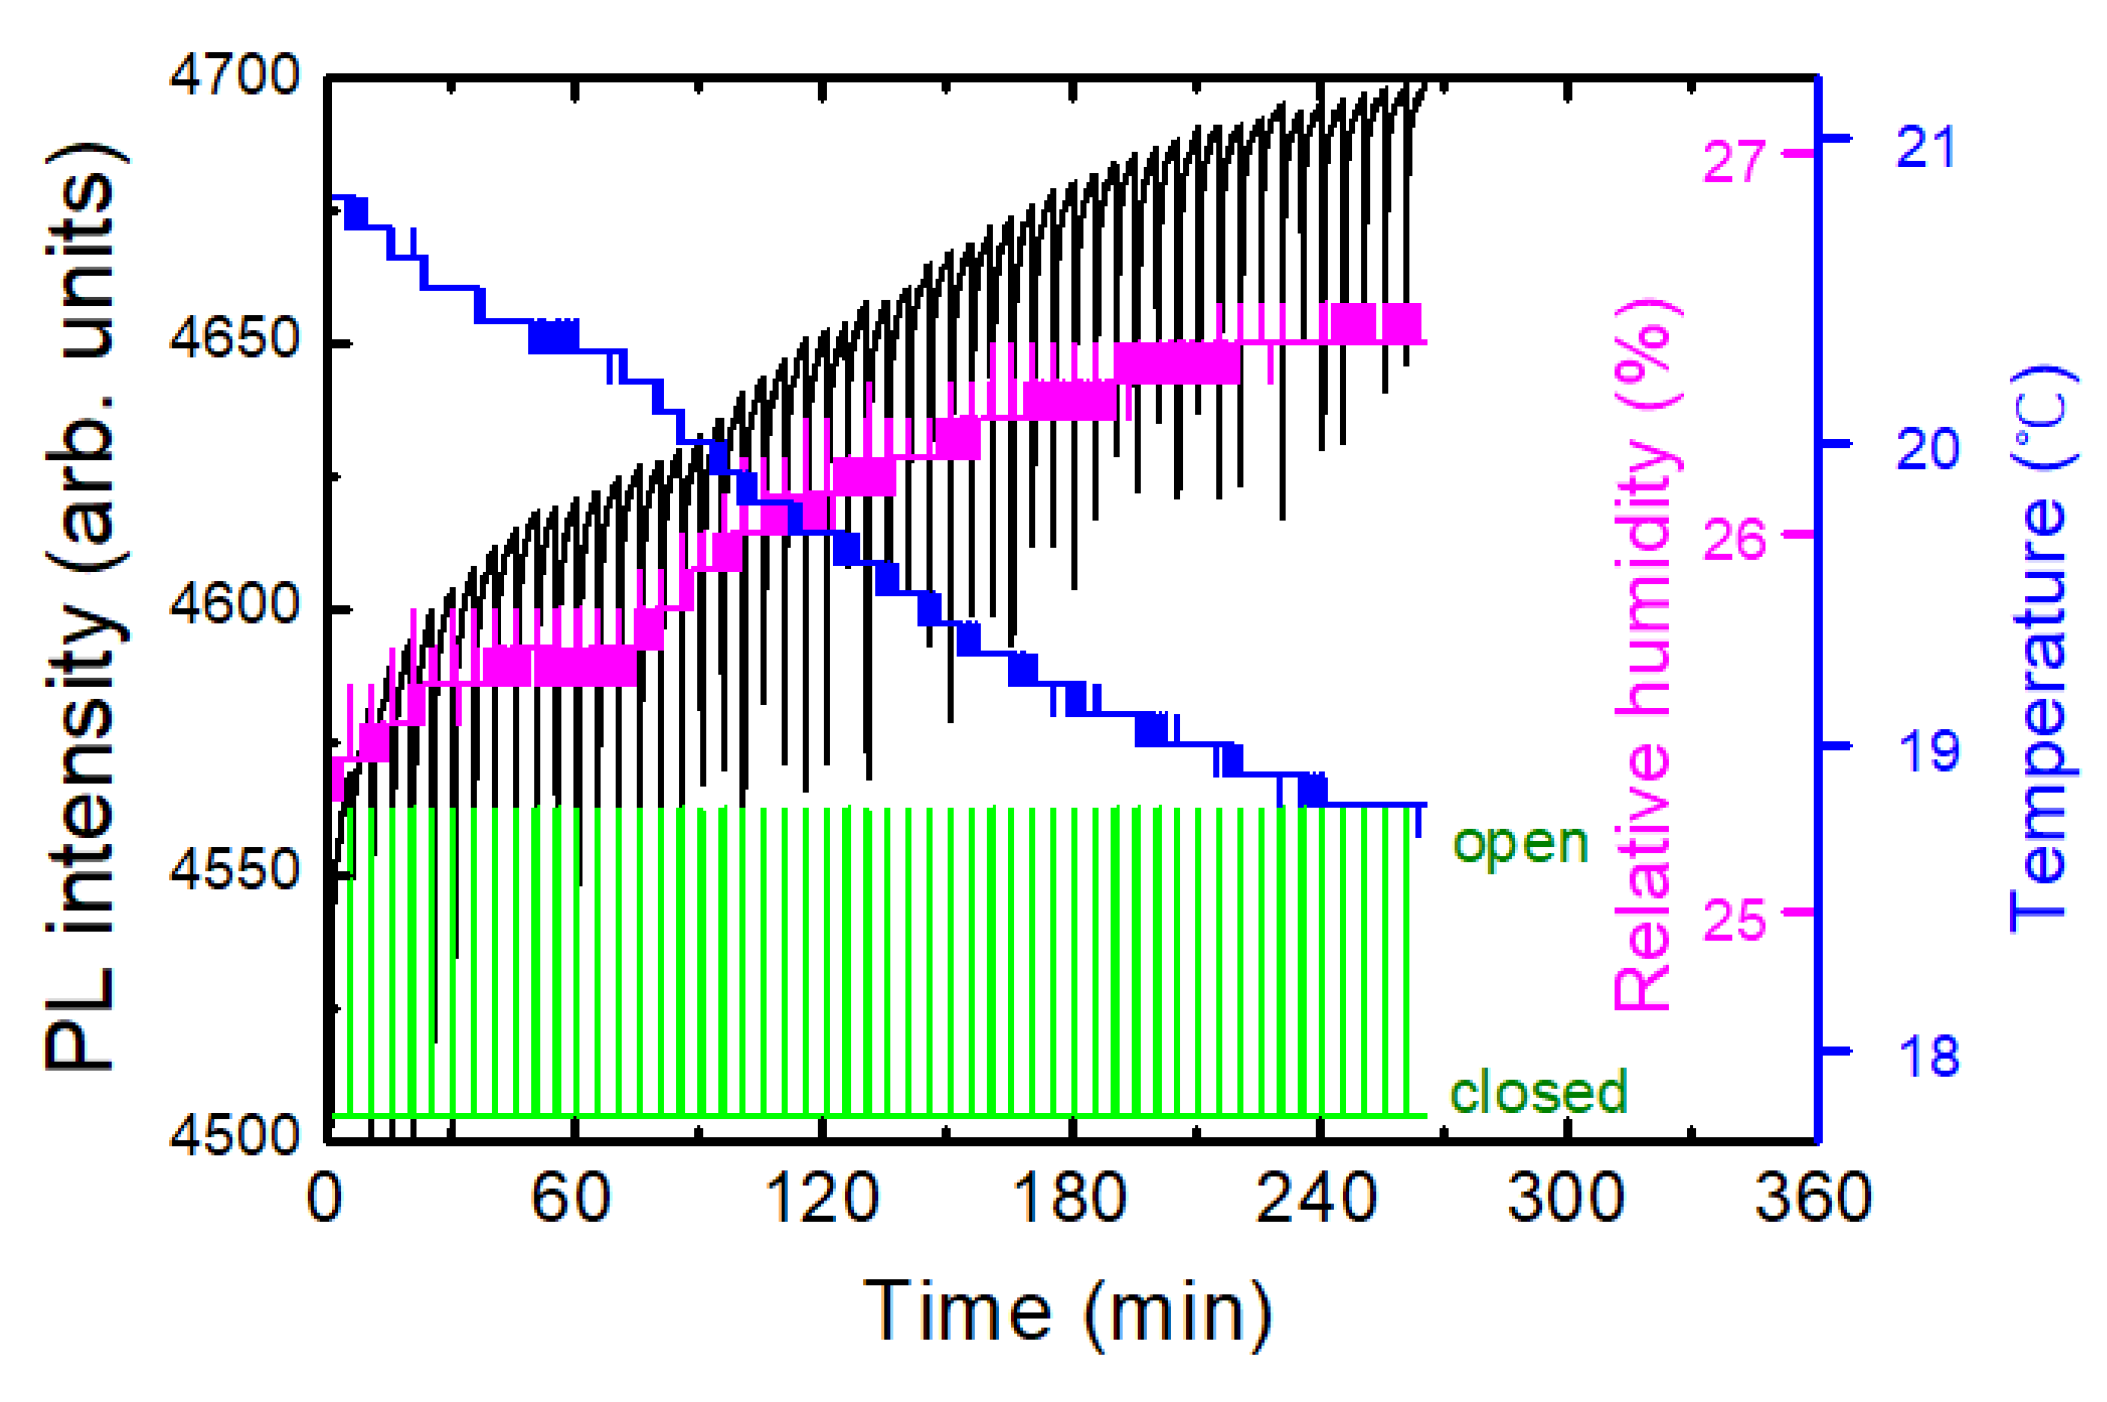
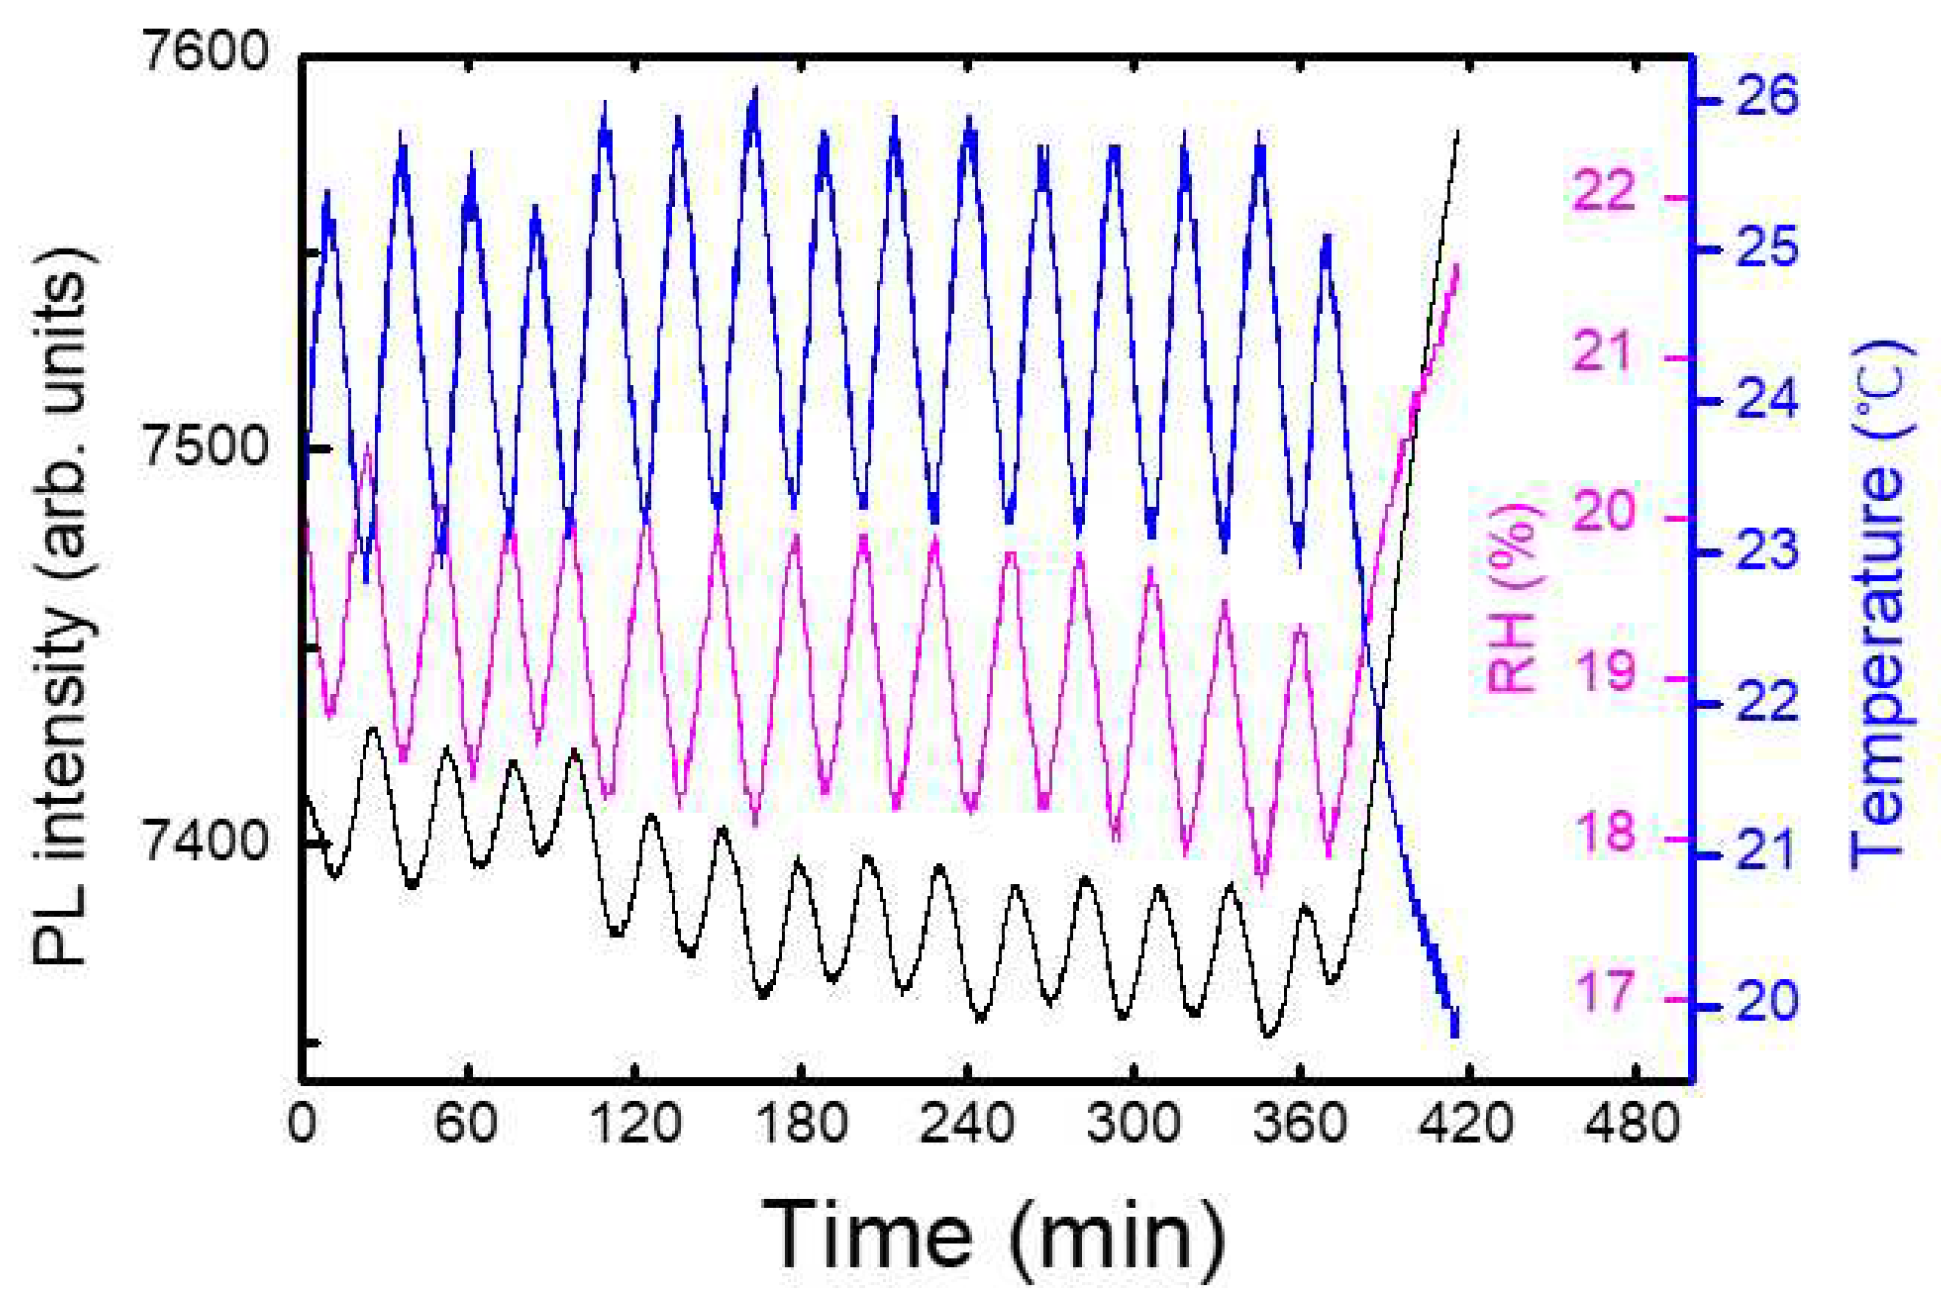
Figure 6a shows an example of a temporal behavior of PL intensity (black), temperature (blue), and relative humidity, RH (magenta), where the oscillation of the temperature was due to a heater operation during winter. In this case, the PL apparatus was set at 1 m above the box with the shutter, and no immediate PL response was observed. On the other hand, the variation in the relative humidity as a result of the temperature change can be seen, as expected.
To separately estimate the effect of T and RH on PL intensity, we heated a polymer substrate and measured PL, while the RH inside of the lab. remained constant. In this case, the temperature of the substrate was measured with a thermocouple which was in direct contact with the substrate.
In
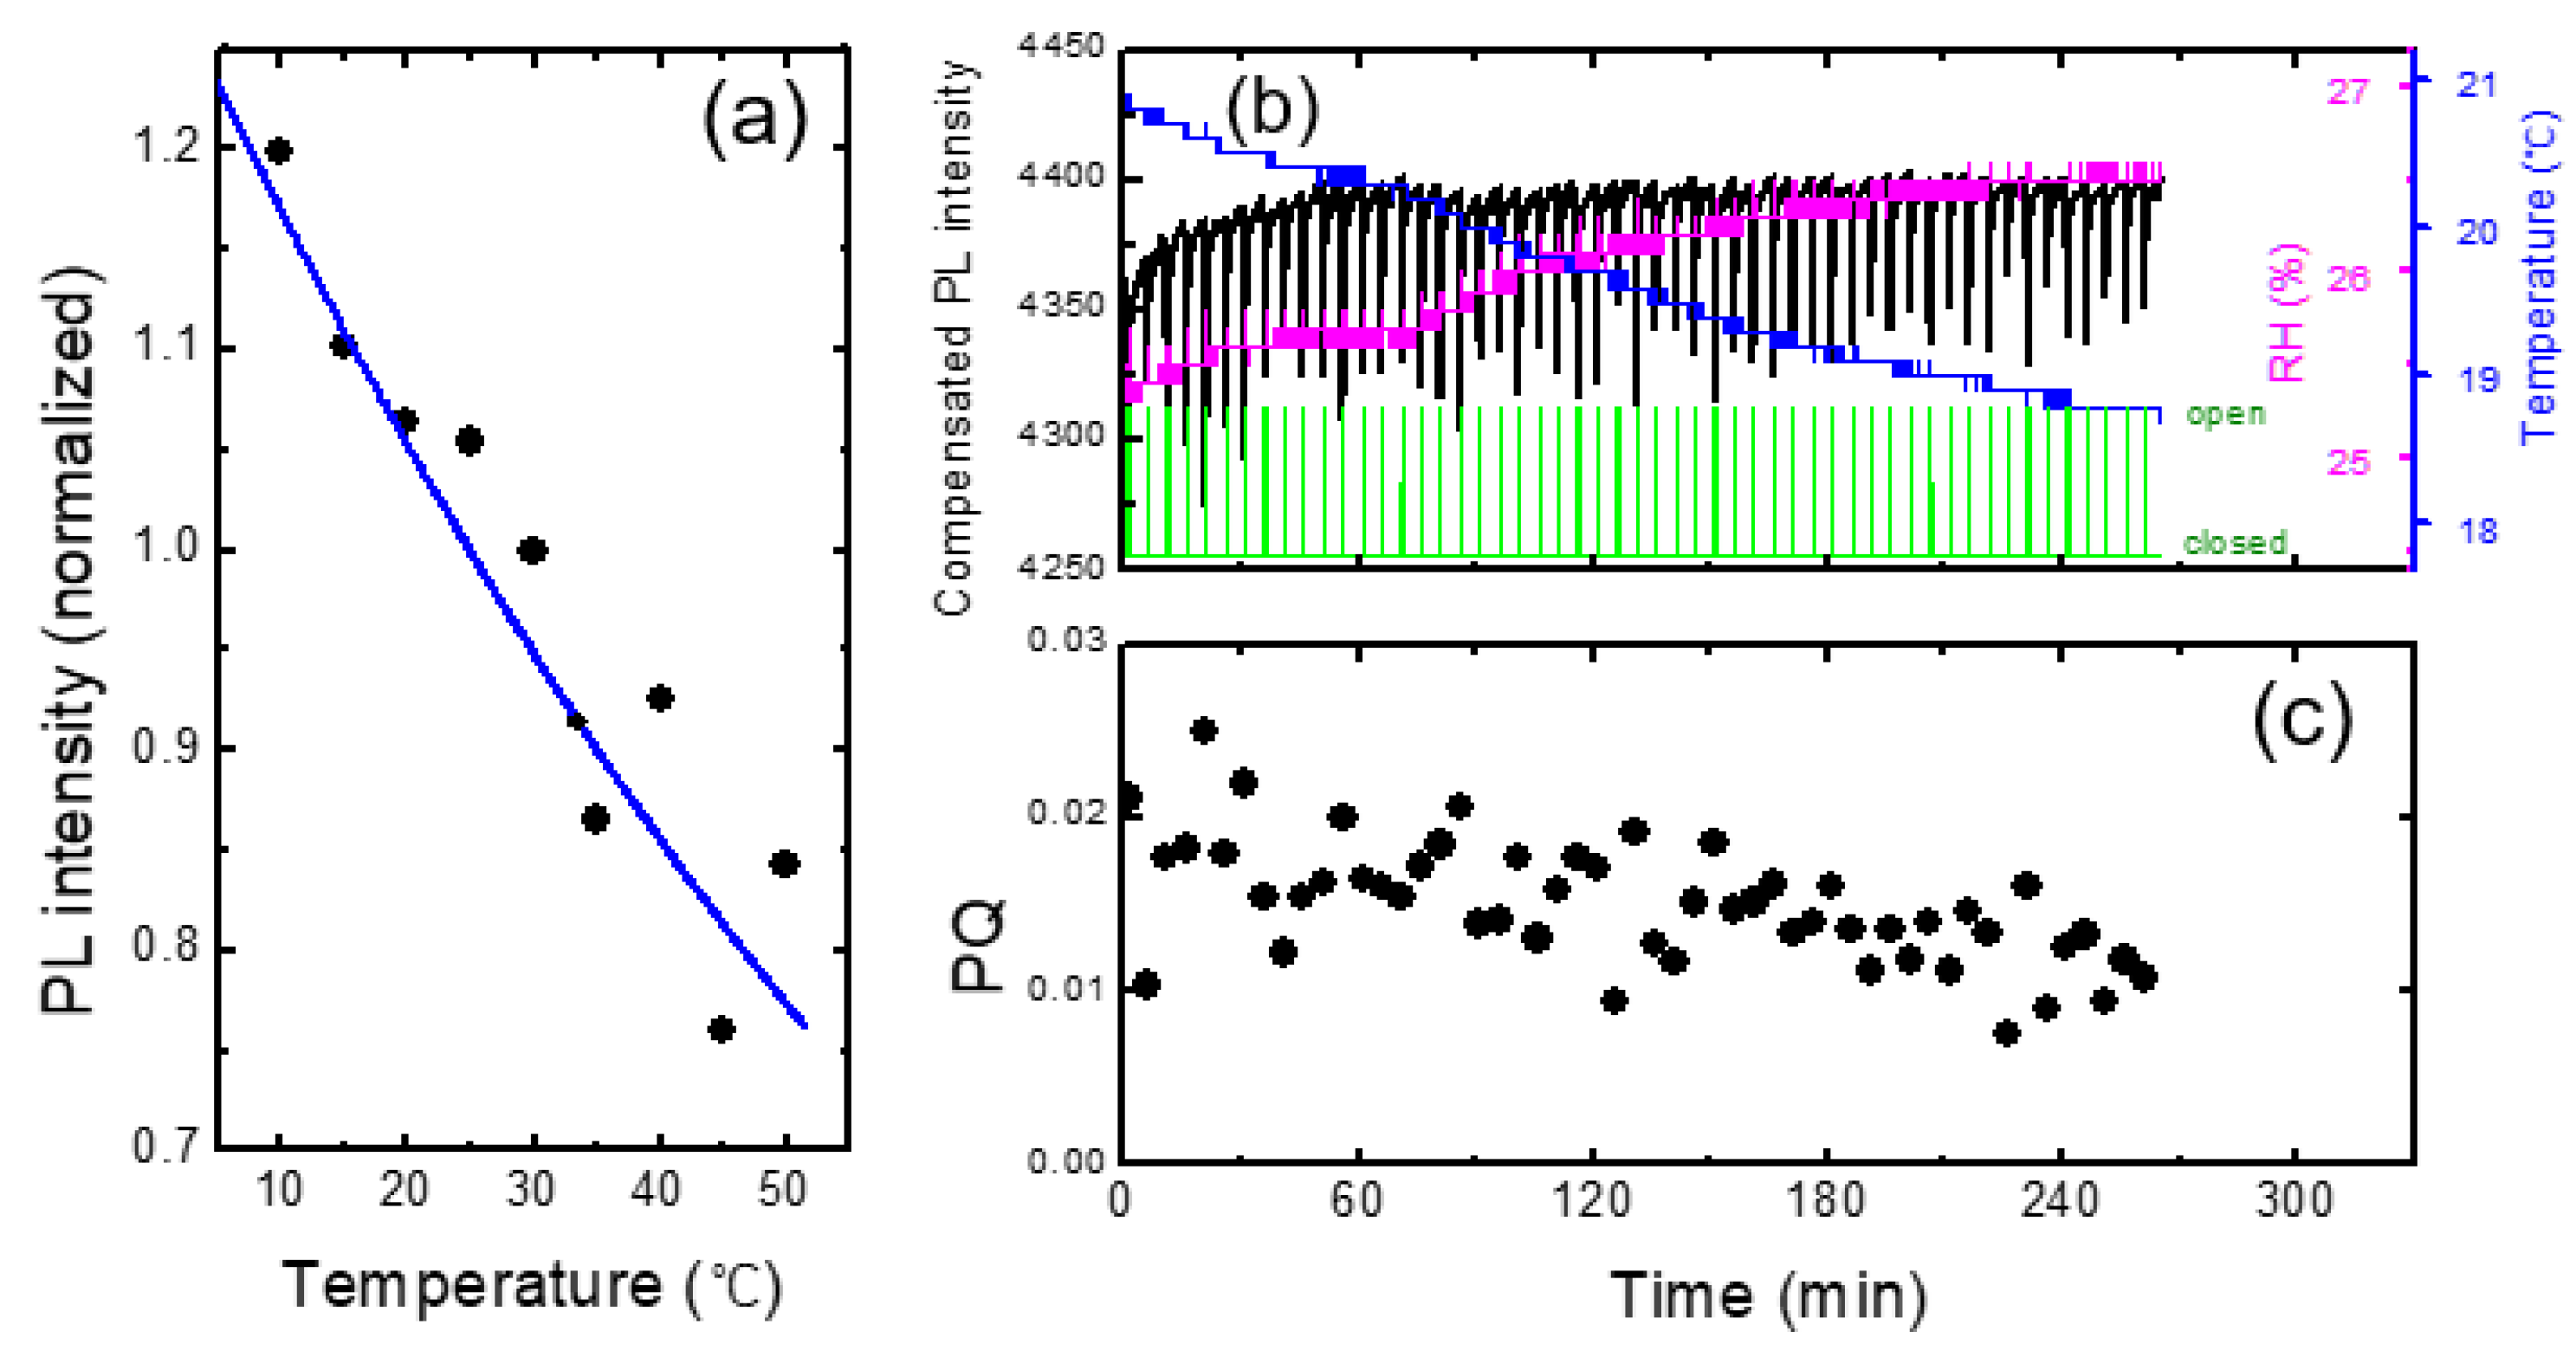
Figure 7a we show the PL intensity as a function of temperature for a PCC film. Arrhenius equation I
0/(1+A*exp(-E
a/k
BT)) was used for the fitting curve, where A=265, E
a = 0.131 eV, and k
B is the Boltzmann constant. Similar to the result in
Figure 6, PL intensity was reduced by about 1 % for the increase of the temperature by 1 degree. This result indicates that when the change of RH was within 2 %, the effect of humidity on PL intensity was less than that of the temperature.
In
Figure 7b, we show the PL intensity compensated with temperature variation using the raw data in
Figure 3. The PL intensity after 60 minutes of the device operation remained fairly constant after the compensation, whereas the initial PL increase for the first 20 minutes was still clearly observed. The PL enhancement for the first 20 minutes was attributed to the effect of the light exposure, discussed in ref. [
11,
25,
26,
27].
The temperature compensation appeared to be very powerful and sufficient for the monotonic and slow change of the temperature. However, for more complicated data, such compensation was not sufficient, as we will discuss in the next section.
As shown in
Figure 7c, the PQ value was found to be reduced as a function of time, which was attributed to the decrease of the vapor pressure as the continuous operation of the shutter. On the other hand, even before the vapor pressure inside of the box was not much decreased, or even when the operating time was only half an hour, the variation of PQ was found to be fairly large. As the air containing the DNT vapor was released from the box when the shutter was open, it would take some time to reach the equilibrium vapor pressure outside of the box; when we measured the PQ immediately after opening the shutter, the distribution of the vapor molecules may not be uniform, possibly causing the large variation of PQ values.
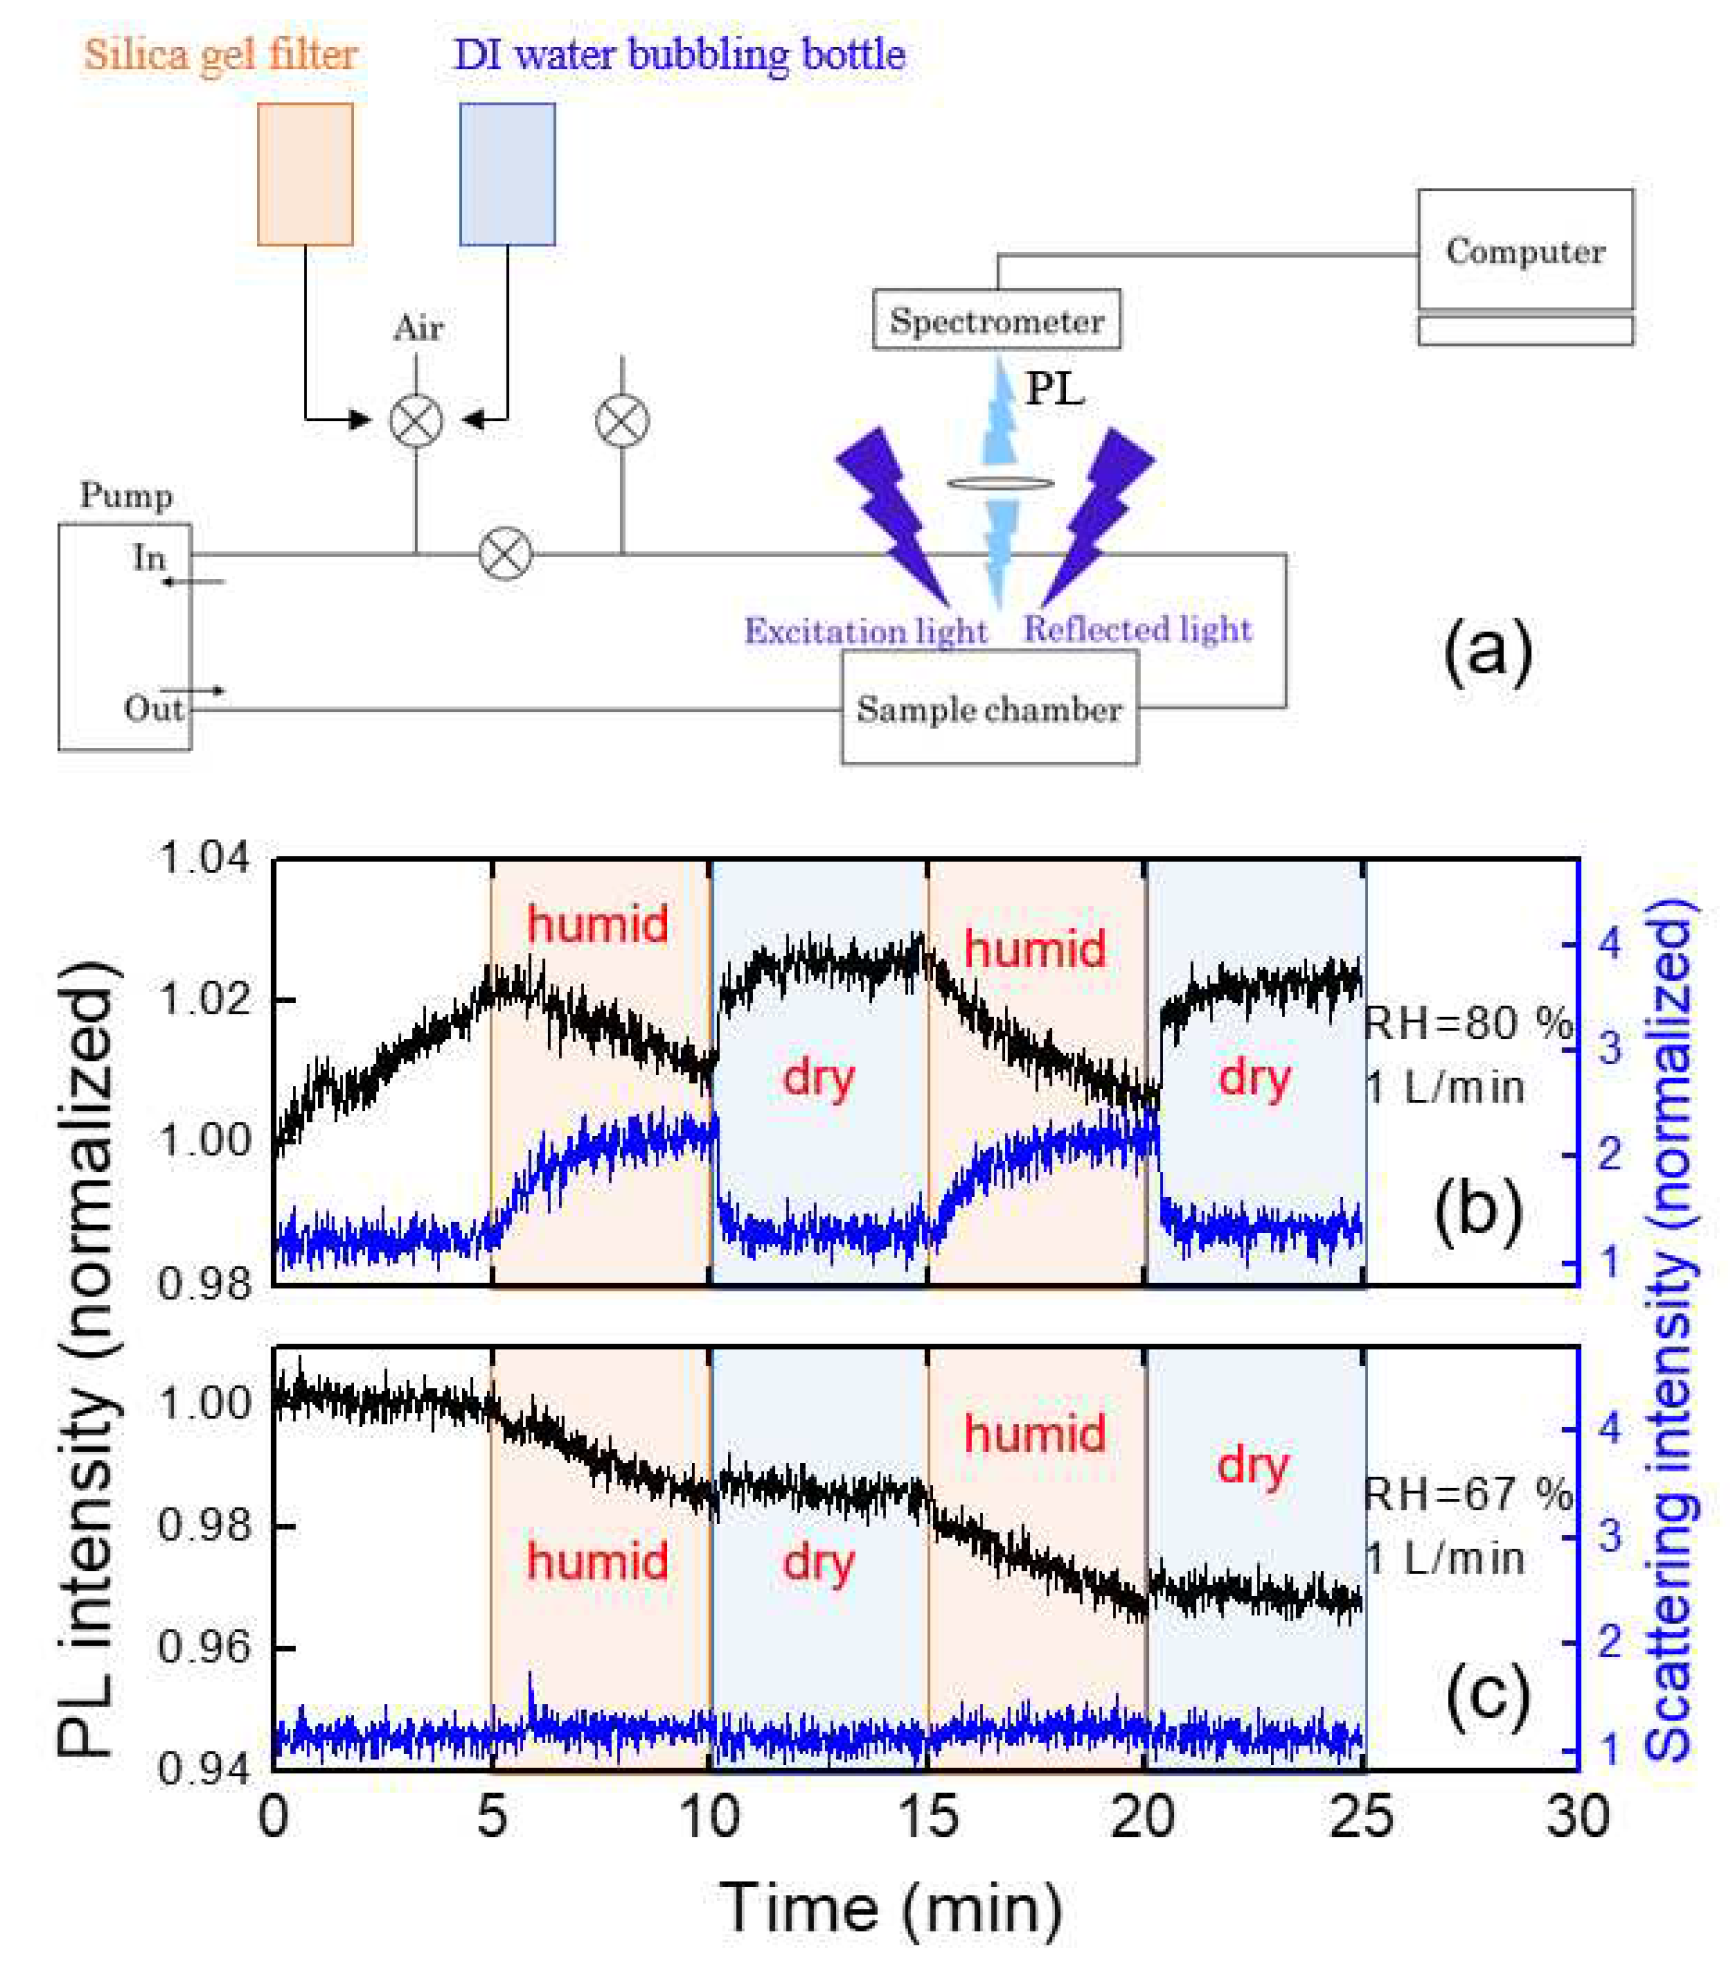
To estimate the humidity effect, we utilized a syringe filter filled with a silica gel and DI water, and the experiments were conducted by alternating filtering and bubbling connected with our home-made PL system. A schematic diagram for the experimental setup is shown in
Figure 8a. The values of RH were estimated to be around 20% (filtering) and 90% (bubbling), corresponding to the “dry” and “humid” conditions, respectively. For RH=90%, PL intensity gradually decreased (
Figure 8b), which was recovered within a second with dry air with 1 liter/min flow rate.
The humidity dependence of the PL intensity can be somewhat complicated by some additional factors: 1) under very high humid conditions, water molecules may condensate on the optical components reducing the apparent PL intensity 2) scattering of PL in the air may be affected by the water molecules.
It was found that the immediate change of the PL intensity with dry air within tens of seconds was associated with the reduction of the scattering at the interface of the optical component, or at the surface of the polymer film, as shown in
Figure 8b. The parasitically scattered light was estimated from the intensity near the LED wavelength of 400 nm in
Figure 3. The origin of the increased scattering under such humid air conditions may be due to the water condensation on the surface of optical components as well as from the polymer films. With the injection of the dry air, the PL intensity was quickly recovered.
We also used room air on a humid day (RH=67 %) during the rainy season in July.
Figure 8c shows the PL intensity change of the polymer thin film under humid and dry air conditions. In this case, there was no abrupt change in PL intensity unlike
Figure 8b, but the PL intensity slowly decreased during the humid period.
In the case of RH=67 %, as in
Figure 8c, the parasitically scattered light remained almost constant, indicating the water condensation effect and the scattering by water molecules were minor, whereas the slow decrease of the PL intensity was observed. When polymer films are exposed to humid air, the PL intensity may not be fully recovered even after exposure of dry air due to the semi-permanent degradation of the polymer.
On rainy days, a false positive detection may occur more frequently due to the light scattering of PL associated with the water condensation. In addition, the deterioration of polymer films needs to be considered after a long period of device operation, especially in very humid weather, or after the exposure of highly concentrated DNT vapors.
3.4. Analysis of complicated situations and degradation of polymer films
In some cases, the compensation of temperature and humidity may be sufficient for the compensation of sensing characteristics such as PL and resistivity. However, when environmental factors are complicated, those corrections alone cannot fully explain the data. In particular, in the case of vapor phase measurement, since the vapor collection efficiency is greatly affected by the airflow, care must be taken in data processing and statistical analysis.
It is very challenging to understand the effect of convection wind inside a building especially when we use a heater, or when we open the windows. The distribution of the DNT vapor molecules may constantly vary with convection airflow. We examined how the convection and turbulence caused by the temperature difference affected the PL quenching results, while we heated the box by placing a heater under the acrylic box.
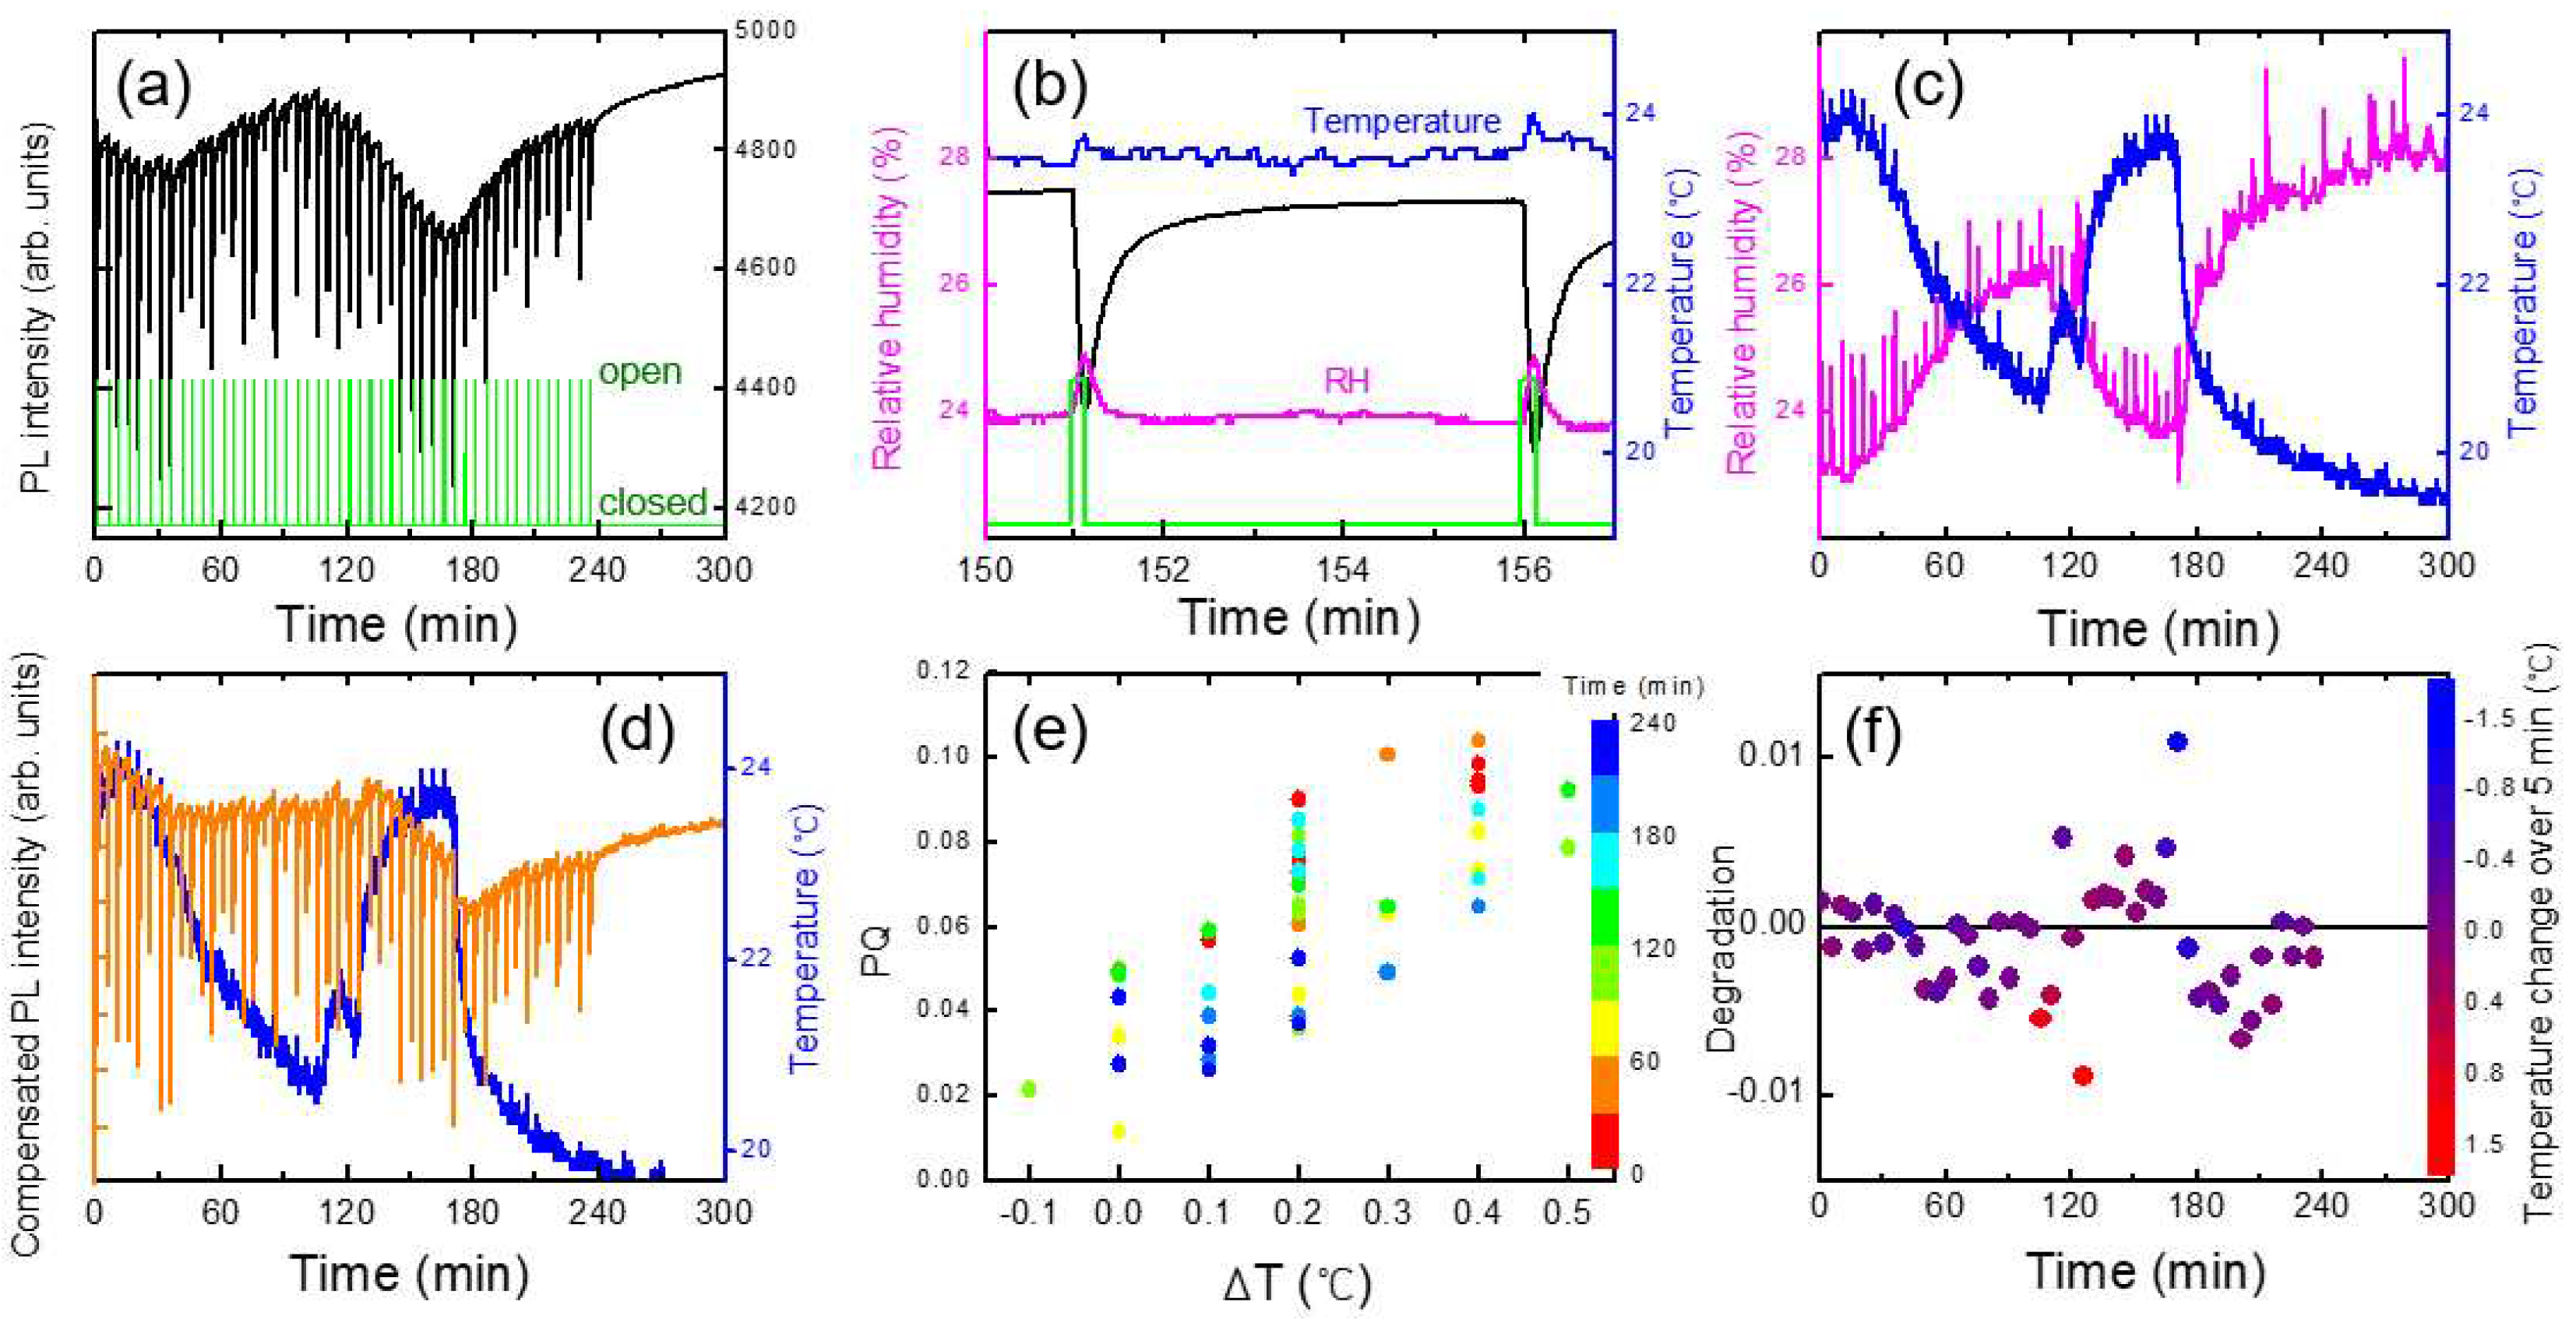
Figure 9 shows an example of a data set to demonstrate such complicated effects. With every shutter opening, the change of temperature (ΔT) inside the PL apparatus was monitored (
Figure 9b) and compared with PQ efficiencies
Figure 9e.
When the shutter was open, not only DNT vapors but also warmer air diffused out and entered the PL apparatus, and an instantaneous increase in temperature (ΔT) was observed, which was a fairly good indicator of airflow. In some cases, the humidity inside the acrylic box was slightly higher than outside the box, possibly due to the speed difference in moisture condensation and drying. In such cases, ΔRH was also clearly observed (
Figure 9c), despite the difference in the diffusion coefficients of DNT and water vapors.
In the experimental set-up, the PL apparatus was located slightly higher than the center of the shutter to optimize the PQ efficiency; the greater the upward convection, the greater the amount of DNT vapor flowing into the apparatus. The correlation between ΔT and PQ shown in
Figure 9e was likely due to the airflow.
The orange curve in
Figure 9d represents the PL intensity compensated for temperature variation. In this case, the value of PQ was 5.4 (± 2.4) %, which was larger due to the heating of the box. For a~1 and b~0, PL intensity would completely recover within 5 min according to the desorption model. After about 130 minutes, however, it was found that the PL intensity was not fully recovered within 5 minutes after the large PL quenching. Although we compensated the PL intensity with the temperature change, PL intensity was decreased with increasing time and with continuous exposure to the high concentration of the DNT molecules. It is worth mentioning that the PL intensity seemed to recover without any shutter operation between 240 and 300 min.
To quantify the incomplete recovery of PL intensity, or the degradation, we plot (I
o - I (5min))/I
o.
Figure 9f shows the degradation as a function of the PQ value after the temperature compensation. As seen in the figure, there were two data points (blue and red) that exhibited significant deviations. We think that these points were associated with the rapid changes in temperature and a slower response of the polymer film.
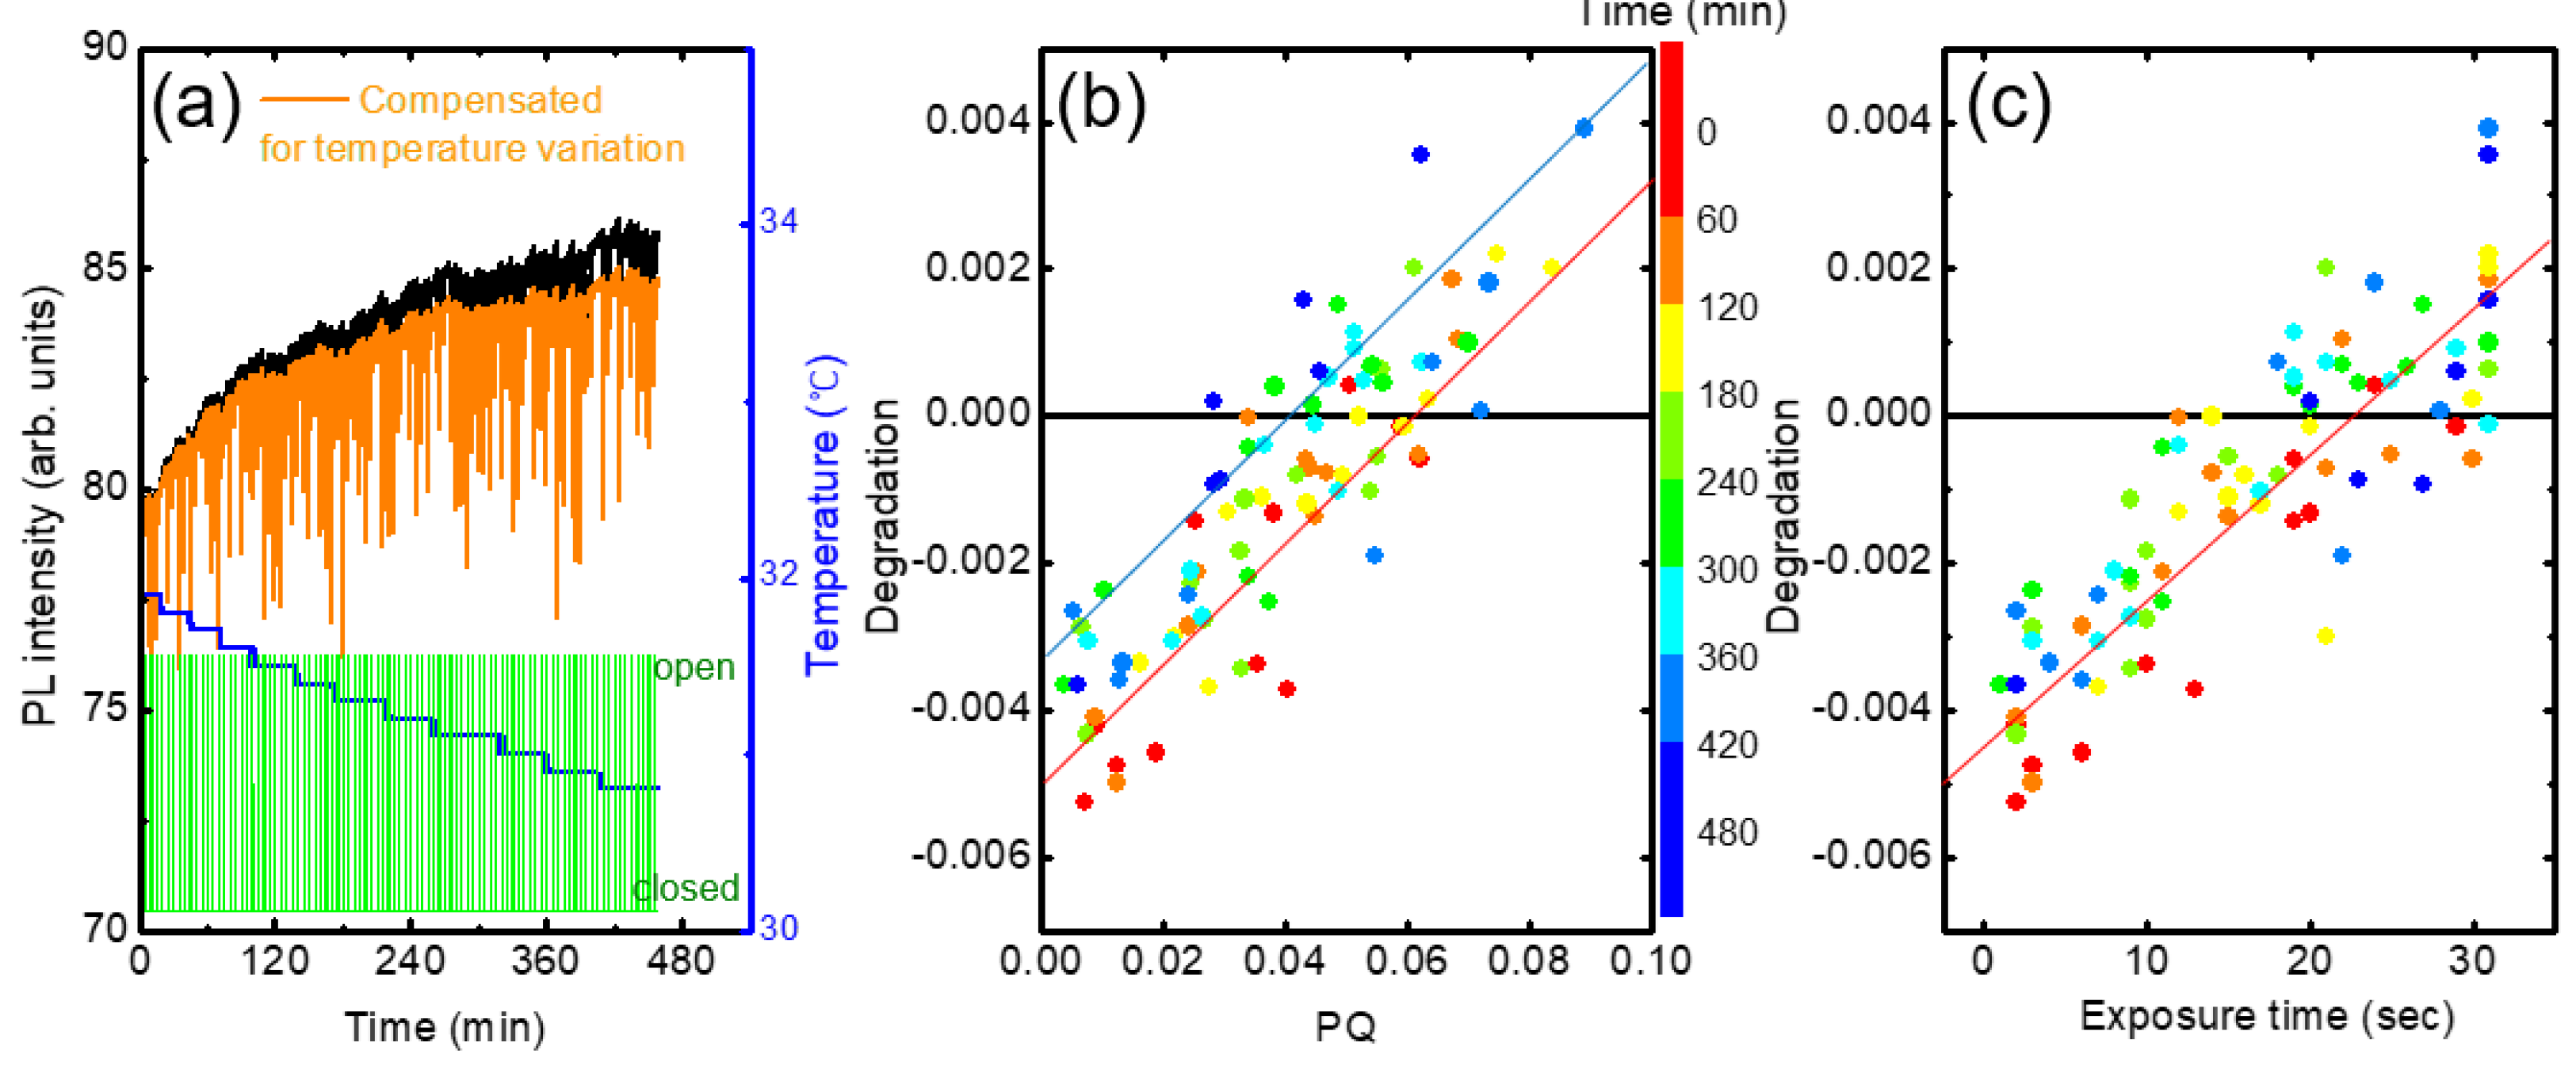
In
Figure 10a we show the PL intensity variation of a fresh (as-deposited) film. Even after the temperature compensation, PL intensity was found to be still increased with time (orange). In the modeling in the previous section, we assumed that the incomplete PL recovery is proportional to PQ. In a plot of degradation vs. PQ, the slope and y-intercept are expected to be ‘1-a’ and ‘-b(t-(1-a)t
q)’, respectively.
In practice, these parameters depend on several factors such as the condition of the polymer film, elapsed time, and PQ value. For example, the extent of the increase appeared to be larger for as-deposit films, and the y-intercept became more negative in the degradation vs. PQ plot.
Figure 10b shows the degradation as a function of PQ obtained from the raw data in
Figure 10a. The color indicates elapsed time. The y-intercept was slightly increased from ~-0.005 to ~-0.0035 with the time from ~60 to ~400 min. Similarly, the degradation was also increased with the increase of the exposure time, as seen in
Figure 10c.
