Preprint
Article

Comparative Small and Large Gap Rheometry for Cementitious Pastes

Altmetrics

Downloads

99

Views

59

Comments

0

This version is not peer-reviewed

Submitted:

11 February 2024

Posted:

13 February 2024

You are already at the latest version

Alerts
Abstract
Rheometric investigations facilitate the rheological analysis of cementitious suspensions. However, the choice of the rheometric device and raw data conversion affect the results. Contrary to small gap rheometry, where the flow data shear stress
Keywords: 
Subject: Engineering  -   Civil Engineering

1. Introduction

The rheological characterization of cementitious building materials is of utmost importance for the adjustment of cement and concrete workability, processing prediction, and control. Experimental flow tests or rheometric tests facilitate the analysis of the rheological parameters yield stress τ 0   [ P a ] , which is the stress that must be surpassed to make a suspension flow, and the plastic viscosity μ   [ P a s ] or apparent viscosity η   [ P a s ] . Empirical flow stoppage tests, where a final flow value can be correlated to a yield stress and the respective flow time can be correlated to a viscosity, are frequently applied at construction sites. Roussel et al. correlated the final slump flow radius of a material to its yield stress [1]:
τ 0 A , R 225 ρ S g V 2 128 π 2 R 5
Where τ 0 is the yield stress in [ P a ] , ρ s the density of the tested material in [ k g m 3 ] , V the tested volume in [ m 3 ] and R the final slump flow radius in [ m ] . A more precise, but at the same time more expensive solution is the use of viscometers or rheometers, which measure the torque response T   [ N m ] as a function of an applied rotational speed ω   [ r a d s ] . While several geometries and set-ups for rheometers exist, see e.g. [2], a general distinction can be made between small and large gap rheometers. in small gap rheometers (such as Parallel Plate, Coaxial cylinders or Cone-Plate geometries), the suspension’s flow field is idealized assumed to be homogeneous. Thus, the shear stress τ in [ P a ] , and the shear rate γ ˙   in [ s 1 ] can be directly calculated from the motor device data T and ω , see for more information e.g. [3,4]. Large gap geometries such as the Couette device or the Vane-in-Cup, however, possess a heterogeneous flow field, wherefore the conversion from rotational speed into a shear rate γ ˙   is not directly possible. Figure 1 illustrates the Vane-in-Cup system with a fixed cup and a rotating vane. with its drive on the vane, the shear rate γ ˙   decreases from its inner radius R i towards its outer radius R o (see Figure 1, middle and right).
In dependence of R i and R o , the calculation of the inner and outer shear stress τ i   and τ o is:
τ i = T 2 π h R i 2 ; τ o = T 2 π h R o 2
Where T is the measured torque in [ N m ] and h is the height of the vane in [ m ] . for materials that possess Newtonian or Bingham flow behavior:
τ γ ˙ = τ 0 , B + μ   γ ˙
with τ 0 , B as the Bingham yield stress and μ as the plastic viscosity, the Reiner-Riwlin approximation describes the relation between the torque T , rotational velocity ω , the geometrical boundary conditions and the rheological parameters τ 0 , B and μ [5]:
ω = T 4 π h µ 1 R i 2 1 R o 2 τ 0 , B µ ln R o R i
If the large gap is not fully sheared, plug flow occurs, and the outer radius R o becomes R o = R p l u g , o . The determination of flow curves from large gap rheometric data requires the conversion from ω to the shear rate γ ˙ , which was intensively investigated by Krieger in [6,7]. Krieger’s second solution for the calculation of γ ˙ is presented in Equations (5) and (6):
γ ˙ = 2 ω n 1 R o R i 2 n
with:
n = d ln τ B d ln ω
Various researchers applied the Reiner-Riwlin approximation [4,8,9,10]. Another conversion formulation is the affine-translation approach, which applies conversion factors to scale T and ω to τ and γ ˙ (see e.g. [11]). Feys at al. extended Equation (4) for the calculation of rheological parameters acc. the modified Bingham model, see [12]. It was found that the Reiner-Riwlin approximation is applicable for the calculation of μ for Newtonian fluids [4]. for materials with shear rate-dependent viscosities, Equation (4) incorporates errors. Calculated rheological parameters depend on the range of input data and the non-linear flow behavior. A targeted investigation of the effect of non-linear cementitious paste flow on rheological data is yet to be published. This research approaches to close this gap.

2. Materials and Methods

2.1. Concept of Investigation

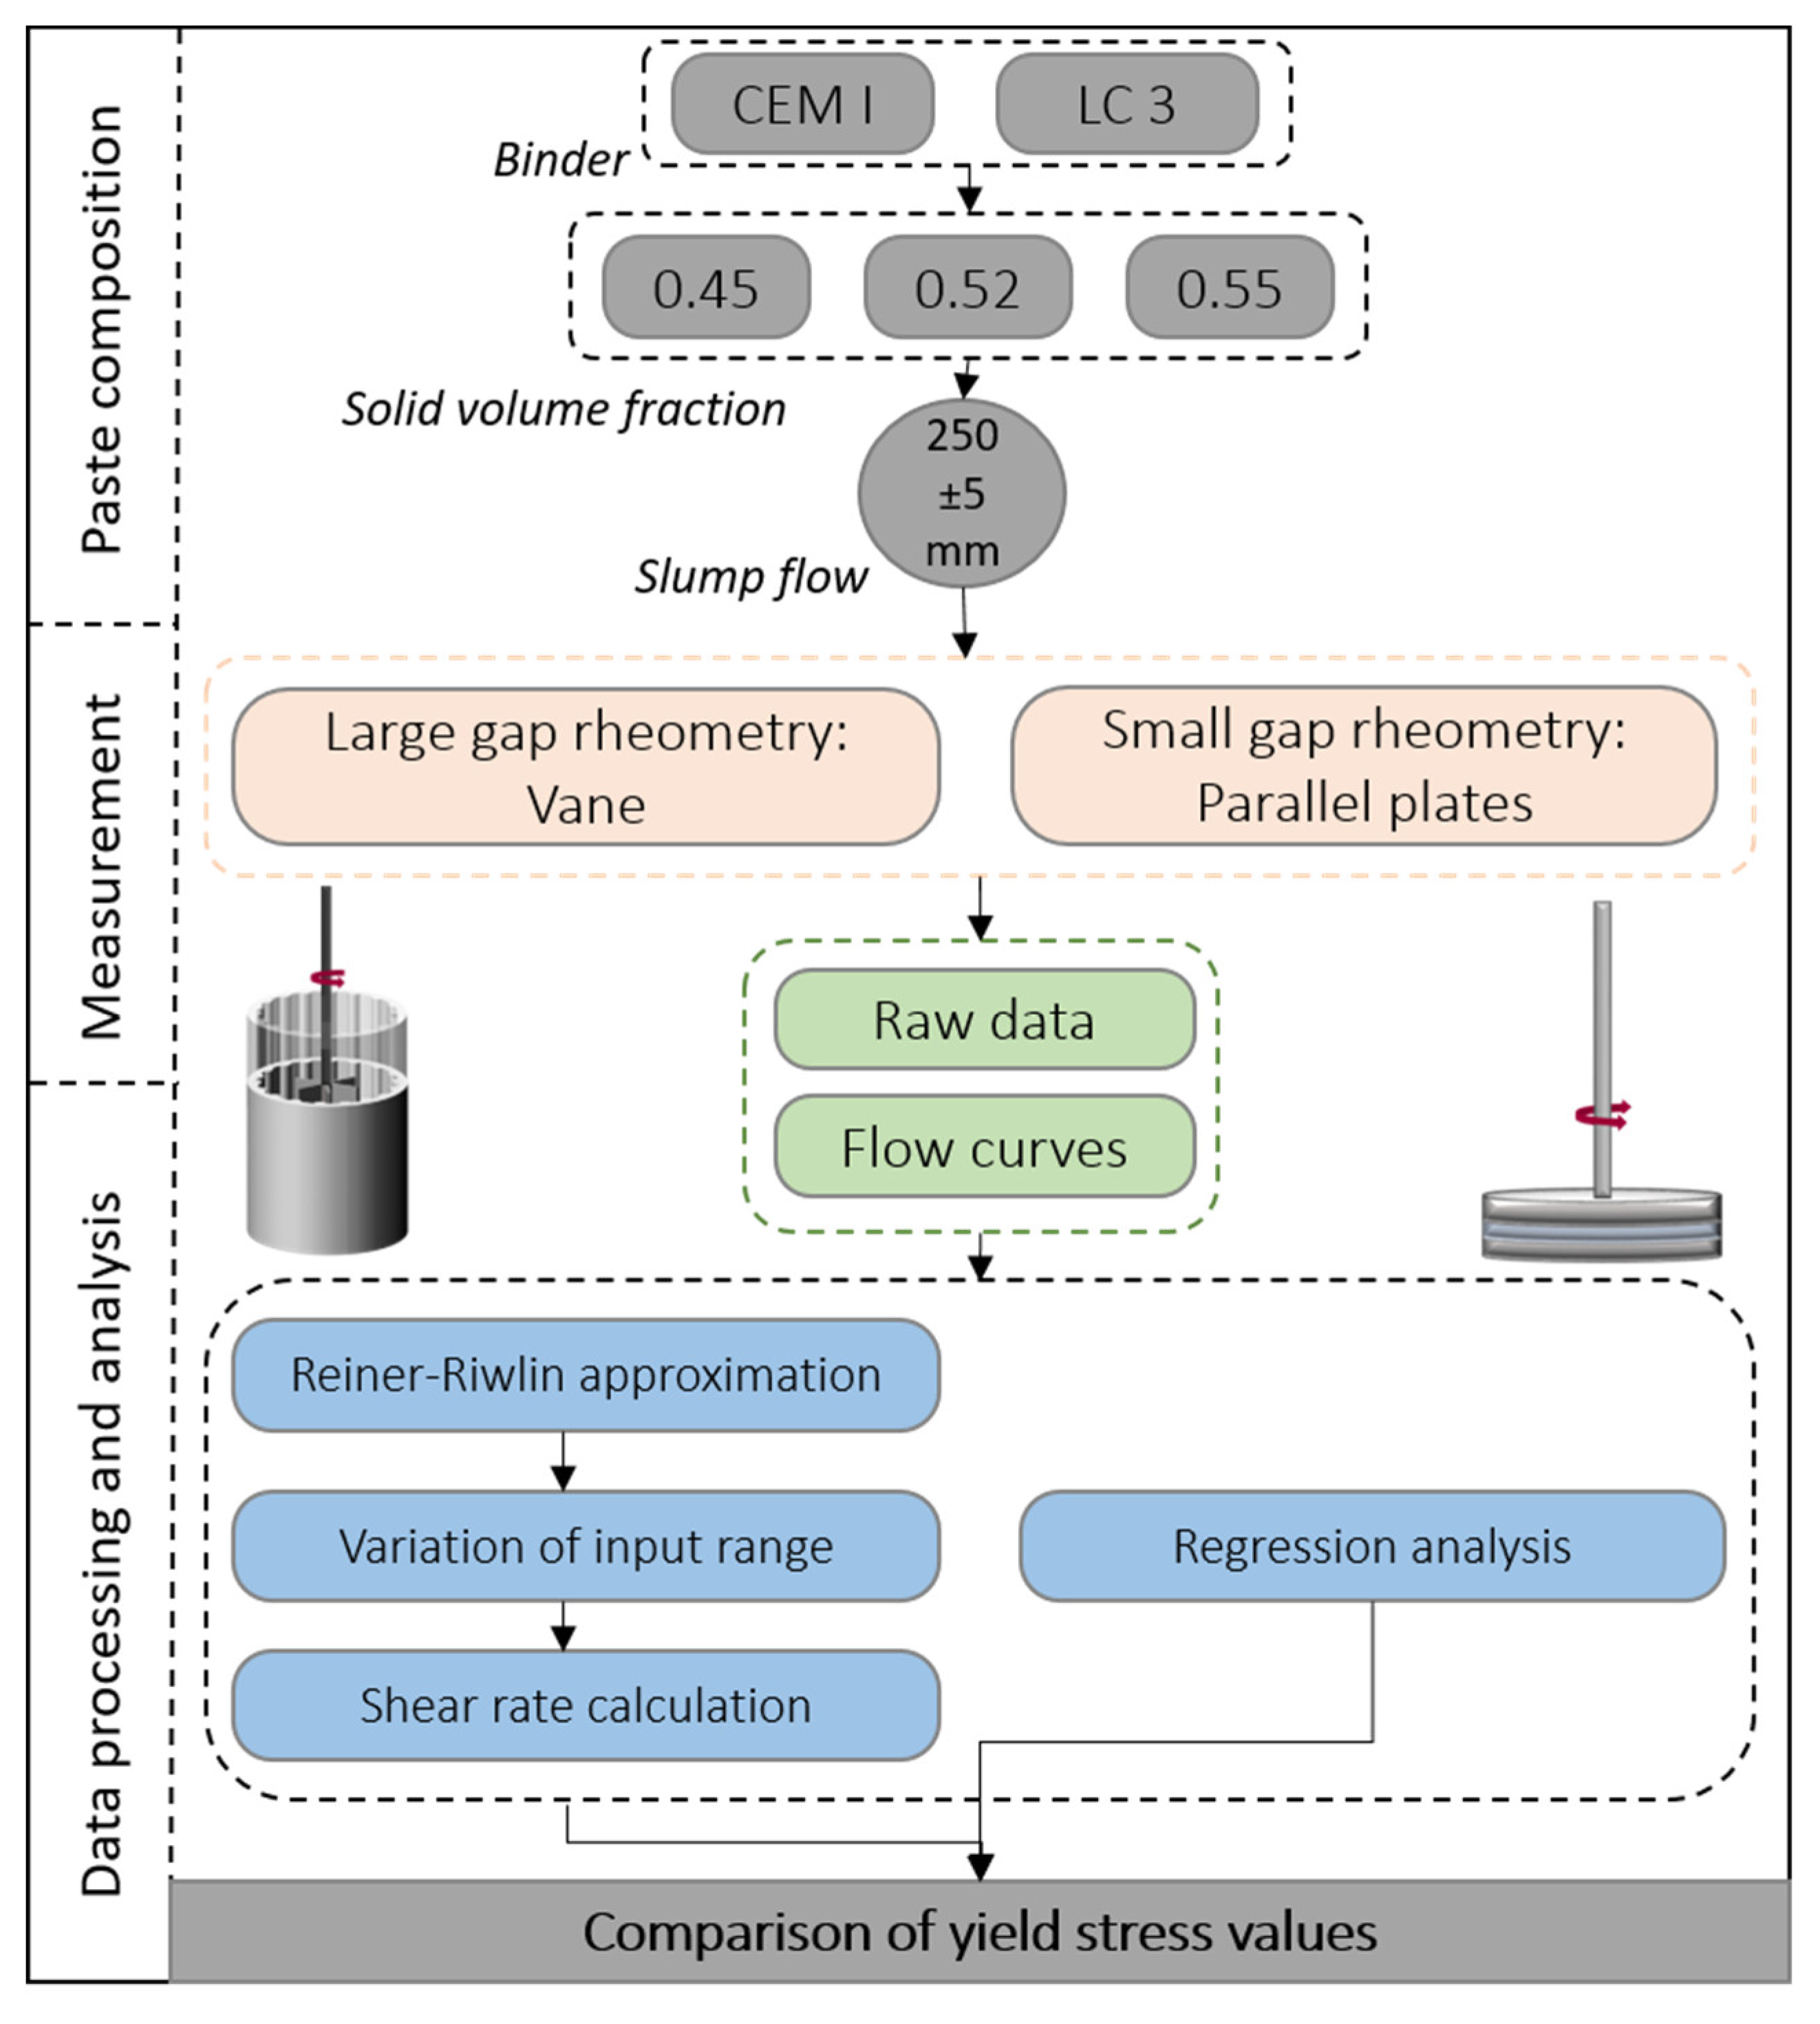
This research analyzes the assessment of rheological properties for cementitious pastes in a large gap rheometric device with the application of the Reiner-Riwlin equation. The schematic concept of investigation is illustrated in Figure 2. Pastes from an Ordinary Portland Cement (OPC) CEM I 42.5 R and a Limestone Calcined Clays Cement (LC3) were prepared with three solid volume fractions Φ s = 0.45, 0.52 and 0.55, while Φ s = V s V s + V W (with V s as volume fraction of the solid and V w as volume fraction of the liquid phase). A Polycarboxylatether-based superplasticizer (PCE) was added to each paste. The dosage of PCE was defined as the required amount to reach a slump flow diameter of 250 ± 5 m m in the mini Hägermann cone acc. DIN EN 12350-8 [13], leading to in comparable yield stress values applying Equation (1). Rheological tests were performed with large gap Vane-in-Cup (ViC) tests and small gap Parallel Plate (PP) tests.
Outgoing from rheometric raw data, flow curves for ViC were calculated through application of Equation (4), but with a variation of the range of input data [ T ; ω ]. The resulting rheological parameters τ 0 and μ were compared to rheological parameters gained from the regression analysis of PP test flow curves. in comparison to the Bingham flow model, the Herschel-Bulkley regression was applied as well:
τ γ ˙ = τ 0 , H B + k   γ ˙ n ,
with τ 0 , H B as Herschel-Bulkley yield stress, k   as consistency index [ ( P a s ) n ] and n as non-Newtonian shear index [ ] .

2.2. Materials

The chemical composition and physical data of the OPC and LC3 are presented in Table 1 and Table 2. More detailed information for the OPC are provided in data in brief in [14] and for the LC3 in [15]. PCE data are published in [16] for the PCE used with the OPC and in [17] for the PCE used with the LC3.
Six cementitious pastes, presented in Table 3, were prepared. PCE was provided with a solid content of 0.3 for PCE (OPC); and of 0.23 for PCE (LC3). The water content within the PCE solution was subtracted from the added water content, but the added percentage by weight of cement (bwoc) provides the information on the fully added PCE liquid. Pastes were mixed with a hand-drilling machine and a four-bladed screw with a mixing energy of 1700 r p m . After 30 s of mixing, the paste was left at rest for 90 s . PCE was added subsequently and the paste was mixed for another 60 s . The paste was again left at rest until 12:30 m i n after water addition and sheared up again for 30 s . Following, the slump flow test and rheometric test were performed in parallel at 15:00 m i n after water addition.

2.3. Methods and Data Handling

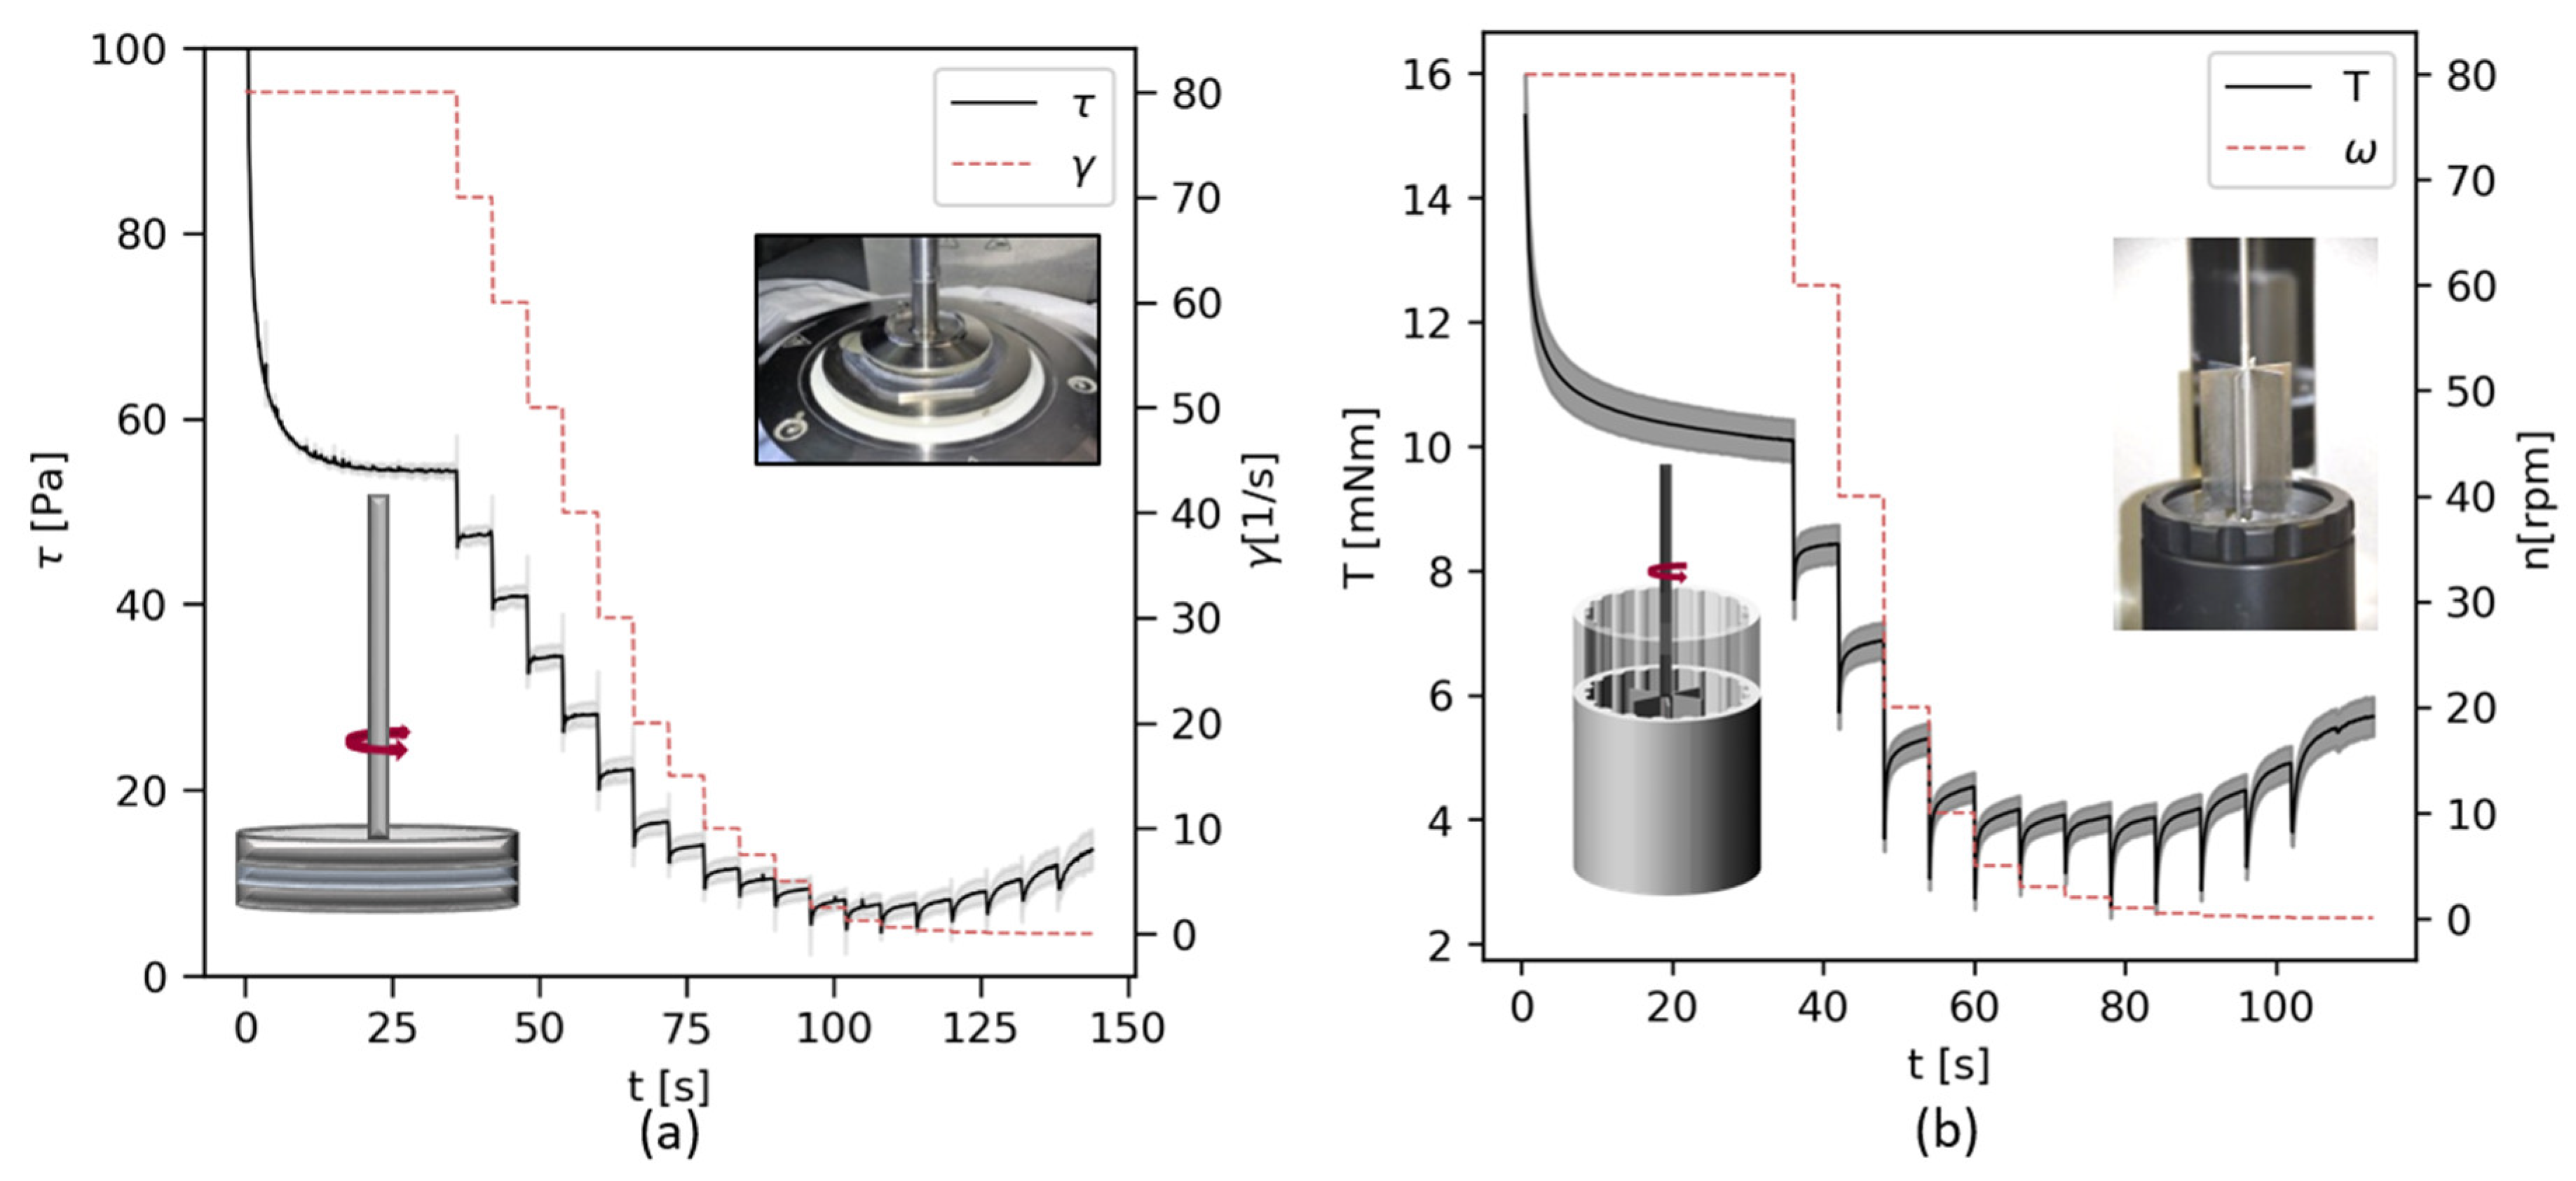
All methods are exemplified on the data for the test series OPC-0.52. The rheometric profiles are presented in Figure 3a for the PP test and (b) for the ViC test. A step-rate-down profile was applied with γ ˙ or n ranging from 80 to 0 s 1 or r p m , with each rate step having a duration of six seconds.
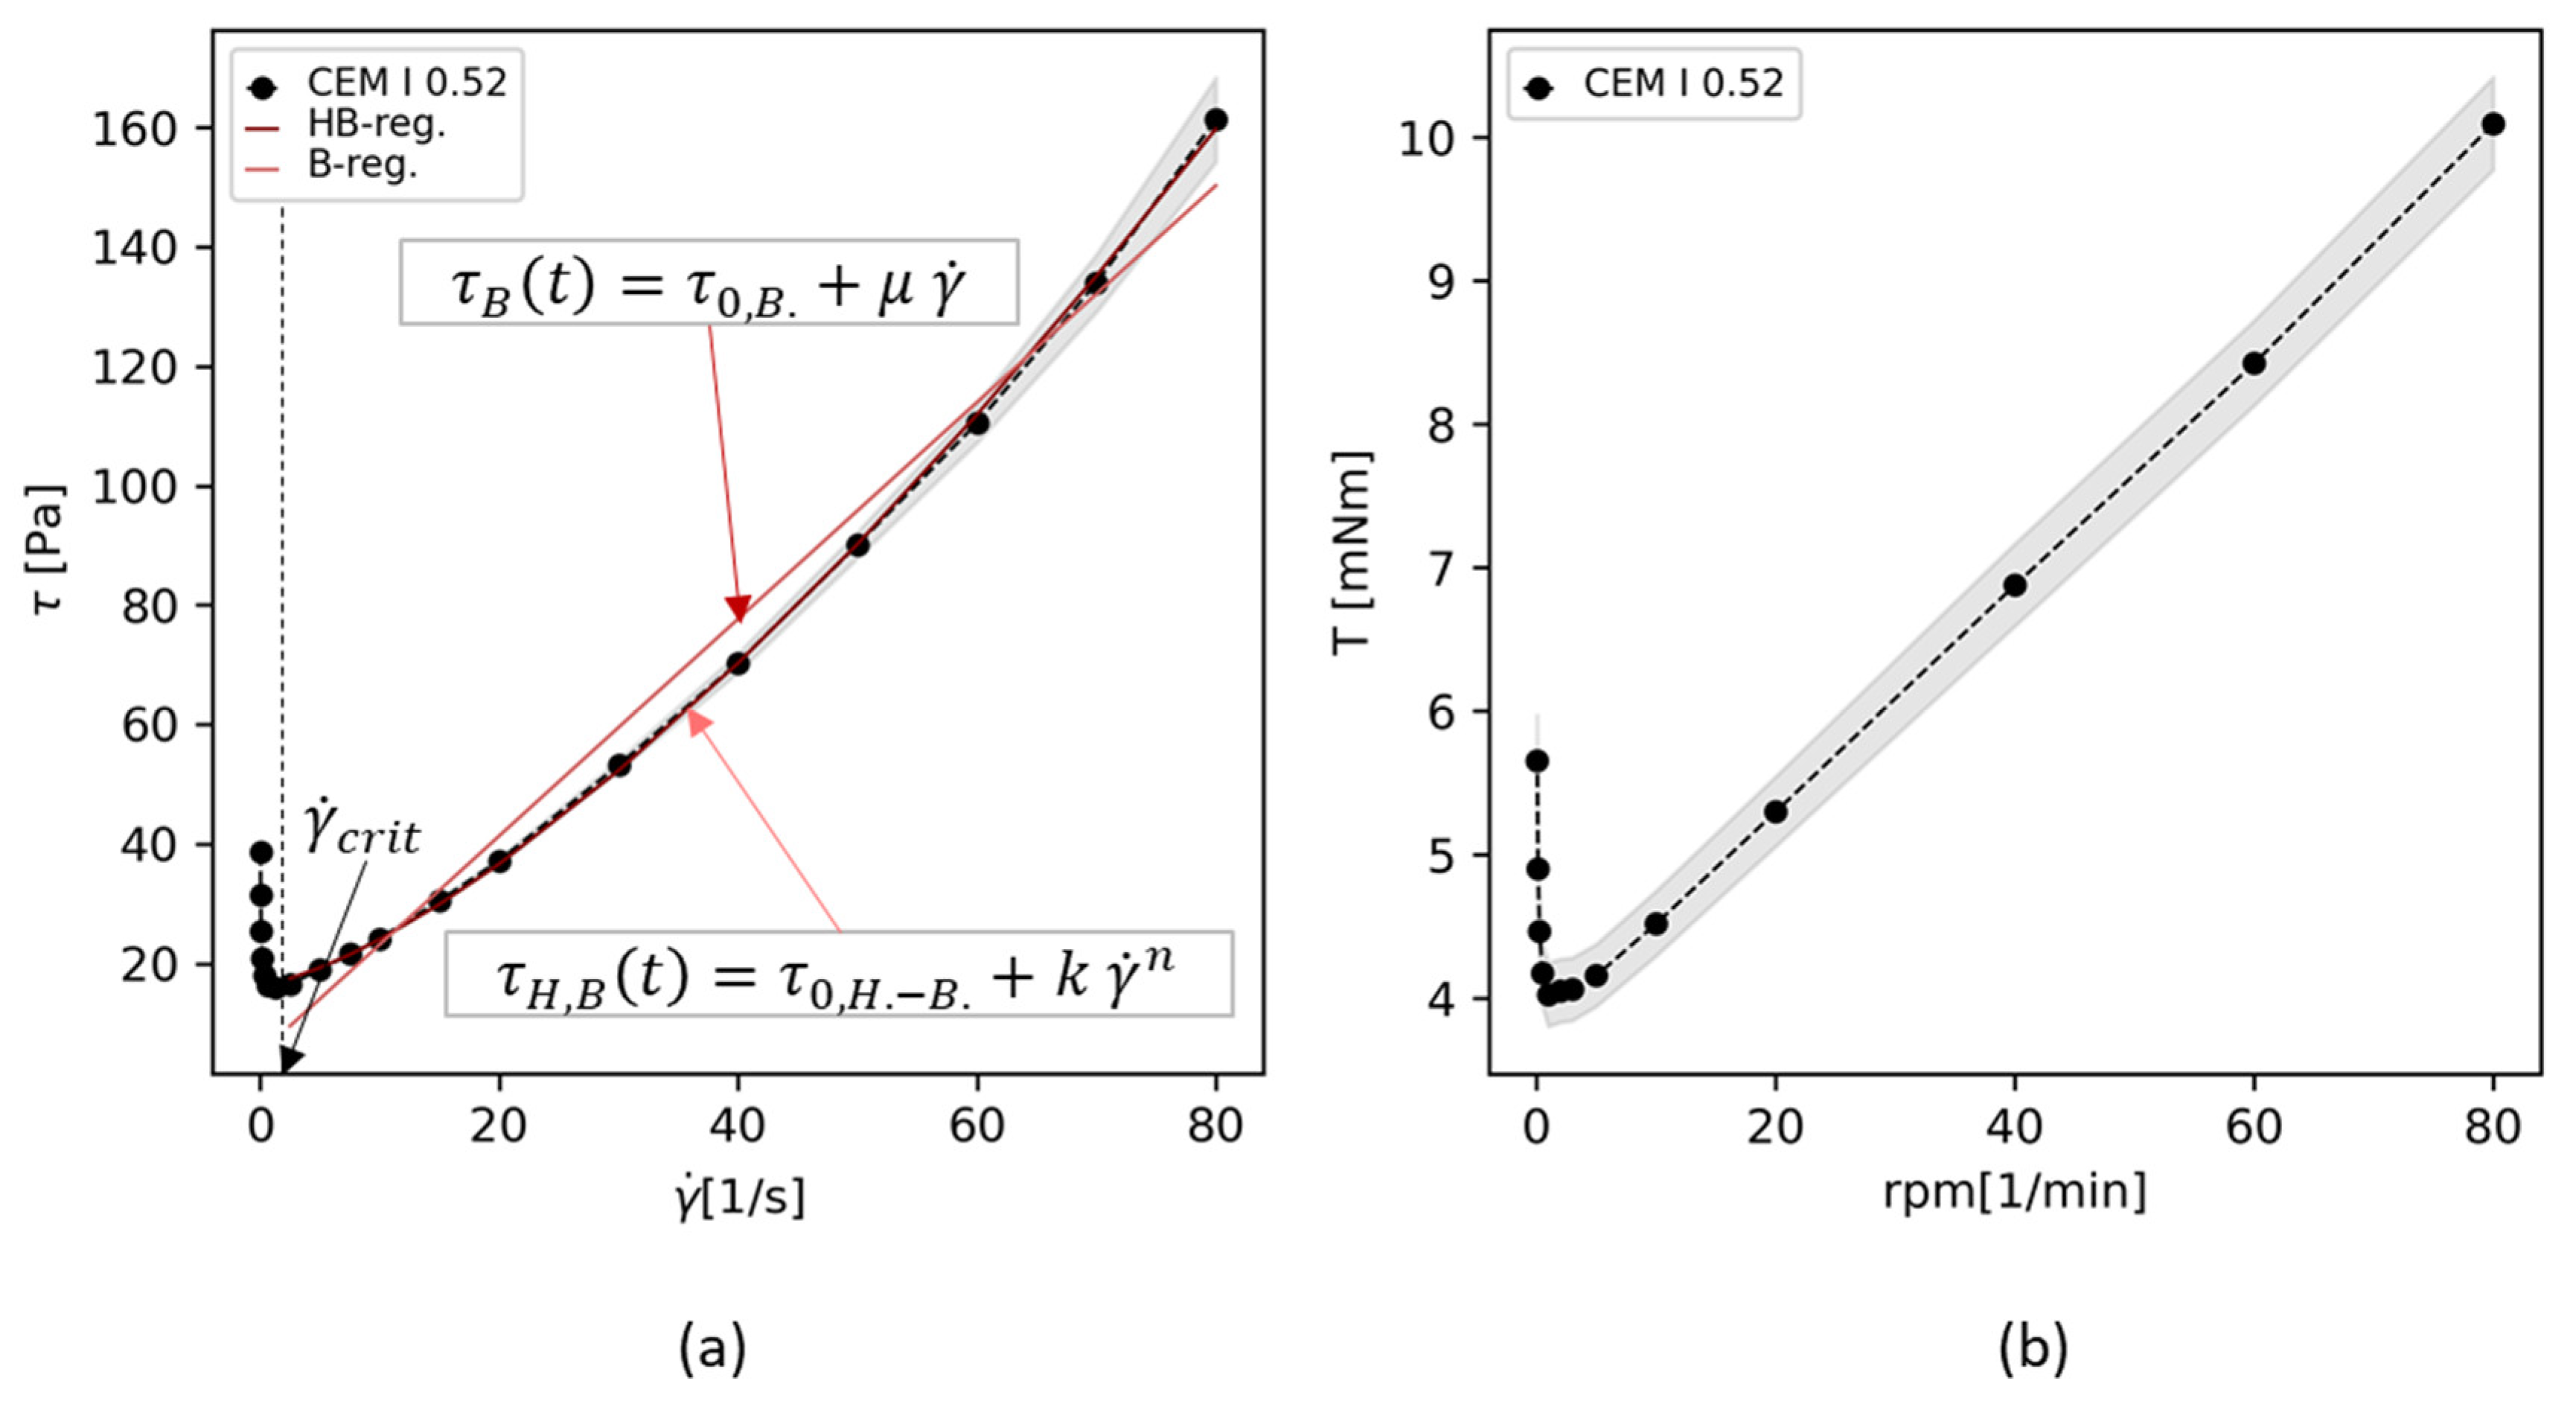
for each γ ˙ or n , the corresponding shear stress τ or torque value T was identified at the equilibrium of the step, and τ γ ˙ or T n flow curves were calculated, see Figure 4. with increasing Φ s and at low rate steps, the torque or stress response increased again below a critical shear rate γ ˙ c r i t or n (see Figure 3a,b at t > 100   s , with resulting data points in Figure 4 below γ ˙ c r i t or n c r i t ). This range with structural buildup was not taken into account for the rheological parameter calculation. for flow curves gained from PP tests, the Bingham and Herschel-Bulkley regression function were applied for the whole range of shear above γ ˙ c r i t with resulting regression curves as illustrated in Figure 4a.
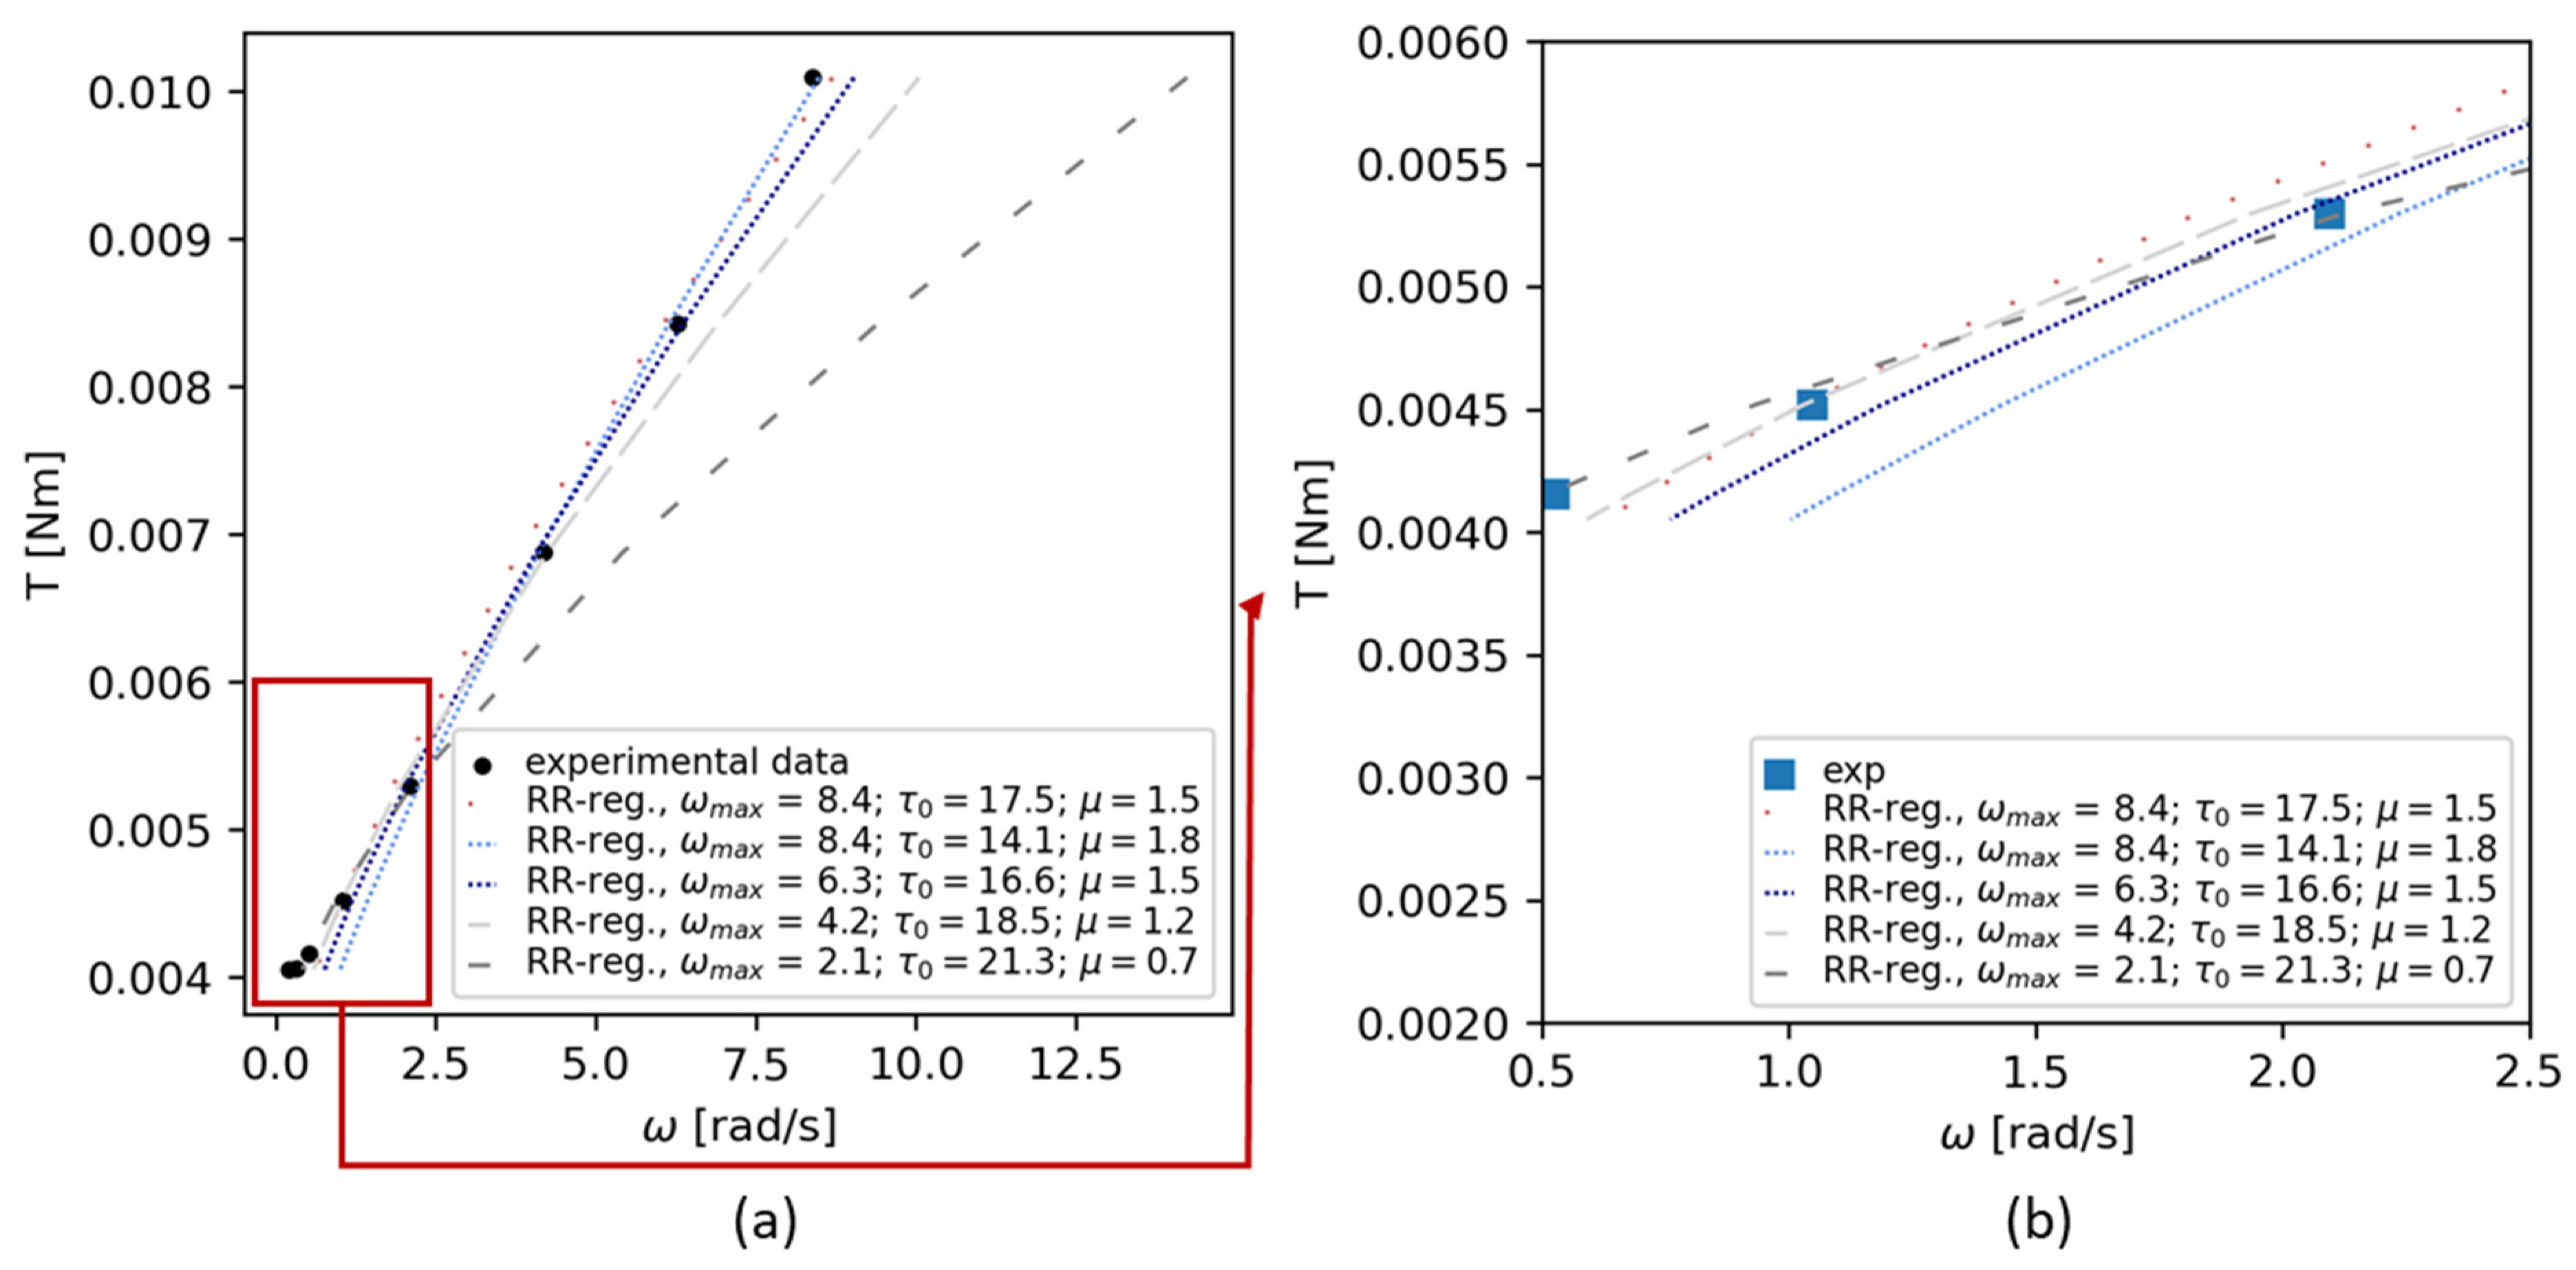
The Reiner-Riwlin equation was applied to ViC flow curve data as presented in Figure 4b. First, ViC raw data T   i n   [ m N m ] and n   i n   [ r p m ] were converted into T   i n   [ N m ] and ω   i n   [ r a d s ] . to each test series, Equation (4) was applied on a varying amount of data points (subsequently called ω steps for RR-iteration”) and varying ω m i n and ω m a x values. The minimum range of data points was 3, the maximum range was the maximum number of available data points above n c r i t .   The procedure is exemplarily illustrated in Figure 5 for OPC-0.52 with four ω  steps for RR-iteration and, thus, 5 possible variations of ω m i n and ω m a x . for each input array [ T ; ω ] , subsequent rheological parameters were calculated with the Reiner-Riwlin equation. Subsequent ω T curves with the pairs of τ 0 , B , V i C and η V i C are illustrated in Figure 5a for the whole ω range, and in Figure 5b for the range of small ω values.
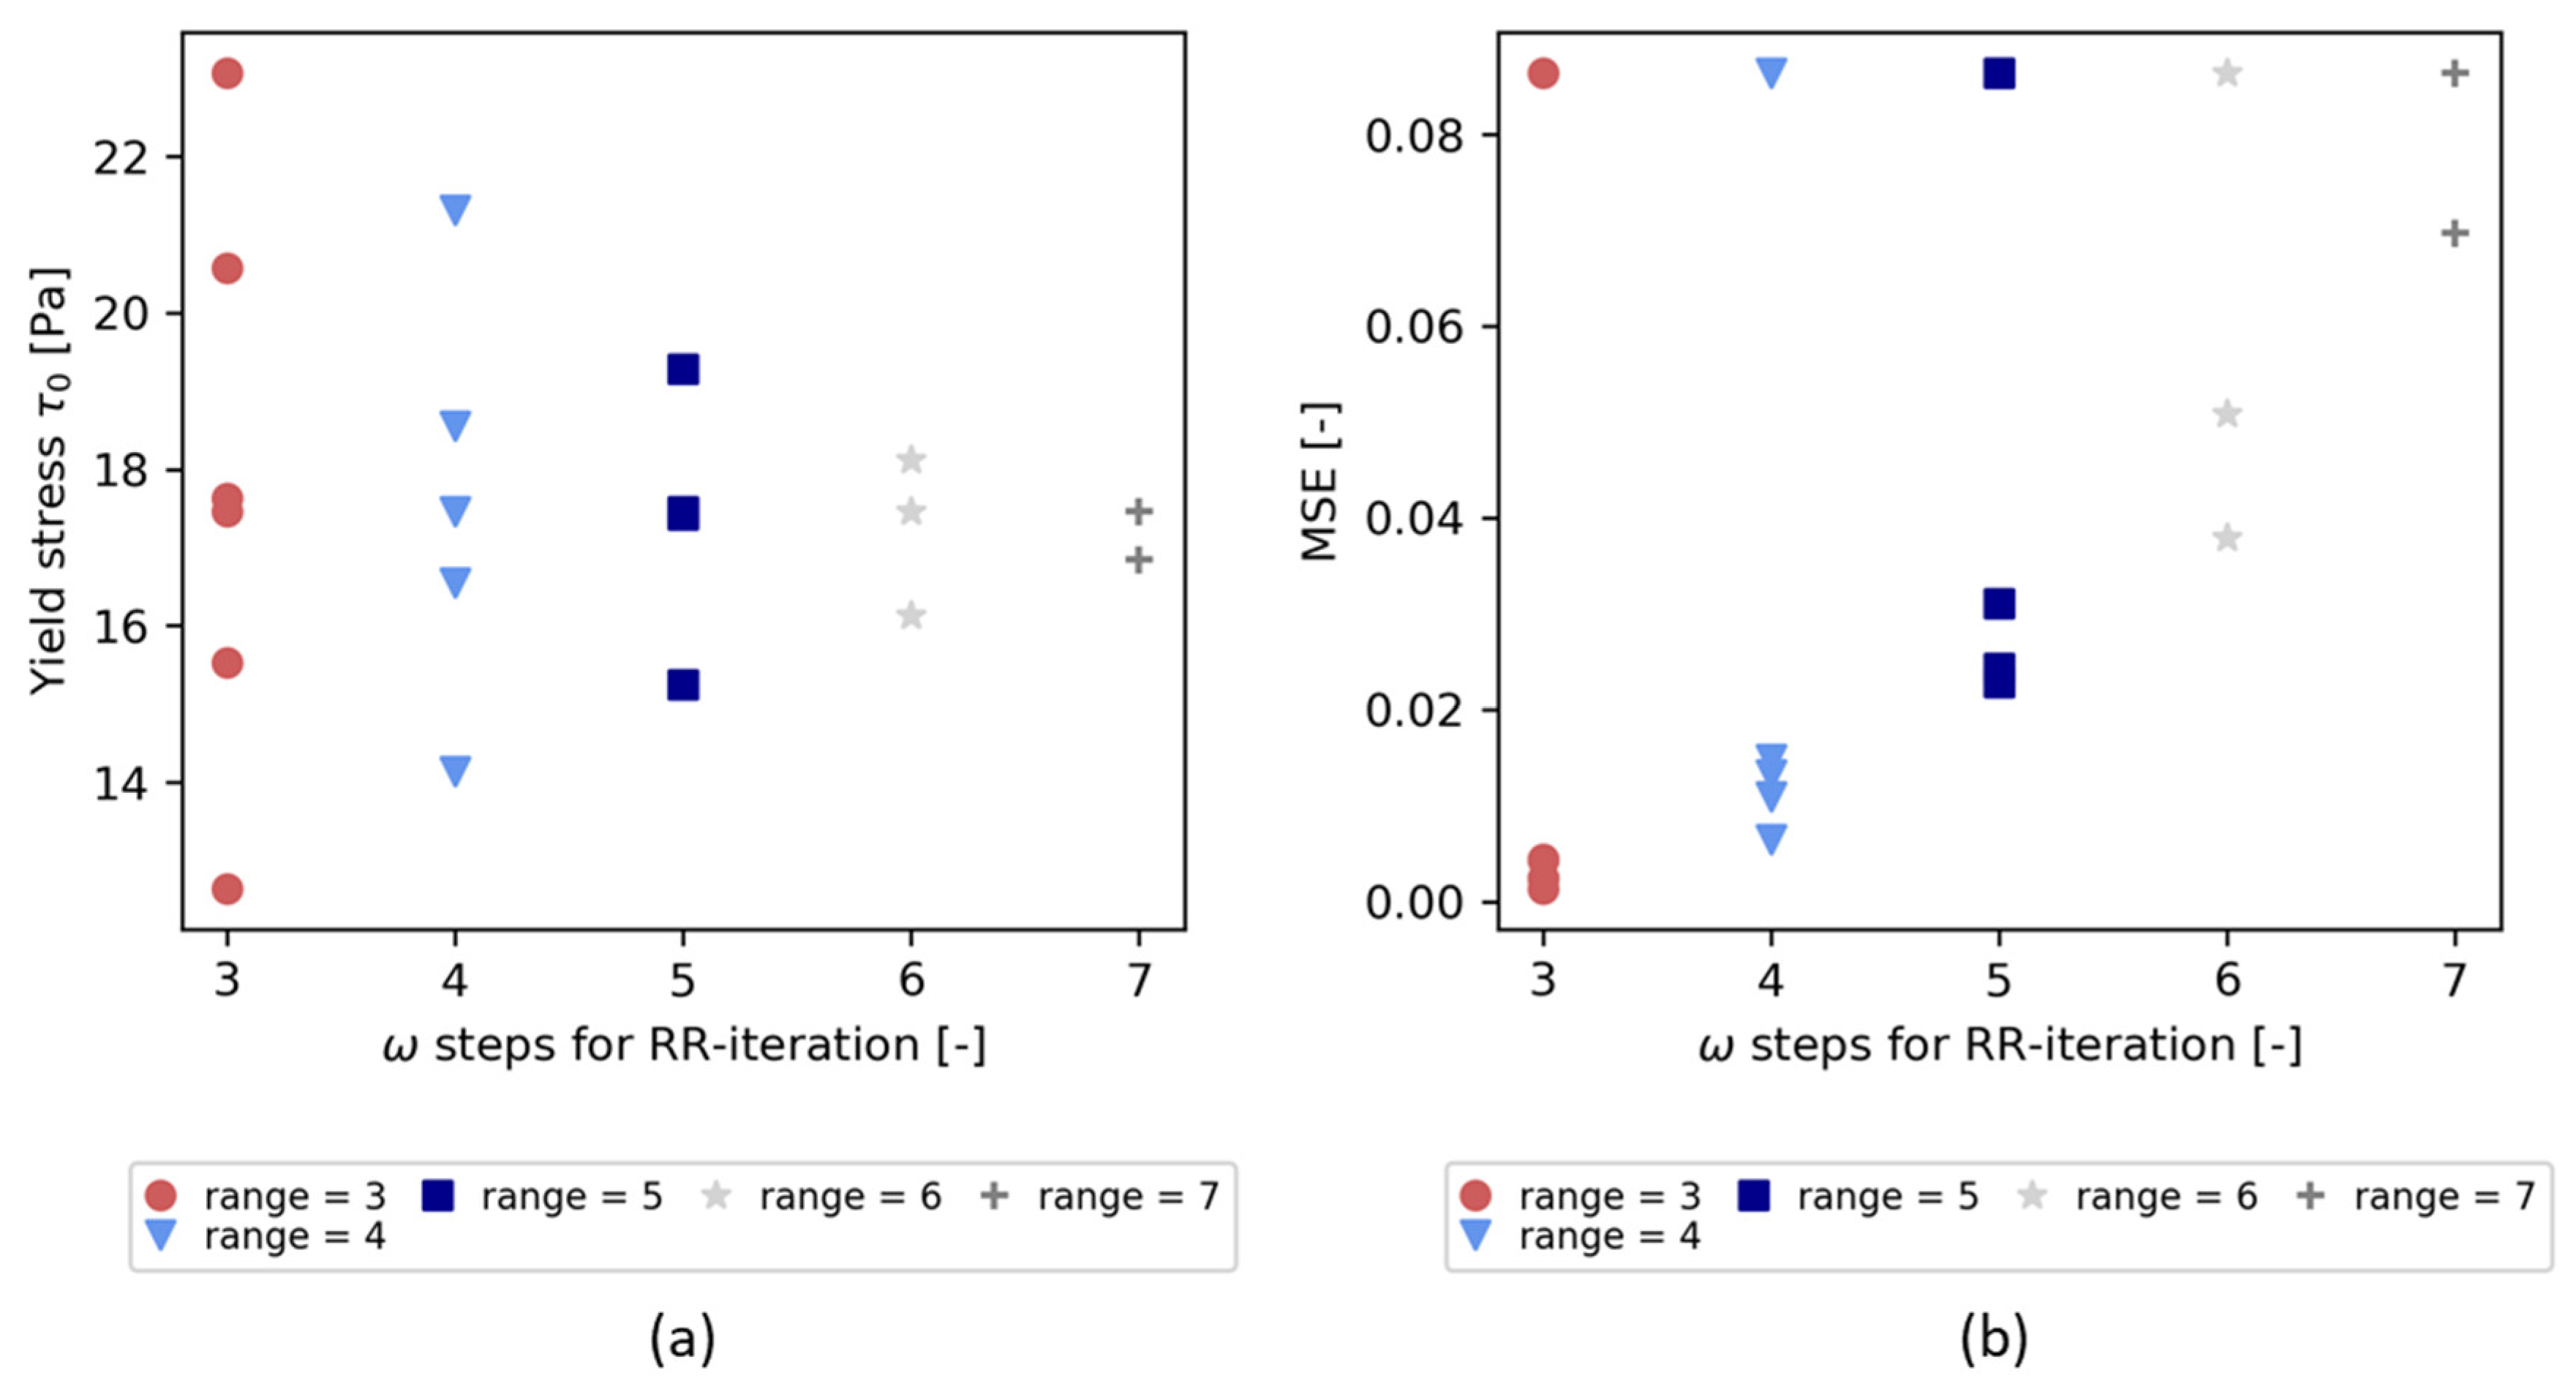
Figure 6a illustrates the resulting yield stress values τ 0 for all possible [ T ; ω ] regressions with corresponding mean squared errors M S E in Figure 6b.
The procedure was repeated for all test series; and final rheological data were compared to analytical yield stress values τ 0 , A , R from the slump flow test and yield stress values τ 0 , B and τ 0 , H B from PP tests and regression curve analysis.

3. Results

3.1. Flow Curves

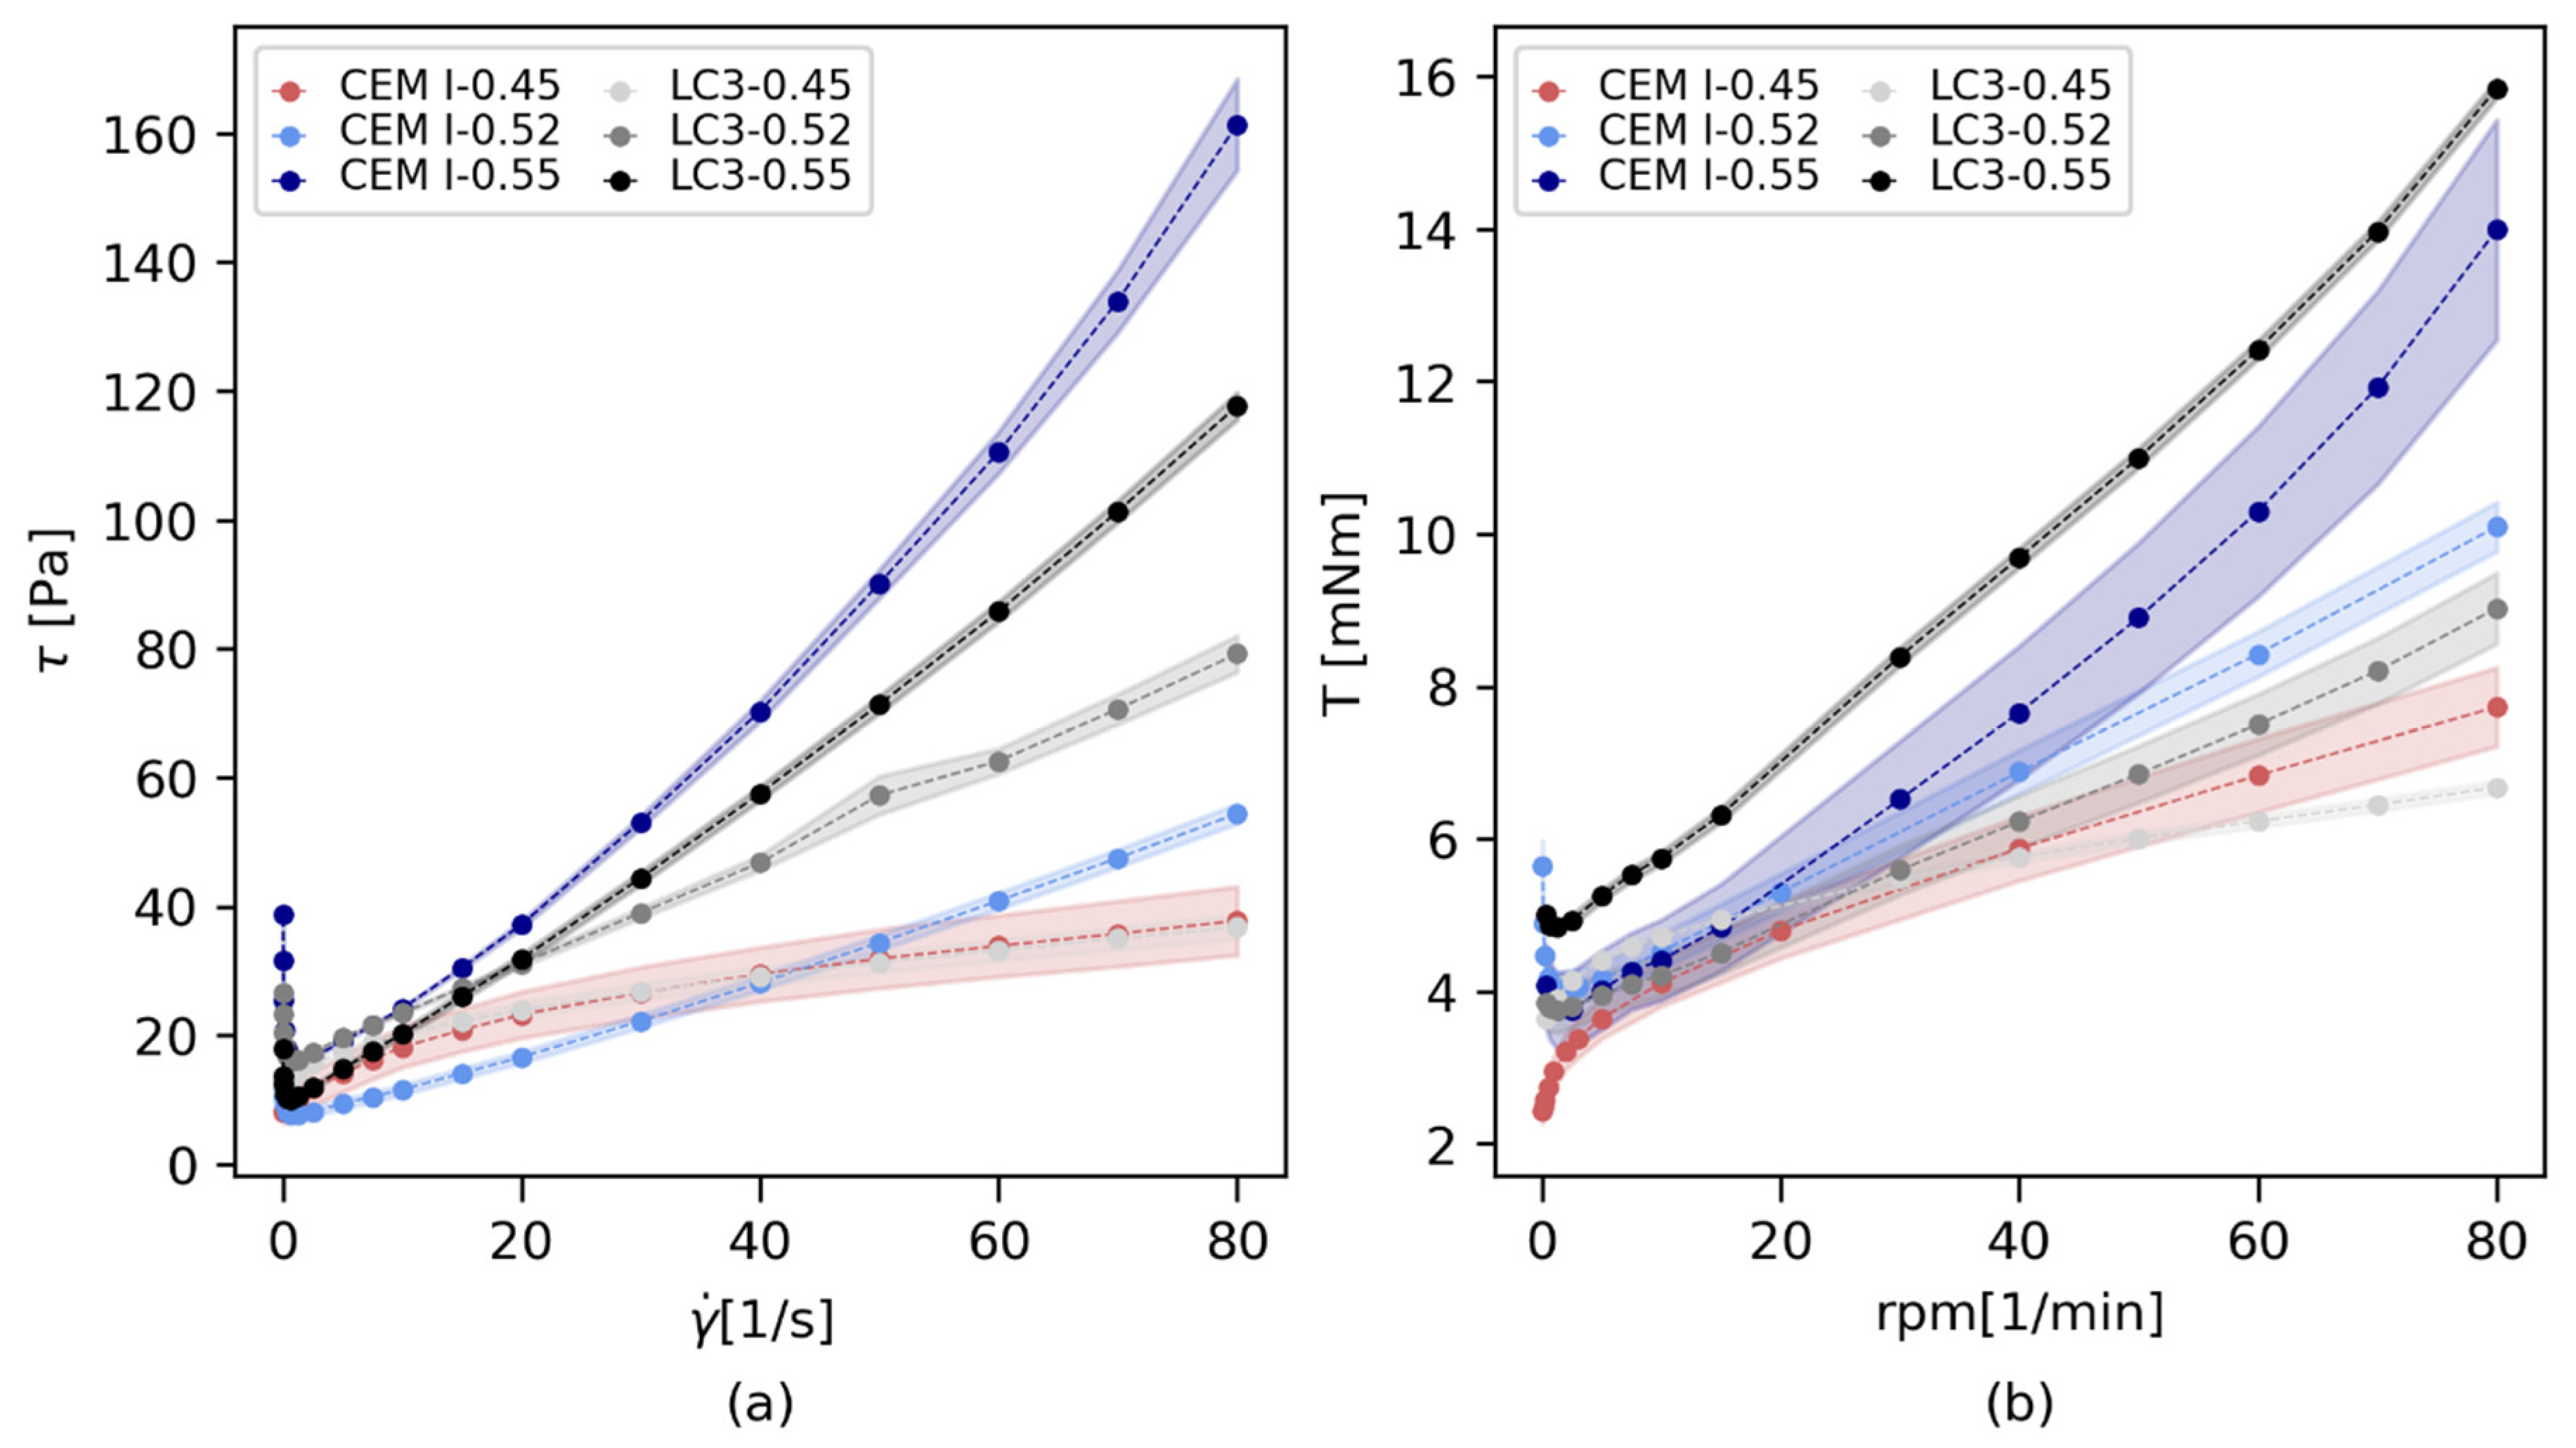
Flow curves for all test series are presented in Figure 7. Each rheometric test was examined three times; the flow curves present their average with the standard deviation in shaded color. Figure 7a depicts the PP flow curves; Figure 7b shows the ViC tests. Results for the rheological parameter regression with the Bingham equation and Herschel-Bulkley equation are provided in Table 4. with increasing Φ s , the rheological behavior of both OPC- and LC3-mixtures changed from shear-thinning to shear-thickening behavior.

3.2. Rheological Parameter Comparison

Table 5 assembles all yield stress values for all test series gained through different measurement techniques. Column 1-4 present the measured (mean) slump flow diameters d S F with corresponding analytical yield stresses τ 0 , A , R calculated through Equation (1). The last three columns provide (1) τ 0 , B , f u l l by application of Equation (4) onto the whole range of [ T ; ω ] above n c r i t in the ViC test, (2) τ 0 , B , f u l l as result from the Bingham regression and (3) τ 0 , H B , f u l l as result from the Herschel-Bulkley regression onto PP test results, both on PP test results for [ τ ;   γ ˙ ] above γ ˙ c r i t . Results show that, despite most accurate laboratory work and defined mixture composition and setup, the macroscopic flowability of the test series slightly deviates with measured slump flow diameters between 245 mm and 257 mm, and thus slightly different τ 0 , A , R . A normalization of experimental data, however, was not conducted.
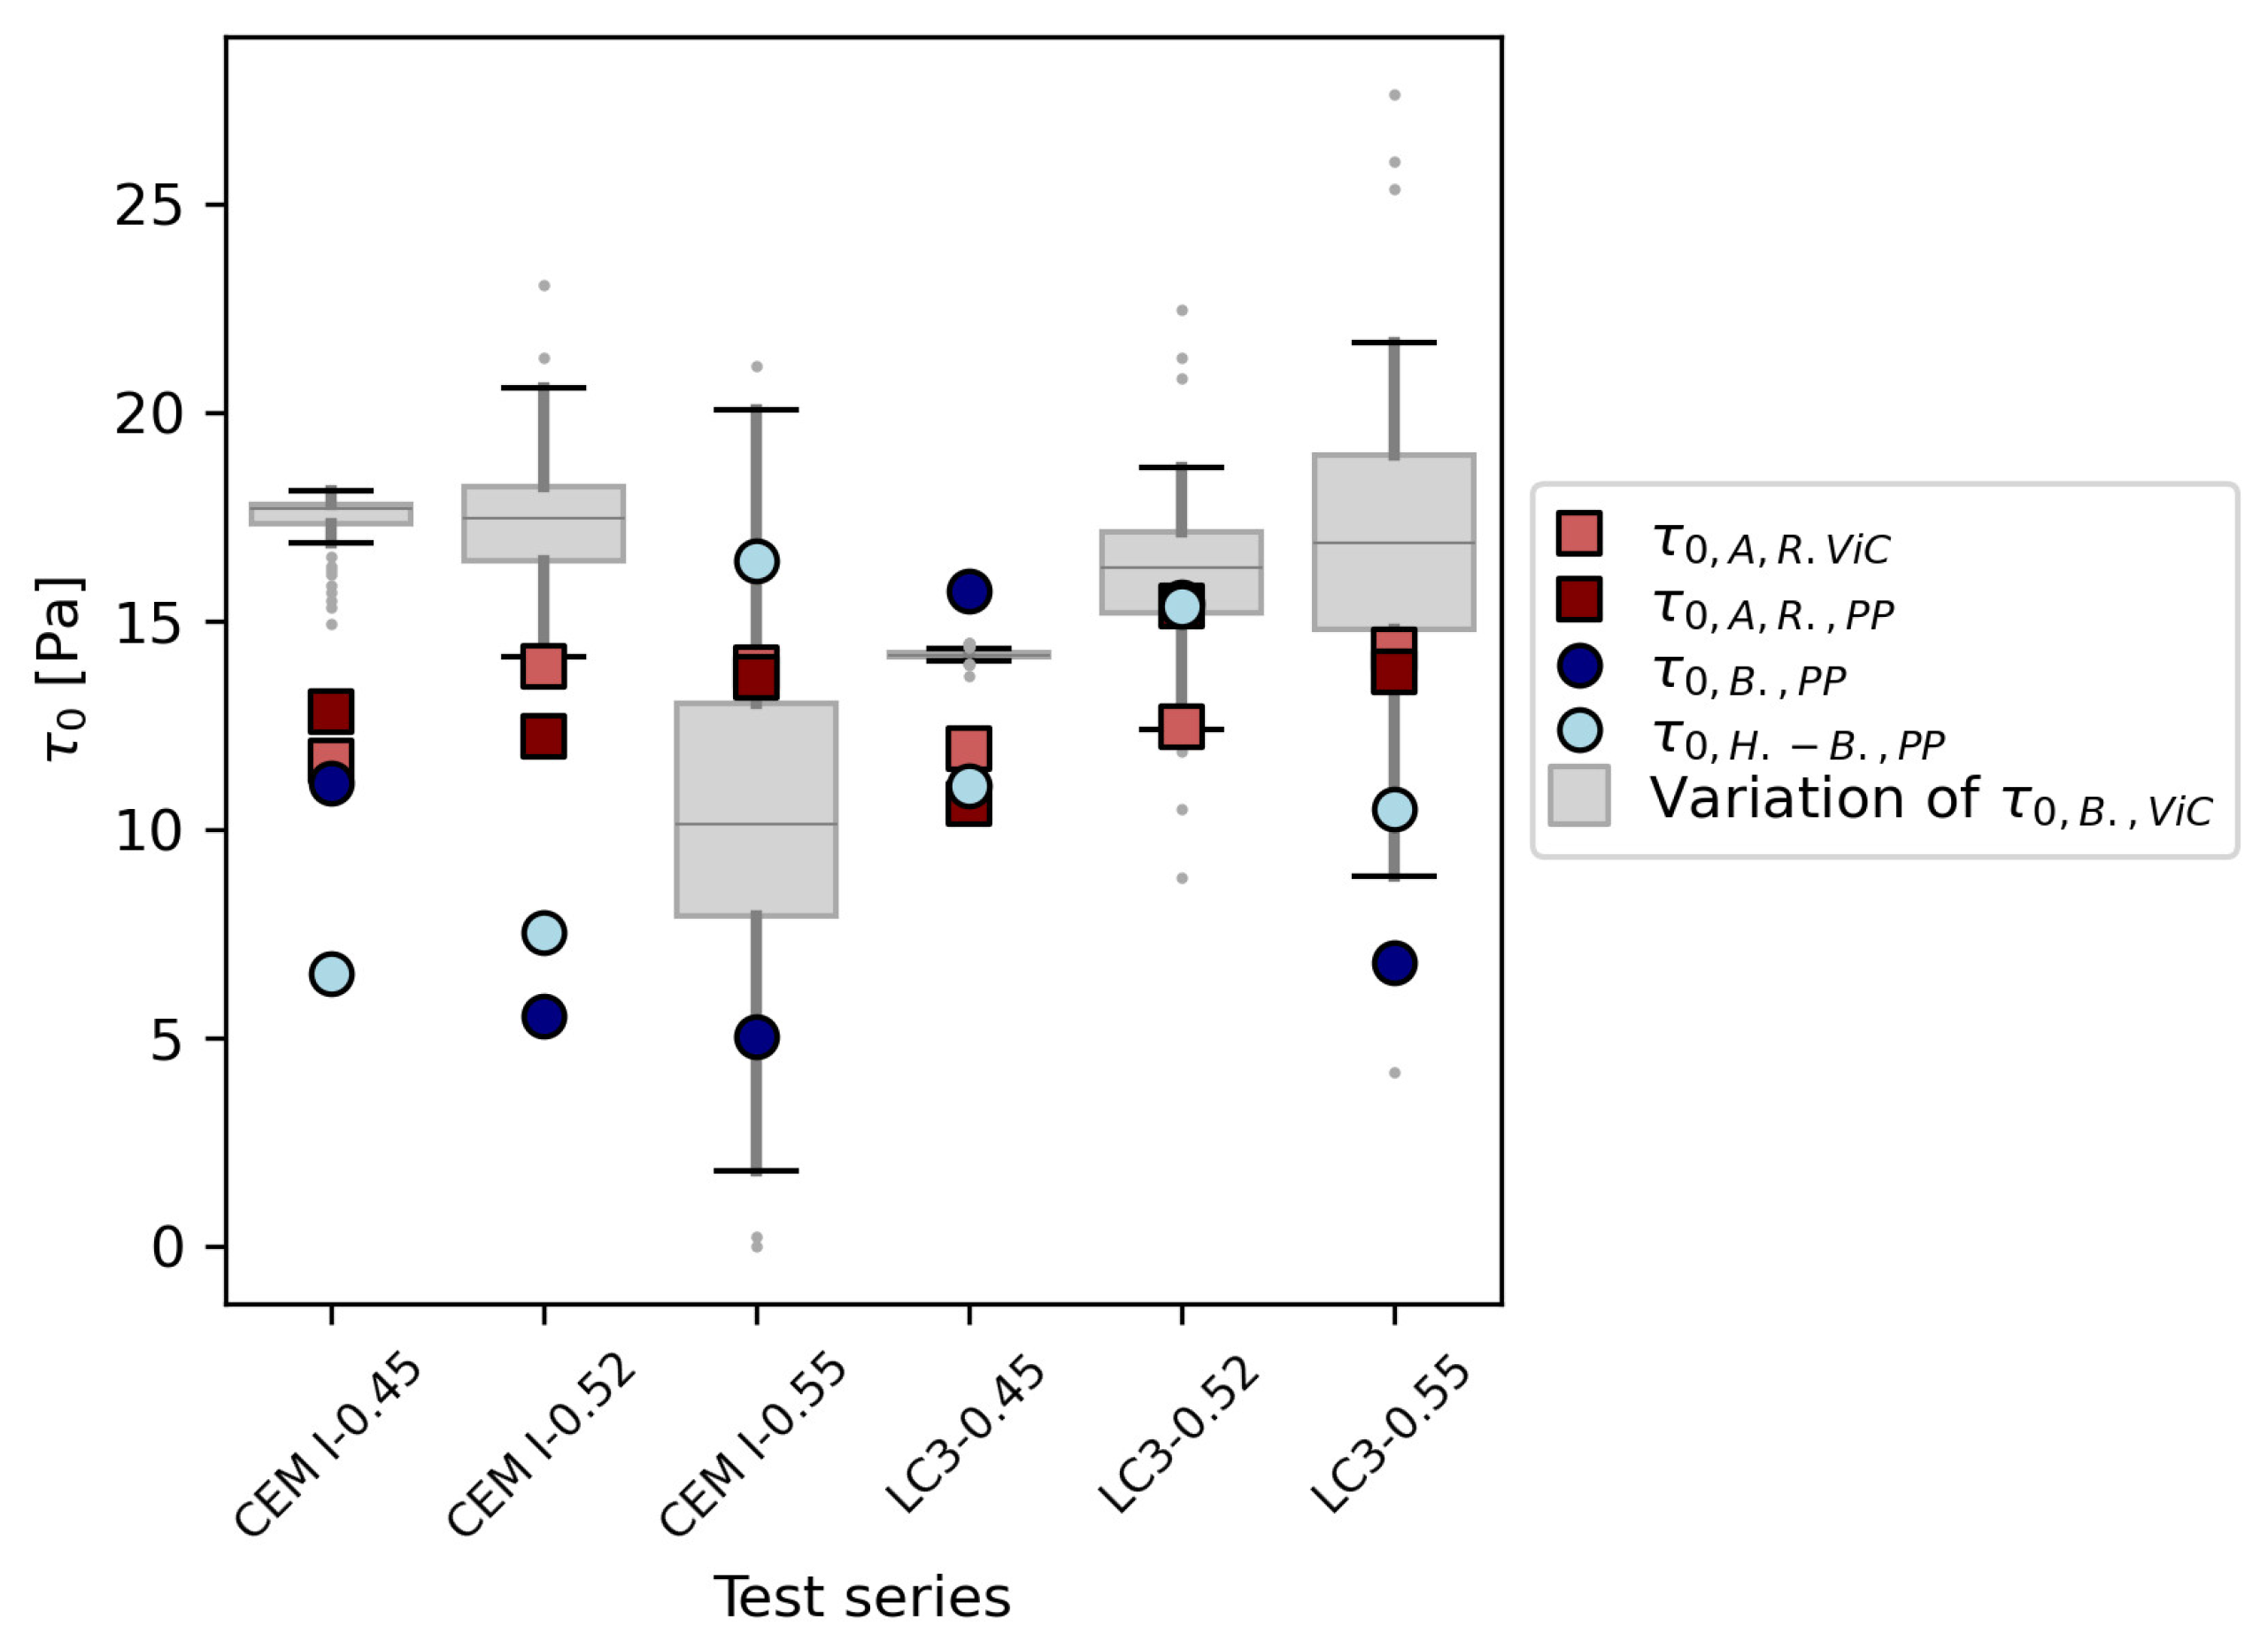
Figure 8 presents the differently calculated yield stress values. τ 0 , A , R   values from the slump flow test range between 10.62 and 15.35 for the different test series. with increasing ϕ s , Bingham yield stress results τ 0 , B show increasing deviations. The grey scaled boxes illustrate the variation of τ 0 , B , V i C depending on the parameter range [ T ; ω ] used for the Reiner-Riwlin calculation of τ 0 and μ , as previously introduced in Figure 6a. The box illustration reveals that with increasing solid volume fraction ϕ s , the variation of τ 0 , B , V i C values (depending on ω steps for RR-iteration and apparent ω m i n and ω m a x – values) increases. Deviations are more pronounced for all OPC test series than for the LC3 test series.

4. Discussion and Outlook

Table 5 and Figure 8 reveal the strong dependency of the calculated yield stress on the chosen rheometric device, regression method and input data for the Reiner-Riwlin equation in a large gap rheometer. Table 4 provides information on the non-linear viscosity: with increasing non-Newtonian index n , the choice of raw data handling and rheological parameter calculation becomes crucial. Since the Reiner-Riwlin equation calculates a linear, plastic viscosity μ and a Bingham yield stress τ 0 , B , its application with increasing n becomes questionable. The choice of ω m i n and ω m a x can under- or overestimate the “real” yield stress. for prospective applications, the rheological analysis of strongly non-Newtonian cementitious pastes evaluated with large gap rheometry should either clearly take the range of ω m i n and ω m a x (e.g., if only the material properties at high velocities are of interest) into account, or introduce extended raw data conversion formulations, which consider the non-linear material behavior.

Acknowledgments

The authors acknowledge the support of the interdisciplinary group and experts in the field of rheology within the priority program DFG SPP 2005. The authors would like to thank Maik Hobusch (M.H.) and Rundi Zhang (R.Z.) for the laboratory support. The authors acknowledge Master Builders Solutions GmbH for the supply of admixtures and HeidelbergCement AG for the supply of binder.

References

  1. Roussel, N.; Stefani, C.; Leroy, R.: From Mini-Cone Test to Abrams Cone Test: Measurement of Cement-Based Materials Yield Stress Using Slump Tests. In: Cemcon 35 (2005), Nr. 5, S. 817–822. [CrossRef]
  2. Mezger, Thomas: Das Rheologie Handbuch: Für Anwender Von Rotations- Und Oszillations-Rheometern. 5., Vollständig Überarbeitete Auflage: Hannover: Vincentz, 2016.
  3. Thiedeitz, Mareike; Kränkel, Thomas; Gehlen, Christoph: Viscoelastoplastic Classification of Cementitious Suspensions: Transient and Non-Linear Flow Analysis in Rotational and Oscillatory Shear Flows. In: Rheologica Acta 61 (2022), 8-9, S. 549–570. [CrossRef]
  4. Haist, Michael; Link, Julian; Et Alr: Interlaboratory Study on Rheological Properties of Cement Pastes and Reference Substances: Comparability of Measurements Performed with Different Rheometers and Measurement Geometries. In: Materials and Structures 53 (2020), Nr. 4. [CrossRef]
  5. Reiner, Markus; Eyring, Henry: Deformation and Flow. An Elementary Introduction to Theoretical Rheology. In: Physics Today 3 (1950), Nr. 4, S. 35–36. [CrossRef]
  6. Krieger, Irvin M.; Elrod, Harold: Direct Determination of The Flow Curves of Non-Newtonian Fluids. Ii. Shearing Rate in The Concentric Cylinder Viscometer. In: Jour. of Appl. Physics 24 (1953), Nr. 2, S. 134–136. [CrossRef]
  7. Krieger, Irvin M.: Shear Rate in Couette Viscometer. In: Trans. Soc. of Rheology 12 (1968), Nr. 1, S. 5–11. [CrossRef]
  8. Wallevik, Olafur H.; Feys, Dimitri; Et Al: Avoiding Inaccurate Interpretations of Rheological Measurements for Cement-Based Materials. In: Cement and Concrete Research 78 (2015), S. 100–109. [CrossRef]
  9. Baravian, C.; Lalante, A.; Parker, A.: Vane Rheometry with A Large, Finite Gap. 2015. [CrossRef]
  10. Nguyen, Q. Dzuy; Boger, D. V.: Direct Yield Stress Measurement with The Vane Method. In: Journal of Rheology 29 (1985), Nr. 3, S. 335–347. [CrossRef]
  11. Haist, Michael: Zur Rheologie Und Den Physikalischen Wechselwirkungen Bei Zementsuspensionen. Karlsruhe, Universität Karlsruhe (Th), Institut Für Massivbau Und Baustofftechnologie. Dissertation. 2009.
  12. Feys, Dimitri; Wallevik, Jon E.; Yahia, Ammar; Khayat, Kamal H.; Wallevik, Olafur H.: Extension of The Reiner–Riwlin Equation to Determine Modified Bingham Parameters Measured in Coaxial Cylinders Rheometers. In: Materials and Structures 46 (2013), 1-2, S. 289–311. [CrossRef]
  13. Din En 12350-8:2019-09, Prüfung Von Frischbeton_- Teil_8: Selbstverdichtender Beton_- Setzfließversuch; Deutsche Fassung En_12350-8:2019.
  14. Lu, Z. C.; Haist, M.; Ivanov, D.; Et Al: Characterization Data of Reference Cement Cem I 42.5 R Used for Priority Program Dfg Spp 2005 "Opus Fluidum Futurum - Rheology of Reactive, Multiscale, Multiphase Construction Materials". In: Data in Brief 27 (2019). [CrossRef]
  15. Pott, U.; Crasselt, C.; Et Al.: Characterization Data of Reference Materials Used for Phase Ii of The Priority Program Dfg Spp 2005 "Opus Fluidum Futurum - Rheology of Reactive, Multiscale, Multiphase Construction Materials". In: Data in Brief 47 (2023), S. 108902. [CrossRef]
  16. Lei, L.; Chomyn, C.; Schmid, M.; Plank, J.: Characterization Data of Reference Industrial Polycarboxylate Superplasticizers Used within Priority Program Dfg Spp 2005 "Opus Fluidum Futurum - Rheology of Reactive, Multiscale, Multiphase Construction Materials". In: Data in Brief 31 (2020), S. 106026. [CrossRef]
  17. Zhang, Lin; Li, Ran; Lei, Lei; Plank, Johann: Characterization Data of Reference Industrial Polycarboxylate Superplasticizer Vp 2020/15.2 Used for Priority Program Dfg Spp 2005 "Opus Fluidum Futurum ". In: Data in Brief 39 (2021),Pp S. 107657. [CrossRef]
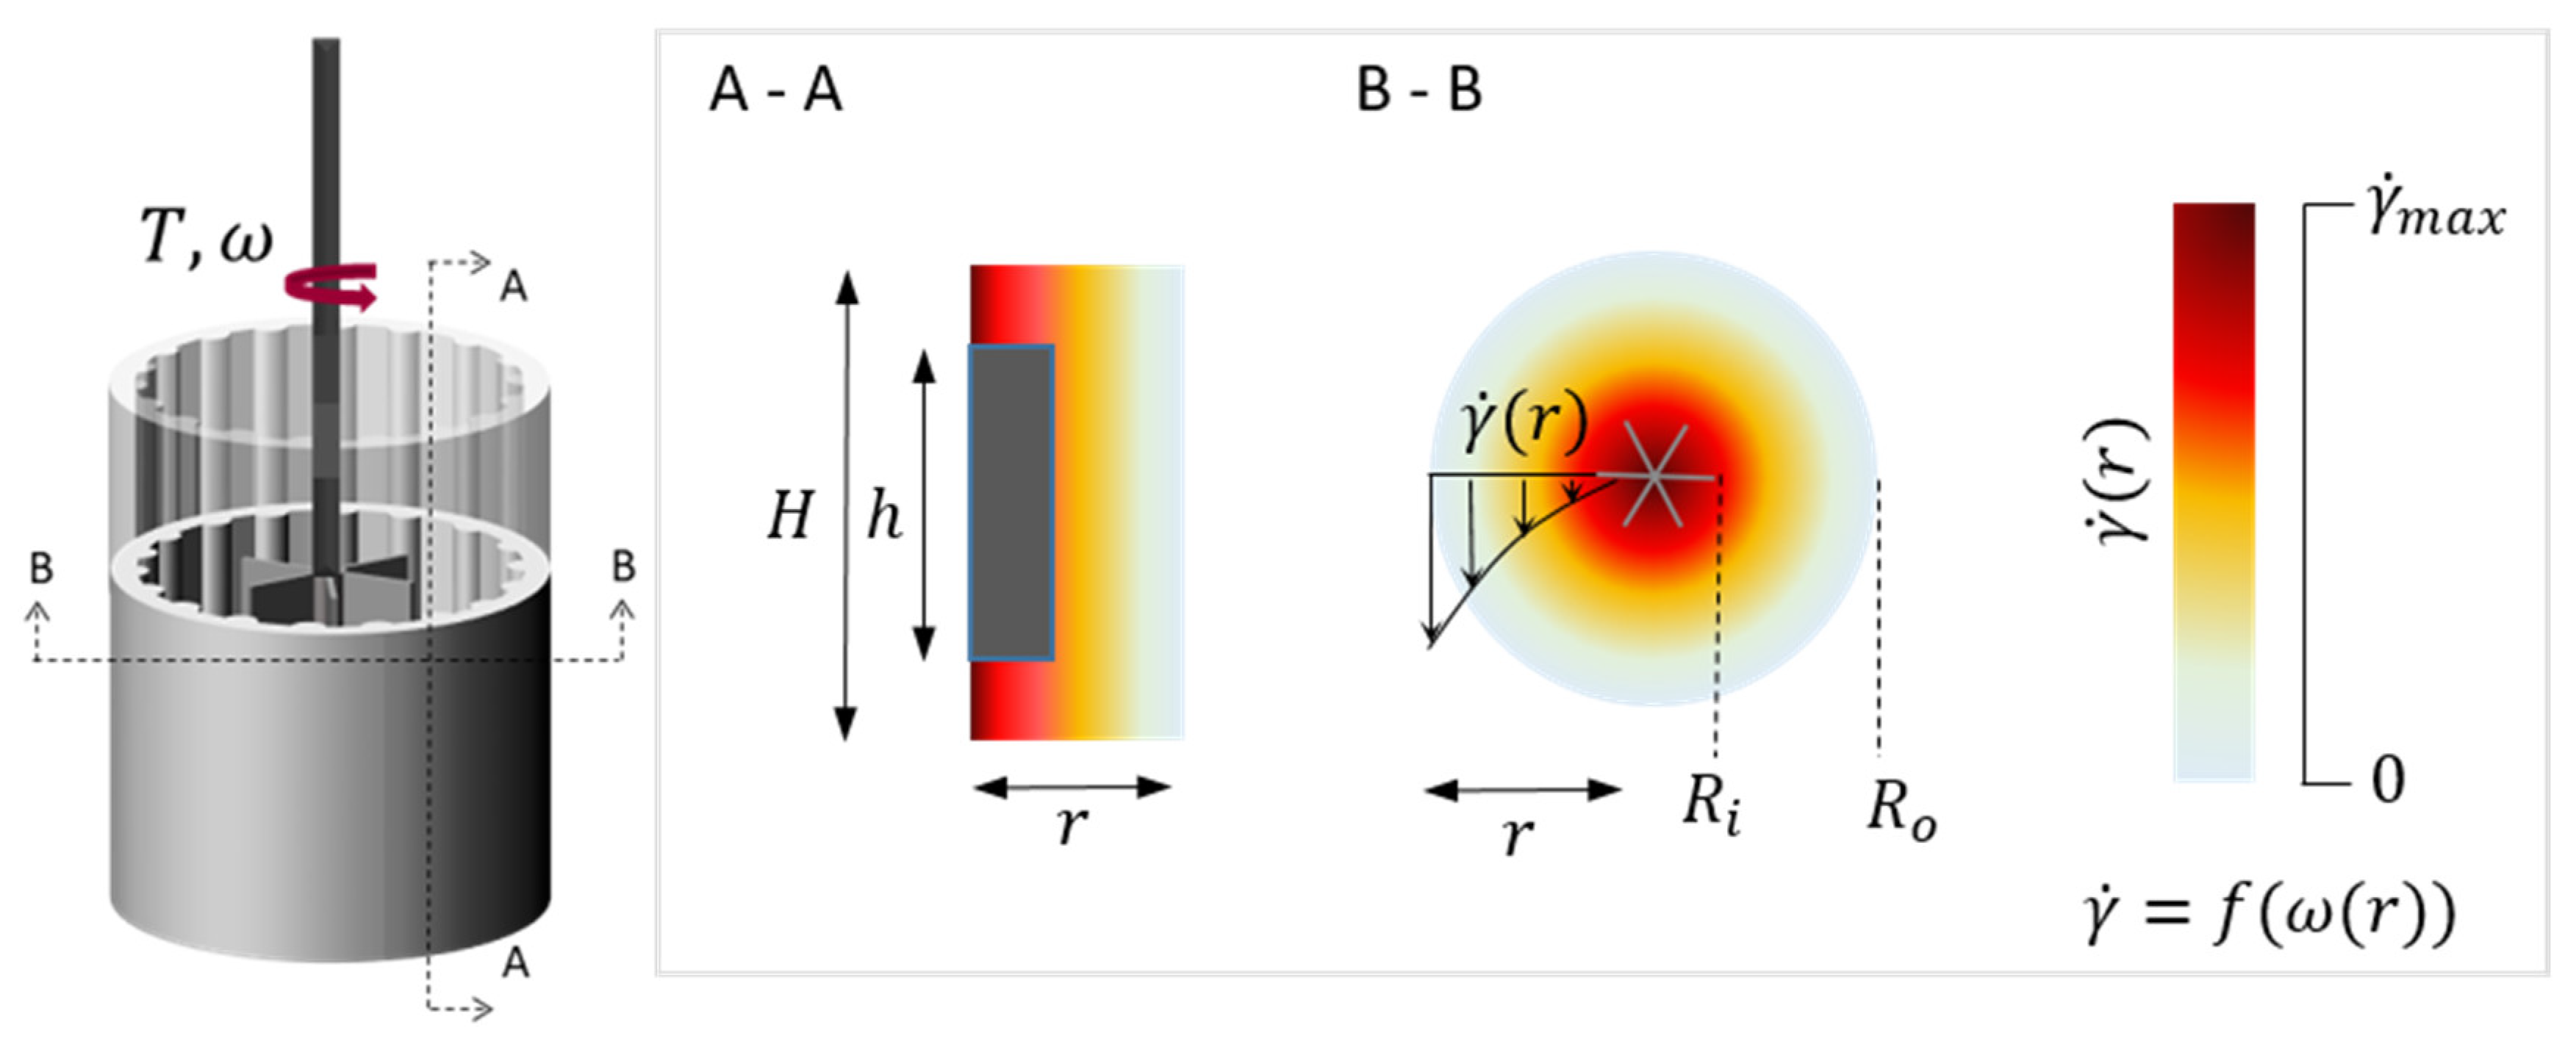
Figure 1. Schematic Vane-in-Cup geometry shear rate distribution from its inner towards the outer radius.
Preprints 98726 g001
Figure 2. Concept of investigation.
Preprints 98726 g002
Figure 3. Raw data for OPC-0.52 from (a) ViC test and (b) PP test including standard deviations in shaded grey scale.
Preprints 98726 g003
Figure 4. Exemplary flow curves for OPC-0.52 from raw data, (a) for PP test with applied regression functions and (b) ViC curve.
Preprints 98726 g004
Figure 5. Exemplary Reiner-Riwlin regression analysis for OPC-0.52 for selected ω ranges with a step size of 4; (a) for the whole range of ω ; (b) for small rotational speeds.
Preprints 98726 g005
Figure 6. Variation of (a) calculated τ 0 values through the Reiner-Rwilin equation in dependence on the chosen step size and range of ω ; (b) MSE values for OPC-0.52.
Preprints 98726 g006
Figure 7. Flow curves from raw data for rheological (a) PP tests and (b) ViC tests.
Preprints 98726 g007
Figure 8. Comparison of all τ 0 values gained through different input arrays [ T ; ω ] in ViC tests, analytical slump flow yield stresses and τ 0 from PP test regressions.
Preprints 98726 g008
Table 1. Chemical composition of the binder systems.
Sample name CaO SiO2 Al2O3 Fe2O3 MgO Na2O K2O TiO2
[%] [%] [%] [%] [%] [%] [%] [%]
OPC 62.90 19.63 5.23 2.60 1.54 0.24 0.80 3.32
LC3 42.53 28.12 9.43 3.47 1.43 0.18 1.31 0.43
Table 2. Physical parameters of the binder systems.
Sample name Specific   density   ρ Blaine SSA BET SSA d50 w d P u n t k e
[g/cm³] [cm²/g] [m²/g] [µm] [-]
OPC 3.11 4300 1.24 13.80 0.27
LC3 2.89 6528 2.65 9.99 0.25
Table 3. Paste mixture compositions for all test series.
Mixture ϕ s w/c ratio Binder Water PCE
[-] [-] [kg/m³] [kg/m³] [% bwoc]
OPC-0.45 0.45 0.39 1399.5 550.0 0.24
OPC-0.52 0.52 0.30 1617.2 480.0 0.85
OPC-0.55 0.55 0.26 1710.5 450.0 1.40
LC3-0.45 0.45 0.42 1295.1 550.0 0.22
LC3-0.52 0.52 0.32 1496.6 480.0 0.75
LC3-0.55 0.55 0.28 1582.9 450.0 1.07
Table 4. Rheological parameters for Bingham regression and Herschel-Bulkley regression.
Mixture γ ˙ c r i t τ 0 , B μ τ 0 , H B k n
[1/s] [Pa] [Pa*s] [Pa] [Pa*sn] [-]
OPC-0.45 0.02 11.13 0.38 6.53 3.69 0.49
OPC-0.52 1.25 5.53 0.59 7.53 0.26 1.18
OPC-0.55 1.25 5.00 1.82 16.45 0.29 1.41
LC3-0.45 0.16 15.71 0.29 11.05 2.86 0.50
LC3-0.52 0.63 15.47 0.80 15.35 0.82 0.99
LC3-0.55 0.63 6.79 1.34 10.50 0.63 1.17
Table 5. Yield stress values for all test series and measurement methods.
Mixture d S F ,
ViC
τ 0 A , R
ViC
d S F ,
PP
τ 0 A , R
PP
τ 0 , B , f u l l
ViC
τ 0 , B , f u l l
PP
τ 0 , H . B , f u l l
PP
[mm] [Pa] [mm] [Pa] [Pa] [Pa] [Pa]
OPC-0.45 257 11.6 251 12.8 17.7 11.1 6.5
OPC-0.52 251 13.9 255 12.2 17.5 5.5 7.5
OPC-0.55 253 13.9 254 13.7 10.1 5.0 16.5
LC3-0.45 252 11.9 258 10.6 14.2 15.7 11.1
LC3-0.52 254 12.5 243 15.4 16.3 15.5 15.4
LC3-0.55 245 14.3 250 13.8 16.9 6.8 10.5
Disclaimer/Publisher’s Note: The statements, opinions and data contained in all publications are solely those of the individual author(s) and contributor(s) and not of MDPI and/or the editor(s). MDPI and/or the editor(s) disclaim responsibility for any injury to people or property resulting from any ideas, methods, instructions or products referred to in the content.
Copyright: This open access article is published under a Creative Commons CC BY 4.0 license, which permit the free download, distribution, and reuse, provided that the author and preprint are cited in any reuse.
Prerpints.org logo

Preprints.org is a free preprint server supported by MDPI in Basel, Switzerland.

Subscribe

© 2024 MDPI (Basel, Switzerland) unless otherwise stated