Preprint
Article

Nutritional and Phytochemical Profiles of Wild Adlay (Coix lacryma-jobi L.) Accessions by GCFID, FTIR, and Spectrophotometer

Altmetrics

Downloads

177

Views

124

Comments

0

Submitted:

13 February 2024

Posted:

13 February 2024

You are already at the latest version

Alerts
Abstract
Cultivated adlay or Job’s tear (Coix lacryma-jobi L.) is an important food crop having numerous therapeutic and nutraceutical health benefits. Our study aimed to determine nutrients, minerals, fatty acid composition, and functional groups of seven wild Adlay accessions (brown, black, yellow, grey, green, off-white, and purple) to find out their scope as cereal crops using simple, rapid, and modern analytical techniques. Results revealed variations among bulk densities, specific densities, percent empty spaces, and corresponding grain counts per 10g of sample are valuable characteristics in distinguishing the accessions. Contents of fat, protein, ash, and fibre were found to be comparable to cultivated Adlay. Brown adlay was measured with the highest protein, fat, and fibre contents, 15.82%, 4.76% and 2.37%, respectively. Phosphorus, potassium, calcium, and sodium ranged 0.3% - 2.2%, whereas boron, iron, copper, zinc, and manganese were in the range 1.6mg/kg - 20.8mg/kg. Wild adlay triglyceride composition constituted of polyunsaturated fatty acids as primary fraction followed by olein and palmitic acid as prominent fatty acids. Distinguishing functional groups expressed infra-red frequencies in narrow bands and fingerprint region of proteins associated with out-of-plane region evident structural differences among adlay accessions. Frequency of functional groups in seven accessions indicated black genotype promising for varietal development.
Keywords: 
Subject: Chemistry and Materials Science  -   Analytical Chemistry

1. Introduction

Nutritionists and food scientists have been increasingly interested in phytochemicals for their potential to promote general health, prevent chronic diseases, and slow down the ageing process [1,2,3]. This has led them to investigate the properties, content, and occurrence of bioactive metabolites in plants. Adlay, also known as Job’s tears or Jobi, is a grain part of an ancient plant Coix lacryma-jobi L., famous as functional food, feed for animals and poultry, and for making beads applied in rosaries, necklaces, bracelets, and other objects etc. It is used in traditional Chinese medicine (TCM) for more than 17 chronic diseases and is known as “the king of Gramineae plants” in lieu of its functional characteristics [4,5]. The physicochemical composition, bioactivity, processing, application, functionality, and safety aspects of adlay, as well as its phytochemistry and health-promoting effects, are well documented [6,7]. Research on the chemical composition of Adlay began in the 1960s, and more than 70 compounds, including lipids, sterols, and phenols, have been isolated and their dynamics for health have been reviewed [8]. Initial research was focused on Adlay proteins, amino acids, and vitamins, but in recent years, studies have surged to investigate functional ingredients of Adlay. Research progress on functional ingredients on Adlay support the notion that adlay may be one of the best functional foods and further reveal the action mechanism of functional ingredients oils, polysaccharides, phenols, phytosterols, Kanglaite, Coixenolide coixol, Coixolin, naringenin, lactam, and resistant starch for combating diseases [8,9,10]. China is a pioneer in using adlay as healthy food, and many studies on the functional ingredients of adlay have been conducted [8,9]. Cultivated Adlay (Coix lachryma-jobi L. var. ma-yuen Stapf) represents a seasonal crop grown in various regions across the globe. In contrast, indigenous Adlay (Coix lachryma L.) is a wild perennial plant distinguished by its stony, hard-shelled grains manifest in 9-11 different colours [11,12]. The indigenous Adlay variety is relatively rare and poorly understood in Pakistan, primarily found at 500m or higher altitudes, including the Margalla hills region. Additionally, it is colloquially referred to as “Tesbih daana” due to its use in crafting prayer beads.
Functional characteristics of Adlay exhibit variations influenced by factors such as type, habitat, biotransformation processes (e.g., fermentation), and measurement techniques [12,13,14]. Literature pertaining to stony hard-shelled adlay, particularly within the context of indigenous Adlay, is limited. To address this gap, a comprehensive study of the physicochemical, mineral, triglyceride composition and functional group characteristics of wild (indigenous) Adlay accessions was conducted using analytical techniques, including gas chromatography with flame ionization detector (GC-FID), atomic absorption, and Fourier Transform Infrared (FT-IR) spectroscopy. Statistical tests such as LSD and principal component analysis were employed to elucidate the differences and classify the accessions with similar characteristics. The insights gained from this study are of significant practical importance for the indigenous Adlay supply chain and its applications in functional foods.

2. Results and Discussion

2.1. Physical characteristics of Indigenous Adlay accessions

Distinct physical variations were observed among grains in both groups categorized by their shell hardness (stony hard or comparatively hard). These variations included bead length, width, color, appearance, and shape. Grain shapes ranged from irregular to oval and appeared in different colors including purple (PRP), black (BLK), yellow (YLW), brown (BRN), grey (GRY), off white (OWT), and green (GRN). Stony hard-shelled grains were prevalent in PRP, BLK, BRN, and OWT, while comparatively hard-shelled grains were less common in YLW, GRY, and GRN, based on both weight-to-weight (w/w) basis and grain count criteria as shown in Figure 1 given below.
The average bead length was 0.86cm (± 0.062), with the longest beads found in BLK (0.95cm), followed by GRY and YLW (0.78cm). Bead breadth, weight, shape (length to breadth ratio-lbr), and volume ranged from 0.631cm to 0.8cm (0.71cm ± 0.064), 0.08g to 0.29g (0.15 g ± 0.07), 1.08 to 1.33 (1.04 ± 0.46), and 0.12mL3 to 0.392mL3 (0.21 mL3 ± 0.1) respectively, as illustrated in Table 1 given below.
The observed lengths, widths, and weights are comparable to three Chinese wild adlay accessions [12]. It is important to note that grain shape is independent of both length and breadth, and the influence of breadth on volume is significantly greater than that of length. Furthermore, a good relationship was found between bead volume and oil content. The average bulk density 0.45g/mL (± 0.19) was highest in BRN, GRN, and PRP whereas the average specific density was 0.745` g/mL (± 0.35) corresponding to flour average density 0.583g/m3 (± 0.19) as indicated in Table 1.
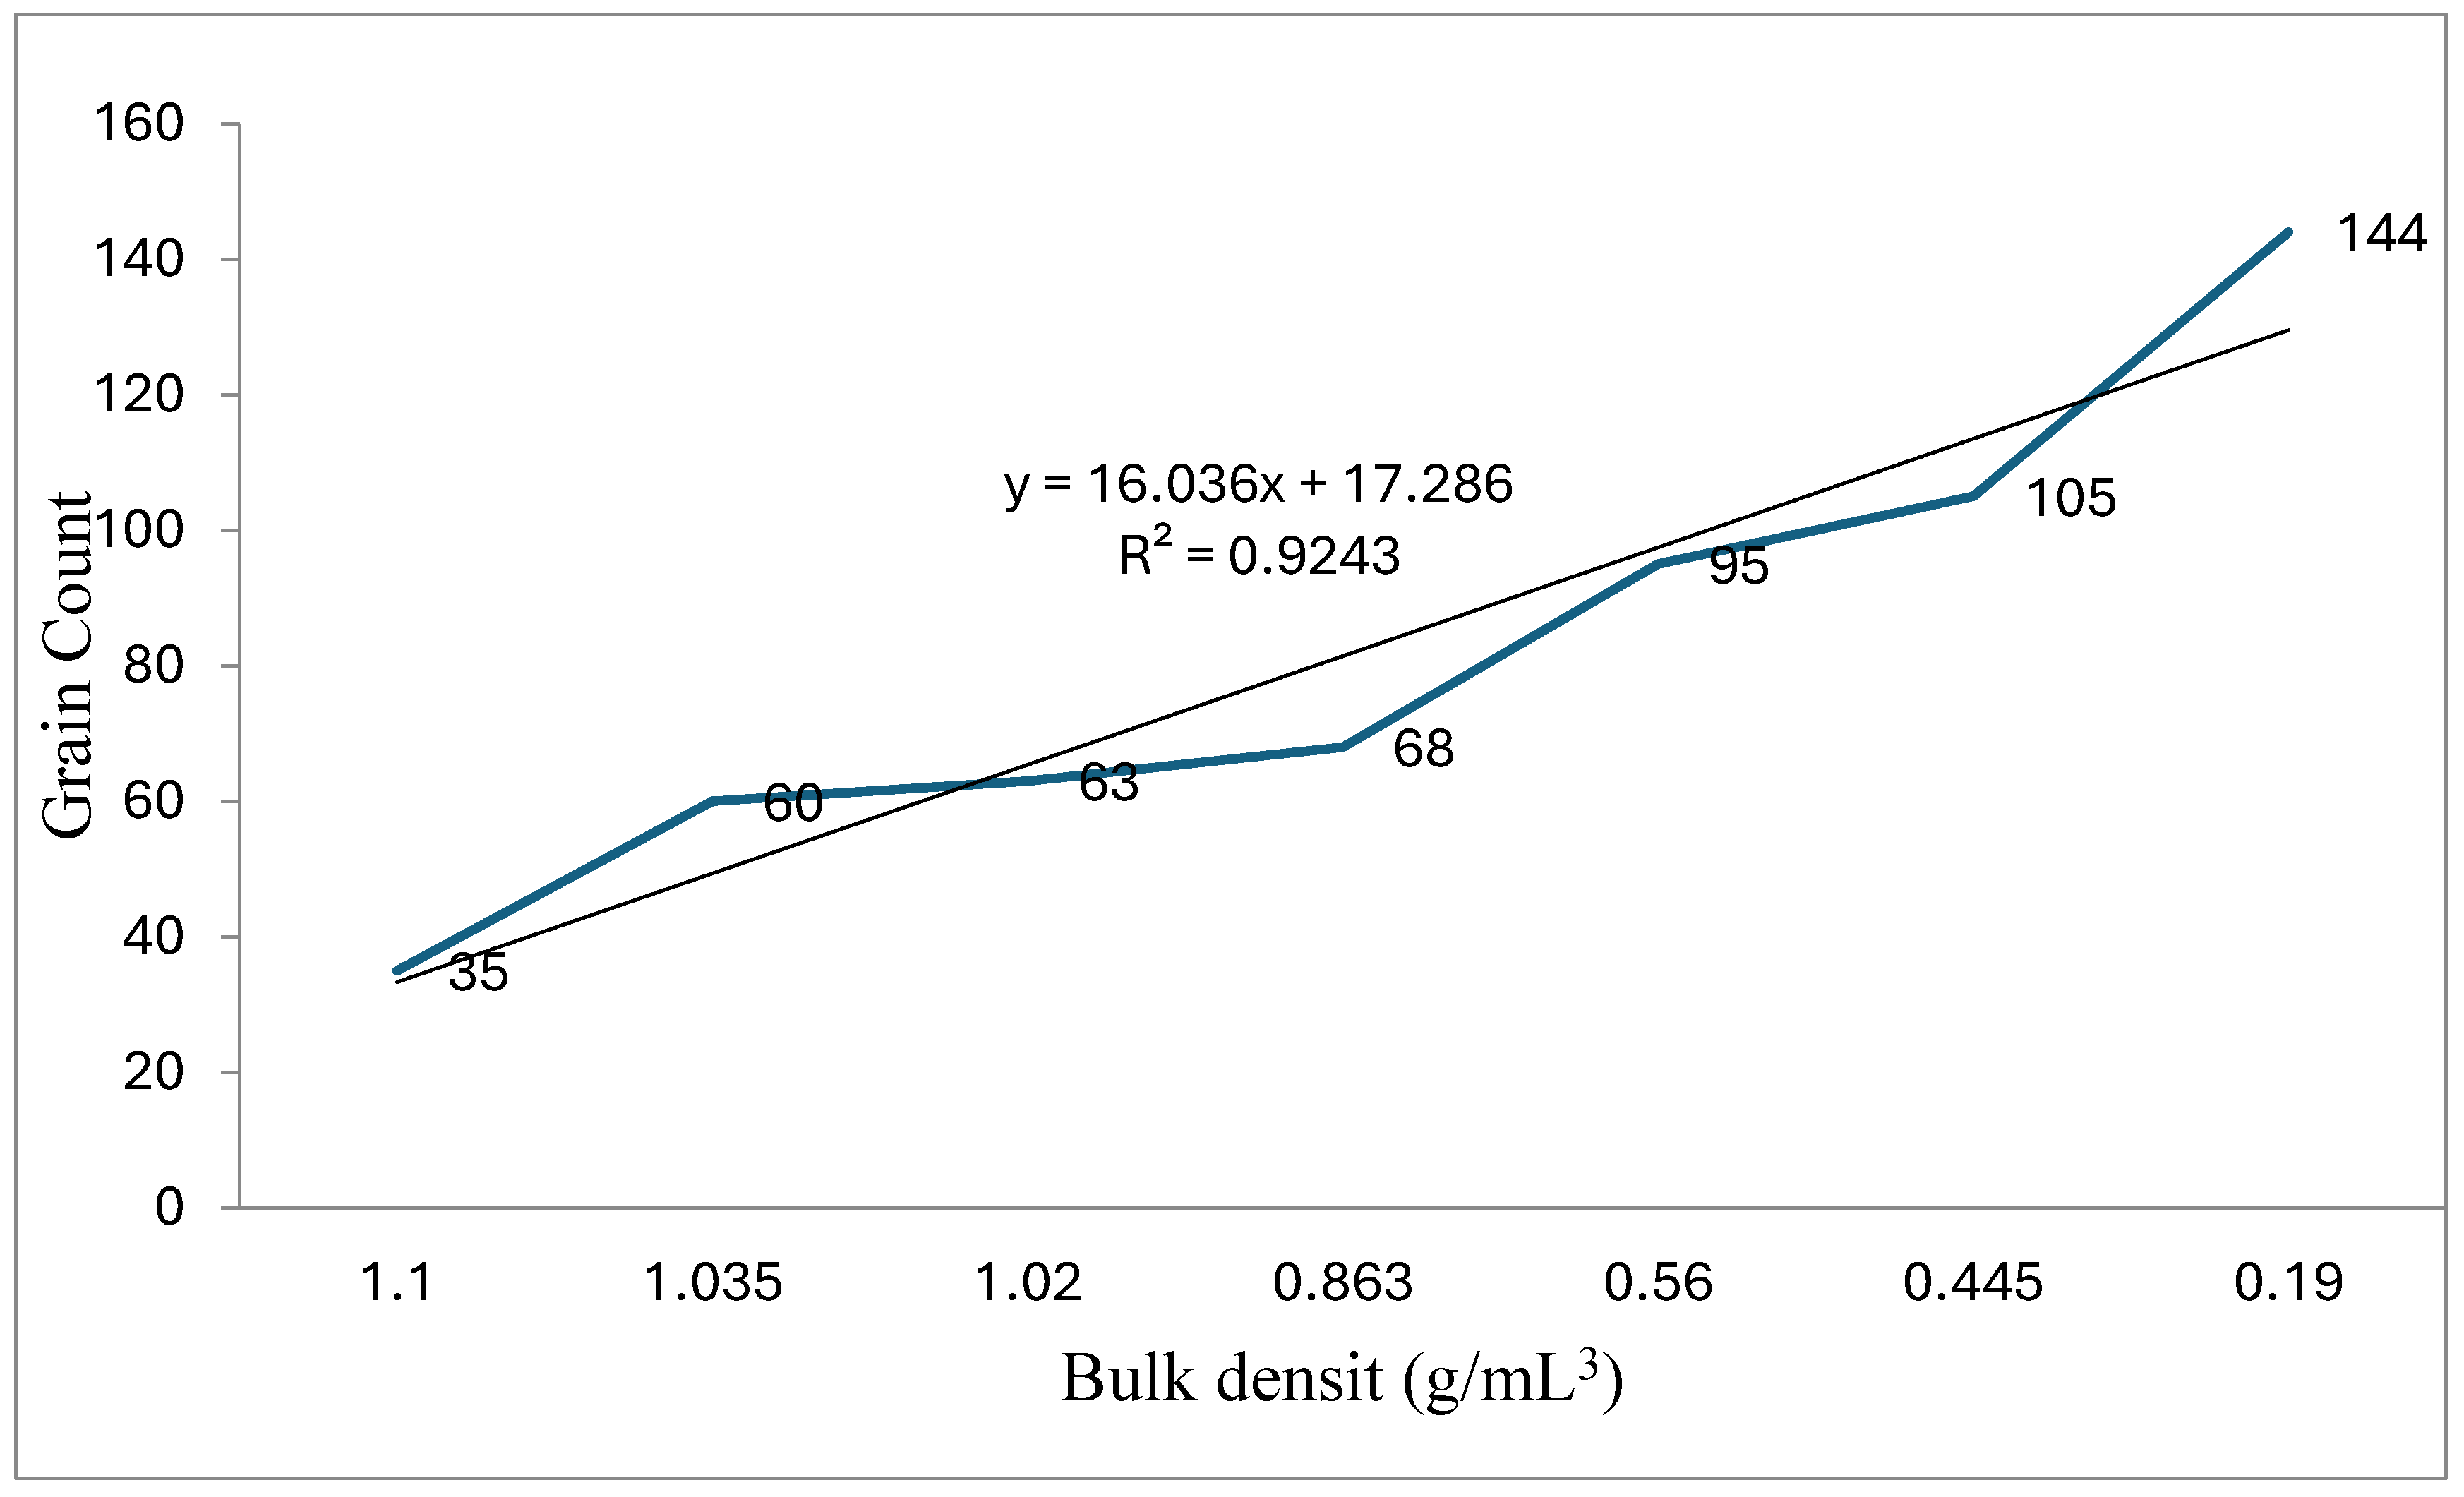
The pronounced differences in densities and % empty spaces offer promising means of distinguishing among indigenous adlay accessions. These density characteristics are closely linked to the texture of the seed coat, a significant factor influencing the milling quality of cereals [11,12]. Among physical characteristics, bulk density, and grain count per 10g of sample were observed inversely related (y = 16.036x + 17.286; R² = 0.93) as shown in Figure 2 given below.
The observed relationship is readily apparent, as grains with lower density tend to occupy greater volume, resulting in higher grain count per unit weight. This phenomenon is closely linked to differences in the percentage of empty spaces (bulk porosity) and both bulk and individual grain densities. The bulk porosity which measures the % empty spaces was 53.89% (± 7.41) and comparable with the average milling recovery % of Adlay which is 45% [12]. The wider range of specific density values in comparison to flour density, indicates variations in grain filling and highlights disparities among the individual grains. Furthermore, lower flour densities are associated with increased flakes recovery during the milling process [15].

2.2. Physicochemical, triglycerides and functional groups of indigenous Adlay accessions

2.2.1. Physicochemical characterization

Adlay oil plays a significant role in various physiological and nutritional attributes [8,13], in addition to the general factors associated with oil in cereals [16]. The average oil content estimated through nuclear magnetic resonance were similar with the values obtained from hexane extraction (4.5% ± 0.3) among different accessions of indigenous Adlay as illustrated in Table 2.
This similarity in oil values by two different methods supports the accuracy of the measurement methodology employed. Differences in fat content among indigenous Adlay grains are readily apparent, driven by measurement, physical, geographical, and other inherent variations among the grains [17,18,19,20]. Black and white cultivars exhibit distinct oil contents, whereas variations in fat content between whole grain flour and degermed flour are minimal [17]. Ding et al. [18] also documented significant differences in fat content among cultivated Adlay varieties. Furthermore, defatted flour revealed an average protein content of 14.66% (± 1.14), with the highest protein content (15.82%) observed in BRN grains, as illustrated in Table 2. In indigenous Adlay, the average protein content is higher than the maximum protein content of 13.78% found in the common wheat commercial variety, ‘Laasani 2008’ (personal communication). The differences in protein content among Adlay accessions seem closely linked to colour variations within the Adlay grains, specifically transitioning from green (GRN) to brown (BRN). It is notable that GRN Adlay grains tend to be relatively softer, which implies immature grains may have lower protein content [18,20]. Prior research has also highlighted substantial differences in protein content within various cultivated whole grain Adlay (ma-yun Stapf) varieties, which are widely consumed in China and Taiwan [12]. However, no significant differences were detected among different compartments of grain [18,21]. Variations in protein content observed in Adlay can be attributed to several factors, including Adlay type, agro-ecological influences, genetic effects, biotransformation by fermentation, and the specific techniques employed for measurement [14,19,20,22,23]. These factors collectively contribute to the differences in protein contents. Moisture and ash are considered crucial as they directly affect the stability and storage of food. The average ash value determined on a dry weight basis in indigenous Adlay collections was 2.24% ±0.36 (1.88% -2.63%), equally highest in OWT and GRN grains, followed by PRP (2.6%), as shown in Table 2. Relatively higher ash contents are probably due to accessions hailing to Margalla hills areas. For example, husk colors or even grain compartments showed significant differences among ash contents [18]. The digestible fiber average contents (2.02±0.2) are comparable to the previously reported 2.3% in cultivated Adlay and are found to be highest in BRN.
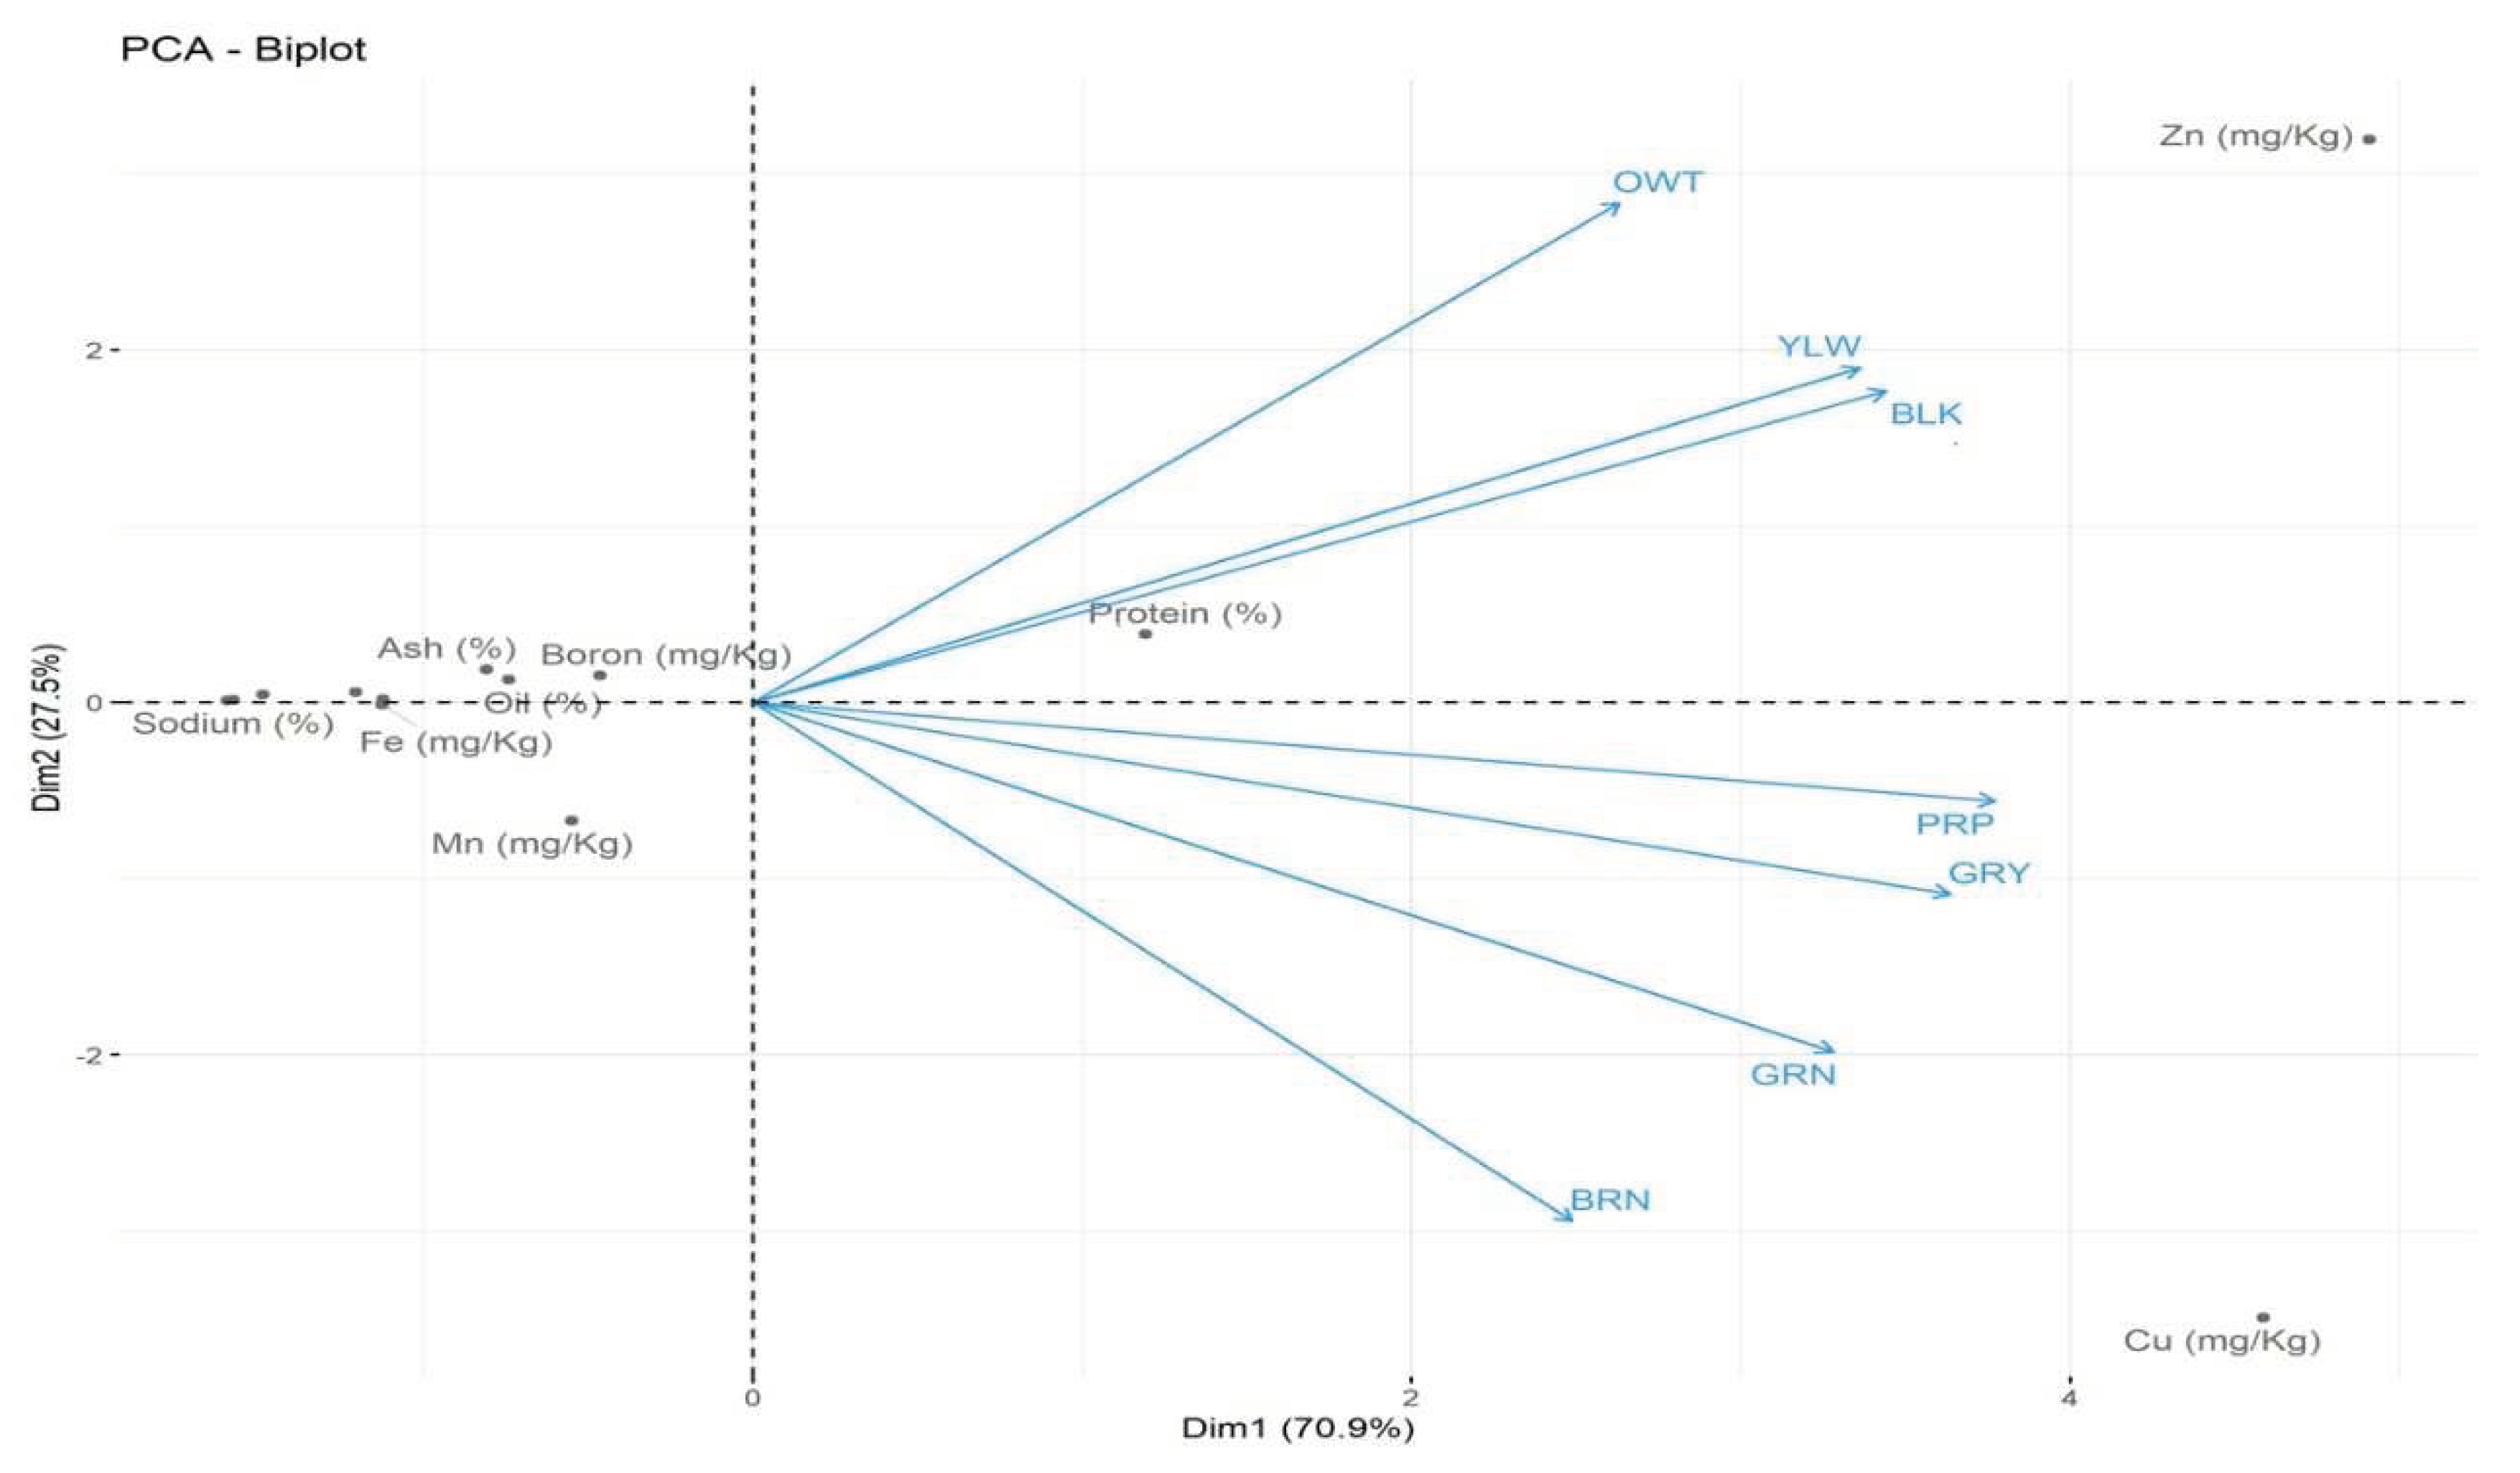
Among the indigenous adlay varieties, GRN adlay exhibited` highest P (0.3%), followed by GRY (0.27%) and OWT (0.25%). These differences, however, were not statistically significant. Notably, phosphorus levels have not been previously reported in hard-shelled adlay genotypes. Additionally, the levels of K in OWT (0.68%), and Ca in YLW (2.2%), were notably higher than the highest Na content (0.21%). These findings suggest the potential advantages of promoting indigenous adlay for their mineral contents. Boron is recognized as a crucial mineral influencing shell hardening, which, in turn, impacts milling quality [24]. It was observed that BLK adlay contained the highest B (4 mg/kg), followed by BRN, GRN, and OWT varieties, respectively. The Boron levels 2.0-4.0mg/kg were found to be comparable to Indian cultivars. In contrast, P, K, Ca, and Na contents (0.3% to 2.2%), were notably higher than those typically found in cultivated adlay [25]. These variations can be attributed to differences in soil chemistry, Adlay type, habitat, extraction method, and measurement techniques [19,22,23,25,26,27]. It’s worth noting that this is the first study to report Fe, Mn, Cu, and Zn contents in Adlay hard-shelled type. Prior studies had only assessed Fe, Cu, and Mn in soft-shelled Adlay, and Zn remained undetected in genotypes from the National Bureau of Plant Genetic Resources of India [25]. Considering the strong relationship among the physicochemical characteristics of indigenous Adlay accessions as indicated in Table 2, multivariate analysis was conducted using the statistical tool ‘Principal Components Analysis’ (PCA). PCA involves the generation of linear combinations of the variables, resulting in principal directions equal to the original variables. These principal directions are represented by vectors in the PCA-Biplot, as depicted in Figure 3.
The analysis identified variables PRP and BLK Adlay accessions as PC1 and PC2, respectively. Notably, YLW clustered with BLK, while GRY clustered with PRP distantly apart from others, as shown in Figure 3. These clusters accounted for a substantial proportion of the data variation, contributing nearly equally at 52.7% and 43.7%, respectively. This observation arises because these variables are more closely aligned with the axes and exhibit similar vector lengths. In contrast, parameters Zn and Cu appeared distant apart in the analysis. The PCA-Biplot presented in Figure 3 represents the distribution of characteristics. It delineates these features into scattered positive loadings, as indicated by eigenvalues and eigenvectors, primarily driven by protein content. Conversely, negative loadings are associated with extracted oil content, Fe, and Na. Additionally, parameters such as ash, B, and Mn contents shape the data distribution within the biplot. Furthermore, the variables GRN, OWT, and BRN exhibit comparable vector lengths, and the angles between them in the biplot convey their inherent correlations in the multivariate space, as depicted above in PCA-Biplot Figure 3.

2.2.2. Wild adlay triglyceride composition

Short and medium-chain fatty acids (SMCFAs) with carbon chain lengths fewer than fourteen have implications for human health [28,29]. In indigenous Adlay accessions, such fatty acids were not detected, as indicated by the chromatograms shown in the Supplementary Figures S1–S7. Among the nine identified fatty acids, saturated fatty acids (SFAs) collectively constituted a significant portion (33.81% ±13.58%) of the total, with palmitic acid (C16:0) being the predominant SFA (26.3% ±4), followed by lignoceric (C24:0), behenic (C22:0), and arachidic (C20:0) acids, as illustrated in Table 3.
As anticipated, unsaturated fatty acids (USFAs) expressed the dominant portion (53.1% ± 8.74) of the wild adlay triglycerides composition. The USFAs fraction mainly consists of PUFAs, with linoleic acid (C18:2n6C) being the major contributor (38.73% ±7.2) followed by MUFAs representing 7.42% ± 4.4 of the total USFAs. Oleic acid (C18:1n9C) was present as the prominent MUFAs (4.2% ±0.63) among the Adlay accessions, followed by eicosenoic acid (C20:1n9C) 3.13% ±0.4. Notably, other unsaturated fatty acids including palmitoleic (C16:1n9C), and eicosenoic acid (C20:1n9C) were present only in the YLW Adlay oils. Our results differ slightly from previously reported regarding the quantitative fractions of unsaturated fatty acids (85.1%) and their respective individual constituents [30]. It is due to the measurement technique, adlay type and habitat etc. [13,22,23,27,30,31].
A striking observation was the higher distribution of PUFA (∑PUFAs) 38.73% ±7.2, making up a significant proportion of the wild adlay oil triglyceride composition in indigenous Adlay most accessions. The percentage contents of ∑PUFAs was 58.3% in YLW Adlay followed by GRY (55.1%), BRN (44.04%), GRN (38.04%), and PRP (33.0%). These values are comparable with earlier reports in cultivated Adlay [30]. A similar study reported Triolein (1.04%) as the most abundant constituent in cultivated Adlay oil from Zhejiang province (China), and has isolated lipid markers consisting of various triglycerides, diglycerides, monoglycerides, sterols, glycerol trioleate, and fatty acids in Adlay seeds [13,22]. Lipid profile further revealed 32 peaks, consisting of 20 triglycerides and 12 diglycerides, 9 of them are useful in distinguishing the geographical origin of Adlay [23,32].
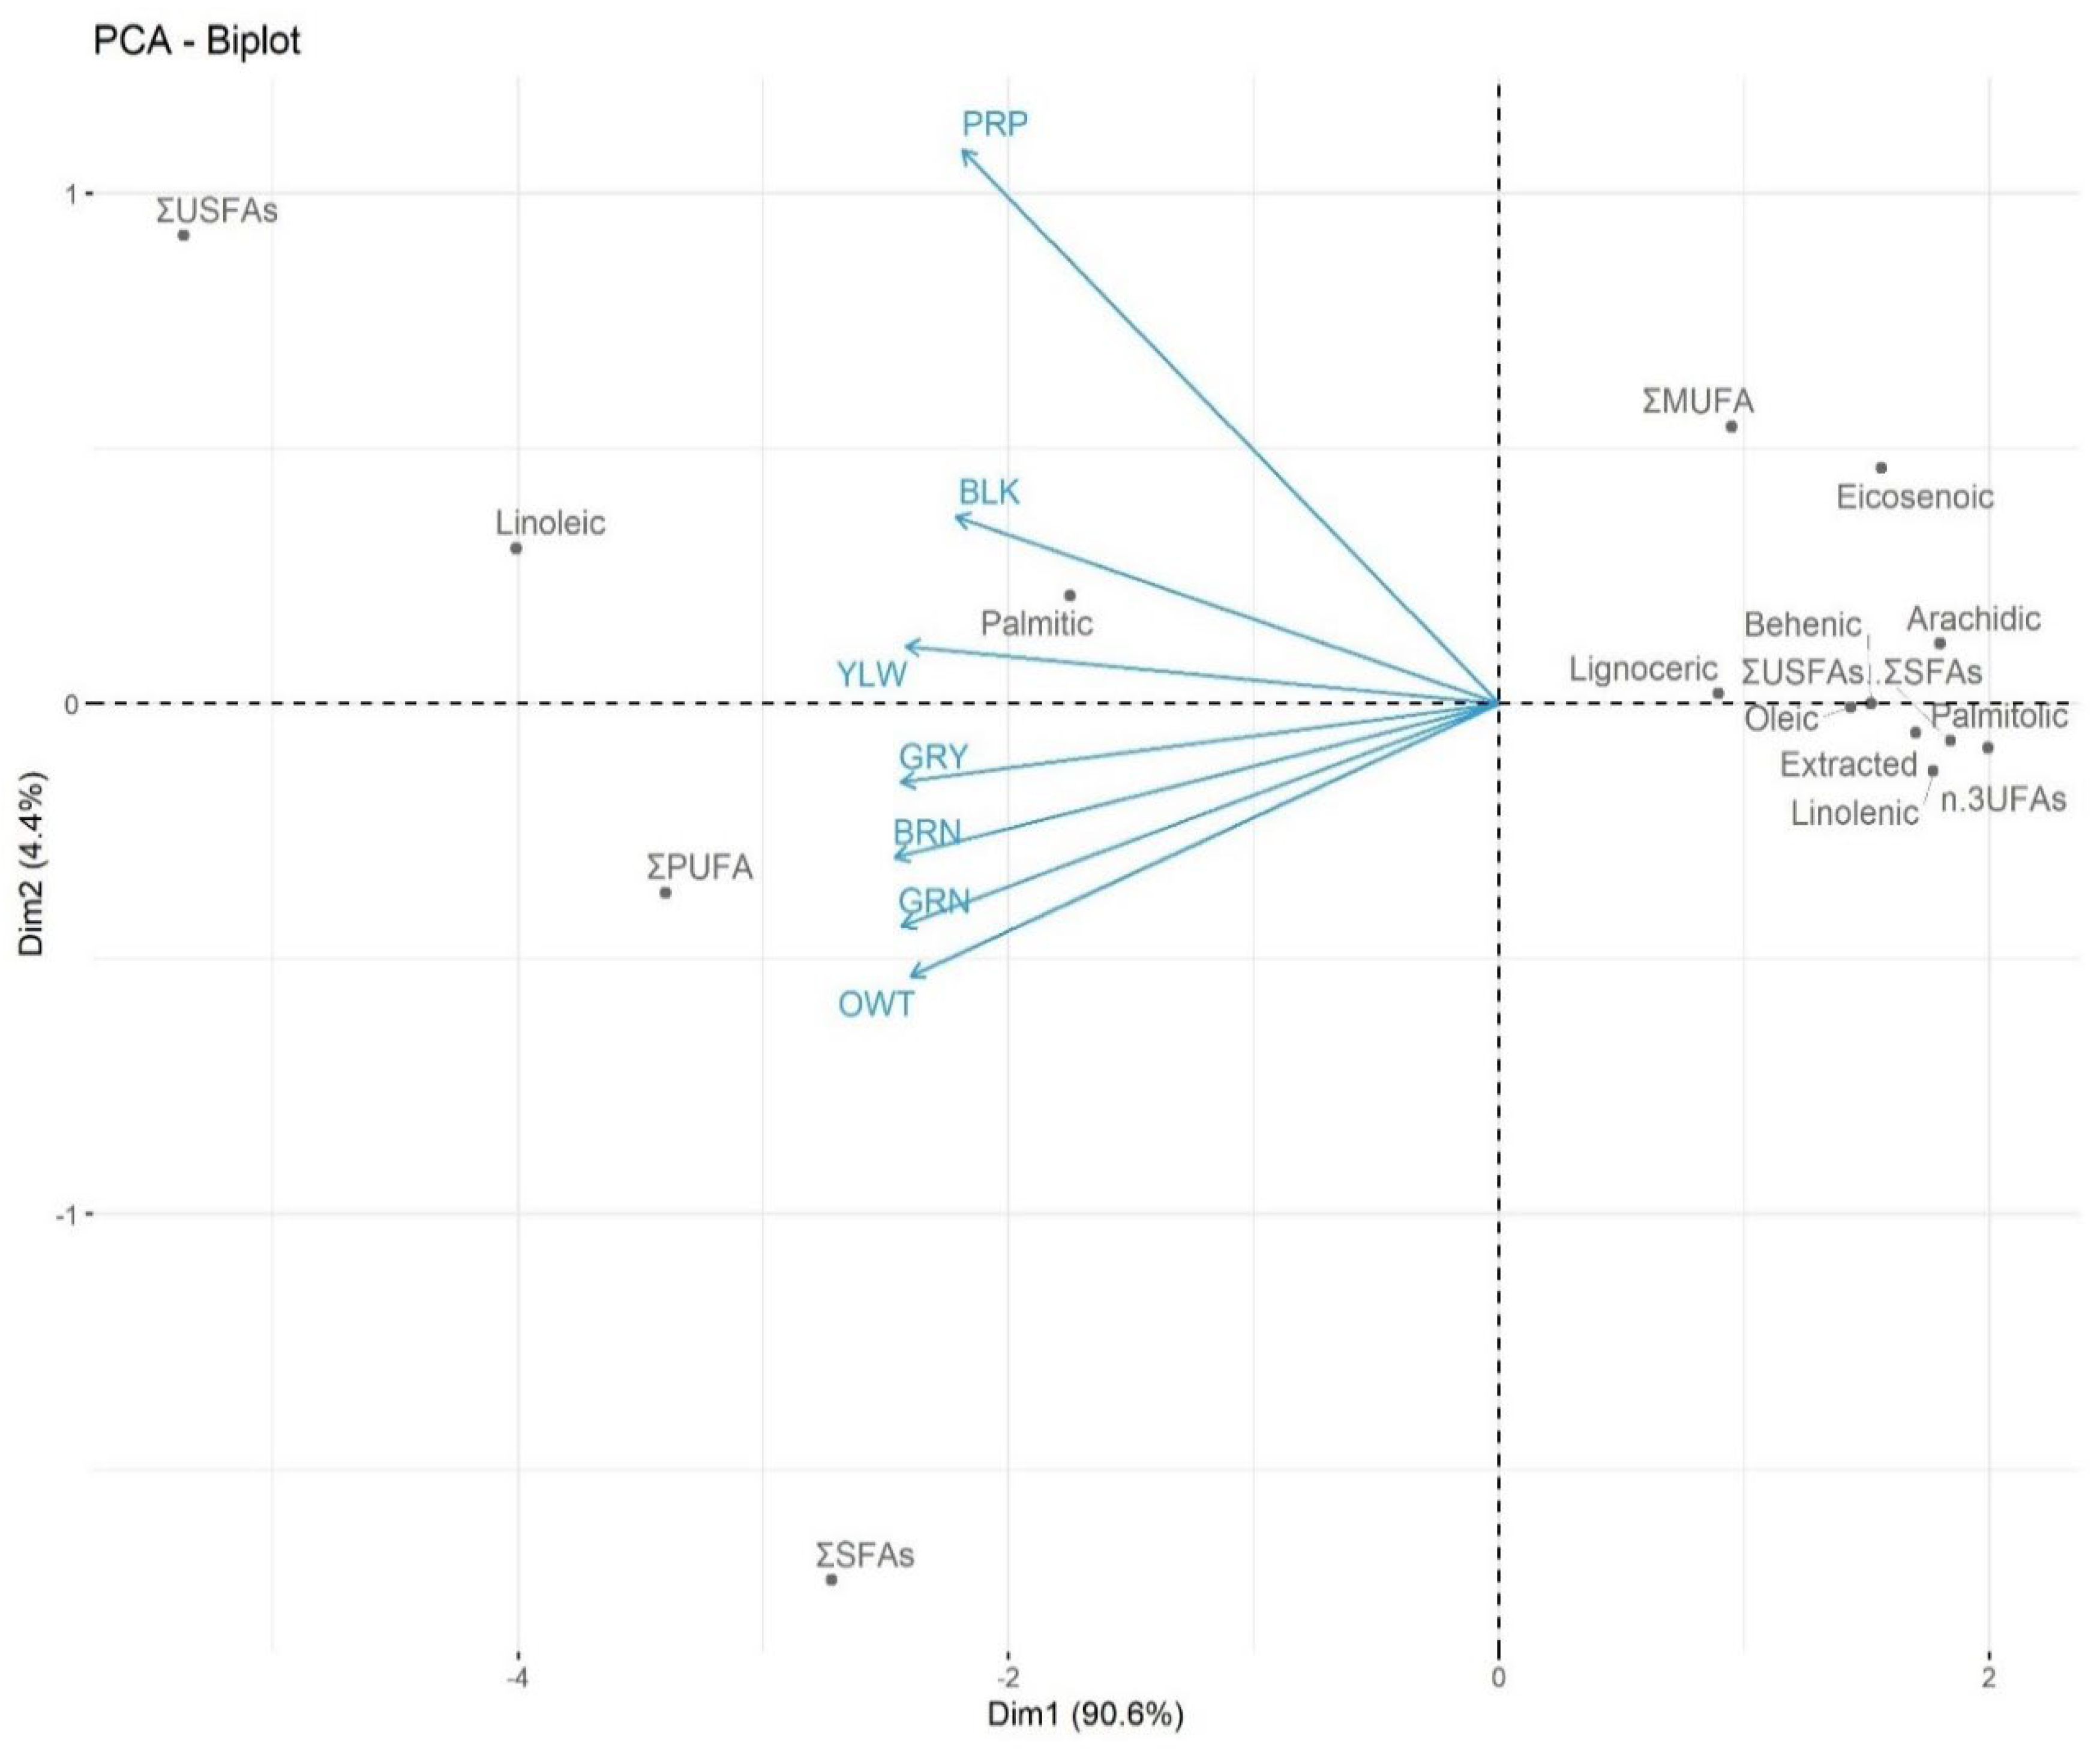
To comprehensively analyze the characteristics of nine identified fatty acids and their derivatives ΣUSFAs/ΣSFAs and ΣPUFA/ΣMUFA, PCA was carried out. PCA notably identified YLW, GRY, and BLK Adlay accessions as PC1, PC2, and PC3, respectively, with BRN, GRN, and OWT Adlay clustering together with GRY. YLW and GRY vectors are parallel to the axes and equal in length within the multivariate space, thereby making maximal and nearly equal contributions to the overall variation, accounting for more than 80% of the total (42% and 39% respectively), as indicated in the PCA-Biplot (Figure 4).
The angle of PC3 (BLK Adlay) signifies its influence. Although it is not parallel to the axes and does not contribute to the same extent as PC1 or PC2, its vector length is substantial enough to warrant consideration in the variation summation. Moreover, PC1, PC2, and PC3 distribute characteristics into compact positive loadings, as revealed by linolenic acid, oil contents, long-chain saturated fatty acids (lignoceric, behenic, and arachidic acids), and the ratio of ΣUSFAs/ΣSFAs.
In contrast, other factors exhibit scattered loadings, with ΣMUFA in quadrant Q1, linoleic acid in Q3, and ΣPUFA in Q4. ΣUSFAs and ΣSFAs are distant apart from the rest of the data points. The angles between vectors YLW, GRY, BRN, GRN, and OWT represent their respective correlation coefficients in the multivariate space, with increased angles indicating proportional decreases in correlation as revealed by the reduced correlation associated with BLK Adlay and the complete lack of correlation, denoted by a wider angle for PRP Adlay.

2.2.3. Identification of functional groups or bonds in Adlay flour using FTIR

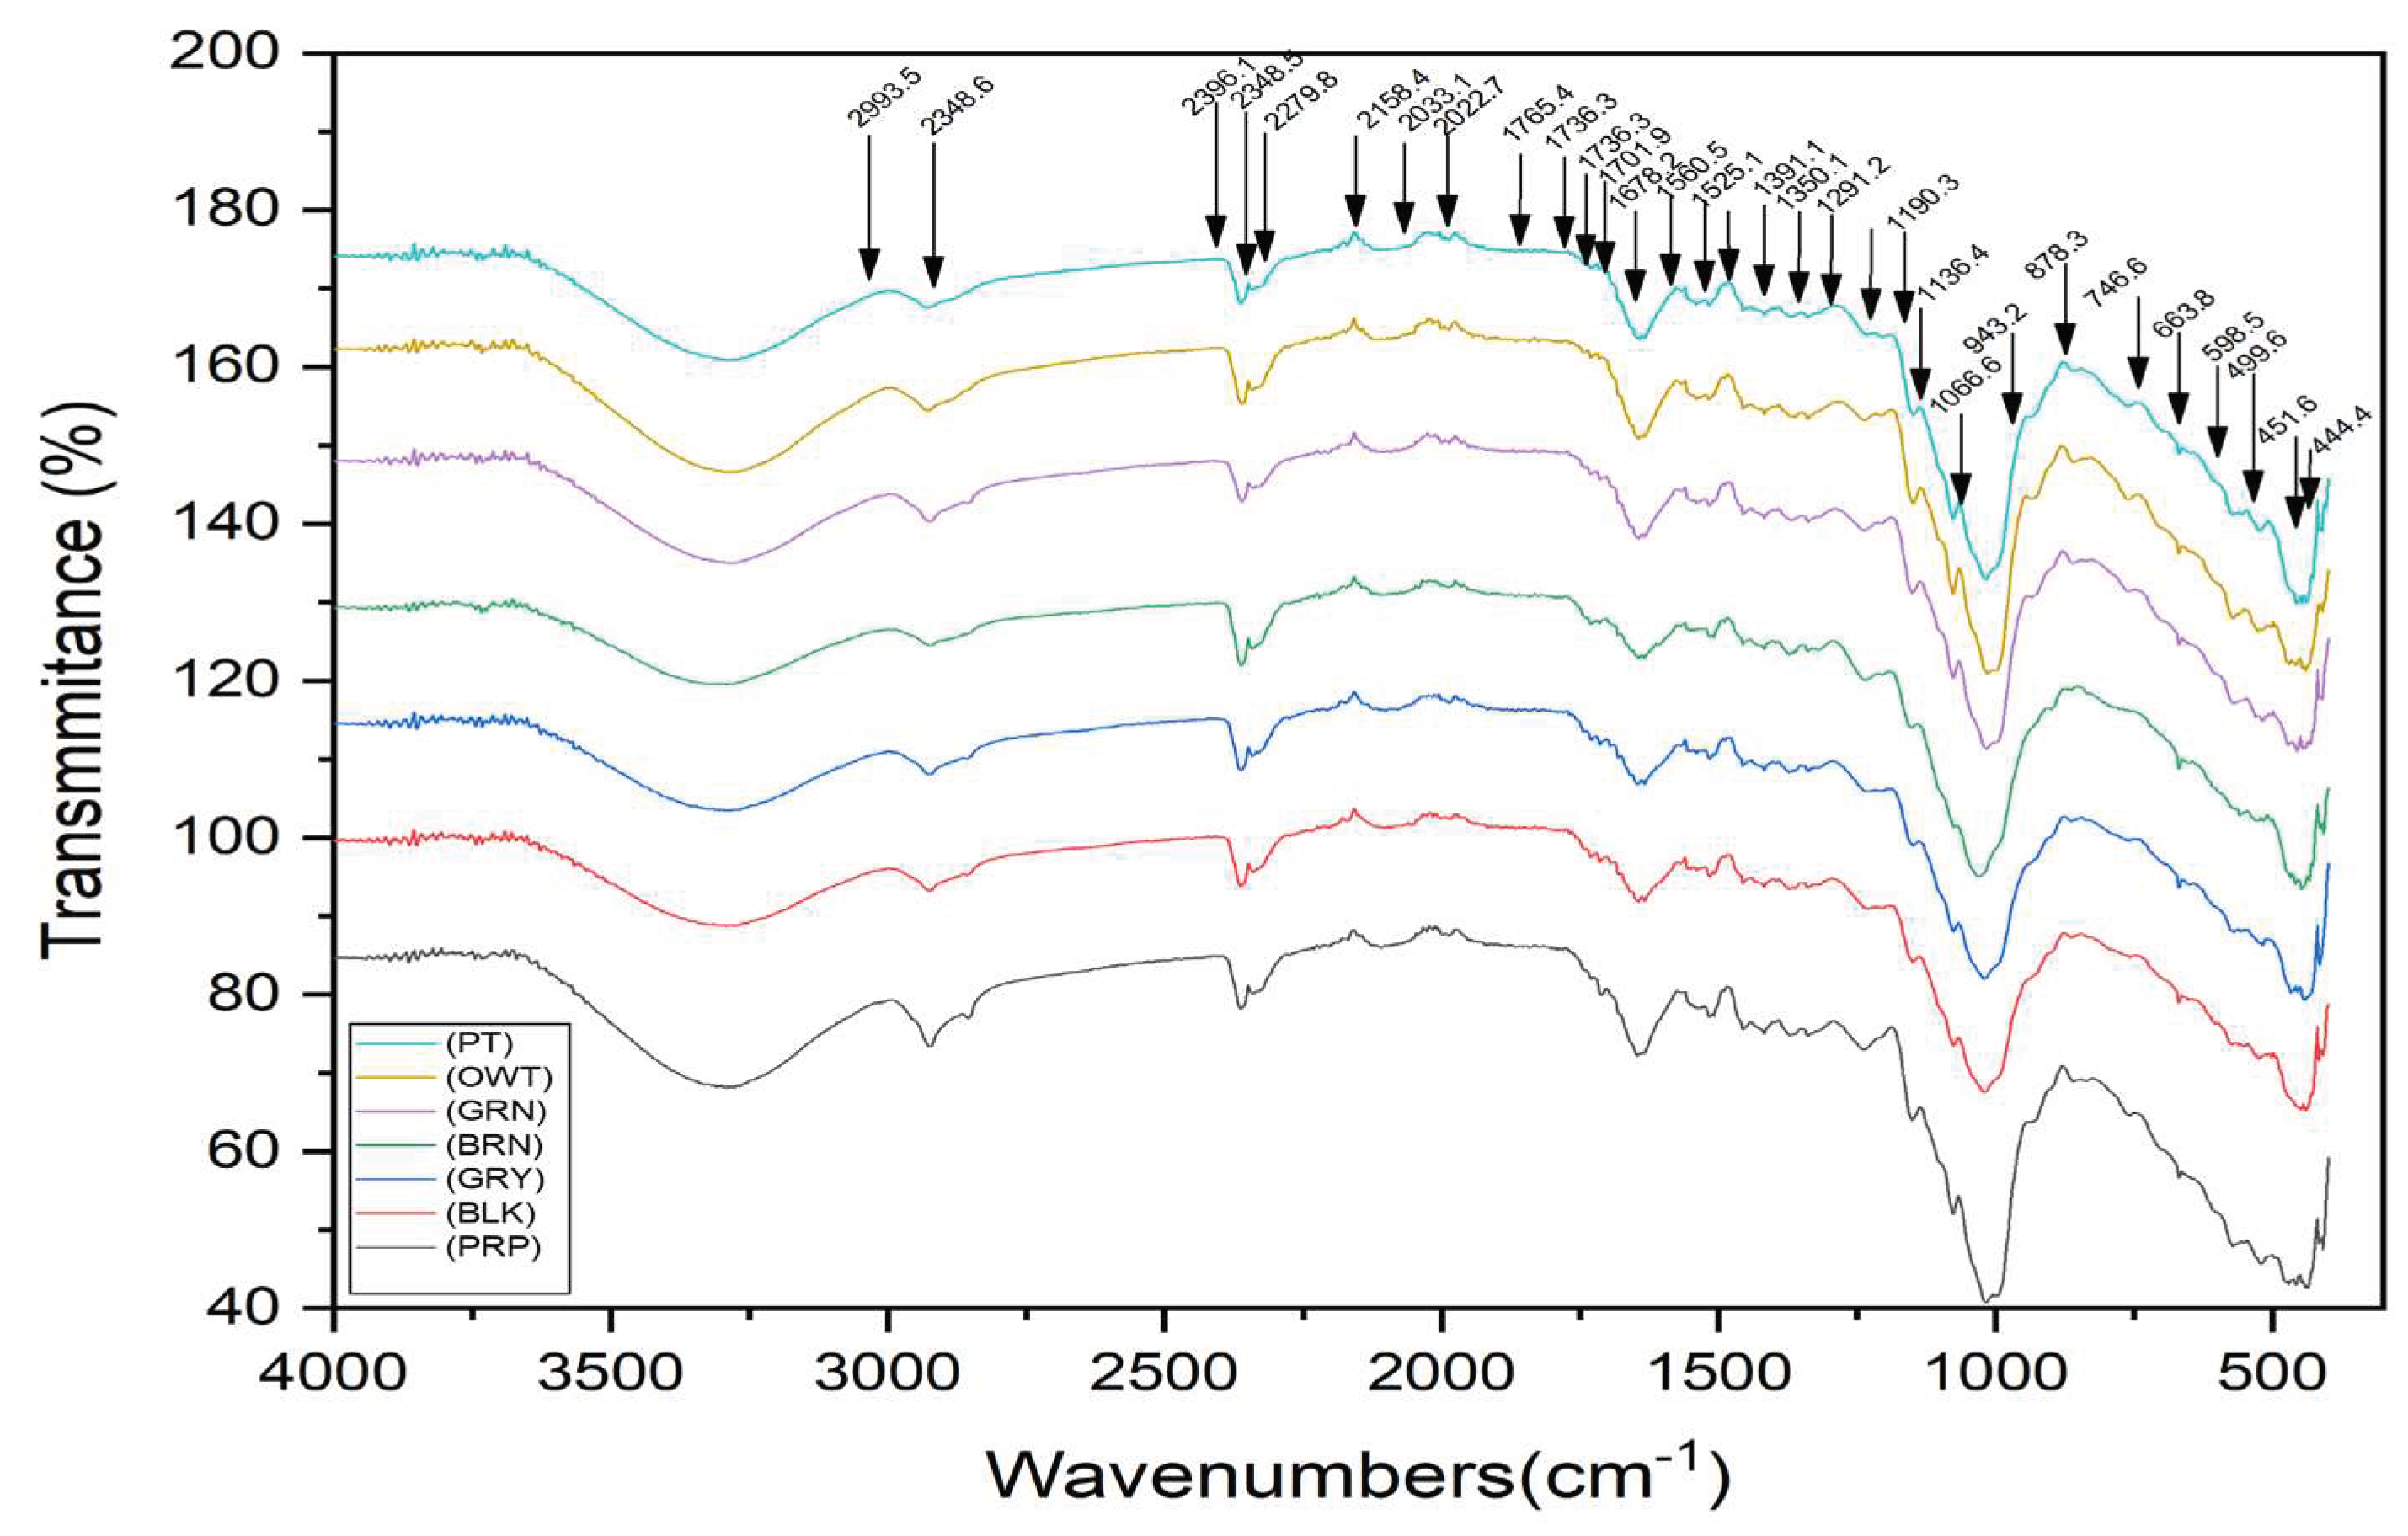
Fourier Transform Infrared (FTIR) is used for qualitative and quantitative assays with minimal sample preparation to outlook vibration of bonds within functional group leading to the metabolic fingerprint out of the molecule [33]. Comparative IR spectra of seven indigenous Adlay flours have been produced in Figure 5.
For simplicity, each spectrum in Figure 5 has been viewed by two distinct frequency ranges according to its placement and application. Frequencies (υ expressed in cm-1) possessing well-defined origins and are shared among all samples are enlisted in Table 4.
The frequencies distributed unevenly among the samples and are elaborative only in combination with other frequencies, origin (s), or when multiple functional groups are considered simultaneously, due to their extensive data size, are illustrated in Supplementary Table S1.
Frequencies consisting of 3350-3653 cm-1, ~3000 cm-1, 2348/2398 cm-1, 1719/1721 cm-1, 1702/1709 cm-1, 1677/1678 cm-1, 1134/1140 cm-1, and 1088/1069 cm-1 represent functional groups or bonds observable among all samples. A distinctive peak characterized by a single, broader/wider, or bold, or semi-global/rounded shape at 3350-3653 cm-1 is always indicative of carboxylic acid, aldehyde/ketone, carbohydrates, aliphatic/acrylic alcohols, and or other related compounds [34,35]. Likewise, the well-known frequency at ~3000 cm-1 is always associated with -CH3 or >CH2 symmetrical stretch (C-H bond), is an inherent feature of the fundamental molecular structure, universally present in organic molecules [36]. Nevertheless, such frequencies are not usable as they are evenly distributed across all samples.
The frequencies which limit indigenous Adlay accession flours, enlisted in Supplementary Table S1, can be categorized further into specific regions consisting of FPR (fingerprint region of protein) from 1500 cm-1 to 1678 cm-1 and NBR (narrow band region) 1188/1199cm-1 to 1577cm-1 in association with combination bands (“Comb band”) and or overtones (1600-2000 cm-1). Additionally, there is the “OOP” (out of the plane region) 631/632 cm-1 to 943/945 cm-1, which intermingles with the FPR region to pose ring substitutions and ring isomerism. The comparative results of this data information are summarised in the ‘remarks column’ of Supplementary Table S2. Further, when a frequency does not distinctly belong to a particular group, it is categorised as such [27]. Briefly, vibrations in the range 410 cm-1 to 2279/2281 cm-1 indicate single or multiple functional groups present in a sample alone or multiple samples. The stretching frequencies 1134/44 and 1069/66 (vibration of ester group C-O bond) can be interpreted in conjunction with the FPR or OOP region [34]. The frequencies at 738 and 687cm-1 indicate ortho substitution, whereas 720 cm-1 and 878 cm-1 are significant in the context of 1,3,5-trisubstituted compounds. Similarly, frequency 1677/1678 cm-1 suggests esters, dienes, trienes, or saturated alcohol groups present in six flours with the exception of PRP wild Adlay accession. The frequency 2158/2159cm-1 is standard across all flours and indicates the isothiocyanate (-SCN) group [33]. The frequency 2149cm-1 is present only in BLK Adlay and marks R-N+≡C- or iso-nitrile group, whereas 1686cm-1 is present only in GRY Adlay flour, indicating the R-HC=N- group [33]. In both PRP and GRY Adlay flours, frequency 2863/2865 cm-1 serves as a distinguishing feature attributed to H-C=O group, as elaborated in Supplementary Table S2 in the remark’s column. With this approach, functional groups/ bonds are proportional to the number of vibration (s) frequency present in a spectrum provided factors such as resonance and or bonded hydrogen or others are considered the same and equally among all samples. BLK Adlay expressed a higher number of frequencies (53) corresponding to the equivalent number of functional groups followed by PRP and YLW (46 each), OWT, GRN and BRN (43 each) and GRY (42), respectively. Frequencies differences 1492/1493cm-1 (~1500 cm-1) - 656cm-1 corresponding to serial number 26-35 (Supplementary Table S2) profoundly discriminated flours in the context of FPR or NBR in association with Comb band and or overtones attributed of resonance and ring ‘OOP’ bending/scissoring, stretching frequencies.
In the regions 680-710 cm⁻¹ and 720-760 cm⁻¹, the absence of frequency implicates a lack of aromatic characteristics in lieu of the typical association of ring C=C bonds in this region. But vibrations at 745 cm⁻¹/747 cm⁻¹, 876 cm⁻¹/878 cm⁻¹, 877 cm⁻¹/905 cm⁻¹, 687 cm⁻¹, 738 cm⁻¹, and 410 cm⁻¹/419 cm⁻¹, coupled with the absence of well-defined peaks beyond 3000 cm⁻¹ due to various factors suppressing arenes, strongly suggest the presence of ring C=C bonds (arene). This interpretation is reinforced by the absence of frequency 895 cm⁻¹ - 915 cm⁻¹ and 985 cm⁻¹ - 995 cm⁻¹ attributed to alkene C=C bond vibrations (as illustrated in Supplementary Table S2). From this insight, PRP and YLW Adlay flours contain ortho/para substitutions or a combination of both in lieu of frequency 745 cm⁻¹/747 cm⁻¹ or, more specifically, 1,2,3,4 or 1,2,4,5 or 1,2,3,5 or 1,3,4,5-tetra substitutions attributed to 876 cm⁻¹/ 878 cm⁻¹ frequency. OWT and BLK accessions exhibit a slight difference due to frequency 845 cm⁻¹/849 cm⁻¹ (indicative of para substitution) and, in some cases, both ortho/para substitutions. Moreover, OWT and BLK Adlay flours are distinguishable by 877 cm⁻¹/905 cm⁻¹ signifying penta- substitutions and frequency 410 cm⁻¹/419 cm⁻¹ pointing hexa- substitutions [33]. In BRN Adlay, the combination of frequencies 687 cm⁻¹ and 738 cm⁻¹ suggests mono-substitution, 738 cm⁻¹ corresponds to ortho and/or 1,3,5-tri substitutions or vibration at 687 cm⁻¹ also indicates alkyl iodide (R-I stretch). GRY flour stands out with its unique absorbance of 878 cm⁻¹, signifying 1,2,3,4 or 1,2,3,5 or 1,3,4,5-tetra substitutions and/or penta- substitution. In the GRN flour spectrum, the vibration at 744 cm⁻¹ suggests ortho isomerism, whereas 827 cm⁻¹/828 cm⁻¹ indicates para isomerism and/or 1,2,3,4 or 1,2,3,5 or 1,3,4,5-tetra substitutions. The background frequency of 880 cm⁻¹ further supports the presence of penta-substitutions.

3. Experimental sections

3.1. Materials

Indigenous Adlay accessions were collected from various outlets, including the Plant Genetic Resources Institute, National Herbarium, National Agricultural Research Centre (NARC), and Margalla Hills in Islamabad. Collections were carried out during the period January-February 2021. Subsequently, the collected samples were subjected to a series of preparation steps, including drying, cleaning, and sorting the grains based on their morphological features comprising size, shape, appearance, and colour. Prior to the milling process conducted in a Cyclone Mill, the grains were subjected to winnowing, moistening, and manual pounding in a laboratory-scale Mortar and Pestle until their shells became pliable. Following air drying, the resulting flour was successively milled using a China mill and then a Cyclone Mill until it could pass through a 100-mesh sieve. Following the detailed methodology, the milled flour was preserved in an airtight polythene container [8,9]. The flours were labelled with acronyms corresponding to the grain colors, such as BLK (black), PRP (purple), BRN (brown), YLW (yellow), GRY (grey), OWT (off white), and GRN (green), and were stored in airtight polythene containers for subsequent analysis, following established standard procedures.

3.2. Physical characteristics determination of Adlay seed

A comprehensive analysis of the physical attributes of indigenous adlay, consisting of texture, bulk density, specific density, bulk porosity (representing % empty spaces), 1000-grains weight, bead dimensions (length, breadth, thickness), length-to-breadth ratio (lbr) indicative of shape, and the quality index (lbr/t) was done following routine procedures [37]. Specific density (g/mL³) was determined using isobutane and cyclo-hexane. Moisture content was assessed using a digital grain moisture tester from Kett®, Germany, designated as PB 1D2. The calibration process was carried out with a standard plate supplied by the PB 1D2 Tester, with the plate maintaining a precise weight of 20 grams, accurate to within ±0.1 gram, as provided by the instrument’s specifications.

3.3. Physicochemical, triglycerides composition and functional groups determination

The primary instrumentations used in this study included Gas chromatograph with Flame Ionization Detector (GCFID 7890A system, USA), a Fourier Transform Infrared (FTIR) spectrophotometer (Brüker Vertex 30, Germany), an Atomic Absorption Spectrophotometer (Varian, USA), and NMR analyzer (4000 Oxford, USA), UV-vis 1800 Shimadzu, Japan, and a muffle furnace. A Supelco © 37-component mixture of fatty acid methyl esters (FAME) standard was procured from Aldrich for triglycerides analysis. De-ionized water was consistently employed throughout the analysis.

3.3.1. Physicochemical parameters measurement

Adlay flour (100g) was defatted using n-hexane in a Soxhlet apparatus extraction assembly. Crude fat on a dry weight basis was determined following standard procedures outlined in the AOAC method 920.85; 2019. The fat content was also quantified using Nuclear Magnetic Resonance (NMR) to compare absolute values with the estimated oil content. The Kjeldahl standard method was employed to determine the protein content in the Adlay flour. This method utilised the SH220N Graphite digester and K9840 auto Kjeldahl distillation unit (Hanon Instrument, China). The protein content was calculated using the conversion factor ‘6.25’ as given below.
%Protein = N x 6.25 x 100
where N represents the number of moles of sample calculated as follows:
N = X moles / 1000 cm3 X (Vsmp - Vblk) cm3 / mg X 14 g / moles X 100

3.3.2. Ash, crude fiber, and mineral determination

Briefly, defatted flour (50g) was digested in 1.25% H2SO4 for 30 minutes and subsequently with 1.25% NaOH in the same manner. After filtration, residues were dried, weighed, and transformed to ash employing a muffle furnace following standard AOAC method 945.26 (2019). Crude fiber was calculated by Eq. as given below.
% C r u d e   f i b e r = W e i g h t   o f   r e s i d u e W e i g h t   o f   a s h W e i g h t   o f   s a m p l e x   100
Minerals P, K, Ca, Na, and B and Fe, Cu, Zn, Mn, were determined following AOAC methods (2019). After acid digestion. Fe, Cu, Mn, and Zn were estimated using Atomic Absorbance Spectrophotometer (Varian®) while P, K, B, Ca, and Na absorbance was measured on Shimadzu® Spectrophotometer (UV-1800) at wavelength λ= 410nm using KH2PO4 as standard following working line Y = 0.082x; R2 =0.998 with Limit of Determination (LoD) = 0.5ppm. Carbohydrate content was determined as the difference between the total weight (100%), subtracting % contents of protein, oil, moisture, and digestible fiber/ash.

3.3.3. Triglyceride composition determination

The analytical sample was prepared following the established FAME (fatty acid methyl esterification) method outlined [21] with minor modifications. Briefly, methylating agent was prepared by dissolving Sodium methoxide powder (CH3NaO =10g) portion wise in 500mL methanol (½ N). Adlay flour (0.2g) was vigorously shaken with 2 mL petroleum ether in a plastic-capped capsule container for 10 minutes. Subsequently, 1.0 mL of a methylating agent was added to the resulting supernatant (0.5 mL) and vigorously shaken. To this solution, 1.0 mL of 10% NaCl solution in methanol was added before its application onto the Agilent® system 7890A. The composition of adlay oil triglyceride was determined following the standard method [38] with slight modification. Briefly, the GCFID method for FAME testing was validated using a capillary column HP-5. The analytical conditions involved maintaining the injector and detector temperatures at 210°C and 220°C, respectively, with a split ratio of 1:5, Helium flow rate set at 1 mL/sec, and the ramping was initiated at 150°C for 1 minute, followed by an increase of 10°C/minute until it reached 210°C, and hold for 1.0 minute.

3.3.4. Functional groups/bonds frequencies determination in Adlay flour using FTIR

Infrared spectra were obtained using a Fourier Transform Infrared (FTIR) spectrometer (Brüker Vertex 30 model), equipped with an attenuated total reflectance (ATR) accessory. The spectra were recorded over the frequency range 410 cm-1 to 3670 cm-1 following slightly modified methods [21,30].

4. Conclusion

Wild Adlay characteristics, including physical attributes, chemical composition, triglyceride composition, and functional groups, have been discussed in the current study to explore it as a cereal crop. Statistically, no significant relationship exists among physical characteristics. Brown genotype contained the highest protein (15.8%), fiber (2.37%) and oil (4.78%) contents. Spectrophotometer analysis of Adlay seeds showed phosphorus, potassium, calcium, and sodium concentrations 0.3, 0.45, 1.4, and 2.1% as well as microminerals boron, iron, copper, zinc, and manganese concentrations 3.2, 1.6, 20.8, 17.61, and 4.4 mg/kg, respectively Triglyceride composed of unsaturated fatty acids as the major fraction (53.1%) with linoleic acid as the major contributor (38.73%), followed by oleic acid (4.2%). The highest number of functional groups in black Adlay are promising for its varietal development.

Supplementary Materials

The following supporting information can be downloaded at the website of this paper posted on Preprints.org.

Author Contributions

Conceptualization, R.A. and M.L.; methodology, A.M.; software, R.A., M.J. and I.K.; validation, A.M., M.J. and I.K., M.L.; formal analysis, R.A., I.K.; investigation, M.L., Au.M. and A.A.; resources, M.A.F., K.M.A. and M.L.; data curation, A.A., I.K.; writing—original draft preparation, M.L., R.A.; writing—review and editing, A.A., Au.M., M.A.F., K.M.A; visualization, I.K.; supervision, M.L., S.S.; project administration, M.L., S.S.; funding acquisition, M.A.F., K.M.A. All authors have read and agreed to the published version of the manuscript.

Funding

This research was supported by the Researchers Supporting Project Number (RSP2024R154), King Saud University, Riyadh, Saudi Arabia.

Institutional Review Board Statement

Not applicable.

Informed Consent Statement

Not applicable.

Data Availability Statement

The data is available in the Supplementary Material.

Acknowledgments

The authors are very grateful to Zulifqar Ali Gurmani, Program Leader (Fodder and Forage Program), and Amir Sultan (PSO), and Muhammad Shabir from the National Agricultural Research Center (NARC), Islamabad, for providing analytical support. The authors also sincerely thank the Researchers Supporting Project Number (RSP2024R154), King Saud University, Riyadh, Saudi Arabia, for providing support.

Conflicts of Interest

The authors declare no conflicts of interest.

References

  1. Ali, A.; Cottrell, J.J.; Dunshea, F.R. Characterization, Antioxidant Potential, and Pharmacokinetics Properties of Phenolic Compounds from Native Australian Herbs and Fruits. Plants 2023, 12, 993. [Google Scholar] [CrossRef] [PubMed]
  2. Zahid, H.F.; Ali, A.; Ranadheera, C.S.; Fang, Z.; Ajlouni, S. Identification of phenolics profile in freeze-dried apple peel and their bioactivities during in vitro digestion and colonic fermentation. Int. J. Mol. Sci. 2023, 24, 1514. [Google Scholar] [CrossRef]
  3. Ali, A.; Cottrell, J.J.; Dunshea, F.R. Identification and characterization of anthocyanins and non-anthocyanin phenolics from Australian native fruits and their antioxidant, antidiabetic, and anti-Alzheimer potential. Food Res. Int. 2022, 162, 111951. [Google Scholar] [CrossRef]
  4. Weng, W.F.; Peng, Y.; Pan, X.; Yan, J.; Li, X.D.; Liao, Z.Y.; Cheng, J.P.; Gao, A.J.; Yao, X.; Ruan, J.J.; Zhou, M.L. Adlay, an ancient functional plant with nutritional quality, improves human health. Front.Nutr. 2022, 9, 1019375. [Google Scholar] [CrossRef] [PubMed]
  5. Li, X.K. Research progress on chemical constituents and pharmacological effects of Coicis Semen. Chinese Tradational Herb Drugs. 2020, 24, 5645–5657. [Google Scholar]
  6. Igbokwe, C.J.; Wei, M.; Feng, Y.; Duan, Y.; Ma, H.; Zhang, H. Coix seed: A review of its physicochemical composition, bioactivity, processing, application, functionality, and safety aspects. Food Rev. Int. 2022, 38(sup1), 921–939. [Google Scholar] [CrossRef]
  7. Devaraj, R.D.; Jeepipalli, S.P.; Xu, B. Phytochemistry and health promoting effects of Job’s tears (Coix lacryma-jobi)-A critical review. Food Biosi. 2020, 34, 100537. [Google Scholar] [CrossRef]
  8. Zeng, Y.; Yang, J.; Chen, J.; Pu, X.; Li, X.; Yang, X.; Yang, L.E.; Ding, Y.; Nong, M.; Zhang, S.; He, J. Actional mechanisms of active ingredients in functional food adlay for human health. Molecules 2022, 27, 4808. [Google Scholar] [CrossRef]
  9. Soni, J.K.; Lalramhlimi, B.; Kumar, A.; Navik, O.; Sailo, L.; Doley, S. Coix: an underutilized functional food crop of Mizoram. Genetic Resources and Crop Evolution. 2023, 1, 1–7. [Google Scholar] [CrossRef]
  10. Deng, S.F.; Ying, Z.Y.; Yang, Y.Q.; Lin, Z.G.; Chen, M. Research progress of functional ingredients on adlay. Chin Agri Sci Bullet. 2017, 33, 123–128. [Google Scholar]
  11. Andriansyah, R.C.E.; Hidayat, D.D.; Kuala, S.I.; Luthfiyanti, R.; Surahman, D.N.; Indriati, A.A. Comparative Study between Wild and Cultivated Varieties of Adlay Grains for Some Engineering Properties. In Proceedings of the 16th ASEAN Food Conference (16thAFC2019)-Outlook and Opportunities of Food Technology and Culinary for Tourism Industry; 2019; pp. 104–113, ISBN 978-989-758-467-1. [Google Scholar]
  12. Xi, X.J. Zhu, Y.G.; Tong, Y.P.; Yang, X.L.; Tang, N.N.; Ma, S.M.; Cheng, Z. Assessment of the genetic diversity of different Job’s tears (Coix lacryma-jobi L.) accessions and the active composition and anticancer effect of its seed oil. PloS one. 2016, 11, e0153269. [Google Scholar] [CrossRef]
  13. Hou, J.J.; Cao, C.M.; Xu, Y.W.; Yao, S.; Cai, L.Y.; Long, H.L.; Guo, D.A. Exploring lipid markers of the quality of coix seeds with different geographical origins using supercritical fluid chromatography mass spectrometry and chemometrics. Phytomedicine 2018, 45, 1–7. [Google Scholar] [CrossRef]
  14. Wen, A., Xie, C., Mazhar, M., Wang, C., Zeng, H., Qin, L. and Zhu, Y., 2020. Tetramethyl pyrazine from Adlay (Coix lacryma jobi) biotransformation Bacillus subtilis and its quality characteristics. J Food Sci Technol. 2020, 57, 4092–4102.
  15. Mendoza, A.J.A.; Sabellano, F.M., Jr. Baco, L.T.; Nabua, W.C.; Pantallano, E.S. Varietal performance of Adlai (Coix lacryma-jobi L.). NMSCST Research Journal 2015, 3, 139–147. [Google Scholar]
  16. Vujic, D.N.; Acanski, M.M. Performance of GCMS for differentiation of various types of flours by creating dendrogram of Lipid soluble extract. CI&CEQ. 2012, 18, 555–581. [Google Scholar] [CrossRef]
  17. Liaotrakoon, W.; Liaotrakoon, V.; Wongsaengtham, W.; Rodsiri, S. Influence of dry-and wet-milling processes on physicochemical properties, syneresis, pasting profile and microbial count of job’s tear flour. Int. Food Res. J. 2014, 21, 1745–1749. [Google Scholar]
  18. Ding, Y.; Zhang, G.; Ni, C.; Yu, G.; Cheng, J.; Zheng, H. Understanding the mechanism of change in morphological structures, visualization features, and physicochemical characteristics of adlay seeds (Coix lacryma-jobi L.): The role of heat soaking. J Cereal Sci. 2020, 91, 102892. [Google Scholar] [CrossRef]
  19. Zhang, H.; Yuan, Y.; Zhu, X. Xu, R.; Shen, H.; Zhang, Q.; Ge, X. The Effect of Different Extraction Methods on Extraction Yield, Physicochemical Properties, and Volatile Compounds from Field Muskmelon Seed Oil. Foods 2022, 11, 721. [Google Scholar] [CrossRef]
  20. Xu, L.; Chen, L.; Ali, B.; Yang, N.A.; Chen, Y.; Wu, F.; Jin, Z.; Xu, X. Impact of germination on nutritional and physicochemical properties of adlay seed (Coixlachryma-jobi L.). Food chem. 2017, 229, 312–318. [Google Scholar] [CrossRef]
  21. Liu, X.; Zhang, X.; Rong, Y.Z.; Wu, J.H.; Yang, Y.J.; Wang, Z.W. Rapid determination of fat, protein, and amino acid content in coix seed using near-infrared spectroscopy technique. Food Anal Methods. 2015, 8, 334–342. [Google Scholar] [CrossRef]
  22. He, C.J.; Li, Z..; Liu, H.; Zhang, H.; Wang, L.; Chen, H. Chemical compositions and antioxidant activity of adlay seed (Coixlachryma-jobi L.) oil extracted from four main producing areas in China. J food Sci. 2020, 85, 123–131. [CrossRef]
  23. Zhao, W.Y.; Gong, Y.; Huang, S.; Yu, H.; Lu, Y. Optimization, and kinetics for the refluxing extractions process of Coix seed oil. Chin J Bioproc Eng E. 2010, 8, 1–5.
  24. Fatima, A., Ali, S., Ijaz, M., Mahmood, R., Sattar, S., Khan, J., and Ahmad, M. Boron application improves the grain yield and quality of fine grain rice cultivars in Punjab, Pakistan. Pak. J. Agri. Sci. 2018, 55, 761–766.
  25. Hore, D.K.; Rathi, R.S. Characterization of Job’s tears germplasm in North-East India. Nat. Prod. Radiance. 2008, 6, 50–54. [Google Scholar]
  26. Coludo, F.E.; Janairo, G.C. Effects of Soil Chemistry on the Physico-Chemical Characteristics of the Grains of Adlay (Coix lacryma-jobi Linn) Grown in Bukidnon, Philippines. Ann. Trop. Res. 2015, 2015 37, 26–43. [Google Scholar] [CrossRef]
  27. Hu, A.; Zhang, Z.; Zheng, J.; Wang, Y.; Chen, Q.; Liu, R.; Liu, X.; Zhang, S. Optimizations, and comparison of two supercritical extractions of adlay oil. IFST . 2012, 13, 128–133.
  28. Lawrence, G.D. Dietary fat and health: dietary recommendations in the context of scientific evidence. Adv Nutr. 2013, 4, 294–302. [Google Scholar] [CrossRef]
  29. Mensink, R.P.; Zock, P.L.; Kester, A.D.; Katan, M.B. Effects of dietary fatty acids and carbohydrates on the ratio of serum total to HDL cholesterol and on serum lipids and apolipoproteins: a meta-analysis of 60 controlled trials. Am J Clin Nutr. 2003, 77, 1146–55. [Google Scholar] [CrossRef]
  30. Ni, C.; Li, B.; Ding, Y.; Wu, Y.; Wang, Q.; Wang, J.; Cheng, J. Anti-cancer properties of coix seed oil against HT-29 colon cells through regulation of the PI3K/AKT signaling pathway. Foods 2021, 10, 2833. [Google Scholar] [CrossRef]
  31. Peng J, Gao W, Peng C, He C, Zhang Q, Bi W. Characteristics of germplasm resources in Coix from Xishuangbanna. Zhongguo Zhong Yao Za Zhi. 2010, 35, 415–418, In Chinese. [PubMed]
  32. Yang, Y.; Du, S.Y.; Sun, Y.Q.; Han, T.; Jia, M.; Qin, L.P. Determination of effective contents triolein and coixol in Coix lacryma jobi var. mayuen from different origins. Chin Trad Herb Drugs 2017, 48, 578–558. [Google Scholar]
  33. Kuhnen, S.; Ogliari, J.B.; Dias, P.F.; Boffo, E.F.; Correia, I.; Ferreira, A.G.; Maraschin, M. ATR-FTIR spectroscopy and chemometric analysis applied to discrimination of landrace maize flours produced in southern Brazilian. Int. J. Food sci. Technol. 2010, 45, 1673–1681. [Google Scholar] [CrossRef]
  34. Ali, M.; Al-Hattab.T.; Al-Hydary. Extraction of date palm seed oil (Phoenix dactylifera) by soxhlet apparatus. IJAET 2015, 8, 261–271.
  35. Abdul, R.; Che, M.Y.B. Determination of extra virgin olive oil in quaternary mixture using FTIR spectroscopy and multivariate calibration. Spectroscopy. 2011, 26, 203–211. [Google Scholar]
  36. Timilsena, Y.P.; Vongsvivut, J.; Adhikari, R.; Adhikari, B. Physicochemical and thermal characteristics of Australian chia seed oil. Food Chem. 2017, 228, 394–402. [Google Scholar] [CrossRef] [PubMed]
  37. Ahmad, R.; Gurmani, Z.A.; Khan, S.U. Quality characteristics integration and relationship in basmati rice is useful for checking adulteration and admixture. J. Agric. Crop Res. 2019, 7, 148–169. [Google Scholar] [CrossRef]
  38. Ratnayake, W.M.N.; Hansen, S.L.; Kennedy, M.P. Evaluation of the CP-Sil 88 and SP-2560 GC columns used in the recently approved AOCS Official Method Ce 1h-05: Determination of c/s-, trans-, saturated, monounsaturated, and polyunsaturated fatty acids in vegetable or non-ruminant animal oils and fats. JAOC. 2006, 83, 475–488. [Google Scholar] [CrossRef]
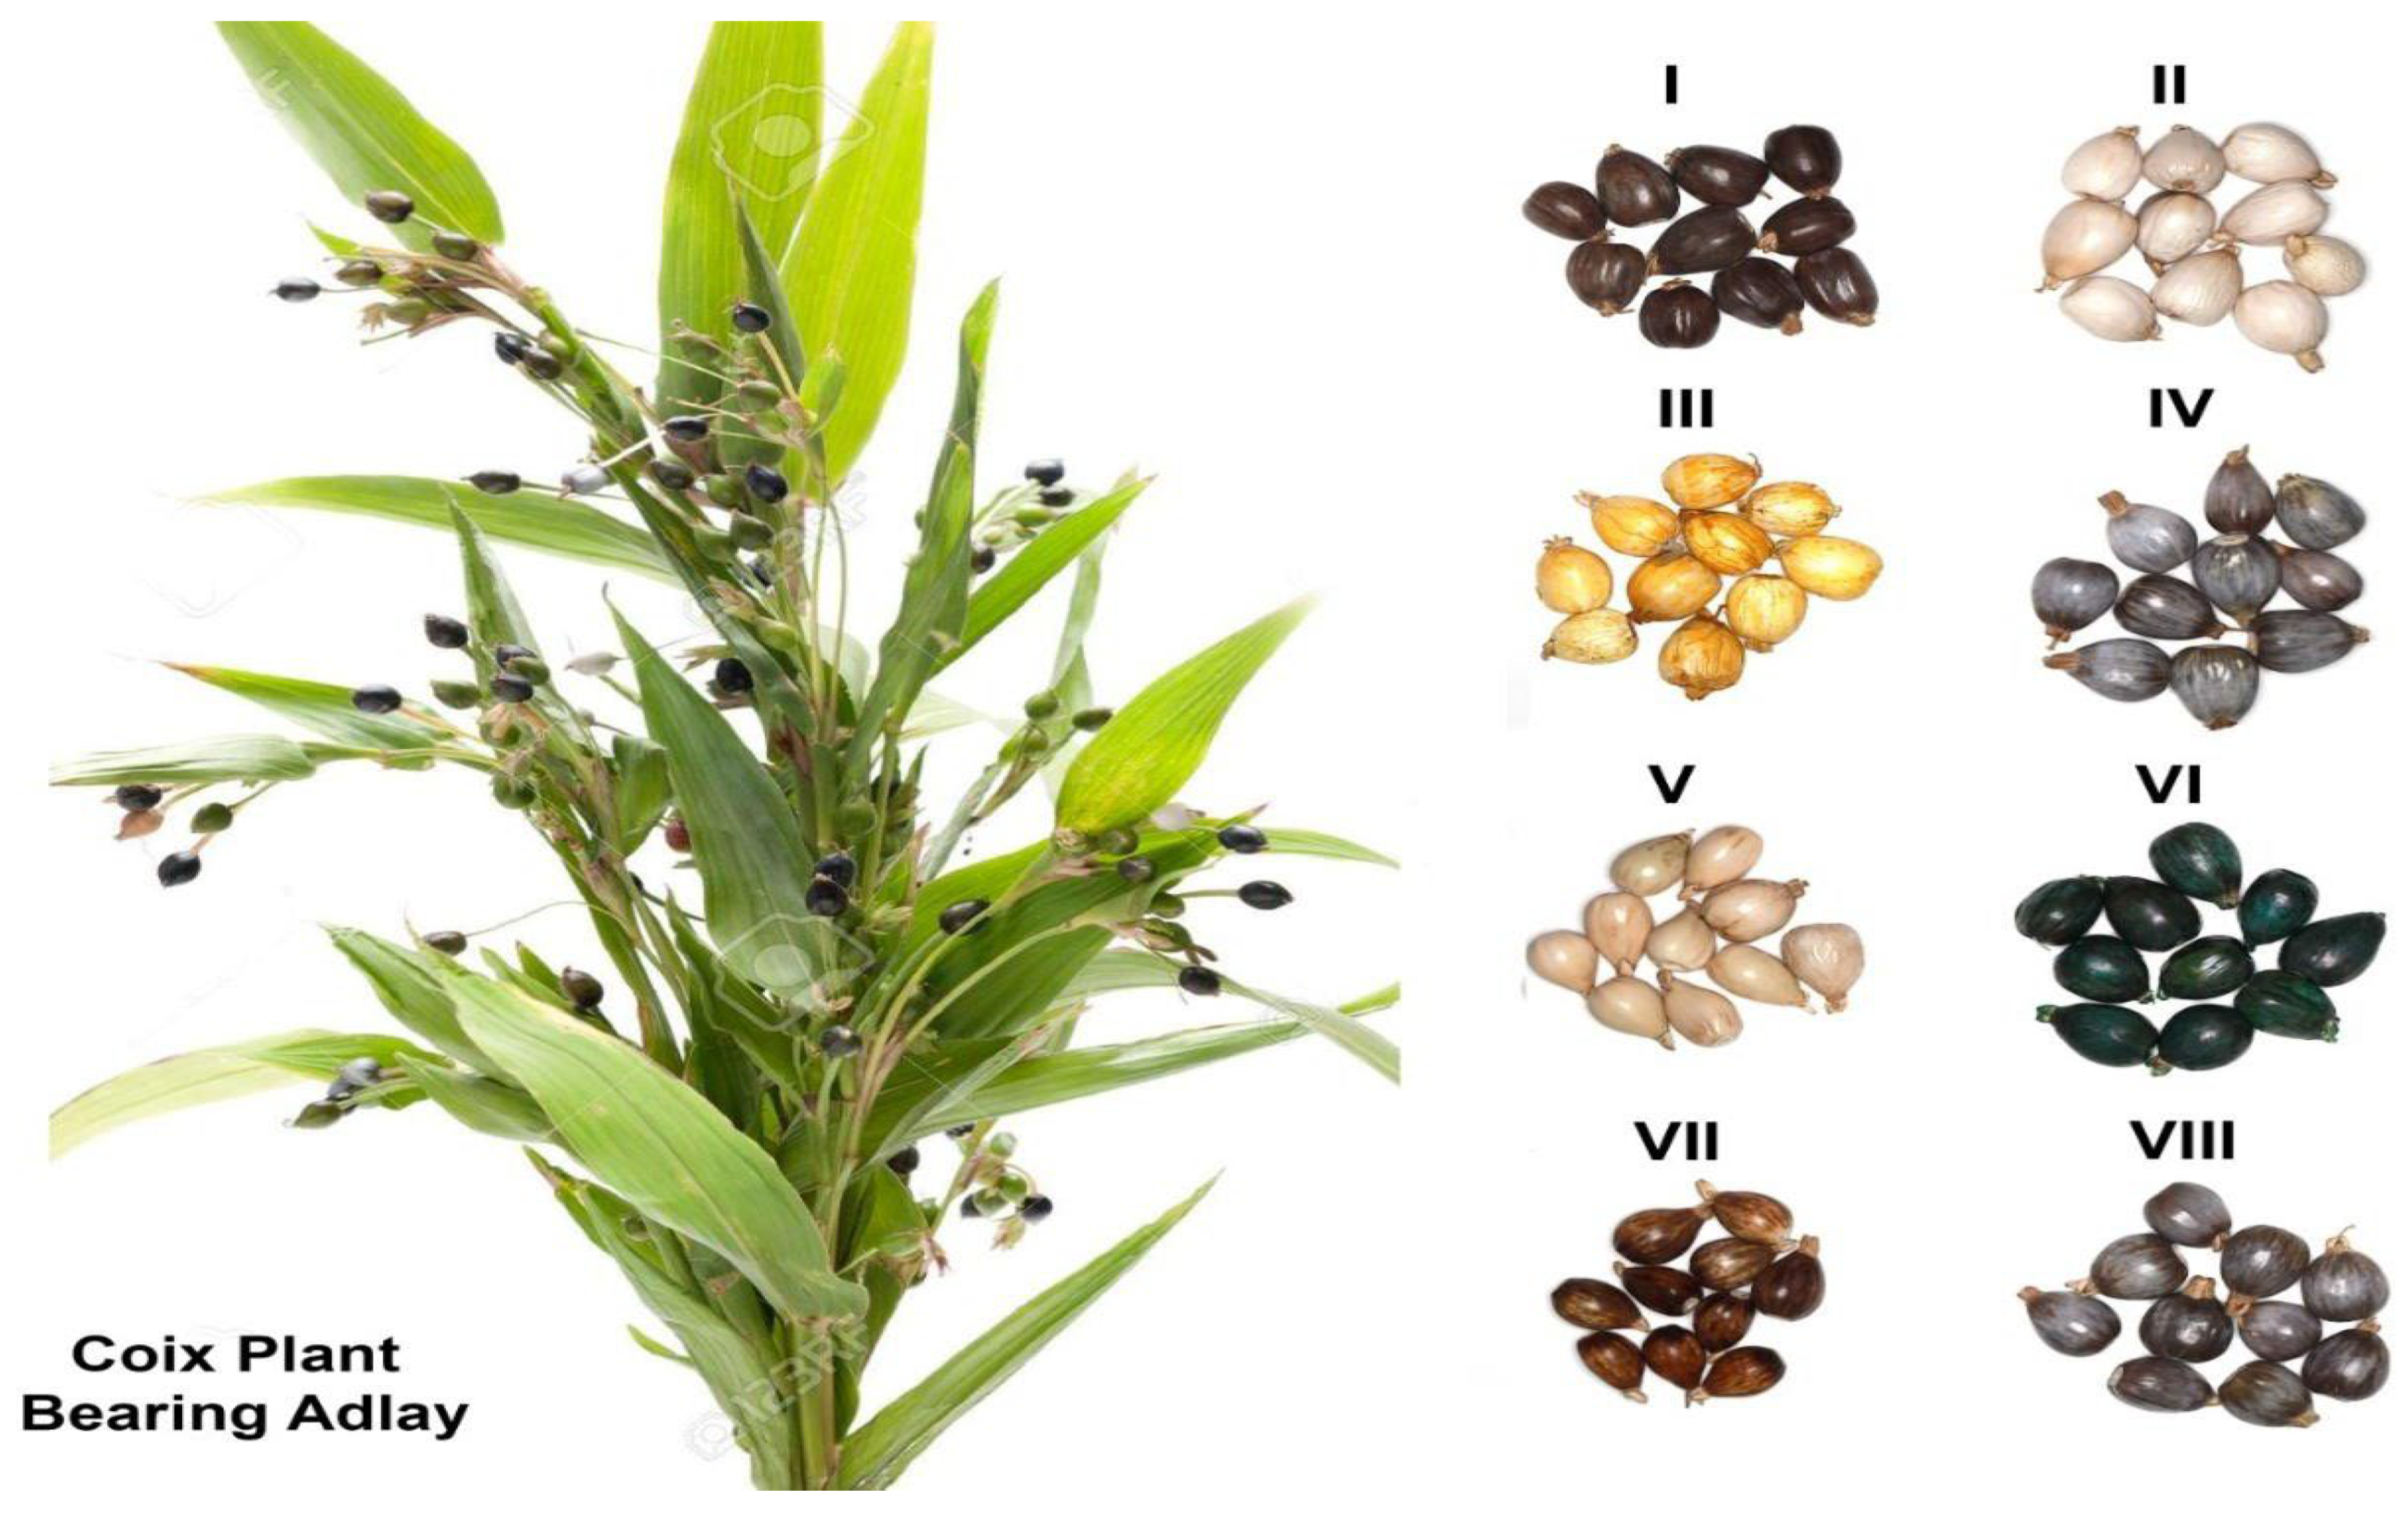
Figure 1. Physical characteristics of indigenous adlay accessions. I (Black), II (Off-white), III (Yellow), IV (Purple), V (Grey), VI (Black), and VII (Brown).
Preprints 98829 g001
Figure 2. Relationship between bulk density and corresponding grain count per 10g Adlay.
Preprints 98829 g002
Figure 3. PCA -Biplot constructed by physiochemical characteristics of indigenous adlay.
Preprints 98829 g003
Figure 4. PCA – Biplot constructed by indigenous adlay triglycerides fatty acids.
Preprints 98829 g004
Figure 5. FTIR spectra of indigenous `adlay accessions Black, Purple, Off-white, Grey, Green, Yellow, and Brown grains flours. The arrow (→) indicates the position where peaks give the impression.
Preprints 98829 g005
Table 1. Physical characteristics of indigenous adlay accessions.
Parameters Description Indigenous Adlay Collections (1000 Grains Each)
PRP BLK BRN GRN GRY YLW OWT Av: ±STDev
Shell texture Stony Stony Stony Hard Hard Stony Hard NA
Appearance* Shiny pears, Shiny, rounded Shiny, irregular Shiny, irregular Shiny, oval Shiny, rounded Shiny, pears NA
Grain count 35a 63b 60c 68d 105e 95f 144g 82 ± 36.03
Length (cm) 0.95a 0.84c 0.84c 0.91b 0.81d 0.78e 0.91b 0.86 ±0.062
Breadth (cm) 0.7c 0.63e 0.65d 0.8a 0.75b 0.65d 0.75b 0.71 ±0.064
Shape (lbr) 1.2b 1.33a 1.29a 1.14c 1.08c 1.19b 1.22b 1.04 ±0.46
bead dia(mm) 0.2a 0.2a 0.2a 0.2a 0.2a 0.2a 0.2a 0.2
bead vol mm3 0.295a 0.262b 0.264b 0.286a 0.255b 0.245b 0.287a 0.27 ±0.02
Weight (g) 0.286a 0.159b 0.17c 0.15c 0.1d 0.11d 0.07e 0.15±0.07
BD (g/ml3) 0.624a 0.61a 1.035b 0.863c 0.234d 0.34e 0.185f 0.45± 0.19
SD (g/mL3) ϯ 1.1a 1.02a 1.035a 0.863b 0.445c 0.56d 0.19e 0.745±0.35
GD (g/ml3) 0.031a 0.02b 0.02b 0.013c 0.004d 0.006d 0.001d 0.014 ±0.011
FD (g/mL3) 0.667b 0.966a 0.588b 0.5c 0.5c 0.476c 0.385d 0.58 ±0.19
BP (%) 63.6a 63.6a 45.6b 45.6b 52.73c 52.6c 53.5c 53.89 ±7.41
Results are average of three replicates; BD = bulk density; GD = grain density; SD = specific density, FD = flour density, BP = bulk porosity; across row, values in the cells with similar alphabets suffixes are comparable at α ≤ (0.05); ϯ stands for Isobutane and n-hexane use as medium for SD determination. * lbr ≤ 2.0 = rounded shape and lbr ≥ 3.0 = slender shape.
Table 2. Physicochemical characteristics indigenous adlay collections.
Proximate Parameter Indigenous Adlay Collections
PRP BLK BRN GRN GRY YLW OWT Av: ±STDEV
moisture (%) 11.9c 11.9c 12.2b 13.2a 11.6d 12.2b 12b 12.4 ±0.51
protein (%) 15.57b 15.63b 15.8a 12.01e 15.58b 14.30c 13.73d 14.66 ± 1.4
oil (%) NMR 4.29a 4.51a 4.78a 4.13b 4.63b 4.77b 4.07c 4.45 ±0.294
Extract 4.31c 4.57b 4.76a 4.07d 4.69b 4.71b 4.19c 4.5 ± 0.3
fiber (%) 1.79e 1.98b 2.37a 1.94b 1.97b 2.21d 1.88e 2.02 ±0.2
ash (%) 2.6a 2.0b 1.88c 2.63a 2.0b 1.95b 2.63a 2.24 ±0.36
P (%) 0.232c 0.2d 0.2d 0.3a 0.27b 0.23c 0.25c 0.3 ±0.04
K (%) 0.34c 0.3c 0.28d 0.48b 0.64a 0.42b 0.68a 0.45 ±0.16
Ca (%) 1.2c 0.9d 1.3c 2.1a 1.5b 2.2a 0.6e 1.4 ±0.6
Na (%) 0.28a 0.16b 0.28a 0.16b 0.17b 0.21c 0.2c 0.21 ±0.052
B (mg/Kg) 3.0c 4.0a 3.9a 3.41b 3.0b 2.0d 3.25b 3.2 ±0.7
Fe (mg/Kg) 2.9a 1.011e 2.3b 1.67c 1.045e 1.44d 1.0e 1.6 ± 0.73
Cu(mg/Kg) 43.53a 8.00e 37.0b 34.5c 15.3d 6.64f 0.56g 20.8 ±17.18
Zn (mg/Kg 36.623a 22.157b 1.27f 13.24d 9.2e 20.37c 20.37c 17.61±11.21
Mn (mg/Kg 5.8c 1.56e 8.3a 7.06b 2.04d 1.78e BDL 4.4 ±3.0
Results are an average of three replicates. Values in the cells with similar alphabets suffix are comparable at α ≤ (0.05). NMR stands for nuclear magnetic resonance.
Table 3. Fatty acid profile of Indigenous Adlay oils.
FAs (% av: ±STDEV) BLK BRN GRN OWT GRY YLW PRP Av ±SDEV
Palmitic (C16:0) (26.3 ± 4) 24.5d 27.5c 29.7b 30.1a 22e 20.6f 29.6b 26.3 ±1.4
Palmitolic (C16:1) ---- --- --- ---- --- 2.02 --- 2.02 ±0.0
Oleic (C18:1n9C (4.2±0.63) 3.7e 3.92d 4.2c 4.79b 3.5f 3.7e 5.2a 4.2 ±1.4
Linoleic(C18:2n6C)43.5±1.4 52.0a 43.5c 37.6d 34.7e 51b 52.5a 33.0f 43.5 ±1.4
Linolenic(C18:3n9C) 1.09c 0.99c 1.04c 1.01c 4.1b 5.8a ----- 2.4 ±1.4
Arachidic (C20:0) --- 2.35c --- --- 2.8b 1.31d 4.81a 2.82 ±1.5
eicosenoic (C20:1) (3.13 ±4) 3.8b ---- 1.96d 2.62c ---- 2.1d 11.4a 4.4 ±1.4
Behenic (C22:0) 3.1d 4.65b 3.71c 4.99a ---- 2.6e 5.3a 4.06 ±1.1
Lignoceric(C24:0) 4.7f 7.52d 9.89c 10.9a 3.5g 7.2e 10.62b 7.8 ±2.9
Solvent Extract Oil (%) 2.51b 2.91a 1.75e 1.91d 2.6a 2.68a 2.2c 2.4 ±0.43
ΣSFAs 32.3 39.67 43.3 45.99 38.3 31.71 5.40 33.8 ±13.58
ΣUSFAs 60.59 48.41 44.8 43.12 58.6 66.12 49.6 53.04 ±8.7
ΣMUFA 6.5 3.92 6.16 7.41 3.5 7.82 16.6 7.42 ±4.4
ΣPUFA 6.29 44.04 38.64 35.71 55.1 58.3 33.0 38.73 ± 7.2
n-3UFAs 1.09 0.99 1.04 1.01 4.1 5.8 ---- 2.38 ±2.1
Ratio of ΣUSFAs/ ΣSFAs 1.88 1.2 1.1 0.93 1.53 2.08 0.98 1.4± 0.45
SFAs = Saturated fatty acids, PUFAs = Polyunsaturated fatty acid, MUFAs = Monosaturated fatty acids. Results are average of three replicates; Values in the cells across rows with similar alphabet suffixes are comparable at α ≤ (0.05).
Table 4. Possible functional groups/ bonds originated by standard frequency (stretching/ bending vibrations) through FTIR analysis of indigenous Adlay flours.
Peak (s) at Animated cm-1 Origin Relevant to Peak (s) Functional Group (s) Reached Out Indigenous Adlay Grains Flours
PRP YLW OWT BLK GRY GRN BRN
Frequencies 2348/49 to 3350/ 3635 Description Originating Peaks
3350/3653 bold/alone/broader or semi rounded peak sym. stretch - H bonded OH Aliphatic or / Aryl Alcohols/ carboxylic/ carbohydrate known window Frequency (3350-3653), appearance (broader/ wider) shape (semi global/ rounded) bold and alone found uniformly and equally in all collection evident H-bonded OH group symmetric stretch pertinent to -COOH; and or carbohydrates; and or R-OH/Ar-OH
~ 3000 -CH3; >CH2 symmetric stretching Well known window (defined Basic skeleton) 2965; 2994 same separated
band type
at 2963 same bands
2863/65 aldehydic H symmetric stretch shoulder type typical defined window
HC=O near R- stretch
shoulder type
2348/49 O=C=O stretch CO2 indication as background contamination CO2 presence without any detectable difference in samples indicates background atmospheric CO2 interception, that may be avoided by T at <2%. It is a well-defined window
Disclaimer/Publisher’s Note: The statements, opinions and data contained in all publications are solely those of the individual author(s) and contributor(s) and not of MDPI and/or the editor(s). MDPI and/or the editor(s) disclaim responsibility for any injury to people or property resulting from any ideas, methods, instructions or products referred to in the content.
Copyright: This open access article is published under a Creative Commons CC BY 4.0 license, which permit the free download, distribution, and reuse, provided that the author and preprint are cited in any reuse.
Prerpints.org logo

Preprints.org is a free preprint server supported by MDPI in Basel, Switzerland.

Subscribe

© 2024 MDPI (Basel, Switzerland) unless otherwise stated