Introduction
The human phospholipase B precursor (HPLB-P) was originally purified from white blood cells obtained from healthy human blood donors and was at that time only known as a hypothetical protein based on sequence analysis of the human genome [
1]. Subsequently we identified the nature of this protein since it displayed phospholipase activities with the ability to remove fatty acids from both sn-1 and sn-2 bonds in phospholipids, thus potentially giving rise to a broad panel of active fatty acid molecules when released from its cellular origin.
By means of our specific polyclonal antibodies most human organ tissues were screened by immunohistochemistry for the expression of HPLBII-P [
2]. Three organ tissues expressed the protein particularly well. These were neuronal cells, gastrointestinal and kidney tissues in addition to bone marrow cells. By means of ELISA we measured HPLBII-P in gastrointestinal material and found interesting relations to GI diseases such as IBS [
3] and IBD [
2]. Our assay also allows the measurement of the very low concentrations found in urine. The purpose of this report was to evaluate the potential utility of HPLBII-P as a sign of kidney injury and compare its potential with other currently used and well characterised biomarkers one of which is HNL/NGAL. Thus, we collected urine from a cohort of critically ill COVID-19 patients admitted to the ICU.
Material and Methods
Data in this research are part of the PronMed study. The study was approved by the National Ethical Review Agency (Dnr 2017/043, with amendments 2020-01623, 2020-02719, 2020-05730, 2021-01469, and 2022-00526-01) and listed at ClinicalTrials.gov (NCT03720860). Informed consent was obtained from the patient or next of kin. The Declaration of Helsinki and its subsequent revisions were followed.
One hundred and thirty two patients were admitted to the ICU (Intensive Care Unit) of Uppsala University Hospital with SARS-CoV-2 infections as diagnosed with PCR and signs of organ failure. Detailed information of the patient demographics was given previously [
4,
5].
Clinical data was collected from the electronic medical records and AKI severity was staged according to Kidney Disease: Improving Global Out come (KDIGO) creatinine criteria and renal replacement requirement solely [
6].
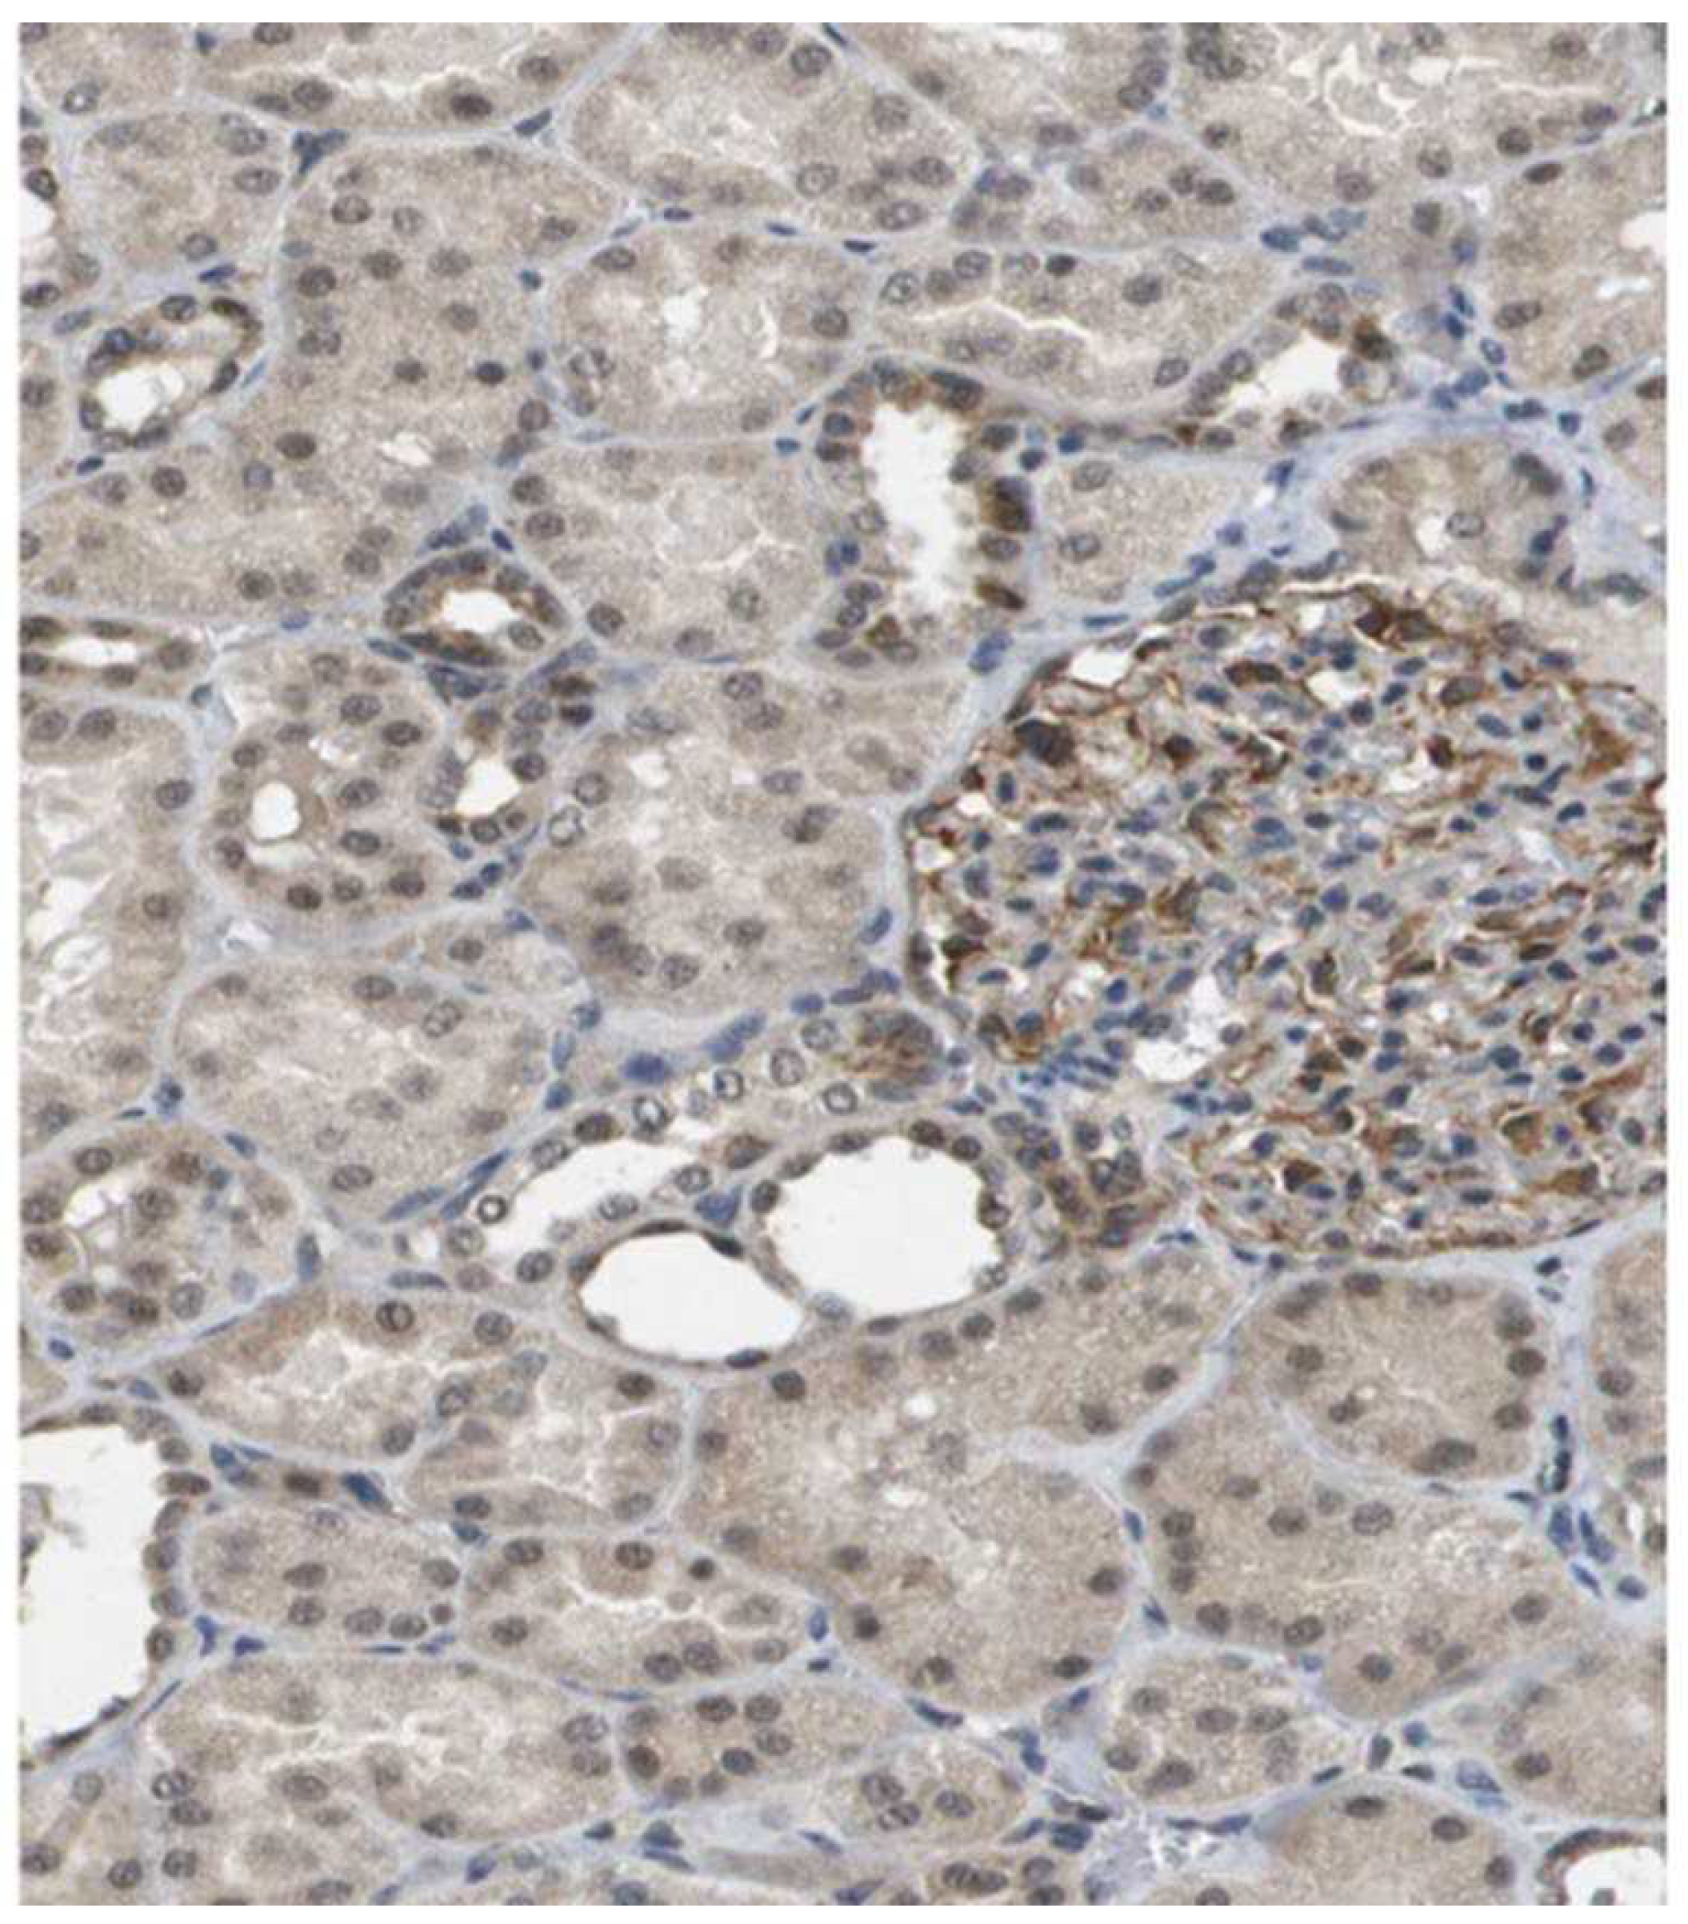
Immunohistochemistry of kidney tissue was performed using the rabbit polyclonal antibody raised against HPLBII-P and documented in the Human Protein Atlas (The Human Protein Atlas).
HPLBII-P and HNL were measured by ELISA (Diagnostics Development, Uppsala, Sweden). The HNL Elisa was configured with mabs 763 and 8F for the purpose of catching most HNL molecular variants in urine. The analytical performances of the two ELISA:s were acceptable with CVs (Coefficient of Variation) in the range of 4-10% of duplicate samples. The measurements of KIM-1, TIMP-2, NGAL were performed by the ELISA kits DY1750B, DY971, and DY1757 respectively, all purchased from R&D systems, Minneapolis, MN, USA. All clinical data were blinded to the analyzing personal.
Albumin and Cystatin C in urine and Cystatin C and creatinine in plasma were all measured by the clinical chemistry laboratory at University Hospital, Uppsala, Sweden.
Statistics
All data were from results obtained at admission to the ICU. Non-parametric statistics was applied. For comparison between independent results Mann-Whitney U test was used. For the comparison of the results of multiple groups Kruskal-Wallis ANOVA was applied. Correlations between biomarkers were calculated by Spearman rank correlations. The statistical programme Medcalc was used in all calculations: MedCalc
® Statistical Software version 22.016 (MedCalc Software Ltd., Ostend, Belgium;
https://www.medcalc.org; 2023)
Results
HPLBII-P in Urine in Patients with AKI
Staining of kidney tissue with the polyclonal antibodies raised against HPLB-P showed distinct staining of cells in the glomeruli (
Figure 1). Staining was also seen in some tubular cells.
By means of the HPLBII-P ELISA the concentrations of HPLBII-P were measured in urine of 60 healthy persons and of patients with COVID-19. The COVID-19 patients were all admitted to the ICU because of respiratory failure. It is shown in
Figure 2 that the urine concentrations in samples from COVID-19 patients were highly and significantly raised as compared to the results of healthy persons (p<0.0001). This was also the case when we only looked at COVID-19 patients without any sign of AKI (
Figure 2 insert). It is further indicated in
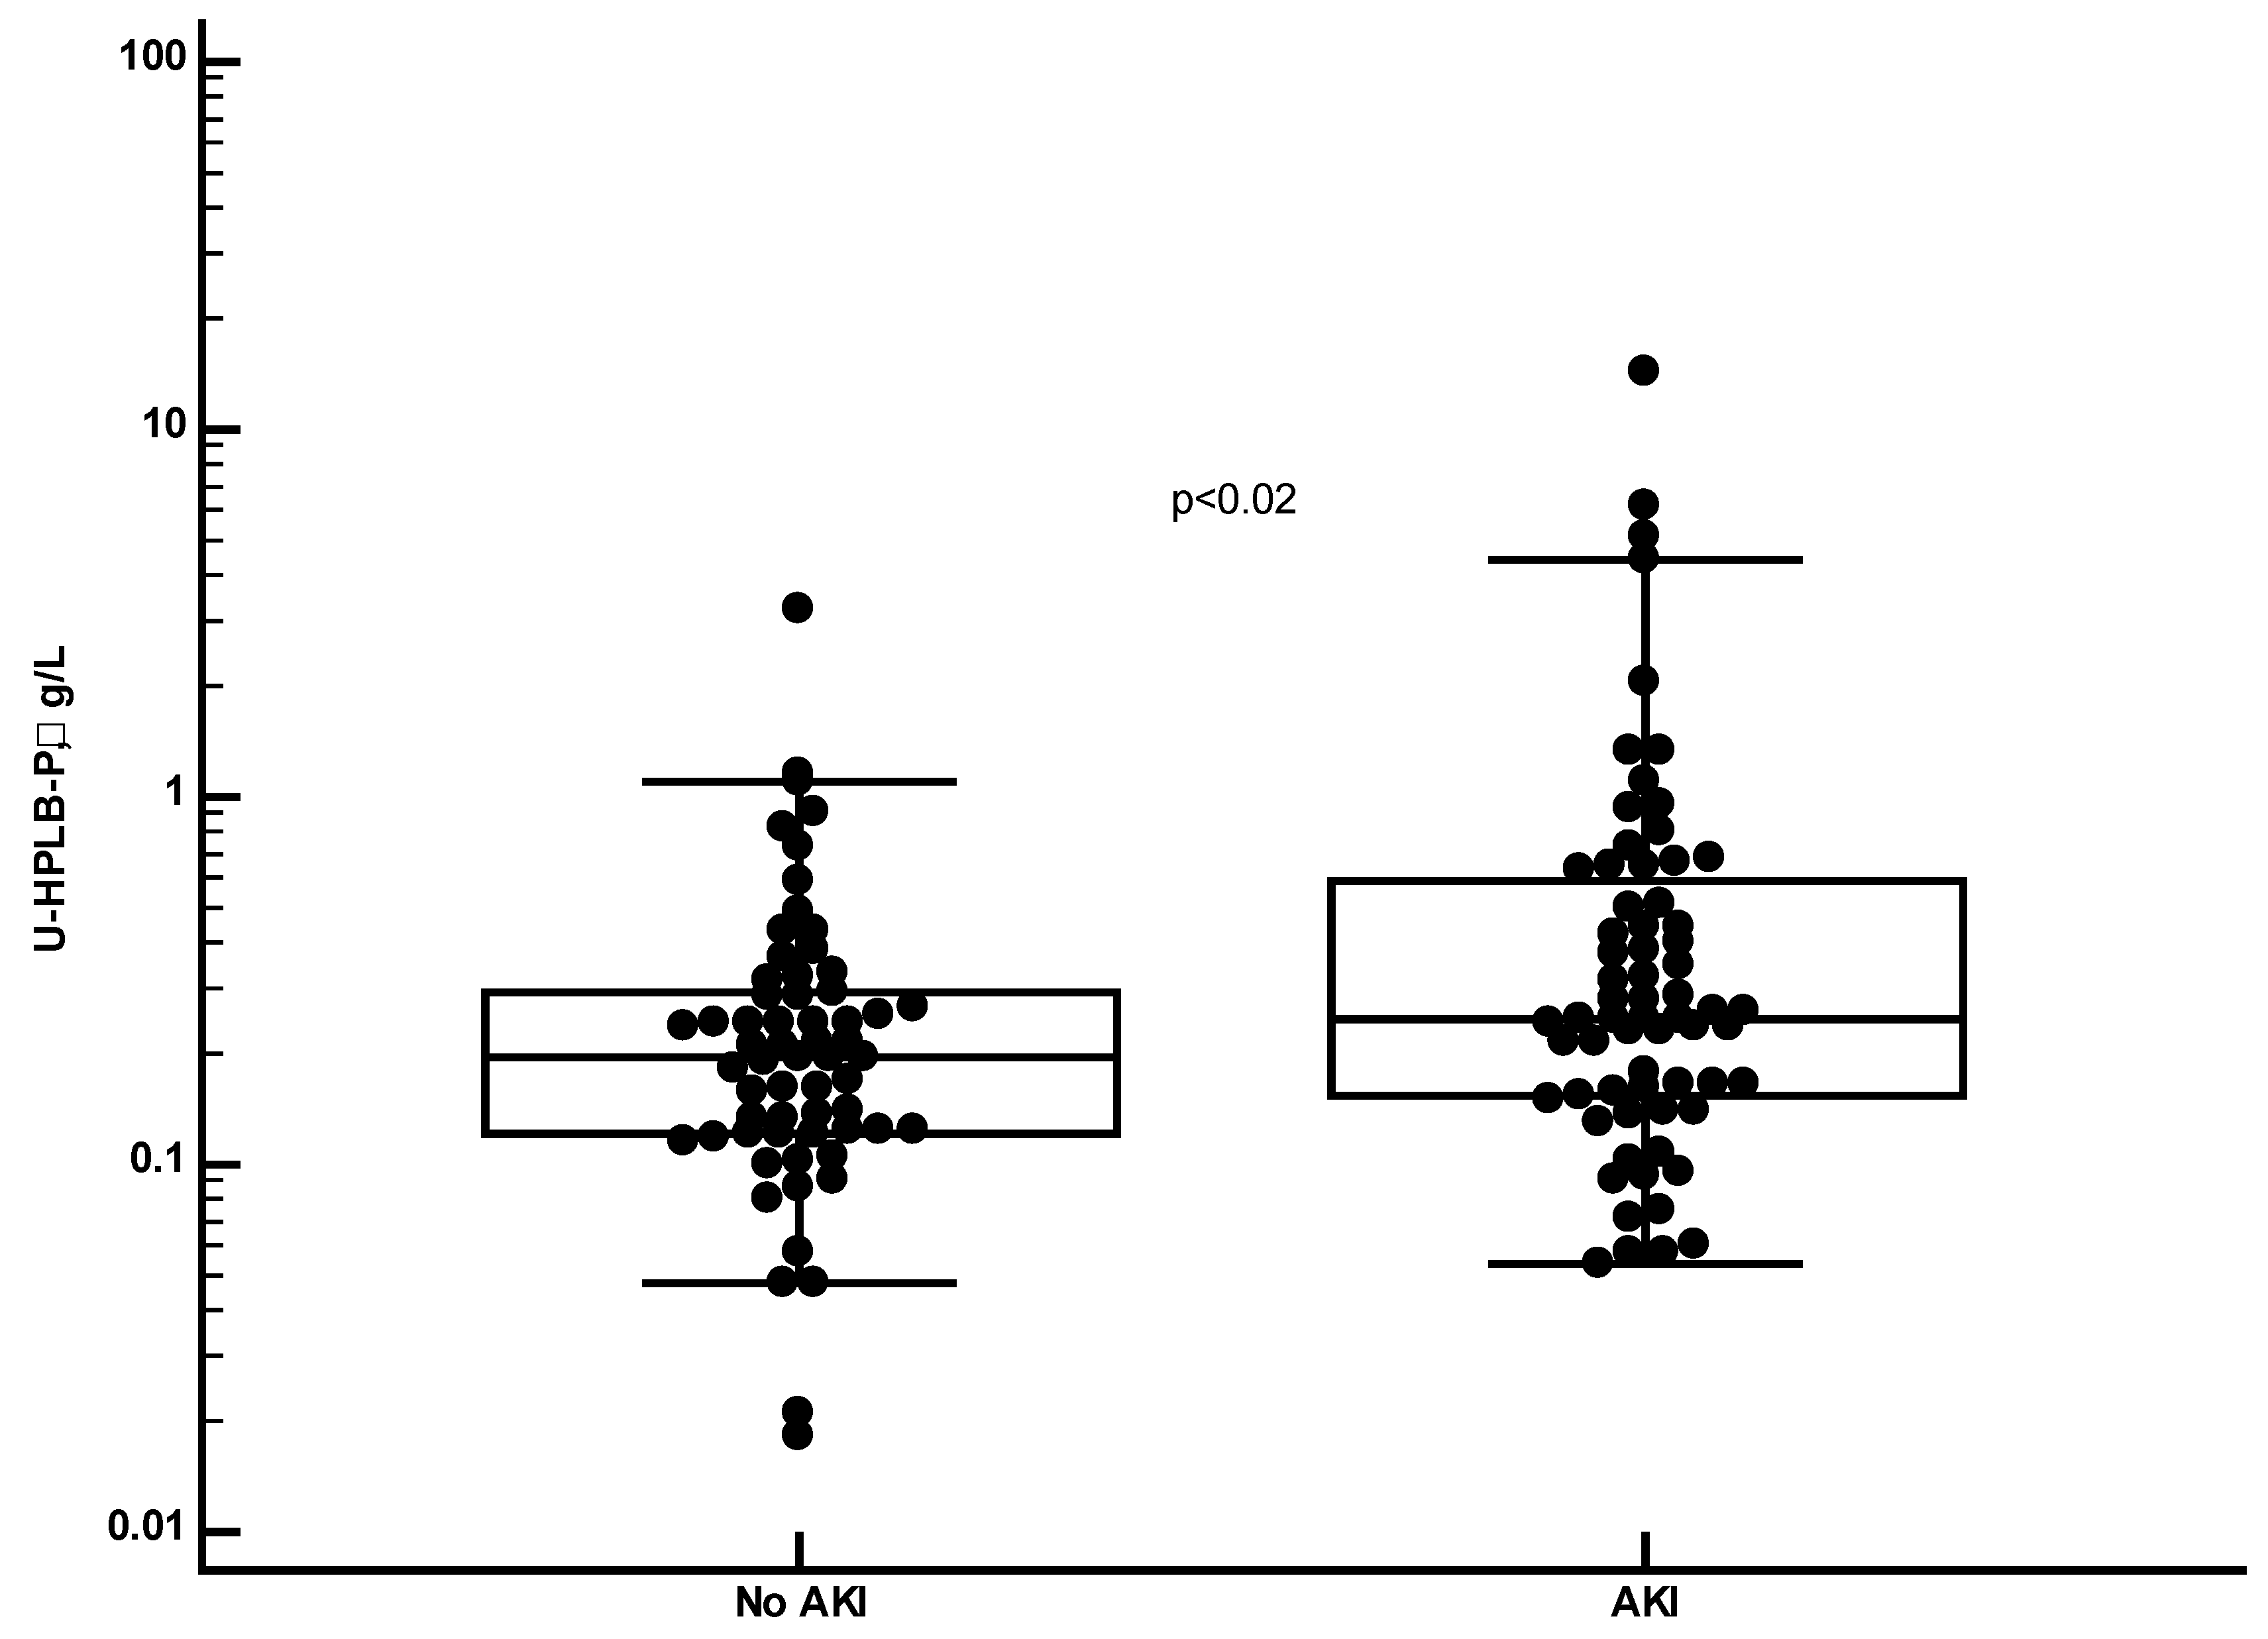
Figure 3 and
Table 1 that the concentrations were higher in the COVID-19 patients with AKI (p<0.02) and with a relation to AKI stages (p=0.04, Kruskal-Wallis ANOVA) (Not shown).
In
Table 1 we show the concentrations of several other biomarkers in urine in COVID-19 patients with or without AKI. None of the biomarkers were elevated in patients with AKI, whereas the serum concentrations of Cystatin C were significantly higher in those patients with AKI (p=0.0002). After urine creatinine correction the levels of HPLBII-P became higher in AKI relative to No AKI (p=0.002) (
Supplementary table and supplementary figure 1) and to AKI to stages (
Supplementary figure 1). The relationships of these biomarkers to HPLBII-P were evaluated by Spearman rank correlation analysis. Significant correlations were found with albumin and HNL (763/8F) in urine as illustrated in
Figure 4a,b. A correlation was also found to KIM-1 (r
s=0.28, p=0.01).
HPLBII-P in Patients with Diabetes Mellitus
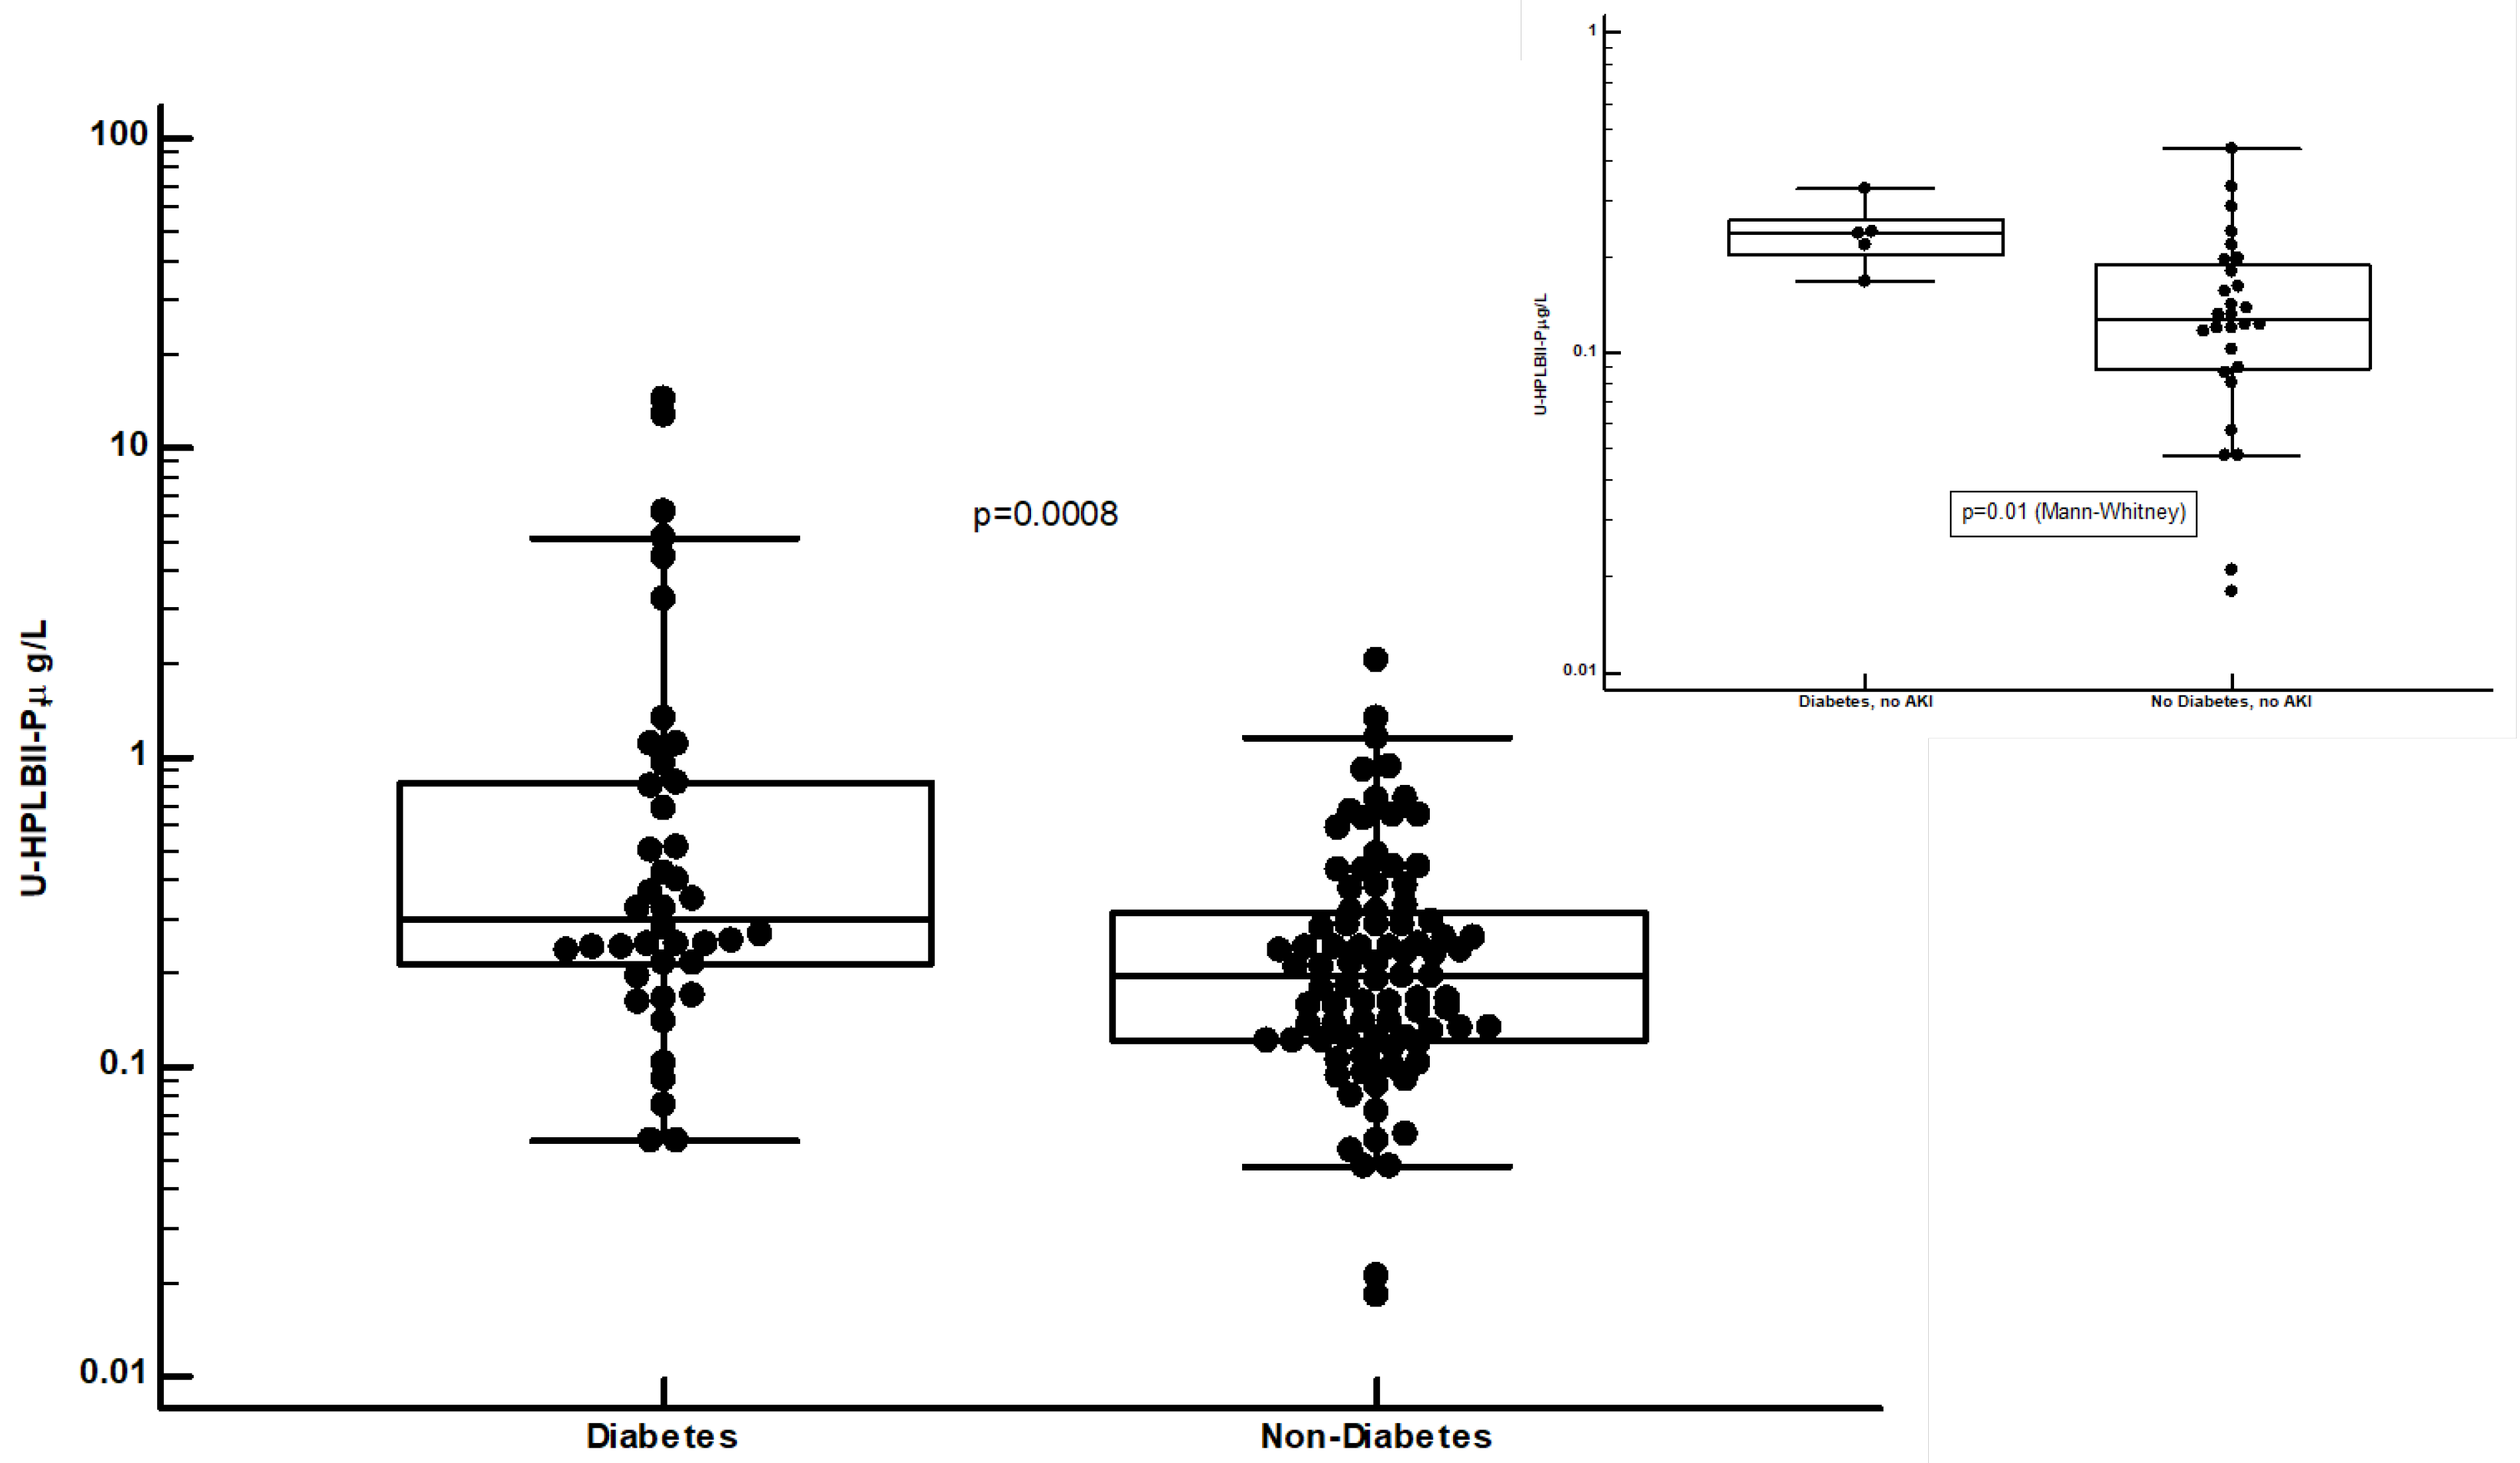
In
Figure 5 we show the highly and significantly raised concentrations of HPLBII-P in patients with diabetes mellitus (p=0.0008). In the insert in figure 5 we show the increased concentrations in diabetes mellitus in COVID-19 patients without signs of AKI (p=0.01). Higher concentrations in urine in patients with diabetes mellitus were also seen for HNL (763/8F) (p=0.0056) and NGAL (p=0.007), but not for the other investigated biomarkers shown in
Table 1. Raised concentrations of HNL (763/8F) and NGAL in diabetes mellitus were only seen in those patients with AKI, p=0.002 and p=0.01, respectively. After urine creatinine correction similar results were obtained (
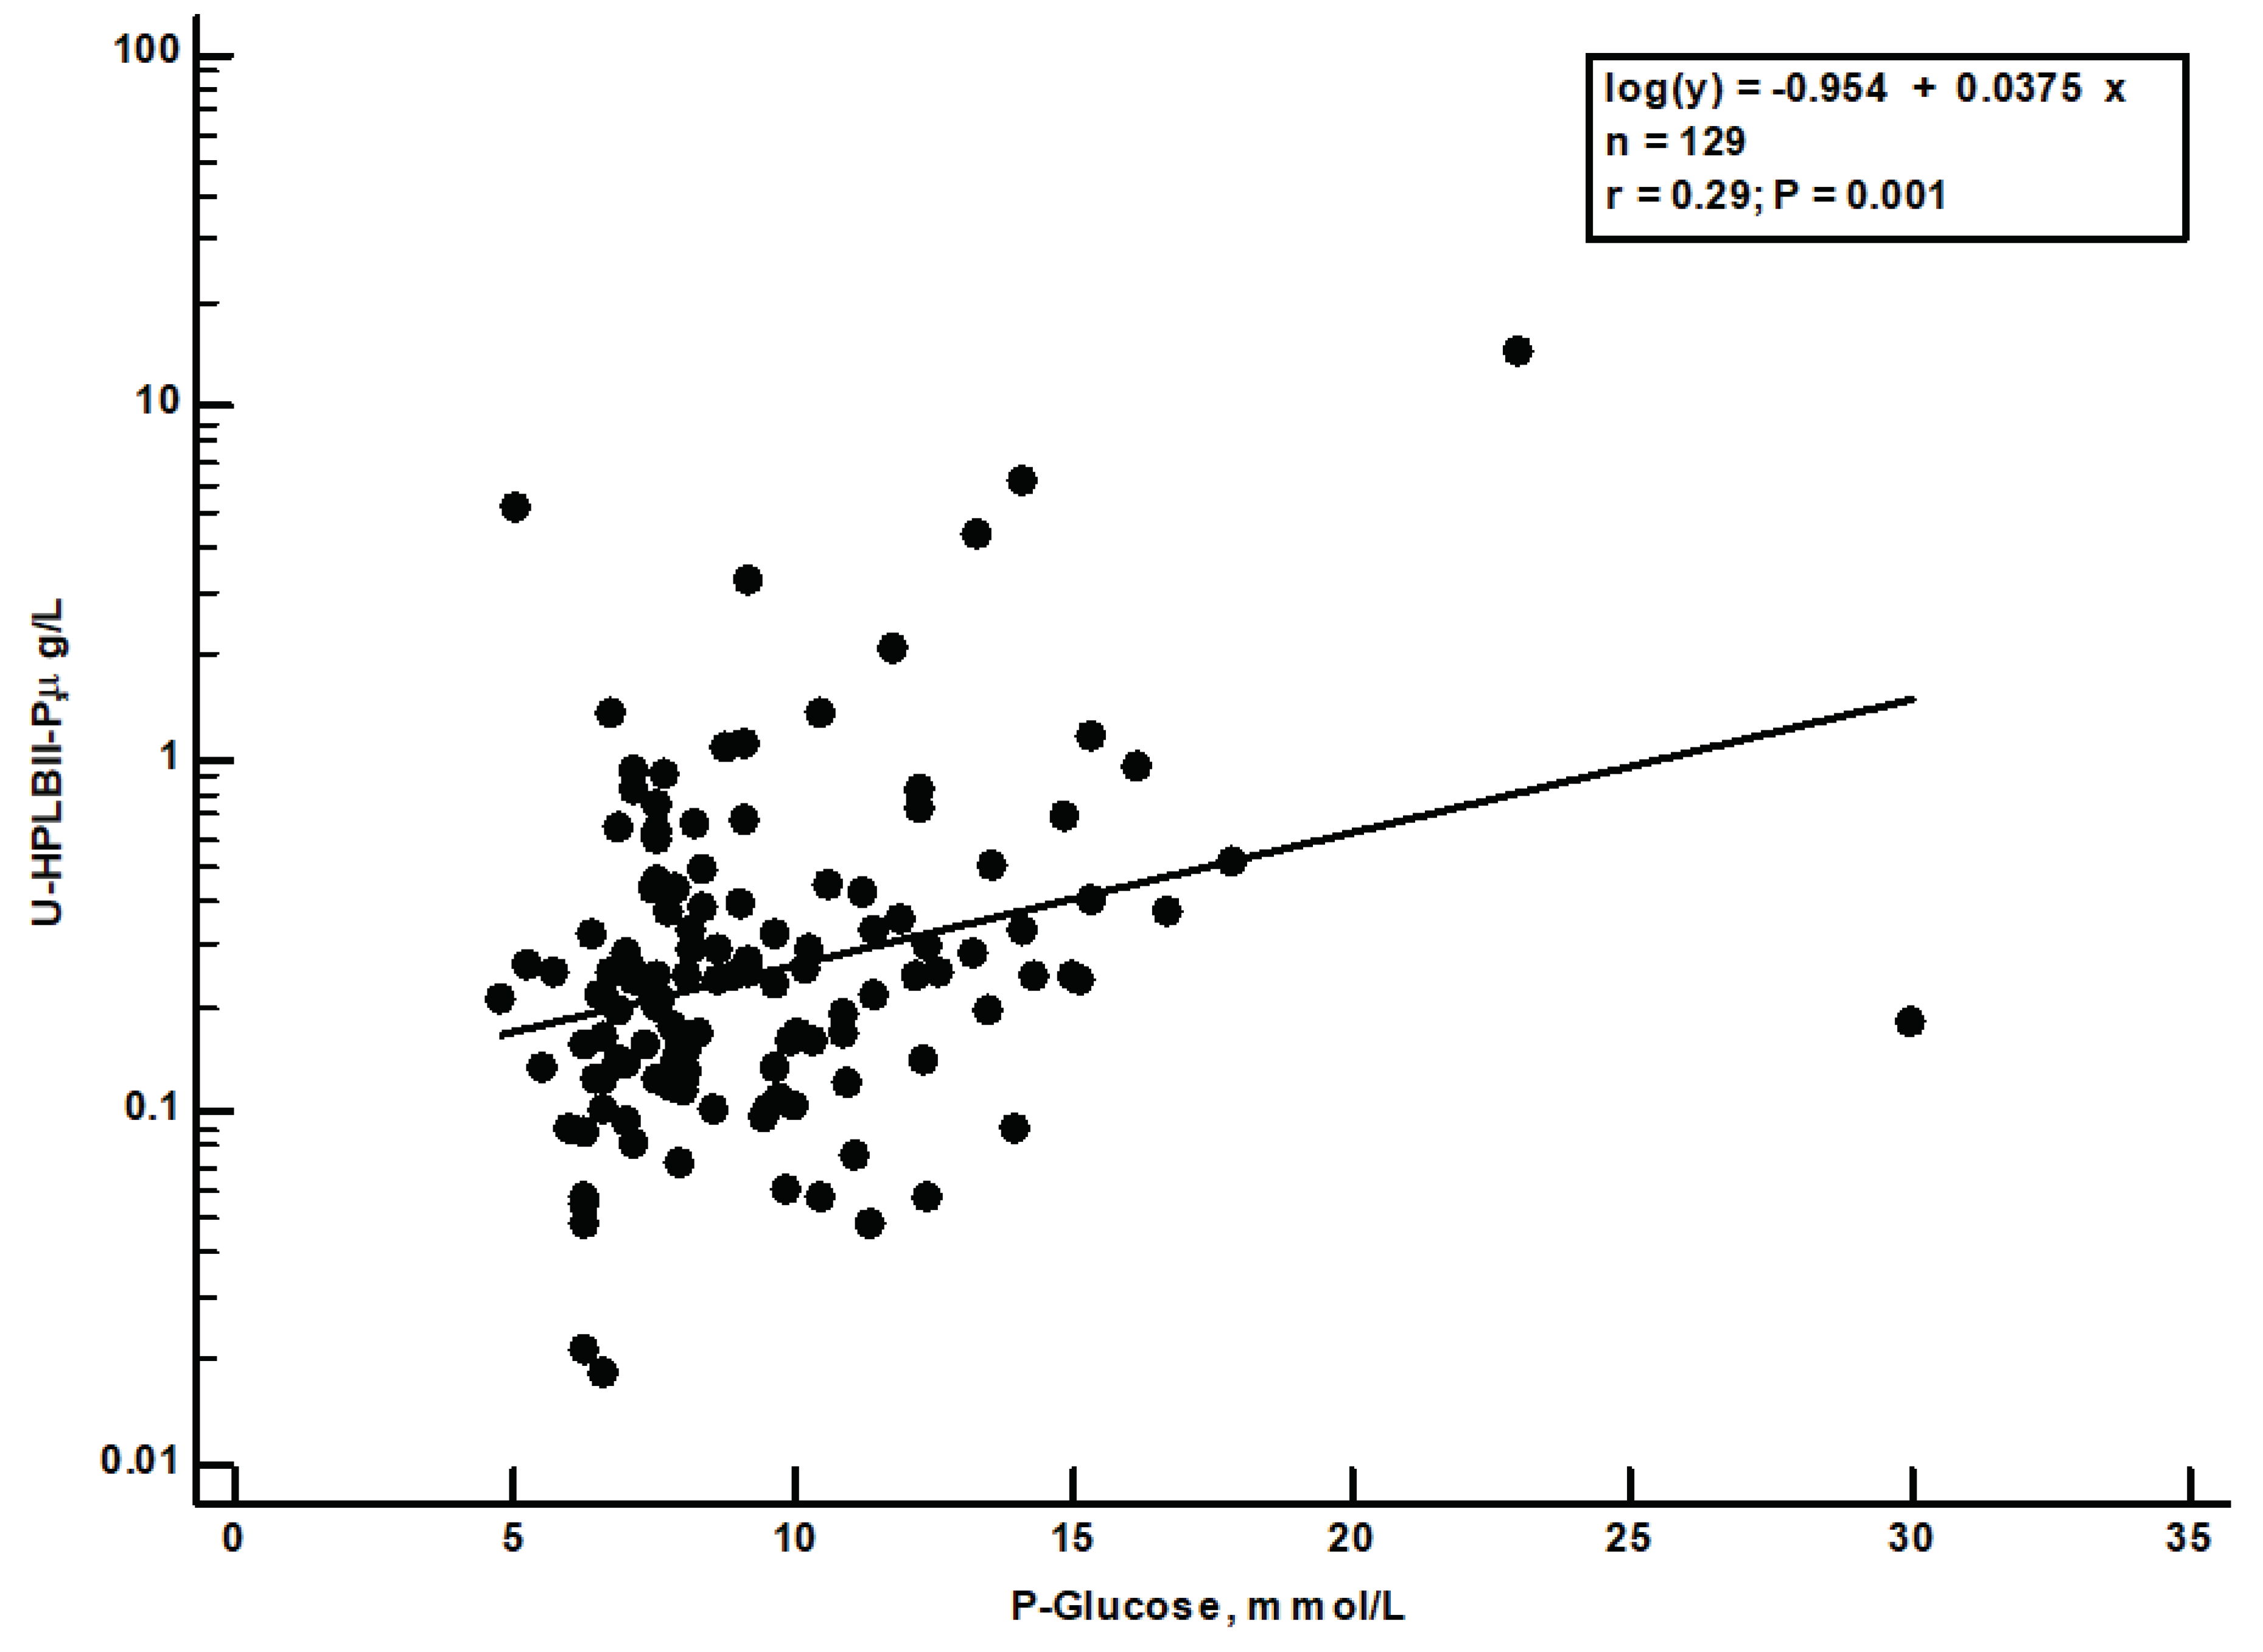
Supplementary Figure S2 and Table). A significant correlation (r
s=0.29, p=0.001) was seen between the plasma glucose concentrations at admission day and the HPLBII-P concentrations (
Figure 6). No correlation to plasma glucose was seen for any of the other urine biomarkers i.e., Albumin, HNL (763/8F), KIM-1 or TIMP-2.
Discussion
This report has shown that HPLBII-P can be measured in urine at very low concentrations, and that these levels are highly raised in patients with SARS-CoV-2 infections admitted to the ICU because of respiratory failure. In our cohort 61% of the patients had AKI of varying severities and these patients had higher concentrations in urine of HPLBII-P than those without AKI whereas the other investigated biomarkers did not show any difference. We also showed that COVID-19 patients with diabetes mellitus had raised concentrations in urine of HPLBII-P. This was seen in the patients with AKI and in the patients without AKI in contrast to the findings for HNL (763/8F) and NGAL in whom raised concentrations were only found in the subpopulation of patients with AKI.
The difference between HNL and HPLBII-P in its localization in the kidney is illustrated by the micrograph in
Figure 1. It is apparent that HPLBII-P is located primarily to glomerular cells in addition to the localization to some tubular cells, whereas the unique localization of HNL to tubular [
5,
7,
8], but not to glomerular cells has been well documented. Most likely HPLBII-P is produced by the podocytes of the glomeruli.
We found a significant correlation to HNL representing tubular damage which could suggest a tubular origin of HPLBII-P as well. However, the highest correlation was seen for albumin in urine, which indicates the glomerular origin of HPLBII-P in urine in line with our immunohistochemistry results shown in
Figure 1. Whether the glomerular contribution to the urine presence is a consequence of glomerular damage in COVID-19 or the stimulated secretion from glomerular cells i.e., podocytes cannot be judged from the findings in this report. The contribution from a glomerular leakage, though, seems less likely given the molecular size of ca 130 kD of HPLBII-P.
The SARS-CoV-2 virus was found recently in glomerular cells of COVID-19 patients [
9,
10] but we rarely find virus in urine [
11]. One speculation is that the virus acts as a trigger of HPLBII-P secretion from the glomerular cells. This notion has some support in our findings that the concentrations of HPLBII-P in urine in COVID-19 patients without signs of AKI were significantly raised as compared to the healthy controls as opposed to the other biomarkers studied in this report.
As of today, we do not know about the actual biological role of HPBLII-P apart from the fact, referred to in the introduction, that it has a broad phospholipase activity. The activity of Phospholipase A2 (PLA
2) has been thoroughly investigated in relation to COVID-19 and the activity of which is believed to be a key element in the severe inflammatory state seen in many patients infected by SARS-CoV-2 [
12]. However, PLA
2 may also take part in the fight against the virus infiltration [
13]. Thus, whether the high HPLBII-P concentrations found in urine of our COVID-19 patients represent kidney damage and/or viral defence remains to be concluded. Indeed, we found previously very high serum levels of HPLBII-P in patients with Influenza A infection without signs of AKI [
2].
The most conspicuous finding in this study was the close relation to diabetes mellitus, since the concentrations in urine of HPLBII-P were highly elevated and correlated, as opposed to the other studied biomarkers, to the key findings in diabetes mellitus of disturbances in glucose metabolism. This leads to the speculation that HPLBII-P in urine reflects the glomerular damage and function which is a well-known consequence of poor control of diabetes mellitus. The two tubular biomarkers HNL and NGAL also showed higher concentrations in diabetes mellitus, but only in those patients with signs of AKI. Thus, raised concentrations of HPLBII-P in urine might be a novel and interesting biomarker of glomerular function and activity in diabetes mellitus.
We conclude from this report that the measurement of HPLBII-P in urine is a sensitive means of revealing AKI in patients with COVID-19 and as such more sensitive than conventionally used urine biomarkers. Most likely the origin of HPLBII-P in urine is dual i.e., the tubuli, but in particular glomerular cells. Whether our findings can be extended to AKI caused by other aetiologies remain to be shown. HPLBII-P may also be a novel and unique biomarker for the diagnosis and monitoring of glomerular function and activity in patients with diabetes mellitus.
Supplementary Materials
The following supporting information can be downloaded at the website of this paper posted on Preprints.org.
References
- Xu S, Zhao L, Larsson A. The identification of a phospholipase B precursor in human neutrophils. FEBS J. 2009, 276, 175–86. [Google Scholar] [CrossRef] [PubMed]
- Xu S, Cai L, Zhao L, Douhan-Hakansson L, Kristjansson G, Pauksen K, et al. Tissue localization and the establishment of a sensitive immunoassay of the newly discovered human phospholipase B-precursor (PLB-P). J Immunol Methods 2010, 353, 71–7. [CrossRef] [PubMed]
- Castro T, V, Ohman L, Aabakken L, Fellstrom B, Hausken T, Hovde O, et al. Randomised clinical trial and meta-analysis: mesalazine treatment in irritable bowel syndrome-effects on gastrointestinal symptoms and rectal biomarkers of immune activity. Aliment Pharmacol Ther 2022, 56, 968–79. [CrossRef] [PubMed]
- Bulow AS, Lipcsey M, Hultstrom M, Eriksson AK, Venge P, Frithiof R, et al. Systemic Human Neutrophil Lipocalin Associates with Severe Acute Kidney Injury in SARS-CoV-2 Pneumonia. J Clin Med 2021, 10.
- Luther T, Bulow-Anderberg S, Larsson A, Rubertsson S, Lipcsey M, Frithiof R, et al. COVID-19 patients in intensive care develop predominantly oliguric acute kidney injury. Acta Anaesthesiol Scand 2021, 65, 364–72. [CrossRef] [PubMed]
- Khwaja, A. KDIGO clinical practice guidelines for acute kidney injury. Nephron Clin Pract 2012, 120, c179–c184. [Google Scholar] [CrossRef] [PubMed]
- Damman K, van Veldhuisen DJ, Navis G, Voors AA, Hillege HL. Urinary neutrophil gelatinase associated lipocalin (NGAL), a marker of tubular damage, is increased in patients with chronic heart failure. Eur J Heart Fail 2008, 10, 997–1000. [CrossRef] [PubMed]
- Xu K, Shang N, Levitman A, Corker A, Kudose S, Yaeh A, et al. Elevated Neutrophil Gelatinase-Associated Lipocalin Is Associated With the Severity of Kidney Injury and Poor Prognosis of Patients With COVID-19. Kidney Int Rep 2021, 6, 2979–92. [CrossRef] [PubMed]
- van Timmeren MM, Bakker SJ, Vaidya VS, Bailly V, Schuurs TA, Damman J, et al. Tubular kidney injury molecule-1 in protein-overload nephropathy. Am J Physiol Renal Physiol 2006, 291, F456–F464. [CrossRef] [PubMed]
- Abbate M, Rottoli D, Gianatti A. COVID-19 Attacks the Kidney: Ultrastructural Evidence for the Presence of Virus in the Glomerular Epithelium. Nephron 2020, 144, 341–2. [CrossRef] [PubMed]
- Frithiof R, Bergqvist A, Jarhult JD, Lipcsey M, Hultstrom M. Presence of SARS-CoV-2 in urine is rare and not associated with acute kidney injury in critically ill COVID-19 patients. Crit Care 2020, 24, 587. [CrossRef] [PubMed]
- Ripon MAR, Bhowmik DR, Amin MT, Hossain MS. Role of arachidonic cascade in COVID-19 infection: A review. Prostaglandins Other Lipid Mediat 2021, 154, 106539. [CrossRef] [PubMed]
- Teixeira SC, Borges BC, Oliveira VQ, Carregosa LS, Bastos LA, Santos IA, et al. Insights into the antiviral activity of phospholipases A2 (PLA2s) from snake venoms. Int J Biol Macromol 2020, 164, 616–25. [CrossRef] [PubMed]
|
Disclaimer/Publisher’s Note: The statements, opinions and data contained in all publications are solely those of the individual author(s) and contributor(s) and not of MDPI and/or the editor(s). MDPI and/or the editor(s) disclaim responsibility for any injury to people or property resulting from any ideas, methods, instructions or products referred to in the content. |
© 2024 by the authors. Licensee MDPI, Basel, Switzerland. This article is an open access article distributed under the terms and conditions of the Creative Commons Attribution (CC BY) license (http://creativecommons.org/licenses/by/4.0/).


