1. Introduction
B-1 cells are a subset of B lymphocytes with distinct phenotypic and functional characteristics from conventional B-2 cells. They play essential roles in immunity, especially in producing natural antibodies and regulating inflammation [
1]. B-1 cells are considered distinct from conventional B cells based on their developmental origin, tissue localization, surface markers, and functional properties [
2]. They are mainly found in the peritoneal and pleural cavities and the spleen [
3]. B-1 cells are known for their ability to produce antibodies that provide early protection against pathogens, particularly bacteria. Unlike conventional B cells, which require activation by T cells and exposure to specific antigens, B-1 cells can produce antibodies spontaneously and rapidly, even in the absence of external stimuli [
4,
5]. B-1 cells are also believed to play a role in maintaining tissue homeostasis and developing autoimmune diseases and certain cancers (revised [
6]). Because of their unique properties, B-1 cells are an area of active research, and there is still much to learn about their functions and regulation in the immune system.
Since the 1980s, when B-1 cells were first identified, numerous investigations have aimed to comprehend their source, role, and participation in the immune reaction against infectious ailments. B-1 lymphocytes constitute a distinct subset of B cells distinguished by specific surface markers (CD19
+ IgM
hi IgD
lo CD11b
+) that set them apart from other B cell groups, notably lacking the CD23 marker [
1,
2]. Additionally, B-1 cells produce natural IgM antibodies with a low affinity that bind to repetitive epitopes like carbohydrates and nucleic acids [
5]. The role of B-1 lymphocytes in immunity has been linked to their production of cytokines that modulate the immune system, their capacity to present antigens to T cells, and their role in offering protection or resistance in various experimental infections (revised on [
7]).
Murine peritoneal B-1 lymphocytes can change into cells exhibiting both the characteristics and functions of mononuclear phagocytes [
8]. Furthermore, it was confirmed that phagocytes originating from B-1 cells (referred to as B-1 cell-derived phagocytes – B-1 CDP) demonstrated the capability to engulf pathogens such as
Cryptococcus neoformans [
9],
Escherichia coli [
10],
Leishmania amazonensis promastigotes [
11], and apoptotic bodies [
10]. Moreover, molecular investigations of B-1 cells have revealed their expression of lymphoid and myeloid lineage commitment factors. Notably, post-phagocyte differentiation, there is an increased expression of myeloid commitment factors [
12]. Consequently, establishing B-1 cell differentiation into phagocytes in vivo introduces a fresh perspective for a deeper understanding of this cell population's role in immunity [
13,
14]. Additionally, the production of microbicidal molecules like reactive oxygen species (ROS) and nitric oxide (NO) by B-1 cells supports theories regarding their involvement in the innate immune response [
13,
14]. Nevertheless, aspects of B-1 cell biology remain elusive, such as their involvement in immunity during fungal infection and sleep deprivation.
Some indications suggest a connection between sleep patterns and the regulation of the immune system. For instance, studies involving paradoxical sleep deprivation in mice have revealed significant increases in systemic glucocorticoid levels, thymus atrophy, a notable reduction in splenic NK cell count, and compromised NK cell activity against tumor cells [
15,
16]. Additionally, it has been established that glial cells and neurons share standard intercellular signals, such as hormones, cytokines, and neurotransmitters, which play roles in regulating normal sleep patterns and altering sleep responses in the face of systemic inflammation [
17,
18]. Furthermore, our group demonstrated that sleep restriction over 21 days prompted the differentiation of peritoneal B-1 cells into B-1 cell-derived phagocytes (B-1 CDP), enhancing their microbicidal capacity through increased production of nitric oxide (NO) and reactive oxygen species (ROS). This shift was accompanied by a harmful modulation of lymphoid commitment factors in B-1 cells from the sleep-restricted group [
19]. A hypothesis regarding the potential influence of sleep on the immune system is supported by observations that sleep restriction can impact several immune cells and their functions, such as phagocytosis [
20], antigen uptake [
21], antibody production [
22,
23], and the levels of autoantibodies [
24].
Several research investigations have revealed that the immune response and pathogens can impact the activation and differentiation of B-1 cells [
7]. Costa and colleagues (2017) demonstrated that B-1 cells sourced from BALB/c mice could enhance the animals' resistance to
Encephalitozoon cuniculi infection, indicating a protective function in managing microsporidia infection [
25]. Nevertheless, in cases where mice were intratracheally infected with
Paracoccidioides brasiliensis, it was observed that B-1 cells relocated to the spleen and triggered an elevation in the subset of regulatory T cells following the fungal infection, illustrating the proactive involvement of B-1 cells in susceptibility to paracoccidioidomycosis [
26]. However, the effect of sleep restriction and fungal infection on the activation and differentiation of B-1 cells is unknown. Thus, this study aimed to evaluate the effects of sleep restriction on B-1 cell response in the presence of
Paracoccidioides brasiliensis or
Candida albicans. Our data brings a new understanding of the role of sleep in the differentiation and activation of B-1 cells during fungal infection.
3. Discussion
Due to their phenotypic and functional characteristics, B-1 lymphocytes can participate in innate and adaptive immunity [
8]. However, the physiology of these cells under stress conditions still needs to be addressed. In previous study, our group showed that stress induced by sleep restriction for 21 days (SR21) led to changes in the behavior of B-1 cells [
19]. In that study, sleep restriction alone was able to increase the population of B-1 cells producing NO and ROS, polarize the cell towards a myeloid profile, suppress the gene expression of some TLRs as well as the expression of the IL-10 gene [
19]. Additionally, this study also demonstrated that intraperitoneal stimulation of
C57BL/6J mice with
L. amazonensis promastigotes led to different effects on B-1 cells of sleep-restricted mice compared to non-restricted controls [
19]. Thus, sleep restriction altered the response pattern of B-1 cells in sleep-restricted animals infected with the parasite compared to those infected without sleep restriction. Whether this pattern would also be valid for fungi was a question to be answered. Therefore, in the present study, we evaluated the response of B-1 cells from sleep-restricted or non-sleep-restricted animals to
P. brasiliensis or
C. albicans infections.
Conventional B lymphocytes and B-1 lymphocytes can present antigens and express costimulatory molecules and MHC II on their membrane [
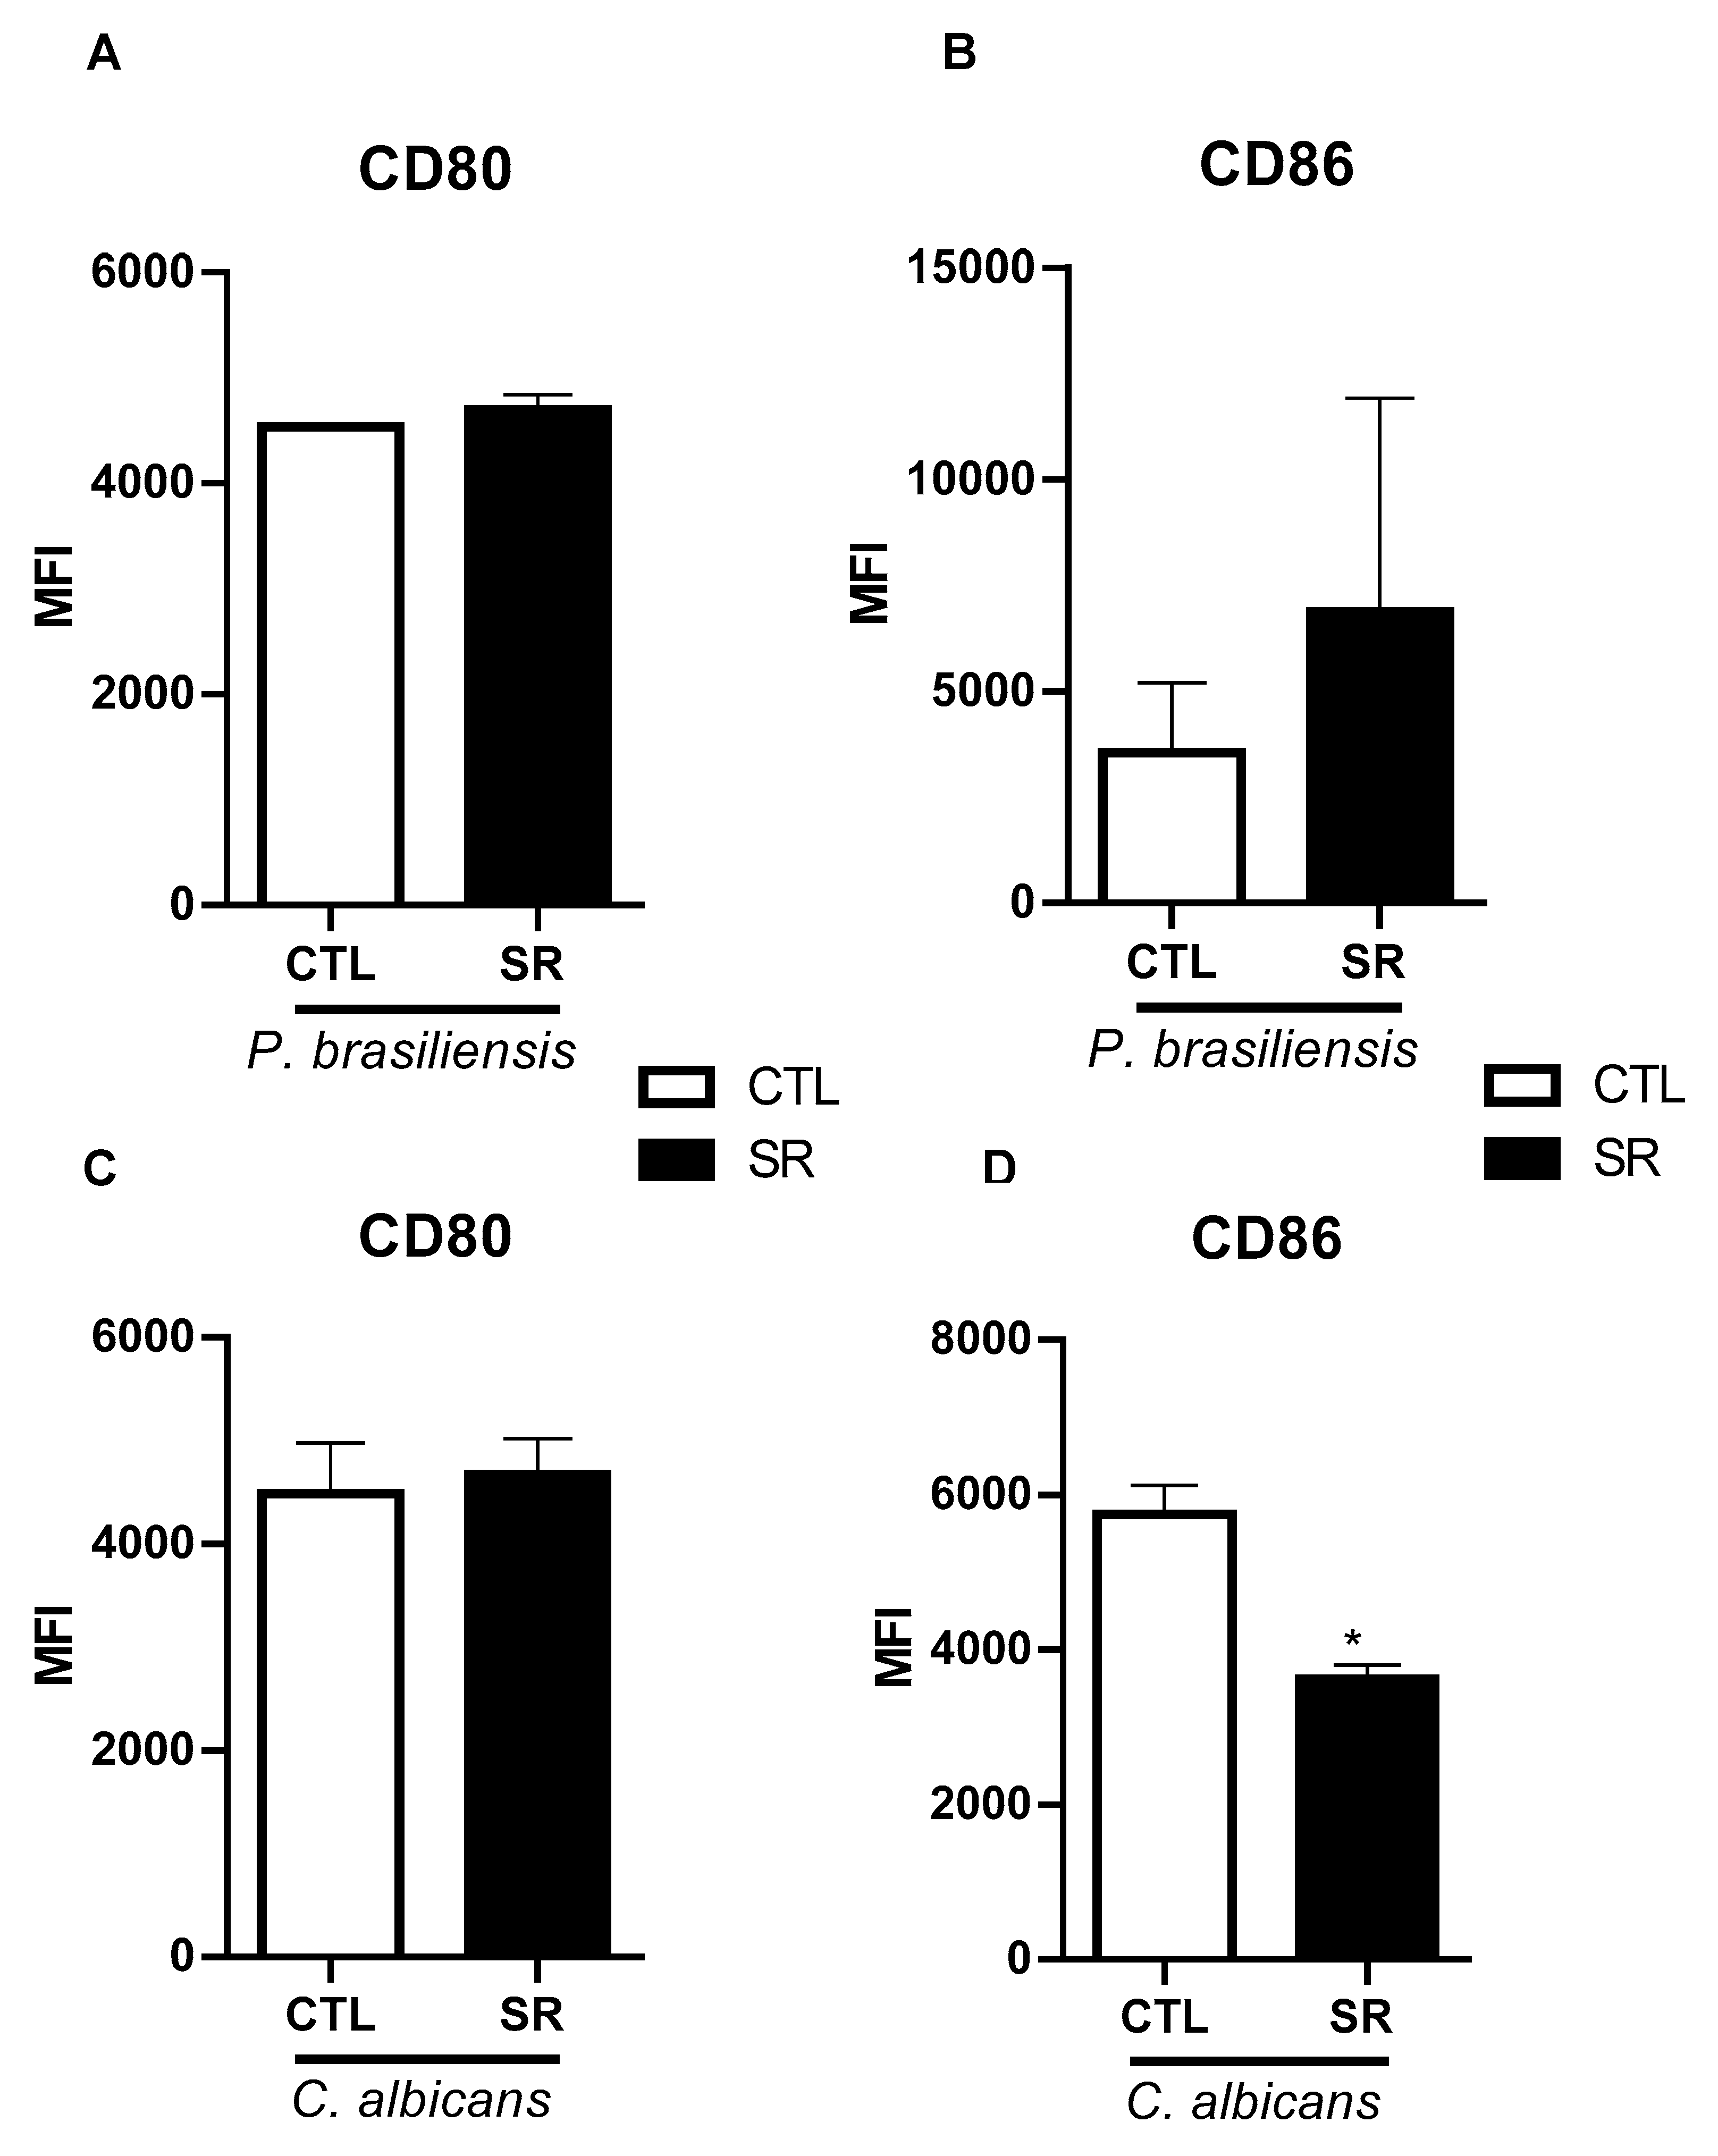
14]. In the present study, the sleep restriction no influence the expression of costimulatory molecules in B-1 cells, except for the marker CD86, which was less expressed after inoculation with
C. albicans. CD86 is a costimulatory molecule that binds to the CD28 receptor on T lymphocytes, leading to a T cell-mediated immune response (reviewed by [
28]). The observation that the expression of this molecule is reduced in sleep-restricted mice following infection with
C. albicans suggests a potential association with fungal components rather than solely with sleep restriction. This change was not evident in our investigation involving
P. brasiliensis or
L. amazonensis [
19]. In
L. amazonensis infection, CD86 levels increased in animals subjected to sleep restriction and parasite infection [
19]. Consequently, this marker is influenced not only by sleep restriction but also by the presence of pathogens.
B-1 cells are able to produce NO and ROS [
12,
14], molecules with microbicidal capacity intensely produced by phagocytic cells and mononuclear phagocytes [
29,
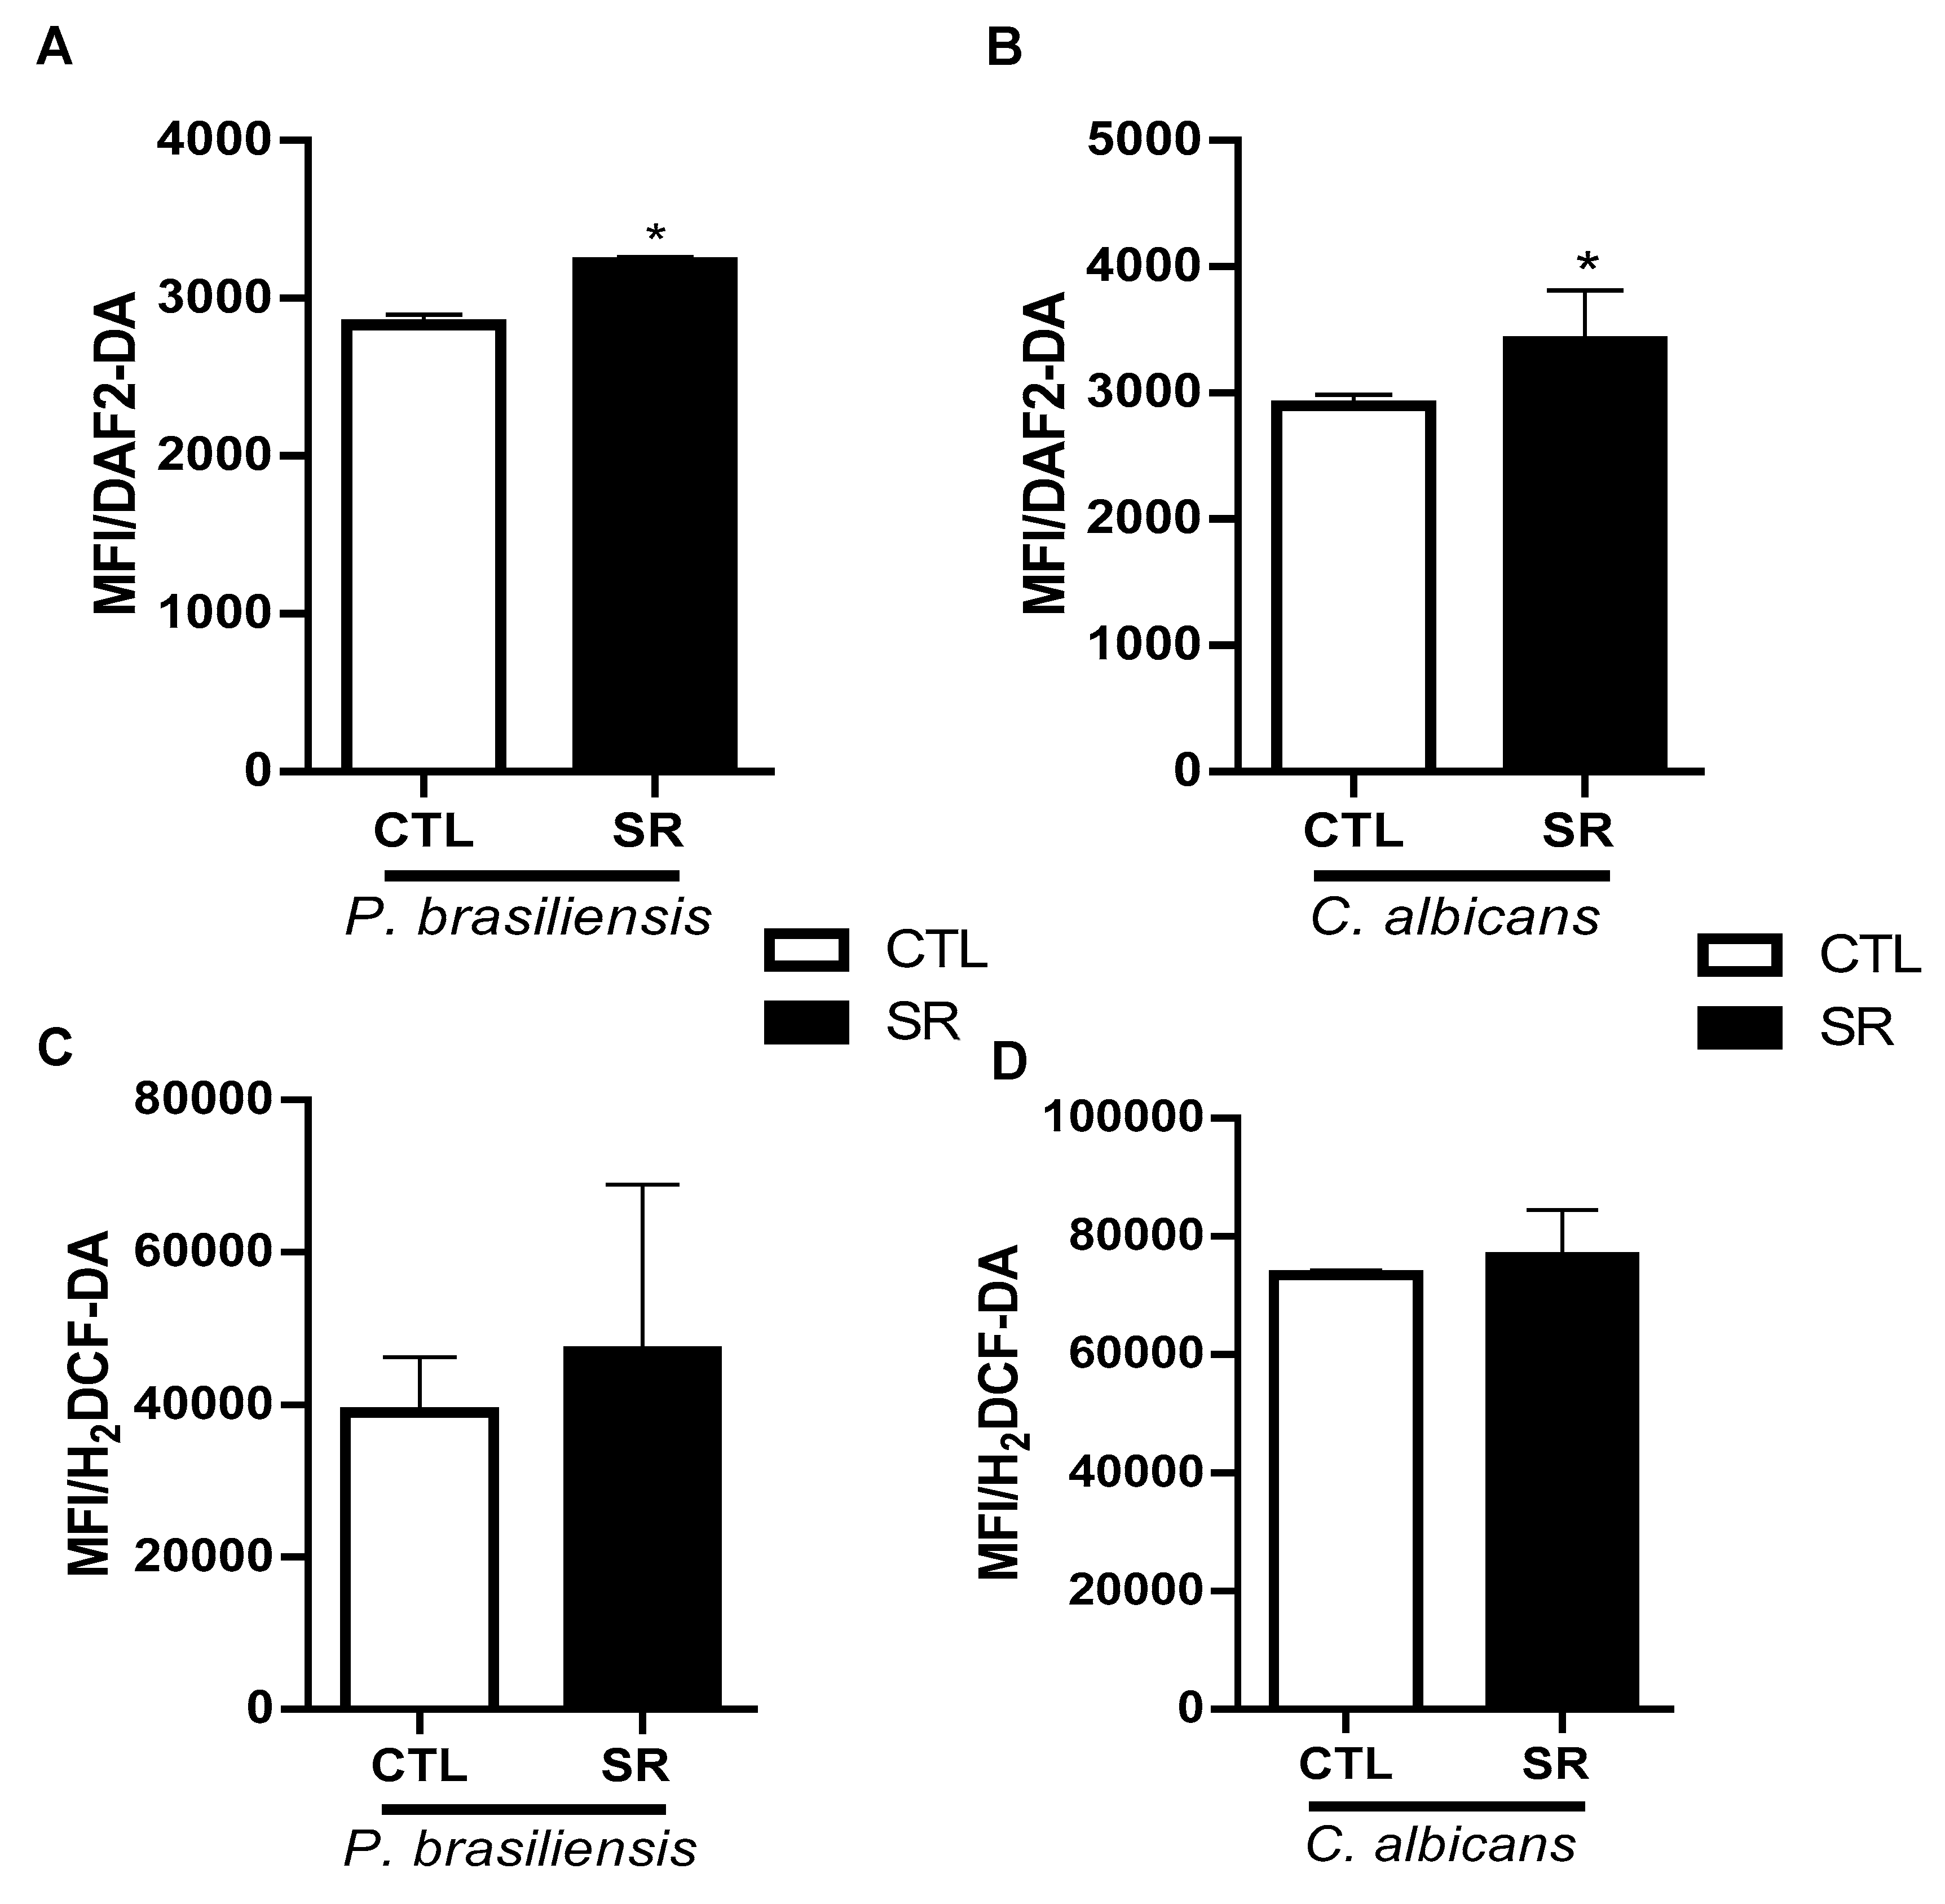
30]. Our findings revealed no alterations in intracellular reactive oxygen species (ROS) production between the groups subjected to sleep restriction and those without restriction. Conversely, intracellular nitric oxide (NO) levels were elevated in B-1 cells of sleep-restricted mice infected with either
P. brasiliensis or
C. albicans. Notably, our previous study also demonstrated heightened NO production in B-1 cells from sleep-restricted animals compared to their non-restricted counterparts. In that investigation, intraperitoneal stimulation with
L. amazonensis promastigotes maintained elevated NO levels in B-1 cells of SR21 animals compared to infected control animals. Therefore, fungal infections revealed a consistent pattern, wherein NO production by B-1 cells in sleep-restricted animals remained higher than in non-restricted infected animals (controls). The assessment of intracellular NO production during sleep restriction has been conducted across various cell types. Sleep deprivation of mice for six days results in increased activation of neuronal nitric oxide synthase (nNOS), which leads to a more significant release of NO, causing cellular toxicity of the neuron [
31]. Conversely, endothelial cells from sleep-restricted animals exhibited impaired NO production, impacting blood pressure elevation and the development of hypertension in these animals [
32]. Peritoneal macrophages from animals intraperitoneally stimulated with thioglycollate and deprived of sleep displayed decreased NO production [
33]. However, in this study, differentiation between macrophages and B-1 cells was not conducted, potentially leading to macrophage population contamination with B-1 cells, as both cell types share several cell surface markers [
33]. Our study represents the first to demonstrate an increase in NO production in B-1 cells from sleep-restricted animals infected with fungi, and this pattern remained consistent across different pathogens studied.
B-1 cells express several pathogen molecular pattern recognition receptors, such as toll-like receptors (TLRs) [
34,
35]. In the previous study, our group showed a decrease in TLR2, TLR6, and TLR9 expression in sleep-restricted animals compared to the control group [
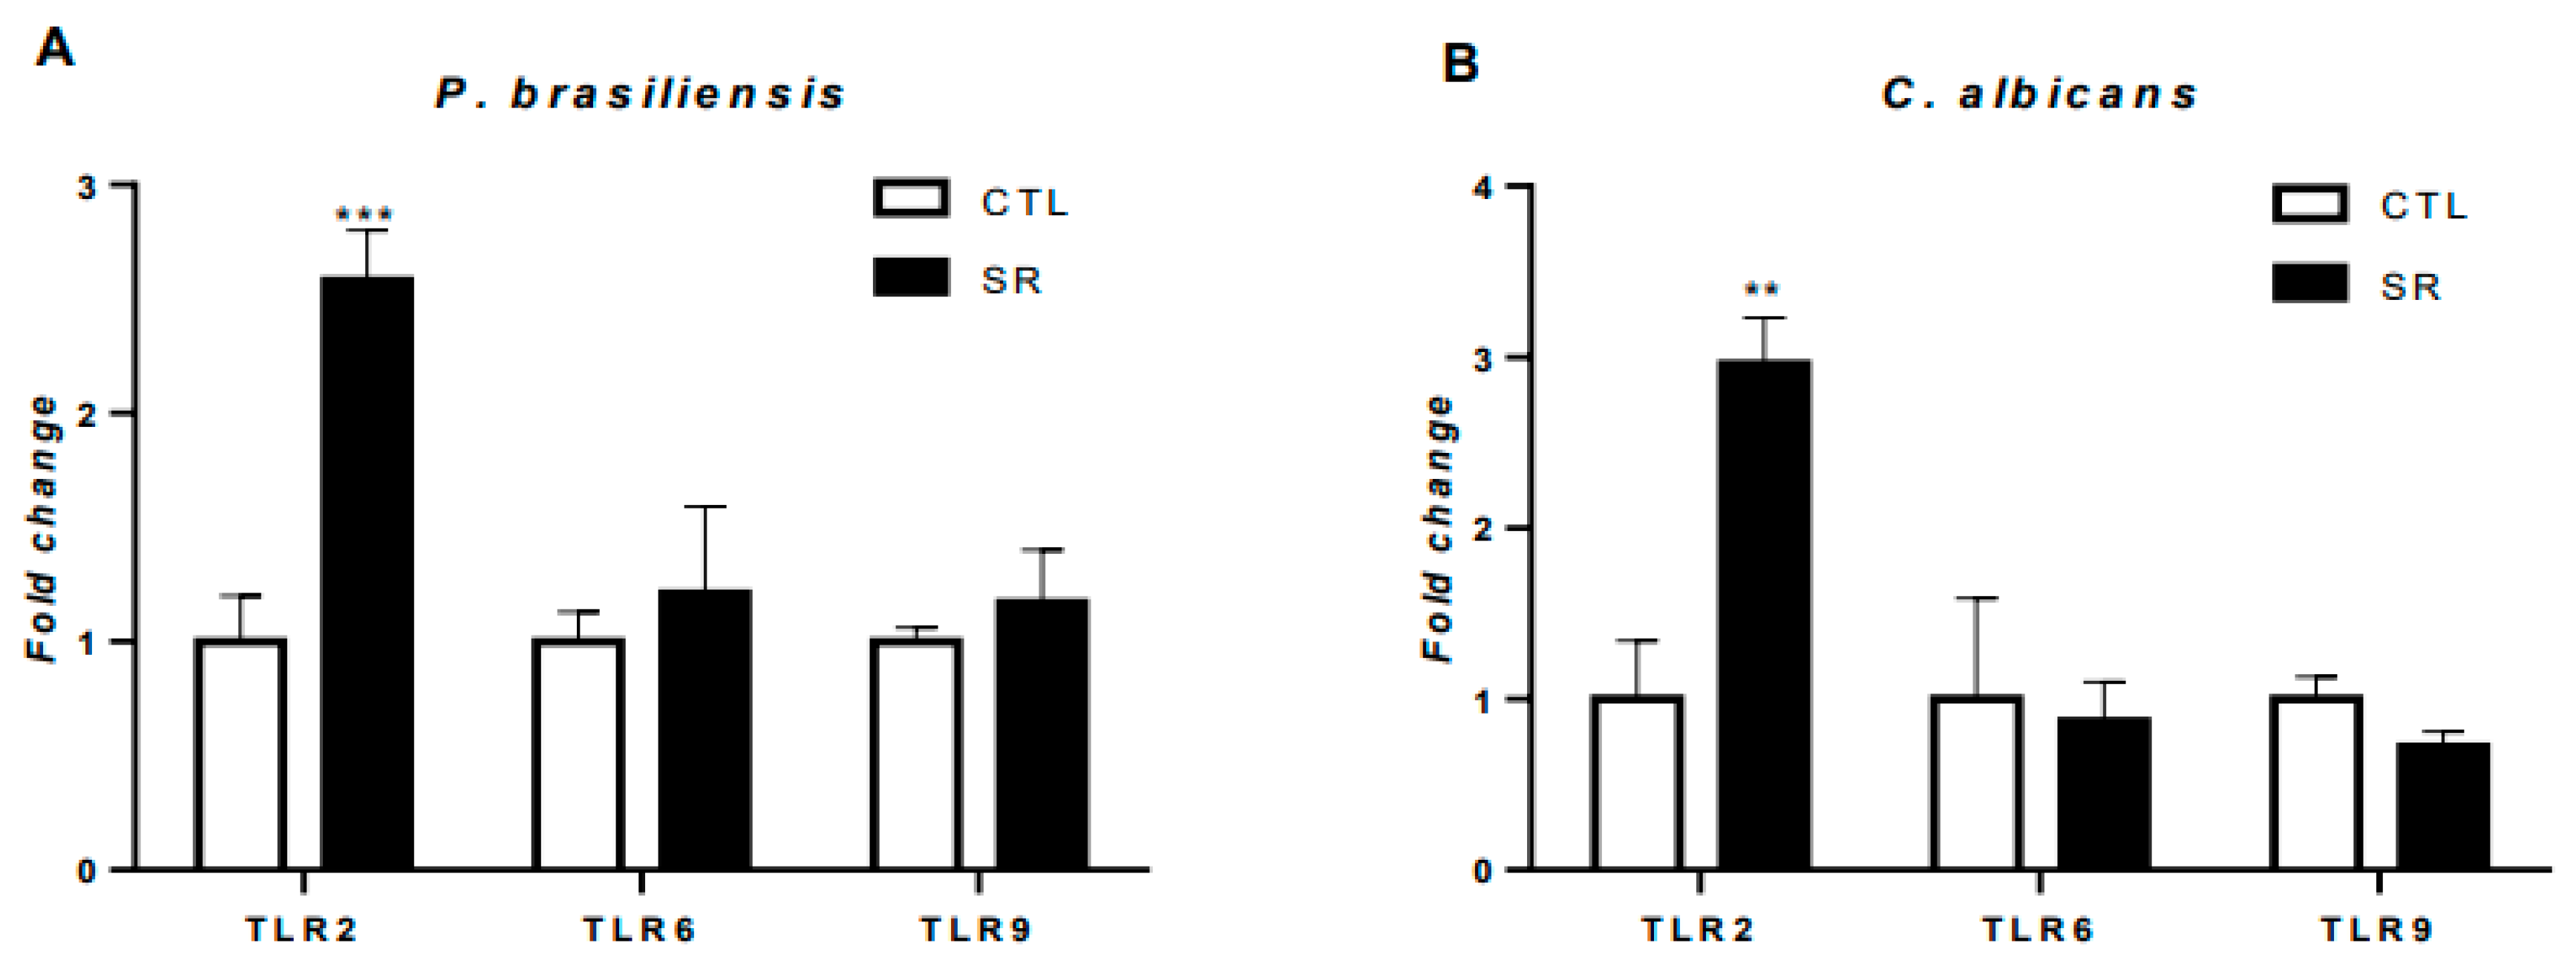
19]. Here, we observed a significant increase in TLR2 expression in animals restricted and infected with fungi, suggesting that restriction and fungal infections played a role in this increase. Choteau et al. (2017) observed that TLR2 deficiency resulted in increased intestinal inflammation and
C. albicans population growth, suggesting the involvement of this receptor in local homeostasis. Interestingly, Nakaira-Takahagi et al. (2011) observed that TLR2 and mannose receptors are the primary receptors in recognizing gp43 (immunodominant antigen highly secreted by
P. brasiliensis) on monocytes. Additionally, several studies also observed an increase in TLR2 expression induced by
P. brasiliensis infection, which corroborates the results in B-1 cells obtained in this work [
36,
37,
38,
39]. The specificity of TLR2 for cell wall components in fungi is a critical factor for the more significant increase in gene expression in animals stimulated intraperitoneally with
C. albicans and
P. brasiliensis.
It is known that cytokines are secreted proteins crucial in regulating and coordinating cellular activities for innate and adaptive immune responses [
40]. Therefore, evaluating the profile of cytokines produced by B-1 lymphocytes is of utmost importance since B-1 lymphocytes are producers of antibodies and cytokines [
10,
19,
41,
42]. The results of the expression of cytokine genes suggest that sleep restriction directly impacts the expression of these genes. However, it is possibly also linked to the particular characteristics of the inoculated microorganism. Studies have observed that IL-12 protects against mice's
P. brasiliensis and
C. albicans infection [
43,
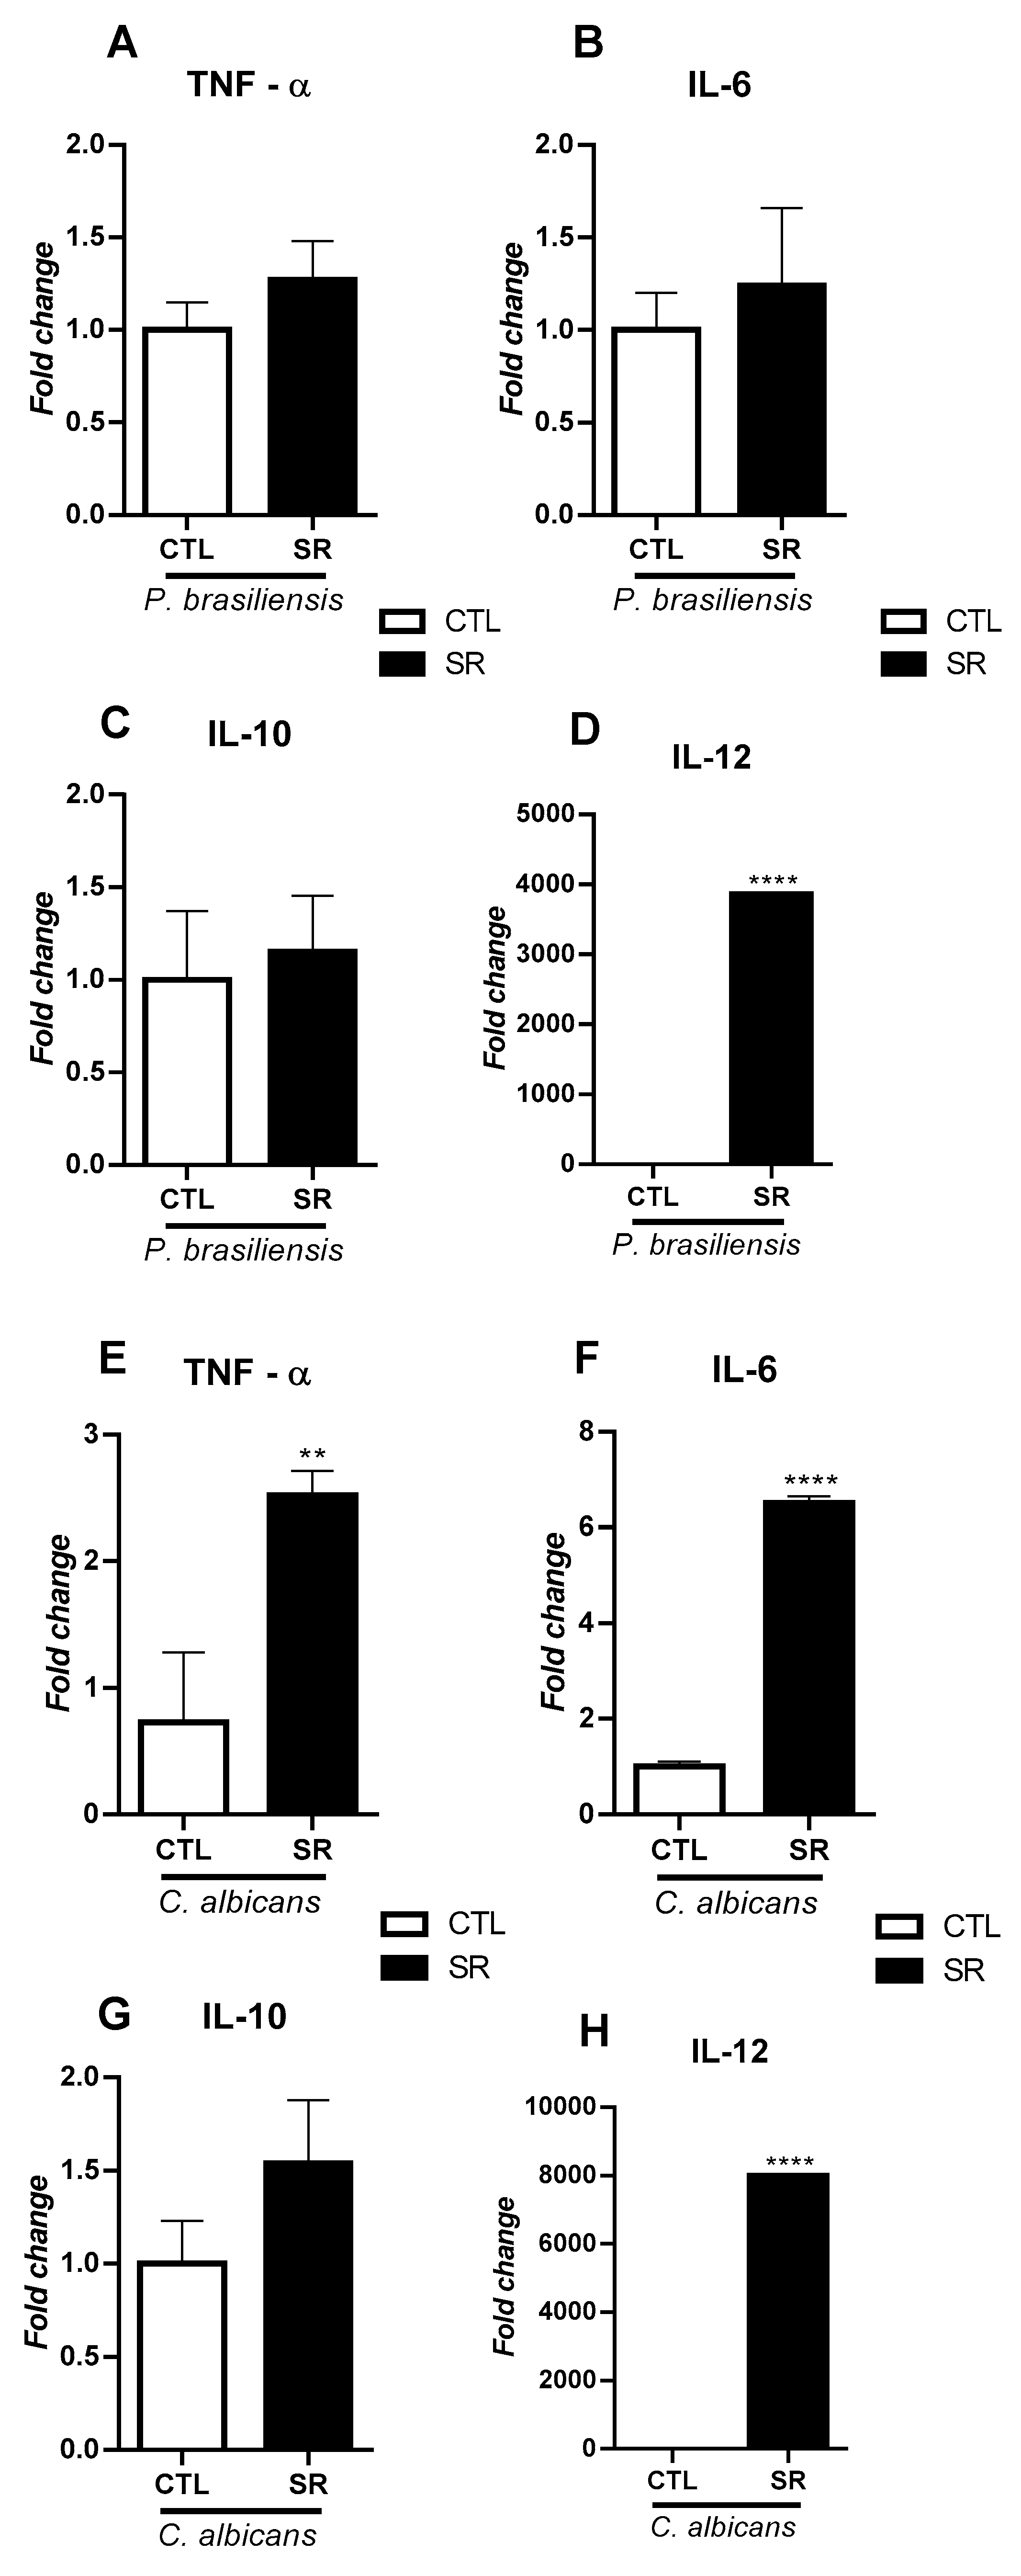
44]. The stress caused by sleep restriction increased the expression of IL-12 in animals for both models of fungal infection:
C. albicans and
P. brasiliensis. These data suggest that stress may have directly impacted the expression of IL-12 in B-1 cells independently of the individual characteristics of the fungi used. The fact that B-1 cells increase the expression of IL-12 after sleep restriction in all fungal models tested is interesting to explore, as this cytokine is essential for polarizing the adaptive response towards a Th1 profile.
The expression of IL-6 and TNF-α was evaluated in infected animals. No changes in these cytokines and IL-10 were observed in animals infected with
P. brasiliensis. Besides, our results showed a significant increase in TNF-α and IL-6 cells from sleep-restricted mice infected with
C. albicans. The increased expression of TLR2 may be related to the increased production of these pro-inflammatory cytokines since the activation of TLR2 is associated with the translocation of the transcription factor NF-KB to the nucleus, which generates increased expression of pro-inflammatory cytokines such as TNF-α and IL-6 [
45]. Several studies have shown that sleep restriction induces the production of pro-inflammatory cytokines such as TNF-α and IL-6, but that this type of stress leads to an adaptive Th2 response [
46,
47,
48].
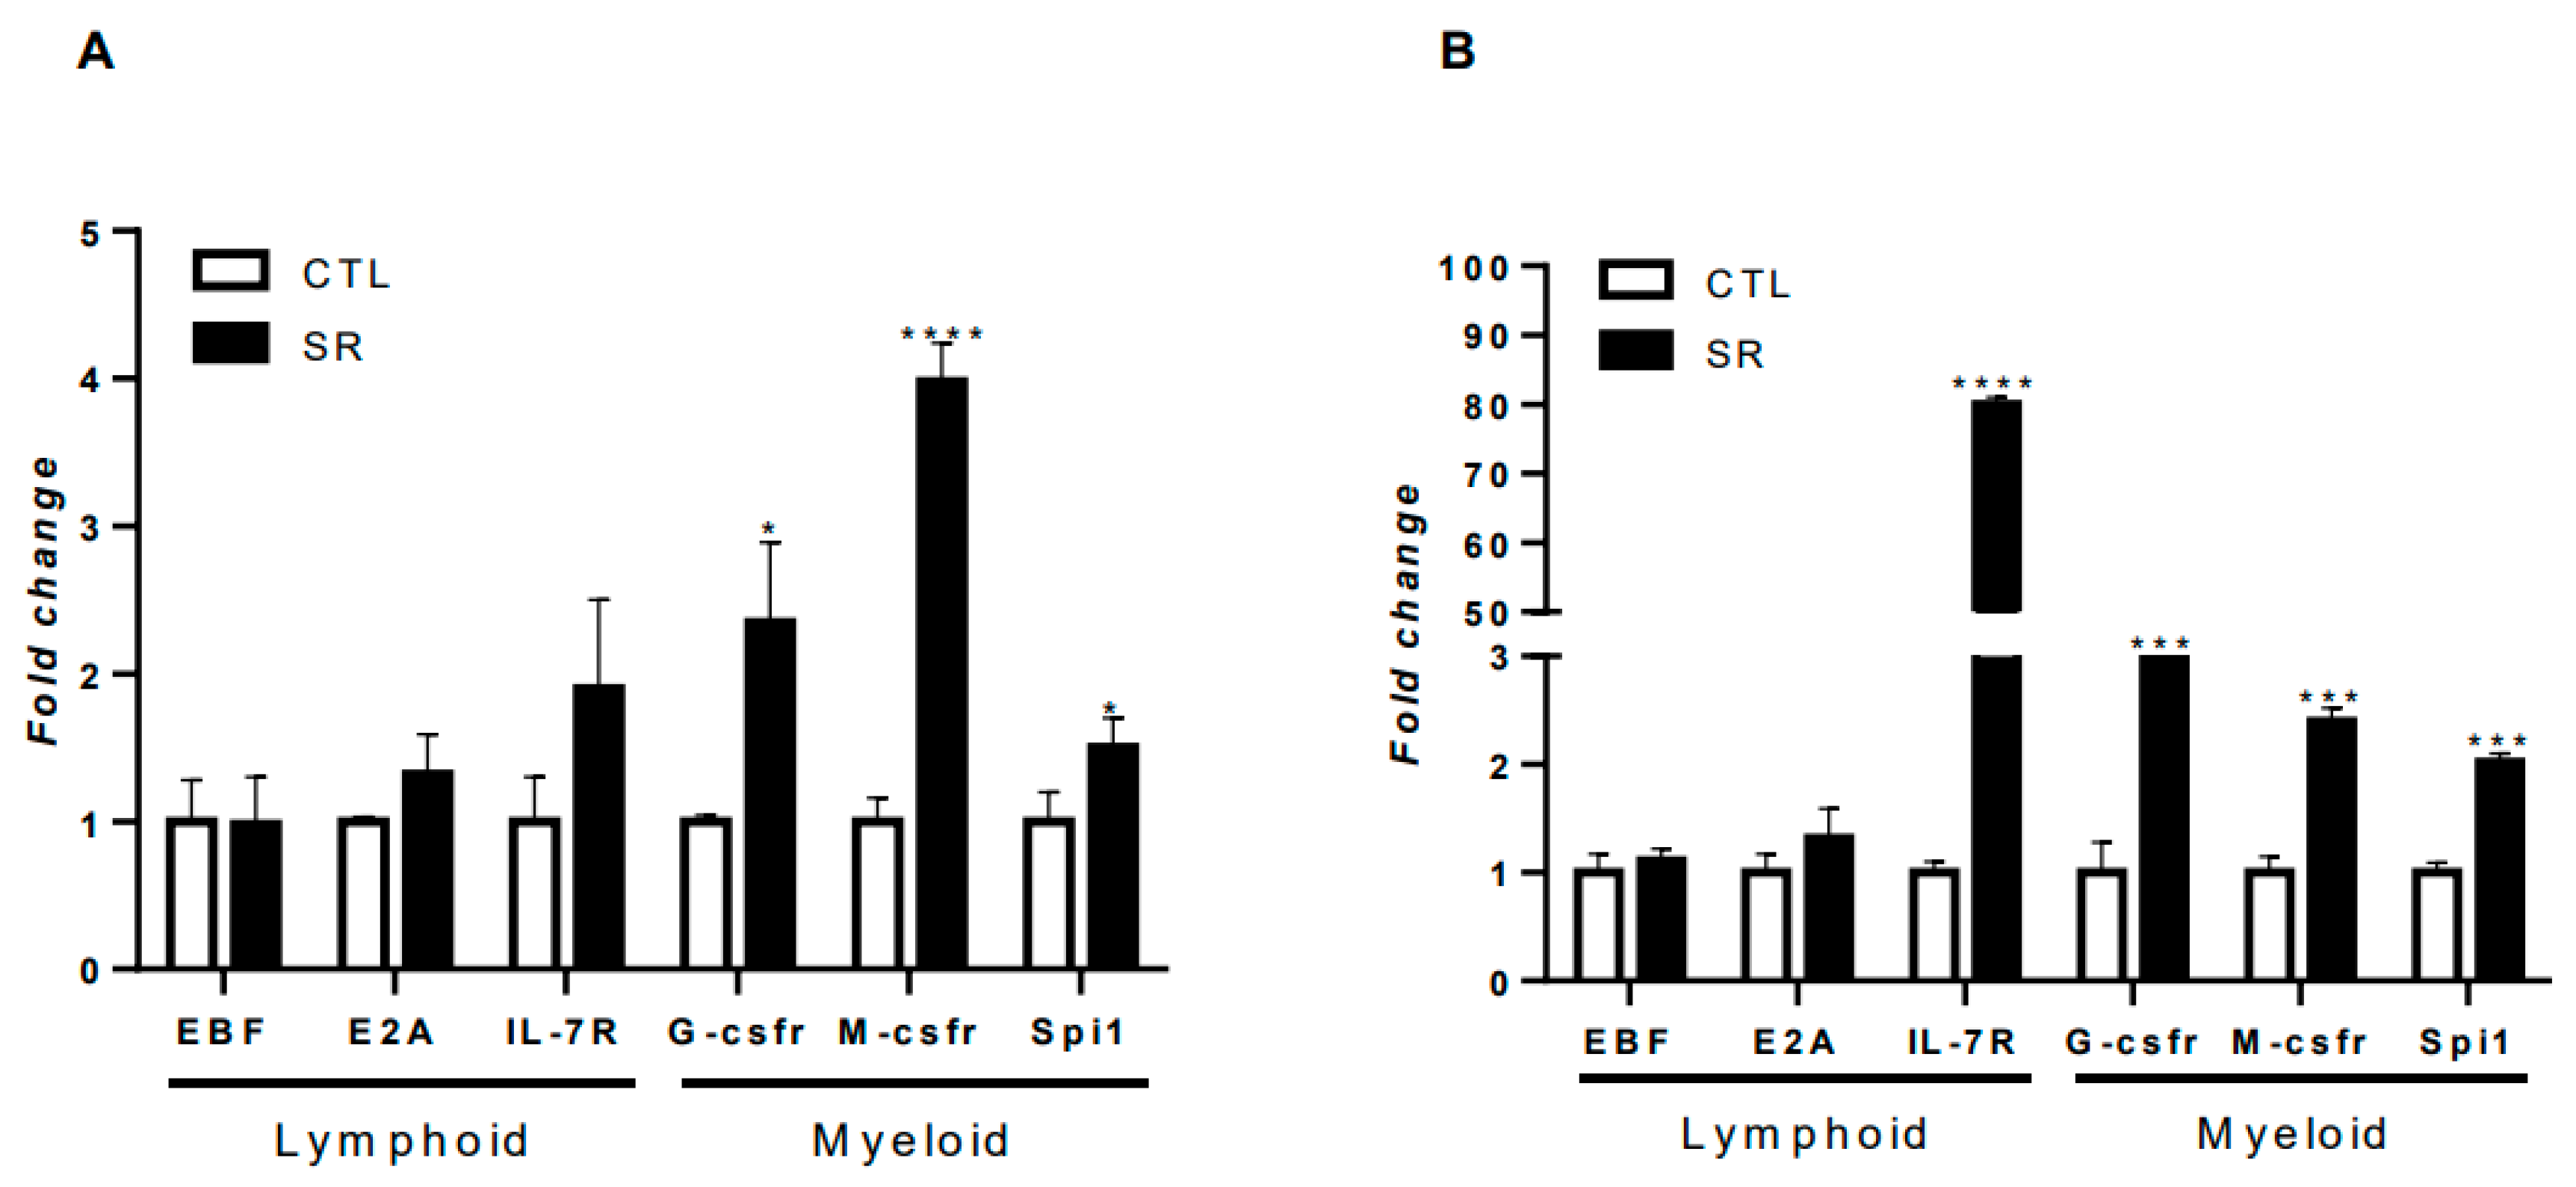
Molecular studies have already demonstrated that B-1 cells express commitment genes for the differentiation of this cell towards a lymphoid and myeloid profile [
12]. The challenge with microorganisms can induce changes in the expression of these genes for myeloid profile, leading to the differentiation of the B-1 cell into a phagocyte [
14,
49]. In a recent study, our group evaluated the effects of sleep restriction on the expression of B-1 lymphocyte commitment genes and observed that sleep restriction alone increased the expression of the myeloid commitment gene G-csfr [
19]. The results obtained in the current study reiterate this relationship, as the polarization of B-1 cells towards the myeloid profile was observed regardless of the microorganism used. However, the particularities of the microorganisms modulated the intensity of expression, being more or less expressed depending on the infection model. In both fungal infection scenarios, an increase in G-csfr, M-csfr, and Spi1 was observed, indicating that sleep restriction helps to increase the differentiation of B-1 lymphocytes into phagocytic cells when challenged with
C. albicans or
P. brasiliensis.
Our work indicates that sleep restriction significantly alters the physiology of B-1 cells, causing a shift towards a myeloid profile independent of the administered microorganism. However, the infection model used to stimulate the acute response of B-1 cells also influences the observed responses in these cells. The data obtained in this study offer valuable insights into B-1 cell behavior and emphasize the importance of investigating immunological changes in the context of sleep restriction. Notably, these observed changes in B-1 lymphocytes can directly affect the immune response quality and homeostatic capacity, demonstrating the significance of maintaining sleep quality.
4. Material and Methods
4.1. Animals
Male C57BL/6J mice, aged 8–10 weeks, were procured from Centro de Desenvolvimento de Modelos Experimentais para Medicina e Biologia (CEDEME, Universidade Federal de São Paulo, São Paulo, Brazil). Animals were kept in environments with 12-hour light/dark cycles, controlled temperature, provided standard solid food at will, and had access to filtered water. All procedures involving animals adhered to the guidelines set by the Brazilian National Council of Animal Experimentation (CONCEA). The study received approval from the local ethical committee (Comissão de Ética no Uso de Animais - CEUA) (CEUA São Camilo #01/018, and CEUA UNIFESP #7018230620). Every attempt was made to minimize animal distress and limit the sample size.
4.2. Sleep Restriction Protocol
The study employed the sleep restriction (SR) technique using the multiple platform method described by Bergmann and colleagues in 1996 [
50]. This approach eliminated social isolation and movement constraints, maintaining the established social hierarchy within the home cage. To acclimate the mice to the SR protocol, they underwent a 1-hour daily adaptation period for three days before the experiment. Mice in the SR group experienced 18 hours of sleep restriction per day, confined to a sleep window from 10:00 am to 4:00 pm, continuously for 21 days, resembling a chronic state of sleep restriction [
51,
52]. This method effectively induced SR, reducing slow-wave sleep by 20% and paradoxical sleep by 100%. Moreover, an increase in total sleep time was observed within the designated sleep window, accompanied by a rebound in slow-wave and paradoxical sleep, confirming the occurrence of SR.
The SR protocol involved a polycarbonate tank (41 × 34 × 17 cm) filled with water and equipped with ten small circular platforms (3 cm in diameter) positioned so the water level remained 1 cm below the platform edges. Up to four animals were housed in each tank, allowing them to move and leap between platforms. Muscle atonia caused the animals to fall off the platforms and wake up, inducing consistent sleep reduction in mice [
51]. Mice were distributed into two groups: (1) control mice in their home cages within the SR room and (2) SR mice inside the SR tanks. After 21 days of sleep restriction, the animals were euthanized by decapitation, and B-1 cells were collected via peritoneal lavage (
Figure 1).
4.3. Flow cytometry analysis
Flow cytometry analysis involved the collection of total peritoneal cells by rinsing them with sterile PBS and quantifying them using a Neubauer chamber. These cells were distributed into micro tubes and diluted with 100 μL PBS (1 × 10⁶ cells/microtube). Purified rat anti-mouse CD16/CD32 (clone 2.4G2, BD Fc Block™, BD Bioscience, San Jose, CA, USA) was applied to prevent nonspecific binding of immunoglobulins to Fc receptors. Subsequently, the total cells were stained with anti-CD23 labeled with phycoerythrin (PE) (clone B3B4, BD) and anti-CD19 linked to allophycocyanin (APC) (clone 1D3, BD). B-1 cells were identified as the CD23- CD19+ lymphocyte population. Cell surface markers were assessed using several monoclonal antibodies, including fluorescein-isothiocyanate (FITC)-conjugated anti-mouse CD80 (anti-CD80 FITC, clone 16-10A1, BD), anti-CD40 FITC (clone 3/23, BD), anti-CD86 FITC (clone GL1, BD), anti-F4/80 coupled with peridinin-chlorophyll-protein - PerCP (clone BM8, BioLegend, San Diego, CA, USA), and anti-MHC-II coupled with PE. B-1 lymphocytes were detected using anti-CD23 FITC (BD) and anti-CD19 APC (BD). Following a 30-minute incubation at 4°C with the respective antibodies (1:100 dilution), the cells were washed, suspended in PBS, and analyzed using a flow cytometer. Intracellular nitric oxide (NO) production was assessed with DAF2-DA (Sigma, St. Louis, MO, United States), while reactive oxygen species (ROS) production was evaluated using the fluorescent reagent H2DCFHDA (Sigma). Peritoneal cells were treated with 5 µM of DAF2-DA or H2DCFHDA for 30 minutes at 37°C in darkness, then washed with PBS and resuspended in 600 µL of PBS. Data was acquired using an Accuri C6 flow cytometer (BD), and FlowJo software version 10.6.2 (FlowJo, LLC, FlowJo™ Software for Mac, Ashland, OR, USA) was used for data analysis.
4.4. Enrichment of peritoneal B-1 lymphocytes
Peritoneal cells from the animals were gathered after completing the sleep restriction regimen. Post-euthanasia, peritoneal cells were obtained through a washing process and underwent a previously outlined cell purification protocol as detailed in [
19,
53]. In summary, cells were treated with Fc block for 40 minutes at 4°C. After PBS rinsing, the total peritoneal cells underwent negative selection using anti-CD23 microbeads (Miltenyi Biotec, Bergisch Gladbach, Germany). Cells that did not express CD23 were positively selected using anti-CD19 microbeads (Miltenyi Biotec). The antibody incubation and purification on magnetic columns followed the manufacturer's guidelines. B-1 cells were identified as CD23
-CD19
+. Flow cytometry verified the purity of the isolated cells. Interventionary studies involving animals or humans, and other studies that require ethical approval, must list the authority that provided approval and the corresponding ethical approval code.
4.5. Quantitative reverse transcriptase-polymerase chain reaction (qRT-PCR)
Quantitative reverse transcriptase-polymerase chain reaction (qRT-PCR) was conducted to investigate the expression of cytokines, Toll-like receptors (TLRs), and factors associated with myeloid and lymphoid commitment in B-1 lymphocytes sourced from sleep-restricted and control mice of the wild type
C57BL/6J strain. Throughout the qRT-PCR procedure, adherence to the Minimum Information for Publication of Quantitative Real-time PCR Experiments (MIQE) guidelines, as outlined by Bustin, was ensured [
54]. Initially, total RNA extraction from purified B-1 cells was carried out using the PureLinkRNA Mini Kit (Ambion; Thermo Fisher Scientific Brand, Grand Island, NY, United States) following the manufacturer's guidelines. Subsequently, total RNA quantification and RNA integrity assessment were conducted via UV absorption using a spectrophotometer (Nanodrop 2000c, Thermo Fisher) and electrophoresis in 1.5% agarose gels, respectively. After DNAse treatment (RQ1 RNase-free DNase; Promega, Madison, WI, United States), cDNA synthesis was executed using the Proto Script First Strand cDNA Synthesis Kit (New England Biolabs Inc., MA, United States). For the qRT-PCR procedure, SYBR Green Real-Time PCR Master Mix (Applied Biosystems, Thermo Fisher Scientific) and the StepOnePlus system (Applied Biosystems) were utilized. The reaction conditions and subsequent analysis were performed as specified in the study by Reis et al. [
14]. Primer sequences were obtained from PrimerBank [
55], and were validated in the study conducted by Reis, Dupin et al. in 2020. The prime sequences are shown in
Supplementary Table S1.
4.6. Fungus
The animals were intraperitoneally infected with the microorganisms on the twentieth day of the sleep restriction protocol (
Figure 1). Each infection model was employed and assessed separately. Thus, for each microorganism used, a new sleep restriction protocol was carried out with a fresh group of animals. Animals from the control group were also infected. After 24 hours of infection, all animals, both the sleep-restricted and control groups, were euthanized. The Pb18 strain of
P. brasiliensis or
C. albicans (ATCC 40006 strain) were cultured and maintained at the Laboratory of Cellular Immunology and Biochemistry of Fungi and Protozoa, UNIFESP campus Diadema.
P. brasiliensis was cultured in semi-solid YPD (yeast extract peptone dextrose) medium in culture tubes at 37°C for six days to promote growth of the yeast phase of the fungus. The fungal cells were washed with sterile PBS and meticulously counted using a Neubauer chamber to ensure an accurate inoculum of 1 x 10
6 cells per animal.
C. albicans was cultured in Petri dishes containing semi-solid YPD medium as isolated colonies for 24 hours at 37°C. Following this timeframe, the fungi were washed with PBS and counted to achieve an inoculum of 1 x 10
5 cells per animal.
4.7. Statistical Analysis
The presented data display the mean and standard deviation (SD) and represent at least two experiments. Two-group comparisons were conducted using the student's t-test. For comparisons involving multiple groups, analysis of variance (ANOVA) followed by Tukey's post-test was employed. P values <0.05 were considered significant. Statistical analyses were conducted using PRISM version 6.00 (GraphPad Software, La Jolla, CA, USA;
www.graphpad.com).
Figure 1.
Workflow used to analyze B-1 cells. Male C57BL/6J mice were distributed into two groups: sleep-restricted and controlled. The sleep restriction protocol was implemented 18 hours daily for 21 consecutive days (SR21). On the 20th day after the start of the sleep restriction protocol, mice were intraperitoneally infected with C. albicans or P. brasiliensis. After 24 h, total peritoneal cells were collected, and the B-1 population (CD19+CD23-) was analyzed by flow cytometry for the presence of MCHII, CD40, CD80, CD86, ROS, and NO. Additionally, B-1 cells were purified using negative selection with anti-CD23 microbeads and positive selection with anti-CD19 microbeads. Total RNAs from purified B-1 cells were used to evaluate the gene expression of lymphoid and myeloid commitment factors (EBF - Early B-cell factor; E2A - E box protein; M-csfr - Macrophage colony-stimulating factor; Spi-1 - transcription factor PU.1; G-csfr - Granulocyte colony-stimulating factor), cytokines (IL-6, IL-10, IL-12, and TNF-α), and Toll-like receptors (TLR2, -6, and -9).
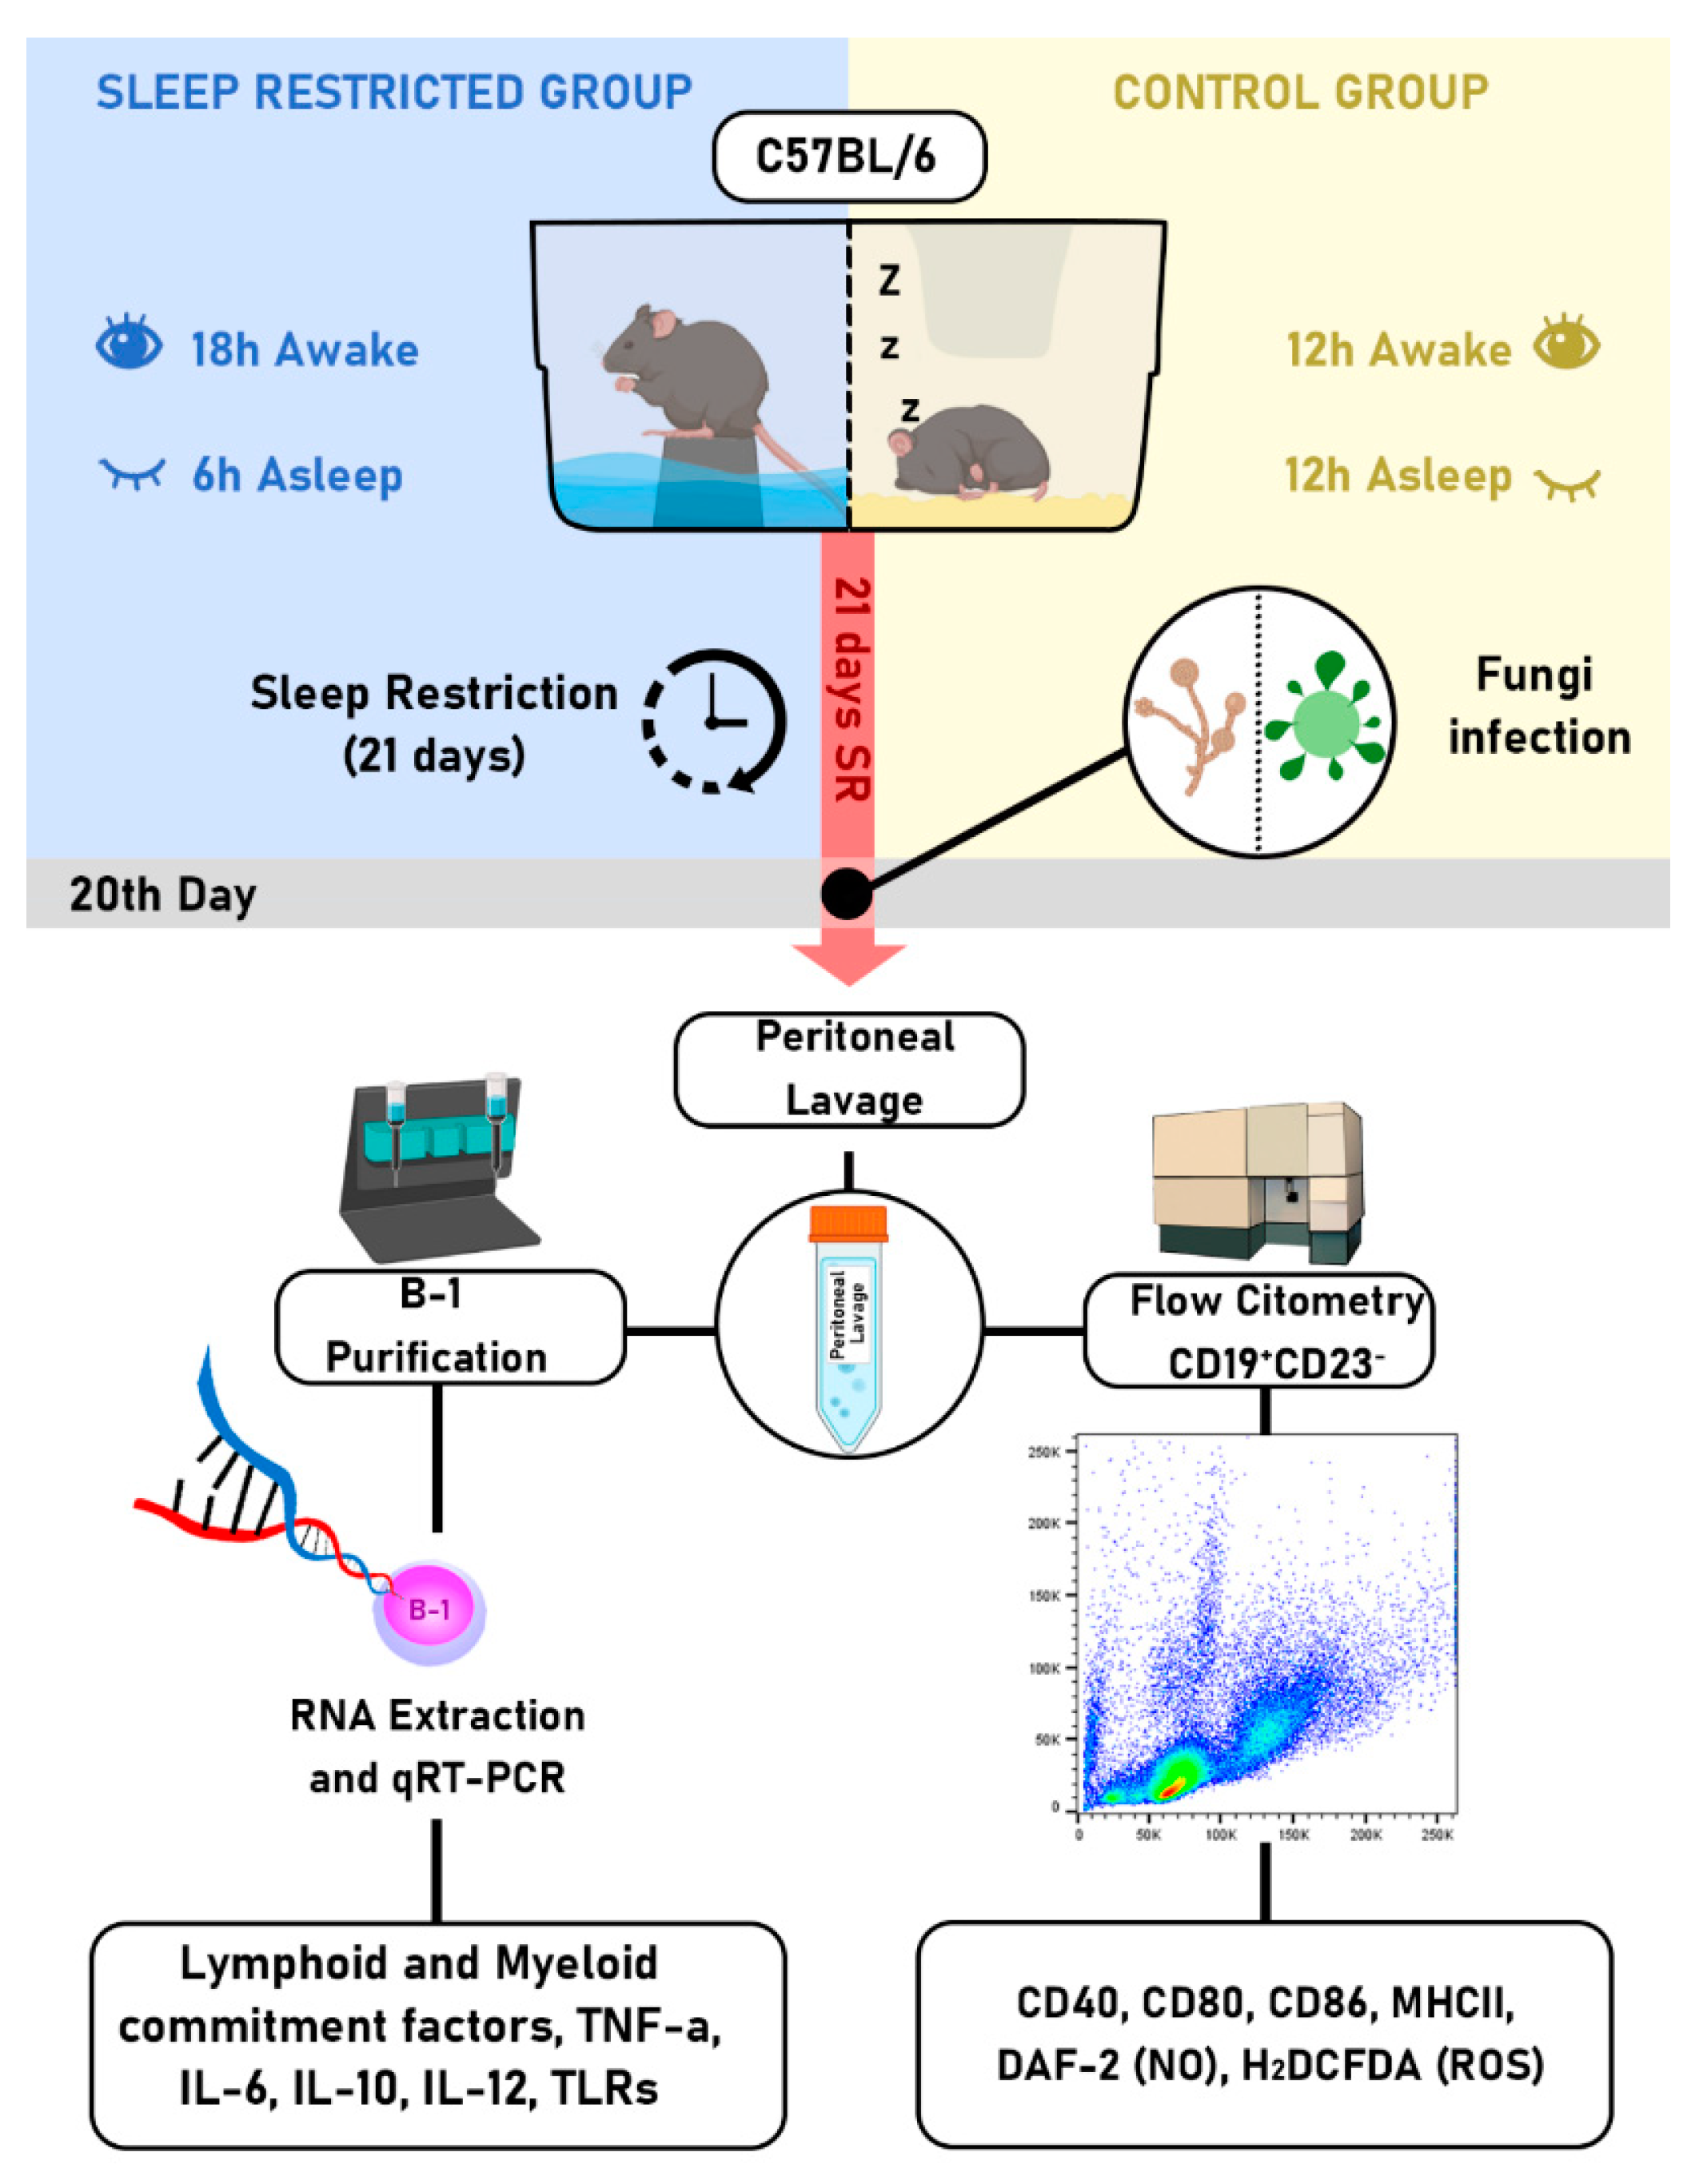
Figure 2.
Assessment of the co-stimulatory molecules CD80 and CD86 in B-1 cells from sleep-restricted mice infected with P. brasiliensis or C. albicans. Animals were subjected to 21 days of sleep restriction and intraperitoneally infected with P. brasiliensis or C. albicans. B-1 cells were analyzed via flow cytometry and identified as CD19+CD23-. The B-1 cell population was then evaluated for CD80 expression (A and C) and CD86 expression (B and D). Bars represent the mean values, and error bars indicate the standard deviation. T-student test (*P < 0.05) was performed. Data represent findings from 3 independent experiments. N= 6 animals per group. CTL - control; SR - sleep-restricted.
Figure 3.
Production of NO and ROS in B-1 cells of sleep-restricted C57BL/6J mice infected with P. brasiliensis or C. albicans. After 21 days of sleep restriction and intraperitoneal infection with P. brasiliensis or C. albicans, B-1 cells were collected by intraperitoneal lavage and labeled with anti-CD19 APC and anti-CD23 PE antibodies and with the DAF2-DA probe to identify NO (A and B) or H2DCF-DA for ROS assessment (C and D). Student's t-test: (*P < 0.05) & (***P < 0.001). The bars represent the mean values, and the error bars are the standard deviation. Data are representative of 3 independent experiments. N= 6 animals per group. CTL – control; SR – sleep restricted.
Figure 4.
Expression of TLRs in B-1 cells from sleep-restricted C57BL/6J mice intraperitoneally infected with P. brasiliensis or C. albicans. After 21 days of sleep restriction and intraperitoneal infection with the pathogens, B-1 cells were collected by intraperitoneal lavage and purified on magnetic columns. Then, RNA was extracted, and cDNA was produced and used to express TLR genes. (A) Relative expression of TLRs in B-1 cells from animals infected with P. brasiliensis and (B) relative expression of TLRs in B-1 cells from animals infected with C. albicans. Student's t-test (***P < 0.001 and **P < 0.01). The bars represent the mean values, and the error bars are the standard deviation. N= 6 animals per group. CTL – control; SR – sleep restricted.
Figure 5.
Expression of TNF-α, IL-6, IL-10, and IL-12 in B-1 cells from sleep-restricted C57BL/6J mice intraperitoneally infected with P. brasiliensis or C. albicans. After 21 days of sleep restriction and intraperitoneal infection with P. brasiliensis or C. albicans, B-1 cells were collected by intraperitoneal lavage and purified on magnetic columns. Then, RNA was extracted, and cDNA was produced and used to express cytokine genes. Relative expression of TNF-α (A and E), IL-6 (B and F), IL-10 (C and G), and IL-12 (D and H). Student's t-test (**P < 0.01, ****P < 0.0001). The bars represent the mean values, and the error bars are the standard deviation. N= 6 animals per group. CTL – control; SR – sleep restricted.
Figure 6.
Expression of lymphoid and myeloid commitment factors in B-1 cells from sleep-restricted C57BL/6J mice intraperitoneally infected with P. brasiliensis or C. albicans. After 21 days of sleep restriction and intraperitoneal infection with (A) P. brasiliensis or (B) C. albicans, B-1 cells were collected by intraperitoneal lavage and purified on magnetic columns. Then, RNA was extracted, and cDNA was produced and used for gene expression. Student's t-test (*P < 0.05, ***P < 0.001, ****P < 0.0001). The bars represent the mean values, and the error bars are the standard deviation. N= 6 animals per group. CTL – control; SR – sleep restricted.

