Preprint
Article

Holistic Environmental Risk Index for Oil and Gas Industry in Colombia

Altmetrics

Downloads

101

Views

45

Comments

0

A peer-reviewed article of this preprint also exists.

Submitted:

13 February 2024

Posted:

13 February 2024

You are already at the latest version

Alerts
Abstract
Risk management for technological hazards mainly focuses on the consequences on human lives. Although technological risk analysis evaluates environmental vulnerability, it does not reflect the consequences on environmentally exposed elements, such as rivers, water springs, flora, and fauna. This paper's objective was to propose a conceptual framework and create a multidisciplinary evaluation model for environmental risk analysis in the oil and gas industry. Initially, the problem was approached from a global perspective to justify the necessity of a holistic environmental risk analysis methodology in the oil industry, using environmental risk factors as well as underlying factors, such as environmental fragility and lack of resilience. The holistic assessment was carried out based on probabilistic risk analysis methodologies to obtain a holistic environmental risk index, HERI. This methodology was applied to an oil and gas industry company in Colombia. This allowed greater disaggregation of the results to establish priorities for risk reduction actions and identify the company's weaknesses.
Keywords: 
Subject: Environmental and Earth Sciences  -   Environmental Science

1. Introduction

Environmental risk is the quantitative or qualitative evaluation of the danger of an adverse impact on the environment—which refers to the probability of the occurrence of an unfavorable situation that may lead to the destruction of ecosystems, alongside the disappearance or gradual deterioration of biodiverse populations, loss of quality of life and natural resources, and an impact on energy—due to the economic activity in a certain area [1]. Anthropogenic activities have caused the overexploitation of natural resources, resulting in biodiversity loss in ecosystems worldwide [2]. Another significant environmental concern affecting these ecosystems is accidental or chronic oil pollution [3]. In 2010, the largest oil spill in United States history that occurred on the coast of the Gulf of Mexico caused one of the most significant environmental disasters in history [4]. In 2018, the Lizama 158 well located in the municipality of Barrancabermeja, Santander, Colombia, presented an oil outcrop, which caused, according to official figures, the deaths of 2,442 animals and affected 5,507 trees [5]. In Colombia, the operational risk in the hydrocarbon transportation phase is mainly due to repetitive actions carried out by third parties, such as external fraud, fortuitous events, and terrorist acts, which can lead to the collapse of sensitive ecosystems [6,7,8].
The concept of risk pertains to something uncertain, tied to random chance and potentiality, regarding events that have not yet occurred. It is abstract, complex, and can only exist in the future. Recent efforts to assess disaster risk for management purposes have revolved around calculating the potential economic, social, and environmental impacts of a physical event at a specific location and time. However, there has been a lack of comprehensive conceptualization of risk; instead, fragmentation has prevailed as different disciplinary approaches estimate or calculate risk separately. Achieving an interdisciplinary estimation of risk requires consideration not just of projected physical damage and casualties or economic losses but also of social dynamics along with organizational and institutional aspects [9].
A global bibliographic review was conducted followed by a specific focus on Colombia to assess the ecological impact of technological events in the oil and gas industry on the environment. The initial findings reveal that environmental disasters resulting from hydrocarbon project activities, particularly oil spills, have had significant negative effects on marine ecosystems [10,11,12,13,14,15], including on corals, benthic organisms, fish, mollusks, birds, plankton, mangroves, marine mammals, and reptiles. The consequences range from obstructing the sunlight necessary for photosynthesis to contaminating the food chain and reducing biodiversity [16,17,18,19,20,21]. For Colombia, only a spill that occurred in Cabo Manglares in the department of Nariño in 1976 [22] was found, where the sinking of the Tanker St. Peter caused an oil leak, impacting the fishing industry and mangroves in the Tumaco municipality. While ocean spills have catastrophic effects, they rarely occur, especially in Colombia. However, from 1980 to 2020, over 2,800 terrorist attacks on oil infrastructures led to more than 3.7 million barrels of hydrocarbons spilling into the environment. This has impacted the soil quality and various ecosystems, including surface waters, flora, fauna (including birds, mammals, and reptiles), amphibians, and fish [8]. Therefore, terrorist attacks are the major hazard for oil spills in Colombia [8,23,24].
Vulnerability can be defined as an internal risk factor of a subject or system exposed to a hazard, corresponding to its intrinsic predisposition to be affected or susceptible to suffering damage [9]. Ecological vulnerability in this study refers to the predisposition or susceptibility of the environment to be affected or suffer damage in case of an oil spill. The susceptibility of ecosystems, flora, and fauna to be affected initially depends on the volume and characteristics of the oil. However, ecosystems at risk may vary in their levels of vulnerability because oil sensitivity is inherent to the environment, which may be less or more sensitive depending on its characteristics [25,26,27,28]. Ecological vulnerability is a term used to describe how easily a specific system can change due to internal or external disturbances, reflecting its sensitivity and lack of adaptation capacity. Researchers believe that vulnerability consists of three elements: exposure, sensitivity, and adaptive capacity. Exposure measures a system's susceptibility to environmental and social stresses. The value of vulnerability determines the potential degree of system damage under the influence of accidents, while sensitivity reflects the unit's response to stressors [29,30,31,32,33,34,35,36].
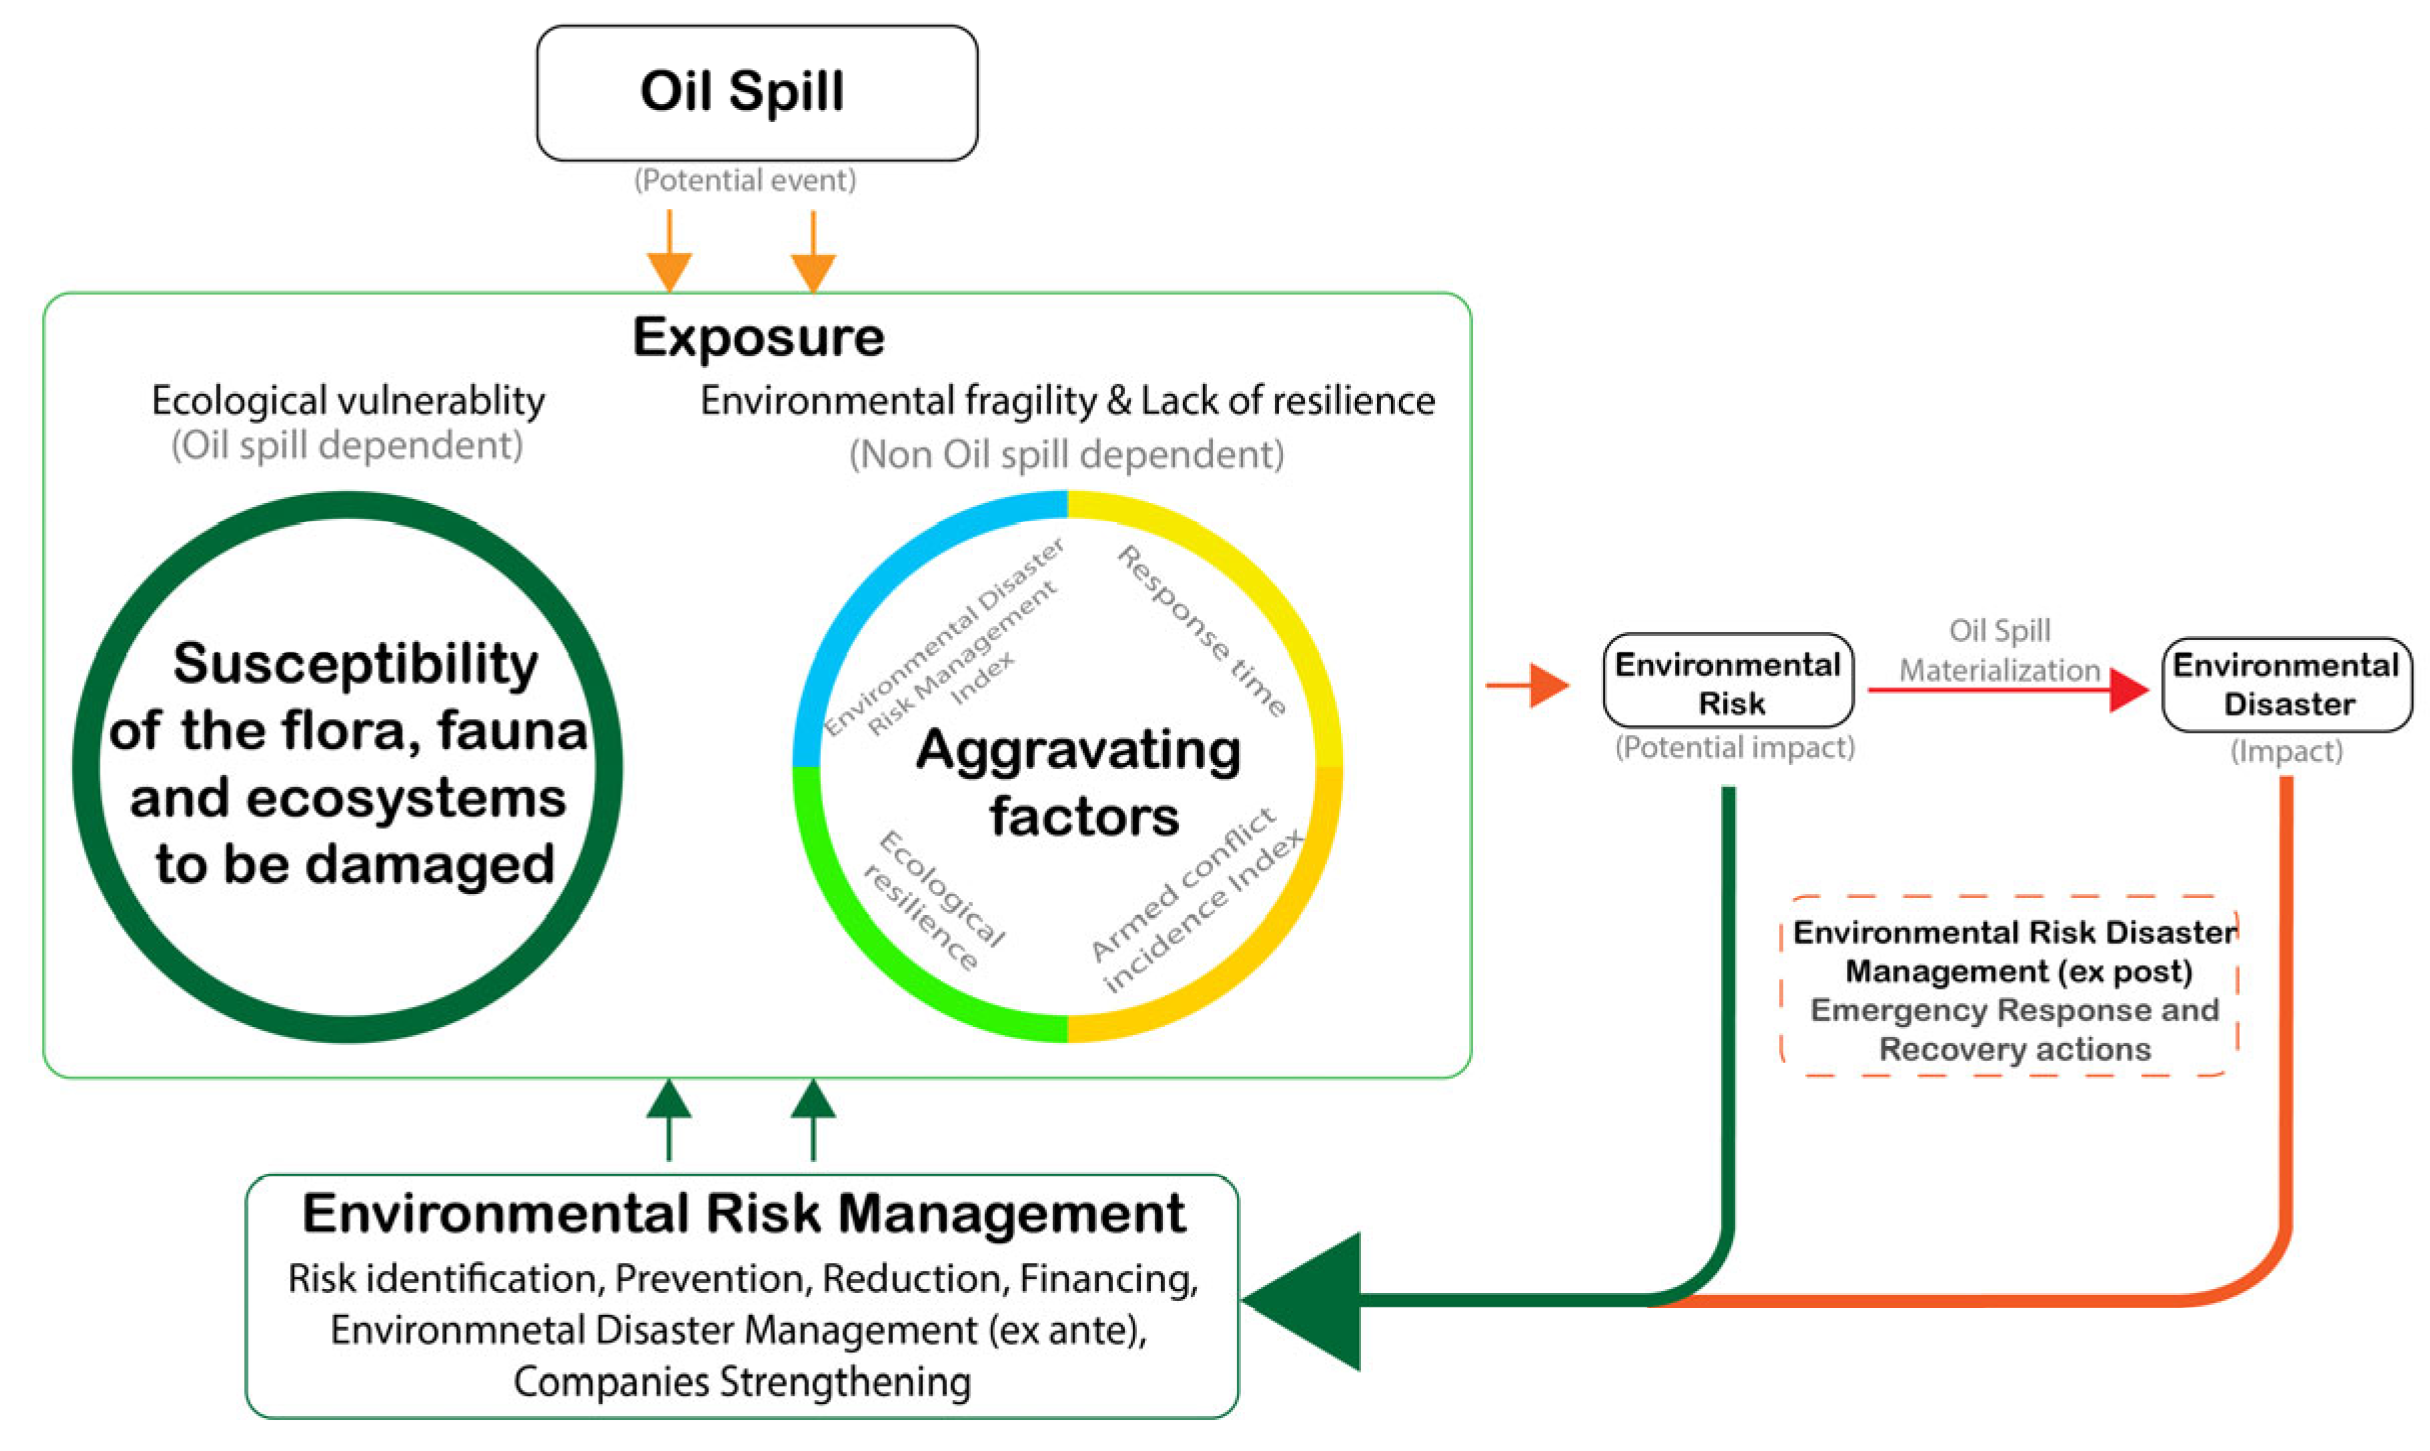
A holistic approach to risk assessment encompasses risk from a complete viewpoint. This involves considering the potential ecological damage directly related to hazard events, as well as understanding how non-hazard-dependent factors, such as social, economic, and environmental elements, exacerbate existing ecological risk conditions in terms of anticipatory capacity, resistance, response, and recovery capabilities [37]. Based on the holistic approach for the case of urban seismic risk evaluation and evaluating risk from a holistic perspective to improve resilience at a global level [37,38,39], we define environmental risk as the interaction between hazard, exposure, and vulnerability, where hazard typically pertains to ecological impacts resulting from oil spill events. Exposure indicates the susceptibility of the flora, fauna, and ecosystems to be damaged (ecological vulnerability directly associated with oil spill events), along with underlying non-oil-spill-dependent factors that exacerbate existing risk conditions due to a lack of capacity to anticipate, resist, respond to, or recover from adverse impacts and environmental fragility (Figure 1). The main objective of this paper was to develop a holistic methodology to evaluate the environmental risk associated with projects in Colombia's hydrocarbon sector.

2. Materials and Methods

2.1. Holistic Environmental Risk Index

The holistic environmental risk index definition was based on the holistic risk evaluation methodology proposed by Cardona [38], Carreño et al. [39], and Marulanda Fraume et al. [37] and is calculated using the following equation:
H E R I = E R 1 + F
This expression, referred to as Moncho's Equation in the literature, is formulated by combining an ecological risk index denoted as ER and an aggravating coefficient called F. Both are constructed using composite indicators [37,39]. This coefficient, F, depends on the weighted sum of a set of aggravating factors related to environmental fragility and lack of resilience.
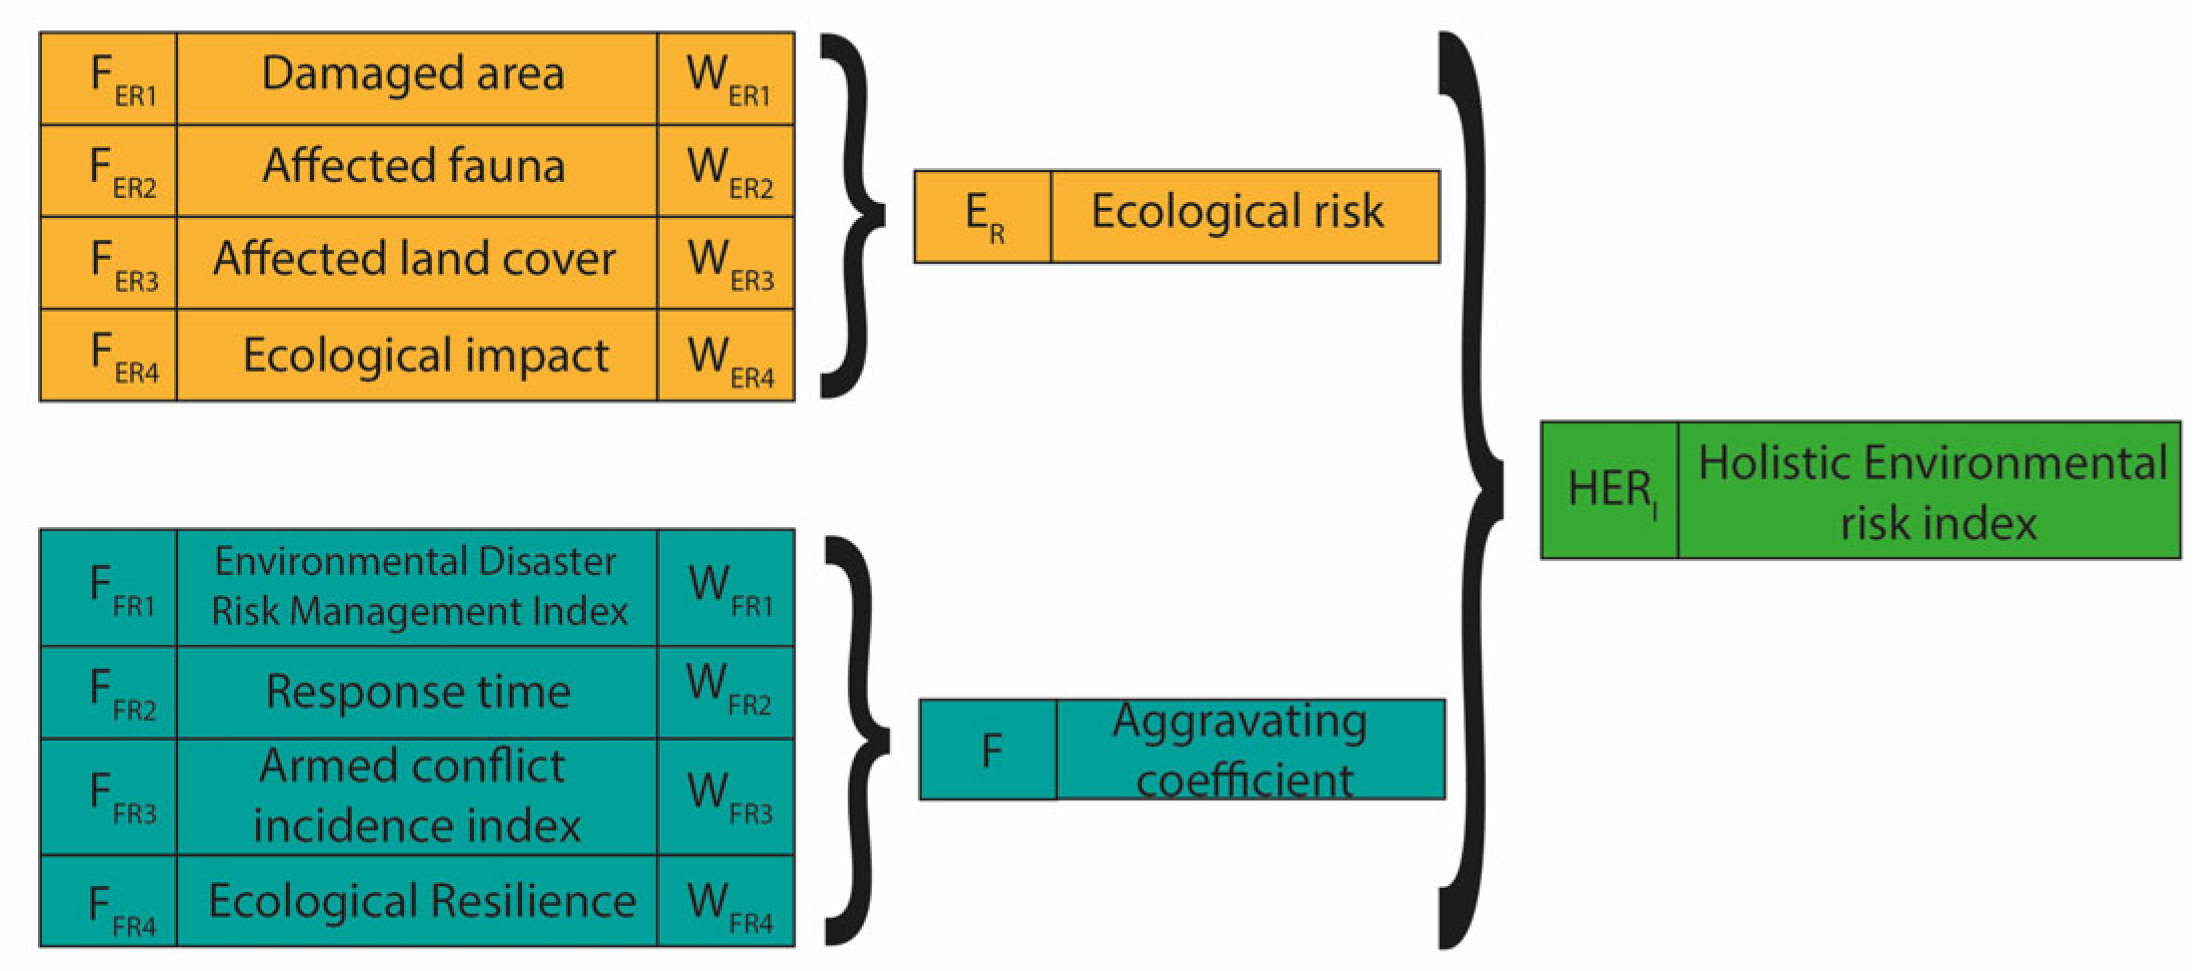
To adapt the methodology, for the ER variable, we designed probabilistic risk measures for indicators such as the affected area, affected fauna, affected land cover, and ecological impact. For variable F, we considered the environmental fragility of the study area and the lack of resilience of the company responsible for operations. According to a holistic approach, these conditions can magnify ecological damage to the environment. Indicators including ecological resilience, the armed conflict index, the time response, and an environmental disaster risk management index adapted from Carreño and Cardona were also considered in this process [40,41,42]. Figure 2 illustrates the structure of the indicators utilized to evaluate the holistic environmental risk index. According to Equation 1, it is assumed that the total risk's maximum value can be twice that of the ecological risk. This suggests that as the indices of aggravating factors decrease, so too does the environmental impact; conversely, a higher index signifies a greater impact on the environment.
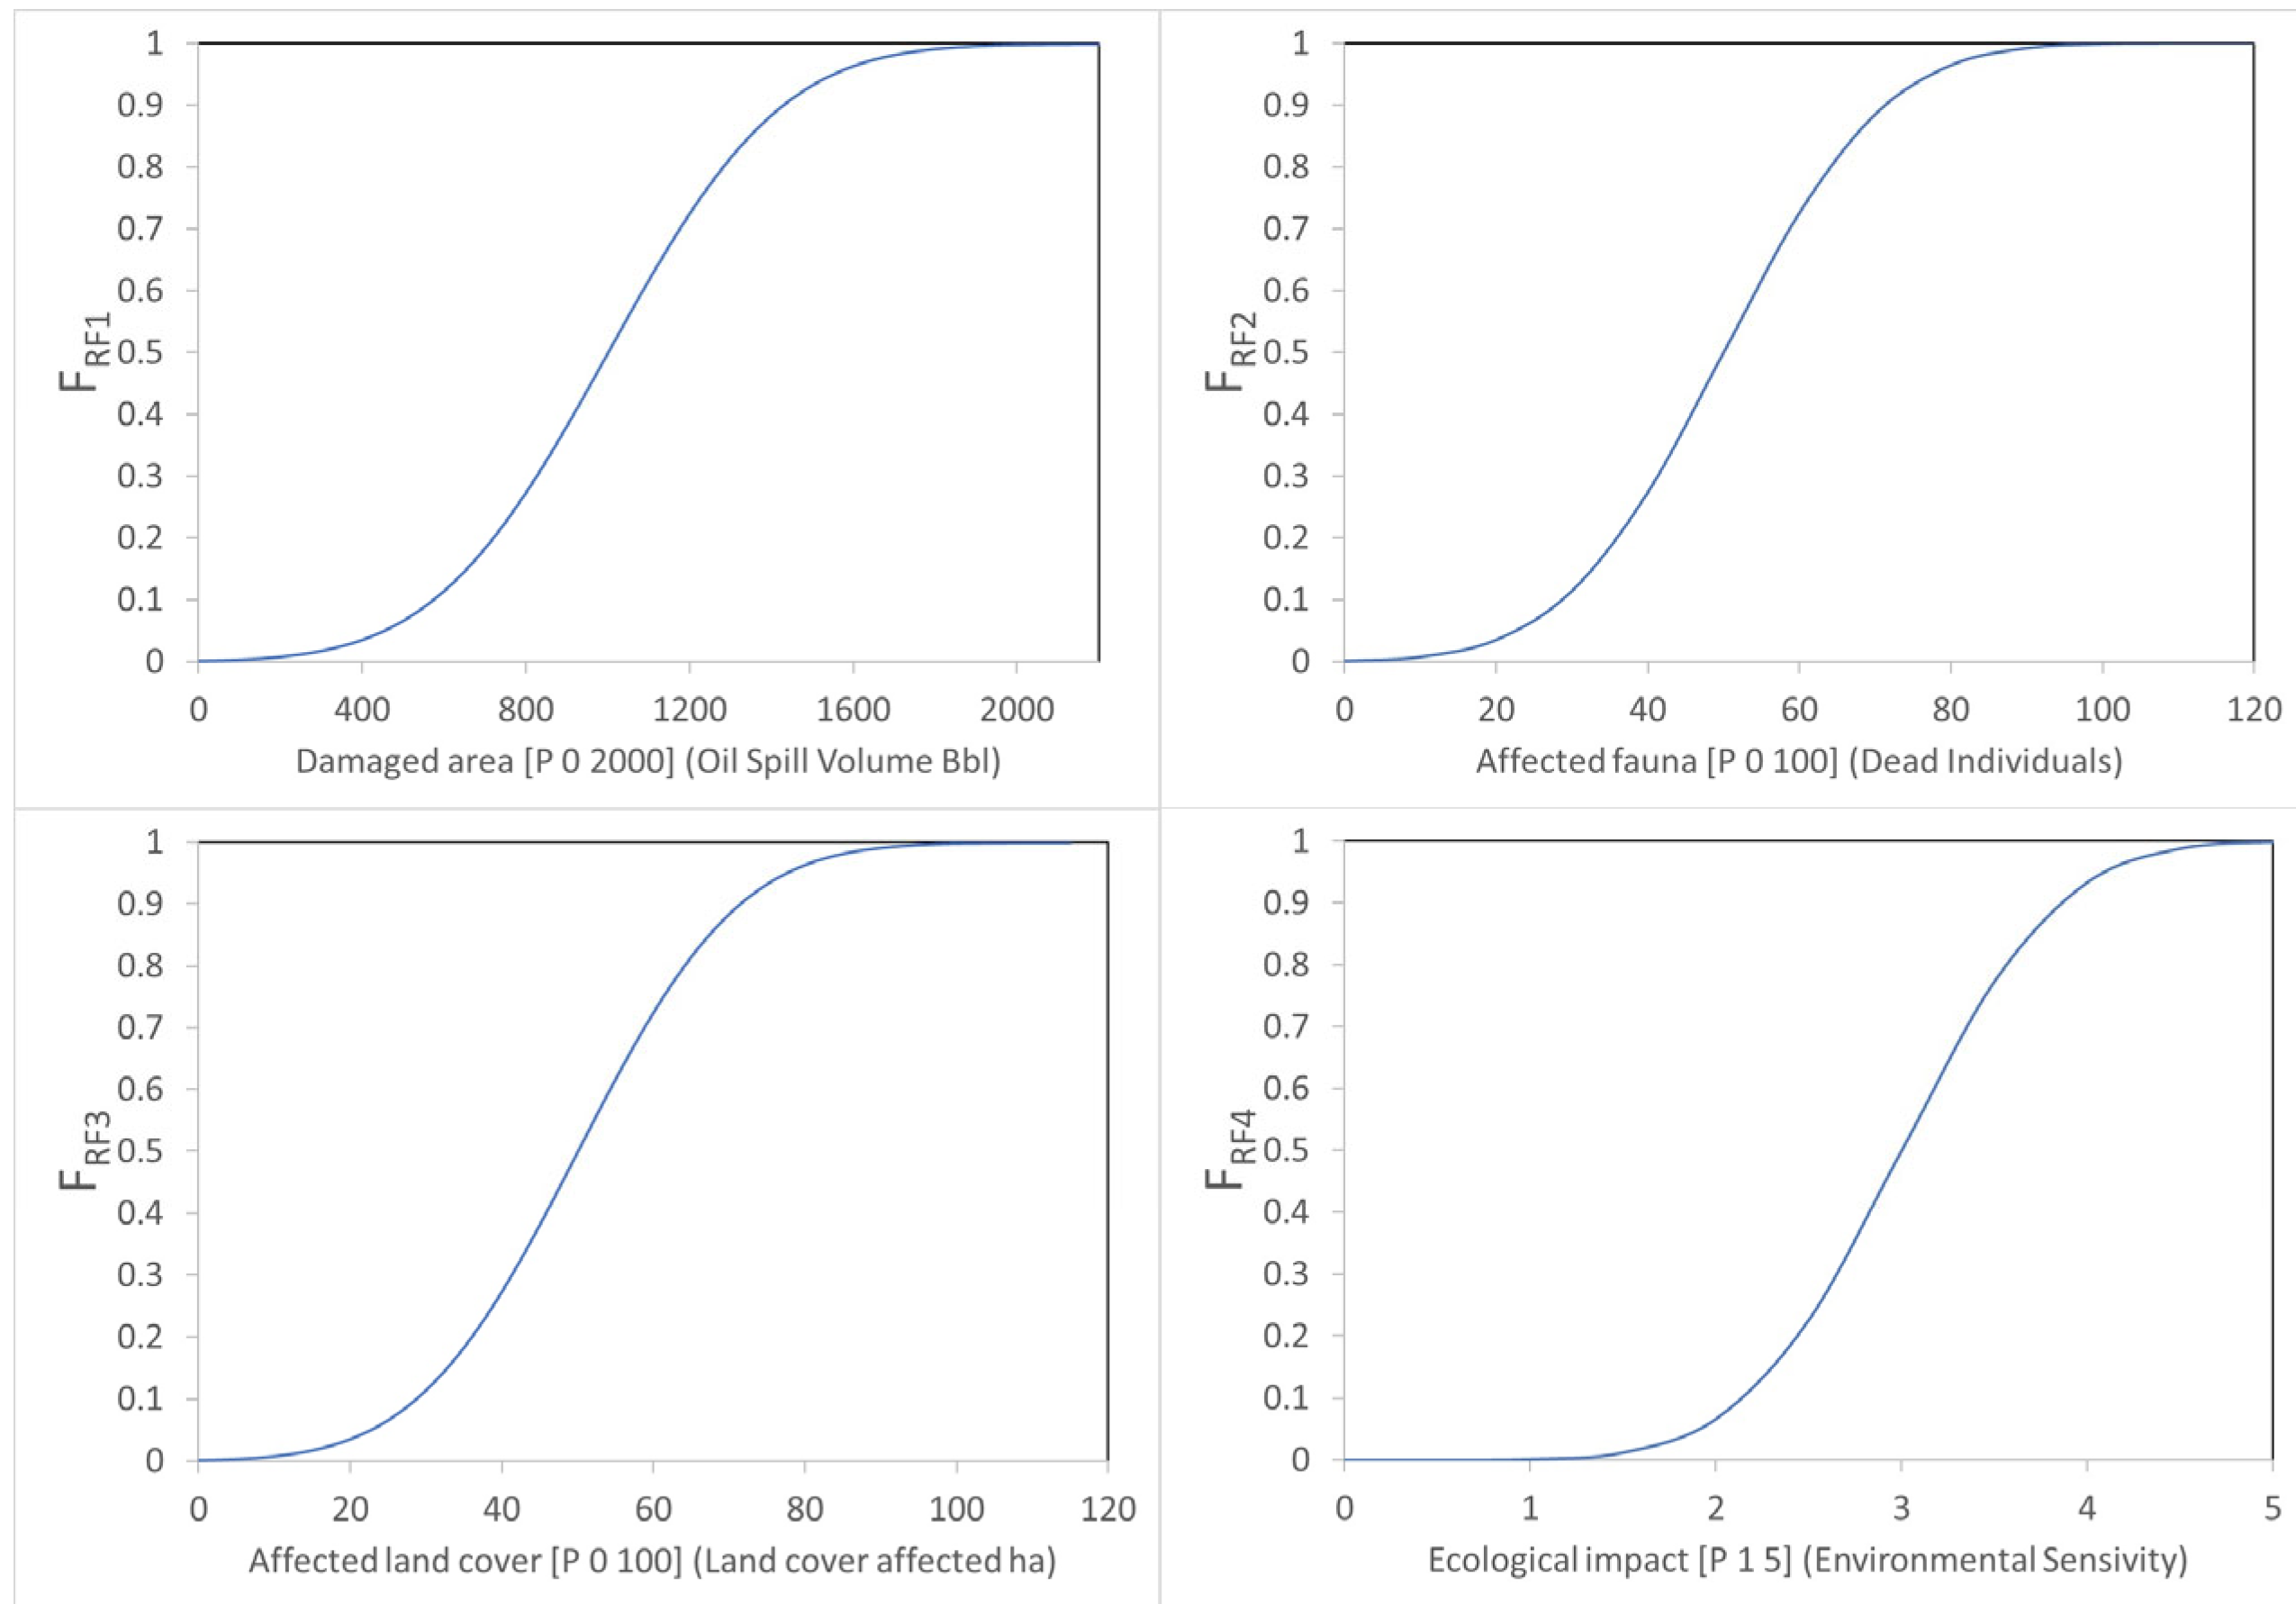
Expressing the ER and F index results as a linear combination of relative indicators may overlook potential interactions and variations in weighting. While this simplification may be acceptable due to data uncertainties, adopting non-linear functions for risk indices could be more suitable and enable better comparisons. This approach requires defining specific function forms with expert support based on past disaster information [43]. Sigmoidal functions are commonly used to determine the physical vulnerability factors in risk assessment. These functions solve the problem of descriptor unit incommensurability and establish a unified normative scheme for risk assessment [37,39,43,44]. Expert opinions and information on previous oil spills were considered when determining the limit values that correspond to the maximum or minimum factor values (1 or 0) at the bottom of each curve. The x-axis represents descriptor values, while the y-axis represents respective risk or aggravation factor values.

2.1.1. Ecological Risk

The ecological risk index ER was calculated following Equation (2), where m is the total number of descriptors, FERi are the component factors, and WERi are their weights.
E R = i = 1 m F E R i × W E R i
The descriptors used included the damaged area, represented as the oil spill volume. This information was computed considering potential risk situations, according to the guide for consequence analysis and quantitative risk analysis [45]. According to the reviewed bibliography, the maximum point of risk is when a spill is greater than 2000 bbl. The second descriptor was the affected fauna, which corresponds to the probable number of dead animals. The maximum risk point was set when the number of deaths was equal to or greater than 100. The third descriptor was the land cover affected. The spilling of oil into the environment affects the land cover; therefore, it is defined as the area in ha of affected land cover. The maximum risk point was set when the area affected was equal to or greater than 100 ha [46]. The last descriptor was the ecological impact. In Colombia, projects in the hydrocarbon sector require an environmental license based on an environmental impact assessment. This assessment evaluates the environmental sensitivity of the ecosystems that could be impacted by the activity. The risk level is determined by the environmental management zoning specified in the environmental license: a sensitivity rating of 1 indicates minimum risk (intervention areas), while a rating of 5 corresponds to maximum risk (exclusion areas). Finally, transformation functions for ecological risk were developed using sigmoidal functions for all cases (Figure 3).
An analytic hierarchy process [39,43,47,48,49,50,51,52] was conducted to calculate the weight for each of the descriptors. Expert opinions were considered using the Delphi method [53,54,55,56,57,58].
Table 1. Weights of the ecological risk factors.
Factor Weight Weight Value
FER1—damaged area WER1 0.41
FER2—affected fauna WER2 0.13
FER3—affected land cover WER3 0.14
FER4—ecological impact WER4 0.32

2.1.2. Aggravating Coefficients

The aggravating coefficient F was calculated following Equation (2), where n is the total number of descriptors, FFRi are the aggravating factors, and WFRi are their weights.
F = i = 1 n F F R i × W F R i
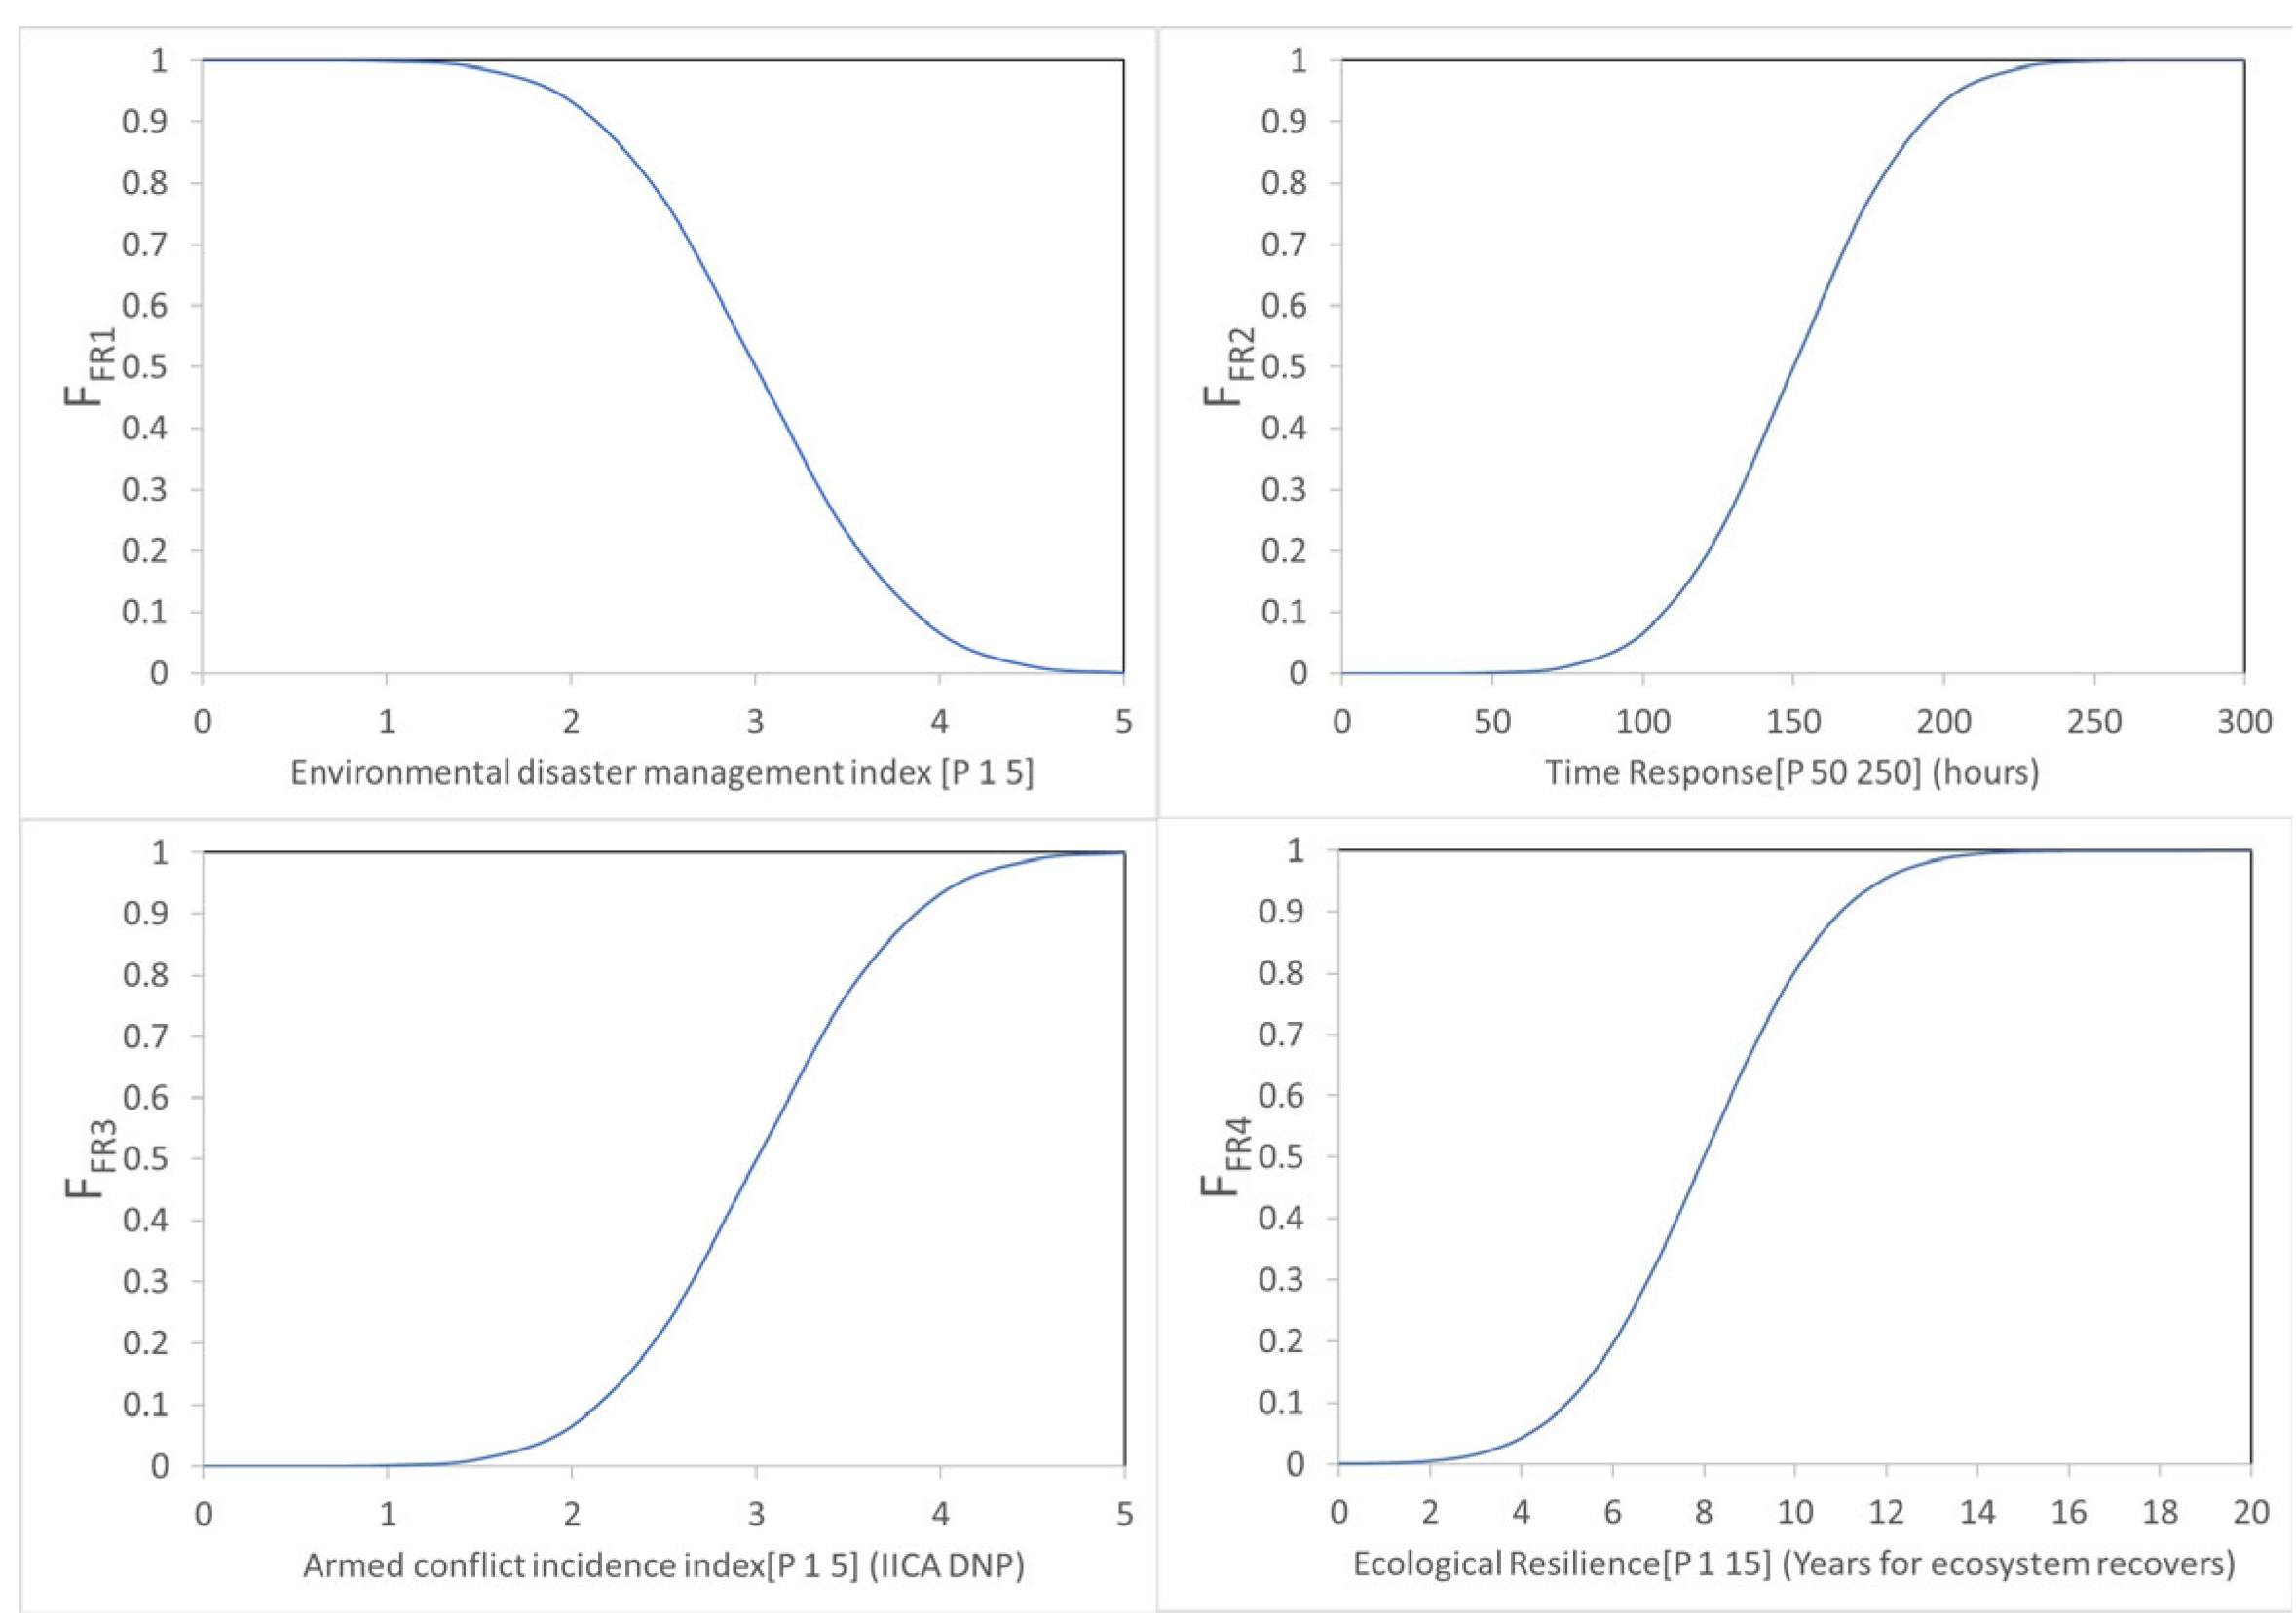
Weaknesses in hazard identification and monitoring and a lack of efficient risk reduction measures and disaster risk management in oil spills significantly increase the environmental impacts [59,60,61,62]. In this case, 4 descriptors were used to evaluate the lack of resilience of companies and the fragility and resilience of the environment when an oil spill occurs.
The first descriptor was the environmental disaster risk management index. Carreño et al. [40,41] designed a disaster risk management index to evaluate the performance and effectiveness of a country's disaster risk management considering the measure of resilience. The index was adapted for our case, which will be explained in detail. The second descriptor was the response time. It has been proven that a quick response reduces the environmental impact of an oil spill [63,64]. In our case, the response time refers to the number of hours it takes the company to reach the site and stabilize the oil spill. Per the bibliographic review, the maximum point of risk is when the response time is equal to or greater than 250 hours, and the minimum point of risk is when the response time is equal to or lower than 50 hours. The National Planning Department of Colombia designed and calculated the armed conflict incidence index (IICA) to identify Colombian municipalities impacted by conflict [65]. This index measures eight variables: armed actions, homicide, kidnapping, antipersonnel mines, forced displacement, coca crops, homicide of leaders and human rights defenders, and homicides against ex-combatants. The index defines five categories: low, moderate low, moderate, high, and very high. Therefore, the maximum risk point is an IICA of 5, while the minimum risk point is an IICA of 1. The last indicator is ecological resilience. In this study, ecological resilience was defined as the return time to a stable state following a perturbation. Expert opinions were considered to define the risk values, where the maximum risk point was 15 years and the minimum risk point was 1 year. Transformation functions were used for the 4 descriptors. The weights of the aggravating coefficients were calculated with the same methodology used for the ecological risk (Table 2).

2.1.3. Environmental Disaster Risk Management Index

The environmental disaster risk management index was built considering Decree 2157, which adopts general guidelines for preparing a disaster risk management plan for public and private entities [66]. After analyzing the standards, the four main pillars of disaster risk management were determined to be risk identification, risk reduction, disaster management, and financial protection. Based on this, an index composed of 4 indicators was adapted from the study by Carreño et al. [40,41].
E D R M i = R M I R I + R M I R R + R M I D M + R M I F P 4
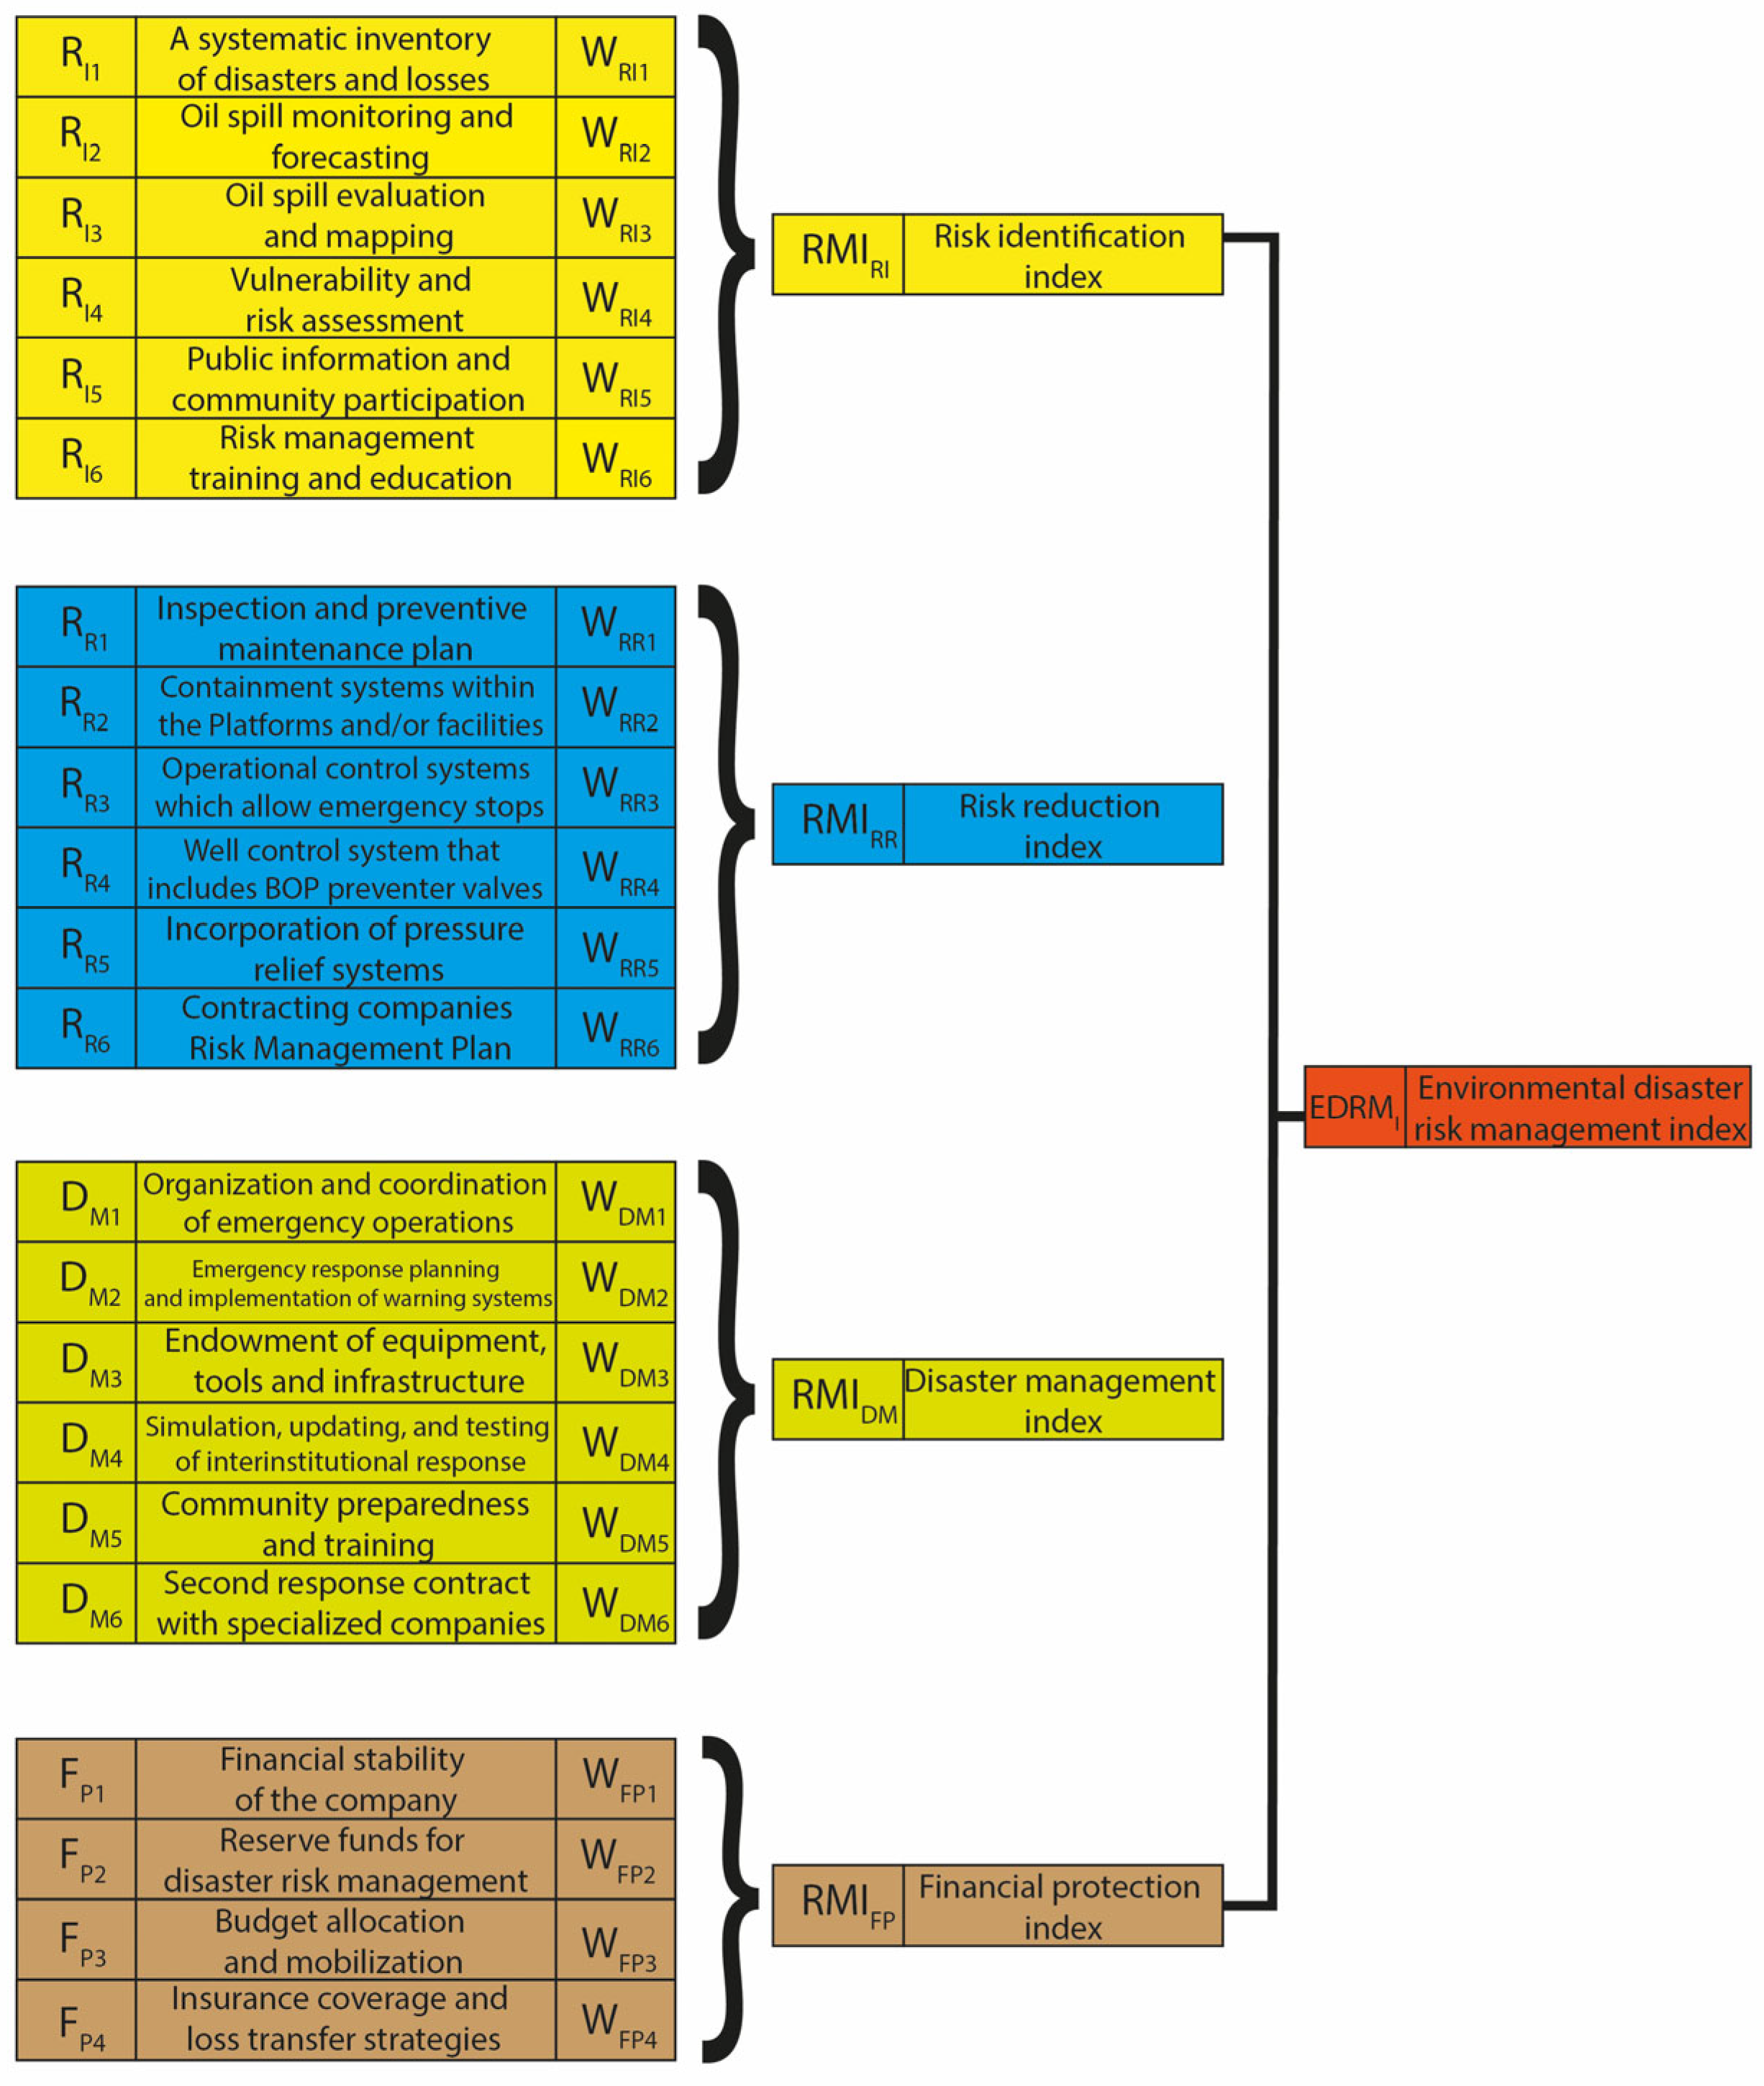
Figure 5 shows the descriptors used for each indicator, which were defined considering the expert opinions. These indicators were evaluated based on five performance levels that correspond to a range from 1 (low performance) to 5 (very high performance). The weights for each indicator were calculated with the same methodology used for the ecological risk (Table 3).

2.2. Environmental Risk Acceptance Criteria

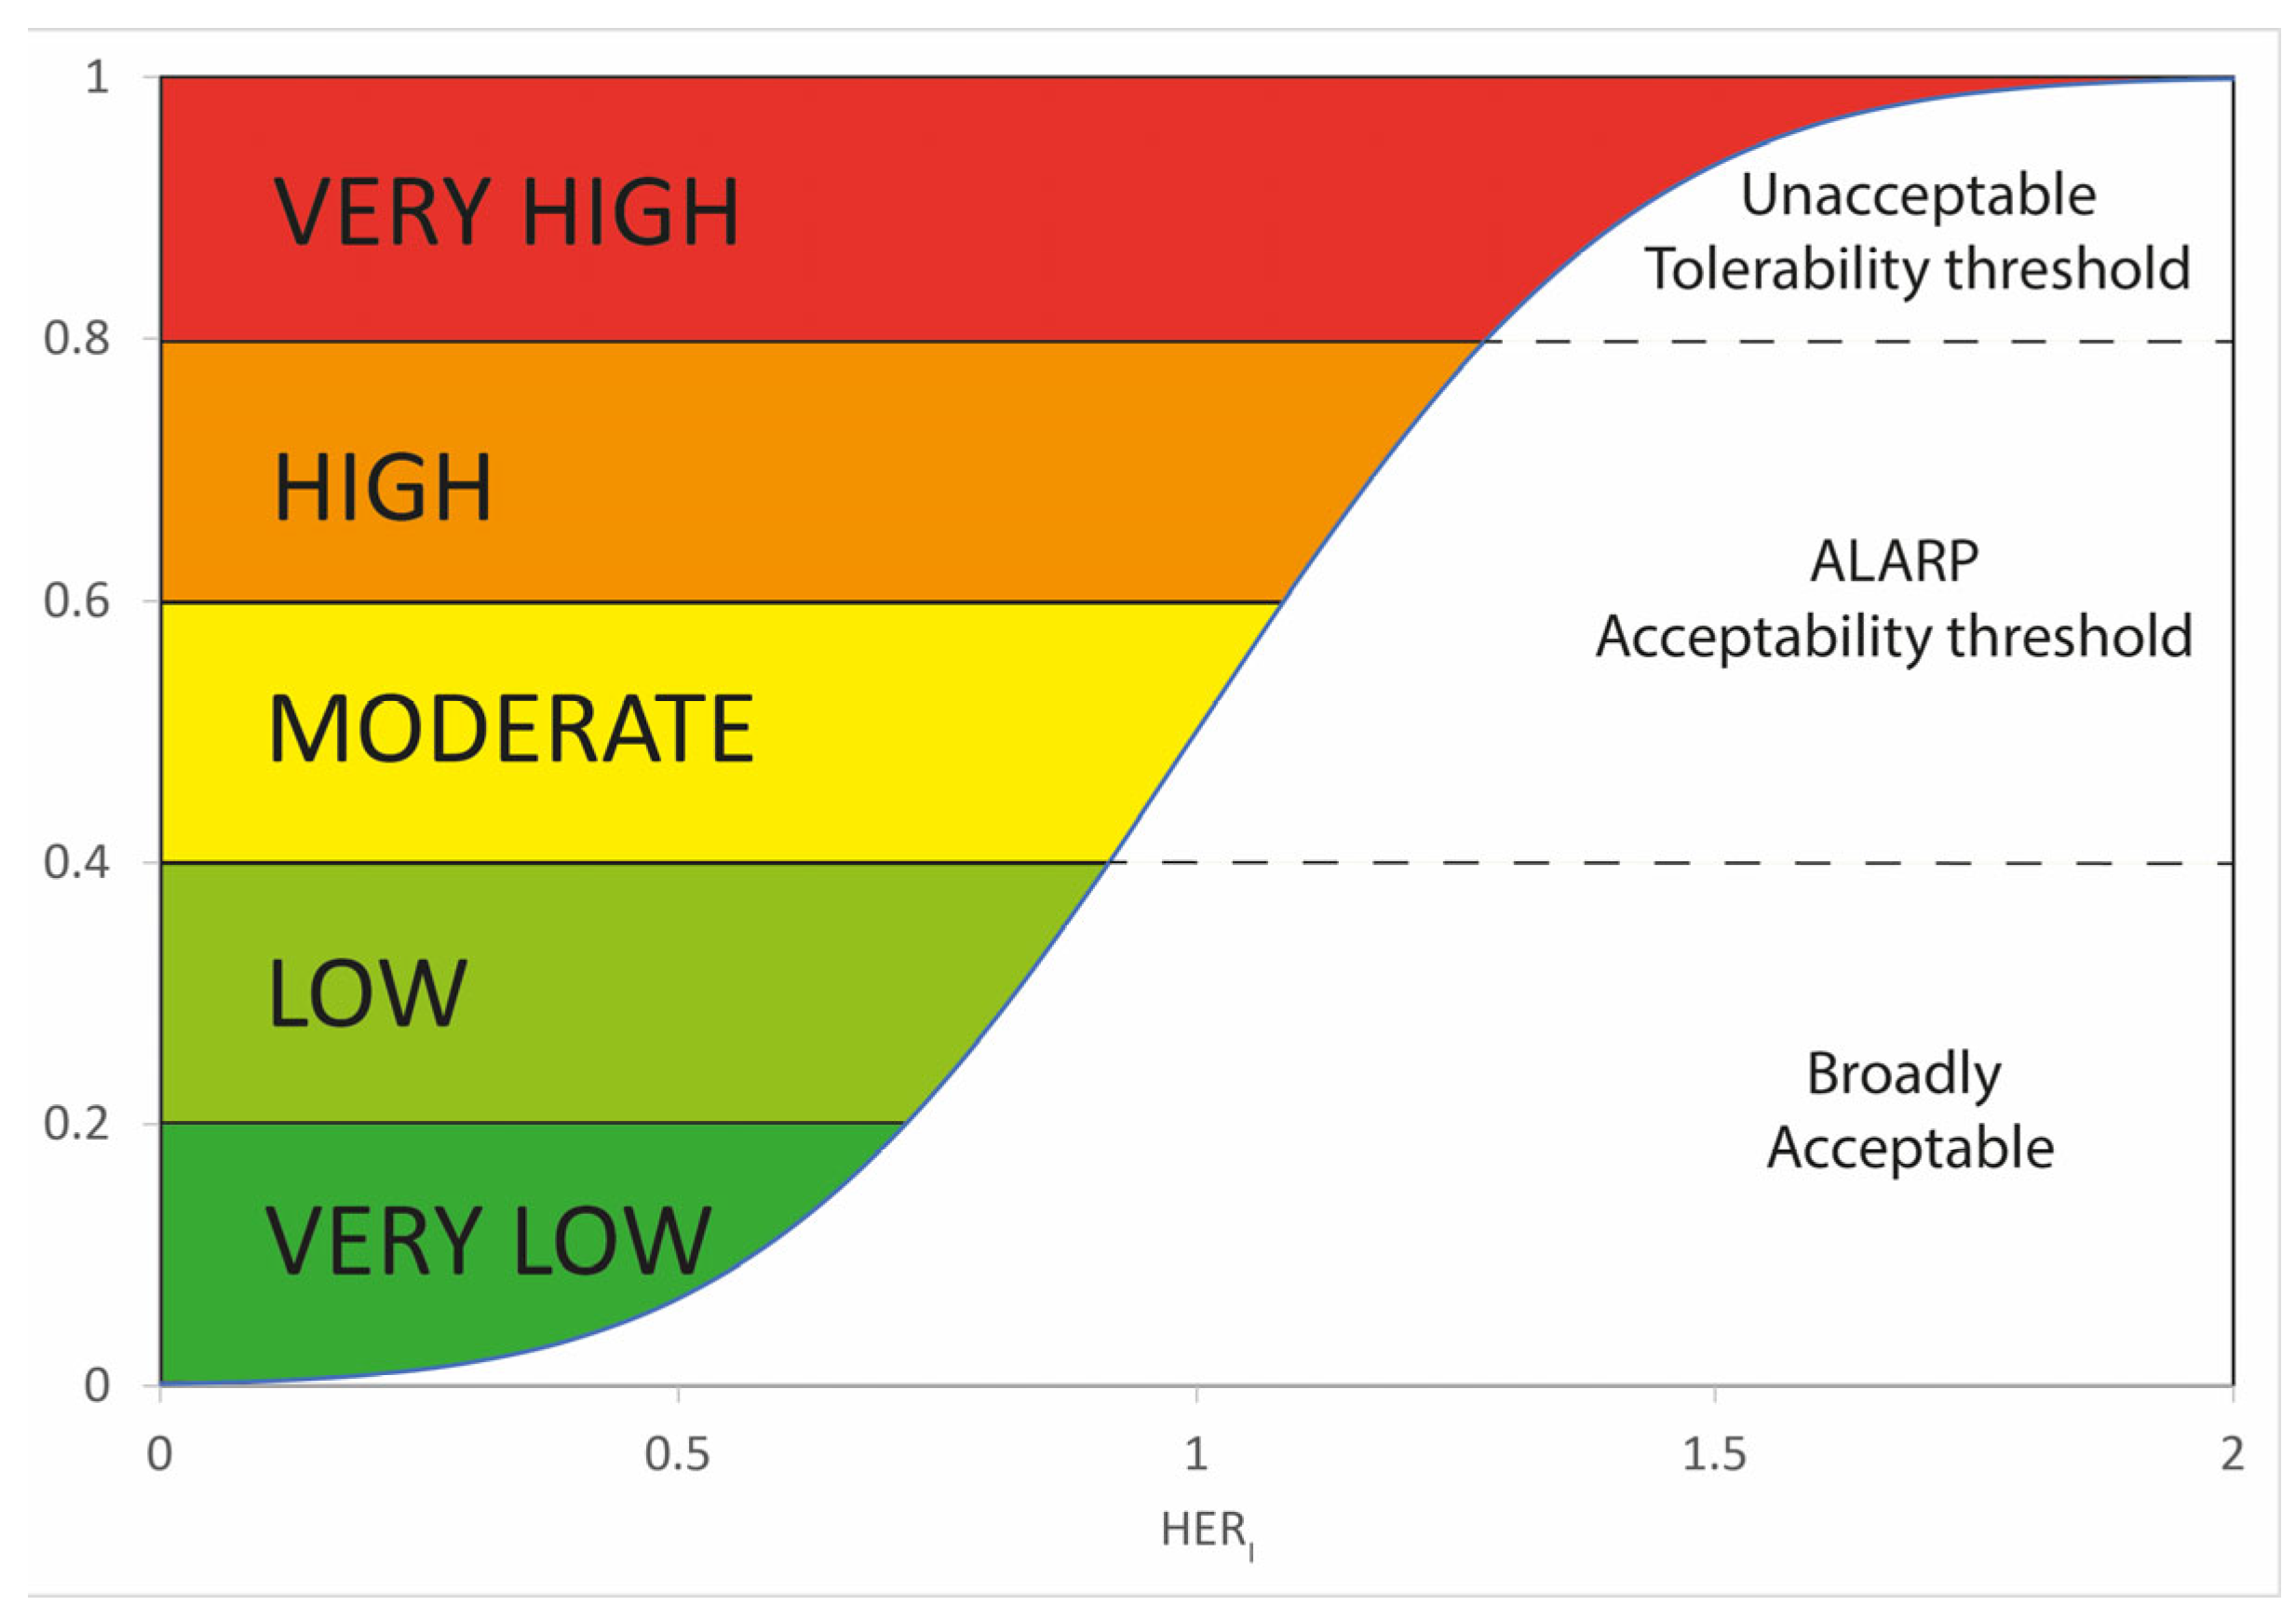
Risk management commonly involves using the ALARP criteria. The ALARP principle focuses on reducing risks to be as low as reasonably practicable. Mitigation measures should be implemented until the costs appear disproportionate to the achievable benefits. Threshold values are defined for “acceptable” and “tolerable” risks in this context, requiring necessary risks to be reduced below the tolerance threshold as they are unacceptable. Risks falling between these thresholds require mitigation until reasonably practicable, while those above the acceptability threshold do not need further mitigation efforts [67,68,69,70,71,72,73,74]. The present study standardized the environmental risk classification using a sigmoidal function, which considered the results from the holistic environment risk index (Figure 6).

3. Results

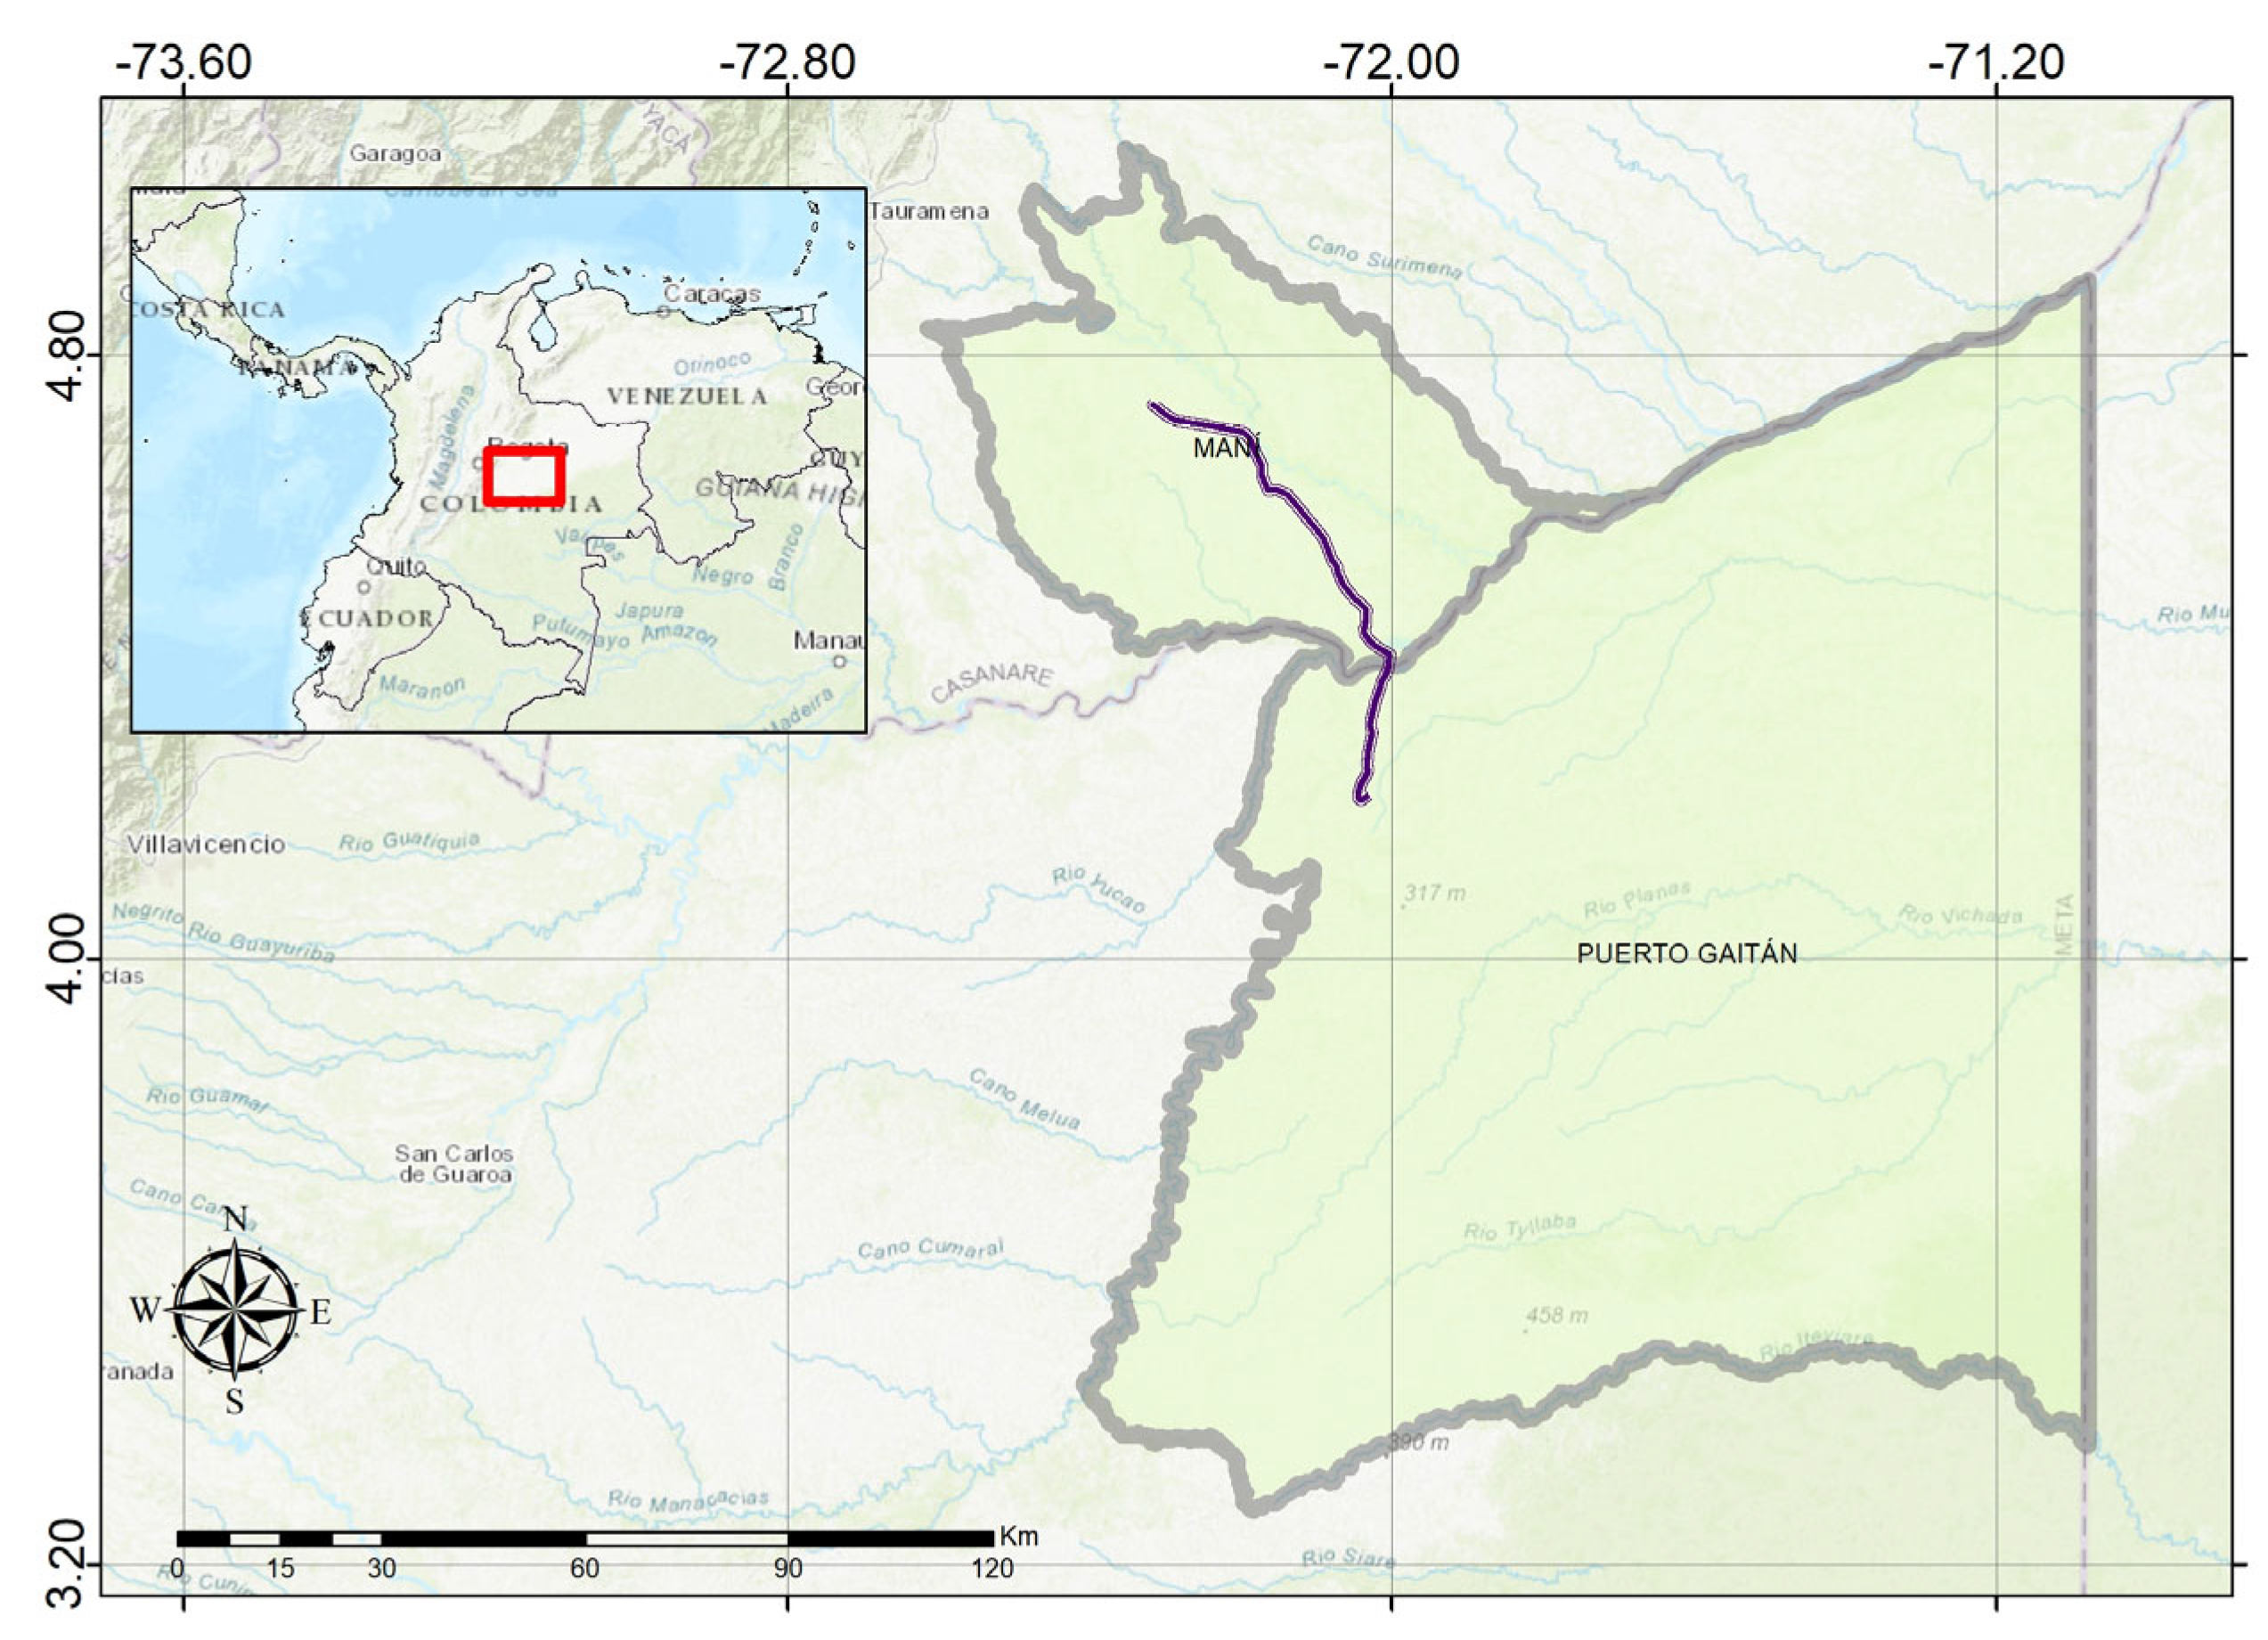
A case study was conducted to evaluate the proposed methodology in an oil pipeline between the municipalities of Maní in the department of Casanare and Puerto Gaitán in the department of Meta, Colombia (Figure 7).
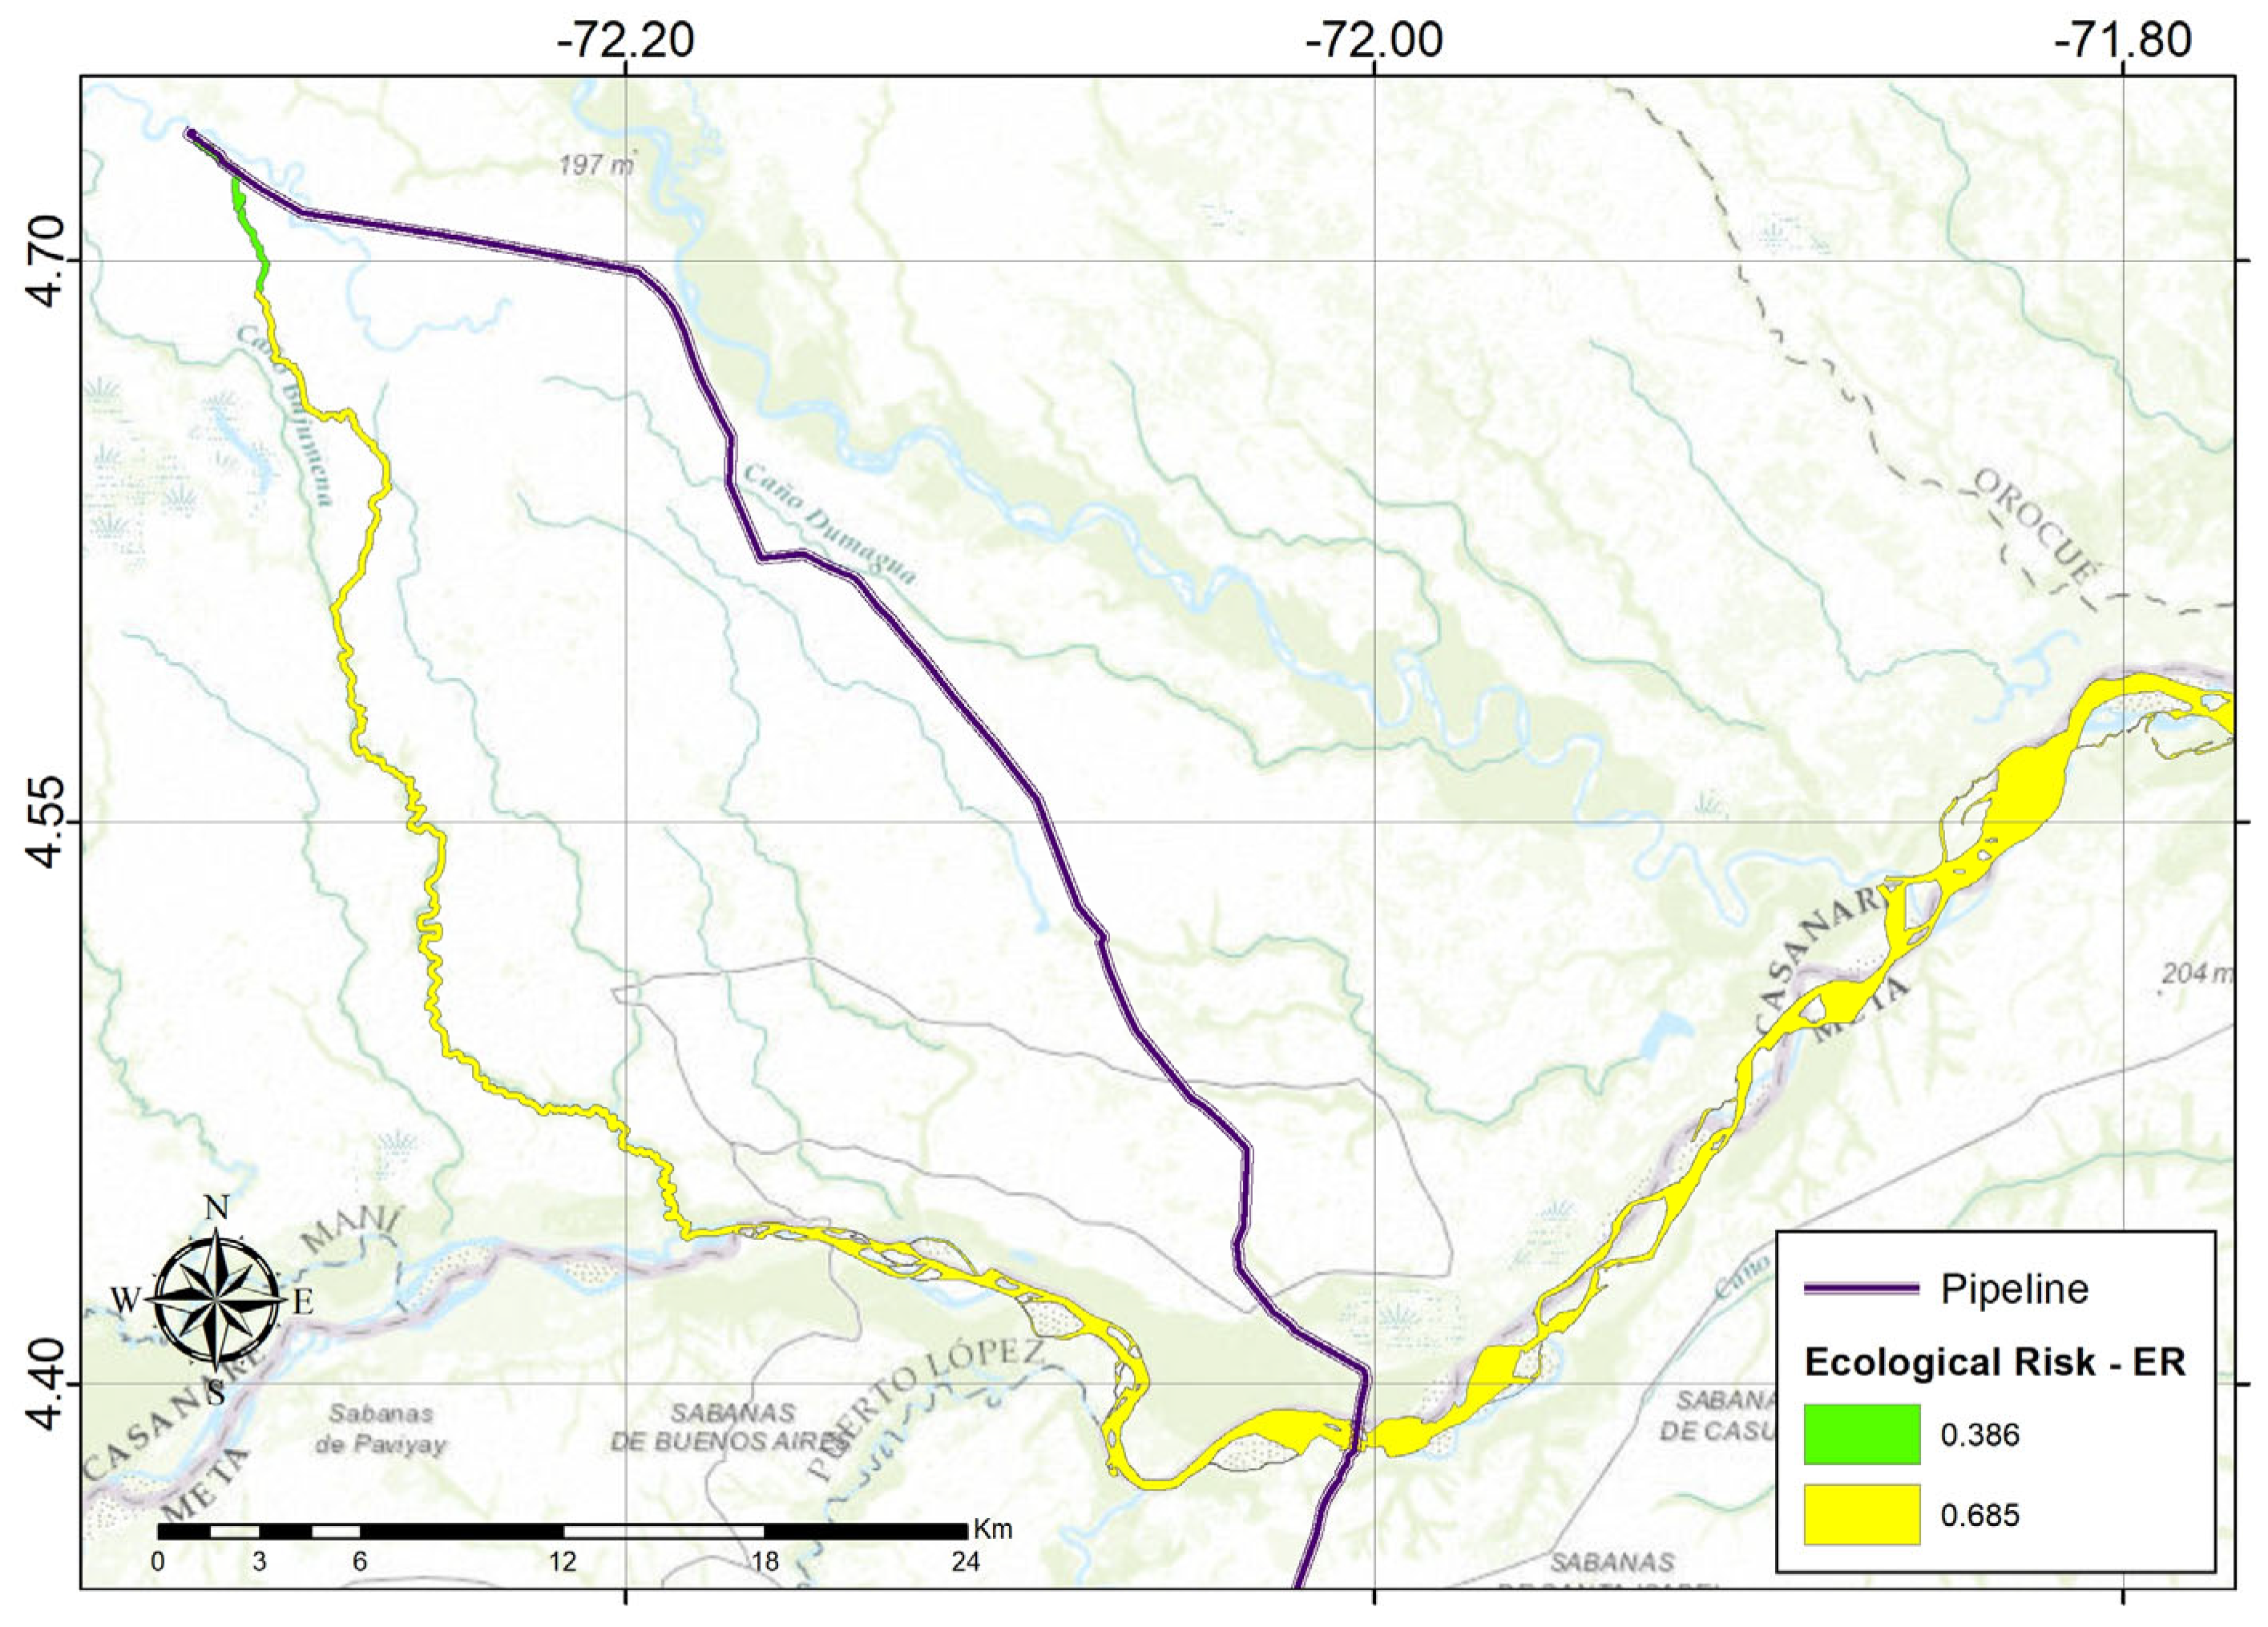
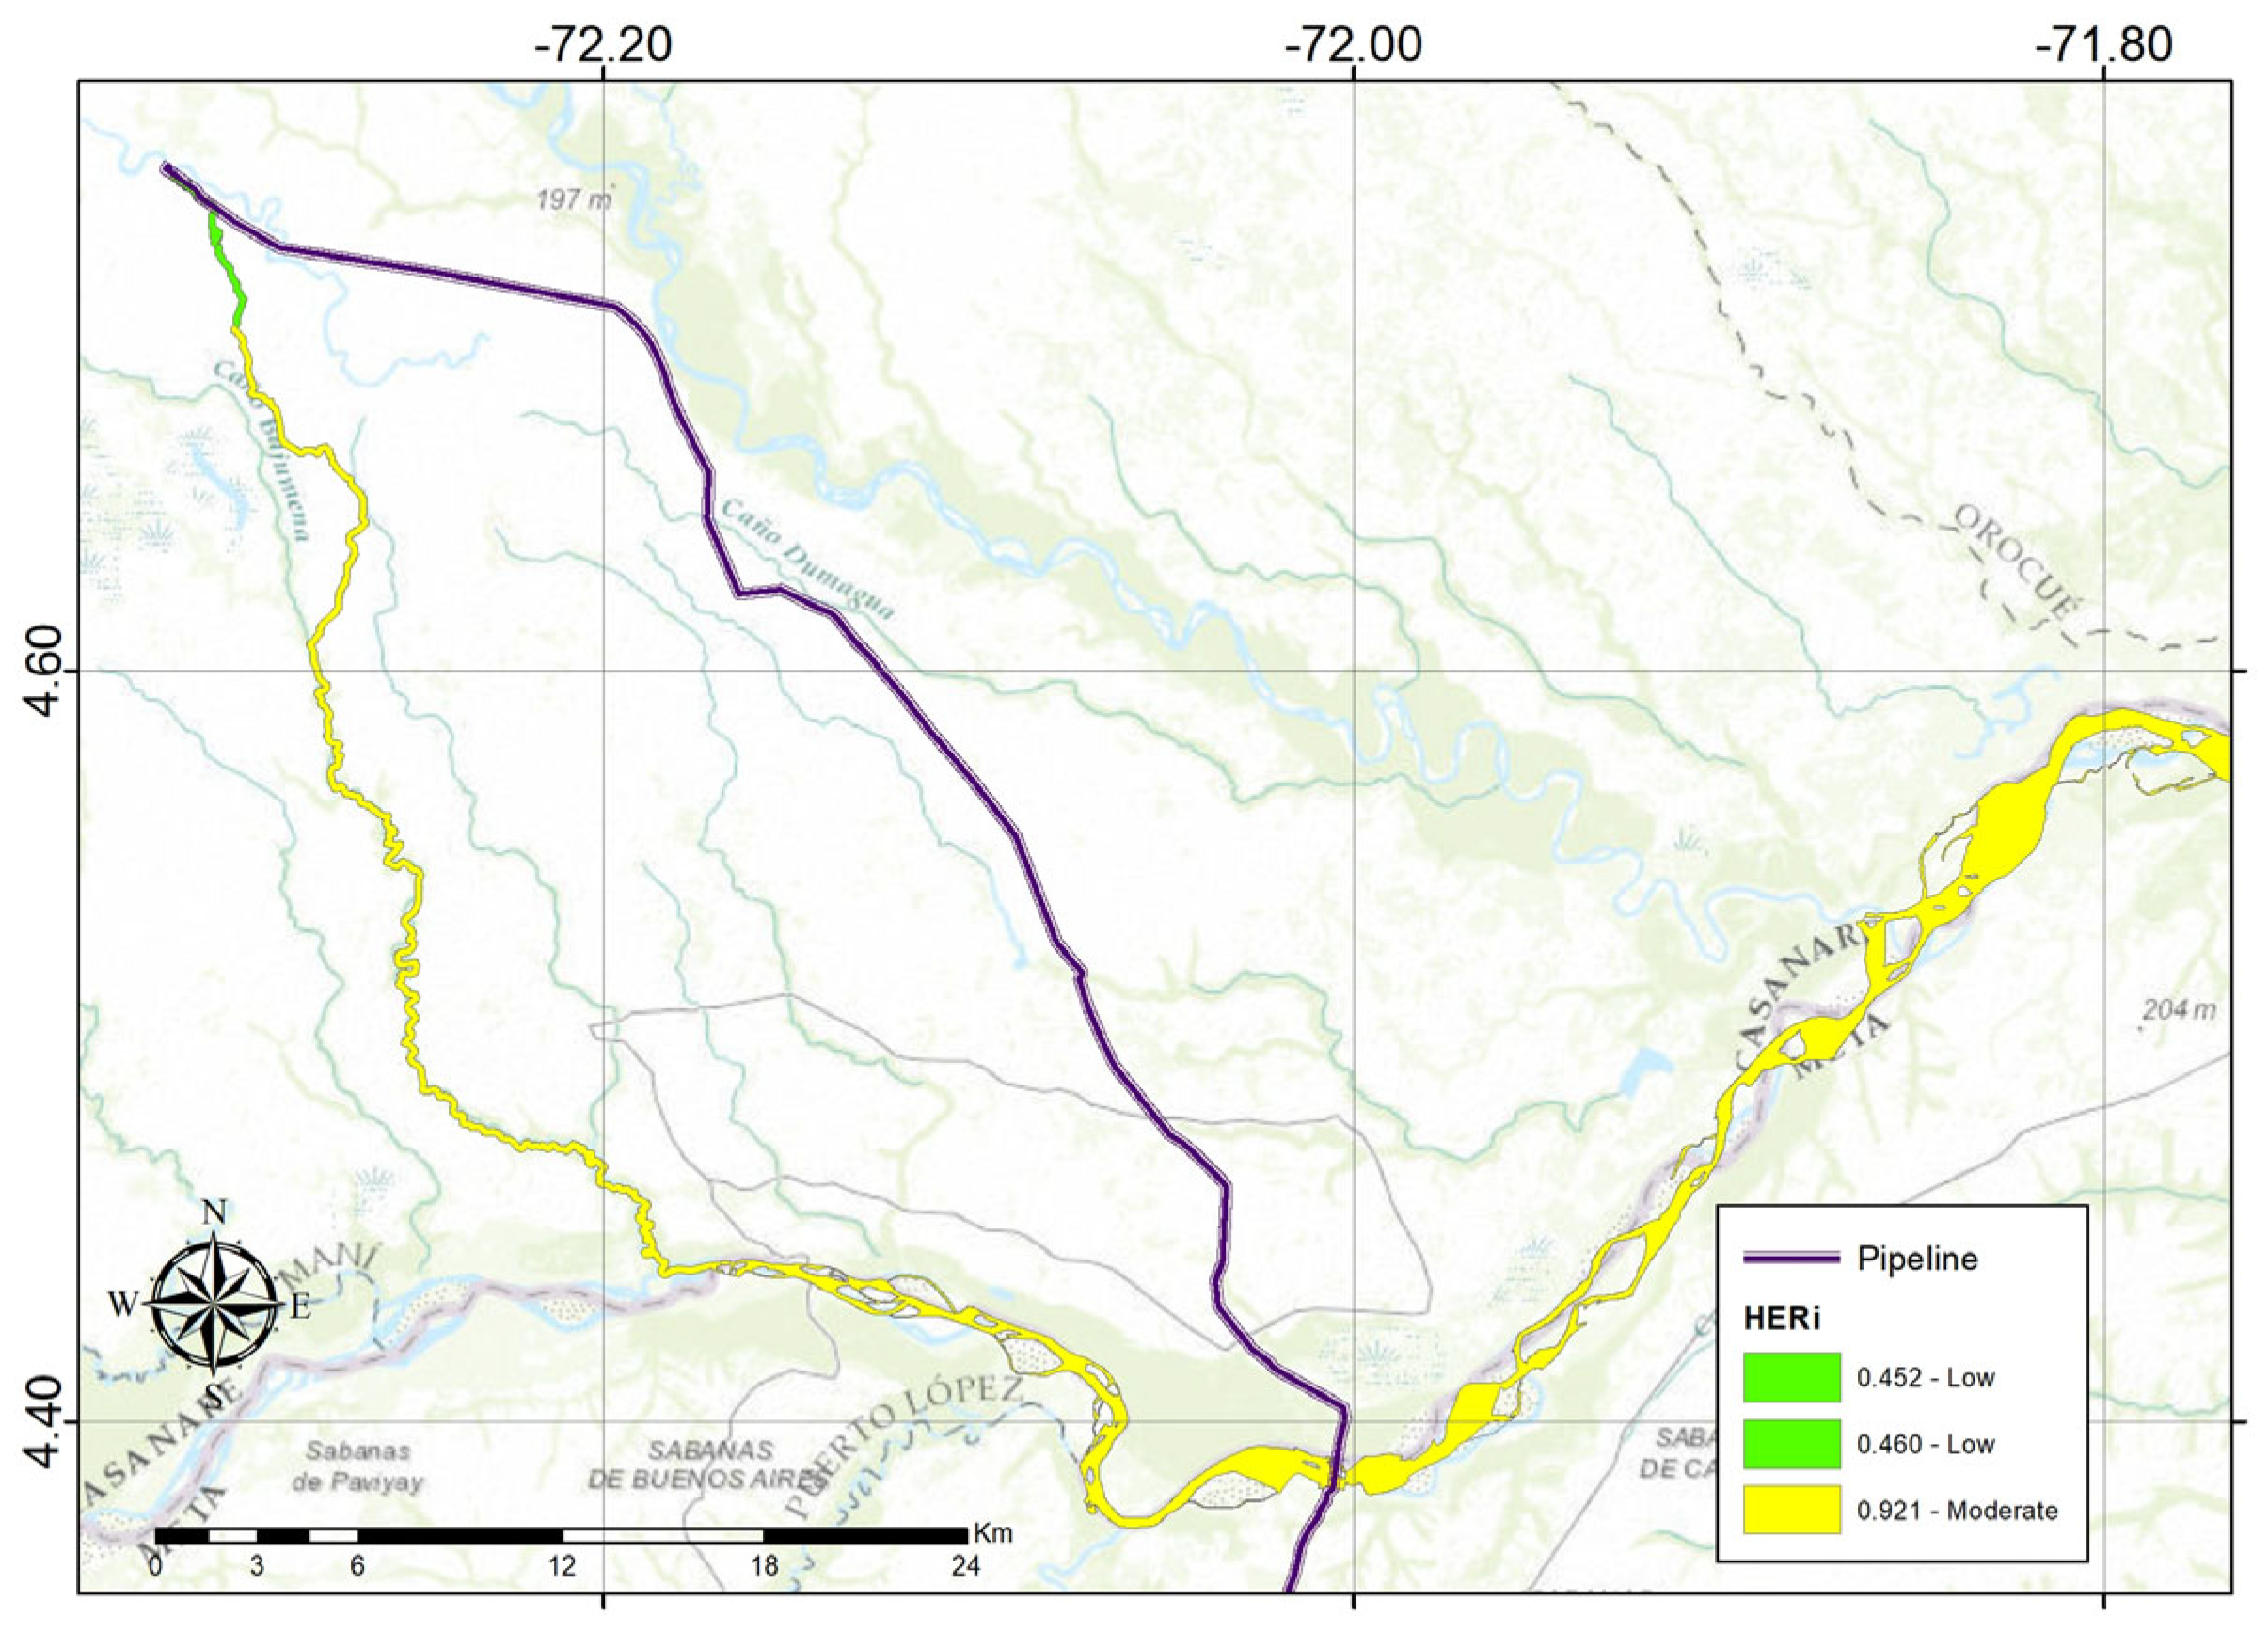
A scenario was initially defined, assuming the worst case of a catastrophic rupture in the pipeline at one of its initial points. After determining the oil spill volume, the ArcHydro Tools plugin in the ArcMap software was used to determine the oil spill routes based on slopes derived from a digital elevation model of the study area. This initial stage helped us understand the overall context of the risk scenario, enabling us to proceed with its evaluation. The damaged area variable corresponds to the volume of spilled barrels, specifically 907 BBL, according to the quantitative risk assessment. We consolidated data on individuals affected by previous oil spills and consulted expert biologists to determine the affected fauna variable. As for the affected land cover variable, we determined the area in hectares of main land covers that would be impacted by analyzing modeled spill routes. In terms of ecological impact, we referred to environmental management zoning developed by the company based on environmental impact assessment. Our evaluations and ratings for each variable are presented in Table 4. Assessing individual areas affected by spills divided according to land cover was essential within this specific risk scenario. The ecological risk factor for each variable, as shown in Table 5, was obtained according to the sigmoidal functions described above. The spatial distribution of ecological risk derived from this classification is presented in Figure 8. The environmental disaster risk index was determined via a multi-criteria analysis, which involved analyzing factors related to identification, reduction, management, and financial protection against environmental risks. The index qualification was made in a participatory workshop with the company in charge. The response time was determined based on historical emergency response data in the country, indicating that it can range from hours to more than two months depending on the spill volume and geophysical conditions. The army conflict incidence index was assessed as medium-low for our study area. Finally, the ecological resilience assessment process considered land cover and expert input regarding post-disaster ecosystem recovery timelines. Details about the variables are presented in Table 6. The aggravating coefficients for each impacted land cover are shown in Table 7 using the previously described sigmoidal functions. Figure 9 illustrates the spatial distribution. Finally, the holistic environmental risk index is shown in Table 8.

4. Discussion and Conclusions

This is the first time a holistic approach has been used to evaluate environmental risk in hydrocarbon projects. This evaluation allowed us to determine, at the Colombian level, which factors do not depend on the spill that increase or decrease the risk. During the workshop held with the company in the case study, it was observed that although the company was aware of its shortcomings, it was not aware that these shortcomings increased the environmental risk. Conducting a self-assessment of its performance in the risk management of environmental disasters allowed the company to identify improvement actions, clarifying that risk reduction measures must be identified using integrated models and comprehensive analysis [37].
This study presented a conceptual framework and a multidisciplinary assessment model for environmental risk analysis in the oil and gas industry in Colombia and introduced the holistic environmental risk index. This study's findings show that while companies in the industry are aware of their shortcomings, there is a lack of awareness regarding how these shortcomings contribute to increased environmental risk. The armed conflict in Colombia has a significant impact on environmental risk, particularly affecting the most sensitive ecosystems with high levels of risk.
These findings have profound potential to assist companies in improving their processes and prioritizing actions to reduce risks. They also emphasize the need to intensify efforts to resolve armed conflict as a strategy for reducing environmental risk at the national level, while highlighting the importance of mitigation measures for vulnerable ecosystems.
This study presented an innovative approach to assessing environmental risks in hydrocarbon projects from both practical and theoretical perspectives. This groundbreaking assessment identified critical factors beyond oil spills influencing environmental risk and provides a solid basis for informed decision making on risk management. However, like any rigorous evaluation, this initial methodology has uncertainties; therefore, it is recommended to conduct further workshops with different sector companies to assess additional descriptors or modifying factor weights. This collaborative approach will help refine the HERI index and promote greater awareness toward more effective sustainable management actions in Colombia's oil and gas industry.

Author Contributions

Conceptualization, M.A.D.V. and D.A.R.B.; methodology, M.A.D.V. and D.A.R.B.; validation, M.A.D.V., D.A.R.B., and C.P.G.R; formal analysis, M.A.D.V. and D.A.R.B.; M.A.D.V., D.A.R.B., and C.P.G.R.; data curation, M.A.D.V., D.A.R.B., and C.P.G.R; writing—original draft preparation, M.A.D.V. and D.A.R.B; writing—review and editing, C.P.G.R.; visualization, M.A.D.V.; supervision, C.P.G.R. All authors have read and agreed to the published version of the manuscript.
Funding

This research and the APC were funded by SERUANS ENVIRONMENT S.A.S.

Data Availability Statement

The data presented in this study are available upon request from the corresponding author.

Conflicts of Interest

The authors declare no conflicts of interest.

References

  1. Zotin, A.; Zuev, D.; Kashkin, V.; Kurako, M.; Simonov, K. Environmental Risk Zones Mapping Using Satellite Monitoring Data. Procedia Comput Sci 2018, 126, 1597–1605. [Google Scholar] [CrossRef]
  2. Millennium Ecosystem Assessment Ecosystems and Human Well‐Being: Synthesis; Press, I., Ed.; 2005; Vol. 4892; ISBN 1-59726-040-1.
  3. National Research Council (US) Oil in the Sea III: Inputs, Fates, and Effects; National Academies Press (US): Washington (DC), 2003; ISBN 0-309-08438-5.
  4. Beland, L.P.; Oloomi, S. Environmental Disaster, Pollution and Infant Health: Evidence from the Deepwater Horizon Oil Spill. J Environ Econ Manage 2019, 98, 102265. [Google Scholar] [CrossRef]
  5. Sarmiento Cristancho, D. La Responsabilidad Patrimonial Del Estado Por Los Daños Causados El 2 de Marzo de 2018 Por El Derrame de de Petróleo En El Pozo Lizama 158, Operado Por Ecopetrol, Ubicado En La Zona Rural Del Municipio de Barrancamermeja, En El Departamenteo de Santander, Revista NUEVA EPÓCA 2019, 53, 183–228. [Google Scholar]
  6. Guerrero-Useda, M. Equilibrio Ambiental, Extracción Petrolera y Riesgo de Desastres En El Oleoducto Transandino Colombiano. IPSA Scientia, revista científica multidisciplinaria 2021, 6, 86–101. [Google Scholar] [CrossRef]
  7. Ríos, J.; González, J.C.; García de las Heras, M. Environment and Armed Conflict in Colombia: Terrorist Attacks against Water Resources and Oil Infrastructure in Norte de Santander (2010-2020). Small Wars and Insurgencies 2021. [CrossRef]
  8. Vera Solano, J.A. Terrorismo Como Detonante de Desastres: Atentados Terroristas Contra Oleoducto Caño Limón Coveñas En Colombia. Revista de Estudios Latinoamericanos sobre Reducción del Riesgo de Desastres REDER 2021, 5, 126–136. [Google Scholar] [CrossRef]
  9. Cardona, O.D. The Need for Rethinking the Concepts of Vulnerability and Risk from a Holistic Perspective: A Necessary Review and Criticism for Effective Risk Management. In Mapping Vulnerability: Disasters, Development and People; 2004.
  10. Wang, Y.; Lee, K.; Liu, D.; Guo, J.; Han, Q.; Liu, X.; Zhang, J. Environmental Impact and Recovery of the Bohai Sea Following the 2011 Oil Spill. Environmental Pollution 2020, 263. [Google Scholar] [CrossRef]
  11. Asif, Z.; Chen, Z.; An, C.; Dong, J. Environmental Impacts and Challenges Associated with Oil Spills on Shorelines. J Mar Sci Eng 2022, 10. [Google Scholar] [CrossRef]
  12. Disner, G.R.; Torres, M. The Environmental Impacts of 2019 Oil Spill on the Brazilian Coast: Overview. Revista Brasileira de Gestão Ambiental e Sustentabilidade 2020, 7, 241–255. [Google Scholar] [CrossRef]
  13. International Association of Oil & Gas Producers Risk Assessment Data Directory Major Accidents; London, 2010.
  14. Vasconcelos, R.N.; Lima, A.T.C.; Lentini, C.A.D.; Miranda, G. V.; Mendonça, L.F.; Silva, M.A.; Cambuí, E.C.B.; Lopes, J.M.; Porsani, M.J. Oil Spill Detection and Mapping: A 50-Year Bibliometric Analysis. Remote Sens (Basel) 2020, 12, 1–18. [Google Scholar] [CrossRef]
  15. ITOPF Oil Tanker Spill Statistics 202; London, Uk. 2022.
  16. The global oil and gas industry association for environmental and social issues Impacts of Oil Spills on Marine Ecology: Good Practice Guidelines for Incident Management and Emergency Response Personnel; London, 2015.
  17. The global oil and gas industry association for environmental and social issues Impacts of Oil Spills on Shorelines: Good Practice Guidelines for Incident management and Emergency Response Personnel; London. G, 2016.
  18. Chilvers, B.L.; Morgan, & K. J.; White, B.J. Sources and Reporting of Oil Spills and Impacts on Wildlife 1970-2018. Environmental Science and Pollution Research 2021, 28, 754–762. [Google Scholar] [CrossRef] [PubMed]
  19. Hook, S.E. Beyond Thresholds: A Holistic Approach to Impact Assessment Is Needed to Enable Accurate Predictions of Environmental Risk from Oil Spills. Integr Environ Assess Manag 2020, 16, 813–830. [Google Scholar] [CrossRef] [PubMed]
  20. Lassalle, G.; Scafutto, R.D.P.M.; Lourenço, R.A.; Mazzafera, P.; de Souza Filho, C.R. Remote Sensing Reveals Unprecedented Sublethal Impacts of a 40-Year-Old Oil Spill on Mangroves. Environmental Pollution 2023, 331. [Google Scholar] [CrossRef] [PubMed]
  21. Abou Samra, R.M.; Ali, R.R. Tracking the Behavior of an Accidental Oil Spill and Its Impacts on the Marine Environment in the Eastern Mediterranean. Mar Pollut Bull 2024, 198. [Google Scholar] [CrossRef] [PubMed]
  22. Hayes, T.M. SINKING OF TANKER ST. PETER OFF COLOMBIA. International Oil Spill Conference Proceedings 1977, 1977, 289–291. [Google Scholar] [CrossRef]
  23. Guerrero Useda, M.E. Rupture of Oil Pipelines Due to External Interference, Environmental Damage and Sustainability in Colombia. Produccion y Limpia 2018, 13, 7–13. [Google Scholar] [CrossRef]
  24. Miranda, D.; Restrepo Ricardo Los Derrames de Petróleo En Ecosistemas Tropicales - Impactos, Consecuencias y Prevención. La Experiencia de Colombia. In Proceedings of the International Oil Spill Conference. 2005.
  25. Nelson, J.R.; Grubesic, T.H. Oil Spill Modeling: Risk, Spatial Vulnerability, and Impact Assessment. Prog Phys Geogr 2018, 42, 112–127. [Google Scholar] [CrossRef]
  26. Monteiro, C.B.; Oleinik, P.H.; Leal, T.F.; Marques, W.C.; Nicolodi, J.L.; Lopes, B. de C.F.L. Integrated Environmental Vulnerability to Oil Spills in Sensitive Areas. Environmental Pollution 2020, 267. [CrossRef]
  27. Rodrigues, F.H.; Kolya, A. de A.; Veiga, V.M.; dos Santos, S.F.; Wieczorek, A.; Corrêa, C.V. dos S.; Costa, D.M.; Giordano, L. do C.; Riedel, P.S.; Reis, F.A.G.V. Oil Spill Environmental Sensitivity Mapping of Rio de Janeiro, Brazil. Mar Pollut Bull 2023, 197. [CrossRef]
  28. D’Affonseca, F.M.; Vieira Reis, F.A.G.; Corrêa, C.V. dos S.; Wieczorek, A.; Giordano, L. do C.; Marques, M.L.; Rodrigues, F.H.; Costa, D.M.; Kolya, A. de A.; Veiga, V.M.; et al. Environmental Sensitivity Index Maps to Manage Oil Spill Risks: A Review and Perspectives. Ocean Coast Manag, 2023; 239. [Google Scholar]
  29. Cai, L.; Yan, L.; Ni, J.; Wang, C. Assessment of Ecological Vulnerability under Oil Spill Stress. Sustainability (Switzerland) 2015, 7, 13073–13084. [Google Scholar] [CrossRef]
  30. Murawski, S.A.; Schwing, P.T.; Patterson, W.F.; Sutton, T.T.; Montagna, P.A.; Milligan, R.J.; Joye, S.B.; Thomas, L.; Kilborn, J.P.; Paris, C.B.; et al. Vulnerability and Resilience of Living Marine Resources to the Deepwater Horizon Oil Spill: An Overview. Front Mar Sci 2023, 10. [Google Scholar] [CrossRef]
  31. Sun, Z.; Liu, Y.; Sang, H. Spatial-Temporal Variation and Driving Factors of Ecological Vulnerability in Nansi Lake Basin, China. Int J Environ Res Public Health 2023, 20. [Google Scholar] [CrossRef] [PubMed]
  32. He, L.; Shen, J.; Zhang, Y. Ecological Vulnerability Assessment for Ecological Conservation and Environmental Management. J Environ Manage 2018, 206, 1115–1125. [Google Scholar] [CrossRef] [PubMed]
  33. Li, Q.; Shi, X.; Wu, Q. Effects of Protection and Restoration on Reducing Ecological Vulnerability. Science of the Total Environment 2021, 761. [Google Scholar] [CrossRef] [PubMed]
  34. De Lange, H.J.; Sala, S.; Vighi, M.; Faber, J.H. Ecological Vulnerability in Risk Assessment - A Review and Perspectives. Science of the Total Environment 2010, 408, 3871–3879. [Google Scholar] [CrossRef] [PubMed]
  35. Jiang, X.; Guo, X.; Wu, Y.; Xu, D.; Liu, Y.; Yang, Y.; Lan, G. Ecological Vulnerability Assessment Based on Remote Sensing Ecological Index (RSEI): A Case of Zhongxian County, Chongqing. Front Environ Sci 2023, 10. [Google Scholar] [CrossRef]
  36. Hu, X.; Ma, C.; Huang, P.; Guo, X. Ecological Vulnerability Assessment Based on AHP-PSR Method and Analysis of Its Single Parameter Sensitivity and Spatial Autocorrelation for Ecological Protection – A Case of Weifang City, China. Ecol Indic 2021, 125. [Google Scholar] [CrossRef]
  37. Marulanda Fraume, M.C.; Cardona A, O.D.; Marulanda Fraume, P.; Carreño T, M.L.; Barbat, A.H. Evaluating Risk from a Holistic Perspective to Improve Resilience: The United Nations Evaluation at Global Level. Saf Sci 2020, 127, 104739. [Google Scholar] [CrossRef]
  38. Cardona, O. Dario.; Barbat, A.H.. Estimación Holística Del Riesgo Sísmico Utilizando Sistemas Dinámicos Complejos. PhD Thesis, Universitat Politècnica de Catalunya: Barcelona, España, 2001. [Google Scholar]
  39. Carreño, M.L.; Cardona, O.D.; Barbat, A.H. Urban Seismic Risk Evaluation: A Holistic Approach. Natural Hazards 2007, 40, 137–172. [Google Scholar] [CrossRef]
  40. Carreño, M.L.; Cardona, O.D.; Barbat, A.H. A Disaster Risk Management Performance Index. Natural Hazards 2007, 41, 1–20. [Google Scholar] [CrossRef]
  41. Carreño, M.L.; Cardona, O.D.; Eslamian, S. Index of Resilience and effectiveness of Disaster Risk Management. In Handbook of HydroInformatics: Volume II: Advanced Machine Learning Techniques; Eslamian, S., Eslamian, F., Eds.; Candice Janco, 2023; pp. 305–314 ISBN 978-0-12-821961-4.
  42. Carreño, M.L.; Cardona, O.D.; Barbat, A.H. Metodología Para La Evaluación Del Desempeño de La Gestión Del Riesgo; Centro Internacional de Métodos Numéricos en Ingeniería (CIMNE), Ed.; 2004; ISBN 84-95999-66-8.
  43. Carreño, M.L.; Cardona, O.D.; Barbat, A.H. Técnicas Innovadoras Para La Evaluación Del Riesgo Sísmico y Su Gestión En Centros Urbanos: Acciones Ex Ante y Ex Pos, Universitat Politècnica de Catalunya, 2006.
  44. Carreño, M.L.; Cardona, O.D.; Barbat, A.H. Sistema de Indicadores Para La Evaluación de Riesgos; Centre Internacional de Mètodes Numèrics en Enginyeria (CIMNE), Ed.; Barcelona, 2005; ISBN 84-95999-70-6.
  45. ECOPETROL S.A Guía Para Análisis de Consecuencias y Análisis Cuantitativo Del Riesgo. 2018.
  46. Omodanisi, E.O. Resultant Land Use and Land Cover Change from Oil Spillage Using Remote Sensing and GIS. Research Journal of Applied Sciences, Engineering and Technology 2013, 6, 2032–2040. [Google Scholar] [CrossRef]
  47. Saaty, T.L. WHAT IS THE ANALYTIC HIERARCHY PROCESS?
  48. Cai, L.; Yan, L.; Ni, J.; Wang, C. Assessment of Ecological Vulnerability under Oil Spill Stress. Sustainability (Switzerland) 2015, 7, 13073–13084. [Google Scholar] [CrossRef]
  49. Ramanathan, R.; Abdullah, L.; Md Fauadi, M.H.F.; Mohamed, M.S.S.; Kamaludin, K.N. A Hybrid of Kansei Engineering (KE) and Analytical Hierarchy Process (AHP) to Develop Conceptual Designs of Portable Oil Spill Skimmer. IIUM Engineering Journal 2023, 24. [Google Scholar] [CrossRef]
  50. Kheybari, S.; Rezaie, F.M.; Farazmand, H. Analytic Network Process: An Overview of Applications. Appl Math Comput 2020, 367. [Google Scholar] [CrossRef]
  51. Wang, Y.; Tang, C.; Du, P.; Liu, B.; Li, Y.; Chen, C. Spatial Differentiation Assessment of the Vulnerability of Marine Protected Areas to Oil Spill Stress in the Bohai Sea. J Mar Sci Eng 2023, 11. [Google Scholar] [CrossRef]
  52. Zhang, H.; Li, W.; Miao, P.; Sun, B.; Kong, F. Risk Grade Assessment of Sudden Water Pollution Based on Analytic Hierarchy Process and Fuzzy Comprehensive Evaluation. Environmental Science and Pollution Research 2020, 27, 469–481. [Google Scholar] [CrossRef]
  53. Helmer, O. Analysis of the Future: The Delphi Method. 1967.
  54. Khalilzadeh, M.; Kebriyaii, O.; Rezaei, R. Identification and Selection of Stakeholder Engagement Strategies: Case Study of an Iranian Oil and Gas Construction Project. International Journal of Construction Management 2023, 23, 484–494. [Google Scholar] [CrossRef]
  55. Olugu, E.U.; Mammedov, Y.D.; Young, J.C.E.; Yeap, P.S. Integrating Spherical Fuzzy Delphi and TOPSIS Technique to Identify Indicators for Sustainable Maintenance Management in the Oil and Gas Industry. Journal of King Saud University - Engineering Sciences, 2021. [Google Scholar] [CrossRef]
  56. Abdul Shukor, S.; Ng, G.K. Environmental Indicators for Sustainability Assessment in Edible Oil Processing Industry Based on Delphi Method. Clean Eng Technol 2022, 10. [Google Scholar] [CrossRef]
  57. Ayyildiz, E.; Gumus, A.T. Pythagorean Fuzzy AHP Based Risk Assessment Methodology for Hazardous Material Transportation: An Application in Istanbul. Environmental Science and Pollution Research 2021, 28, 35798–35810. [Google Scholar] [CrossRef]
  58. Jahanvand, B.; Bagher Mortazavi, S.; Asilian Mahabadi, H.; Ahmadi, O. Determining Essential Criteria for Selection of Risk Assessment Techniques in Occupational Health and Safety: A Hybrid Framework of Fuzzy Delphi Method. Saf Sci 2023, 167. [Google Scholar] [CrossRef]
  59. Webler, T.; Lord, F. Planning for the Human Dimensions of Oil Spills and Spill Response. Environ Manage 2010, 45, 723–738. [Google Scholar] [CrossRef] [PubMed]
  60. Walker, A.H.; McKinnon, L.R.; Ritchie, L.; Gill, D.; Hasenaeur, T.; Giese, J. Oil Spill Preparedness and Response: Building the Capacity to Protect Public Welfare and Support Community Resilience. International Oil Spill Conference Proceedings 2021, 2021. [Google Scholar] [CrossRef]
  61. Sabela-Rikhotso, P.T.Z.; van Niekerk, D.; Nemakonde, L.D. Enhancing Coordination for Effective Management of Oil Spill Pollution in South Africa. International Journal of Disaster Risk Science 2022, 13, 12–24. [Google Scholar] [CrossRef]
  62. Finucane, M.L.; Clark-Ginsberg, A.; Parker, A.M.; Becerra Ornelas, A.U.; Clancy, N.; Ramchand, R.; Slack, Tim.; Parks, Vanessa.; Ayer, Lynsay.; Edelman, A.F.; et al. Building Community Resilience to Large Oil Spills: Findings and Recommendations from a Synthesis of Research on the Mental Health, Economic, and Community Distress Associated with the Deepwater Horizon Oil Spill; ISBN 9781977405357.
  63. Soares, M.O.; Teixeira, C.E.P.; Bezerra, L.E.A.; Rossi, S.; Tavares, T.; Cavalcante, R.M. Brazil Oil Spill Response: Time for Coordination. Science (1979) 2020, 367, 155. [Google Scholar] [CrossRef] [PubMed]
  64. Nordvik, A.B. Time Window-of-Opportunity Strategies for Oil Spill Planning and Response. Pure Appl. Chem 1999, 71, 5–16. [Google Scholar] [CrossRef]
  65. Departamento Nacional de Planeación - DNP Índice de Incidencia Del Conflicto Armado – IICA; Bogotá D.C., 2021.
  66. Departamento administrativo de la presidencia de la República de Colombia Decreto 2157 Del 20 de Diciembre de 2017 Available online:. Available online: https://www.funcionpublica.gov.co/eva/gestornormativo/norma.php?i=199583 (accessed on 29 January 2024).
  67. Psarros, G.; Skjong, R.; Vanem, E. Risk Acceptance Criterion for Tanker Oil Spill Risk Reduction Measures. Mar Pollut Bull 2011, 62, 116–127. [Google Scholar] [CrossRef] [PubMed]
  68. Jones-Lee, M.; Aven, T. ALARP - What Does It Really Mean? Reliab Eng Syst Saf 2011, 96, 877–882. [Google Scholar] [CrossRef]
  69. Melchers, R.E. On the ALARP Approach to Risk Management. Reliab Eng Syst Saf 2001, 71, 201–208. [Google Scholar] [CrossRef]
  70. Baybutt, P. The ALARP Principle in Process Safety. Process Safety Progress 2014, 33, 36–40. [Google Scholar] [CrossRef]
  71. Ale, B.J.M.; Hartford, D.N.D.; Slater, D. ALARP and CBA All in the Same Game. Saf Sci 2015, 76, 90–100. [Google Scholar] [CrossRef]
  72. Langdalen, H.; Abrahamsen, E.B.; Selvik, J.T. On the Importance of Systems Thinking When Using the ALARP Principle for Risk Management. Reliab Eng Syst Saf 2020, 204. [Google Scholar] [CrossRef]
  73. Maselli, G.; Macchiaroli, M.; Nesticò, A. Alarp Criteria to Estimate Acceptability and Tolerability Thresholds of the Investment Risk. Applied Sciences (Switzerland) 2021, 11. [Google Scholar] [CrossRef]
  74. Valeur, J.R. ; Lars Wahl Andersen Performance Standards for Oil Spill Risk. Paper presented at the SPE International Conference and Exhibition on Health, Safety, Environment, and Sustainability, Virtual 2020. [Google Scholar] [CrossRef]
Figure 1. Conceptual framework of the holistic approach to environmental disaster risk. Adapted from Cardona and Barbat [38], Carreño et al. [39], and Marulanda-Fraume et al. [37].
Preprints 98855 g001
Figure 2. Structure of indicators used for the holistic environmental risk evaluation.
Preprints 98855 g002
Figure 3. Transformation functions used to standardize the ecological risk factors.
Preprints 98855 g003
Figure 4. Transformation functions used to standardize the aggravating coefficients.
Preprints 98855 g004
Figure 5. Structure of indicators used for the environmental disaster risk management index. Adapted from the study by Carreño et al. [40,41].
Preprints 98855 g005
Figure 6. Environmental risk acceptance criteria.
Preprints 98855 g006
Figure 7. Case study localization.
Preprints 98855 g007
Figure 8. Spatial distribution of ecological risk—ER.
Preprints 98855 g008
Figure 9. Aggravating coefficients of spatial distribution.
Preprints 98855 g009
Figure 10. HERI spatial distribution.
Preprints 98855 g010
Table 2. Weights of the aggravating coefficients.
Factor Weight Weight Value
FFR1—environmental disaster risk management index WER1 0.42
FFR2—response time WER2 0.10
FFR3—armed conflict incidence index WER3 0.26
FFR4—ecological resilience WER4 0.22
Table 3. Weights of the environmental disaster risk management index factors.
Index Factor Weight Weight Value
RMI—risk identification index RI1—systematic inventory of disasters and losses WRI1 0.09
RI2 —oil spill monitoring and forecasting WRI2 0.21
RI3 —oil spill evaluation and mapping WRI3 0.20
RI4—vulnerability and risk assessment WRI4 0.20
RI5—public information and community participation WRI5 0.09
RI6—risk management training and education WRI6 0.21
RII—risk reduction index RR1—inspection and preventive maintenance plan WRR1 0.24
RR2—containment systems within the platforms and/or facilities WRR2 0.19
RR3—operational control systems that allow emergency stops WRR3 0.19
RR4—well control system that includes BOP preventer valves WRR4 0.17
RR5—incorporation of pressure relief systems WRR5 0.14
RR6—contracting companies' risk management plan WRR6 0.07
DMI—disaster managementindex DM1—organization and coordination of emergency operations WDM1 0.19
DM2—emergency response planning and implementation of warning systems WDM2 0.17
DM3—endowment of equipment, tools, and infrastructure WDM3 0.31
DM4—simulation, updating, and testing of interinstitutional response WDM4 0.14
DM5—community preparedness and training WDM5 0.07
DM6—second response contract with specialized companies WDM6 0.12
FPI—financial protection index FP1—financial stability of the company WFP1 0.24
FP2—reserve funds for disaster risk management WFP2 0.21
FP3—budget allocation and mobilization WFP3 0.21
FP4—insurance coverage and loss transfer strategies WFP4 0.35
Table 4. Descriptor values of the ecological risk—ER.
Land Cover FER1 FER2 FER3 FER4
Burnt areas 907 50 4902.6 2
Permanent crops 907 50 4902.6 2
Water courses 907 50 4902.6 5
Table 5. Factors values of ecological risk—ER.
Land Cover FER1 FER2 FER3 FER4 ER
Burnt areas 0.39 0.5 1 0.067 0.386
Permanent crops 0.39 0.5 1 0.067 0.386
Water courses 0.39 0.5 1 1 0.685
Table 6. Descriptor values for the aggravating coefficients.
Land Cover FFR1 FFR2 FFR3 FFR4
Burnt areas 3.41 200 2 2
Permanent crops 3.41 200 2 5
Water courses 3.41 200 2 10
Table 7. Factors values of aggravating coefficients—F.
Land Cover FFR1 FFR2 FFR3 FFR4 F
Burnt areas 0.137 0.933 0.0668 0.005 0.169
Permanent crops 0.137 0.933 0.0668 0.099 0.190
Water courses 0.137 0.933 0.0668 0.804 0.345
Table 8. Holistic environmental index values.
Land Cover Er F HERi
Burnt areas 0.386 0.169 0.452
Permanent crops 0.386 0.190 0.460
Water courses 0.685 0.345 0.921
Disclaimer/Publisher’s Note: The statements, opinions and data contained in all publications are solely those of the individual author(s) and contributor(s) and not of MDPI and/or the editor(s). MDPI and/or the editor(s) disclaim responsibility for any injury to people or property resulting from any ideas, methods, instructions or products referred to in the content.
Copyright: This open access article is published under a Creative Commons CC BY 4.0 license, which permit the free download, distribution, and reuse, provided that the author and preprint are cited in any reuse.
Prerpints.org logo

Preprints.org is a free preprint server supported by MDPI in Basel, Switzerland.

Subscribe

© 2024 MDPI (Basel, Switzerland) unless otherwise stated