Submitted:
14 February 2024
Posted:
15 February 2024
You are already at the latest version
Abstract
Keywords:
1. Introduction
2. Axial Intensity Control in an Vortical Optical Needle and Translation of Optical Needles
2.1. Axial Intensity Control in an Optical Needle
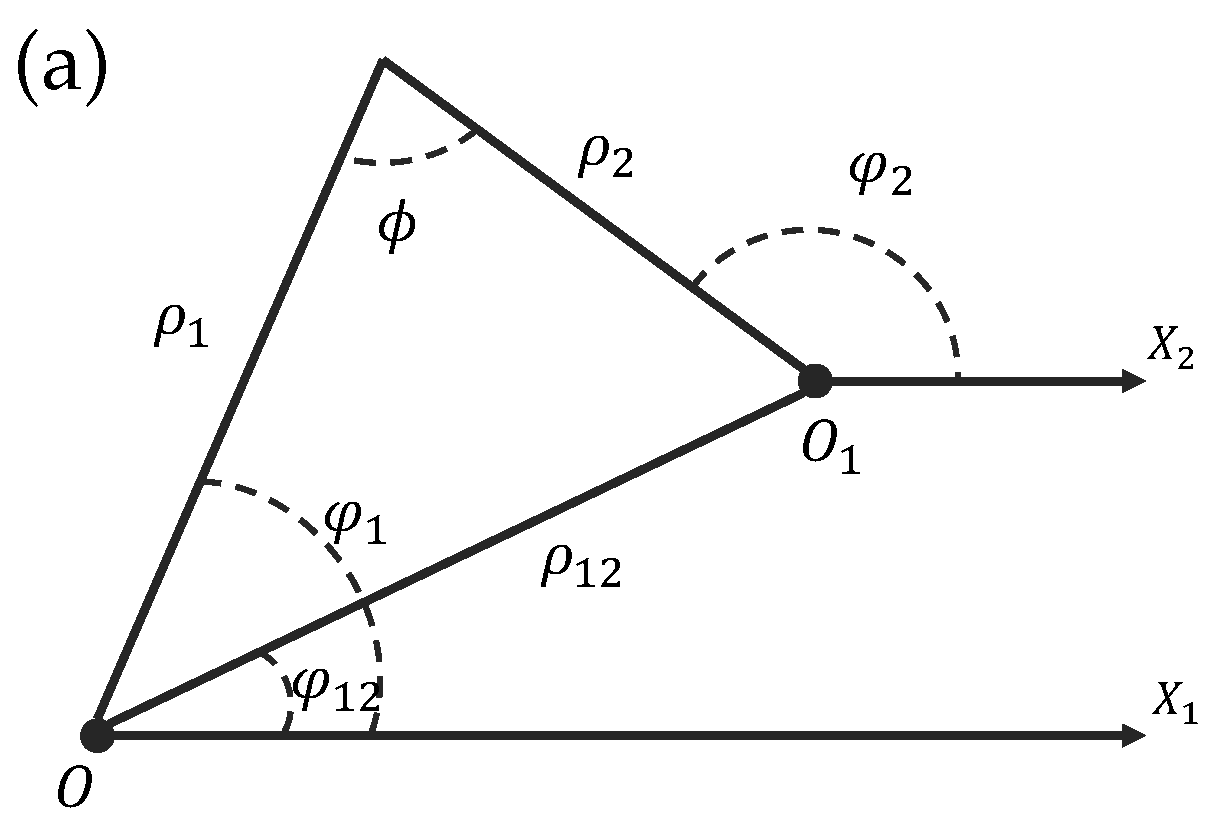
2.2. Translation of the Vortical Optical Needle
3. Experimental Results
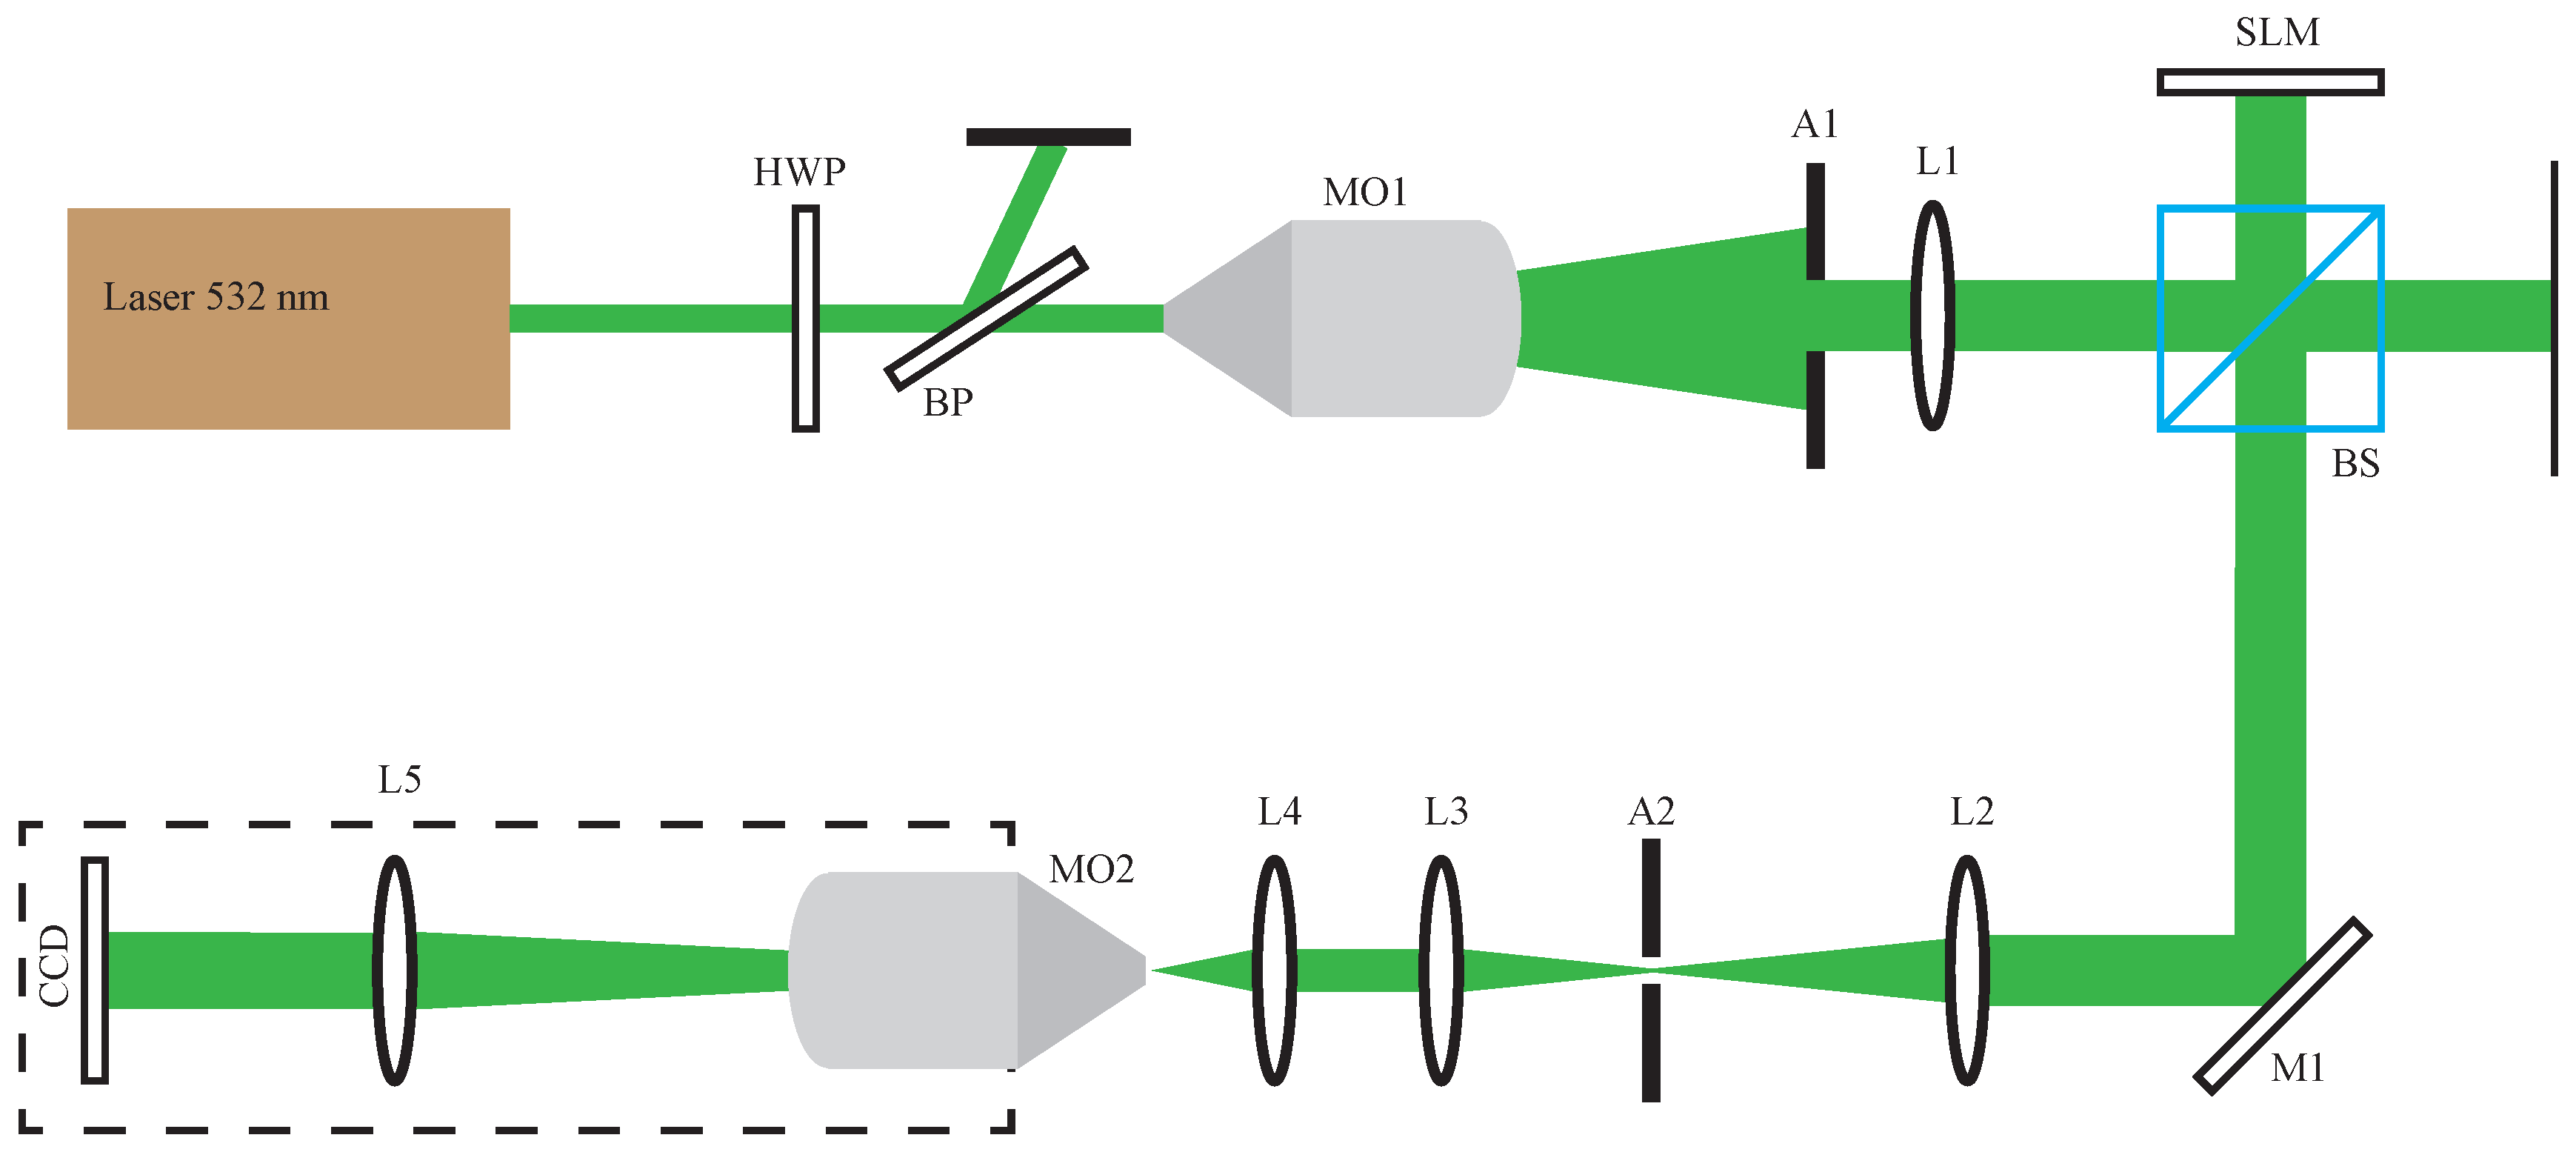
3.1. Optical Setup
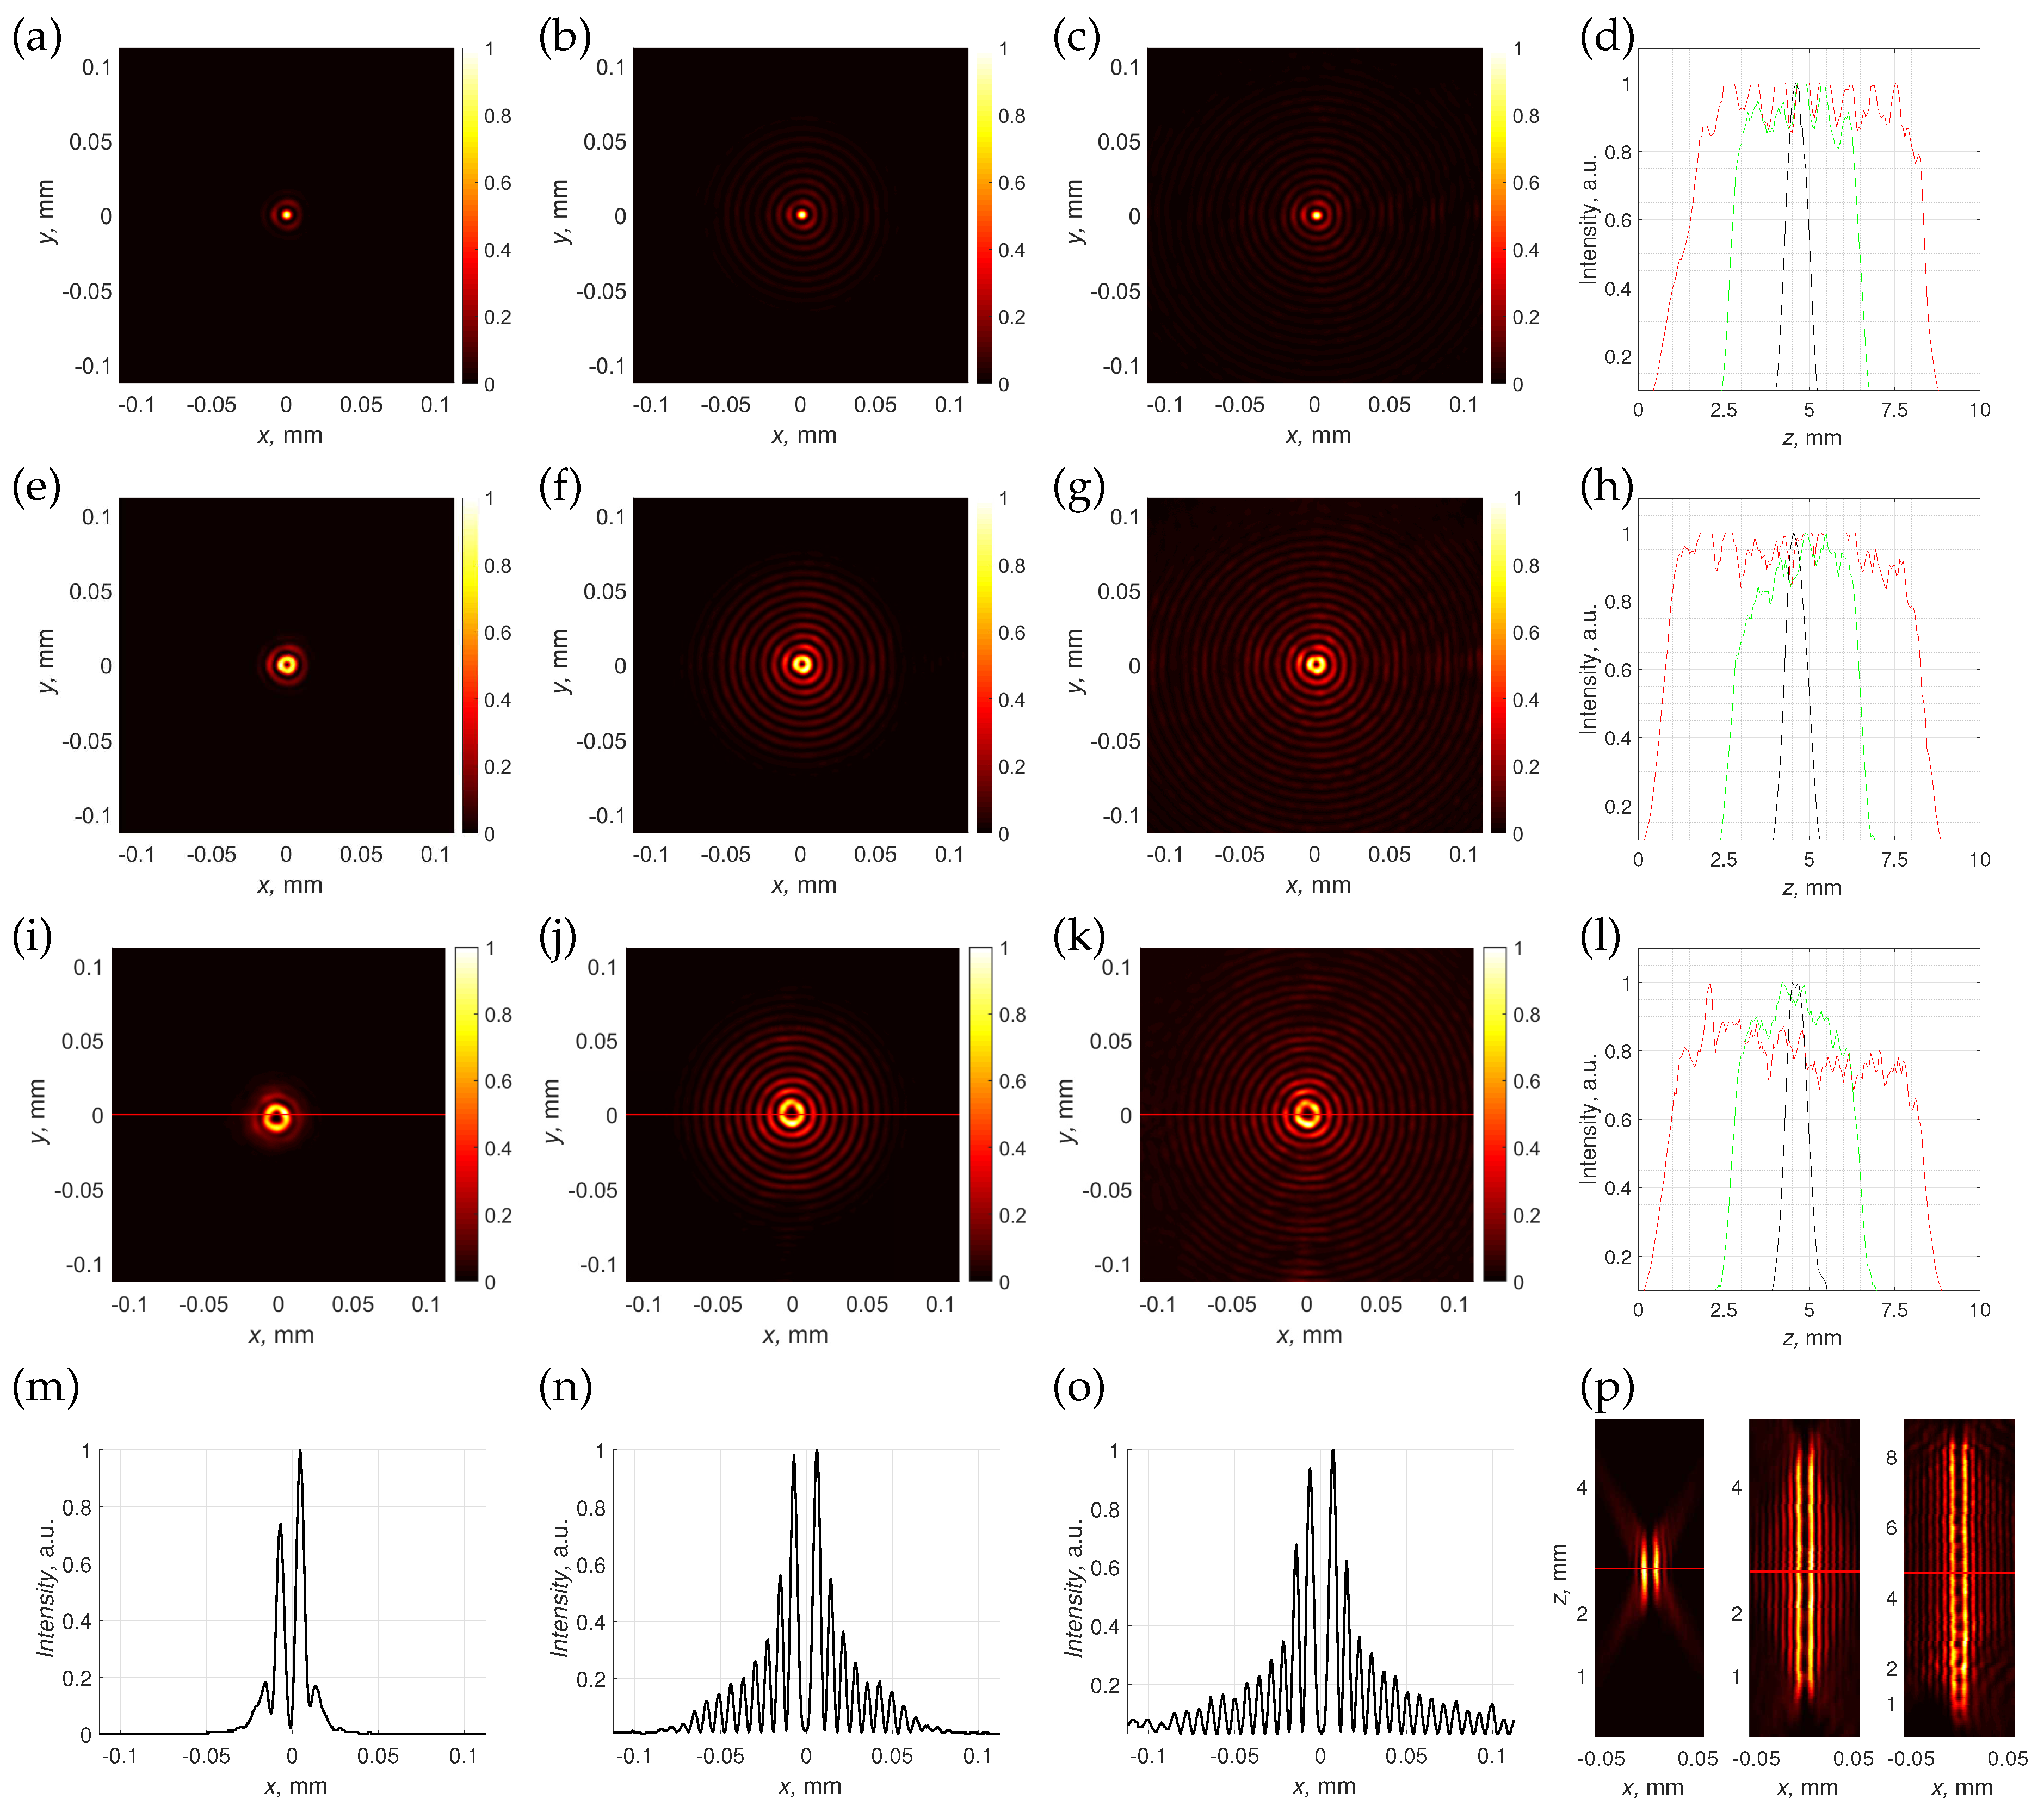
3.2. Creation of Single Vortical Needles
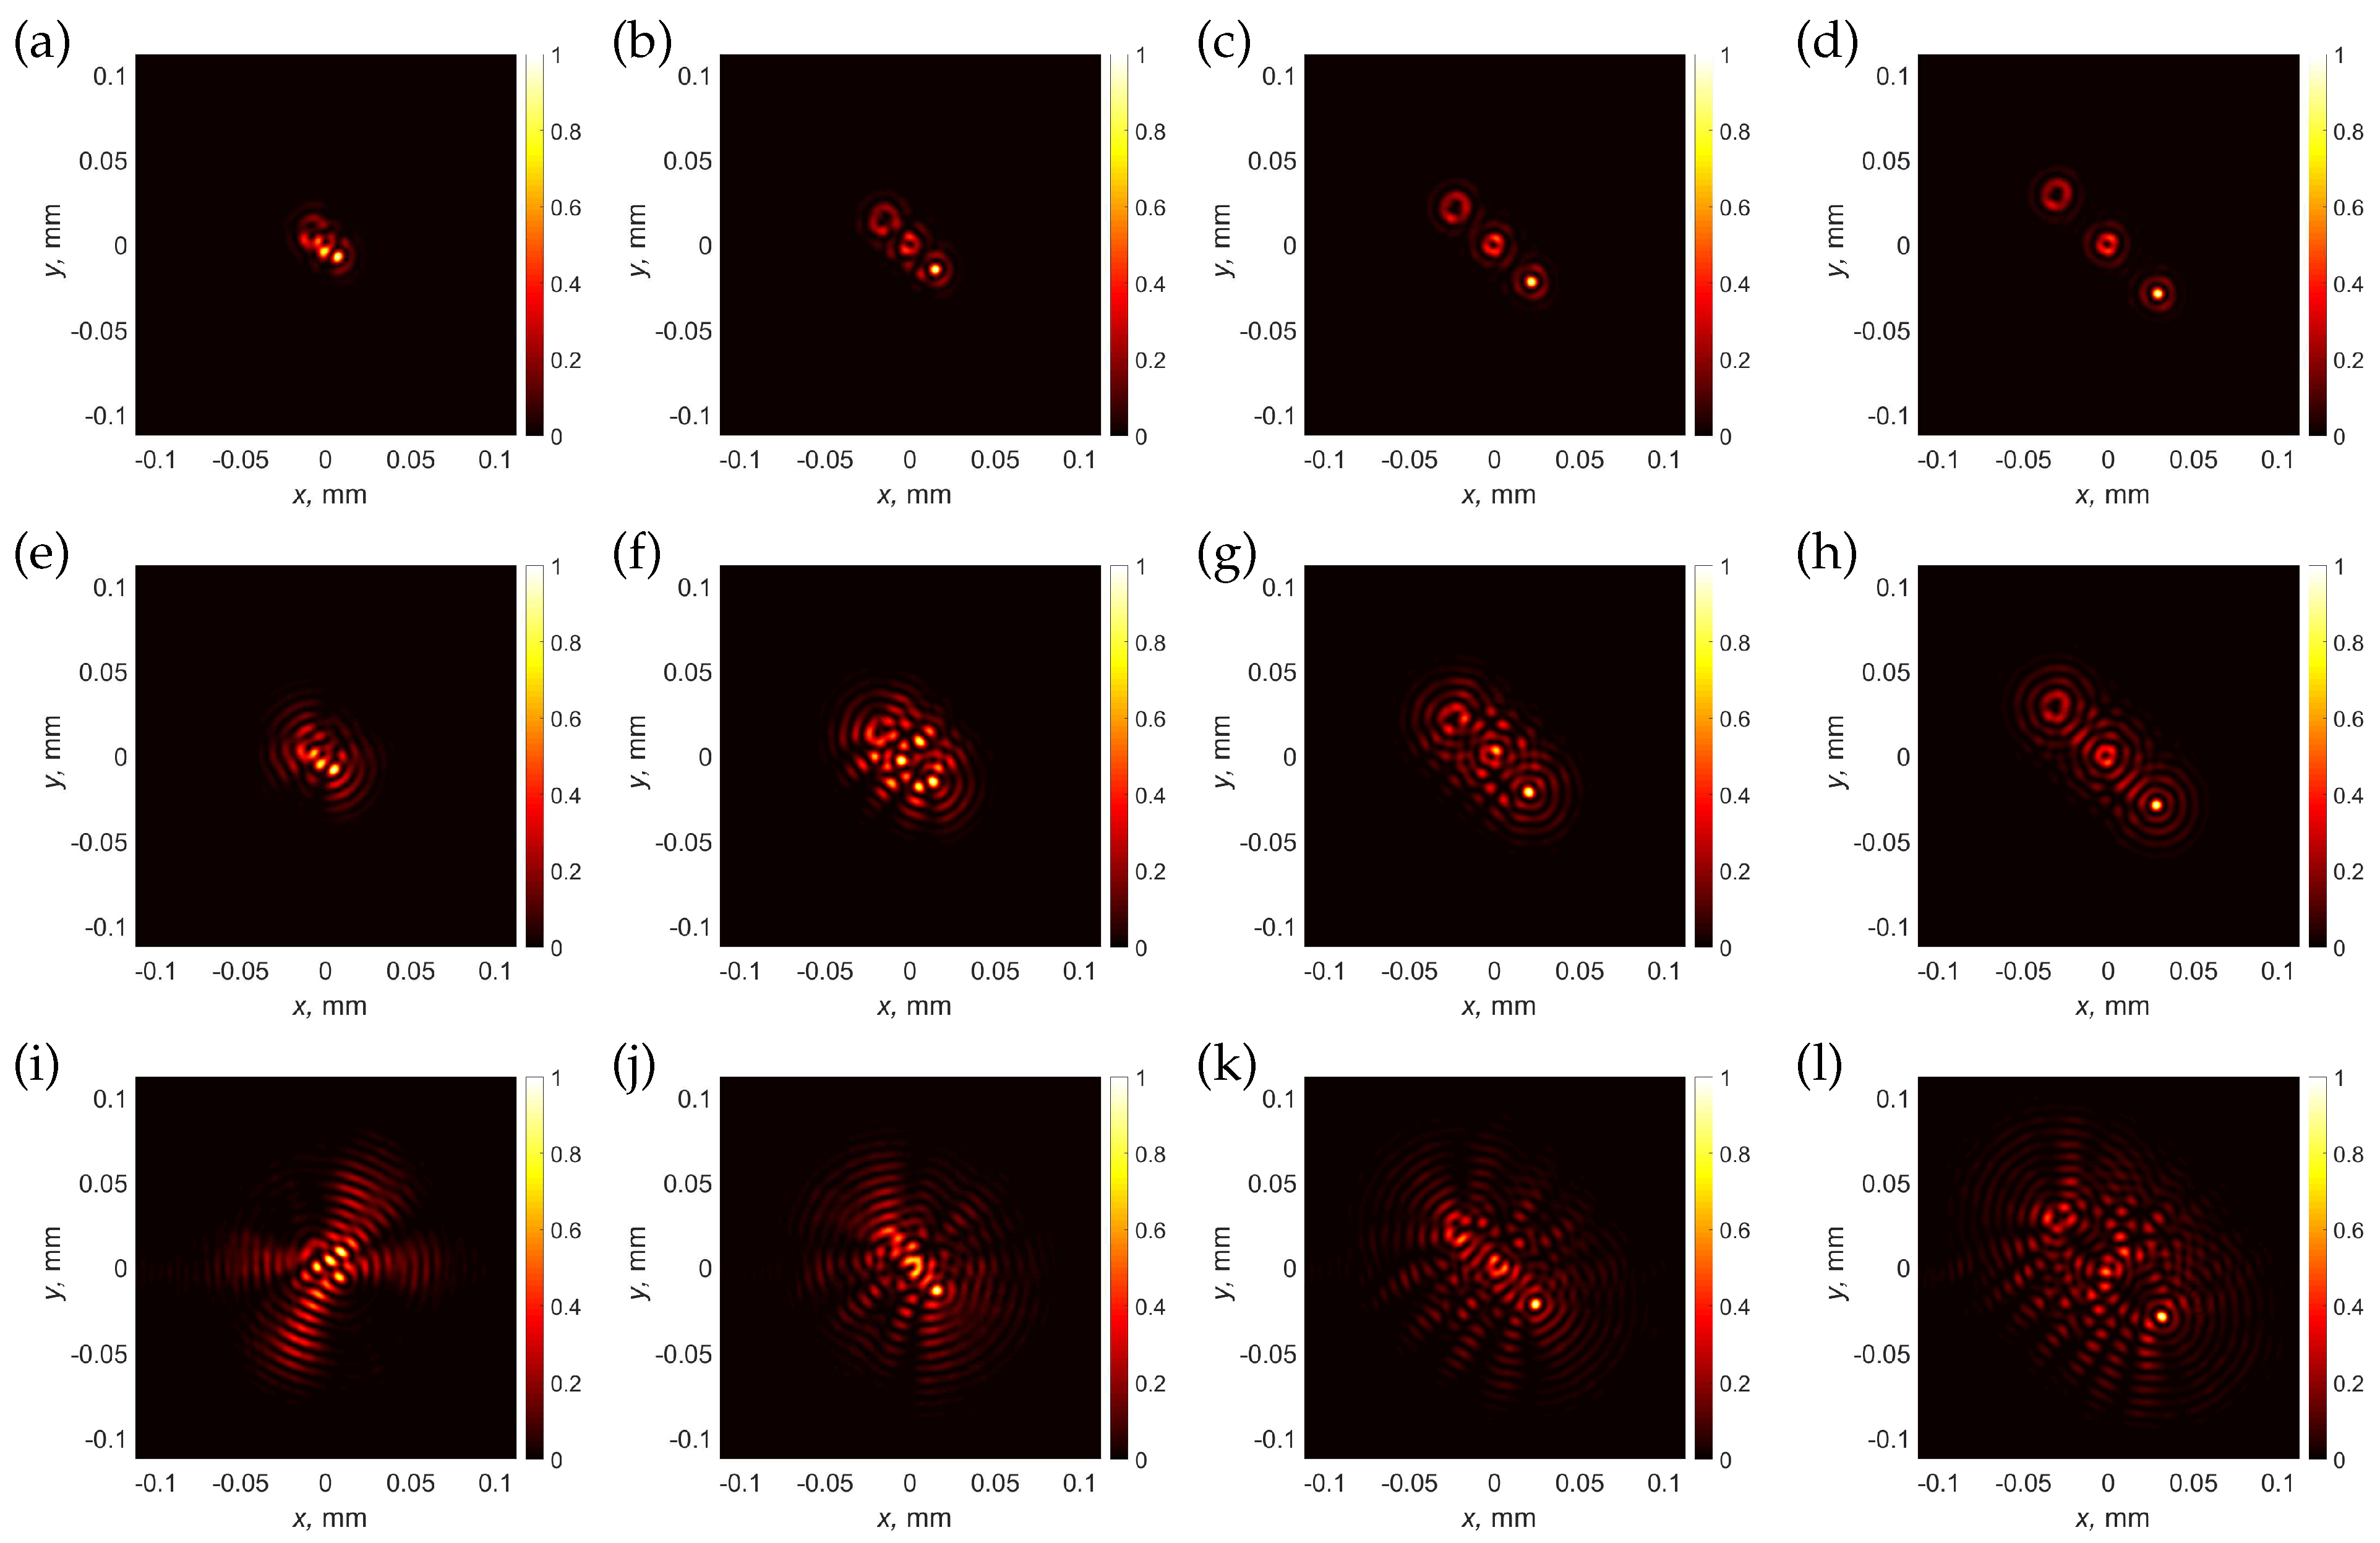
3.3. Creation of an Array of Optical Needles
3.4. Creation of an Array of Vortical Needles with Individual Topological Charges
3.5. Creation of an Array of Vortical Needles with Complex Positions and Axial Profiles
4. Discussion and Conclusions
Author Contributions
Funding
Data Availability Statement
Conflicts of Interest
Abbreviations
| SLM | Spatial Light Modulator |
| FWHM | Full Width at Half Maximum |
| CCD | Charge-Coupled Device |
| LD | Linear dichroism |
References
- Orazi, L.; Romoli, L.; Schmidt, M.; Li, L. Ultrafast laser manufacturing: From physics to industrial applications. CIRP Ann. 2021, 70, 543–566. [Google Scholar] [CrossRef]
- Sibbett, W.; Lagatsky, A.A.; Brown, C.T.A. The development and application of femtosecond laser systems. Opt. Express 2012, 20, 6989–7001. [Google Scholar] [CrossRef]
- Sussulini, A.; Becker, J.S.; Becker, J.S. Laser ablation ICP-MS: Application in biomedical research. Mass Spectrom. Rev. 2017, 36, 47–57. [Google Scholar] [CrossRef]
- Knox, W. Ultrafast technology in telecommunications. IEEE J. Sel. Top. Quantum Electron. 2000, 6, 1273–1278. [Google Scholar] [CrossRef]
- Weng, Y.; Ip, E.; Pan, Z.; Wang, T. Advanced Spatial-Division Multiplexed Measurement Systems Propositions—From Telecommunication to Sensing Applications: A Review. Sensors 2016, 16. [Google Scholar] [CrossRef]
- Rubinsztein-Dunlop, H.; Forbes, A.; Berry, M.V.; Dennis, M.R.; Andrews, D.L.; Mansuripur, M.; Denz, C.; Alpmann, C.; Banzer, P.; Bauer, T.; et al. Roadmap on structured light. J. Opt. 2016, 19, 013001. [Google Scholar] [CrossRef]
- Angelsky, O.V.; Bekshaev, A.Y.; Hanson, S.G.; Zenkova, C.Y.; Mokhun, I.I.; Jun, Z. Structured light: Ideas and concepts. Front. Phys. 2020, 8, 114. [Google Scholar] [CrossRef]
- Courvoisier, F. Nonstandard Light for Ultrafast Laser Microstructuring and Nanostructuring. In Ultrafast Laser Nanostructuring: The Pursuit of Extreme Scales; 2023; pp. 581–621. [Google Scholar]
- Porfirev, A.; Khonina, S.; Kuchmizhak, A. Light–matter interaction empowered by orbital angular momentum: Control of matter at the micro-and nanoscale. Progress in Quantum Electronics 2023, 100459. [Google Scholar] [CrossRef]
- Durnin, J. Exact solutions for nondiffracting beams. I. The scalar theory. JOSA A 1987, 4, 651–654. [Google Scholar] [CrossRef]
- Durnin, J.; Miceli Jr, J.; Eberly, J.H. Diffraction-free beams. Phys. Rev. Lett. 1987, 58, 1499. [Google Scholar] [CrossRef]
- Khonina, S.N.; Kazanskiy, N.L.; Karpeev, S.V.; Butt, M.A. Bessel Beam: Significance and Applications—A Progressive Review. Micromachines 2020, 11, 997. [Google Scholar] [CrossRef]
- Grunwald, R.; Bock, M. Needle beams: A review. Adv. Physics: X 2020, 5, 1736950. [Google Scholar] [CrossRef]
- Misawa, H.; Juodkazis, S. 3D laser microfabrication: Principles and applications; John Wiley & Sons, 2006. [Google Scholar]
- Jarutis, V.; Paškauskas, R.; Stabinis, A. Focusing of Laguerre–Gaussian beams by axicon. Opt. Commun. 2000, 184, 105–112. [Google Scholar] [CrossRef]
- Khonina, S.N.; Kazanskiy, N.L.; Khorin, P.A.; Butt, M.A. Modern types of axicons: New functions and applications. Sensors 2021, 21, 6690. [Google Scholar] [CrossRef]
- Bhuyan, M.K.; Courvoisier, F.; Lacourt, P.A.; Jacquot, M.; Salut, R.; Furfaro, L.; Dudley, J.M. High aspect ratio nanochannel machining using single shot femtosecond Bessel beams. Appl. Phys. Lett. 2010, 97, 081102. [Google Scholar] [CrossRef]
- Chen, L.; Yu, D. Investigation of low-cost through glass vias formation on borosilicate glass by picosecond laser-induced selective etching. J. Mater. Sci. Mater. Electron. 2021, 32, 16481–16493. [Google Scholar] [CrossRef]
- Mikutis, M.; Kudrius, T.; Šlekys, G.; Paipulas, D.; Juodkazis, S. High 90% efficiency Bragg gratings formed in fused silica by femtosecond Gauss-Bessel laser beams. Opt. Mater. Express 2013, 3, 1862–1871. [Google Scholar] [CrossRef]
- Meyer, R.; Froehly, L.; Giust, R.; Del Hoyo, J.; Furfaro, L.; Billet, C.; Courvoisier, F. Extremely high-aspect-ratio ultrafast Bessel beam generation and stealth dicing of multi-millimeter thick glass. Appl. Phys. Lett. 2019, 114, 201105. [Google Scholar] [CrossRef]
- Rapp, L.; Meyer, R.; Furfaro, L.; Billet, C.; Giust, R.; Courvoisier, F. High speed cleaving of crystals with ultrafast Bessel beams. Opt. Express 2017, 25, 9312–9317. [Google Scholar] [CrossRef]
- Feuer, A.; Thomas, J.U.; Freitag, C.; Weber, R.; Graf, T. Single-pass laser separation of 8 mm thick glass with a millijoule picosecond pulsed Gaussian–Bessel beam. Appl. Phys. A 2019, 125, 332. [Google Scholar] [CrossRef]
- Minkevičius, L.; Jokubauskis, D.; Kašalynas, I.; Orlov, S.; Urbas, A.; Valušis, G. Bessel terahertz imaging with enhanced contrast realized by silicon multi-phase diffractive optics. Opt. Express 2019, 27, 36358–36367. [Google Scholar] [CrossRef]
- McGloin, D.; Garcés-Chávez, V.; Dholakia, K. Interfering Bessel beams for optical micromanipulation. Opt. Lett. 2003, 28, 657–659. [Google Scholar] [CrossRef]
- Gao, L.; Shao, L.; Chen, B.C.; Betzig, E. 3D live fluorescence imaging of cellular dynamics using Bessel beam plane illumination microscopy. Nat. Protoc. 2014, 9, 1083–1101. [Google Scholar] [CrossRef]
- Zhu, M.; Cao, Q.; Gao, H. Creation of a 50,000 λ long needle-like field with 0.36 λ width. JOSA A 2014, 31, 500–504. [Google Scholar] [CrossRef]
- Lightman, S.; Gvishi, R.; Hurvitz, G.; Arie, A. Shaping of light beams by 3D direct laser writing on facets of nonlinear crystals. Opt. Lett. 2015, 40, 4460–4463. [Google Scholar] [CrossRef]
- Courvoisier, F.; Zhang, J.; Bhuyan, M.; Jacquot, M.; Dudley, J.M. Applications of femtosecond Bessel beams to laser ablation. Appl. Phys. A 2013, 112, 29–34. [Google Scholar] [CrossRef]
- Gotovski, P.; Šlevas, P.; Orlov, S.; Ulčinas, O.; Urbas, A. Generation of an optical needle beam with a laser inscribed Pancharatnam-Berry phase element under imperfect conditions. Opt. Express 2021, 29, 33331–33345. [Google Scholar] [CrossRef]
- Šlevas, P.; Mundrys, K.; Ulčinas, O.; Orlov, S. An optical needle with elongated transversal profile created using Airy beams for laser processing of glasses. Opt. Laser Technol. 2024, 174, 110558. [Google Scholar] [CrossRef]
- Orlov, S.; Stabinis, A. Propagation of superpositions of coaxial optical Bessel beams carrying vortices. J. Opt. A: Pure Appl. Opt. 2004, 6, S259. [Google Scholar] [CrossRef]
- Doan, D.H.; Iida, R.; Kim, B.; Satoh, I.; Fushinobu, K. Bessel beam laser-scribing of thin film silicon solar cells by ns pulsed laser. J. Therm. Sci. Technol. 2016, 11, JTST0011–JTST0011. [Google Scholar] [CrossRef]
- Wetzel, B.; Xie, C.; Lacourt, P.A.; Dudley, J.M.; Courvoisier, F. Femtosecond laser fabrication of micro and nano-disks in single layer graphene using vortex Bessel beams. Appl. Phys. Lett. 2013, 103. [Google Scholar] [CrossRef]
- Li, X.; Xu, Z.; Jiang, L.; Shi, Y.; Wang, A.; Huang, L.; Wei, Q. Creating a three-dimensional surface with antireflective properties by using femtosecond-laser Bessel-beam-assisted thermal oxidation. Opt. Lett. 2020, 45, 2989–2992. [Google Scholar] [CrossRef]
- Jaroszewicz, Z.; Sochacki, J.; Kołodziejczyk, A.; Staronski, L.R. Apodized annular-aperture logarithmic axicon: Smoothness and uniformity of intensity distributions. Opt. Lett. 1993, 18, 1893–1895. [Google Scholar] [CrossRef]
- Golub, I.; Chebbi, B.; Shaw, D.; Nowacki, D. Characterization of a refractive logarithmic axicon. Opt. Lett. 2010, 35, 2828–2830. [Google Scholar] [CrossRef]
- Čižmár, T.; Dholakia, K. Tunable Bessel light modes: Engineering the axial propagation. Opt. Express 2009, 17, 15558–15570. [Google Scholar] [CrossRef]
- Orlov, S.; Juršėnas, A.; Nacius, E. Optical Bessel-like beams with engineered axial phase and intensity distribution. J. Laser Micro Nanoeng. 2018, 13, 244–248. [Google Scholar]
- Dharmavarapu, R.; Bhattacharya, S.; Juodkazis, S. Diffractive optics for axial intensity shaping of Bessel beams. J. Opt. 2018, 20, 085606. [Google Scholar] [CrossRef]
- Gutiérrez-Vega, J.C.; Iturbe-Castillo, M.; Chávez-Cerda, S. Alternative formulation for invariant optical fields: Mathieu beams. Opt. Lett. 2000, 25, 1493–1495. [Google Scholar] [CrossRef]
- Bandres, M.A.; Rodríguez-Lara, B. Nondiffracting accelerating waves: Weber waves and parabolic momentum. New J. Phys. 2013, 15, 013054. [Google Scholar] [CrossRef]
- Orlov, S.; Vosylius, V.; Gotovski, P.; Grabusovas, A.; Baltrukonis, J.; Gertus, T. Vector beams with parabolic and elliptic cross-sections for laser material processing applications. J. Laser Micro Nanoeng. 2018, 13, 280–286. [Google Scholar]
- Berry, M.V.; Balazs, N.L. Nonspreading wave packets. Am. J. Phys. 1979, 47, 264–267. [Google Scholar] [CrossRef]
- Siviloglou, G.A.; Broky, J.; Dogariu, A.; Christodoulides, D.N. Observation of Accelerating Airy Beams. Phys. Rev. Lett. 2007, 99, 213901. [Google Scholar] [CrossRef]
- Baumgartl, J.; Mazilu, M.; Dholakia, K. Optically mediated particle clearing using Airy wavepackets. Nat. Photonics 2008, 2, 675–678. [Google Scholar] [CrossRef]
- Cheng, H.; Zang, W.; Zhou, W.; Tian, J. Analysis of optical trapping and propulsion of Rayleigh particles using Airy beam. Opt. Express 2010, 18, 20384–20394. [Google Scholar] [CrossRef] [PubMed]
- Zheng, Z.; Zhang, B.F.; Chen, H.; Ding, J.; Wang, H.T. Optical trapping with focused Airy beams. Appl. Opt. 2011, 50, 43–49. [Google Scholar] [CrossRef]
- Mathis, A.; Courvoisier, F.; Froehly, L.; Furfaro, L.; Jacquot, M.; Lacourt, P.A.; Dudley, J.M. Micromachining along a curve: Femtosecond laser micromachining of curved profiles in diamond and silicon using accelerating beams. Appl. Phys. Lett. 2012, 101, 071110. [Google Scholar] [CrossRef]
- Manousidaki, M.; Papazoglou, D.G.; Farsari, M.; Tzortzakis, S. Abruptly autofocusing beams enable advanced multiscale photo-polymerization. Optica 2016, 3, 525–530. [Google Scholar] [CrossRef]
- Ivaškevičiūtė-Povilauskienė, R.; Kizevičius, P.; Nacius, E.; Jokubauskis, D.; Ikamas, K.; Lisauskas, A.; Alexeeva, N.; Matulaitienė, I.; Jukna, V.; Orlov, S.; et al. Terahertz structured light: Nonparaxial Airy imaging using silicon diffractive optics. Light. Sci. & Appl. 2022, 11, 326. [Google Scholar] [CrossRef]
- Duocastella, M.; Arnold, C.B. Bessel and annular beams for materials processing. Laser Photonics Rev. 2012, 6, 607–621. [Google Scholar] [CrossRef]
- Stoian, R.; Bhuyan, M.K.; Zhang, G.; Cheng, G.; Meyer, R.; Courvoisier, F. Ultrafast Bessel beams: Advanced tools for laser materials processing. Adv. Opt. Technol. 2018, 7, 165–174. [Google Scholar] [CrossRef]
- Wang, J.; Chen, W.; Zhan, Q. Engineering of high purity ultra-long optical needle field through reversing the electric dipole array radiation. Opt. Express 2010, 18, 21965–21972. [Google Scholar] [CrossRef]
- Rogers, E.T.; Savo, S.; Lindberg, J.; Roy, T.; Dennis, M.R.; Zheludev, N.I. Super-oscillatory optical needle. Appl. Phys. Lett. 2013, 102. [Google Scholar] [CrossRef]
- Orlov, S.; Juršėnas, A.; Baltrukonis, J.; Jukna, V. Controllable spatial array of Bessel-like beams with independent axial intensity distributions for laser microprocessing. J. Laser Micro Nanoeng. 2018, 13, 324–329. [Google Scholar]
- Coullet, P.; Gil, L.; Rocca, F. Optical vortices. Opt. Commun. 1989, 73, 403–408. [Google Scholar] [CrossRef]
- Gahagan, K.; Swartzlander, G.J. Optical vortex trapping of particles. Opt. Lett. 1996, 21, 827–829. [Google Scholar] [CrossRef]
- Molina-Terriza, G.; Torres, J.P.; Torner, L. Twisted photons. Nat. Phys. 2007, 3, 305–310. [Google Scholar] [CrossRef]
- Shen, Y.; Wang, X.; Xie, Z.; Min, C.; Fu, X.; Liu, Q.; Gong, M.; Yuan, X. Optical vortices 30 years on: OAM manipulation from topological charge to multiple singularities. Light. Sci. Appl. 2019, 8, 1–29. [Google Scholar] [CrossRef]
- Porfirev, A.P.; Kuchmizhak, A.A.; Gurbatov, S.O.; Juodkazis, S.; Khonina, S.N.; Kulchin, Y.N. Phase singularities and optical vortices in photonics. Phys. Usp. 2022, 65, 789–811. [Google Scholar] [CrossRef]
- Allen, L.; Beijersbergen, M.W.; Spreeuw, R.J.C.; Woerdman, J.P. Orbital angular momentum of light and the transformation of Laguerre-Gaussian laser modes. Phys. Rev. A 1992, 45, 8185–8189. [Google Scholar] [CrossRef]
- Chávez-Cerda, S.; McDonald, G.; New, G. Nondiffracting beams: Travelling, standing, rotating and spiral waves. Opt. Commun. 1996, 123, 225–233. [Google Scholar] [CrossRef]
- Kotlyar, V.; Soifer, V.; Khonina, S. An algorithm for the generation of laser beams with longitudinal periodicity: Rotating images. J. Mod. Opt. 1997, 44, 1409–1416. [Google Scholar] [CrossRef]
- Khonina, S.; Kotlyar, V.; Soifer, V.; Lautanen, J.; Honkanen, M.; Turunen, J. Generating a couple of rotating nondiffracting beams using a binary-phase DOE. Opt.-Int. J. Light Electron Opt. 1999, 110, 137–144. [Google Scholar]
- Tervo, J.; Turunen, J. Rotating scale-invariant electromagnetic fields. Opt. Express 2001, 9, 9–15. [Google Scholar] [CrossRef] [PubMed]
- Leach, J.; Dennis, M.R.; Courtial, J.; Padgett, M.J. Knotted threads of darkness. Nature 2004, 432, 165–165. [Google Scholar] [CrossRef] [PubMed]
- Dennis, M.R.; King, R.P.; Jack, B.; O’holleran, K.; Padgett, M.J. Isolated optical vortex knots. Nat. Phys. 2010, 6, 118–121. [Google Scholar] [CrossRef]
- Sugic, D.; Dennis, M.R. Singular knot bundle in light. JOSA A 2018, 35, 1987–1999. [Google Scholar] [CrossRef] [PubMed]
- Bode, B.; Dennis, M.R.; Foster, D.; King, R.P. Knotted fields and explicit fibrations for lemniscate knots. Proc. R. Soc. A: Math. Phys. Eng. Sci. 2017, 473, 20160829. [Google Scholar] [CrossRef] [PubMed]
- Lasagni, A.F.; Gachot, C.; Trinh, K.E.; Hans, M.; Rosenkranz, A.; Roch, T.; Eckhardt, S.; Kunze, T.; Bieda, M.; Günther, D.; et al. Direct laser interference patterning, 20 years of development: From the basics to industrial applications. In Proceedings of the Laser-based micro-and nanoprocessing XI; SPIE, 2017; Volume 10092, pp. 186–196. [Google Scholar]
- Zabila, Y.; Perzanowski, M.; Dobrowolska, A.; Kąc, M.; Polit, A.; Marszałek, M. Direct laser interference patterning: Theory and application. Acta Phys. Pol. A 2009, 115, 591–593. [Google Scholar] [CrossRef]
- Si, J.; Feng, Z.; Cheng, D.; Wang, Y. Freeform beam splitting system design for generating an array of identical sub-beams. Opt. Express 2021, 29, 29918–29935. [Google Scholar] [CrossRef]
- Kahle, M.; Nodop, D.; Rücker, J. Beam shaping and splitting for high-power USP-lasers. Procedia CIRP 2020, 94, 807–811. [Google Scholar] [CrossRef]
- Katz, S.; Kaplan, N.; Grossinger, I. Using Diffractive Optical Elements: DOEs for beam shaping–fundamentals and applications. Opt. Photonik 2018, 13, 83–86. [Google Scholar] [CrossRef]
- Brodsky, A.; Kaplan, N. Laser surface texturing using a single diffractive optical element as an alternative for direct laser interference patterning. J. Laser Appl. 2020, 32. [Google Scholar] [CrossRef]
- Bowman, R.; Muller, N.; Zambrana-Puyalto, X.; Jedrkiewicz, O.; Di Trapani, P.; Padgett, M. Efficient generation of Bessel beam arrays by means of an SLM. Eur. Phys. J. Spec. Top. 2011, 199, 159–166. [Google Scholar] [CrossRef]
- Lutz, C.; Schwarz, S.; Marx, J.; Esen, C.; Hellmann, R. Multi-Bessel Beams Generated by an Axicon and a Spatial Light Modulator for Drilling Applications. Photonics 2023, 10. [Google Scholar] [CrossRef]
- Stankevicius, E.; Garliauskas, M.; Raciukaitis, G. Bessel-like beam array generation using round-tip microstructures and their use in the material treatment. J. Laser Micro Nanoeng. 2016, 11, 352. [Google Scholar]
- Dudutis, J.; Stonys, R.; Račiukaitis, G.; Gečys, P. Aberration-controlled Bessel beam processing of glass. Opt. Express 2018, 26, 3627–3637. [Google Scholar] [CrossRef]
- Novotny, L.; Hecht, B. Principles of nano-optics; Cambridge university press, 2012. [Google Scholar]
- Jenne, M.; Flamm, D.; Ouaj, T.; Hellstern, J.; Kleiner, J.; Grossmann, D.; Koschig, M.; Kaiser, M.; Kumkar, M.; Nolte, S. High-quality tailored-edge cleaving using aberration-corrected Bessel-like beams. Opt. Lett. 2018, 43, 3164–3167. [Google Scholar] [CrossRef]
- Zamboni-Rached, M.; Recami, E.; Hernández-Figueroa, H.E. Theory of “frozen waves”: Modeling the shape of stationary wave fields. JOSA A 2005, 22, 2465–2475. [Google Scholar] [CrossRef]
- Yan, W.; Gao, Y.; Yuan, Z.; Wang, Z.; Ren, Z.C.; Wang, X.L.; Ding, J.; Wang, H.T. Non-diffracting and self-accelerating Bessel beams with on-demand tailored intensity profiles along arbitrary trajectories. Opt. Lett. 2021, 46, 1494–1497. [Google Scholar] [CrossRef]
- Lutz, C.; Schwarz, S.; Marx, J.; Esen, C.; Hellmann, R. Multi-Bessel Beams Generated by an Axicon and a Spatial Light Modulator for Drilling Applications. Photonics 2023, 10, 413. [Google Scholar] [CrossRef]
- Zeng, Y.; Yu, Y.; Wu, P.; Chen, M.; Zheng, S.; Pan, M.; Zhan, Q. Generation of a linear array of focal spots with prescribed characteristic using the radiation pattern from a tapered line source antenna. Opt. Commun. 2023, 534, 129329. [Google Scholar] [CrossRef]
- Lutz, C.; Schwarz, S.; Rung, S.; Marx, J.; Esen, C.; Hellmann, R. Optical system for multi Bessel beam high power ultrashort pulsed laser processing using a spatial light modulator. In Proceedings of the Lasers in Manufacturing-LiM 2021; 2021. [Google Scholar]
- Stratton, J.A. Electromagnetic theory; John Wiley & Sons, 2007; Volume 33. [Google Scholar]
- Wang, Y.; Potoček, V.; Barnett, S.M.; Feng, X. Programmable holographic technique for implementing unitary and nonunitary transformations. Phys. Rev. A 2017, 95, 033827. [Google Scholar] [CrossRef]
- Orlov, S.; Regelskis, K.; Smilgevičius, V.; Stabinis, A. Propagation of Bessel beams carrying optical vortices. Opt. Commun. 2002, 209, 155–165. [Google Scholar] [CrossRef]
- Orlov, S.; Stabinis, A. Free-space propagation of light field created by Bessel–Gauss and Laguerre–Gauss singular beams. Opt. Commun. 2003, 226, 97–105. [Google Scholar] [CrossRef]
- Pyragaite, V.; Stabinis, A. Free-space propagation of overlapping light vortex beams. Opt. Commun. 2002, 213, 187–191. [Google Scholar] [CrossRef]



Disclaimer/Publisher’s Note: The statements, opinions and data contained in all publications are solely those of the individual author(s) and contributor(s) and not of MDPI and/or the editor(s). MDPI and/or the editor(s) disclaim responsibility for any injury to people or property resulting from any ideas, methods, instructions or products referred to in the content. |
© 2024 by the authors. Licensee MDPI, Basel, Switzerland. This article is an open access article distributed under the terms and conditions of the Creative Commons Attribution (CC BY) license (http://creativecommons.org/licenses/by/4.0/).


