1. Introduction
Hiccups are a common symptom experienced by many people and are mainly caused by myoclonus of the diaphragm [
1]. Hiccups have been associated with speech, sleep, and swallowing disorders and weight loss, fatigue, and insomnia [
2]. Although not life-threatening, hiccups can significantly reduce the quality of life of patients. If hiccups occur as a drug side effect, they can also impact the choice of drug treatment. Therefore, controlling hiccups that are drug side effects is important for drug therapy.
Hiccups are brief, involuntary spasms of the muscles of the diaphragm accompanied by coordinated contractions of the glottis closure muscle group [
1]. The afferent and efferent pathways of the hiccup reflex arch involve the glossopharyngeal nerve (9th cranial nerve), vagus nerve (10th cranial nerve), nucleus of the solitary bundle tract, nucleus ambiguous, and peroneal nerve [
3]. The exact mechanism of the hiccup reflex arch is unclear. However, neurotransmitters such as gamma-aminobutyric acid (GABA), serotonin, and dopamine have been associated with the onset of hiccups. Reflex arches are mediated by central neurotransmitters (GABA, dopamine, and serotonin) and peripheral neurotransmitters (epinephrine, norepinephrine, acetylcholine, and histamine) [
4,
5]. There are no reports on sex differences or physical information about common hiccups experienced by healthy individuals. However, male patients have a high incidence of intractable or persistent hiccups [
6].
Several reports have described drug-induced hiccups. Lee et al. revealed a male predominance for peripheral hiccups based on a meta-analysis. However, there were no sex difference in hiccups caused by central nervous system disorders [
6]. In a study about the risk factors of patient-induced hiccups, low body mass index, nausea and vomiting, and cancer drug therapy were associated with hiccups [
7]. In other reports, cisplatin [
8,
9] and dexamethasone [
10] have been suspected to affect the development of hiccups. However, no studies have analyzed the risk factors for drug-induced hiccups using data from large databases. Therefore, in a previous study, drug and patient information related to hiccups were analyzed using data from the Japanese Adverse Drug Event Report (JADER) database and the FDA Adverse Event Reporting System (FAERS) database via data mining [
11,
12]. Dexamethasone and several anticancer drugs were identified as independent risk factors for hiccups. We also established a visualization method for suspected drugs in the adverse drug reaction database. In a prior study using data from JADER, data on the drugs suspected to affect hiccups were extracted, and results showed that a patient’s height is a risk factor for hiccups [
11]. Furthermore, in an analysis using FAERS data stratified according to sex, the drugs suspected to affect hiccups differed significantly between male and female patients. Among them, nicotine was commonly suspected to be associated with hiccups in male and female individuals [
12]. Hiccups have male predominance [
6]; however, their cause has not been elucidated. No studies have yet validated whether the male predominance of hiccup occurrence is attributed to drug sensitivity or neurological sex differences.
As shows in a previous study, several case reports and database studies have assessed the association between hiccups and drugs. However, to the best of our knowledge, only a few studies have investigated the mechanism of drug-induced hiccups. The small number of cases involving drug-induced hiccups and the difficulty in predicting their onset are some reasons of the causes for the lack of research. To treat and prevent drug-induced hiccups, the causative mechanisms should be identified. Therefore, the molecular chemistry related to the induction of hiccups based on the suspected drug information identified using FAERS. By handling information on suspected drugs obtained from several sources, rare cases of adverse drug reactions, such as hiccups, can be evaluated. These results may provide leads for novel research to elucidate the pathogenic mechanism of hiccups.
Numerous factors are involved in the mechanism of the effects and adverse drug reactions. From the perspective of toxicology, molecular initiating events (MIEs) in the adverse outcome pathway (AOP) represent an important concept when considering the mechanism of drug-induced adverse effects [
13]. MIEs denote the first interaction between a molecule and a biomolecule or the biological system in the AOP. Their targets include nuclear receptors (NRs) and stress response pathways (SPs). NRs are intracellular proteins that regulate DNA transcription in the cell nucleus by binding to hormones and other substances. NRs bind directly to DNA and regulate gene expression, and they are associated with the development, homeostasis, and metabolism of the organism. If a ligand binds to a nuclear receptor, a conformational change occurs, which activates the receptor and subsequently regulates gene expression [
14]. SPs are biochemical processes that regulate the response to various stress signals in cells. Endocrine-disrupting chemicals disrupt the endocrine system by interacting with NRs and SPs, causing various adverse developmental, reproductive, neural, and immunological effects in humans and wildlife [
15]. Moreover, NRs and SPs may be involved in adverse drug events.
Drug-induced hiccups may develop hours or days after drug administration and may persist for an extended period [
7,
10]. Therefore, these phenomena are not controlled on a millisecond-by-millisecond basis but are thought to develop through several molecular pathways from the time of drug administration. Given these facts, we believe that searching for NRs/SRs as MIEs involved in the induction of drug-induced hiccups will help to elucidate their mechanisms. Therefore, this study aimed to identify NRs and SPs associated with drug-induced hiccups using Toxicity Predictor, a machine learning model.
3. Discussion
This study used data from the FAERS database, an adverse drug reaction database, to identify the key suspected drugs causing hiccups. Furthermore, the association between the suspected drugs and MIEs was investigated. To the best of our knowledge, there is limited information on the mechanism of drug-induced hiccups, and no reports based on adverse events reporting systems have revealed the mechanism of drug-induced hiccups. In addition, this was the first study that aimed to examine the MIEs , especially NRs/SRs, of drug-induced hiccups using Toxicity Predictor and FAERS. The Toxicity Predictor can predict the agonist and antagonist activities of a drug in the MIE, which is the starting point of action of an adverse effect. Previous reports have described methods for evaluating the MIEs of adverse effects using the Toxicity Predictor [
13]. We believe that such methods are reliable [
16].
To investigate the association between each suspected drug and NRs/SPs, the objective variable was a binary variable of lnROR > 0 (positive signal) or < 0 (negative signal). A method to identify prophylactic and therapeutic agents against side effects by focusing on drugs with positive and negative signals is a method of drug repositioning and has been attracting significant attention in recent years [
17,
18,
19]. This study examined the involvement of NRs/SPs in hiccups by comparing the MIE activities of drugs with positive and negative signals for drug-induced hiccups.
The data used in this study were classified into the overall cohort and the male and female subgroups. Drug-induced hiccups occur more frequently in men [
6]. In our previous study using the adverse drug reaction database, hiccups were also more commonly in men, and the distinctions regarding the drugs suspected were noted between male and female patients [
11,
12]. Based on these findings, our objective was to identify the differences in NRs and SPs involved in the development of hiccups between male and female patients. Multivariate analysis identified the TGF-β agonist as an independent factor associated with hiccups in the overall dataset. In the male subgroup, TGF-β was an independent factor based on the univariate and multivariate analyses. In the female group, ARE was an independent factor in the univariate and multivariate analyses.
To the best of our knowledge, this report first explored the association between drug-induced hiccups and TGF-β. Toxicity Predictor, a toxicity prediction program, centers its predictions on the toxicity results of Tox21. To assess the cytotoxicity of a compound in Tox21, the transduction process by which TGF-β binds to the TGF-β receptor and acts on nuclear gene expression via the Smad protein is being monitored.
TGF-β is an important cytokine that maintains bodily homeostasis. It has been detected in a broad array of tissues and organs and is known for its roles in inhibiting cell proliferation and inducing cell differentiation and apoptosis in various cell types. In addition, TGF-β is involved in processes such as cell differentiation, migration, and adhesion. Moreover, it plays significant roles in diverse mechanisms including ontogeny, tissue remodeling, wound healing, inflammation, immunity, and cancer invasion and metastasis. TGF-β was identified in the cerebral spinal fluid of mice exhibiting exhaustion. Thus, its use as a fatigue marker has gained attention [
20].
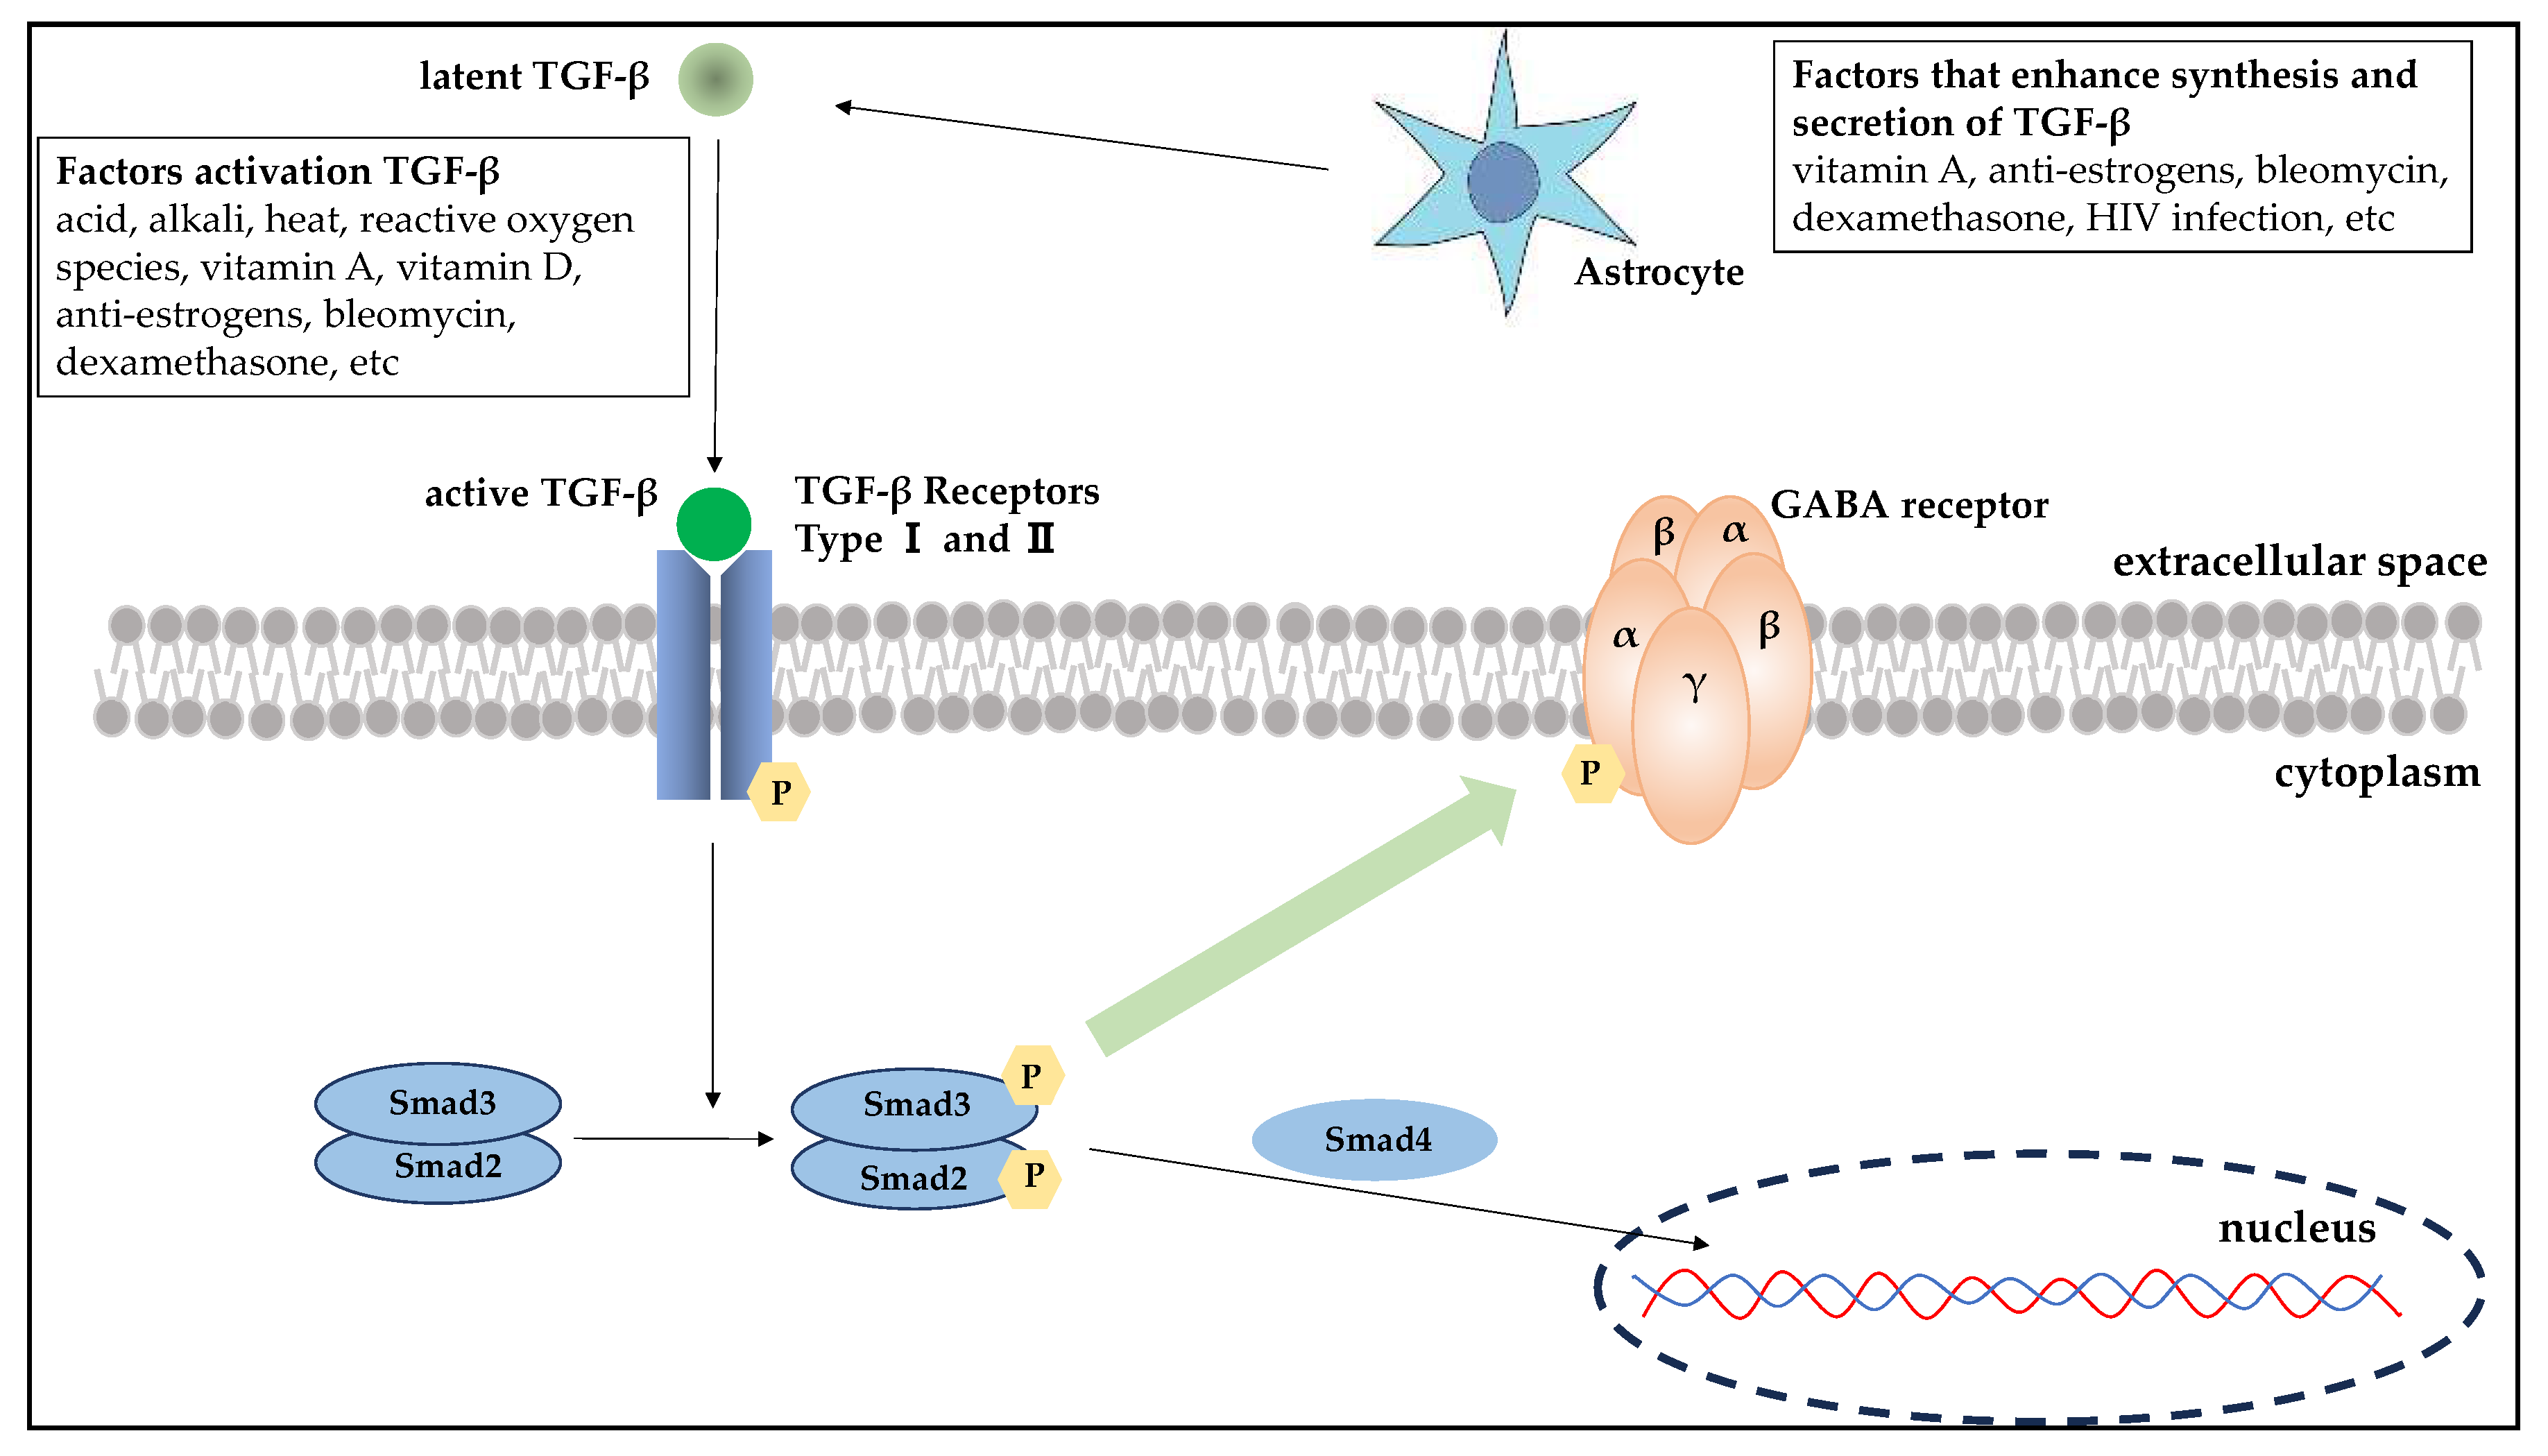
TGF-β, which is ubiquitous and produced in several tissues and cells, is released in an inactive, latent form (latent TGF-β) that cannot bind to receptors. It becomes activated when in the vicinity of target cells where it transforms into its active form (active TGF-β) that can bind to receptors and exert its effects. Astrocytes are known to be one of the major cells producing and releasing TGF-β in the brain where GABA receptors are located, with drug action and viral infection having been reported as facilitating factors [
21,
22]. Known external factors that activate TGF-β include acids, alkalis, heat, reactive oxygen species, vitamin A, vitamin D, anti-estrogens, bleomycin, and dexamethasone, among others [
23]. The TGF-β family receptors have been categorized into the following three types: type I, type II, and type III. Within the signaling pathway, ligand-bound type II receptors initiate the activation of type I receptors via phosphorylation, followed by autophosphorylation. This process activates and binds Smad2 and Smad3. After phosphorylation, Smad2/3 associates with Smad4, leading to the translocation of this complex into the nucleus where it functions as a transcription factor (
Figure 5). The TGF-β/Smad signaling pathway is important for regulating cell development and growth. Disruptions in this pathway have also been significantly associated with tumor development [
24].
In this study, TGF-β was identified as a novel factor implicated in the induction of hiccups. Previous research has shown that drug-induced hiccups are more prevalent in men and that there are sex differences in the drugs commonly implicated [
12]. Based on these findings, TGF-β was identified as an associated factor in both the overall dataset and specifically in the male subgroup. This discovery could significantly enhance our understanding of sex differences in hiccups. Moreover, hiccups are associated with GABA, an inhibitory system neuron, with the GABA derivative baclofen used for treating hiccups [
25]. TGF-β promotes the growth of dopamine nerves and regulates the GABAergic nervous system. Although the exact intracellular mechanism of TGF-β is not completely understood, some studies have revealed that Erk1/2 and GSK3β might increase GABAergic neurotransmission by inhibiting the phosphorylation of gephyrin, a scaffolding protein for the GABA receptor [
26]. Hence, TGF-β can be associated with the onset of hiccups via its influence on the GABAergic nervous system. Current evidence showing an association between TGF-β and drug-induced hiccups is limited. Hence, it is considered a possible MIE in the mechanistic understanding of hiccups. Ongoing research about the TGF-β signaling pathway can further clarify its role in neurotransmission.
The TGF-β superfamily interacts with receptors located on the plasma membrane. Upon binding with TGF-β, type 2 receptors undergo phosphorylation and subsequently form a complex with type 1 receptors. Activation of this receptor complex leads to the phosphorylation of Smad, an intracellular signaling molecule, which then forms a complex. It has been hypothesized that the interaction of TGF-β with GABA receptors may inhibit the phosphorylation of gephyrin, a scaffolding protein essential for GABA receptors, thereby enhancing GABAergic neurotransmission. However, the specific details of this interaction and its mechanisms remain significantly unexplored.
In the analysis of the female subgroup, ARE, one of the mechanisms associated with protection against oxidative stress, was found to be a factor associated with hiccups. The odds ratio [OR: 0.08 [0.01–0.70]) indicates a negative signal for drug-induced hiccups, which may be associated with hiccup inhibition. The Tox21 program monitors ARE activation via the Nrf2/antioxidant response signaling pathway to assess compound toxicity.
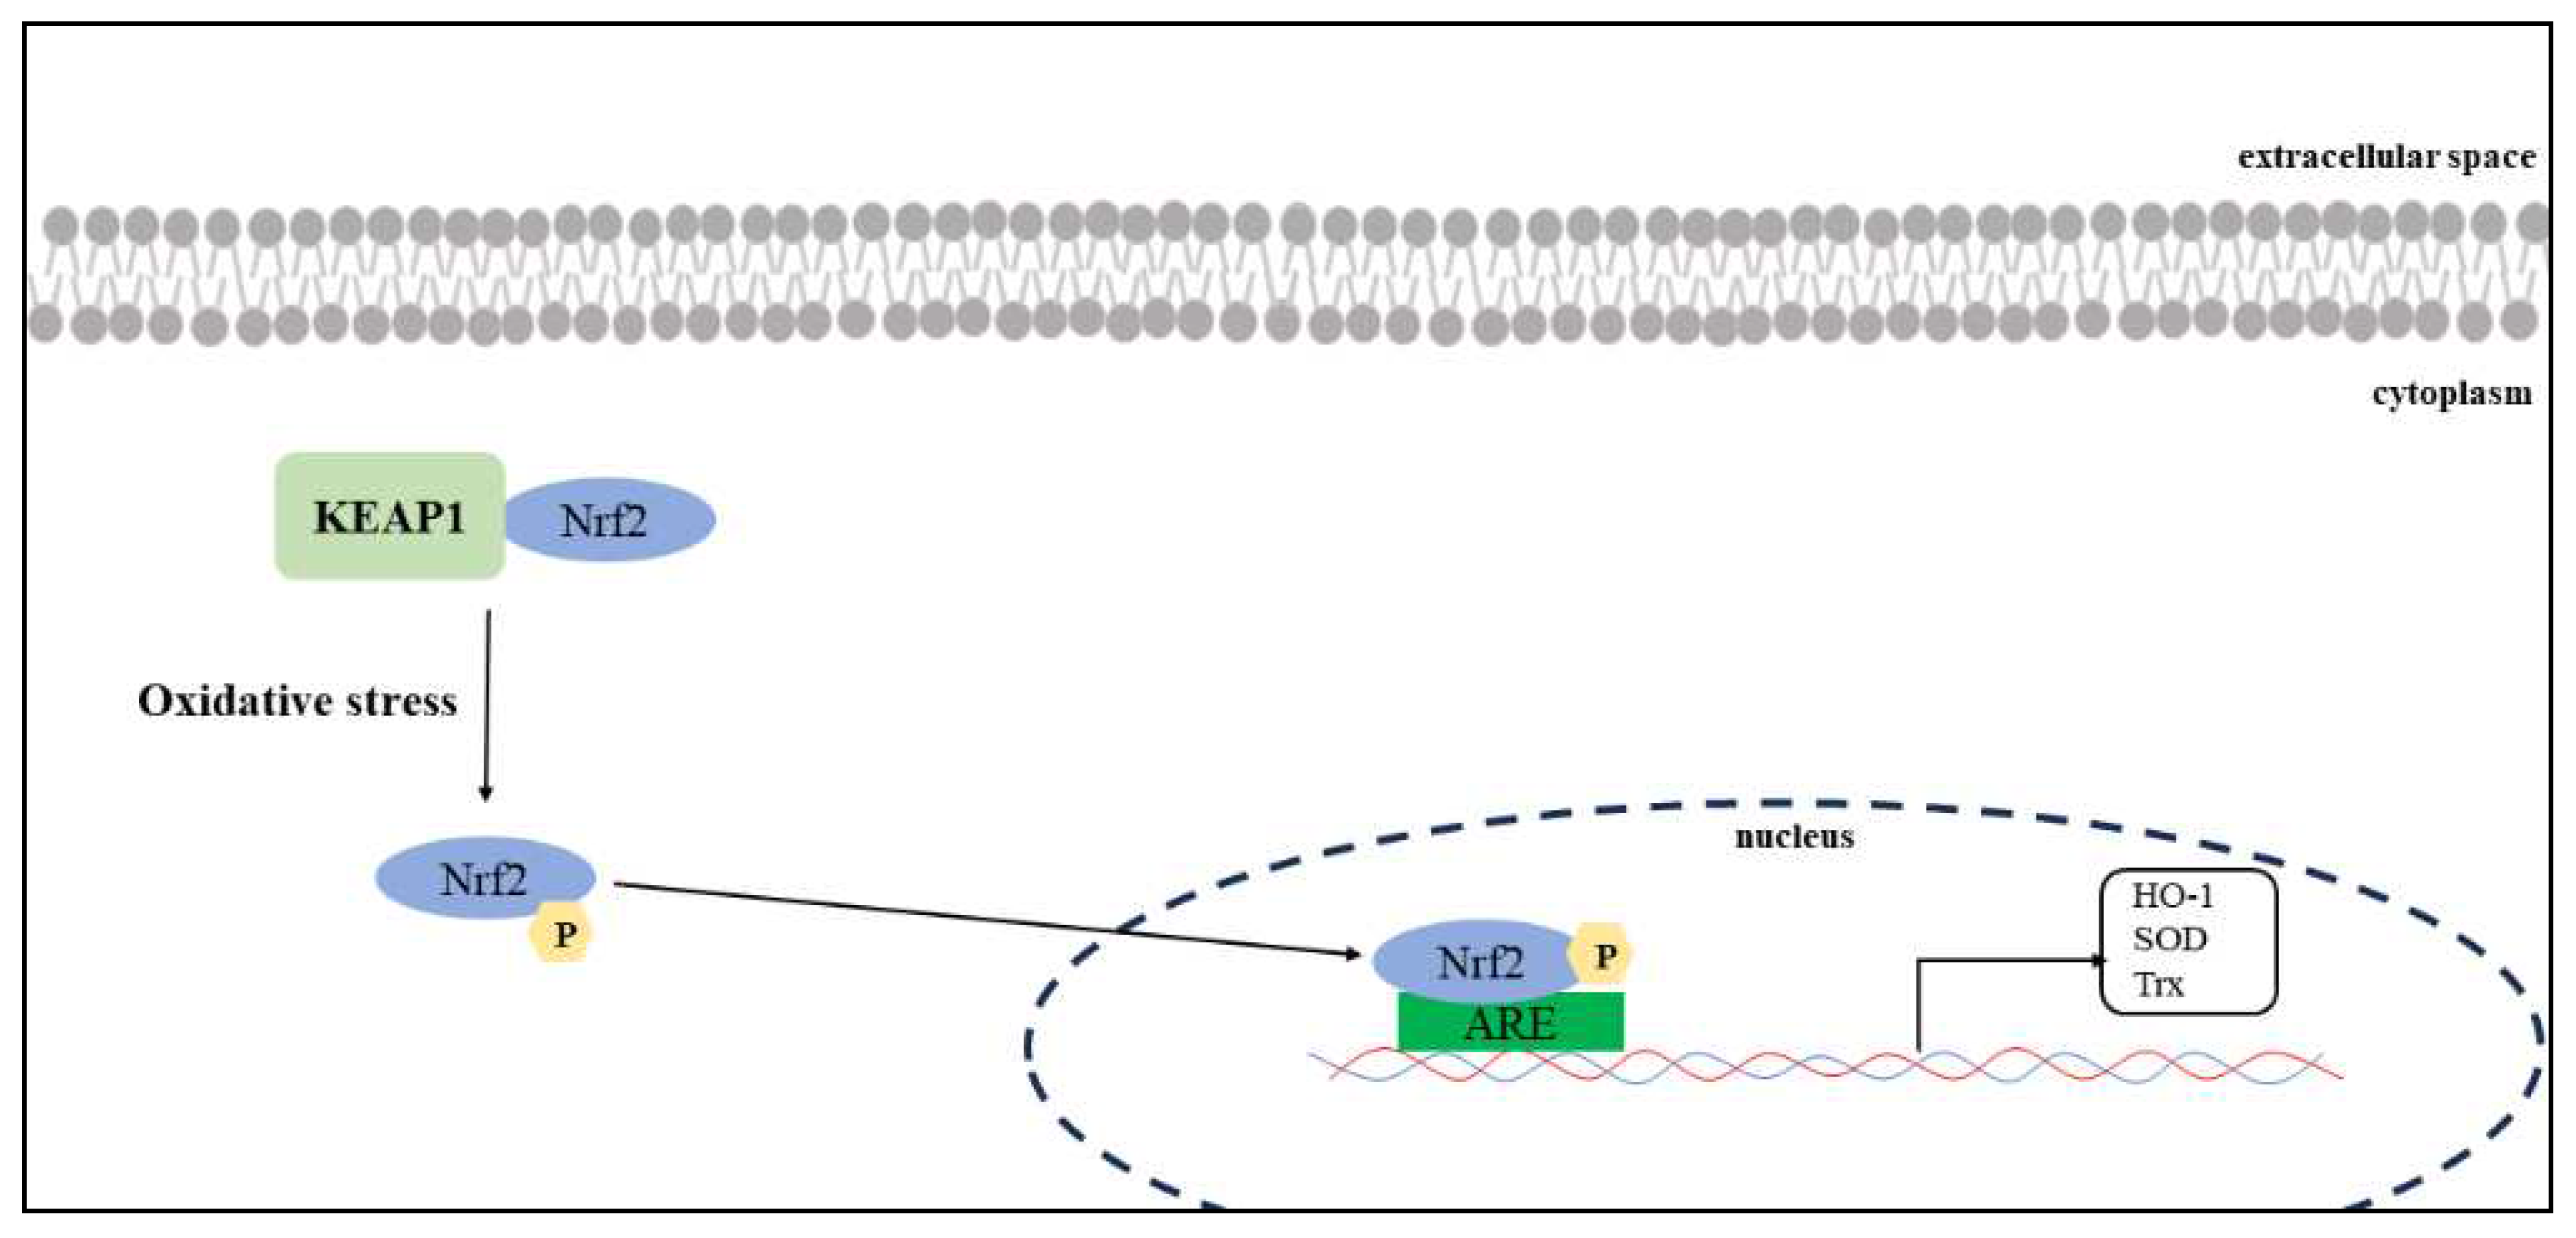
Nrf2-ARE is an important signaling pathway that regulates the expression of antioxidant enzymes. In the cytosol, Nrf2 binds to Kelch-like ECH-associated protein 1 (KEAP1) in the cytoplasm, and its activity remains low under normal physiological conditions [
27]. When cells are exposed to oxidative stress, Nrf2 unbinds KEAP1 and moves into the nucleus to bind with ARE (
Figure 6). This promotes the transcription and expression of a series of antioxidant enzymes, including heme oxygenase-1 (HO-1), superoxide dismutase (SOD), and thioredoxin (Trx) [
28].
Currently, there are no reports on hiccups and oxidative stress. However, drugs that have been reported as important suspect drugs for hiccups (e.g., nicotine, dexamethasone, and anticancer drugs) increase oxidative stress. Nicotine causes increased oxidative stress, leading to greater neuronal apoptosis, DNA damage, reactive oxygen species, and lipid peroxides. Nicotinic acetylcholine receptors (nAChRs) have been identified in the tissues other than those in the nervous system, and their effects on nicotinic receptors have been associated with acute and chronic effects [
29]. Glucocorticoid levels increase if the organism is stressed, which is accompanied by an increase in free radicals. Dexamethasone ingestion mimics the adverse effects of increased corticosterone in vivo [
30]. These findings may explain why hiccups are associated with oxidative stress. The fact that the current study showed the involvement of ARE in the inhibitory side of hiccups may also support an association between hiccups and oxidative stress. We believe that ARE was an independent factor only in the female subgroup because of sex differences regarding the suspected drug for hiccups. Hence, future studies on oxidative stress and sex differences in antioxidant mechanisms should be performed. Regarding the independence of factors in this subgroup analysis, the results of multiple logistic regression analysis showed that ARE had a
p value of <0.05 based on the likelihood ratio test, but not the Wald test (
Table 3). As a possible cause for the uncertainty of the results, the small number of female patients used in this analysis might have affected the test. It is necessary to wait for the accumulation cases involving female patients to corroborate the current results and ensure the validity of the discussion.
The results of the current study indicated that should pathways related to NRs and SPs be associated with the induction of hiccups, the mechanism of their development may differ between men and women (
Figure 4). However, given the clear sex differences in drug-induced hiccups, some sex hormone receptor involvement in the mechanism underlying the onset of drug-induced hiccups can be expected. The nuclear receptor activities we used to predict hiccups included agonist and antagonist activities of the androgen and estrogen receptors. However, no significant correlation had been observed between these activities and the induction of hiccups. The limited number of reports on hiccups compared with other side effects may explain why no relationship between sex hormone receptors and hiccups could be detected.
Another study on TGF-β and sex differences observed a difference in gene expression in the lens of male and female rats with cataract formations induced by TGF-β [
31]. The mentioned report suggests that sex differences may be associated with the expression and activation of TGF-β. Given that reports on sex differences in TGF-β in humans are limited, future studies need to examine these sex differences in more detail.
Nuclear factor erythroid 2-related factor 2 (Nrf2)–ARE is an important signaling pathway that regulates the expression of antioxidant enzymes. Nrf2 binds to KEAP1 in the cytoplasm and maintains a low activity under normal physiological conditions. If cells are exposed to oxidative stress, Nrf2 unbinds KEAP1 and translocate into the nucleus to bind with ARE. This promotes the transcription and expression of a series of antioxidant enzymes, including heme oxygenase-1 (HO-1), superoxide dismutase (SOD), and thioredoxin (Trx).
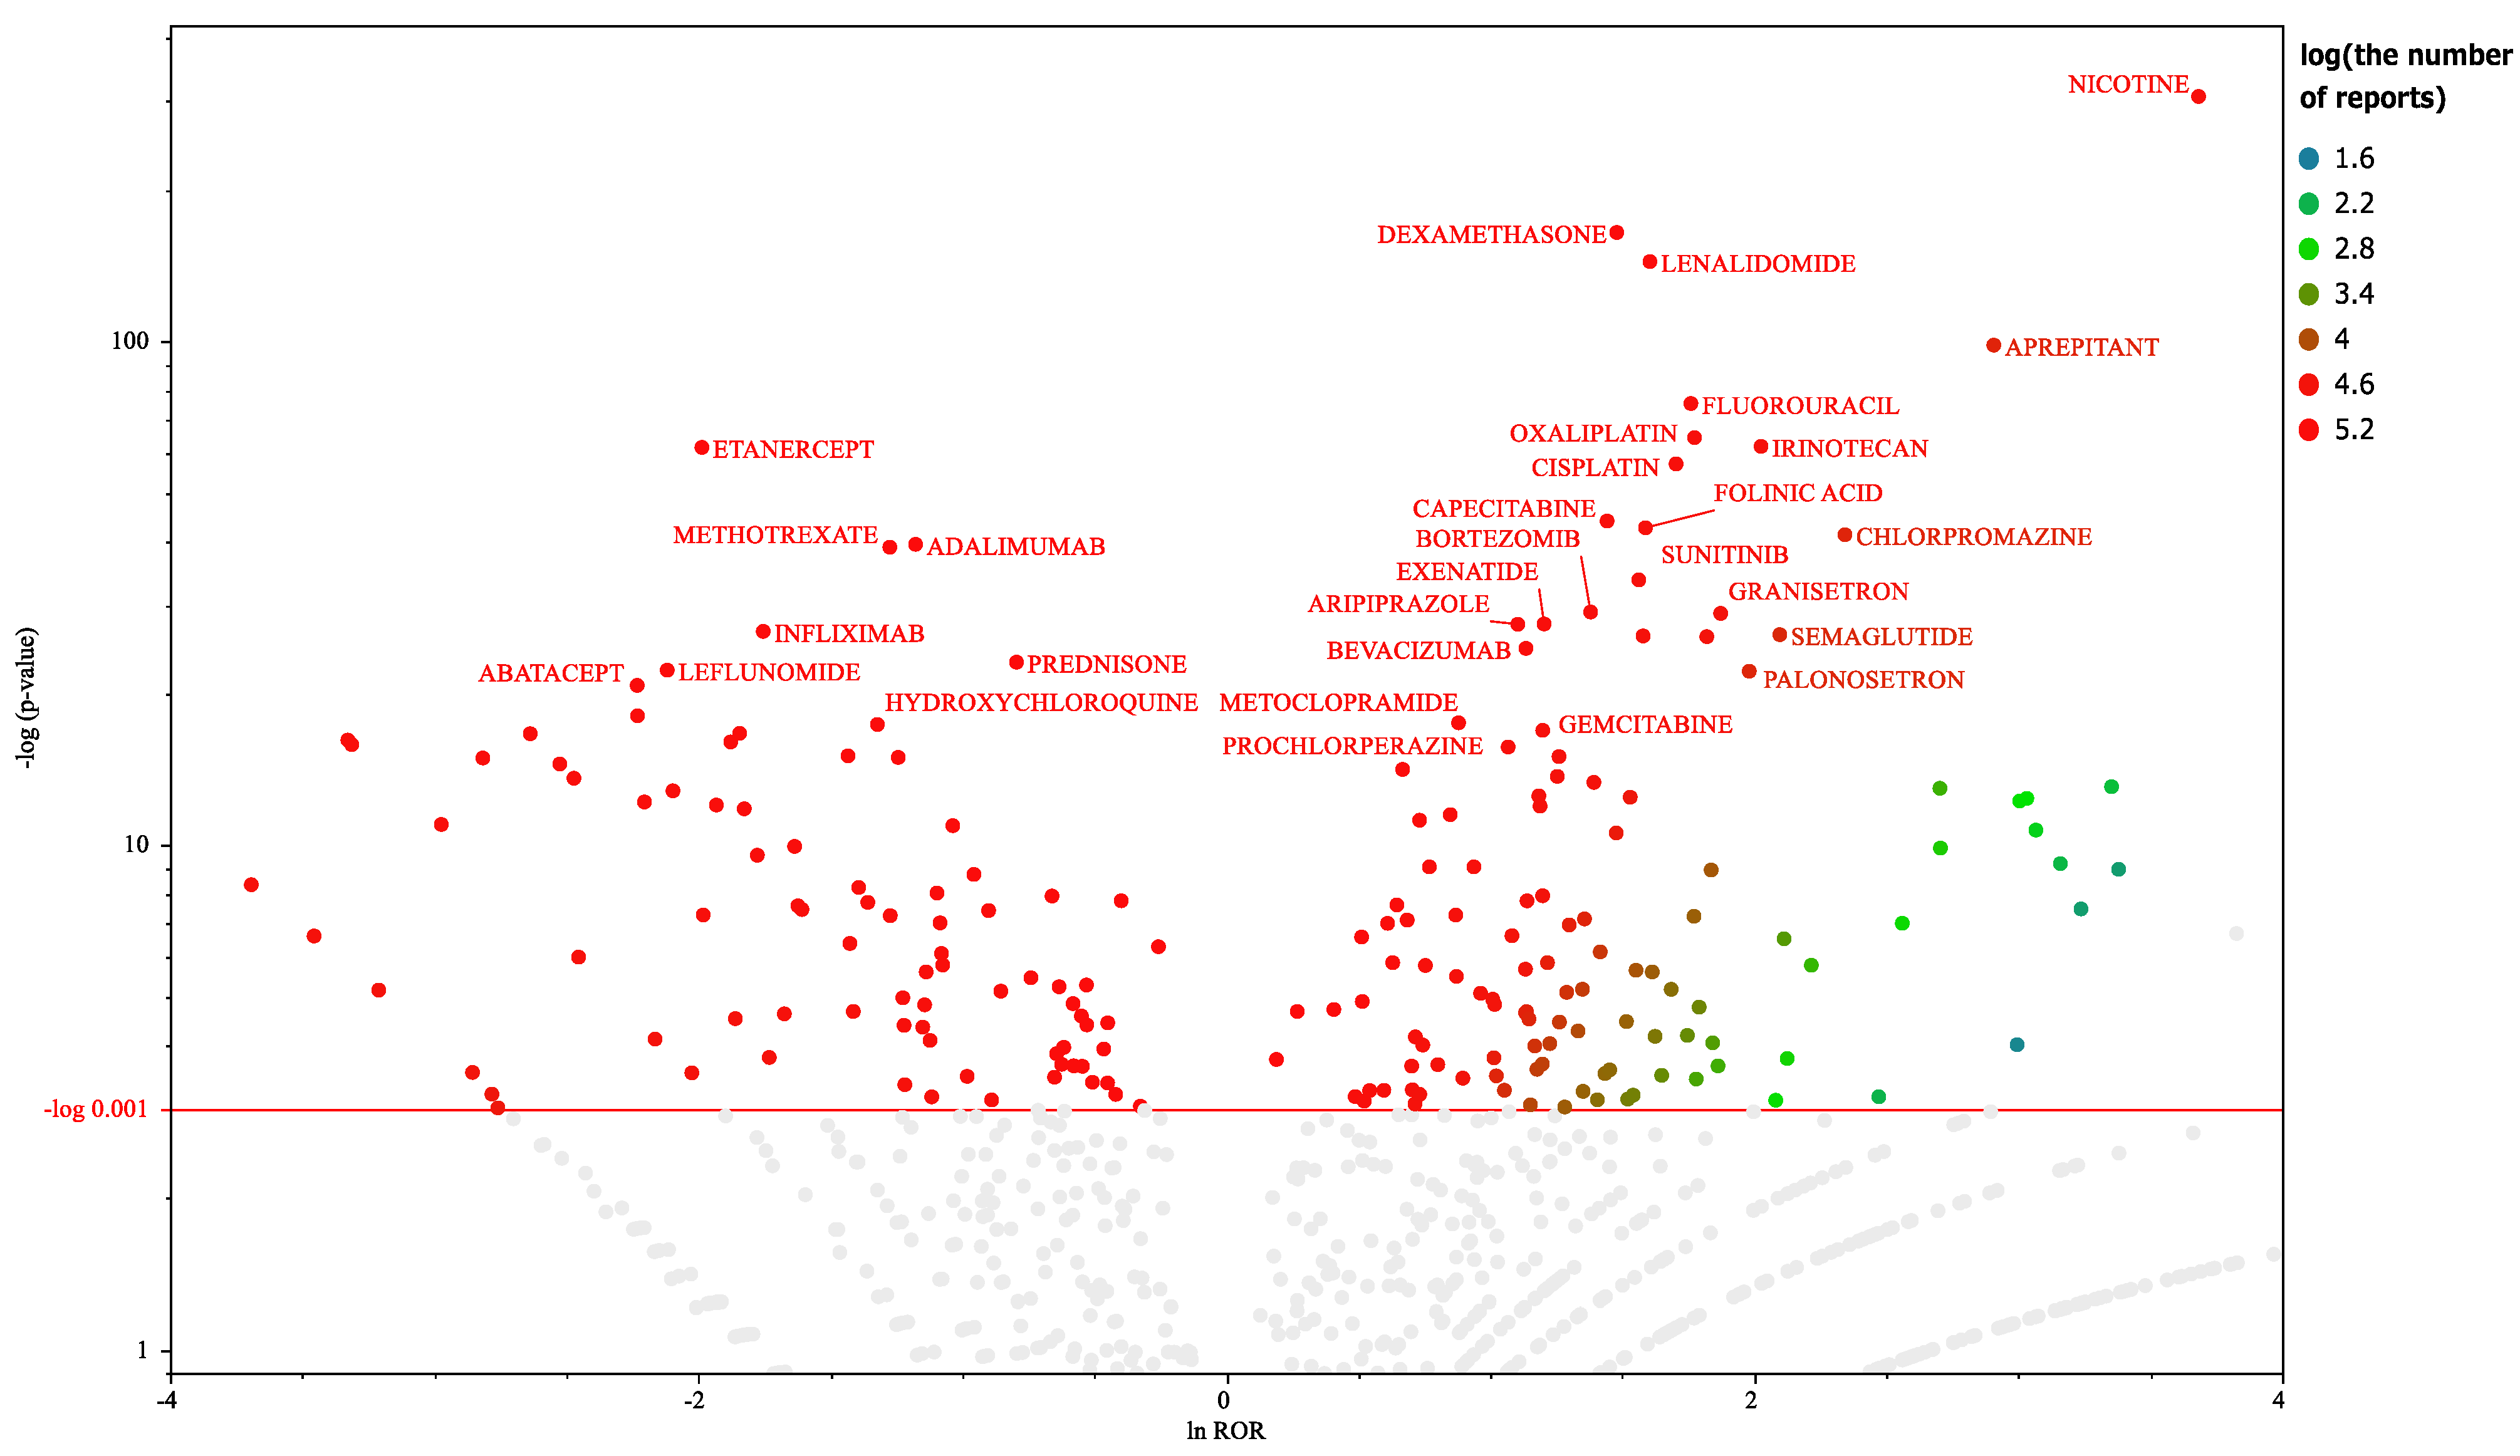
Figure 1.
Drugs associated with hiccups. This volcano plot was created by plotting the negative logarithm of the p value (−log10p) based on the Fisher’s exact test on the y-axis and the natural logarithm of the ROR (lnROR) on the x-axis. In all patients, drugs with > 1,000 reports and those considered as significant (p ≤ 0.001 based on the Fisher’s exact test) were included in the volcano plot. The color of the individual points represents differences in the log of the number of reports for each drug. The gray plots indicate drugs with a p value of > 0.001 or < 1,000 reported cases. The red line on the y-axis represents a p = 0.001. In this scatter plot, the signal is larger for the points (drugs) plotted in the upper right corner. The blue-to-red colors represent the number of times an adverse drug reaction was reported.
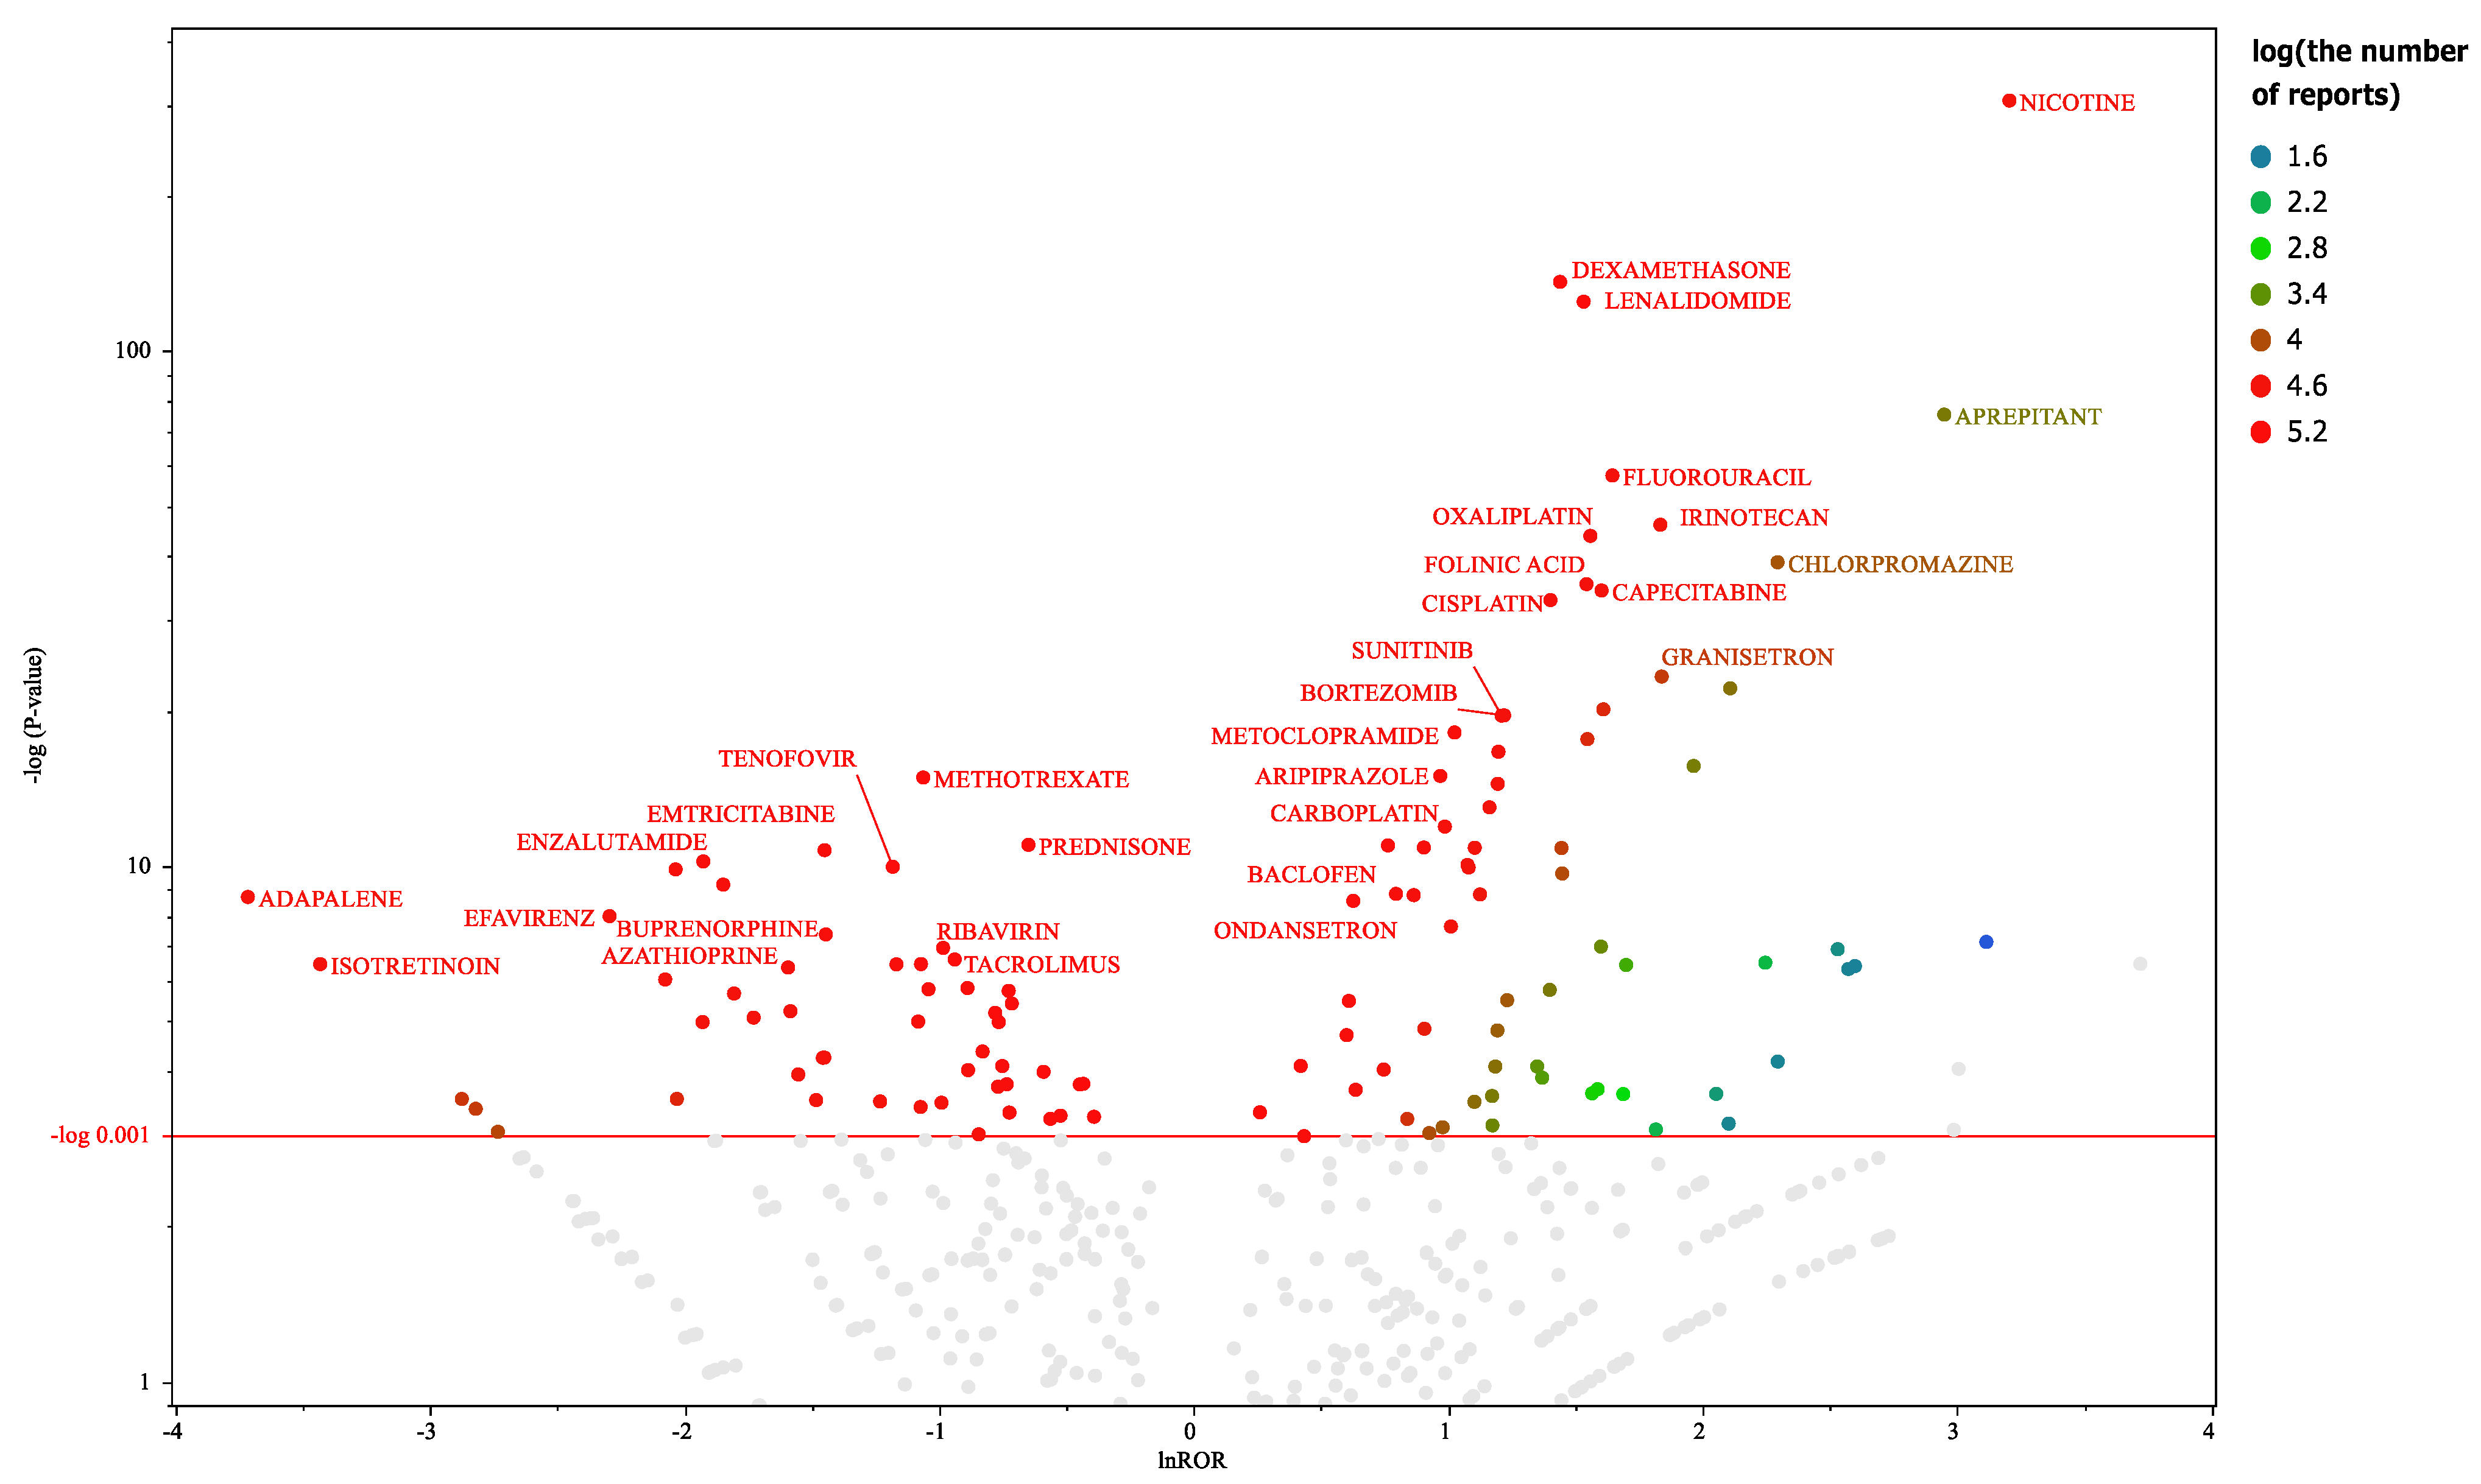
Figure 2.
Drugs associated with hiccups in male participants This volcano plot was created by plotting the negative logarithm of the p value (−log10p) based on the Fisher’s exact test on the y-axis and the natural logarithm of the ROR (lnROR) on the x-axis. The red line on the y-axis represents p = 0.001. In male patients, drugs with > 1,000 reports and those that are significant (p ≤ 0.001 based on the Fisher’s exact test) are included in the volcano plot. The color of the individual points represents differences in the log of the number of reports for each drug. The gray plots indicate drugs with p > 0.001 or <1,000 reported cases. In this scatter plot, the signal is larger for the points (drugs) plotted in the upper right corner. The line on the y-axis represents the total average. The blue-to-red colors represent the number of times an adverse drug reaction was reported.
Figure 3.
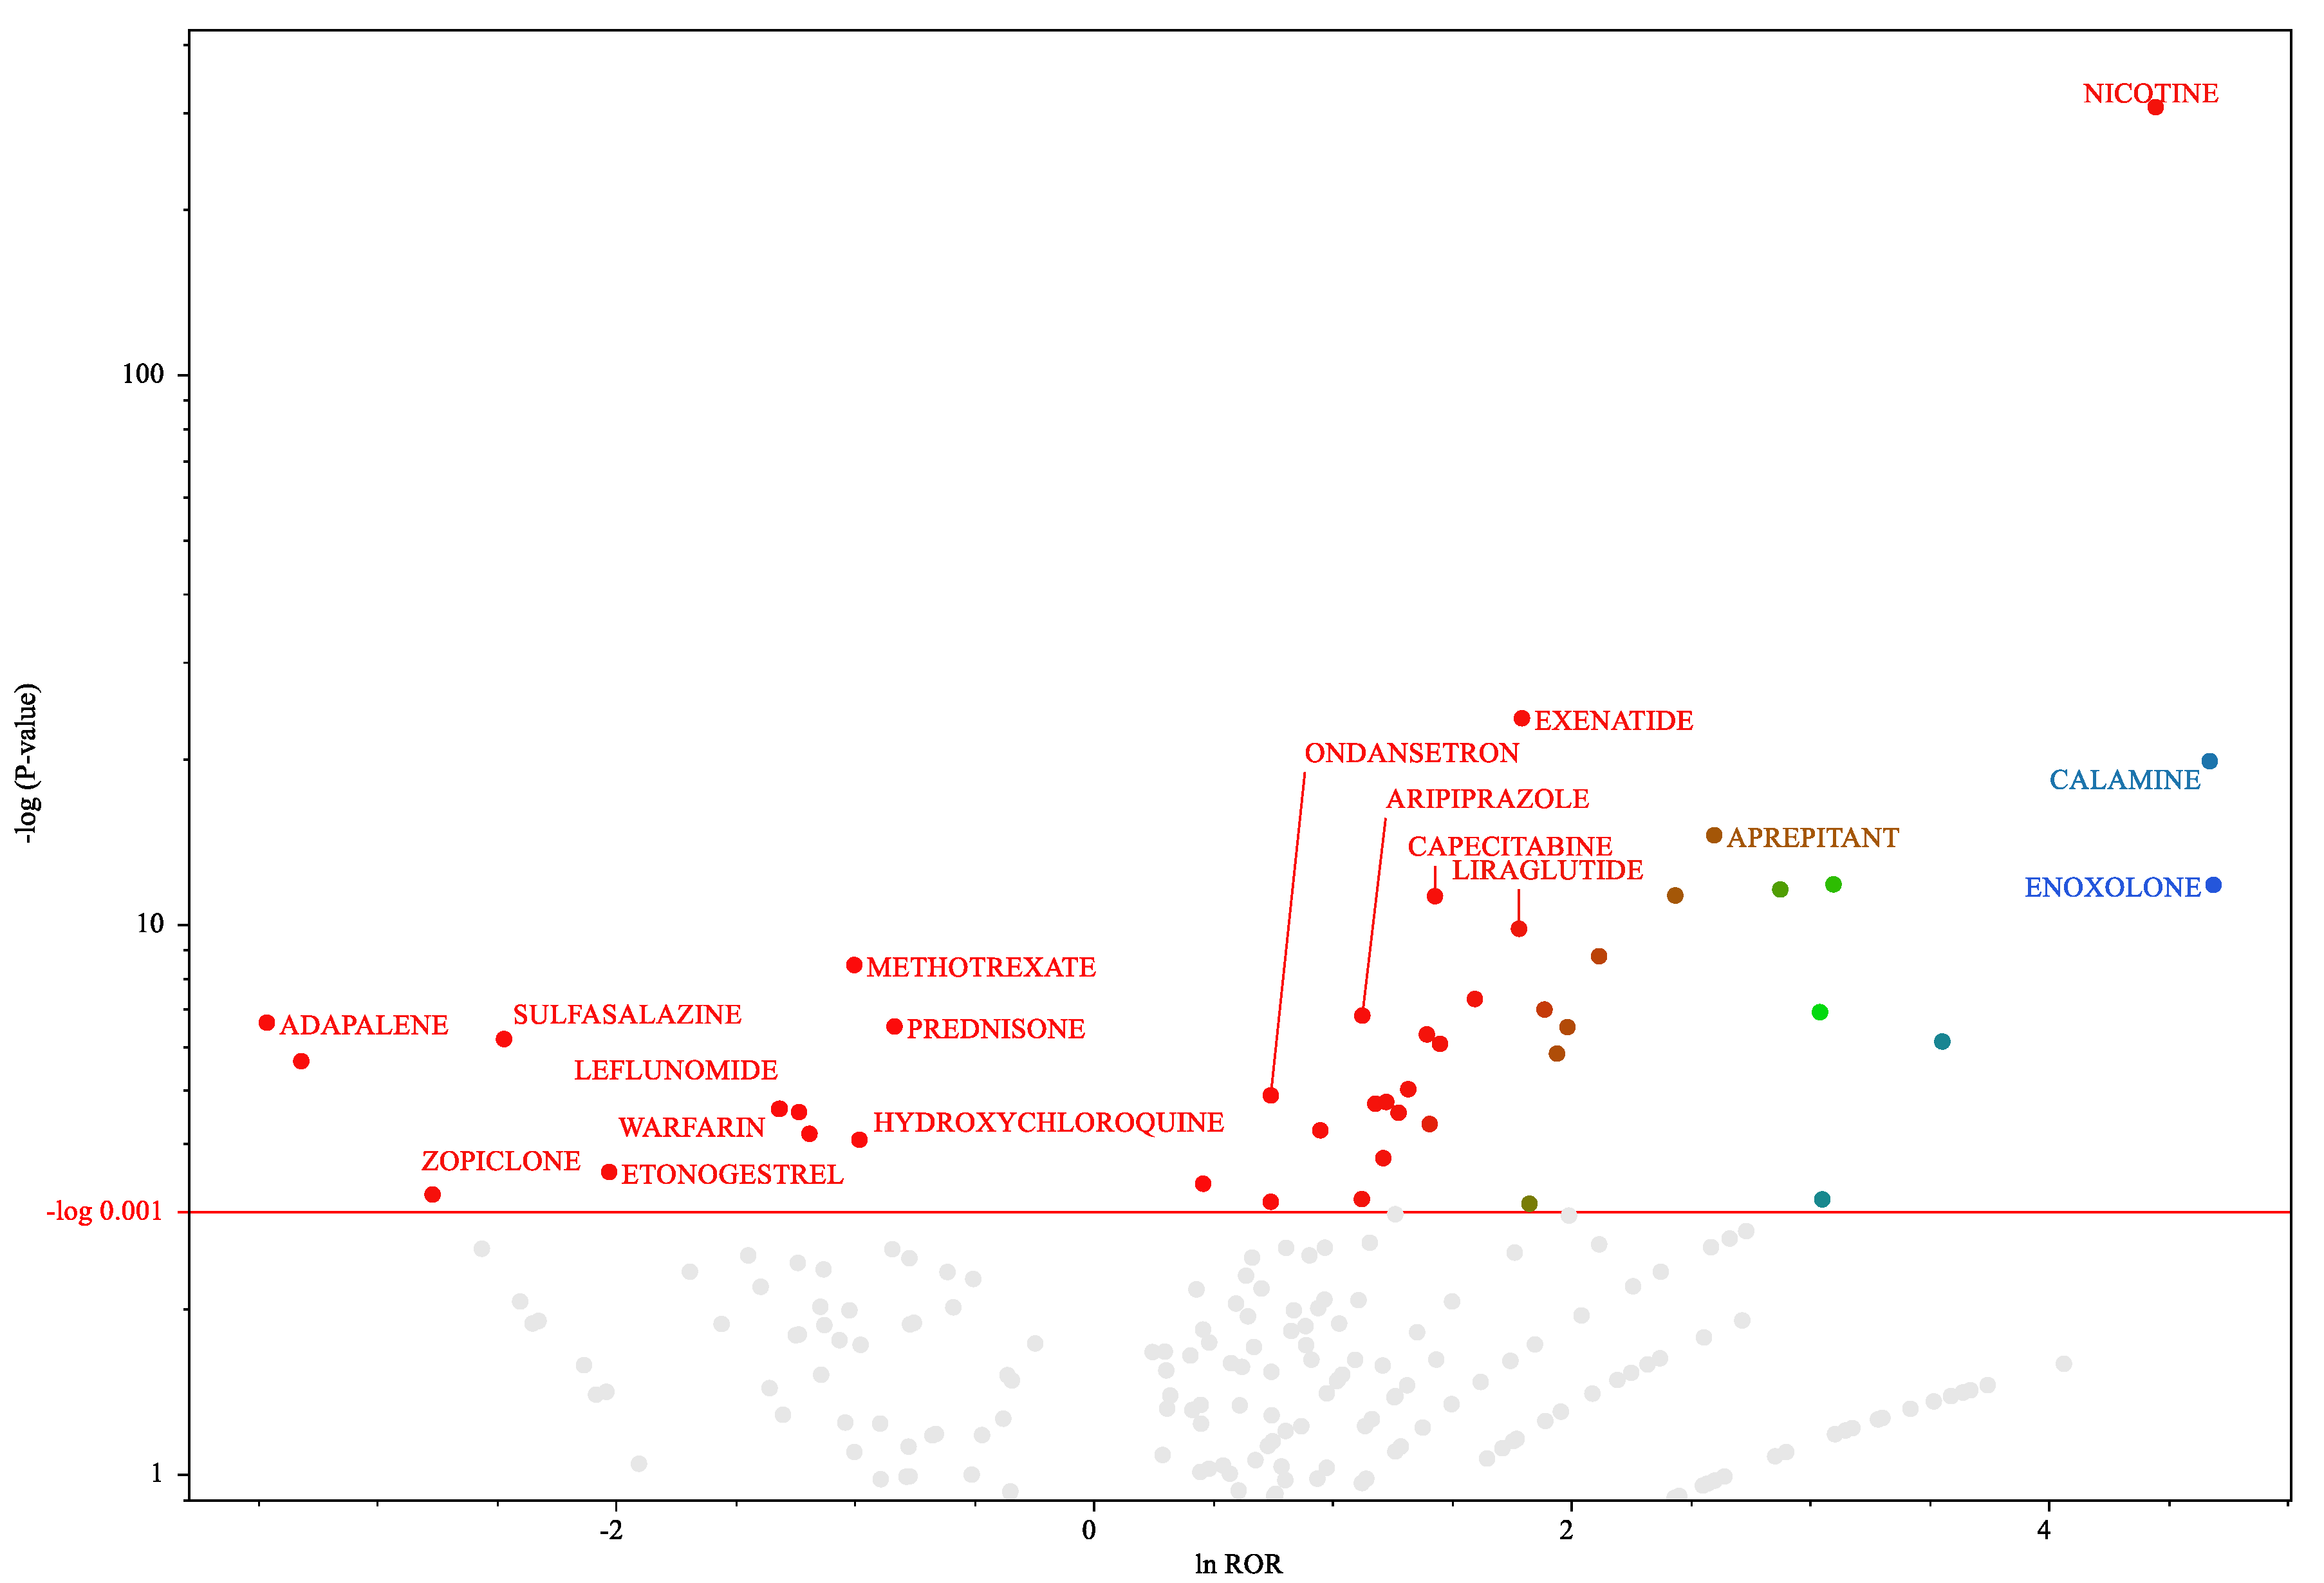
Medicines associated with hiccups in female patients.
Figure 3.
Medicines associated with hiccups in female patients.
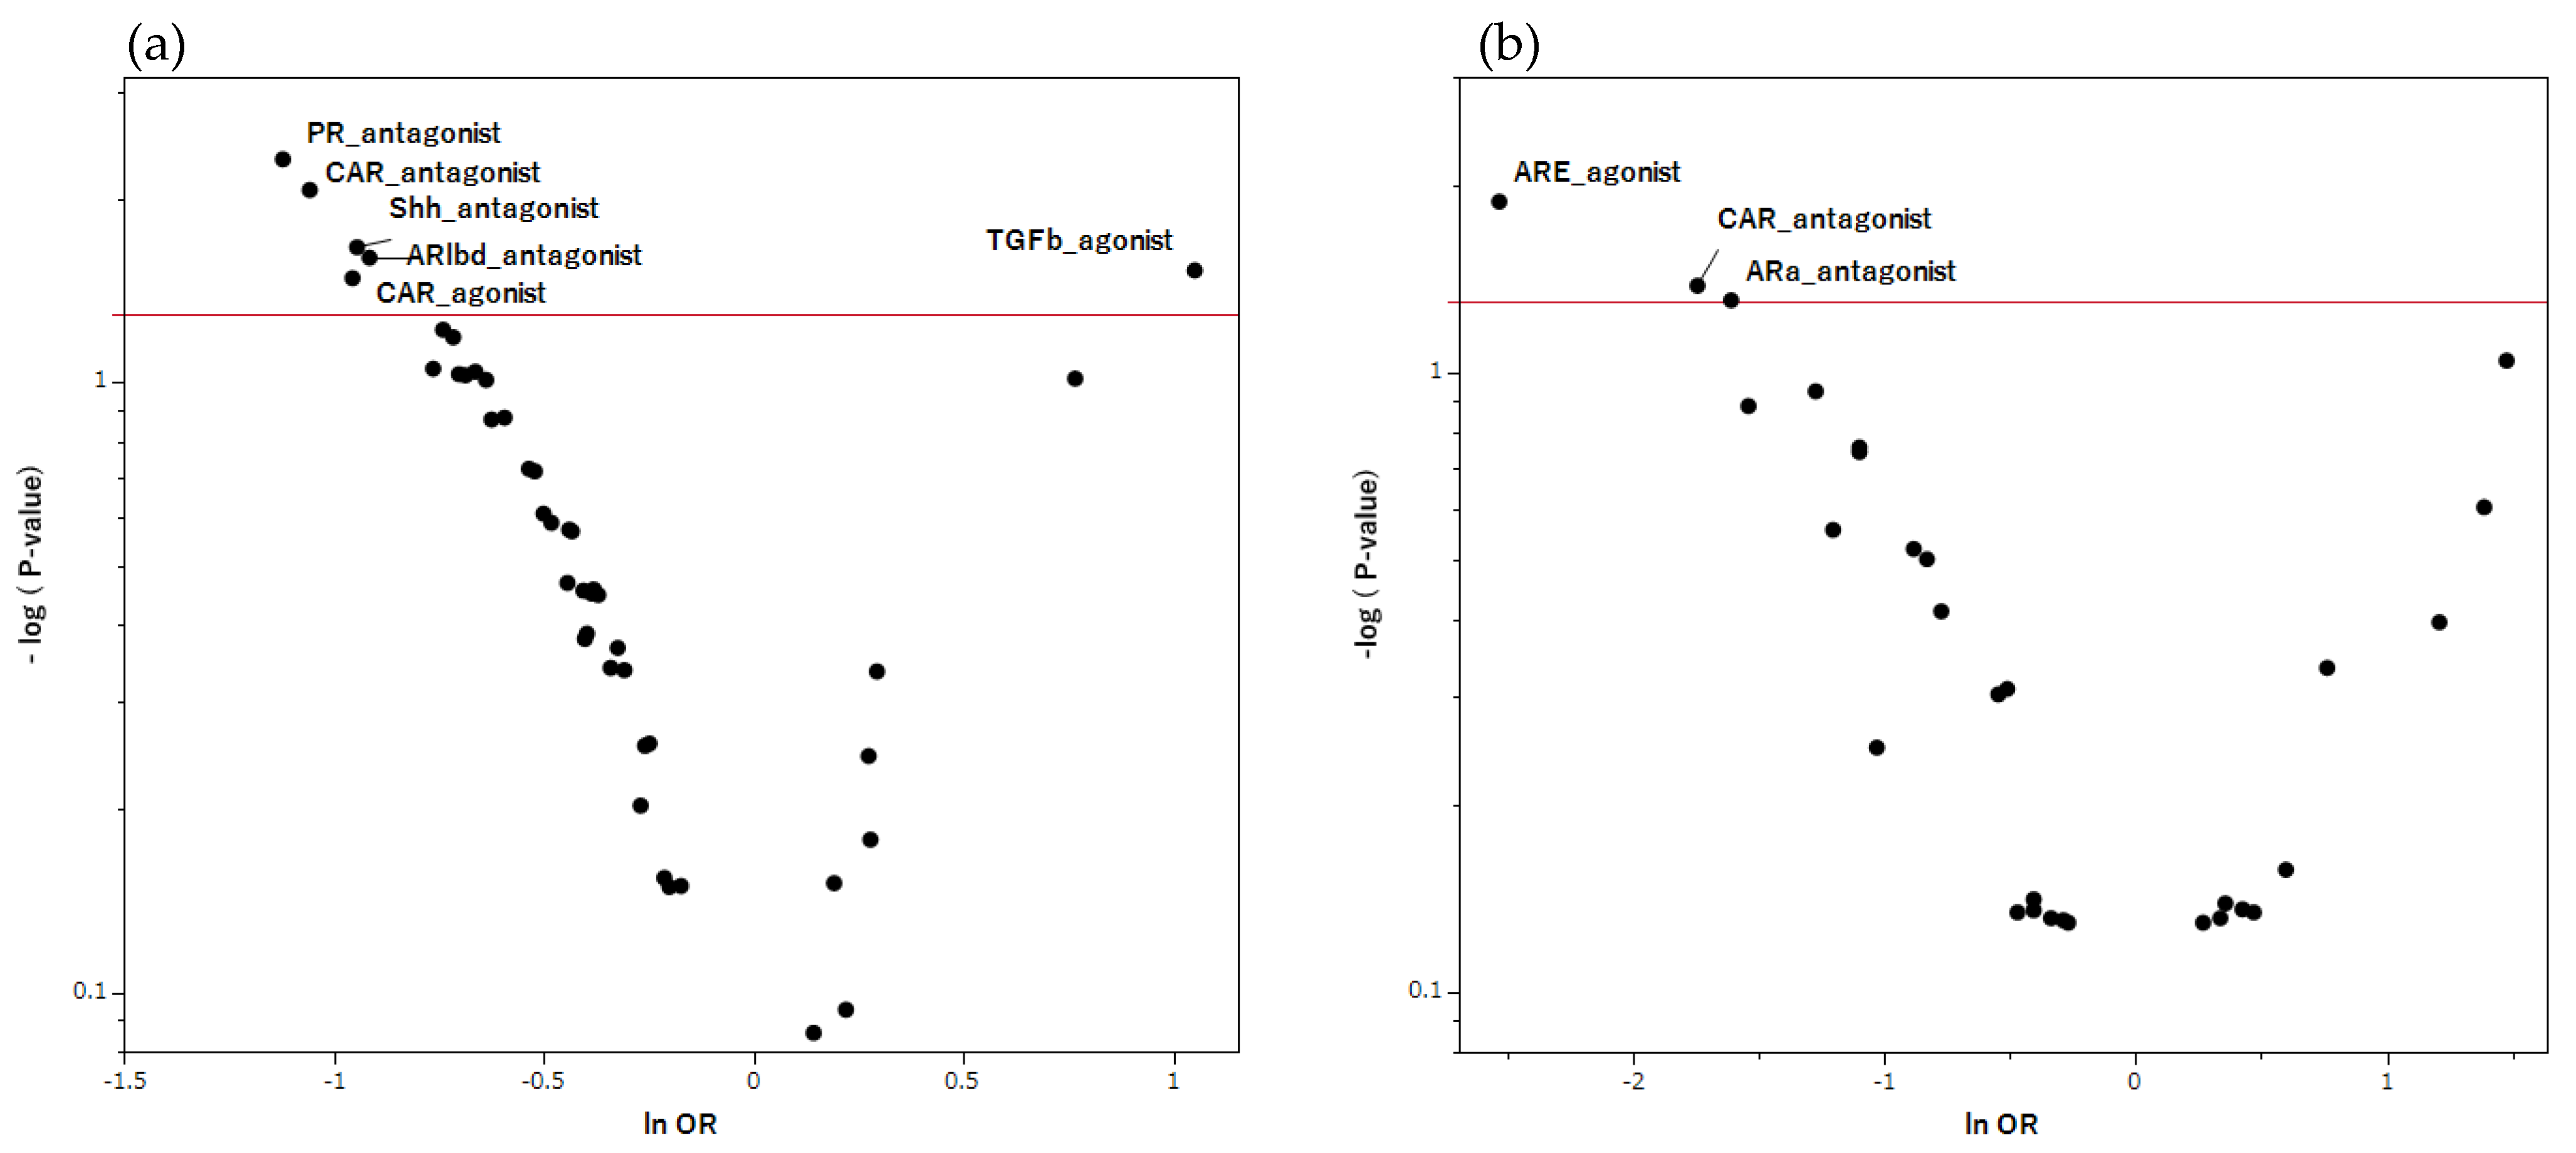
Figure 4.
MIEs associated with hiccup induction in pharmacotherapy. This volcano plot was created by plotting the negative logarithm of the p value (−log10 p) using the Fisher’s exact test on the y-axis and the natural logarithm of the OR (ln OR) on the x-axis. The red line on the y-axis represents p = 0.05. In this scatter plot, signals associated with hiccup induction (positive signals) are plotted in the upper right, whereas those associated with inhibition (negative signals) are plotted in the upper left. (a) is the volcano plot for the male table, whereas (b) is the volcano plot for the female group. PR, progesterone receptor; TGFb, transforming growth factor-beta; Shh, sonic hedgehog signaling; ARlbd, androgen receptor lbd; ARE, antioxidant response element; CAR, constitutive androstane receptor; ARa, androgen receptor with antagonist.
Figure 5.
TGF-β signaling and the GABA neurotransmission interaction.
Figure 5.
TGF-β signaling and the GABA neurotransmission interaction.
Figure 6.
Oxidative stress and Nrf2–ARE signaling.
Figure 6.
Oxidative stress and Nrf2–ARE signaling.
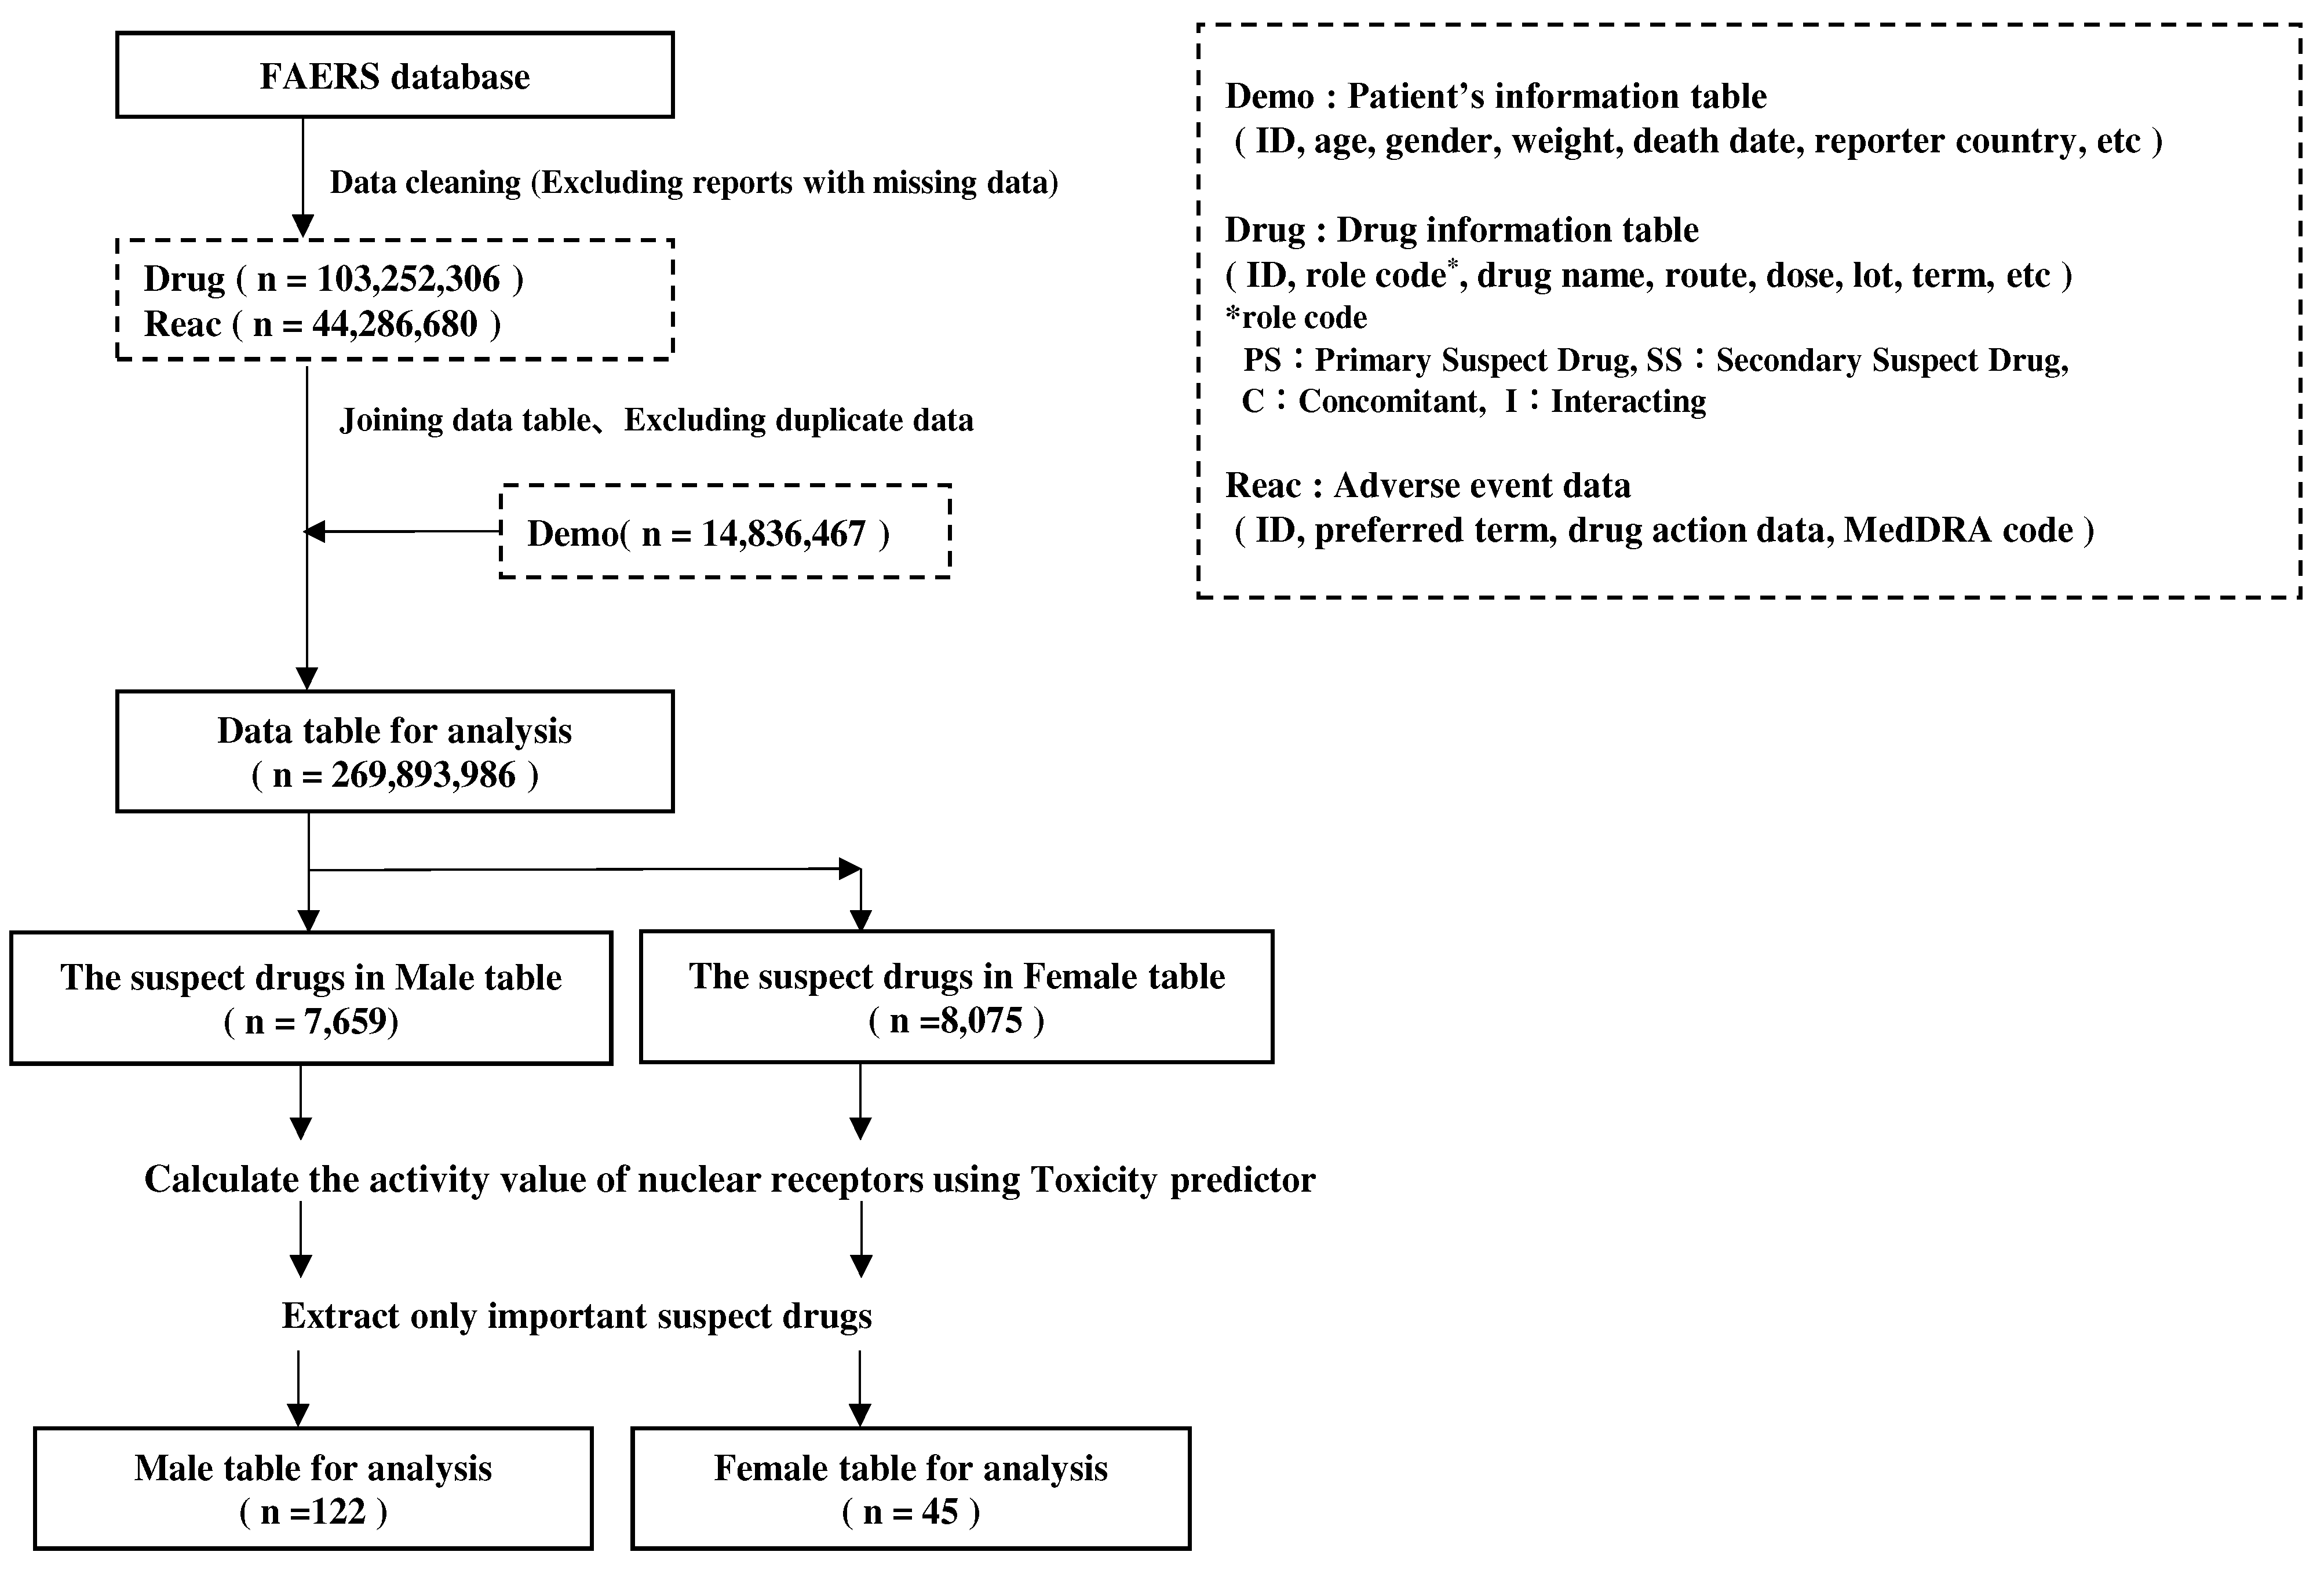
Figure 7.
Data analysis table.
Figure 7.
Data analysis table.
Table 1.
Univariate and multivariate analyses of MIEs associated with drug-induced hiccups.
Table 1.
Univariate and multivariate analyses of MIEs associated with drug-induced hiccups.
| MIEs |
Activity type |
Univariate analysis |
Multivariate analysis |
| |
|
95% CI |
|
95% CI |
|
|
|
p value |
Odds ratio |
Lower |
Upper |
Odds ratio |
Lower |
Upper |
p value
(Likelihood ratio test) |
p value
(Wald test) |
| ERaant |
agonist |
0.010 |
0.21 |
0.06 |
0.69 |
0.28 |
0.06 |
1.26 |
0.088 |
0.097 |
| PR |
antagonist |
0.011 |
0.43 |
0.23 |
0.82 |
0.61 |
0.30 |
1.26 |
0.181 |
0.181 |
| ARaant |
agonist |
0.011 |
0.33 |
0.14 |
0.76 |
0.65 |
0.21 |
1.97 |
0.445 |
0.443 |
| TGFb |
agonist |
0.014 |
3.37 |
1.30 |
8.75 |
4.59* |
1.54 |
13.67 |
0.002 |
0.006 |
| PR |
agonist |
0.014 |
0.20 |
0.05 |
0.76 |
0.66 |
0.12 |
3.55 |
0.625 |
0.628 |
| Shh |
agonist |
0.026 |
0.40 |
0.18 |
0.89 |
0.63 |
0.25 |
1.60 |
0.330 |
0.329 |
Table 2.
Univariate and multivariate analyses of MIEs associated with drug-induced hiccups in the male group.
Table 2.
Univariate and multivariate analyses of MIEs associated with drug-induced hiccups in the male group.
| MIEs |
Activity type |
Univariate analysis |
Multivariate analysis |
| |
|
95% CI |
|
95% CI |
|
|
|
p value |
Odds ratio |
Lower |
Upper |
Odds ratio |
Lower |
Upper |
p value
(Likelihood ratio test) |
p value
(Wald test) |
| PR |
agonist |
0.005 |
0.326 |
0.152 |
0.698 |
0.60 |
0.22 |
1.62 |
0.318 |
0.318 |
| CAR |
antagonist |
0.009 |
0.347 |
0.160 |
0.753 |
0.56 |
0.23 |
1.41 |
0.222 |
0.220 |
| Sonic hedgehog |
agonist |
0.021 |
0.389 |
0.176 |
0.861 |
0.70 |
0.25 |
1.97 |
0.504 |
0.502 |
| ARlbd |
antagonist |
0.025 |
0.401 |
0.189 |
0.851 |
0.62 |
0.22 |
1.70 |
0.351 |
0.348 |
| TGFb |
agonist |
0.030 |
2.857 |
1.100 |
7.423 |
3.67* |
1.29 |
10.45 |
0.011 |
0.015 |
Table 3.
The activity type and result of univariate and multivariate of MIE.
Table 3.
The activity type and result of univariate and multivariate of MIE.
| MIEs |
Activity type |
Univariate analysis |
Multivariate analysis |
|
| |
|
95% CI |
95% CI |
|
|
|
|
|
p value |
Odds ratio |
Lower |
Upper |
Odds ratio |
Lower |
Upper |
p value
(Likelihood ratio test) |
p value
(Wald test) |
| ARE |
Agonist |
0.01 |
0.08 |
0.01 |
0.70 |
0.12* |
0.01 |
1.32 |
0.048 |
0.083 |
| CAR |
Antagonist |
0.04 |
0.18 |
0.03 |
0.94 |
0.50 |
0.07 |
3.62 |
0.483 |
0.489 |
| ARant |
Agonist |
0.05 |
0.20 |
0.05 |
0.88 |
0.24 |
0.04 |
1.20 |
0.073 |
0.080 |
Table 4.
Cross-tabulation and formula for reportedodds ratios (RORs) of hiccups.
Table 4.
Cross-tabulation and formula for reportedodds ratios (RORs) of hiccups.
| |
Hiccups |
Other adverse events |
| Suspected drugs |
n11
|
n12
|
| Other drugs |
n21
|
n22
|
