Preprint
Article

Species Composition and Distribution of Hull-Fouling Macroinvertebrates Differ according to the Areas of Research Vessel Operation

Altmetrics

Downloads

129

Views

32

Comments

0

A peer-reviewed article of this preprint also exists.

Submitted:

15 February 2024

Posted:

16 February 2024

You are already at the latest version

Alerts
Abstract
Abstract: Global ecological concern regarding the transfer of fouling organisms to ship hulls is increasing. This study investigated the species composition, dominant species, distribution patterns, community structure, and life-cycle differences of hull-fouling macroinvertebrates on five research vessels (R/Vs: Isabu, Onnuri, Eardo, Jangmok 1, and Jangmok 2) operated by the Korea Institute of Ocean Science and Technology (KIOST). Hull-fouling macroinvertebrates were collected three to five times on quadrats from the upper and middle sectors of the hull sides, bottom, and niche areas (the propellers and shafts and the thrusters). A total of 47 macroinvertebrate species were identified, represented by 8,519 individuals(ind.)/m2 and a biomass of 1,967 gWWt/m2 on the five vessels. The number of species, density, and biomass were greater on the coastal vessels the Eardo, Jangmok 1, and Jangmok 2 than on the ocean-going vessels the Isabu and Onnuri. Among the coastal vessels, barnacles were the most abundant and had the greatest density, while mollusks had the highest biomass. Differences between hull sectors showed that the highest species abundance and density appeared on all hulls in ports and bays where the Jangmok 1 operated, while the highest species abundance, density, and biomass were identified in the niche areas of the Eardo, which operated farther from the coast. The hull-fouling macroinvertebrates that exceeded 1% of all organisms were the barnacles Amphibalanus amphitrite, Balanus trigonus, and Amphibalanus improvisus; the polychaete Hydroides ezoensis; the bivalves Magallana gigas and Mytilus galloprovincialis; and the amphipod Jassa slatteryi. The dominant species were cosmopolitan and globally distributed, and many of them were cryptogenic. Six native species were identified: M. gigas, H. ezoensis, the amphipod Melita koreana, the isopod Cirolana ko-reana, and the barnacle B. trigonus and F. kondakovi. Eight non-indigenous species (NIS) were de-tected: barnacles A. amphitrite and A. improvisus, the bivalve M. galloprovincialis, the polychaete Perinereis nuntia, amphipods J. slatteryi and Caprella californica, and bryozoans Bugulina californica and Bugula neritina. Of the fouling macroinvertebrates found on the vessel hulls, 13% were native and 17% were NIS. The nMDS ordination analysis of the five vessels showed four clusters of fouling macroinvertebrate communities: two ocean clusters (the Isabu and Onnuri), one coastal cluster (the Eardo and Jangmok 2), and one local cluster (the Jangmok 1). More diverse communities developed on the hulls of vessels that operated locally rather than globally or in deep oceans. Spearman rank correlation showed that biological indices such as number of species, density, and biomass correlated highly and positively with the numbers of days on coastal operations and negatively with the number days on ocean operations. The species diversity index correlated positively with the total number of anchoring days and coastal operation days and negatively with the total number of operation days and ocean operation days. The macroinvertebrates differed by the area of operation, the port of anchorage, the number of days in operation and at anchor, and the hull sectors. There is no previous research data on hull-fouling macroinvertebrates in the Republic of Korea, and this study provides a basis for future studies to identify introduced species and their differences based on operation area.
Keywords: 
Subject: Biology and Life Sciences  -   Ecology, Evolution, Behavior and Systematics

1. Introduction

As human activities and international trade expand [1], biodiversity and economic losses caused by introduced marine species are increasing, with NIS being one of the major components of polluting communities [2]. NIS can cause biodiversity loss and change community structure through the local elimination of native species [2,3,4]. NIS can be introduced by ships and negatively impact marine ecosystems by destroying the habitats of native species, changing the species compositions, and reducing marine resources [5,6]. Ports are the main focus of NIS, and artificial structures are becoming spots of introduction [2,7]. Marine biofouling of ships docked in port not only directly damages hulls via corrosion and deformation; it also greatly compromises sailing power, increasing fuel consumption, reducing speed, and lowering propeller efficiency by 15–20% [5,8].
Ship ballast water and hull-fouling organisms may be invasive and harmful, and hull-fouling is of particular concern as ships are primary vectors for introducing NIS into new localities [9,10]. It has also been argued that floating structures such as hulls serve as major introduction and dispersion vectors with specific niches, anchors, propellers, and sea chests [11,12,13,14]. Colonization success of non-indigenous species was seen to be driven primarily by habitat and local propagules rather than international traffic effects [11]. Quantitative techniques to assess the transport of species through hull-fouling are not very widespread, although some data have been used to predict the abundance and diversity of organisms transported by ocean-going yachts in New Zealand and Scotland [15,16]. The expiration date of paint efficiency and long periods of inactivity/reduced sailing increase the risk of hull macrofouling development [15,16,17,18].
Several risk assessment studies have been carried out abroad based on predictive tools for the prevention of the accidental introduction of marine NIS [15,16] and hull-fouling organisms as introduction vectors [10]. In Germany, species introductions by international ships were assessed from 1992 to 1996. NIS were found in 38% of all ballast water samples, 57% of all sediment samples, and 96% of all hull samples, indicating that hull-fouling is an important source of introduction; 57% of the species were not native to the North Sea [6]. Of percentages all species found in New Zealand, 69% of NIS were found on hulls compared with 3% in ballast water [19]. In Japan, 26 species have been unintentionally introduced and 42.3% of these are presumed to have been introduced by hull-fouling [20]. In Vladivostok, Russia, it was reported that spatially disconnected macrofouling communities of tropical and boreal origin may simultaneously coexist on the same ocean-going ships in the far East Sea basin [21,22].
The International Maritime Organization has issued recommendations for the control and management of ship biofouling to minimize the transfer of introduced aquatic species [23]. The Korean Ministry of Oceans and Fisheries (MOF) reported 84,015 ship movements in 2017, of which 21,597 were domestic and 62,418 were of foreign origin [24]. Korea has established a Second Basic Plan (2019–2028) for marine ecosystem conservation and management, as dictated by the Marine Ecosystem Act of 2009 [25]. Marine ecosystem disturbances were monitored and harmful marine organisms detected in 10 domestic ports in 2008–2012; research on how to manage the issues commenced in 2014 [26]. Therefore, although port-monitoring systems have been developed and regulations have been established for the systematic management of non-indigenous marine species, hull-fouling has not been addressed.
Habitat and native organism disturbance caused by NIS is decreasing in Korea [26,27,28], and interest in research on marine-introduced organisms has recently increased. In a survey of structures in 19 ports along the Korean coast between 2008 and 2013, a total of 26 species of invasive marine benthic organisms were recorded, of which 20 species of macroinvertebrates were found to be marine NIS [27]. However, in Korea, hull-fouling as a vector has received little attention, and no research has been conducted on hull-fouling macroinvertebrates due to research difficulties. Surveys of hull-fouling communities and settlement plates in ports provide suitable data for studying interactions between NIS due to spatial limitations and the abundance of species [29]. In the future, it is very likely that these will be considered environmental risks, as are organisms in ballast water. Therefore, it is important to proactively consider the regulatory framework of the IMO to limit the introduction of harmful organisms from abroad [23,30,31]. The International Maritime Organization (IMO) is a specialized agency of the United Nations that is responsible for measures to improve the safety and security of international shipping and to prevent pollution from ships.
To date, there has been no previous research on hull-fouling macroinvertebrates in Korea, and studies have only been conducted on artificial structures, floating objects, the rocky bottom, and intertidal zones in various ports. Therefore, the purpose of this study is (1) to reveal differences in the species composition and distribution of attached organisms depending on the operating area; (2) to identify domestically introduced species using ship hulls as a vector and to distinguish between native and non-native species; (3) to determine the correlation between the operating–anchoring conditions of ships and the distribution of attached organisms; (4) to determine and present ships’ hull pollution status, prepare a preemptive response strategy to IMO regulations, and provide basic data for policy development.

2. Materials and Methods

2.1. Hull Sampling

In 2016 and 2017, we studied five research vessels currently in use by the Korea Institute of Ocean Science and Technology (KIOST) in Busan, Korea. All vessels were cleaned annually in a dry dock, and the sample survey was carried out immediately after the removal of all seawater from the shipyard dock just prior to cleaning. More samples and species were collected in dry docks than in water, for which the method of Meloni et al. [32] was followed. The hull-macrofouling samples were collected from four hull sectors in the dry dock (Table 1 and Table 2qw2): the upper, middle, and bottom sectors (defined by reference to the waterline) and from the thrusters or propeller shafts (niche areas). Samples were collected in three to five replicates using a scraper from all samples within quadrats (15 × 15 cm) for four sectors of the five ship hulls (69 samples in total). The samples were fixed in vinyl bags containing a diluted 10% formalin solution on an electric table lift and transported to the laboratory (Figure 1). All collected organisms were identified and counted and identified to the species level by experts using a microscope and weighted to an accuracy of up to 0.001 g in the laboratory. Identification of hull-fouling macroinvertebrates followed literature guidelines: Mollusks in Korea [33], Marine Mollusks in Japan [34], Annelida Polychaetes Ⅰ, Ⅱ, Ⅲ [35,36,37], Marine Crustaceans in Korean Coasts [38,39], and Echinoderms of Korea [40]. Biomass was measured after complete removal of the moisture from the surface of the organism with strong absorbent paper. Individual numbers and biomass were converted to per unit area for comparison by each ship hull and sector. When collecting hull-fouling macroinvertebrates, photographs were taken to confirm the collection area before and after sample collection. Bottom and side gap samples were collected on both sections, and the propeller shaft was collected by rotating the quadrat, taking into account the curvature. Finally, a species list was generated using Microsoft office professional plus 2019 Excel v1808 software (Appendices 1–5).

2.2. Navigation Areas

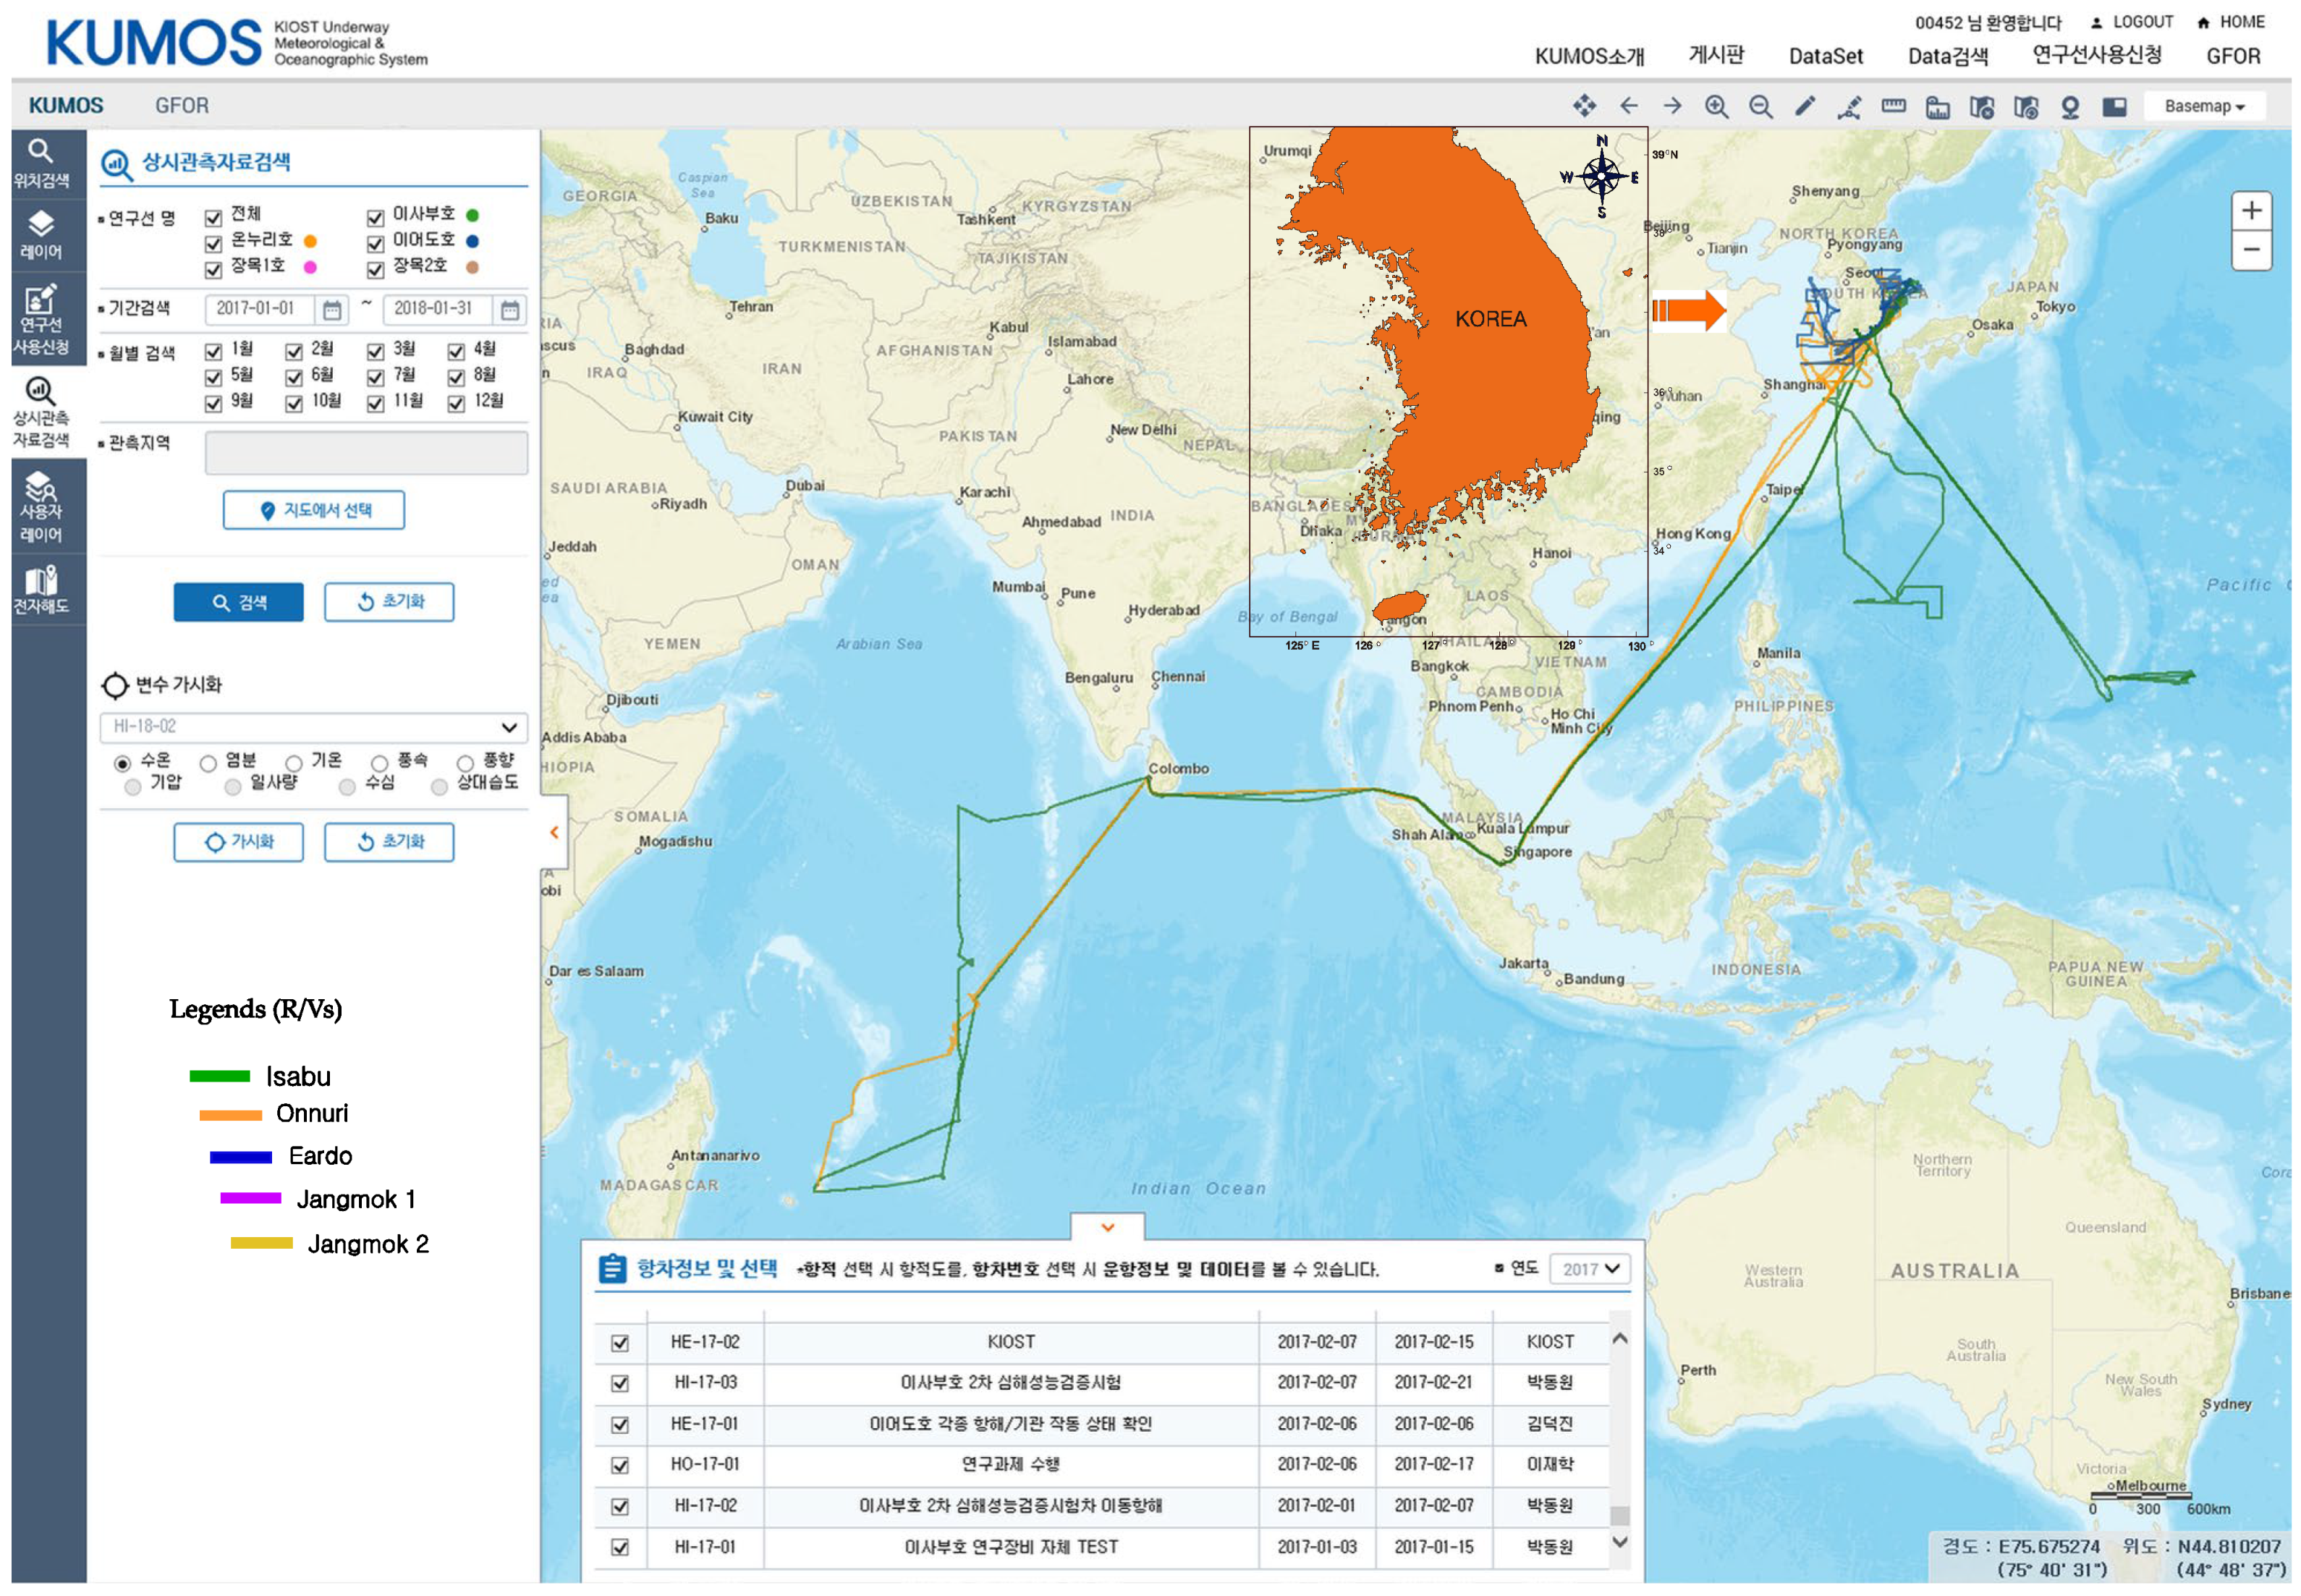
The five vessels were divided into three categories according to navigation area and tonnage (Table 2). The ocean-going the Isabu and Onnuri, which principally survey the ocean worldwide, anchored in Guam in the Northwest Pacific Ocean, Colombo (Sri Lanka) in the North Indian Ocean, and Mauritius in the Southwest Indian Ocean. The coastal class the Eardo mainly investigates the South and East Seas of South Korea. The local class the Jangmok 1 mainly operates inshore such as in ports and bays in the South Sea. The coastal-local class the Jangmok 2 investigates the coastal, port, and bay areas of the East Sea, West Sea, and South Sea. In particular, the Jangmok 2 frequently operates in the Ulleung island area, 120 km away in the East Sea. After the research surveys, the Jangmok 2 anchored at an East Sea port and the other research vessels at the Jangmok port (adjacent to the South Sea) when they were not operating. The operational records of these research vessels for one year from 2016 to 2017 are presented (Table 3, Figure 2).

2.3. Data Analysis

The faunal matrix resulting from abundances per species by sample was employed for subsequent analyses. The data were subjected to fourth-root transformation to focus on rare species and decrease the significance of common species during analysis. The number of individuals was converted into a per-square-meter measure [41]. Univariate analysis was conducted on community structure data such as number of species, number of individuals, and biomass. In addition, the Shannon–Wiener diversity index (loge H´) and the Pielou evenness index () were calculated using Primer-e software [42,43]. Major species were selected as the species having an abundance of more than 1% of the total number of individuals. Before multivariate analysis, the null hypothesis that the sample follows a normal distribution was rejected as p-value is lower than the significance level alpha=0.05 (p<0.0001), so non-parametric statistics were performed. This normality test was carried out using the Shapiro–Wilk, Anderson-Darling, and Lilliefors methods with the XlSTAT Base 19.02 Addinsoft.
We examined community similarity using a nonmetric multidimensional scaling (nMDS) plot of the fouling communities based on Bray–Curtis similarities, which were generated per hull sector of each vessel. The similarity measure was calculated based on fourth-root transformed data of the number of individuals. Similarity profile tests (SIMPROF) from nMDS analysis were used for sample clusters. Community composition differences among vessels were tested using one-way ANOSIM (analysis of similarity) on the fourth-root transformed similarity matrix of each hull [44]. Similarity percentages (SIMPER) analysis was performed to identify the contribution of each species to the similarity and dissimilarity between the vessels [45]. All of the multivariate analyses were performed using PRIMER v.7 [46]. The Spearman rank correlations between the number of species, number of individuals, biomass, diversity index, and evenness index of macroinvertebrate on the hull and the total operation days (TODs), total anchoring days (TADs), coastal operation days (CODs), and ocean operation days (OODs) were analyzed using the Xlstat addinsoft. Ship operating records for this period (2016–2017) were downloaded from http://kumos.kiost.ac.kr (Table 3).
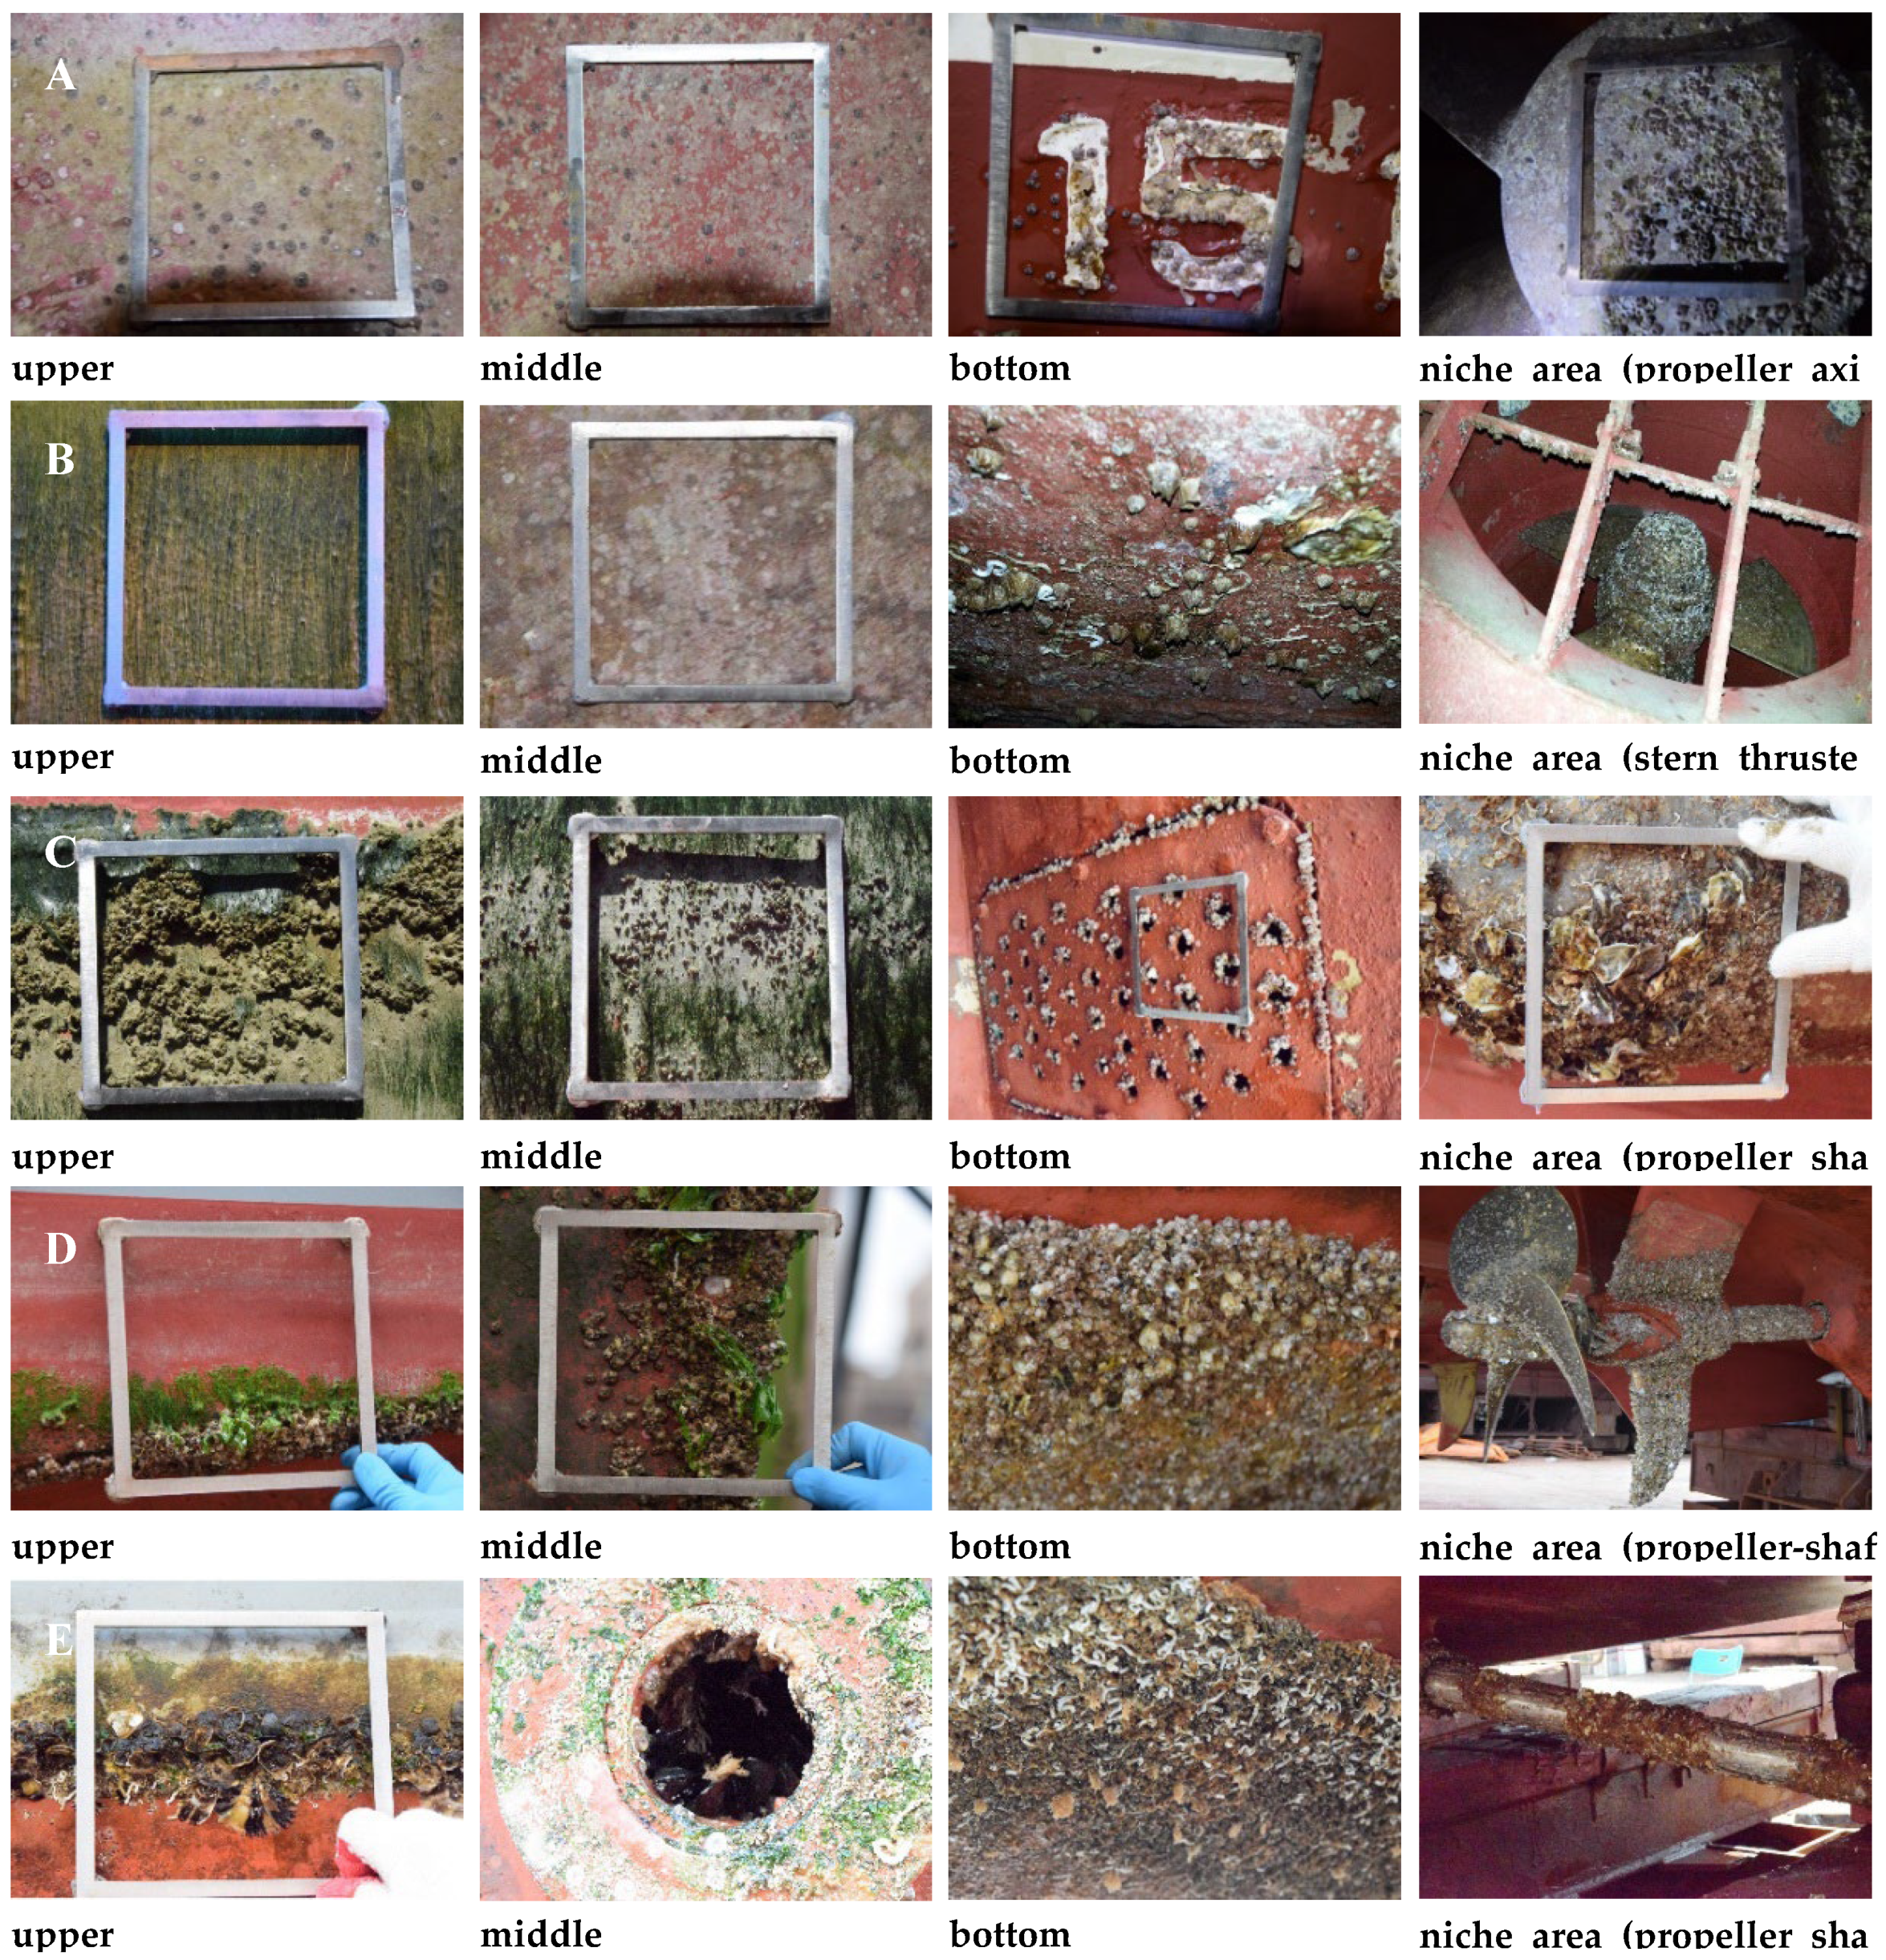
Figure 3. Attached hull-fouling macroinvertebrates on the five research vessels ((A): Isabu, (B): Onnuri, (C): Eardo, (D): Jangmok 1, (E): Jangmok 2; upper: waterline on the hull side, middle: between the waterline and bottom line, bottom: including the seawater inlet, niche areas: propeller, shaft, and thruster; quadrats: 15х15 cm).
Preprints 98963 g003

3. Results

3.1. ISABU

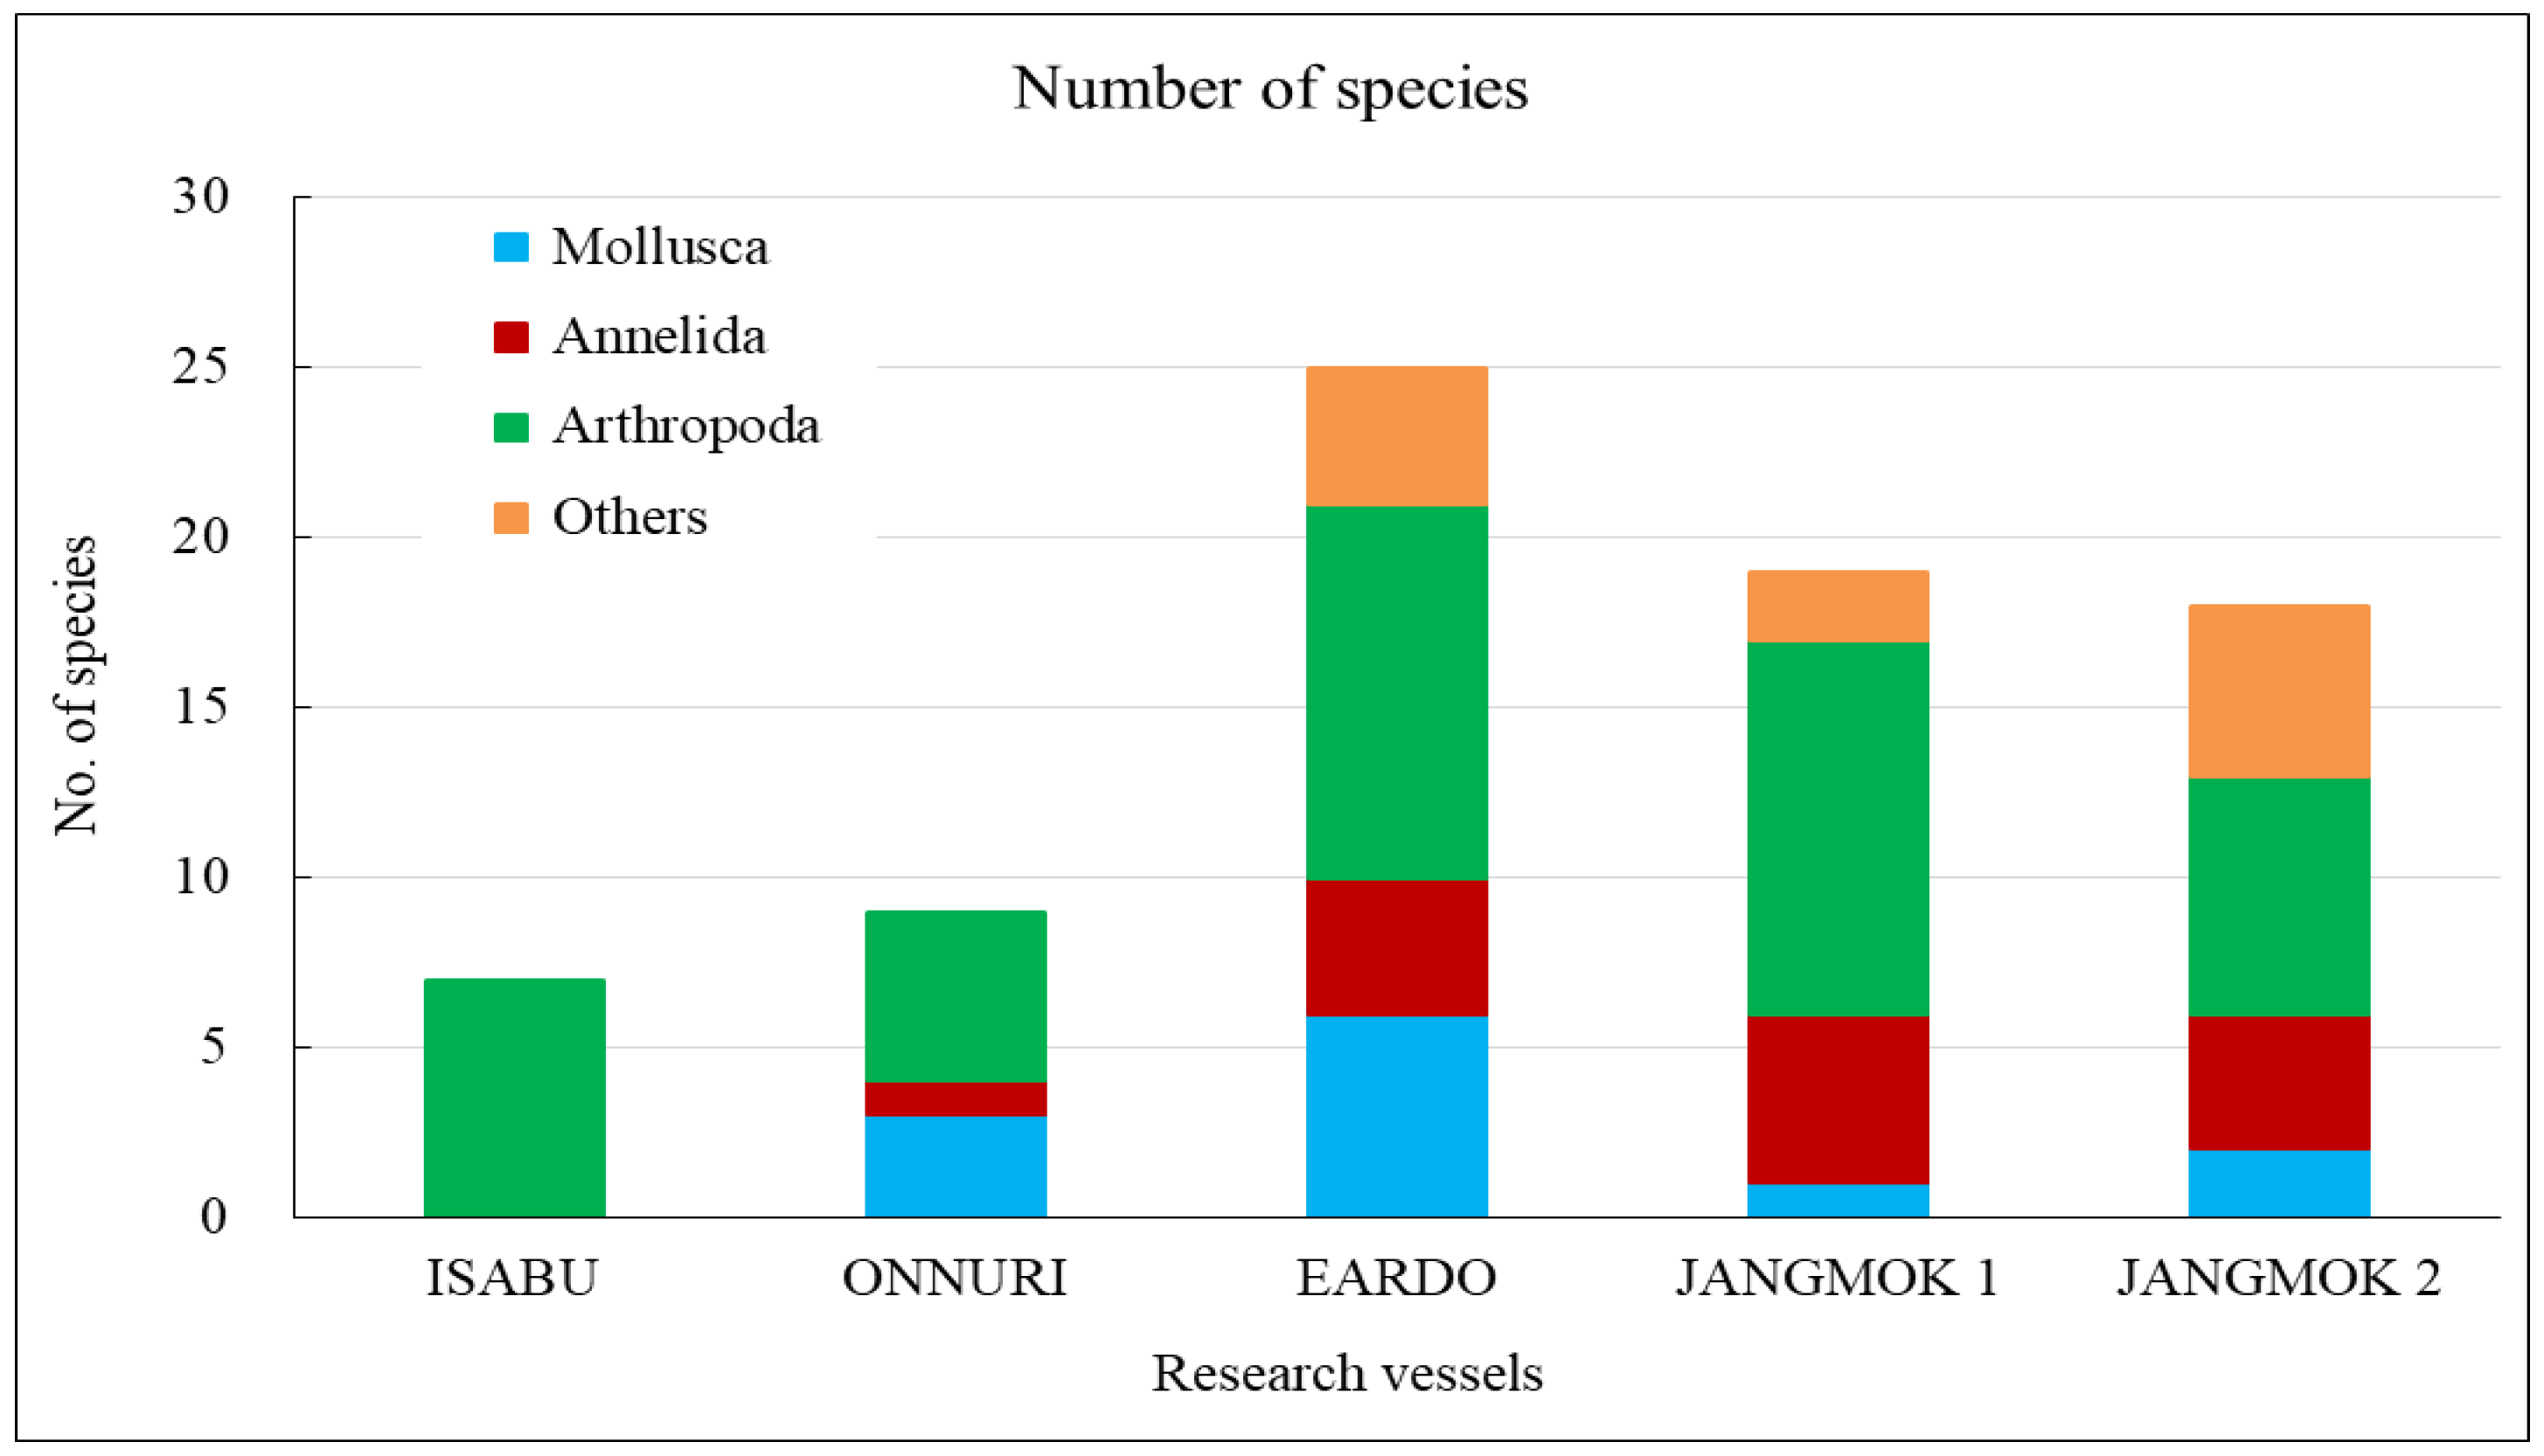
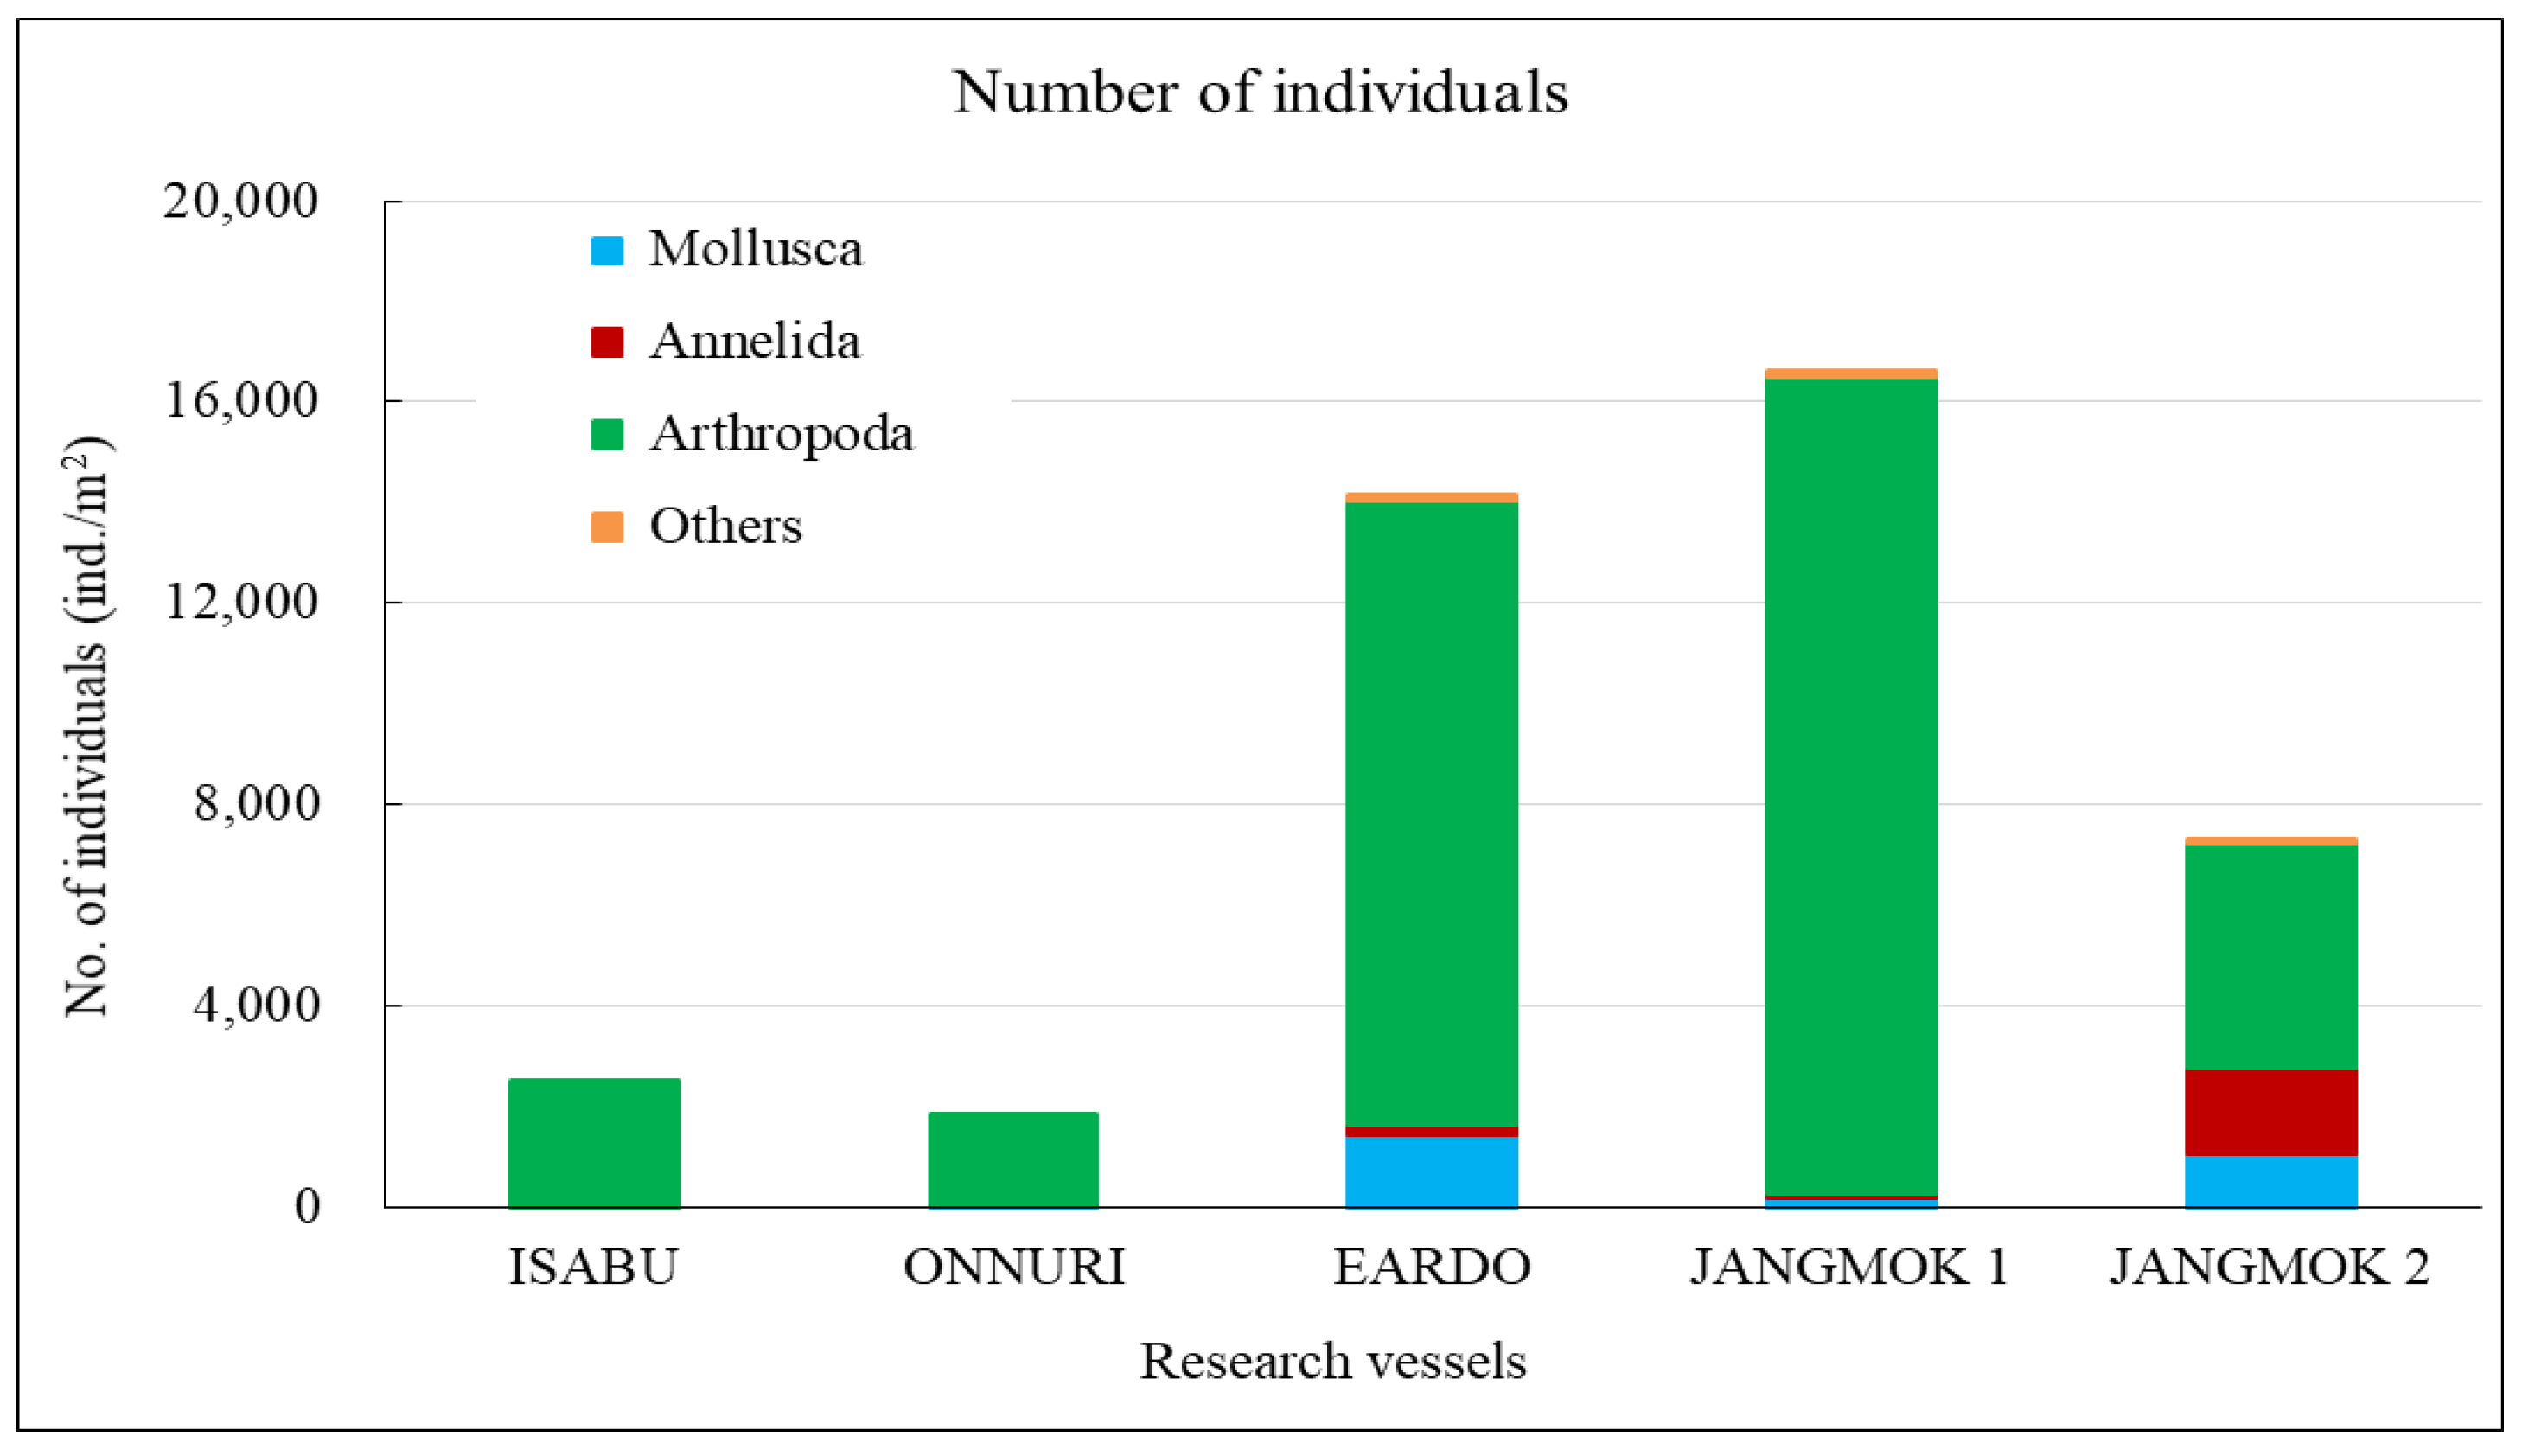
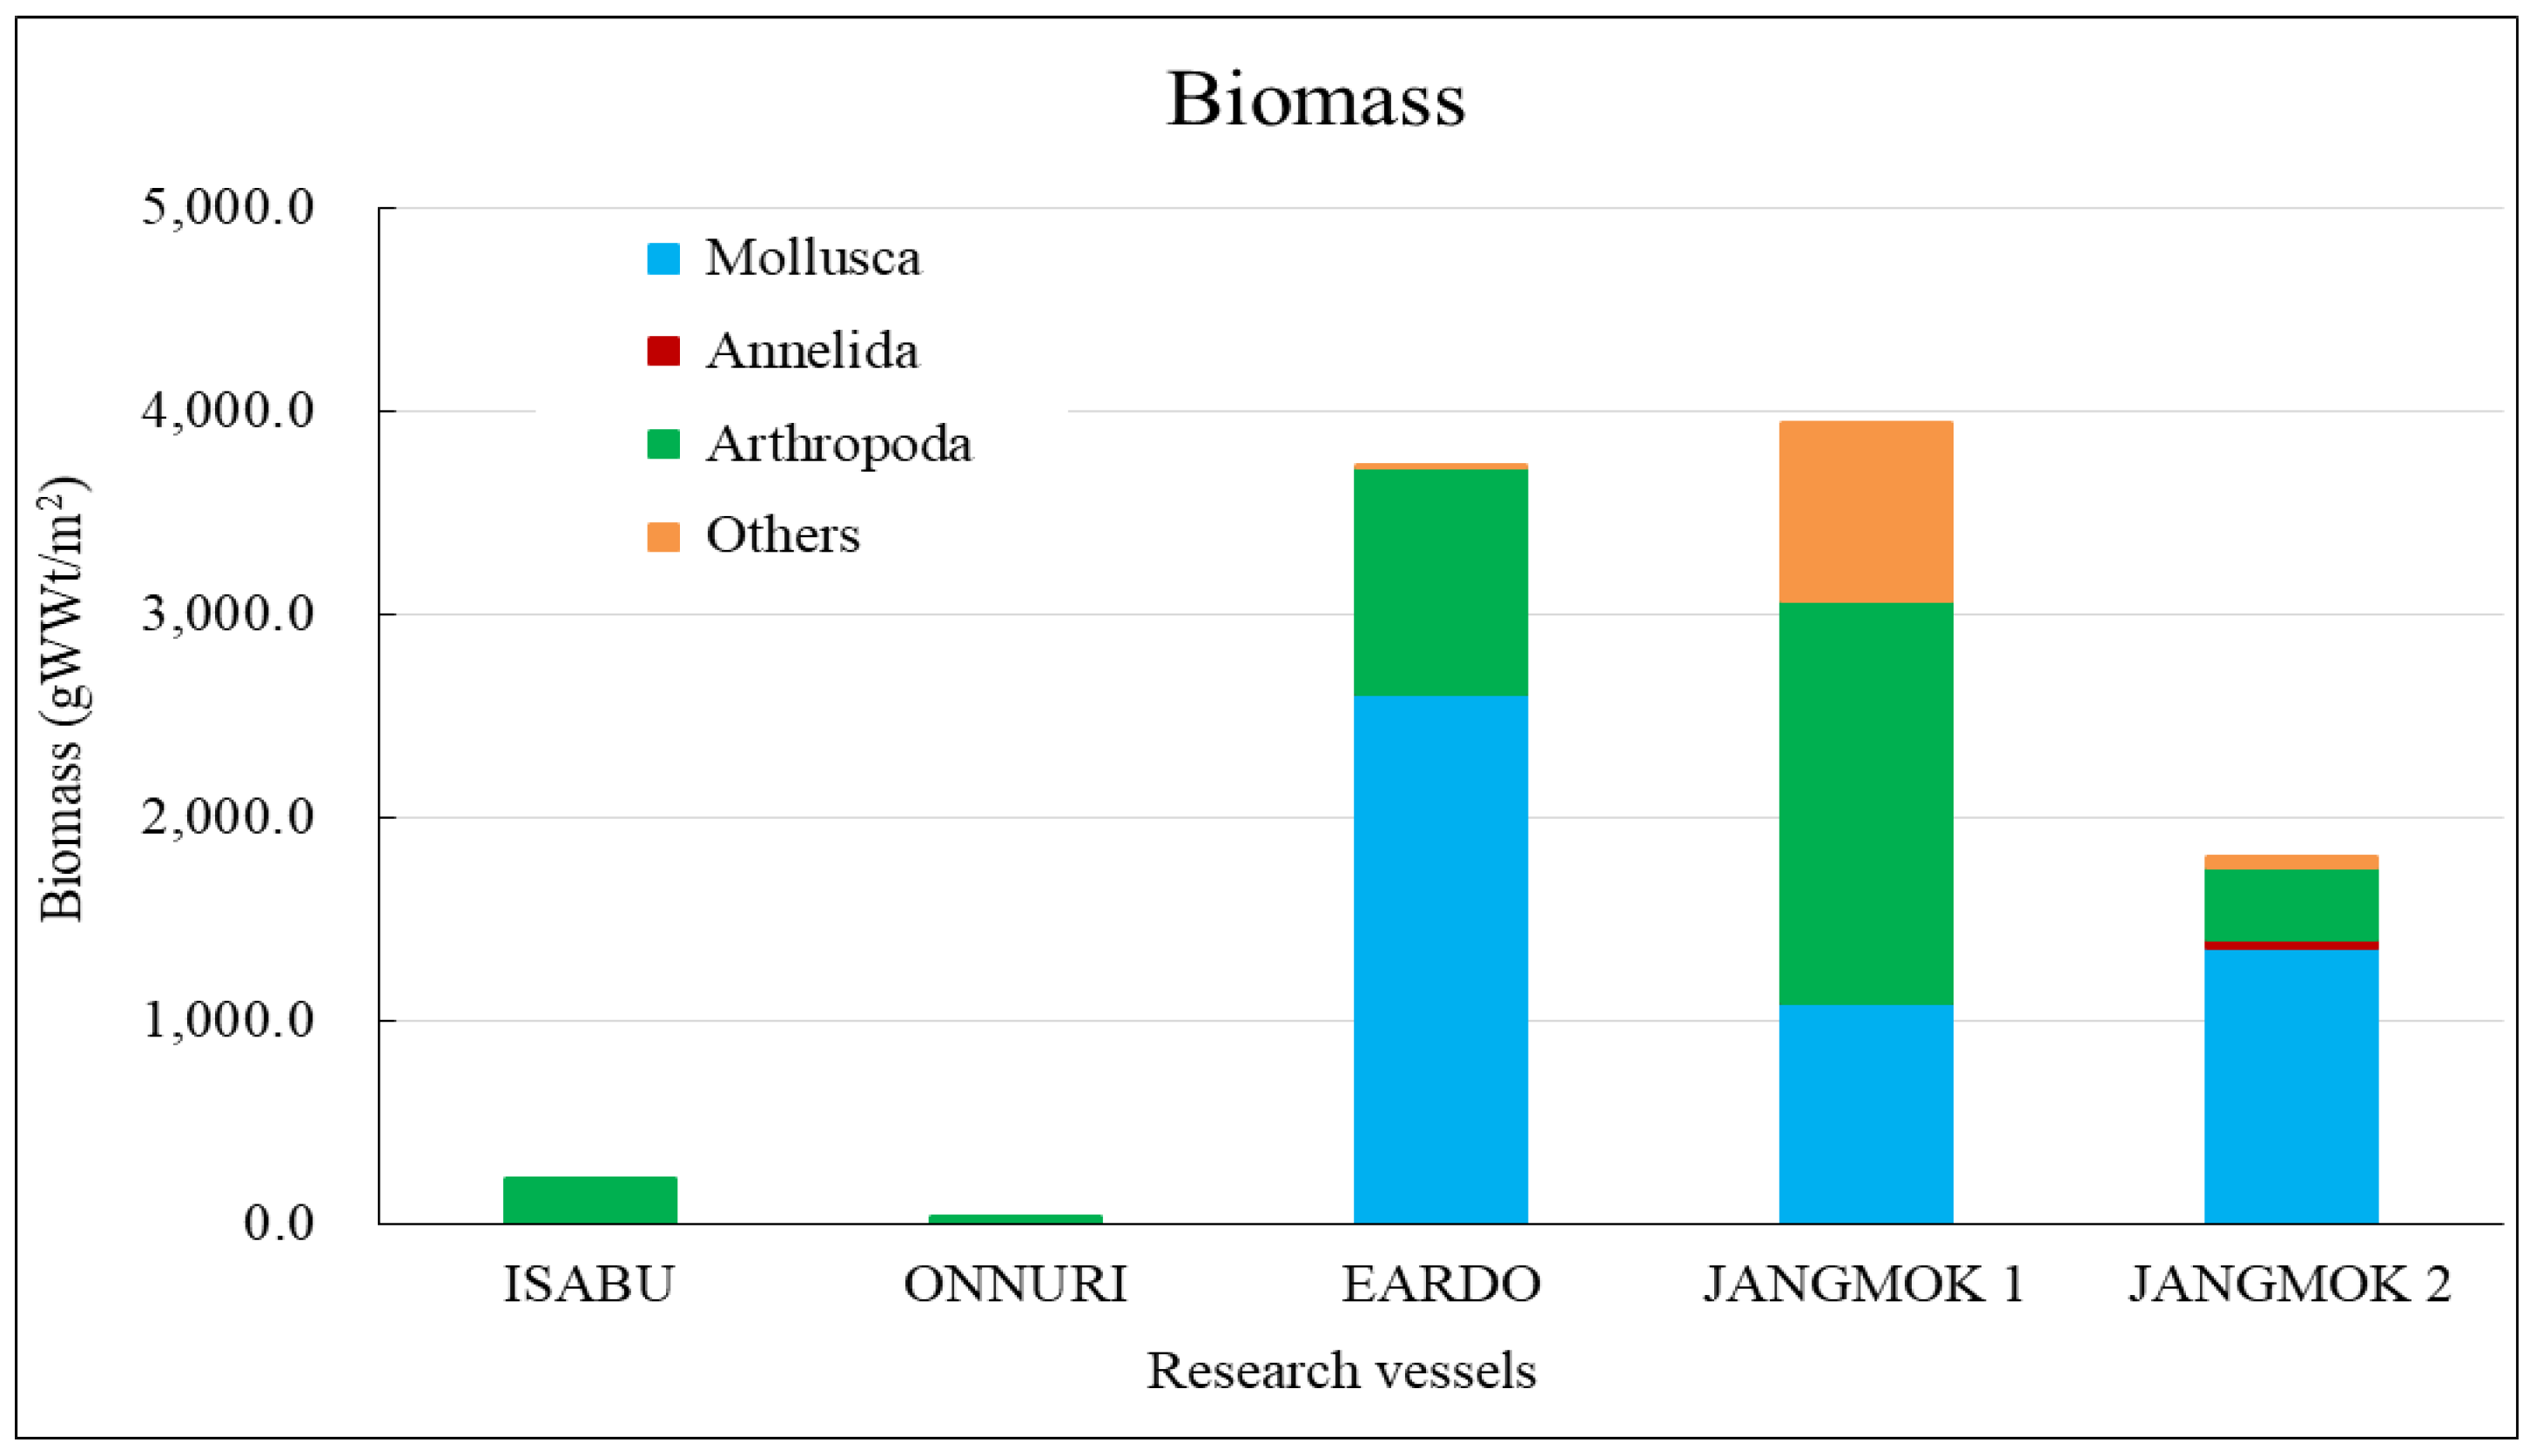
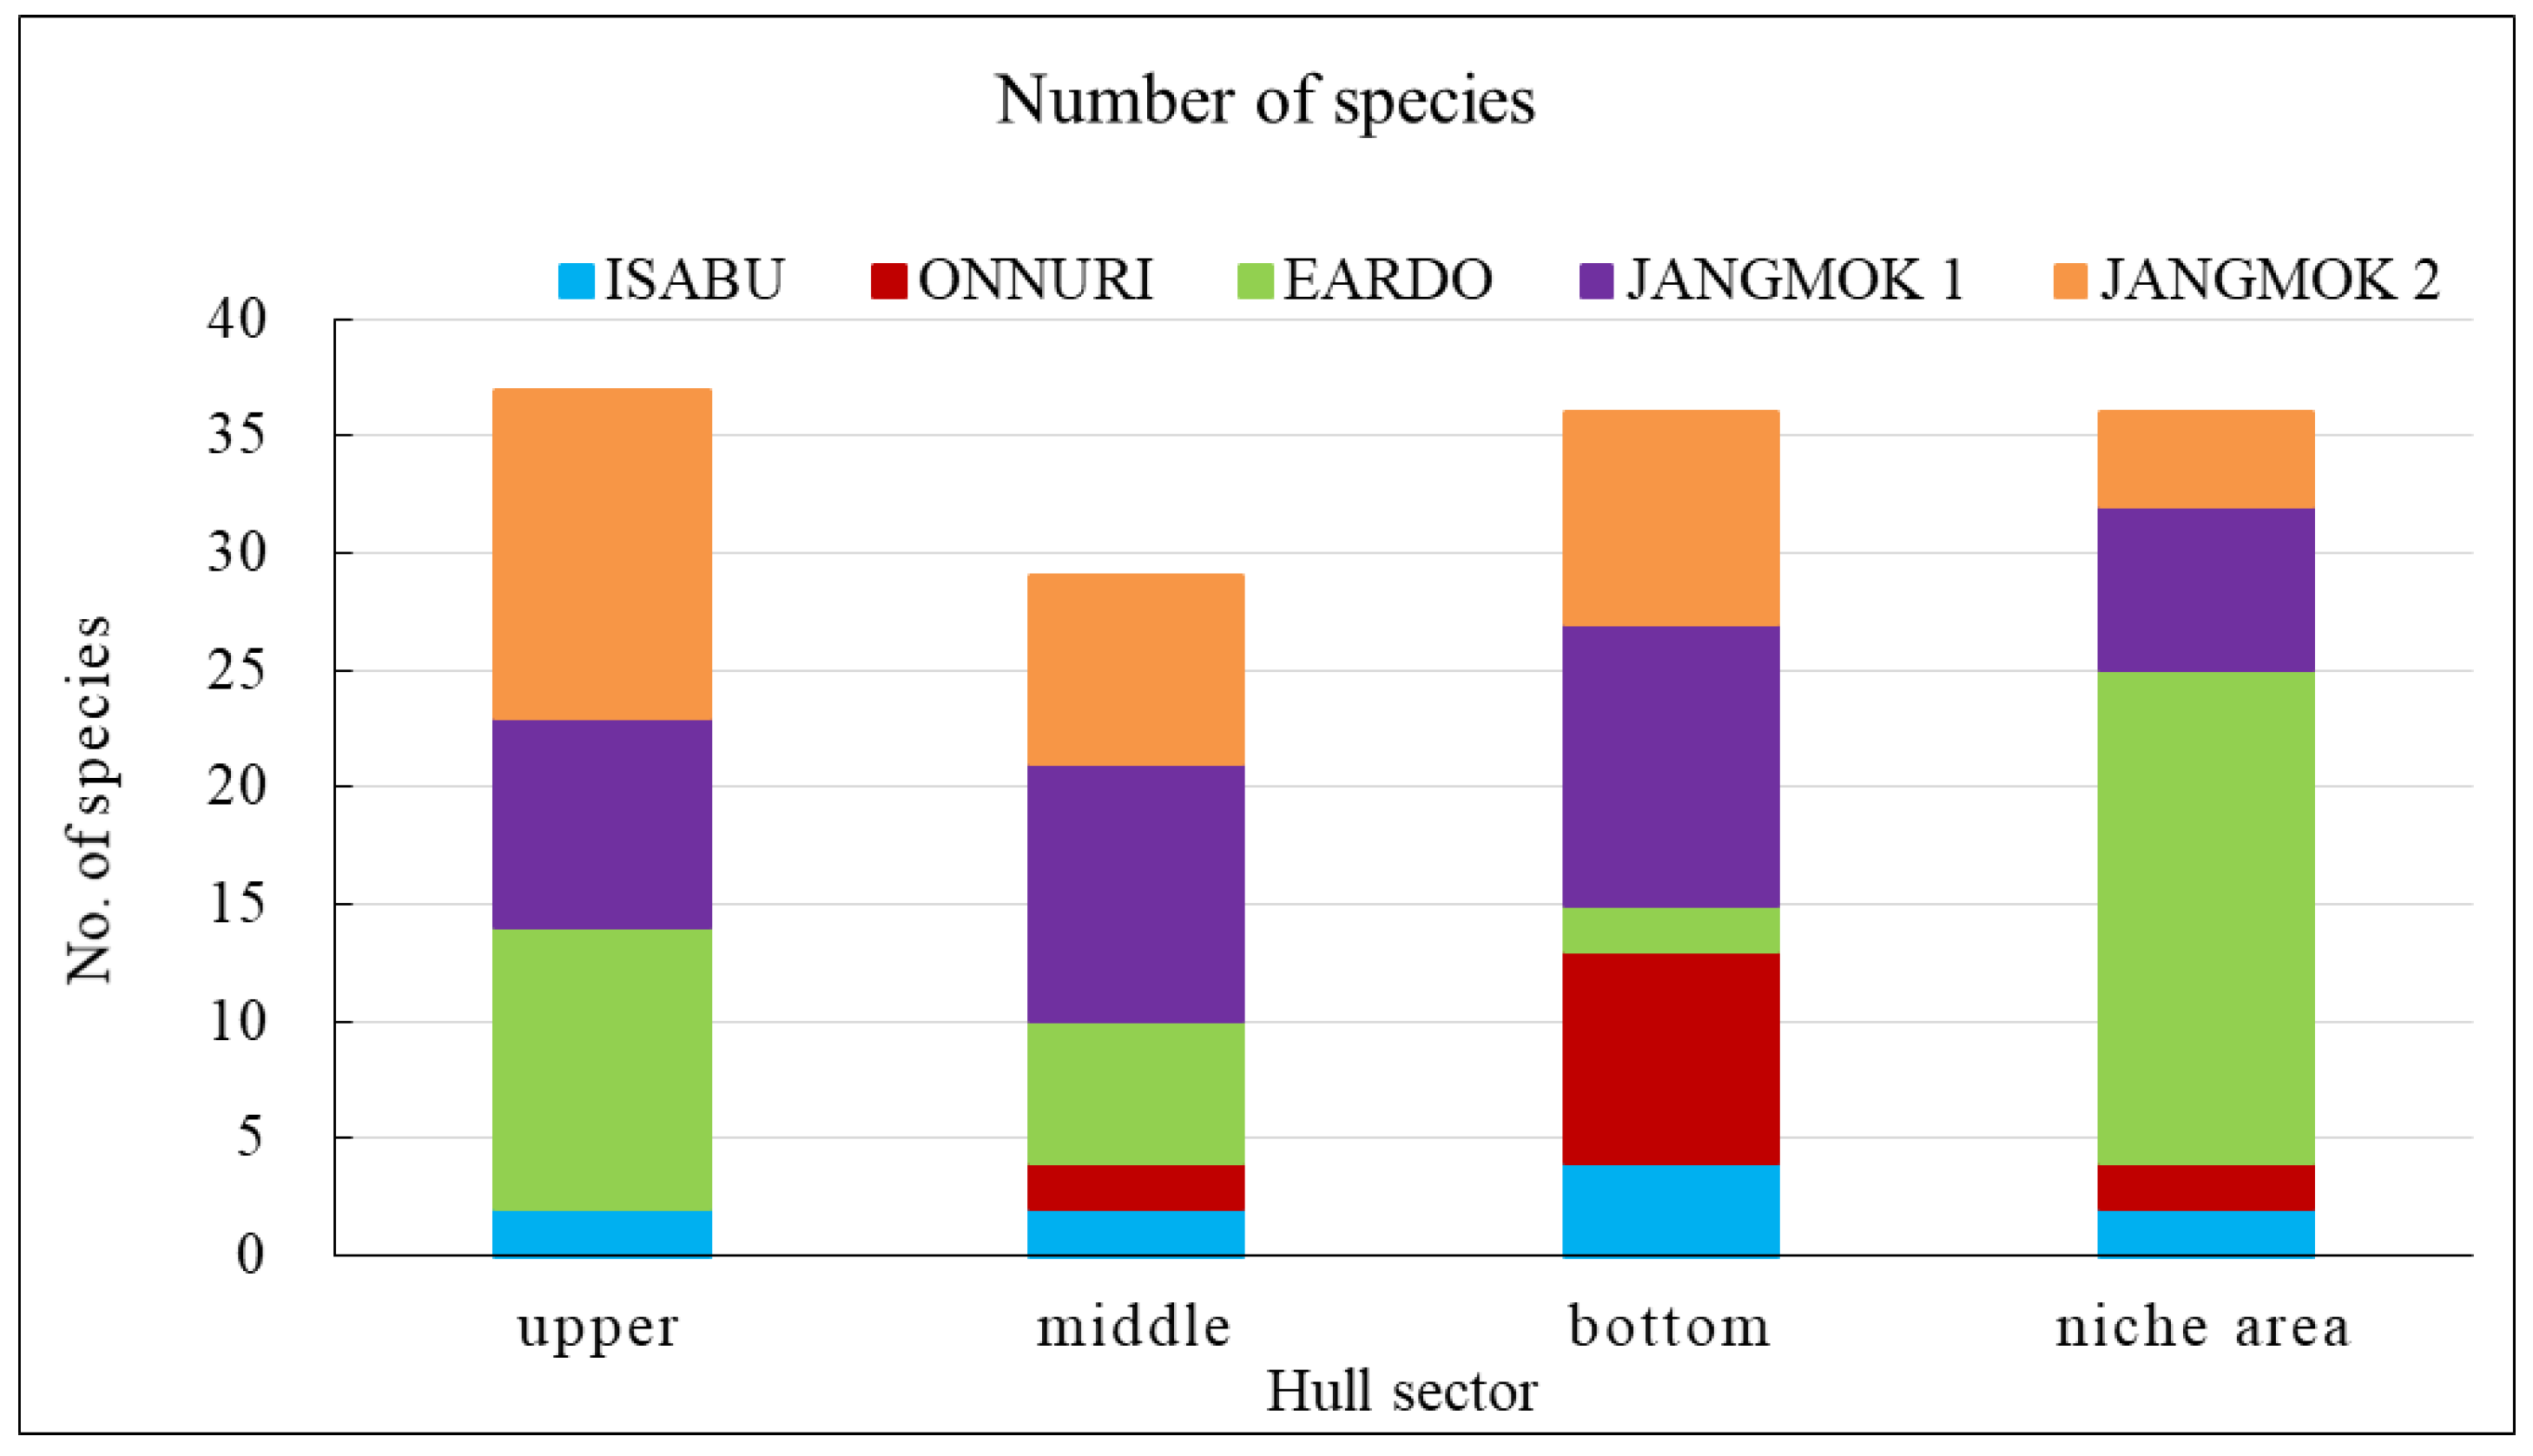
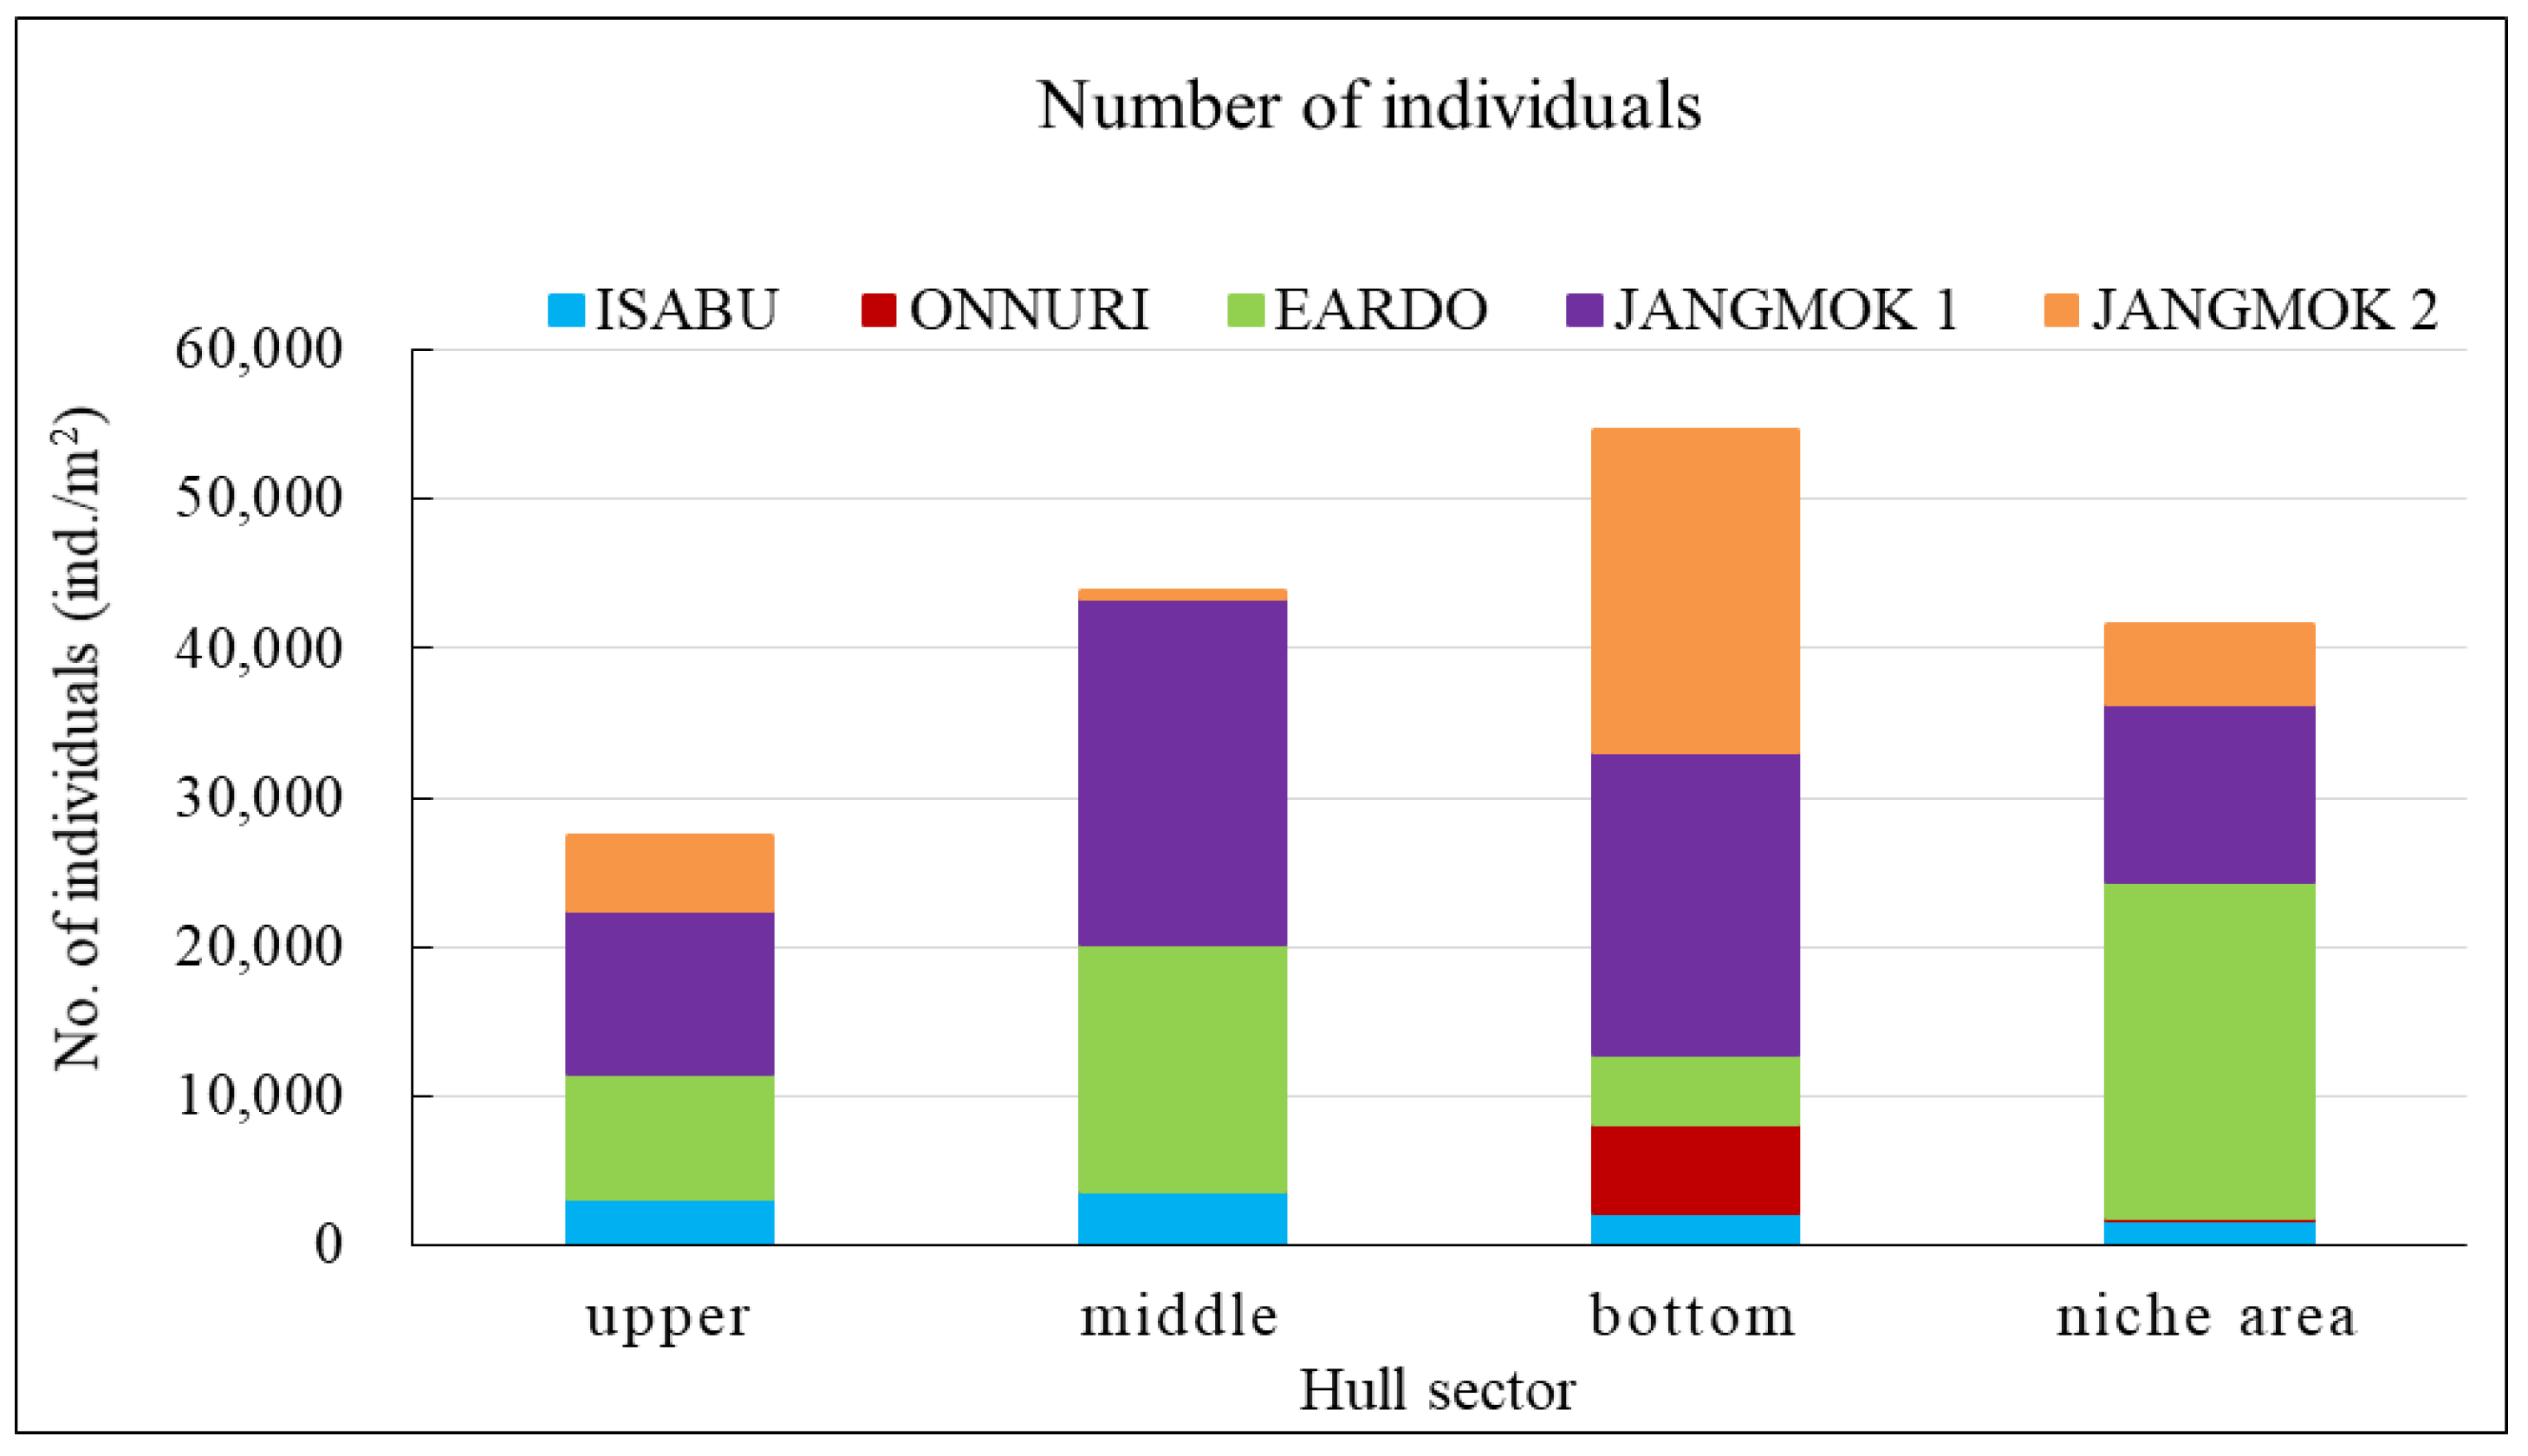
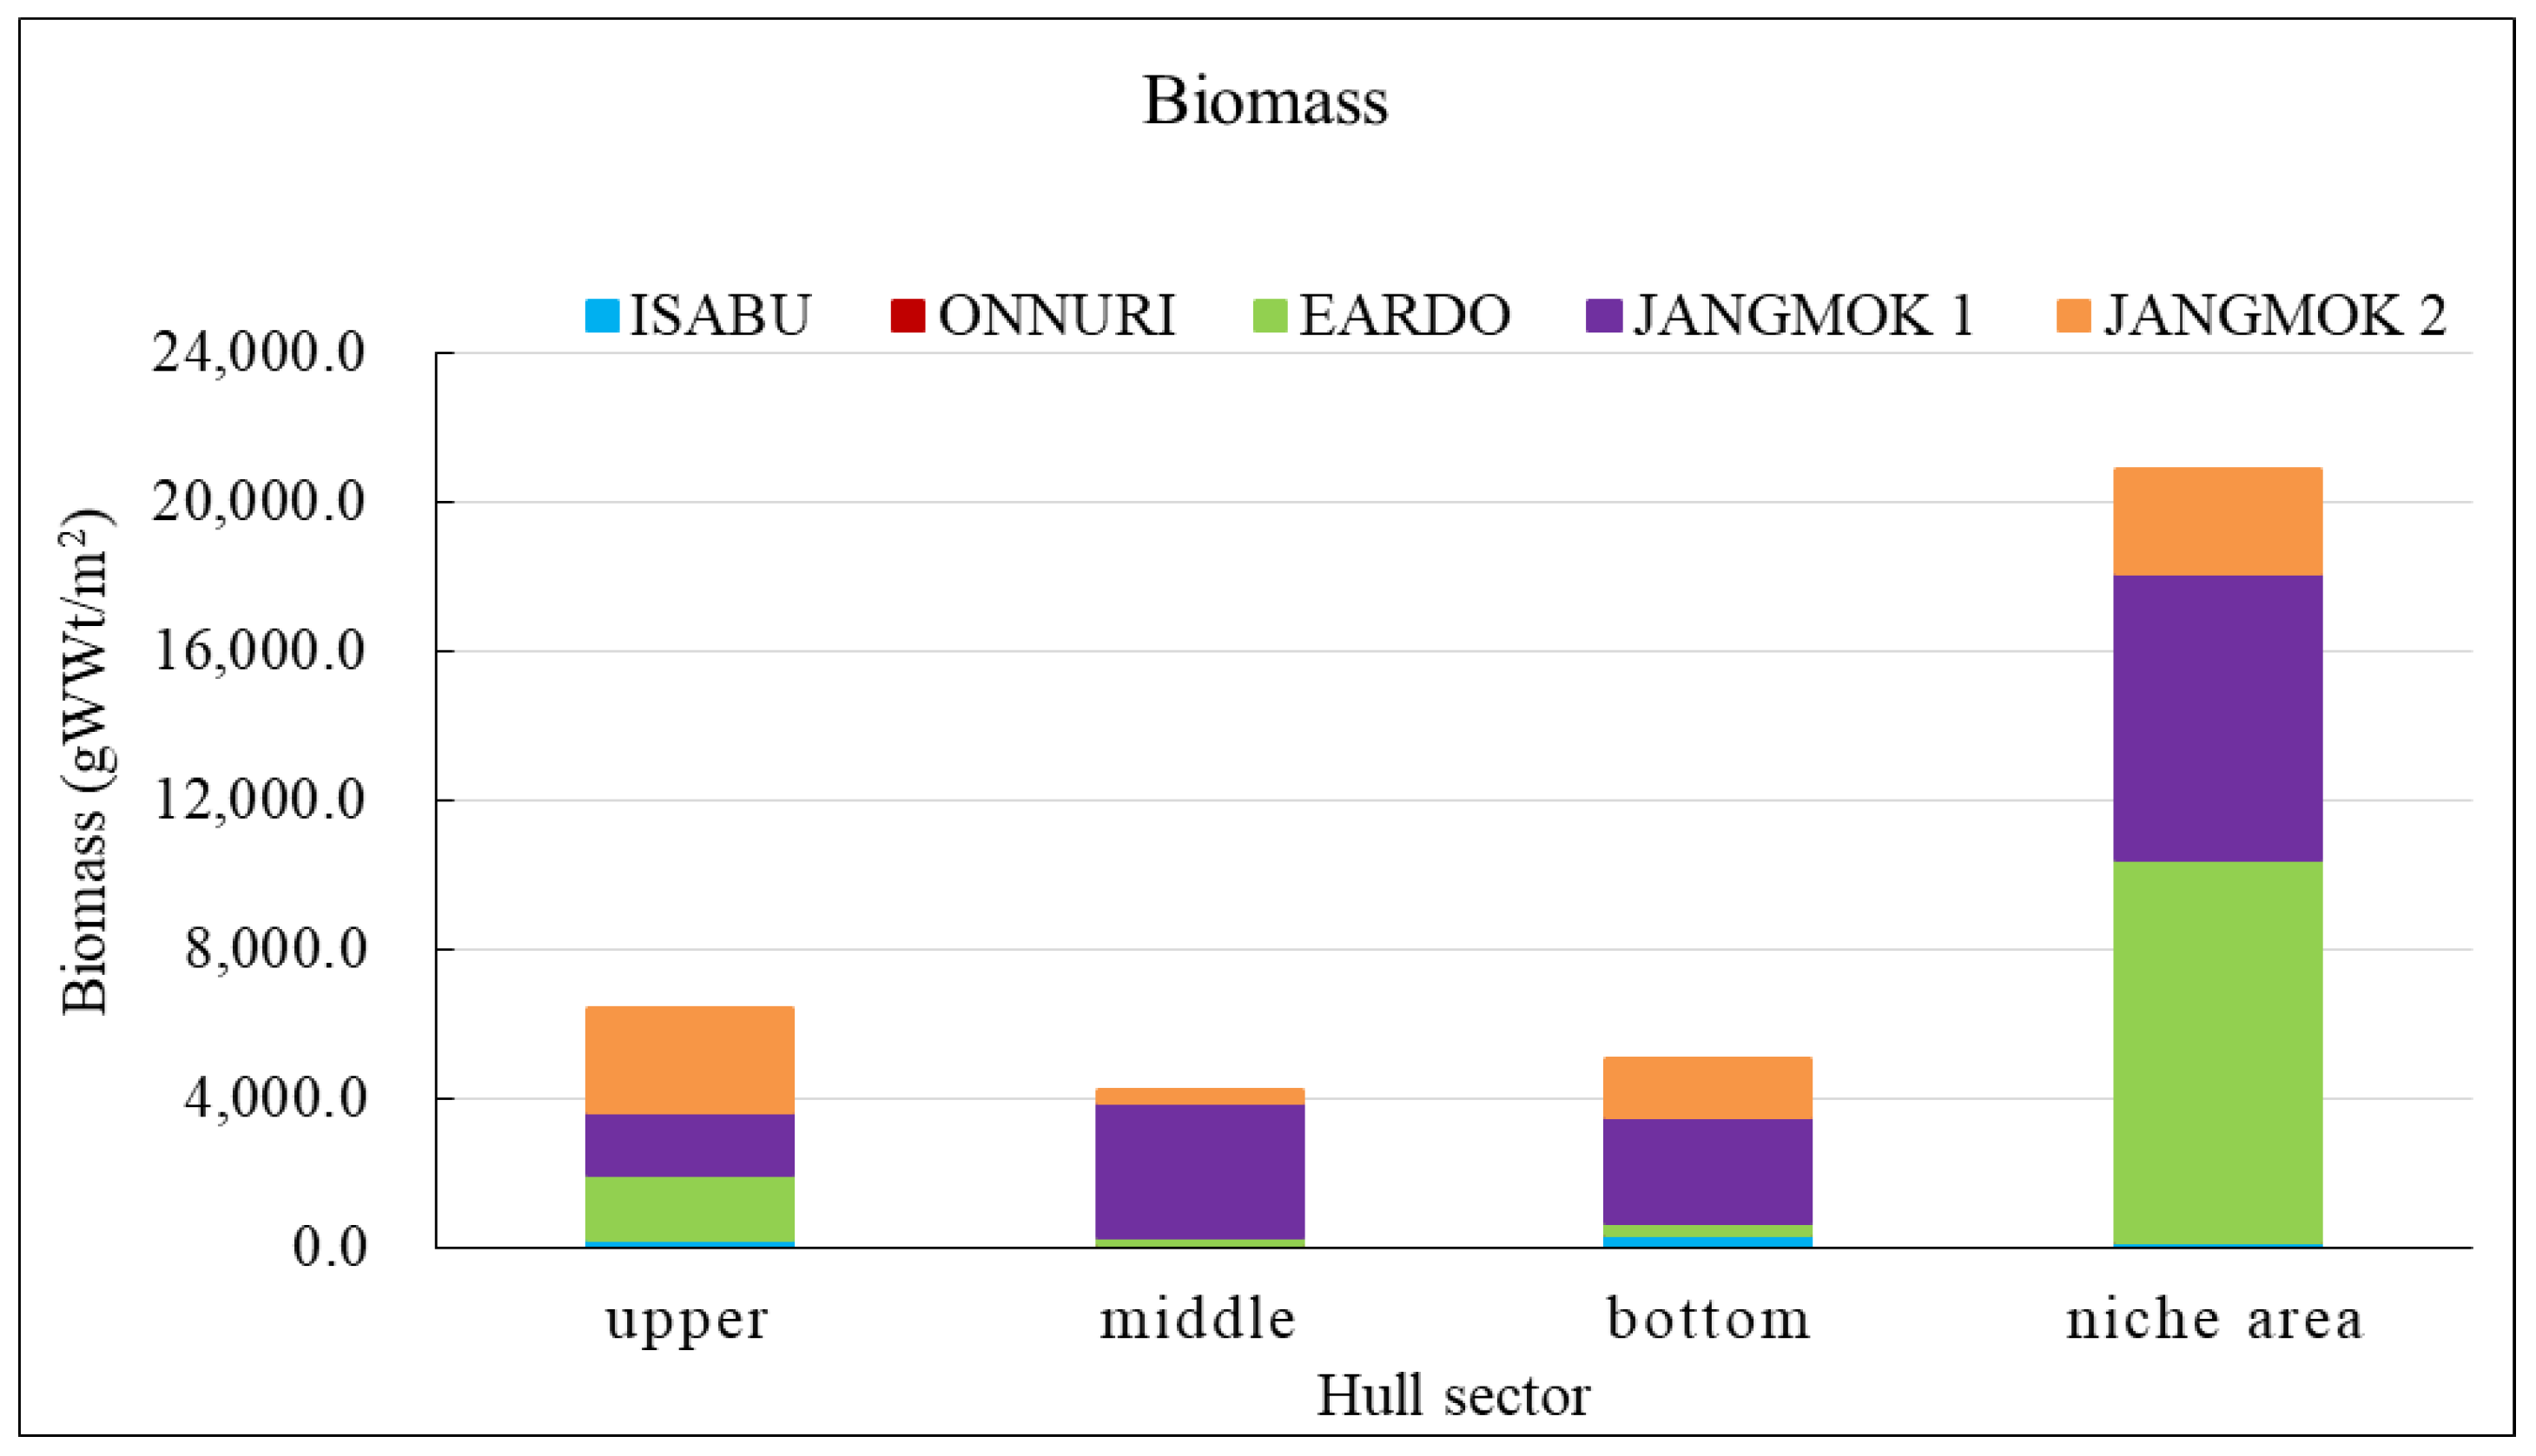
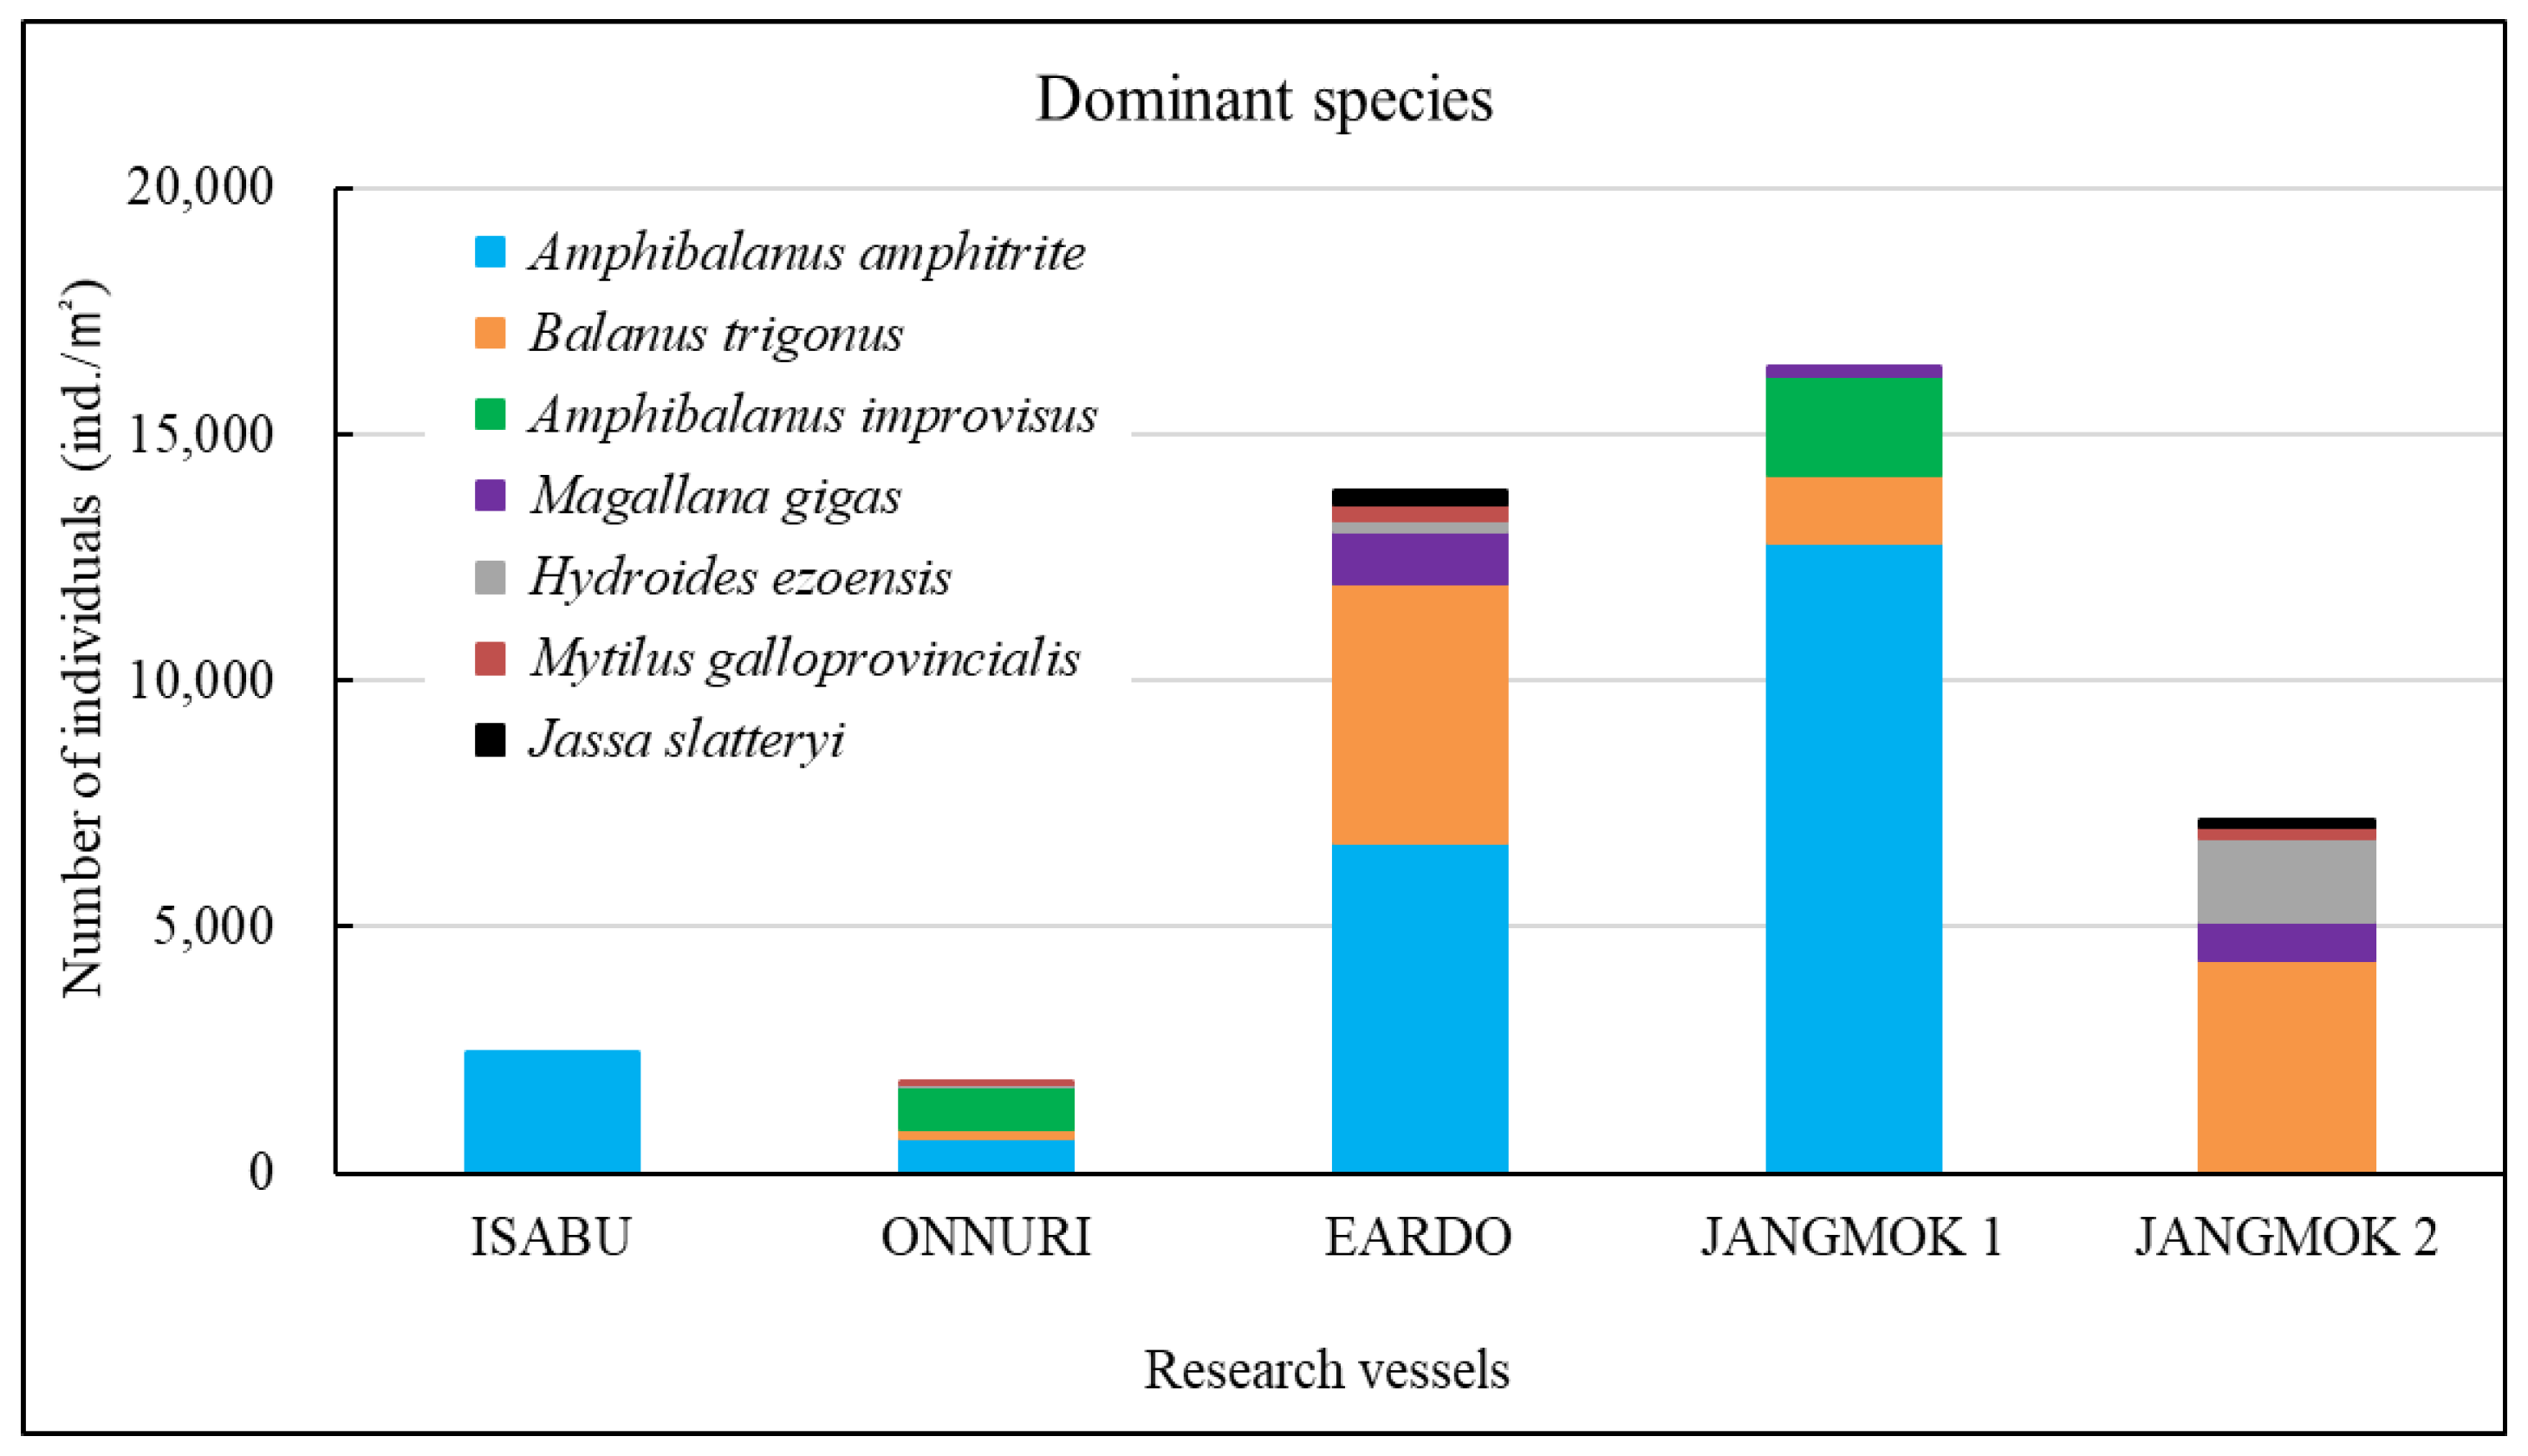
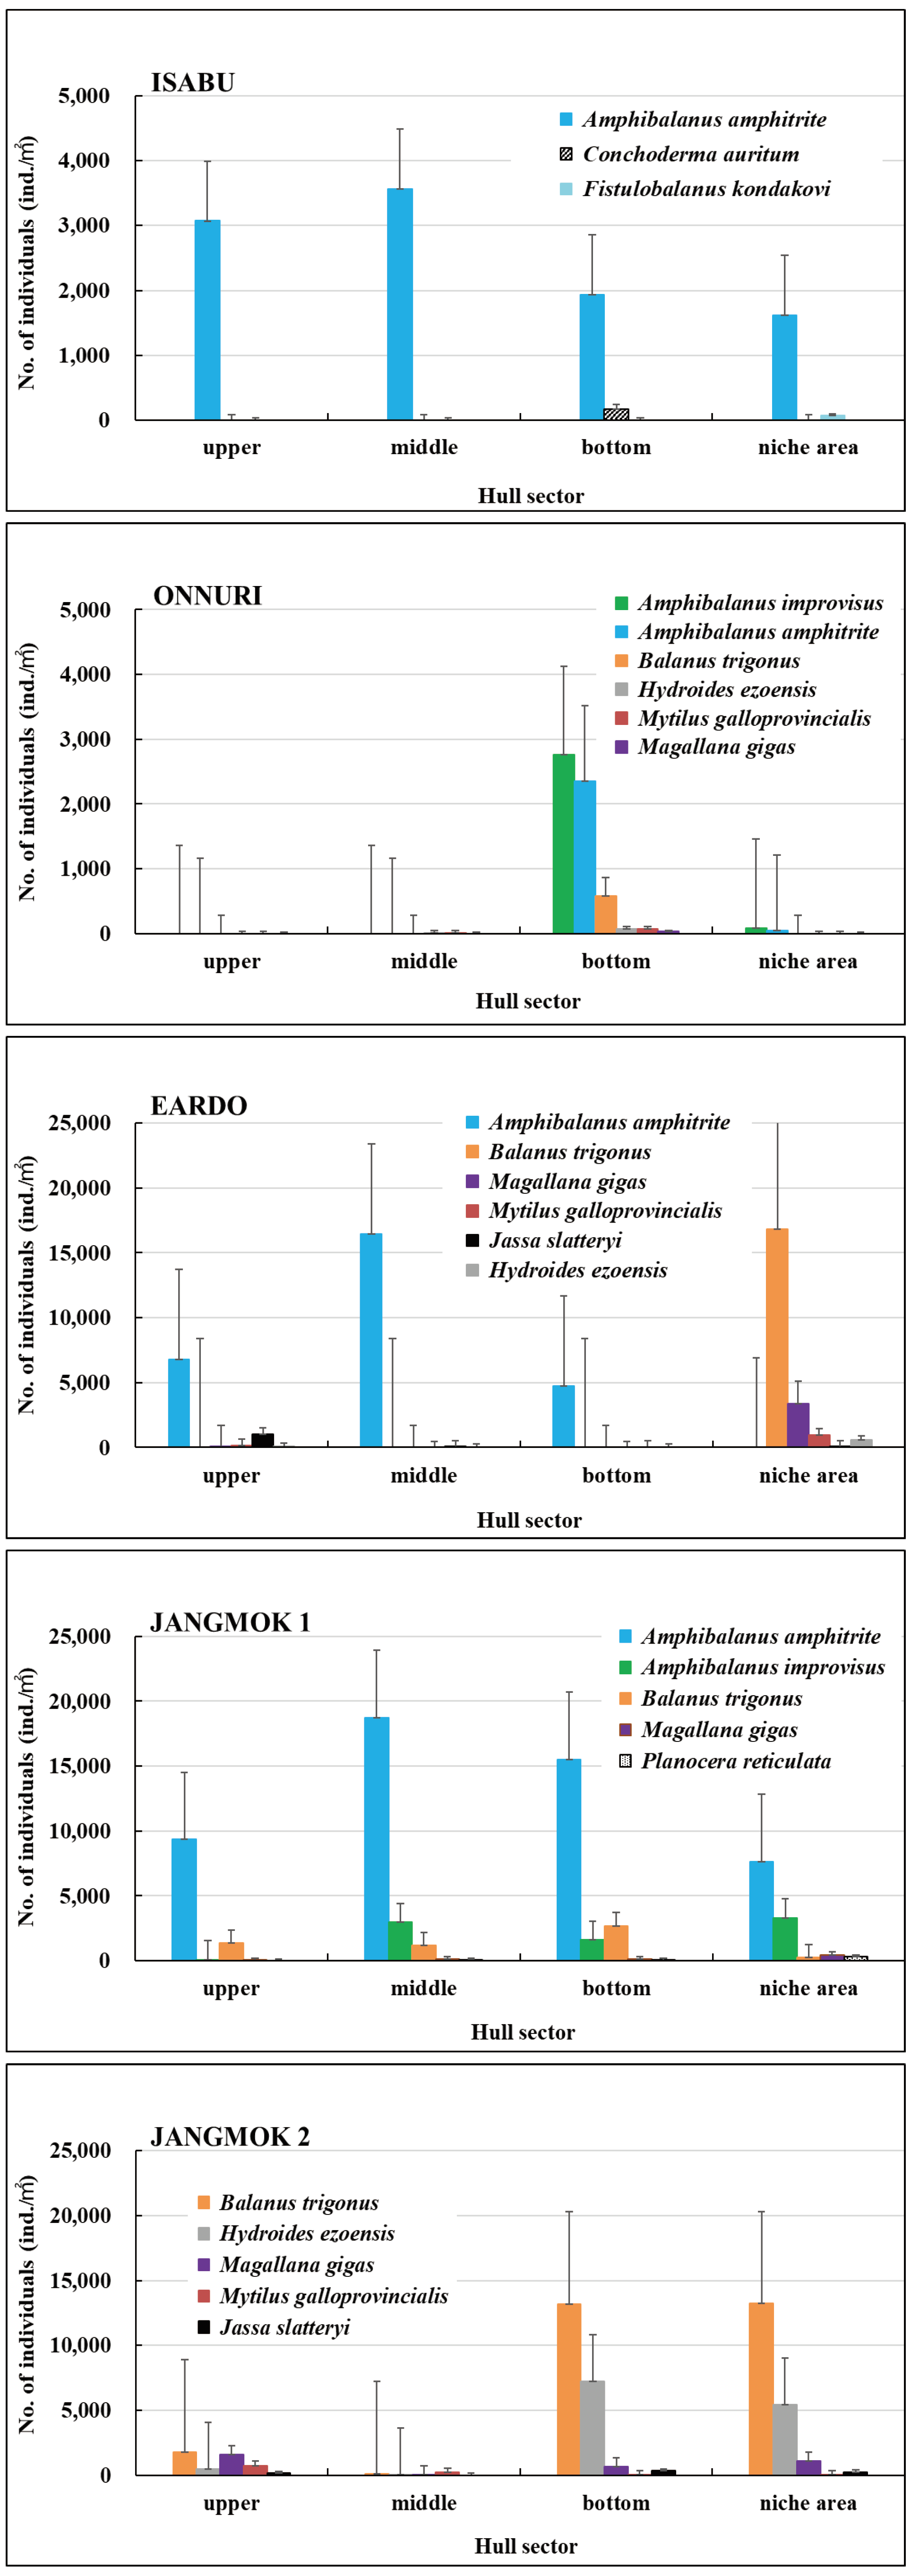
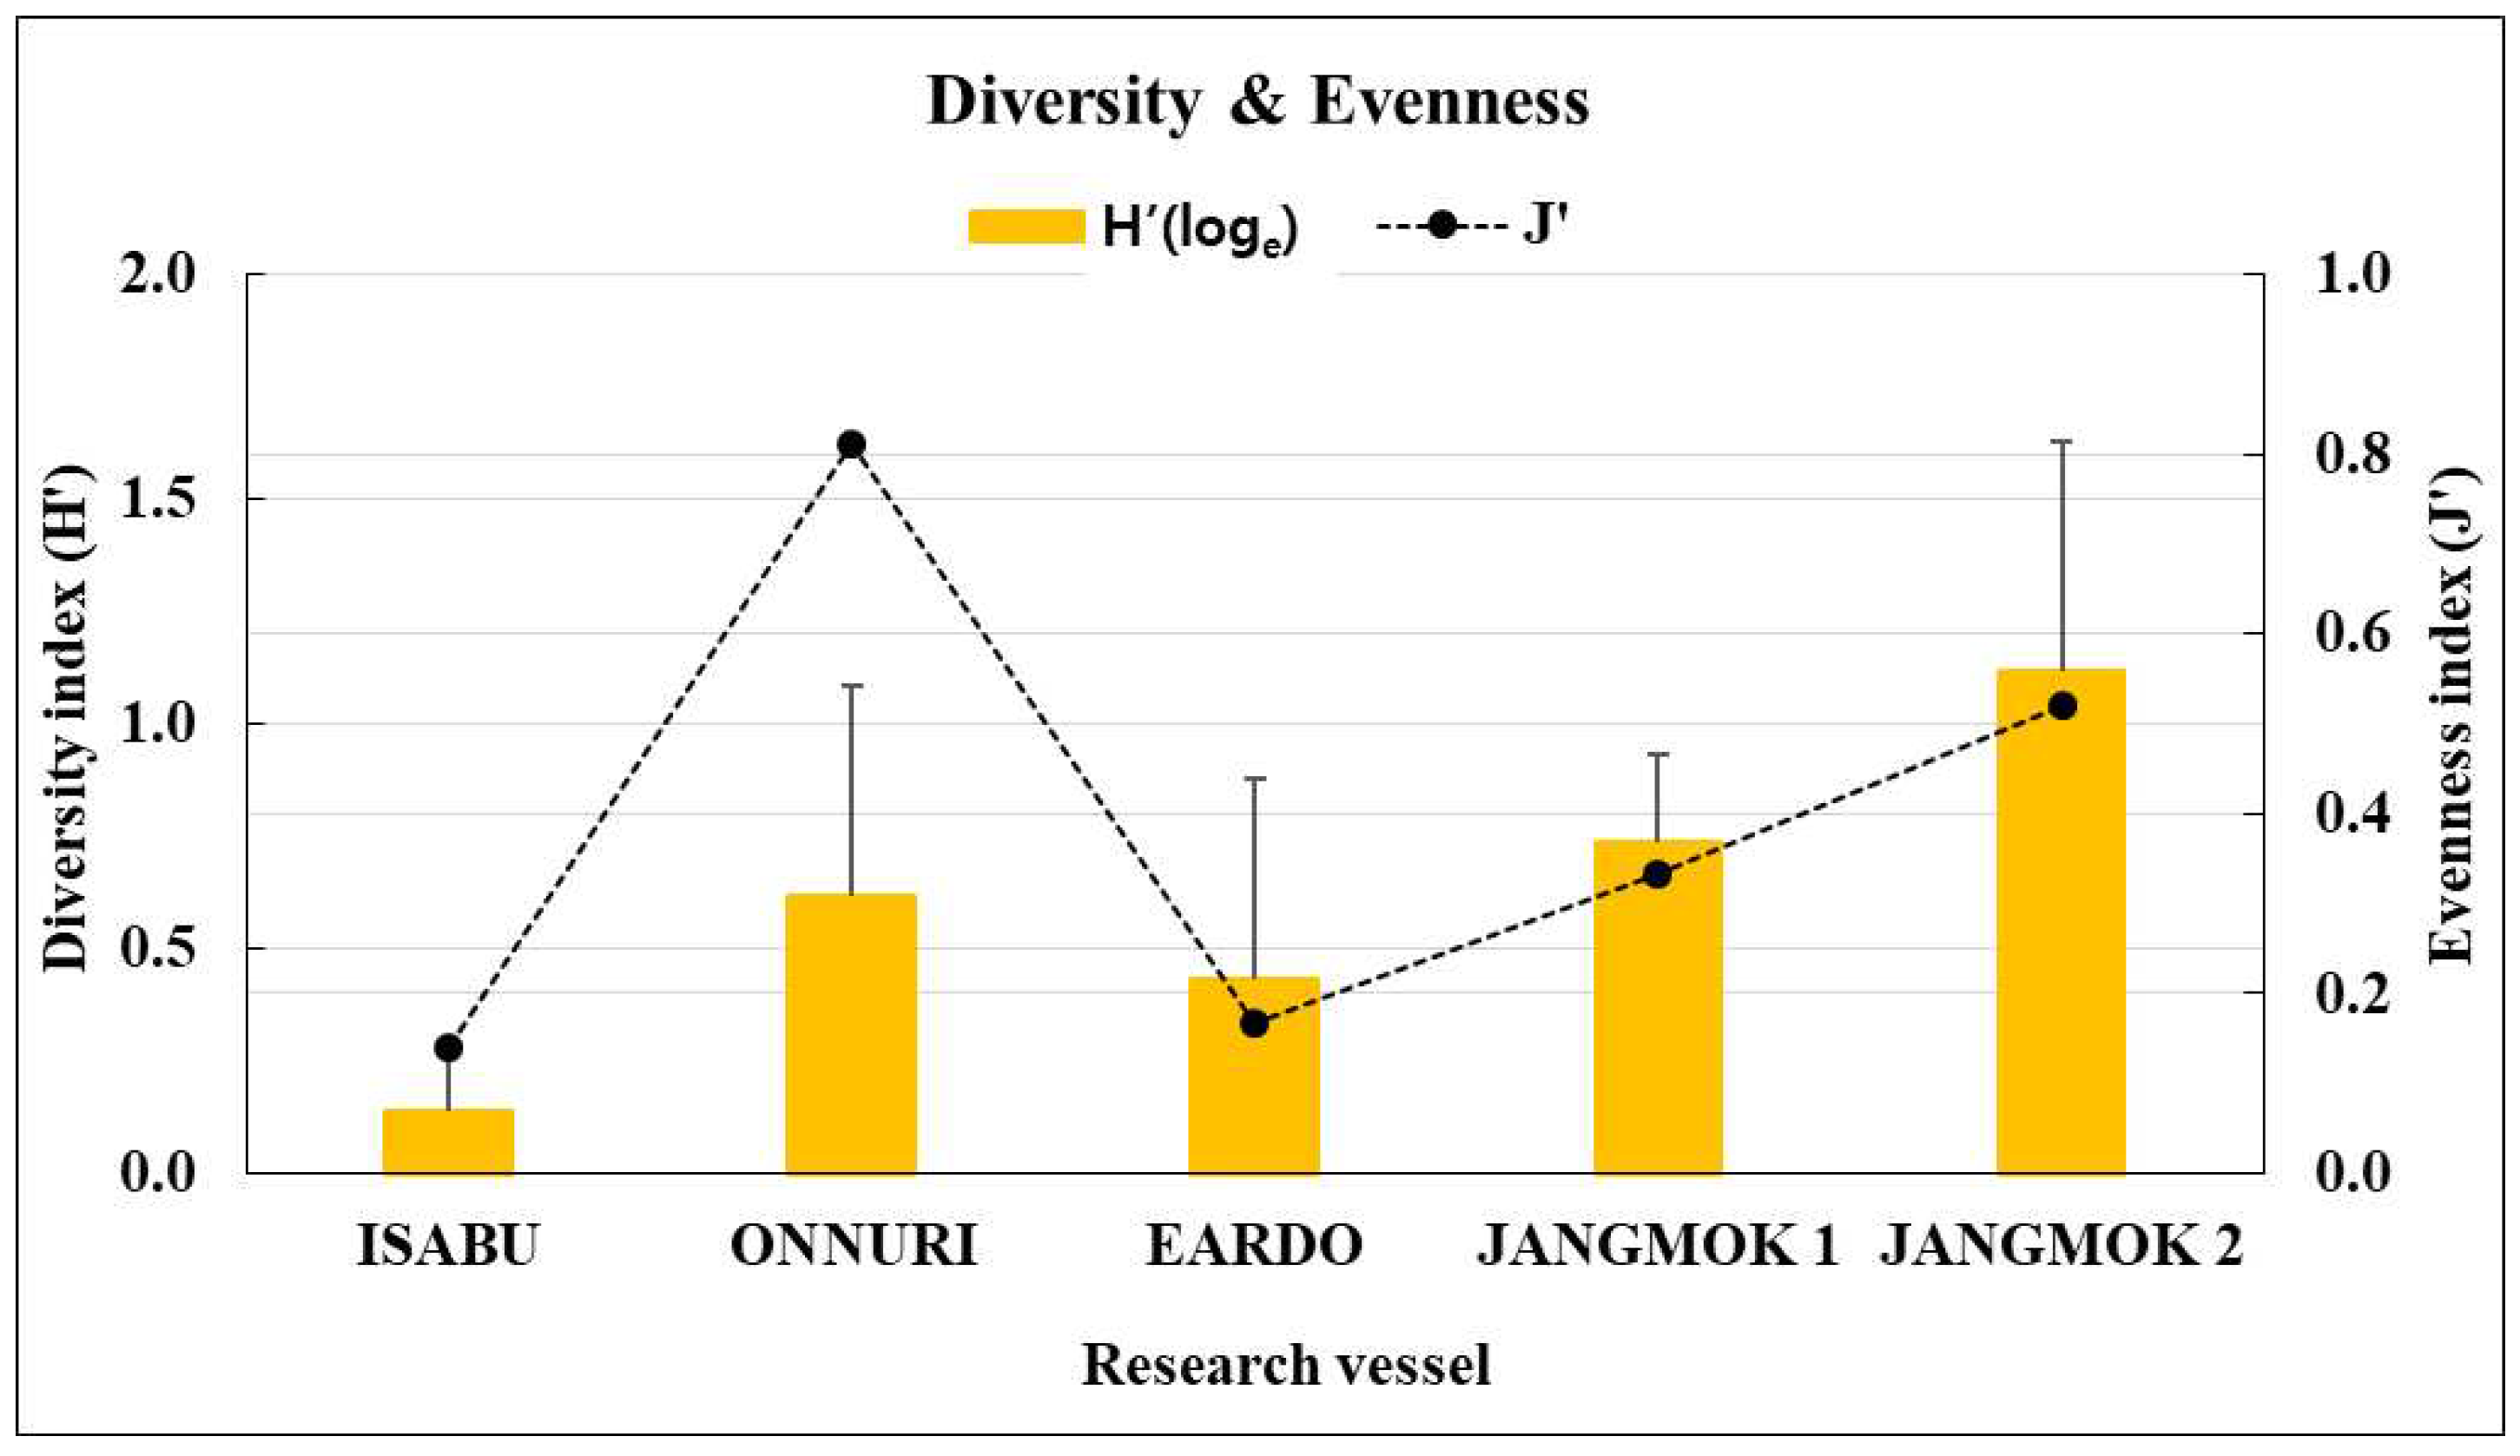
The Isabu hull-fouling macroinvertebrates included seven species, with a mean density of 2,516 ind./m2 and a biomass of 220 gWWt/m2. The taxa were only arthropods: four species of amphipods and three of cirripedes were found on the hull (Figure 4, Figure 5 and Figure 6). The mean density was significantly lower compared to that of the other vessels. The barnacle Amphibalanus amphitrite Darwin, 1854 was distributed across the hull and somewhat higher on the side of the hull. The barnacle Fistulobalanus kondakovi Tarasov and Zevina, 1957 was found in propeller shaft crevices (six individuals), and the lepad Conchoderma auritum Linnaeus, 1767 was discovered on the bottom of the hull (15 individuals). Amphipods Caprella equilibra Say, 1818 and Crassicorophium crassicorne Bruzelius, 1859 were also found in that sector (one of each), and one individual each of Monocorophium acherusicum A. Costa, 1853 and Pareurystheus anamae Gurjanova, 1952 were discovered on the side of the hull. The biomass was highest on the bottom of the hull where Conchoderma auritum Linnaeus, 1767 was distributed (Figure 7, Figure 8 and Figure 9). The major species (> density 1%) on Isabu were the barnacle A. amphitrite (96.9%), followed by the lepad C. auritum (1.9%), and the barnacle F. kondakovi (1%) (Figure 10 and Figure 11). The species diversity indices of hull-attached macroinvertebrates were lower than those of other vessels (average 0.14). The bottom of the hull exhibited a low value of 0.33, followed by the propeller and shaft niches (0.16) and the sides (0.03). The evenness indices were very low compared to those of the other vessels (average 0.14) but were relatively high (0.24) on the bottom of the hull and the propeller shaft (Figure 12).

3.2. ONNURI

The Onnuri hull-fouling macroinvertebrates included nine species, with a mean density of 1,856 ind./m2 and a biomass of 31 gWWt/m2. The taxonomic groups included five species of arthropod; the three barnacles A. amphitrite, Amphibalanus improvisus, and Balanus trigonus Darwin, 1854; amphipods Ericthonius pugnax Dana, 1852 and M. acherusicum; mollusks Magallana gigas Thunberg, 1793, Mytilus galloprovincialis Lamarck, 1819, and Hiatella arctica Linnaeus, 1767, and the polychaete Hydroides ezoensis Okuda, 1934. The mean densities were as follows: arthropods 1,786 ind./m2 (96.2%), mollusks 43 ind./m2 (2.3%), and polychaetes 27 ind./m2 (1.5%). Arthropods made up most of the biomass at 29 gWWt/m2 (93.7%), followed by polychaetes at 1 gWWt/m2 (3.4%), and mollusks at 0.9 gWWt/m2 (2.9%) (Figure 4, Figure 5 and Figure 6). By hull sector, nine species were on the bottom of the hull, and two were present on each of the middle of the hull sides and the niche areas (propeller and shaft). The mean densities on each hull sector were in the order of 5,913 ind./m2 for the bottom, 130 ind./m2 for the niche areas, and 29 ind./m2 for middle sector. The biomass was the highest on the bottom (27 gWWt/m2) and was low at 0.5 gWWt/m2 in the niche areas and 0.1 gWWt/m2 in the middle sector (Figure 7, Figure 8 and Figure 9). The major species (> density 1%) were the barnacles A. improvisus 870 ind./m2 (46.9%), A. amphitrite 732 ind./m2 (39.5%), and B. trigonus 177 ind./m2 (9.6%), followed by the polychaete H. ezoensis at 27 ind./m2 (1.4%), and the bivalves M. galloprovincialis at 27 ind./m2 and M. gigas at 10 ind./m2 (1.0%). The dominant species, A. improvisus and A. amphitrite, exhibited the highest densities on the bottom of the hull (Figure 10 and Figure 11). The Onnuri species diversity indices averaged 0.62, with a maximum of 1.13 on the bottom of the hull, 0.69 in the middle sector on one side, and 0.64 in the niche areas (propeller and shaft). The evenness indices averaged 0.61, being relatively high in the middle sector of the hull sides (1.00), 0.92 for the niche areas, and low on the bottom (0.52) (Figure 12).

3.3. EARDO

The Eardo hull-fouling macroinvertebrates included 25 species, with a mean density of 14,171 ind./m2 and a biomass of 3,736 gWWt/m2. The taxonomic groups included arthropods (11 species), mollusks (6), polychaetes (4), and other taxa (4). The mean densities were as follows: arthropods 12,408 ind./m2 (87.6%) (mostly barnacles), mollusks 1,424 ind./m2 (10.0%), polychaetes 220 ind./m2 (1.6%), and other taxa 120 ind./m2 (0.8%). The biomass was highest for mollusks (2,603 gWWt/m2) (69.7%), particularly bivalves; this was followed by the arthropods at 1,116 gWWt m2 (29.9%), other taxa at 12 gWWt/m2 (0.3%), and polychaetes at 6 gWWt/m2 (0.1%) (Figure 4, Figure 5 and Figure 6). By hull sector, there were 21 species in the niche areas (the aft propeller shaft), 12 species in the upper sector of the hull around the waterline, 6 species in the middle sector, and 2 species on the bottom. The mean densities by hull sector were 22,496 ind./m2 in the niche areas given the high density of B. trigonus, followed by 16,598 ind./m2 in the middle sector (principally A. amphitrite), 8,402 ind./m2 on the upper, and 4,754 ind./m2 on the bottom. The biomass by hull sector was highest at 10,231 gWWt/m2 in the niche areas (principally M. gigas and B. trigonus) followed by 1,732 gWWt/m2 in the upper sector (mostly M. galloprovincialis), 319 gWWt/m2 in the bottom sector, and 185 gWWt/m2 in the middle sector (Figure 7, Figure 8 and Figure 9). The six dominant species (>1%) were the barnacles A. amphitrite at 6,704 ind./m2 (47.3%) and B. trigonus at 5.266 ind./m2 (37.2%), the bivalves M. gigas at 1,065 ind./m2 (7.5%) and M. galloprovincialis at 342 ind./m2 (2.4%), the amphipod Jassa slatteryi Conlan, 1990 at 269 ind./m2 (1.9%), and the polychaete H. ezoensis at 190 ind./m2 (1.3%). By hull sector, the barnacle A. amphitrite dominated in the middle sector of the hull on both sides, and B. trigonus and M. gigas dominated in the niche areas on the propeller shaft (Figure 10 and Figure 11). The species diversity indices were low (average 0.43); the highest values were 0.90 in the niche areas and 0.73 on the upper sector around the waterline. The figures for the middle and bottom sectors were very low at 0.05 and 0.04. The evenness indices were also very low (average 0.17); the values for the upper and niche areas were 0.29 and 0.30 and those for the middle and bottom sectors were 0.03 and 0.05 (Figure 12).

3.4. JANGMOK 1

The Jangmok 1 hull-fouling macroinvertebrates included 19 species, with a mean density of 16,616 ind./m2 and a biomass of 3,937 gWWt/m2. The groups included arthropods (11 species), polychaetes (5), mollusks (2), and other taxa (2). The mean densities were as follows: arthropods 16,257 ind./m2 (97.8%) with many barnacles, mollusks at 178 ind./m2 (1.1%), polychaetes at 80 ind./m2 (0.5%), and other taxa at 101 ind./m2 (0.6%). The arthropod biomass was highest at 1,985 gWWt/m2 (50.4%), principally the barnacles A. amphitrite and A. improvisus, followed by the mollusks at 1,080 gWWt/m2 (27.4%) (mostly M. gigas), other taxa at 869 gWWt/m2 (22.1%), and polychaetes at 2.1 gWWt/m2 (0.1%) (Figure 4, Figure 5 and Figure 6). By hull sector, 12 species were on the bottom, followed by 11 in the middle sector of the hull side, 9 on the upper around the waterline, and 7 in the niche areas. The mean densities by hull sector were 23,246 ind./m2 in the middle and 20,246 ind./m2 on the bottom, attributable to the barnacles A. amphitrite and A. improvisus, followed by 12,029 ind./m2 in the bottom and 10,942 ind./m2 in the upper sectors. The biomass by hull sector was highest at 7,647 gWWt/m2 in the niche areas (mostly the bivalve M. gigas) followed by 3,589 gWWt/m2 in the middle sector and 2,822 gWWt/m2 in the bottom sector (many barnacles) (Figure 7, Figure 8 and Figure 9). The dominant species (density > 1%) were barnacles (three species), a bivalve (one species), and turbellarians (one species); the barnacles were A. amphitrite at 12,812 ind./m2 (77.1%), A. improvisus at 1,986 ind./m2 (11.9%), and B. trigonus at 1,380 ind./m2 (8.3%). The value for the bivalve M. gigas was 178 ind./m2 (1.1%), and that for Planocera reticulata was 98 ind./m2 (0.6%). All dominant species were on the hull. In particular, the most dominant, A. Amphitrite, was distributed at high densities on the sides and bottom; the values were 18,725 ind./m2 for the middle and 15,522 ind./m2 for the bottom; the densities in the upper and niche areas were lower at 9,348 and 7,652 ind./m2, respectively. The number of individuals of the second most-dominant species, A. improvisus, was 3,290 ind./m2 on the bottom (the propeller and shaft), 2,971 ind./m2 on the middle of the hull side, and 1,594 ind./m2 on the bottom of the hull. The number of individuals of the third most dominant species, B. trigonus, was 2,696 ind./m2 on the bottom, 1,391 ind./m2 in the upper area, and 1,159 ind./m2 in the middle. The number of individuals of the fourth most-dominant species (the bivalve M. gigas) was 464 ind./m2 in the niche areas on the propeller shaft (Figure 10 and Figure 11). The species diversity indices averaged 0.74, being highest at 0.97 for the niche areas, followed by 0.79 for the bottom, 0.68 for the middle, and 0.50 for the upper sector. The evenness indices were relatively high (average 0.33). The values were 0.50 for the niche areas, 0.32 for the bottom, 0.28 for the middle, and 0.23 for the upper sector (Figure 12).

3.5. JANGMOK 2

The Jangmok 2 hull-fouling macroinvertebrates included 18 species, with a mean density of 7,307 ind./m2 and a biomass of 1,801 gWWt/m2. The taxa were arthropods (seven species), other taxa (five), polychaetes (four), and mollusks (two). The mean densities were as follows: arthropods at 4,475 ind./m2 (61.2%) (many B. trigonus barnacles), followed by polychaetes at 1,720 ind./m2 (23.5%) (many of the serpulid polychaete H. ezoensis), mollusks at 1,053 ind./ m2 (14.4%) (many bivalves, i.e., M. gigas and M. galloprovincialis), and other taxa at 59 ind./m2 (0.8%). The biomass was the highest for mollusks (1,358 gWWt/ m2; 75.4%), principally the bivalves M. gigas and M. galloprovincialis. The values were 361 gWWt/m2 (20.1%) for the arthropods, 46 gWWt/m2 (2.5%) for other taxa, and 36 gWWt/m2 (2.0%) for the polychaetes (Figure 4, Figure 5 and Figure 6). By hull sector, there were 14 species in the upper sector around the waterline, 9 on the bottom, 8 in the middle, and 4 in the niche areas (propeller and shaft). The mean densities by hull sector were 21,580 ind./m2 on the bottom (many B. trigonus and H. ezoensis); meanwhile, the upper and bottom sectors exhibited relatively low densities of 4,449 and 5,333 ind./m2, respectively, and the middle sector had a very low density of 446 ind./m2. By hull sector, the biomass was the highest (2,814 gWWt/m2) in the niche areas (propeller and shaft) (principally M. gigas and B. trigonus). It was slightly lower for the upper sector (2,737 gWWt/m2, principally M. gigas and M. galloprovincialis) and at the bottom (1,508 gWWt/m2, mostly M. gigas, H. ezoensis, and B. trigonus). The value in the middle sector was very low (324 gWWt/m2) (Figure 7, Figure 8 and Figure 9). The dominant species (density > 1%) were the barnacle B. trigonus at 4,314 ind./m2 (59.0%), the polychaete H. ezoensis at 1,689 ind./m2 (23.1%), the two bivalves M. gigas at 780 ind./m2 (10.7%) and M. galloprovincialis at 273 ind./m2 (3.7%), and the amphipod J. slatteryi at 118 ind./m2 (1.6%). The density of B. trigonus was highest (13,217 ind./m2) in the niche areas and at the bottom (13,174 ind./m2) o the hull. The second dominant species H. ezoensis exhibited the highest density of 7,232 ind./m2 on the bottom and a density of 5,424 ind./m2 in the niche areas. The number of individuals of the third most dominant species, M. gigas, was 1,587 ind./m2 in the upper section of the hull waterline and 1,109 ind./m2 in the niche areas. See Figure 10, Figure 11 and Figure 12 for other data.

3.6. Non-Indigenous Species

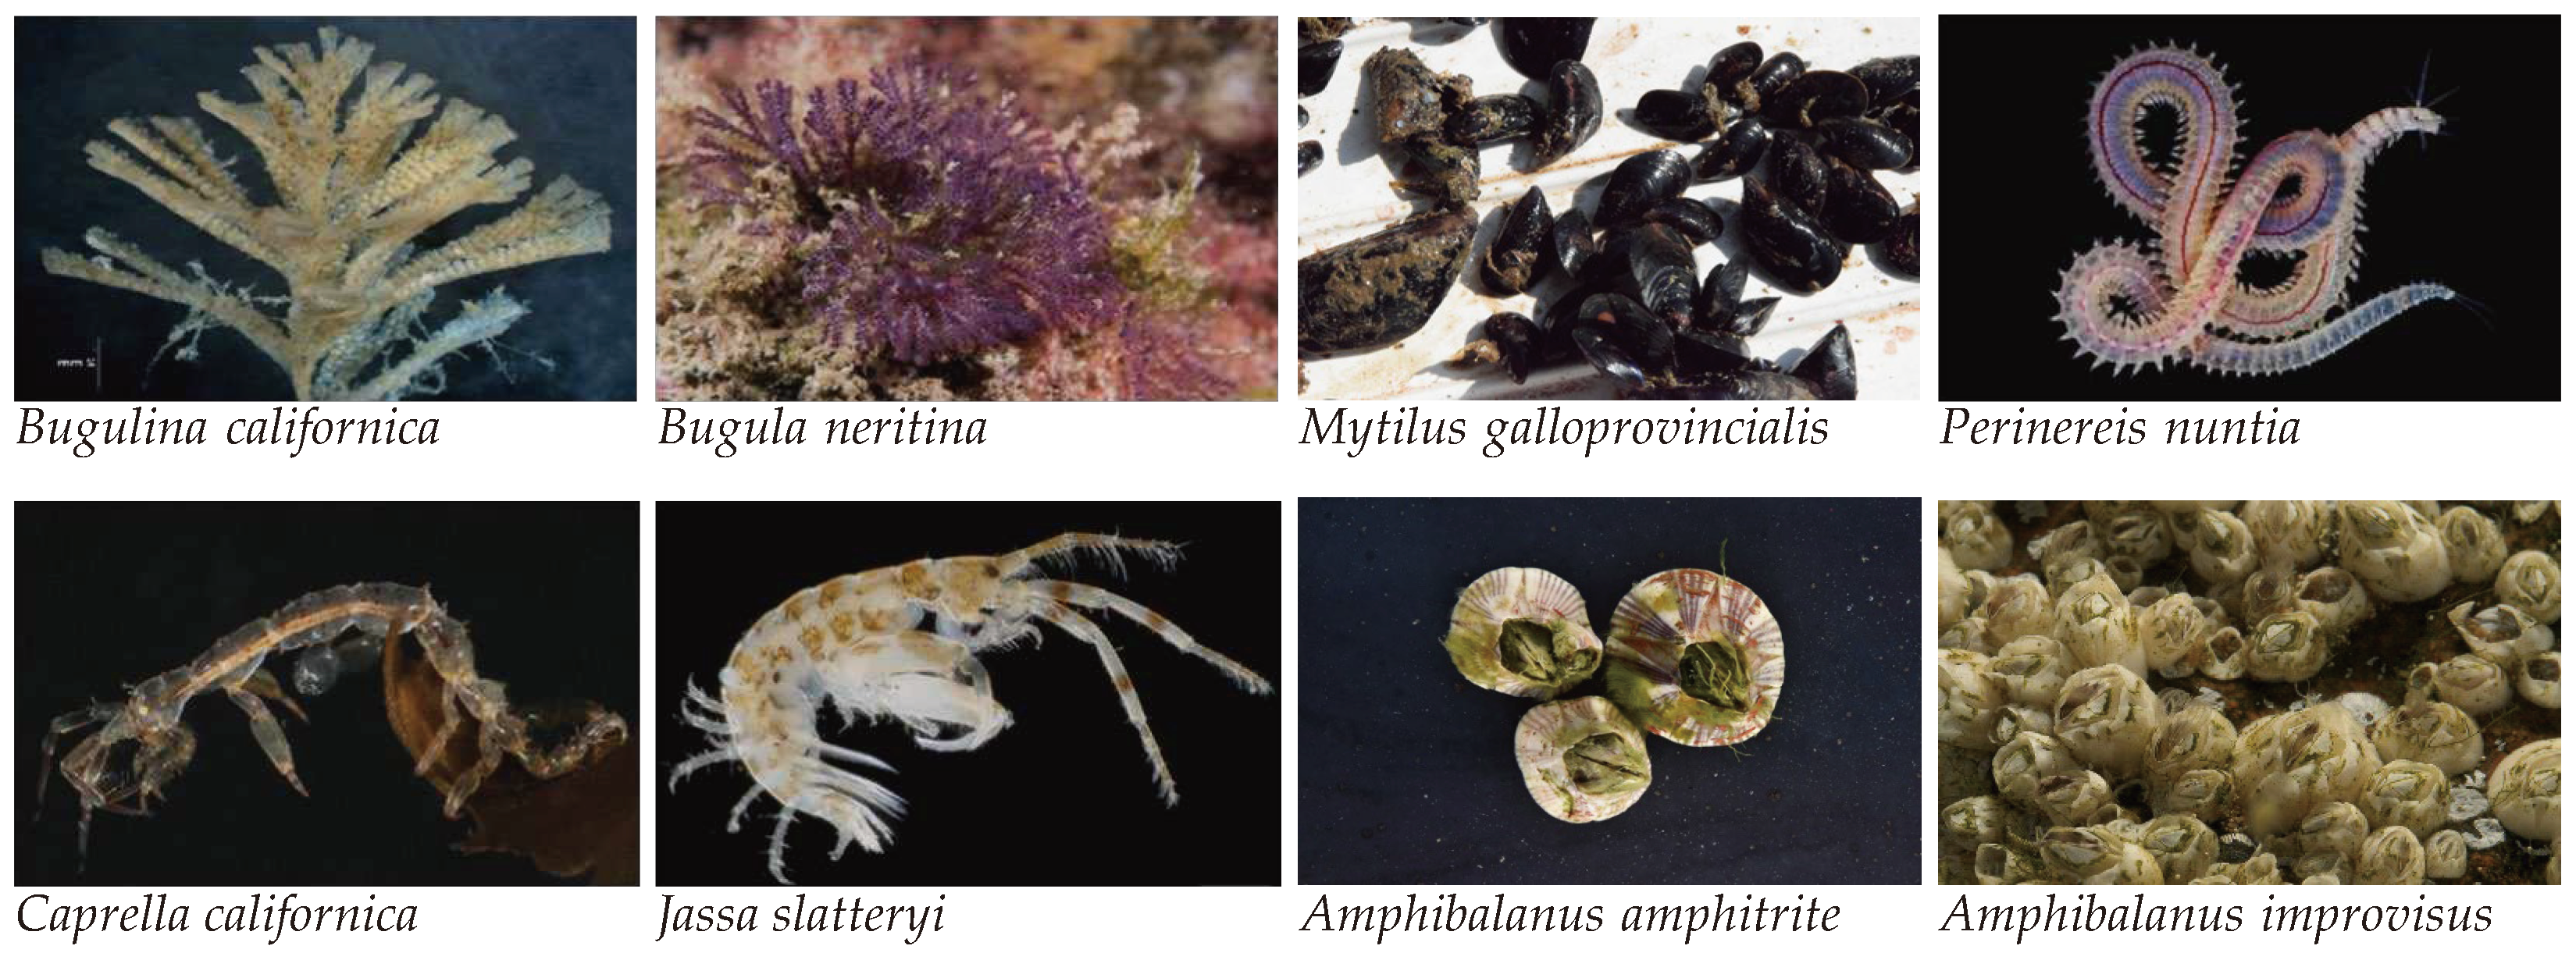
According to a report by MOF [27] based on a survey of several domestic ports, it was revealed that 26 marine benthic NIS, including animals and plants, were introduced into Korea (Table 4). Among these, five species appeared repeatedly in this survey: the bivalve M. galloprovincialis, barnacles A. amphitrite and A. improvisus, and bryozoans B. neritina and Celleporaria brunnea Hincks, 1884. However, among the 47 hull-fouling macroinvertebrates that appeared in this survey, six native species and eight NIS appeared (Table 5). The native species were the bivalve M. gigas, the polychaete H. ezoensis, the amphipod Melita koreana, the isopod Cirolana koreana, and the barnacles B. trigonus, and F. kondakovi. NIS (Figure 13) were the bryozoans Bugulina californica and B. neritina, the bivalve M. galloprovincialis, the polychaete Perinereis nuntia, the amphipods Caprella californica and J. slatteryi, and the barnacles A. amphitrite and A. improvisus. Non-indigenous barnacle species, i.e., B. trigonus and F. kondakovi, appeared in abundance on the hulls of the ocean-going vessels the Isabu and Onnuri and the coastal vessels the Eardo and local the Jangmok 1. In addition, the bivalve M. galloprovincialis and amphipod J. slatteryi appeared in abundance on the hull of the coastal–local the Jangmok 2. Among the 47 species of fouling macroinvertebrates that were found on the hulls of five vessels, native species accounted for 13% and NIS accounted for 17%.
Table 4. List of marine benthic non-indigenous species introduced into Korea reported by MOF [27]. Among the 26 species listed, 5 species (★) were identified in this study. Asterisks indicate the bivalve M. galloprovincialis, the barnacles A. amphitrite and A. improvisus, and the bryozoans B. californica and B. neritina.
No. Taxa Class, Family Non-Indigenous Species This Study
1 Porifera Halichondriidae Halichondria bowerbanki Bruton, 1930
2 Cnidaria Hydrozoa Ectopleura crocea Allman, 1872
3 Cnidaria Hydrozoa Bougainvillia muscus Allman, 1863
4 Cnidaria Hydrozoa Obelia dichotoma Linnaeus, 1758
5 Mollusca Gastropoda Crepidula onyx G.B. Sowerby I, 1824
6 Mollusca Bivalvia Mytilus galloprovincialis Lamarck, 1819
7 Arthropoda Cirripedia Amphibalanus amphitrite Darwin, 1854
8 Arthropoda Cirripedia Balanus perforatus Brugiere, 1789
9 Arthropoda Cirripedia Balanus eburneus Gould, 1841
10 Arthropoda Cirripedia Amphibalanus improvisus Darwin, 1854
11 Bryozoa Bugulidae Bugulina californica Robertson, 1905
12 Bryozoa Bugulidae Bugula neritina Linné, 1758
13 Bryozoa Bugulidae Celleporaria brunnea Hincks, 1884
14 Bryozoa Schizoporellidae Schizoporella unicornis Johnston, 1847
15 Bryozoa Candidae Tricellaria occidentalis Trask, 1857
16 Chordata Ascidiidae Ascidiella aspersa Müller, 1776
17 Chordata Cionidae Ciona intestinalis Lessueur, 1823
18 Chordata Clavelinidae Clavelina lepadiformis Müller, 1776
19 Chordata Molgulidae Molgula manhattensis De Kay, 1843
20 Chordata Styelidae Styela plicata Lessueur, 1823
21 Chlorophyta Ulvaceae Ulva lactuca Linnaeus, 1753
22 Chlorophyta Ulvaceae Ulva laetevirens Areschoug, 1854
23 Chlorophyta Ulvaceae Ulva prolifera O.F.Müller, 1778
24 Rhodophyta Ceramiaceae Antithamnion kylinii N.L.Gardner, 1927
25 Rhodophyta Ceramiaceae Antithamnionella ternifolia (Hooker f. & Harvey) Lyle, 1922
26 Ochrophyta Chordariaceae Striaria attenuata Greville, 1828
Table 5. List of native and non-indigenous species found among 47 species of hull-fouling macroinvertebrates in this study. The numbers are the sum of the number of individuals of macroinvertebrate species attached to the hull of each vessel. Asterisks indicate six native and eight non-indigenous species.
No. Phylum Sub Taxa Abbre. Species Isabu Onnuri Eardo Jangmok 1 Jangmok 2 Native Non-indigenous Species
1 Bryozoa Bugulidae Bry Bugulina californica 1 9
2 Bryozoa Bugulidae Bry Bugula neritina 1
3 Cnidaria Actiniaria AAc Heteranthus japonicus 1
4 Cnidaria Hydrozoa CHy Sertulariidae unid. 3
5 Mollusca Gastropoda MGa Cheilea cepacea 1
6 Mollusca Bivalvia MBi Hiatella arctica 2 1
7 Mollusca Bivalvia MBi Magallana gigas 3 392 49 251
8 Mollusca Bivalvia MBi Modiolus kurilensis 1
9 Mollusca Bivalvia MBi Musculus senhousia 3
10 Mollusca Bivalvia MBi Mytilus galloprovincialis 8 126 88
11 Annelida Polychaeta APol Eteone longa 1 1
12 Annelida Polychaeta APol Hydroides ezoensis 8 70 544
13 Annelida Polychaeta APol Marphysa sanguinea 1
14 Annelida Polychaeta APol Nereis multignatha 9 15 7
15 Annelida Polychaeta APol Nereis pelagica 2
16 Annelida Polychaeta APol Perinereis nuntia 1
17 Annelida Polychaeta APol Platynereis bicanaliculata 1
18 Annelida Polychaeta APol Polydora sp. 1
19 Annelida Polychaeta APol Syllis sp. 4
20 Crustacea Amphipoda CAm Apocorophium acutum 11
21 Crustacea Amphipoda CAm Caprella californica 5
22 Crustacea Amphipoda CAm Caprella equilibra 1
23 Crustacea Amphipoda CAm Crassicorophium crassicorne 1
24 Crustacea Amphipoda CAm Ericthonius pugnax 1 2 1
25 Crustacea Amphipoda CAm Jassa slatteryi 99 38
26 Crustacea Amphipoda CAm Marea sp. 4
27 Crustacea Amphipoda CAm Melita hoshinoi 1
28 Crustacea Amphipoda CAm Melita koreana 1
29 Crustacea Amphipoda CAm Monocorophium acherusicum 1 1 4 1
30 Crustacea Amphipoda CAm Pareurystheus anamae 1
31 Crustacea Amphipoda CAm Photis reinhardi 1
32 Crustacea Isopoda CIs Cirolana koreana 10 12 1
33 Crustacea Isopoda CIs Dynoides dentisinus 1
34 Crustacea Isopoda CIs Paranthura japonica 1
35 Crustacea Cirripedia CCi Amphibalanus amphitrite 785 219 2,467 3,536
36 Crustacea Cirripedia CCi Amphibalanus improvisus 260 7 548
37 Crustacea Cirripedia CCi Balanus trigonus 53 1,938 381 1,389
38 Crustacea Cirripedia CCi Conchoderma auritum 15
39 Crustacea Cirripedia CCi Fistulobalanus kondakovi 6
40 Crustacea Cirripedia CCi Lepas anatifera 1
41 Crustacea Decapoda CDe Hemigrapsus sinensis 1
42 Crustacea Decapoda CDe Philemnus minutus 1
43 Crustacea Tanaidacea CTa Zeuxo sp1 26 6
44 Chordata Tunicata CTu Ascidia sp. 2
45 Chordata Tunicata CTu Pyura sp. 32
46 Chordata Tunicata CTu Styela clava 9 4
47 Platyhelminths Planoceridae Plat Planocera reticulata 2 27
No. of species 7 9 25 19 18 6 8
No. of individuals (ind.) 817 564 5,240 4,605 2,371
Biomass (gWWt) 70.9 9.4 1,374.9 1,086.5 579.8
No. of samples (15х15 cm) 14 13 16 12 14

3.7. Community Analysis

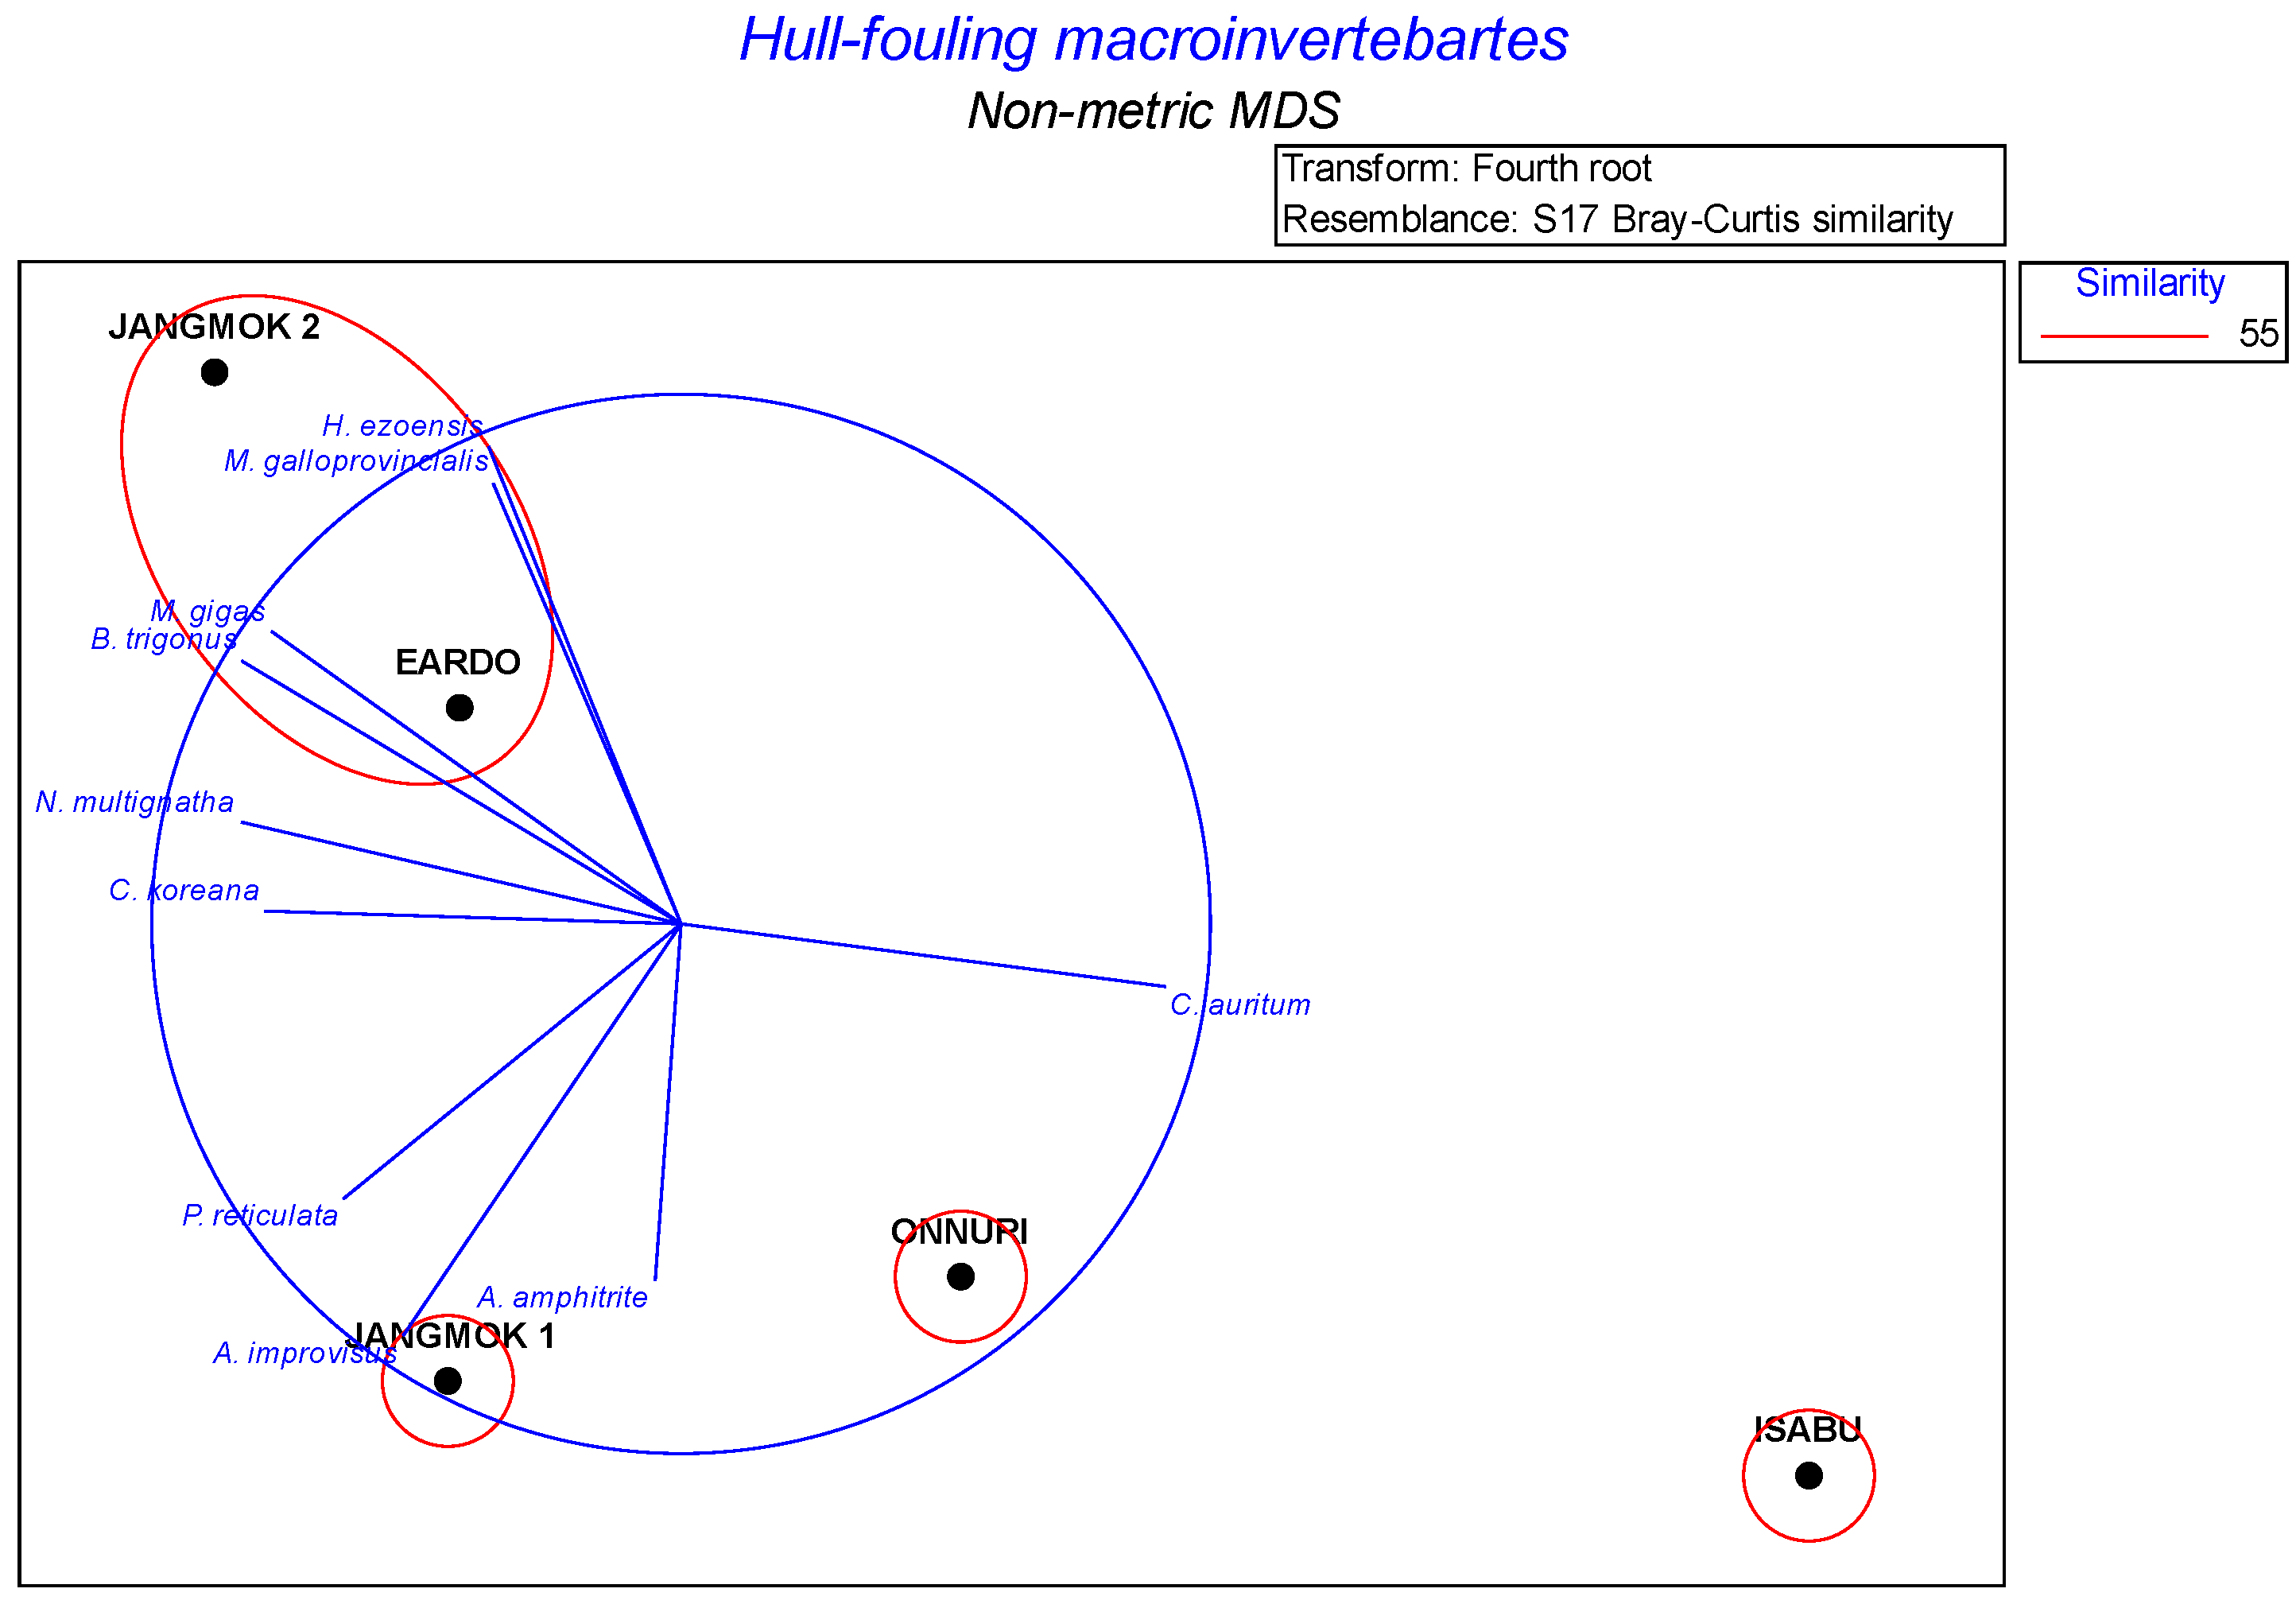
Sixty-nine samples of macroinvertebrates attached to the hulls of five research vessels were analyzed. The raw abundance data were transformed (fourth-root), and a Bray–Curtis similarity matrix was created. A similarity profile (Simprof test) test was used for hierarchical cluster analysis to test the similarity matrix; the resulting index indicating the extent of faithful representation in multidimensional space was appropriate (cophenetic correlation 0.88, range 0-1). The nMDS ordination analysis of the five vessels revealed four clusters of fouling invertebrate communities (ANOSIM global R-value: 0.90, p < 0.001): two ocean clusters (the Isabu and Onnuri), one coastal cluster (the Eardo and Jangmok 2), and one local cluster (the Jangmok 1). Vector and species overlays were produced using Pearson correlations between the species’ variables and the ordination MDS 1 and MDS 2 axes. This is offered purely as an exploratory tool to visualize potential linear or monotonic relationships between a given set of variables and ordination axes (Figure 14).
SIMPER analysis was performed to identify the contribution of each species to the dissimilarity between the vessel communities. As a result, the following species were identified that contributed most to community composition. The Isabu and Onnuri (group av. dissimilarity: 69.0%): A. improvisus (18.6%), B. trigonus (12.5%), Conchoderma auritum (9.1%); the Isabu and Jangmok 1 (group av. dissimilarity: 75.5%): A. improvisus (12.5%), B. trigonus (11.4%), M. gigas (6.8%), A. amphitrite (6.2%); the Isabu and Eardo and Jangmok 2 (group av. dissimilarity: 90.6%): B. trigonus (12.3%), M. gigas (8.1%), H. ezoensis (7.7%), A. amphitrite (7.3%), M. galloprovincialis (6.2%); the Onnuri and Jangmok 1 (group av. dissimilarity: 51.3%): A. amphitrite (13.2%), Planocera reticulata (7.8%), Nereis multignatha (6.7%), Cirolana koreana (6.4%), B. trigonus (5.9%); the Onnuri and Eardo and Jangmok 2 (group av. dissimilarity: 51.3%): B. trigonus (8.9%), A. amphitrite (8.8%), A. improvisus (8.1%); and the Jangmok 1 and Eardo and Jangmok 2 (group av. dissimilarity: 61.6%): A. amphitrite (8.9%), A. improvisus (8.0%), H. ezoensis (7.7%), and M. galloprovincialis (6.2%) (Table 6).
One-way ANOSIM was performed to test the null hypothesis that there were no significant differences within the macroinvertebrate communities among the vessels without considering clusters divided by nMDS analysis (Global R-value: 0.532, p < 0.001). In the pairwise test, the Isabu cluster showed differences from the Onnuri cluster (R = 0.34, p < 0.05), the Jangmok 1 cluster (R = 1.0, p < 0.05), and the Jangmok 2 cluster (R = 1.0, p < 0.05). The Onnuri cluster showed differences from the Jangmok 1 cluster (R = 0.32, p < 0.05) and the Jangmok 2 cluster (R = 0.39, p < 0.05). The Eardo cluster showed differences from the Jangmok 1 cluster (R = 0.46, p < 0.05) and the Jangmok 2 cluster (R = 0.64, p < 0.05). Additionally, the Jangmok 1 and Jangmok 2 clusters were different (R = 1.0, p < 0.05). However, pairwise tests showed no significant differences between the Isabu and Eardo clusters (R = 0.35, p > 0.05) and the Onnuri and Eardo clusters (R = 0.08, p > 0.05) (Table 7); R-values in the range of 0.25 < R < 0.5 means differences with some overlap, and 0.5 < R means differences between clusters.
Spearman rank correlations were analyzed between the biological indices and vessel operating conditions (Table 8). Operating conditions were analyzed using one year’s operating records for the five vessels, which included the total operation days (TODs): the Isabu, 219; the Onnuri, 165; the Eardo, 180; the Jangmok 1, 141; the Jangmok 2, 138; total anchoring days (TADs): the Isabu, 146; the Onnuri, 200; the Eardo, 185; the Jangmok 1, 224; the Jangmok 2, 227; coastal operation days (CODs): the Isabu, 157; the Onnuri, 255; the Eardo, 365; the Jangmok 1, 365; the Jangmok 2, 365; and ocean operation days (OODs): the Isabu, 208; the Onnuri, 110; the Eardo, 0; the Jangmok 1, 0; the Jangmok 2, 0 (Table 3). The biological indices such as the number of species, number of individuals, and biomass correlated highly and positively with the number of days of coastal operation and negatively with the number of days of ocean operation. The species diversity index (H’) correlated positively with the total numbers of anchoring and coastal operation days and negatively with the total numbers of operation days and ocean operation days.

4. Discussion

4.1. Hull-Fouling Macroinvertebrates

Meloni et al. [32] reported that more samples and species were collected in dry docks than in water. Therefore, it was expected that many samples would be lost underwater, and the conditions for underwater collection were not favorable, so collection was conducted in dry docks. It is assumed that hull-attached organisms that are collected before cleaning and are subsequently removed with high-pressure water through the washing process will die or be discharged into the surrounding marine ecosystem [30]. In this study, 47 species of hull-fouling macroinvertebrates were identified, represented by 8,519 ind./m2 and a biomass of 1,967 gWWt/m2. The 47 species of macroinvertebrates (Table 5) that appeared in this study were slightly higher than the 6–42 species found on ship hulls operated in the Far East basin, as reported by Moshchenko and Zvyagintsev [21,22].
In terms of density, the barnacles were the most numerically abundant on all surveyed vessels and were dominated by the suspension- or filter-feeding barnacles: A. amphitrite, B. trigonus, and A. improvisus. In particular, barnacles are greatly resistant to dislodgement by currents and waves as their adhesion strength is very high (0.02 MPa in juveniles to over 2.00 MPa in adults), although variable depending on the substratum, species, and age/size of the individuals [17,18,47]. These results are believed to be one of the reasons why barnacles, along with attached organisms, take over ship hulls and spread worldwide.
Relatively more species, individuals, and biomass were found on coastal-operated hulls than on ocean-going vessels. Conversely, the ocean-going the Isabu and Onnuri with fewer anchorage days exhibited low values. In particular, the coastal-operated Eardo and the local-operated the Jangmok 1 hulls, which had 151 and 186 long anchorage days in the South Sea with high average annual water temperature of 15.7–18.8°C [48], had high biomass, driven by the bivalve mollusk M. gigas and the barnacle A. amphitrite. Conversely, the hull of the coastal- and local-operated the Jangmok 2, which had a long stationary period of 115 days in the East Sea with a low average annual water temperature of 8.6–15.9°C, had a low number of individuals and biomass [48,49,50]. These results suggest that prolonged port stays of ships increase the risk of fouling attachment to the hulls [29,51,52,53], and that seawater temperature is a major geographical determinant of the composition of marine communities, including biofouling composition, influencing the spawning period, settlement, growth, and reproduction of organisms [54]. In addition, it was confirmed through settlement plate experiments that salinity and port significantly affect the composition of the fouling assemblages [55]. However, prolonged ocean operations may reduce biofouling by creating low-food, high-flow conditions that stress hull-adhering organisms [52,56].
The attachment state of hull-fouling macroinvertebrates shows different distribution patterns depending on the sectors of the hull. Submerged sections and niche areas (i.e., in the cavities and metallic parts) of the hull were the best predictor for NIS abundance on ships [12,13]. Studies on these hull sections and niche areas may show differences in attached organisms depending on the various operating conditions of the ship [12,13,52,53,57]. This study also showed similar results. the Eardo, operating in coastal areas, exhibited very high biomass on the propeller shaft, with organisms more commonly attached to the niche areas than to the hull. However, the Jangmok 1 (141 days of operation, 224 days of anchorage), which operates in the warm southern seas, had a high number of species and individuals on the side and bottom of the hull. The Jangmok 2 (138 days of operation, 227 days of anchorage), which operates in the East Sea in low water temperatures, had a high number of species on the sides of the hull and individuals on the bottom of the hull (Table 3, Figure 7-9). Therefore, it is highly likely that the attachment pattern of hull-fouling macroinvertebrates will vary depending on the vessel’s operating area, anchorage port, number of anchorage days, and hull sector.

4.2. Dominant and Non-Indigenous Species

Eight non-indigenous species were found on the hulls of the five vessels during the survey periods (Table 5). The 26 marine benthic non-indigenous species reported in Korea (Table 4) [27] include all animals and plants attached on floating structures, rocks, nets, etc., in 19 domestic ports with frequent ship traffic, while the eight species in this study can be understood through difference in research results for only hull-attaching organisms. Among these, the barnacles A. amphitrite and A. improvisus were abundantly distributed on the hulls of the ocean-going the Isabu and Onnuri. In addition, A. amphitrite is widely distributed in Korea, with many individuals found on the hulls of the coastal-operated the Eardo and Jangmok 1, which operates in ports and bays. Non-native species are believed to have already been introduced, settled, and widely distributed in the country. In this study, 47 species, of which 13% were native and 17% were non-indigenous, were found, which is lower than the 150 species, of which 40% were native and 25% were introduced and non-indigenous in New Zealand [14], which are located at the same mid-latitude. This aspect can be attributed to differences in the number and duration of survey vessels.
Most of the dominant and non-indigenous species that are attached to the hull and spread worldwide are known to be highly adaptable to environmental changes such as temperature, salinity, flow rate, space, competition, substrate, etc. [29]. Based on the track records of research vessels in tropical to temperate regions (Figure 2), the main hull-fouling macroinvertebrates listed in Table 5 are presumed to be highly adaptable to changes in water temperature and salinity [58,59,60]. Spawning may be induced by changes in temperature or salinity upon entry into a port, according to seasons [50,54,55,61]. If the spawning season of the attached organisms does coincide with the time the ship anchors and stays in port, they will be able to settle. Therefore, organisms can be spread by ships that frequently enter and leave domestic and foreign ports [62]. In addition, species that are resistant to various environmental conditions, such as water temperature and salinity in the anchorage areas, and have a strong survival capacity can successfully colonize, so these species will attach to the hull of the ship and play the role of invaders [63,64]. Sessile taxa can withstand high water velocities and protect adjacent mobile organisms from water forces, increasing introduced species diversity [52,65]. It is true that most dominant species have various geographical distribution forms and are spread widely around the world, so there are limits to determining whether they are native and non-indigenous species. Nevertheless, this study attempted to distinguish only hull-fouling macroinvertebrates (Table 5, Figure 13).
The most dominant, barnacle Amphibalanus amphitrite Darwin, 1854 [66], was once found in the cenozoic stratum of Japan [67], but then disappeared and reappeared in the Far East [68]. However, the organism is now found in the intertidal zones of southeastern Korea. It has been introduced to tropical/warm-temperate waters worldwide, primarily via hull fouling, and possibly also with oyster M. gigas shipments or in ballast water [69]. As early as 1854, Darwin noted that this species and a few other barnacles “which seem to range over nearly the whole world (excepting the colder seas)” could have been transported to some regions via ship fouling [70]. This species was absent from Korea before 1970 but is now the most widespread species along the entire coast, including brackish waters. It was introduced in ballast water or on hulls in the early 1970s when international trade began to increase; it was the first introduced species found in Korea [70]. A. amphitrite competes with the native barnacle Fistulobalanus albicostatus; in some parts of the southern coast, F. albicostatus is disappearing [19]. A previous study [71] reported that A. amphitrite was the dominant sessile species on artificial submerged polyvinylchloride (PVC) substrates from June to September in Jangmok Bay, Geoje Island, southern Korea. In our study, A. amphitrite dominated on four of the research vessels, but not on Jangmok 2, which operates mainly in the Korean East, West, and South seas; the longest stay at an East Sea port was 115 days. In particular, A. amphitrite was present at high densities on the sides of the hull of the Eardo and the bottom of the Jangmok 1 but at low densities on the hulls of the Isabu and Onnuri. This species is thought to have spread along the entire Korean coast [71].
The barnacle Balanus trigonus Darwin, 1854 [66] is a cosmopolitan species; large numbers have been observed on the spiny lobster Panulirus gracilis in western Mexico [72]. In the eastern Pacific, it spreads from Monterey, California, to Peru, including the entire Gulf of California [73]. It does not appear to have been in the Atlantic Ocean basin prior to the 1850s. These common fouling barnacles may have been introduced to the South Atlantic by ships from the Pacific and Indian oceans sailing via Cape Horn and the Cape of Good Hope [74]. This species is endemic to the Indo-Pacific region and is known to be an opportunistic fouling species. Therefore, it is likely to be a native species. On the New Zealand coast, B. trigonus is an opportunistic species that attains sexual maturity within 14 days; the high growth rate, early maturity, and high predation level are associated with a short generation time and high population turnover [75]. In the laboratory, the time from the newly hatched nauplius stage to the cyprid stage is 9–13 days (average 11 days) [76]. B. trigonus juveniles settle on hulls when ships visit tropical ports [77]. The densities were high in the niche areas and bottoms of the Eardo, Jangmok 1, and Jangmok 2, but the species was not found on the hull of the Isabu. In general, B. trigonus attaches at high densities to objects in lower intertidal zones, underwater structures, fishing nets, and the shells of mussels in shallow water, which is clear and warm along all Korean coasts.
The barnacle Amphibalanus improvisus Darwin, 1854 [66] is found in temperate and tropical oceans from the Atlantic coasts of America to Europe. It is not known where the species originated, perhaps North America or Europe [78]. The organism has colonized many oceans, including Indo-Pacific and Australasian waters, via ship biofouling [79]. The organism has been reported from underwater structures in brackish lakes (salinity 8 psu) of the eastern coast of the South Sea and in an East Sea port; in the mid-1980s, it was found at high levels in the brackish Lake Jumunjin of the Korean East Coast. The organism attaches to oyster/mussel culture frames and powerplant drains. In the future, it is likely to spread to western coastal areas, posing a risk to native species; continuous monitoring and management are necessary [70,80]. We found that this species was most common on the bottom of the Onnuri but the entire hull (principally the propeller and shaft) of the Jangmok 1; it was absent from the Isabu and Jangmok 2. The reason why it was present in high amounts on the bottom of the Onnuri is probably because the amount of adhesion increased as seawater was sucked in from the bottom intake part. The average annual water temperatures in South Korea are 8.6–15.9°C on the east, 10.9–14.9°C on the west, and 15.7–18.8°C on the south coasts [48]. The Jangmok 2 anchored for 34 days in the West Sea, where the current is strong and the average tidal difference is 7 m, and for 115 days in the East Sea, where the water temperature is low. Therefore, hull larval settlement was unlikely.
The polychaete Hydroides ezoensis Okuda, 1934 [81] is a tube-forming annelid that is native to the temperate Northern Pacific, Northwest Pacific, and the central Indo-Pacific; it is widely distributed in the intertidal zone and on submerged rocks, shells, and hulls in Korea, Russia, China, and Japan [82]. This species was first described in 1934 in waters around Hokkaido, Japan, but later became established in seas around Great Britain [83] and Australia. Therefore, this species is likely to be native to Korea. It commonly adheres to hulls, docks, industrial water intakes, aquaculture facilities, and sometimes muddy gravel substrates. It was first recorded in Geomun-do and Baek-do in the South Korean Sea in 1978 [84] and spawns from April to December. The trochophore larvae hatch 20 h after fertilization and settle 6 days later [85]. The species forms calcareous tubes on the shells of oysters in hanging cultures (damaging the oysters) [86] and is the dominant sessile species on artificial PVC substrates from May to October in Jangmok Bay, Geoje Island, southern Korea [71]. We found that this species dominated the bottom seawater intake plate and propeller shaft of the Jangmok 2 and was also found (in lower numbers) on the hulls of the Onnuri and Eardo. The larvae of this species settle in regions with good water flow and water temperatures above 10–11°C. Off Pohang, in the southern part of the Korean East Sea, this temperature is maintained from mid-April to mid-December [85]. Therefore, if a vessel is anchored in port at this time, the likelihood of attachment increases.
The bivalve Magallana gigas Thunberg, 1793 [87] grows rapidly and tolerates a wide range of environmental conditions (temperature 1.8–35℃; salinity 20–38 psu). It originated in the Northwest Pacific in Korea, China, and Japan but spread to the west coast of the United States in the 1920s and western Europe in the 1960s, attached to hulls and in ballast water [88]. In Korea, the hanging culture of M. gigas commenced in the 1930s and increased in 1969. Spawning off the coast of Korea is optimal at a water temperature of 23–25℃ and thus occurs from the end of May to the end of October. Settling occurs within 2 weeks of hemiplankton hatching; copper (Cu) ions (at 0.05–0.06 mg/L in seawater) facilitate settlement [89]. M. gigas was extensively attached to the propeller shaft of the Eardo and to the entire hull of the Jangmok 2. We presume that, when the vessels were anchored, the water temperature and salinity allowed the organism to attach to propeller shafts (which lack protective paint) and settle and grow around the hole on the side of the hull from which organic matter is discharged.
Non-indigenous species, such as the bivalve Mytilus galloprovincialis Lamarck, 1819 [90], are widely distributed from the temperate to the subarctic coasts of both the Northern and Southern Hemispheres and often dominate the hard substrates of intertidal and nearshore habitats. This species was introduced to the coasts of Korea, Japan, Vladivostok in Russia, and the northern Pacific from Europe via human activity in the early 20th century [27]. This mussel is confined to submerged artificial substrates from March to April and becomes dominant in July [71]. It excludes other macroalgae recruiters by overgrowing them to occupy the entire substrate surface and maintains a high population density by preventing the settlement of other species until late autumn [71]. It has replaced the native Korean bivalve M. unguiculatus (Valenciennes, 1858) and prevents the attachment of the ascidiacean Halocynthia roretzi [91]. On the Eardo and Jangmok 2 operating along domestic coasts, the organism was densely distributed in the drainage holes on the hull sides, and many individuals were noted in the propeller shaft cover of the Eardo. The organism may optimally settle and grow when seawater over a substrate is stirred.
The amphipod Jassa slatteryi Conlan, 1990 [92] was first recorded on the propeller of an international trader of the Hanjin Shipping Company; it differs from the native Jassa falcata [93] of the southern Korean coast [94]. This hull fouler is also found in ballast water. The life history pattern is annual and iteroparous; there are two principal juvenile recruitment periods during the year, namely, spring (March to May) and fall (October to December) [95]. The organism was principally found on the hull side of the Eardo (with a higher number of individuals on the waterline) and on the hull sides, bottom, and propeller shaft of the Jangmok 2. The former ship had sailed the East and South Seas and stayed in South Sea ports for 151 days; the latter had sailed the entire coast of South Korea and stayed in the East Sea ports for 115 days. However, the organism was absent from the Jangmok 1, which operated for 102 days and anchored for 186 days off the South Coast in 2016–2017.

4.3. Differences Among Vessels

Between 2016 and 2017, hull-fouling macroinvertebrates were studied on five research vessels that operated in the ocean, coastal, and local areas for one year after cleaning (Table 2,3). Two ocean-going vessels mainly operated in low-latitude tropical climate regions, while three coastal vessels operated in the temperate regions of mid-latitudes. There were differences in the attached organisms depending on the navigation area; i.e., the abundance of attached organisms was relatively lower on vessels operating in low latitudes than on vessels sailing in mid-latitudes. Such species composition, community structure, and distribution patterns are thought to reflect the unique ecological characteristics of the shipping area [21,22]. However, conflicting research results are presented. Ships operating at low latitudes may be exposed to greater numbers of fouling organisms because the productivity of biological communities is generally higher in warmer climates [96]. Moreover, in tropical to sub-tropical locations of low latitudes, biofouling is generally more intense since the warmer temperatures (>20°C) allow for continuous reproduction throughout the year and an increased growth rate of the biofouling organisms [59,60]. On the other hand, in temperate areas of mid-latitudes with mild temperatures (5–20°C), biofouling occurs throughout the year and shows strong seasonality, with most spawning and growth occurring from spring (beginning of April) to early autumn (end of October) [59,60,61]. In this study, the species composition of the ocean-going vessel community was poor, while the coastal vessel community composition was richer. The reason is that the ocean navigation type of two research vessels had very short anchorage days at ocean ports (22 days/year for the Isabu and 9 days/year for the Onnuri) and long operating days (186 days/year for the Isabu and 101 days/year for the Onnuri) (Table 3) [16,96,97]. Therefore, it is assumed that the short anchorage days are because there are fewer opportunities for fouling organisms to attach to the operational hull.
NIS can cause biodiversity loss and change the community structure through the elimination of local native species abundance [2,7]. Additionally, biological invasions and changes in sea use are among the major causes of global biodiversity decline, and shipping and multiplication of artificial structures at the expense of natural habitats are considered the major forces responsible for marine invasions and biotic homogenization [11]. Therefore, according to the results of this study of the hull being responsible for one of the biological spreads, the macroinvertebrate species diversity indices were highest for communities on the hulls of the coastal and local operating vessels (Figure 12), while the ocean-going the Onnuri had a slightly higher diversity index than the coastal operation the Eardo. This is interpreted as a result of more species being found on the Eardo but with some dominant species being extremely dominant.
In the similarity levels based on nMDS ordination, which reveals significance differences between communities, communities were divided into two ocean communities, one coastal community, and one local community (Figure 14), and among the coastal communities, the Eardo and Jangmok 2 were classified as similar clusters. This is interpreted as a result of the periodic navigation of the Jangmok 2 to distant areas of the East Sea. Contributing species and contribution rates that affect community classification based on SIMPER analysis (Table 6) showed high dissimilarity values between groups. However, the reason why the dissimilarity between the ocean-going the Onnur and local the Jangmok 1 groups was relatively low is presumed to be due to the very long anchoring days of the two vessels in the South Sea port [51].
Significant differences between the vessel groups were verified based on ANOSIM pairwise tests (Table 7). However, the Isabu and Eardo’s cluster and the Onnuri and the Eardo’s cluster did not show significant differences. The Isabu and Onnuri operated on the ocean from July to September and anchored at a South Sea port in winter, while the Eardo operated in the South Sea and East Sea and anchored at a South Sea port (Table 3). In this way, the groups of ocean-going vessels and coastal-going vessels showed various aspects with no clear statistical differences. Presumably, it is related to the port location and period of stay at which the vessel docks. In general, seawater temperature affects the settlement and spread of fouling organisms and is related to latitude and seasonality [29,54], and long stationary periods and reduced navigation activity increase the risk of macrofouling species attaching to hulls [16]. This was confirmed by the positive correlation between the number of operating days and the number, density, and biomass of hull-attached organisms for vessels that frequently operate at mid-latitudes with clear seasonal changes and by a negative correlation with the number of operating days for vessels with few anchorage days in low latitudes with low water temperature changes (Table 3, Table 8). Moreover, even within the mid-latitude region, port location and period of stay can be identified through differences in the adherent organisms of ships operating in low-water temperatures in the north and high-water temperatures in the south (Table 8). The species diversity index (H’) positively correlated with the total numbers of anchoring and coastal operation days and negatively with the total numbers of operation and ocean operation days (Table 8). Thus, a spatially disconnected macrofouling community of tropical and temperate region origin may simultaneously coexist on the same ship [21,22]. This possibility may also be related to the current sub-tropicalization of the Korean Peninsula.

5. Conclusions

Ship biofouling is one of the main vectors for the introduction and spread of harmful marine species worldwide. However, its importance in Korean coastal ecosystems has not been fully studied. This study is expected to be very valuable as a preliminary study in the absence of previous research due to the difficult conditions of domestic ship surveys, such as owner permits, port access restrictions, and on-site risk. Previous studies have been conducted on ports, intertidal zones, artificial structures, and floating objects, but this is the first study to investigate organisms attached to hulls. In connection with the research project, we investigated hull-fouling macroinvertebrates on KIOST research vessels and identified the species composition, dominant species, life history, native species, non-native species, and community structure of hull-fouling macroinvertebrates among research vessels. These hull-fouling macroinvertebrates showed differences in species composition depending on the vessel’s operating area, number of days of operation, anchorage area, and number of days at anchor, and differences in the distribution of attached organisms were also confirmed along the coasts of mid-latitude regions due to differences in water temperature depending on latitude. There were six native species and eight exotic species that were identified during the survey period, and the major dominant species were confirmed to be species that have already been introduced into Korea and are widely distributed around the world. This will be an important basis for research on ship fouling in response to future IMO restrictions. In conclusion, the introduction of non-indigenous species through hull fouling is expected to increase, and future long-term studies will be needed. In addition, it will be necessary to introduce regulations on how to address organisms attached to hulls, such as inspecting organisms attached to hulls before entering or exiting ships, improving methods of collecting residues after cleaning, and limiting the frequent cleaning of hulls.

Acknowledgments

The authors are grateful to all the research vessels’ crew support. This work was funded by the KIOST research project “Development of risk assessment for control technology to reduce transfer of ship’s biofouling”: In-water cleaning technique (PE99813) and the Korea Institute of Marine Science and Technology Promotion (KIMST) of the Ministry of Oceans and Fisheries (1525013842).

Appendix

Table A1. Hull-fouling macroinvertebrate specimens identified to species on the Isabu research vessel.
Taxa Species Name upper-1 upper-2 upper-3 middle-1 middle-2 middle-3 bottom-1 bottom-2 bottom-3 bottom-4 niche-1 niche-2 niche-3 niche-4 Total
CCi Amphibalanus amphitrite 85 68 59 47 92 107 74 35 25 44 115 34 785
CCi Balanus trigonus 0
CCi Amphibalanus improvisus 0
MBi Magallana gigas 0
APol Hydroides ezoensis 0
MBi Mytilus galloprovincialis 0
CAm Jassa slatteryi 0
CTa Zeuxo sp. 0
CTu Pyura sp. 0
APol Nereis multignatha 0
Plat Planocera reticulata 0
CIs Cirolana koreana 0
CCi Conchoderma auritum 5 1 9 15
Others Styela clava 0
CAm Apocorophium acutum 0
Others Bugulina californica 0
CAm Monocorophium acherusicum 1 1
CCi Fistulobalanus kondakovi 6 6
CAm Caprella californica 0
APol Syllis sp. 0
CAm Ericthonius pugnax 0
CAm Marea sp. 0
MBi Musculus senhousia 0
MBi Hiatella arctica 0
CHy Sertulariidae unid. 0
APol Eteone longa 0
APol Nereis pelagica 0
CTu Ascidia sp. 0
MBi Modiolus kurilensis 0
MGa Cheilea cepacea 0
APol Marphysa americana 0
APol Perinereis nuntia 0
APol Platynereis bicanaliculata 0
APol Polydora sp. 0
CAm Caprella equilibra 1 1
CAm Crassicorophium crassicorne 1 1
CAm Melita koreana 0
CAm Melita hoshinoi 0
CAm Pareurystheus anamae 1 1
CAm Photis reinhardi 0
CDe Hemigrapsus sinensis 0
CDe Philemnus minutus 0
CIs Dynoides dentisinus 0
CIs Paranthura japonica 0
CCi Lepas anatifera 0
AAc Heteranthus japonicus 0
Bry Bugula neritina 0
No. of species 1 1 2 1 2 1 2 1 2 4 2 0 0 1 7
No. of individuals (ind.) 85 68 60 47 93 107 79 35 26 55 121 0 0 34 810
Biomass (gWWt) 6.4 4.9 4.9 1.5 2.9 2.6 4.6 1.02 2.0 24.8 9.8 0 0 5.5 70.9
CCi: Crustacea Cirripedia; CAm: Amphipoda; CIs: Isopoda; CTa: Tanaidacea; CDe: Decapoda; MBi: Mollusca Bivalvia; MGa: Gastropoda; APol: Annelida Polychaeta; Chor: Chordata; Plat: Platyhelminthes; CHy: Cnidaria Hydozoa; CAn: Cnidaria Anthozoa; CTu: Chordata Tunicata; Bry: Bryozoa.
Table A2. Hull-fouling macroinvertebrate specimens identified to species on the Onnuri research vessel.
Taxa Species Name upper-1 upper-2 upper-3 middle-1 middle-2 middle-3 bottom-1 bottom-2 bottom-3 bottom-4 niche-1 niche-2 niche-3 Total
CCi Amphibalanus amphitrite 80 49 87 1 1 1 219
CCi Balanus trigonus 53 53
CCi Amphibalanus improvisus 98 68 88 1 2 3 260
MBi Magallana gigas 3 3
APol Hydroides ezoensis 1 7 8
MBi Mytilus galloprovincialis 1 2 3 2 8
CAm Jassa slatteryi 0
CTa Zeuxo sp. 0
CTu Pyura sp. 0
APol Nereis multignatha 0
Plat Planocera reticulata 0
CIs Cirolana koreana 0
CCi Conchoderma auritum 0
Others Styela clava 0
CAm Apocorophium acutum 0
Others Bugulina californica 0
CAm Monocorophium acherusicum 1 1
CCi Fistulobalanus kondakovi 0
CAm Caprella californica 0
APol Syllis sp. 0
CAm Ericthonius pugnax 1 1
CAm Marea sp. 0
MBi Musculus senhousia 0
MBi Hiatella arctica 2 2
CHy Sertulariidae unid. 0
APol Eteone longa 0
APol Nereis pelagica 0
CTu Ascidia sp. 0
MBi Modiolus kurilensis 0
MGa Cheilea cepacea 0
APol Marphysa americana 0
APol Perinereis nuntia 0
APol Platynereis bicanaliculata 0
APol Polydora sp. 0
CAm Caprella equilibra 0
CAm Crassicorophium crassicorne 0
CAm Melita koreana 0
CAm Melita hoshinoi 0
CAm Pareurystheus anamae 0
CAm Photis reinhardi 0
CDe Hemigrapsus sinensis 0
CDe Philemnus minutus 0
CIs Dynoides dentisinus 0
CIs Paranthura japonica 0
CCi Lepas anatifera 0
AAc Heteranthus japonicus 0
Bry Bugula neritina 0
No. of species 0 0 0 2 0 0 3 3 2 7 2 2 2 9
No. of individuals (ind.) 0 0 0 2 0 0 180 120 175 69 2 3 4 555
Biomass (gWWt) 0 0 0 0.01 0 0 0.7 0.4 0.7 7.6 0.008 0.02 0.01 9.4
CCi: Crustacea Cirripedia; CAm: Amphipoda; CIs: Isopoda; CTa: Tanaidacea; CDe: Decapoda; MBi: Mollusca Bivalvia; MGa: Gastropoda; APol: Annelida Polychaeta; Chor: Chordata; Plat: Platyhelminthes; CHy: Cnidaria Hydozoa; CAn: Cnidaria Anthozoa; CTu: Chordata Tunicata; Bry: Bryozoa.
Table A3. Hull-fouling macroinvertebrate specimens identified to species on the Eardo research vessel.
Taxa Species Name upper-1 upper-2 upper-3 upper-4 middle-1 middle-2 middle-3 middle-4 bottom-1 bottom-2 bottom-3 niche-1 niche-2 niche-3 niche-4 niche-5 Total
CCi Amphibalanus amphitrite 208 114 303 302 647 567 46 118 162 2,467
CCi Balanus trigonus 75 355 323 115 1070 1,938
CCi Amphibalanus improvisus 2 2 3 7
MBi Magallana gigas 1 73 88 38 101 91 392
APol Hydroides ezoensis 1 7 13 6 10 33 70
MBi Mytilus galloprovincialis 2 3 10 1 1 75 34 126
CAm Jassa slatteryi 94 1 1 1 1 1 99
CTa Zeuxo sp. 8 11 4 2 1 26
CTu Pyura sp. 1 31 32
APol Nereis multignatha 1 4 4 9
Plat Planocera reticulata 1 1 2
CIs Cirolana koreana 1 6 3 10
CCi Conchoderma auritum 0
Others Styela clava 1 1 7 9
CAm Apocorophium acutum 1 1 3 1 1 2 1 1 11
Others Bugulina californica 0
CAm Monocorophium acherusicum 2 2 4
CCi Fistulobalanus kondakovi 0
CAm Caprella californica 0
APol Syllis sp. 0
CAm Ericthonius pugnax 2 2
CAm Marea sp. 0
MBi Musculus senhousia 1 2 3
MBi Hiatella arctica 1 1
CHy Sertulariidae unid. 0
APol Eteone longa 1 1
APol Nereis pelagica 0
CTu Ascidia sp. 0
MBi Modiolus kurilensis 1 1
MGa Cheilea cepacea 1 1
APol Marphysa americana 0
APol Perinereis nuntia 0
APol Platynereis bicanaliculata 1 1
APol Polydora sp. 0
CAm Caprella equilibra 0
CAm Crassicorophium crassicorne 0
CAm Melita koreana 0
CAm Melita hoshinoi 0
CAm Pareurystheus anamae 0
CAm Photis reinhardi 1 1
CDe Hemigrapsus sinensis 0
CDe Philemnus minutus 1 1
CIs Dynoides dentisinus 0
CIs Paranthura japonica 0
CCi Lepas anatifera 0
AAc Heteranthus japonicus 1 1
Bry Bugula neritina 0
No. of species 6 4 8 2 4 4 1 1 2 1 1 9 9 7 11 11 25
No. of individuals (ind.) 221 119 335 98 309 650 567 1 48 118 162 165 463 371 313 1275 5,215
Biomass (gWWt) 63.8 35.6 59.9 0.1 2.4 8.1 6.5 0.001 6.2 6.2 9.6 172.6 175.0 100.3 421.4 307.3 1,374.9
CCi: Crustacea Cirripedia; CAm: Amphipoda; CIs: Isopoda; CTa: Tanaidacea; CDe: Decapoda; MBi: Mollusca Bivalvia; MGa: Gastropoda; APol: Annelida Polychaeta; Chor: Chordata; Plat: Platyhelminthes; CHy: Cnidaria Hydozoa; CAn: Cnidaria Anthozoa; CTu: Chordata Tunicata; Bry: Bryozoa.
Table A4. Hull-fouling macroinvertebrate specimens identified to species on the Jangmok 1 research vessel.
Taxa Species Name upper-1 upper-2 upper-3 middle-1 middle-2 middle-3 bottom-1 bottom-2 bottom-3 niche-1 niche-2 niche-3 Total
CCi Amphibalanus amphitrite 306 43 296 370 922 864 207 358 71 99 3,536
CCi Balanus trigonus 89 7 25 55 87 99 10 9 381
CCi Amphibalanus improvisus 6 51 154 105 5 61 3 163 548
MBi Magallana gigas 2 2 6 7 14 2 16 49
APol Hydroides ezoensis 0
MBi Mytilus galloprovincialis 0
CAm Jassa slatteryi 0
CTa Zeuxo sp. 0
CTu Pyura sp. 0
APol Nereis multignatha 1 1 11 1 1 15
Plat Planocera reticulata 3 2 12 10 27
CIs Cirolana koreana 1 10 1 12
CCi Conchoderma auritum 0
Others Styela clava 0
CAm Apocorophium acutum 0
Others Bugulina californica 1 1
CAm Monocorophium acherusicum 1 1
CCi Fistulobalanus kondakovi 0
CAm Caprella californica 0
APol Syllis sp. 4 4
CAm Ericthonius pugnax 1 1
CAm Marea sp. 2 1 1 4
MBi Musculus senhousia 0
MBi Hiatella arctica 0
CHy Sertulariidae unid. 0
APol Eteone longa 0
APol Nereis pelagica 0
CTu Ascidia sp. 0
MBi Modiolus kurilensis 0
MGa Cheilea cepacea 0
APol Marphysa americana 1 1
APol Perinereis nuntia 1 1
APol Platynereis bicanaliculata 0
APol Polydora sp. 1 1
CAm Caprella equilibra 0
CAm Crassicorophium crassicorne 0
CAm Melita koreana 1 1
CAm Melita hoshinoi 1 1
CAm Pareurystheus anamae 0
CAm Photis reinhardi 0
CDe Hemigrapsus sinensis 1 1
CDe Philemnus minutus 0
CIs Dynoides dentisinus 0
CIs Paranthura japonica 1 1
CCi Lepas anatifera 0
AAc Heteranthus japonicus 0
Bry Bugula neritina 0
No. of species 5 1 6 0 9 7 11 5 0 5 4 6 19
No. of individuals (ind.) 404 43 308 0 455 1149 1084 313 0 455 77 298 4,586
Biomass (gWWt) 68.3 2.7 46.1 0 63.5 183.7 167.0 24.7 0 139.6 8.1 380.0 1,086.5
CCi: Crustacea Cirripedia; CAm: Amphipoda; CIs: Isopoda; CTa: Tanaidacea; CDe: Decapoda; MBi: Mollusca Bivalvia; MGa: Gastropoda; APol: Annelida Polychaeta; Chor: Chordata; Plat: Platyhelminthes; CHy: Cnidaria Hydozoa; CAn: Cnidaria Anthozoa; CTu: Chordata Tunicata; Bry: Bryozoa.
Table A5. Hull-fouling macroinvertebrate specimens identified to species on the Jangmok 2 research vessel.
Taxa Species Name upper-1 upper-2 upper-3 upper-4 middle-1 middle-2 middle-3 middle-4 bottom-1 bottom-2 bottom-3 niche-1 niche-2 niche-3 Total
CCi Amphibalanus amphitrite 0
CCi Balanus trigonus 19 27 26 91 10 465 282 162 118 93 96 1,389
CCi Amphibalanus improvisus 0
MBi Magallana gigas 39 37 39 31 3 29 5 12 21 19 16 251
APol Hydroides ezoensis 10 9 1 21 4 56 211 232 544
MBi Mytilus galloprovincialis 19 38 9 1 20 1 88
CAm Jassa slatteryi 9 4 2 5 14 4 38
CTa Zeuxo sp. 1 5 6
CTu Pyura sp. 0
APol Nereis multignatha 1 3 1 2 7
Plat Planocera reticulata 0
CIs Cirolana koreana 1 1
CCi Conchoderma auritum 0
Others Styela clava 3 1 4
CAm Apocorophium acutum 0
Others Bugulina californica 1 1 1 1 1 1 1 1 1 9
CAm Monocorophium acherusicum 0
CCi Fistulobalanus kondakovi 0
CAm Caprella californica 1 3 1 5
APol Syllis sp. 0
CAm Ericthonius pugnax 0
CAm Marea sp. 0
MBi Musculus senhousia 0
MBi Hiatella arctica 0
CHy Sertulariidae unid. 1 1 1 3
APol Eteone longa 1 1
APol Nereis pelagica 2 2
CTu Ascidia sp. 1 1 2
MBi Modiolus kurilensis 0
MGa Cheilea cepacea 0
APol Marphysa americana 0
APol Perinereis nuntia 0
APol Platynereis bicanaliculata 0
APol Polydora sp. 0
CAm Caprella equilibra 0
CAm Crassicorophium crassicorne 0
CAm Melita koreana 0
CAm Melita hoshinoi 0
CAm Pareurystheus anamae 0
CAm Photis reinhardi 0
CDe Hemigrapsus sinensis 0
CDe Philemnus minutus 0
CIs Dynoides dentisinus 1 1
CIs Paranthura japonica 0
CCi Lepas anatifera 1 1
AAc Heteranthus japonicus 0
Bry Bugula neritina 1 1
No. of species 8 11 8 8 0 0 0 8 6 7 8 4 3 2 18
No. of individuals (ind.) 99 125 83 148 0 0 0 41 557 517 415 143 113 112 2,353
Biomass (gWWt) 50.0 58.1 54.4 89.3 0 0 0 29.8 44.0 32.2 27.9 69.8 71.9 52.5 579.8
CCi: Crustacea Cirripedia; CAm: Amphipoda; CIs: Isopoda; CTa: Tanaidacea; CDe: Decapoda; MBi: Mollusca Bivalvia; MGa: Gastropoda; APol: Annelida Polychaeta; Chor: Chordata; Plat: Platyhelminthes; CHy: Cnidaria Hydozoa; CAn: Cnidaria Anthozoa; CTu: Chordata Tunicata; Bry: Bryozoa.

References

  1. Bellora, C.; Bureau, J.C.; Bayramoglu, B.; Gozlan, E.; Jean, S. Trade and Biodiversity. Printed in Belgium 2020, 38. Available online: https://www.europarl.europa.eu/RegData/etudes/.
  2. Albano, M.J.; Obenat, S.M. Fouling assemblages of native, non-indigenous and cryptogenic species on artificial structures, depths and temporal variation. Journal of Sea research 2019, 144, 1–15. [Google Scholar] [CrossRef]
  3. Alghamdi, S.A.; Cordova, R.A.Q. The impact of biofouling on marine environment: A qualitative review of the current antifouling technologies. Master of science in Maritime affairs, World Maritime university, 2019; p. 90. [Google Scholar]
  4. Carlton, J.T. Biological invasions and cryptogenic species. Ecology 1996, 77, 1653–1655. [Google Scholar] [CrossRef]
  5. Seo, K.C.; Atlar, M.; Goo, B.G. A study on the hydrodynamic effect of biofouling on marine propeller. J. Kor. Soc. Mar. Env. & Saf. 2016, 22, 123–128. [Google Scholar]
  6. Gollasch, S. The Importance of Ship Hull Fouling as a Vector of Species Introduction into the North Sea. Biofouling 2002, 18, 105–121. [Google Scholar] [CrossRef]
  7. Lewis, J.A. 7. Invasive species. In: Environmental impact of ships (Cambridge Environmental Chemistry Series) by More, S.D.; Fileman, T.; Vance, T. Cambridge University Press: 1st edition, Cambridge, UK 2021, 350, 165–215. [Google Scholar]
  8. Farkas, A.; Song, S.; Degiuli, N.; Martić, I.; Demirel, Y.K. Impact of biofilm on the ship propulsion characteristics and the speed reduction. Ocean Engineering 2020, 199, 1–19. [Google Scholar] [CrossRef]
  9. Chan, F.T.; MacIsaac, H.J.; Bailey, S.A. Relative importance of vessel hull fouling and ballast water as transport vectors of nonindigenous species to the Canadian Arctic. Can. J. Fish. Aquat. Sci. 2015, 72, 1230–1242. [Google Scholar] [CrossRef]
  10. Suk, J.H. A study on the regulatory framework related to ship’s biofouling. The Korea institute of Maritime Law 2018, 30, 139–173. [Google Scholar] [CrossRef]
  11. Leclerc, J.C.; Viard, F.; Sepúlveda, E.G.; Díaz, C.; Hinojosa, J.N.; Araneda, K.P.; Silva, F.; Brante, A. Habitat type drives the distribution of non-indigenous species in fouling communities regardless of associated maritime traffic. Diversity and Distributions 2019, 26, 62–75. [Google Scholar] [CrossRef]
  12. Moser, C.S.; Wier, T.P.; First, M.R.; Grant, J.F.; Riley, S.C.; Robbins-Wamsley, S.H.; Tamburri, M.N.; Ruiz, G.M.; Miller, A.W.; Drake, L.A. Quantifying the extent of niche areas in the global fleet of commercial ships: The potential for “super-hot spots” of biofouling. Biological Invasions 2017, 19, 1745–1759. [Google Scholar] [CrossRef]
  13. Ulman, A., Ferrario, J., Forcada, A., Seebens, H., Arvanitidis, C., Occhipinti-Ambrogi, A., & Marchini, A. Alien species spreading via biofouling on recreational vessels in the Mediterranean Sea. Journal of Applied Ecology 2019, 56, 2620–2629. [CrossRef]
  14. Coutts, A.D.; Dodgshun, T.J. The nature and extent of organisms in vessel sea-chests: A protected mechanism for marine bioinvasions. Marine pollution bulletin 2007, 54, 875–886. [Google Scholar] [CrossRef]
  15. Floerl, O.; Inglis, G.J.; Hayden, B.J. A Risk-Based Predictive Tool to Prevent Accidental Introductions of Nonindigenous Marine Species. Environmental management 2005, 35, 765–778. [Google Scholar] [CrossRef]
  16. Ashton, G.; Boos, K.; Shucksmith, R.; Cook, E.A. Risk-based predictive tool to prevent accidental introductions of nonindigenous marine species. Aquatic Invasions 2006, 1, 214–218. [Google Scholar] [CrossRef]
  17. Swain, G.; Anil, A.; Baier, R.E.; Chia, F.S.; Conte, E.; Cook, A.; Hadfield, M.; Haslbeck, E.; Holm, E.; Kavanagh, C. Biofouling and barnacle adhesion data for fouling-release coatings subjected to static immersion at seven marine sites. Biofouling 2000, 16, 331–344. [Google Scholar] [CrossRef]
  18. Wendt, D.; Kowalke, G.; Kim, J.; Singer, I. Factors that influence elastomeric coating performance: The effect of coating thickness on basal plate morphology, growth and critical removal stress of the barnacle Balanus amphitrite. Biofouling 2006, 22, 1–9. [Google Scholar] [CrossRef] [PubMed]
  19. Cranfield, H.J.; Gordon, D.P.; Willan, R.C.; Marshall, B.A.; Battershill, C.N.; Francis, M.P.; Nelson, W.A.; Glasby, C.J.; Read, G.B. Adventive marine species in New Zealand. NIWA Technical Report 34. ISSN 1174-2631. 1998; p. 48. [Google Scholar]
  20. Otani, M. Important vectors for marine organisms unintentionally introduced to Japanese waters. In Assessment and Control of Biological Invasion Risks; Koike, F., Clout, M.N., Kawamichi, M., De Poorter, M., Iwatsuki, K., Eds.; Shoukadoh Book Sellers: Kyoto, Japan; IUCN: Gland, Switzerland, 2006; pp. 92–103. [Google Scholar]
  21. Moshchenko, A.V.; Zvyagintsev, A.Y. Composition and structure of macrofouling communities on Ocean-going ships in the far East Sea basin. Ocean and Polar Research 2001, 23, 63–75. [Google Scholar]
  22. Moshchenko, A.V.; Zvyagintsev, A.Y. Distribution characteristics of macrofouling organisms on Ocean-going ships of the far East Sea basin. Ocean and Polar Research 2001, 23, 323–335. [Google Scholar]
  23. IMO. Guidelines for the control and management of ship’s biofouling to minimize the transfer of invasive aquatic species. International Maritime Organization, 15 July 2011, Res. MEPC. 2011, 207, 62. [Google Scholar]
  24. MOF. Statistics of vessels arriving at Korean ports by weight class. Korean Ministry of Oceans and Fisheries 2017. Available online: http://www.mof.go.kr/statPortal/cate/statView.do (accessed on 21 May 2020).
  25. MOF. Law for the conservation and management of marine ecosystems (Marine Ecosystem Act). Korean Ministry of Oceans and Fisheries 2019. Available online: http://www.mof.go.kr/, (accessed on 16 May 2020).
  26. MOF; KOEM. Study on improvement method of management system for foreign marine organisms and harmful marine organisms; Ministry of Oceans and Fisheries, Korean Marine Environment Management Corporation, 2015; p. 137. [Google Scholar]
  27. MOF. Marine introduced benthos of Korea. Ministry of Oceans and Fisheries 2013, 102. [Google Scholar]
  28. MLTMA. Management plan for marine ecosystem disturbance organisms. Ministry of Land, Transport and Maritime Affairs. 2008; p. 320. [Google Scholar]
  29. Lord, J.P. Temperature, space availability, and species assemblages impact competition in global fouling communities. ” Biol Invasions 2017, 19, 43–55. [Google Scholar] [CrossRef]
  30. Hyun, B.G.; Jang, P.G.; Shin, K.; Kang, J.H.; Jang, M.C. Ship’s hull fouling management and in-water cleaning techniques. Journal of the Korean Society of Marine Environment & Safety 2018, 24, 785–795. [Google Scholar]
  31. Kim, D.H. International management of introduced marine pests and Korea’s strategic response. Journal of Korea Environmental Policy and Administration 2005, 13, 134–168. [Google Scholar]
  32. Meloni, M.; Correa, N.; Bettini Pitombo, F.; Chiesa, I.L.; Doti, B.; Elías, R.; Genzano, G.; Giachetti, C.B.; Giménez, D.; López-Gappa, J.; Pastor, C.; Pereira Wandeness, A.; Ramírez, F.C.; Roccatagliata, D.; Schulze-Sylvester, M.; Tatián, M.; Zelaya, D.G.; Sylvester, F. In-water and dry-dock hull fouling assessments reveal high risk for regional translocation of nonindigenous species in the southwestern Atlantic. Hydrobiologia 2021, 848, 1981–1996. [Google Scholar] [CrossRef]
  33. Min, D.K.; Lee, J.S.; Koh, D.B.; Je, J.G. Mollusks in Korea. Min Molluscan Research Institute 2004, 566. [Google Scholar]
  34. Okutani, T. Marine Mollusks in Japan. Tokai University Press 2000, 1173. [Google Scholar]
  35. Imajima, M. Annelida Polychaeta Ⅰ; Seibutsu Kenkyusha Co. Ltd.: Tokyo, 1996; p. 530. [Google Scholar]
  36. Imajima, M. Annelida Polychaeta Ⅱ; Seibutsu Kenkyusha Co. Ltd.: Tokyo, 2001; p. 542. [Google Scholar]
  37. Imajima, M. Annelida Polychaeta Ⅲ; Seibutsu Kenkyusha Co. Ltd.: Tokyo, 2007; p. 499. [Google Scholar]
  38. Hong, S.Y. Marine Invertebrates in Korean Coasts; Academy Publishing Company, Inc., 2006; p. 479. [Google Scholar]
  39. NFRDI. Shrimp of the Korea Waters. Hanguel Graphics Press: Busan, 2001; p. 223. [Google Scholar]
  40. Shin, S.; Rho, B.J. Illustrated encyclopedia of fauna & flora of Korea. Echinodermata, 36. Sam-Hwa Publ. Co. Ltd.: Seoul, Korea, 1996; p. 780. [Google Scholar]
  41. Clarke, K.R.; Gorley, R.N.; Somerfield, P.J.; Warwick, R.M. Change In marine Communities: An Approach to Statistical Analysis and Interpretation. 3rd edition; PRIMER-E Ltd.: Plymouth, 2014; p. 255. [Google Scholar]
  42. Shannon, C.E.; Wiener, W. The Mathematical Theory of Communication; University of Illinois Press: Urbana, IL, 1963; p. 127. [Google Scholar]
  43. Pielou, E.C. Ecological diversity; Wiley: New York, 1975; p. 165. [Google Scholar]
  44. Somerfield, P.J.; Clarke, K.R.; Gorley, R.N. A generalised analysis of similarities (ANOSIM) statistic for designs with ordered factors. Austral Ecology 2021, 46, 901–910. [Google Scholar] [CrossRef]
  45. Clarke, K.R.; Ainsworth, M. A method of linking multivariate community structure to environmental variables. Mar. Ecol. Prog. Ser. 1993, 92, 205–219. [Google Scholar] [CrossRef]
  46. Clarke, K.R.; Gorley, R.N. PRIMER v7: User Manual/Tutorial; PRIMER-E: Plymouth, 2015; p. 296. [Google Scholar]
  47. Larsson, A.I.; Mattsson-Thorngren, L.; Granhag, L.M.; Berglin, M. Fouling-release of barnacles from a boat hull with comparison to laboratory data of attachment strength. J. Exp. Mar. Biol. Ecol. 2010, 392, 107–114. [Google Scholar] [CrossRef]
  48. KHOA. Ocean data in grid framework. Korea Hydrographic and Oceanographic Agency. Available online: http://www.khoa.go.kr/oceangrid/khoa/intro.do, (accessed on 29 May 2020).
  49. Chan, F.T.; MacIsaac, H.J.; Bailey, S.A. Survival of ship biofouling assemblages during and after voyages to the Canadian Arctic. Marine Biology 2016, 163, 1–14. [Google Scholar] [CrossRef]
  50. Almeida, L.P.; Coolen, J.W.P. Modelling thickness variations of macrofouling communities on offshore platforms in the Dutch North Sea. J. Sea Res. 2020, 156, 1–8. [Google Scholar] [CrossRef]
  51. Ashton, G.; Boos, K.; Shucksmith, R.; Cook, E. Risk assessment of hull fouling as a vector for marine non-natives in Scotland. Aquatic Invasions 2006, 1, 214–218. [Google Scholar] [CrossRef]
  52. Davidson, I.C.; Brown, C.W.; Sytsma, M.D.; Ruiz, G.M. The role of containerships as transfer mechanisms of marine biofouling species. Biofouling 2009, 25, 645–655. [Google Scholar] [CrossRef]
  53. Sylvester, F.; MacIsaac, H.J. Is vessel hull fouling an invasion threat to the Great Lakes? Divers. Distrib. 2010, 16, 132–143. [Google Scholar] [CrossRef]
  54. Newell, R.C.; Branch, G.M. The influence of temperature on the maintenance of metabolic energy balance in marine invertebrates. In Advances in Marine Biology; Blaxter, J.H.S., Russell, F.S.; Yonge, M.; Eds, Elsevier: London, UK 1980, 17, 329–396. [Google Scholar]
  55. Outinen, O.; Puntila-Dodd, R.; Barda, L.; Brzana, R.; Joanna, H.D.; Kalnina, M.; Kostanda, M.; Lindqvist, A.; Monika, N.S.; Ścibik, M.; Strake, S.; Vuolamo, J.; Lehtiniemi, M. The role of marinas in the establishment and spread of non-indigenous species in Baltic Sea fouling communities. Biofouling, The Journal of Bioadhesion and Biofilm Research 2021, 37, 984–997. [Google Scholar] [CrossRef] [PubMed]
  56. Ruiz, G.M.; Smith, G. Biological study of container vessels at the port of Oakland. Final report, Smithsonian Environmental Research Center, Edgewater 2005, 155. Available online: http://www.serc.si.edu.
  57. Coutts, A.D.M.; Taylor, M.D. A preliminary investigation of biosecurity risks associated with biofouling on merchant vessels in New Zealand. N.Z. J. Mar. Freshw. 2004, 38, 215–229. [Google Scholar]
  58. Kim, I.H. Invasion of foreign barnacles into Korean waters. Korean Journal of Systematic Zoology 1992, 8, 2–163. [Google Scholar]
  59. Lehaitre, M.; Delauney, L.; Compère, C. Biofouling and underwater measurements. In Real-Time Observation Systems for Ecosystem Dynamics Harmful Algal Blooms: Theory, Instrumentation Modelling; Babin, M., Roesler, C.S., Cullen, J.J., Eds.; UNESCO Publishing: Paris, France, 2008; pp. 463–493. [Google Scholar]
  60. Hellio, C.; Yebra, D. Advances in Marine Antifouling Coatings and Technologies; CRC Press: Boca Raton, FL, USA, 2009; p. 785. [Google Scholar]
  61. Minchin, D.; Gollasch, S. Fouling and Ships’ Hulls: How Changing Circumstances and Spawning Events may Result in the Spread of Exotic Species. Biofouling 2003, l19, 111–122. [Google Scholar] [CrossRef] [PubMed]
  62. Schimanski, K.B.; Goldstien, S.J.; Hopkins, G.A.; Atalah, J.; Floerl, O. Life history stage and vessel voyage profile can influence shipping-mediated propagule pressure of non-indigenous biofouling species. Biol Invasions 2017, 19, 2089–2099. [Google Scholar] [CrossRef]
  63. Fofonoff, P.W.; Ruiz, G.M.; Carlton, J.T. National exotic marine and estuarine species information system 2003. Available online: http://invasions.si.edu/nemesis/.
  64. CABI. Invasive species compendium [online]. Commonwealth Agricultural Bureaus International. 2023. Available online: http://www.cabi.org/isc/.
  65. Clarke Murray, C.; Therriault, T.W.; Martone, P.T. Adapted for invasion? Comparing attachment, drag and dislodgment of native and nonindigenous hull fouling species. Biol. Invasions 2012, 14, 1651–1663. [Google Scholar] [CrossRef]
  66. Darwin, C. A Monograph on the Sub-Class Cirripedia with Figures of All the Species. The Balanidae, (or Sessile Cirripedia); the Verricidae, etc. The Ray Society, London. i-viii + 1-684, pls. 1-30. 1854, 250. Available online: https://ia800201.us.archive.org/30/items/monographonsubcl02darw/monographonsubcl02darw.pdf (accessed on 29 May 2020).
  67. Yamaguchi, T. Taxonomic studies on some fossil and Recent Japanese Balanoidea (Part 1). Transactions and Proceedings of the Palaeontological Society of Japan. New Series. 1977; no. 107-108, pp. 135–201. Pls. 19-27. [Google Scholar]
  68. Hiro, F. Studies on the cirripedian fauna of Japan. IV. Cirripeds of the Formosa (Taiwan), with some geographical and ecological remarks on littoral forms. Memoirs of the college of science, Kyoto imperial University, series B 1939, 15, 245–284. [Google Scholar]
  69. Cohen, A.N.; Andrew, N. The exotics guide: Non-native marine species of the North American Pacific Coast. Center for Research on Aquatic Bioinvasions, Richmond, CA, and San Francisco Estuary Institute, Oakland, CA. 2011. Available online: http://www.exoticsguide.org/balanus_amphitrite, (accessed on 28 May 2020).
  70. Kim, I.H. Illustrated encyclopedia of fauna & flora of Korea. Ministry of Education 1998, 38, 1038. [Google Scholar]
  71. Choi, J.W.; Park, S.H.; Seo, J.Y. Recruitment patterns of sessile organisms on the artificial PVC panels in Jangmok Bay, southern coast of Korea. Korean, J. Malacol. 2011, 27, 29–33. [Google Scholar] [CrossRef]
  72. Hendrickx, M.E.; Ramírez-Félix, E. Settlement of the barnacle Balanus trigonus Darwin, 1854, on Panulirus gracilis Streets, 1871, in western Mexico. The Journal of The Brazilian Crustacean Society, Nauplius, 27: e2019020 2019, 1-9. http://doi.org/10.1590/2358-2936e2019020. [CrossRef]
  73. Pitombo, F.B.; Ross, A. A checklist of the intertidal and shallow-water sessile barnacles of the Eastern Pacific, Alaska to Chile. In Contributions to the Study of East Pacific Crustaceans. [Contribuciones al Estudio de los Crustáceos del Pacífico Este]; Hendrickx, M.E., Ed.; Instituto de Ciencias del Mary Limnología, UNAM: Mexico, 2002; pp. 97–107. [Google Scholar]
  74. Zullo, V.A. Balanus trigonus Darwin (Cirripedia, Balaninae) in the Atlantic basin: An introduced species ? Bulletin of Marine Science 1992, 50, 66–74. [Google Scholar]
  75. Ayling, A.M. The Strategy of Orientation in the Barnacle Balanus trigonus. Marine Biology 1976, 36, 335–342. [Google Scholar] [CrossRef]
  76. Lee, C.; Kim, C.H. Larval Development of Balanus trigonus Darwin (Cirripedia: Thoracica: Balanidae) reared in the laboratory. Journal of the Korean Fisheries Society 1990, 23, 457–467. [Google Scholar]
  77. Chapman, J.W.; Breitenstein, R.A. and Carlton, J.T. Port-by-port accumulations and dispersal of hull fouling invertebrates between the Mediterranean Sea, the Atlantic Ocean and the Pacific Ocean. Aquatic Invasions 2013, 8, 249–260. [Google Scholar] [CrossRef]
  78. Zeinalipour, M. The Comparison of the Balanus improvisus (Crustacea: Cirripeia) Growth, Population Dynamics and Larval Recruitment in the Southern Coasts of the Caspian Sea. Journal of Life Sciences 2015, 9, 416–422. [Google Scholar]
  79. Grigorovich, I.A.; Therriault, W.T. History of aquatic invertebrate invasions in the Caspian Sea. Biological Invasions 2003, 5, 103–115. [Google Scholar] [CrossRef]
  80. Kim, H.K.; Lee, S.K.; Min, B.S.; Kim, W. Report on the current status of the distribution of invasive barnacles in marine national park areas of Korea. Journal of National Park Research 2019, 10, 249–257. [Google Scholar]
  81. Okuda, S. Some tubicolous Annelids from Hokkaido. Zoological Institute, Faculty of Science, Hokkaido Imperial University, Sapporo 1934, 3, 233–246. Available online: http://hdl.handle.net/2115/26971, (accessed on 29 May 2020).
  82. JTMD. Japanese Tsunami marine debris database. Supported by Ministry of the Environment and Smithsonian Environmental Research Center. Available online: https://invasions.si.edu/nemesis/jtmd/SpeciesSummary.jsp? taxon=Hydroides%20ezoensis, (accessed on 29 May 2020).
  83. Thorp, C.H.; Pyne, S.; West, S.A. Hydroides ezoensis Okuda, a fouling serpulid new to British coastal waters. Journal of Natural History 1987, 21, 863–877. [Google Scholar] [CrossRef]
  84. Paik, E.I. Benthic Polychaetous Annelids from Geomun-do and Baeg-do Is. Korea. Journal of the Korean Fisheries Society 1979, 12, 41–63. [Google Scholar]
  85. Hong, S.Y. Notes on the early development of Hydroides ezoensis Okuda. Publ. Inst. Mar. Sci. Nat. Fish. Univ. Busan 1980, 12, 55–58. [Google Scholar]
  86. Paik, E.I. Polychaetous Annelids growing in oyster farms. Bull. Korean Fish. Soc. 1980, 13, 33–44. [Google Scholar]
  87. Thunberg, C.P. Drawing and description of a large oyster variety from Japan. Kongliga Vetenskaps Academiens Nya Handlingar. 1793, 14, 140–142, pl 1. Available online: https://www.biodiversitylibrary.org/page/46957303.
  88. FAO. Food and Agriculture Organization of the United Nations, Cultured Aquatic Species Information Programme. Available online: http://www.fao.org/fishery/culturedspecies/Crassostrea_gigas/en#tcNA003C (accessed on 29 May 2020).
  89. Jang, G.N. Shellfish culture. Samgwang publisher company 2002, 424p. [Google Scholar]
  90. Lamarck [J.-B. M.] de. Histoire naturelle des animaux sans vertèbres. Tome 6, 1: Vi, Paris 1819, 343. Available online: http://www.marinespecies.org/aphia.php?p=taxdetails&id=140481.
  91. Drasche, R. Ueber einige neue und weniger bekannte aussereuropasche einfache Ascidien. Denkschr. Acad. Wiss. Wien. 1884, 48, 369–386. [Google Scholar]
  92. Conlan, K.E. Revision of the crustacean amphipod genus Jassa Leach (Corophioidea: Ischyroceridae). Can. J. Zool. 1990, 68, 2031–2075. [Google Scholar] [CrossRef]
  93. Hong, J.S. Three tube-building amphipods from experimental plates in Deukryang Bay in the southern coast of Korea. Kor. J. Zool. 1983, 26, 135–153. [Google Scholar]
  94. Lim, B.J.; Park, J.Y. Redescription of Jassa slatteryi (Crustacea: Amphipoda: Ischyroceridae). Korean journal of environmental biology 2006, 24, 300–305. [Google Scholar]
  95. Jeong, S.J.; Yu, O.H.; Suh, H.L. Life History and Reproduction of Jassa Slatteryi (Amphipoda, Ischyroceridae) on a Seagrass Bed (Zostera marina L.) in Southern Korea. Journal of Crustacean Biology 2007, 27, 65–70. [Google Scholar] [CrossRef]
  96. Sylvester, F.; Kalaci, O.; Leung, B.; Lacoursière-Roussel, A.; Murray, C.C.; Choi, F.M. Hull fouling as an invasion vector: Can simple models explain a complex problem? J. Appl. Ecol. 2011, 48, 415–423. [Google Scholar] [CrossRef]
  97. Chan, F.T.; Ogilvie, D.; Sylvester, F.; Sarah, A.; Bailey, S.A. Ship Biofouling as a Vector for Non-indigenous Aquatic Species to Canadian Arctic Coastal Ecosystems: A Survey and Modeling-Based Assessment. Mar. Sci. 2022, 9, 1–9. [Google Scholar] [CrossRef]
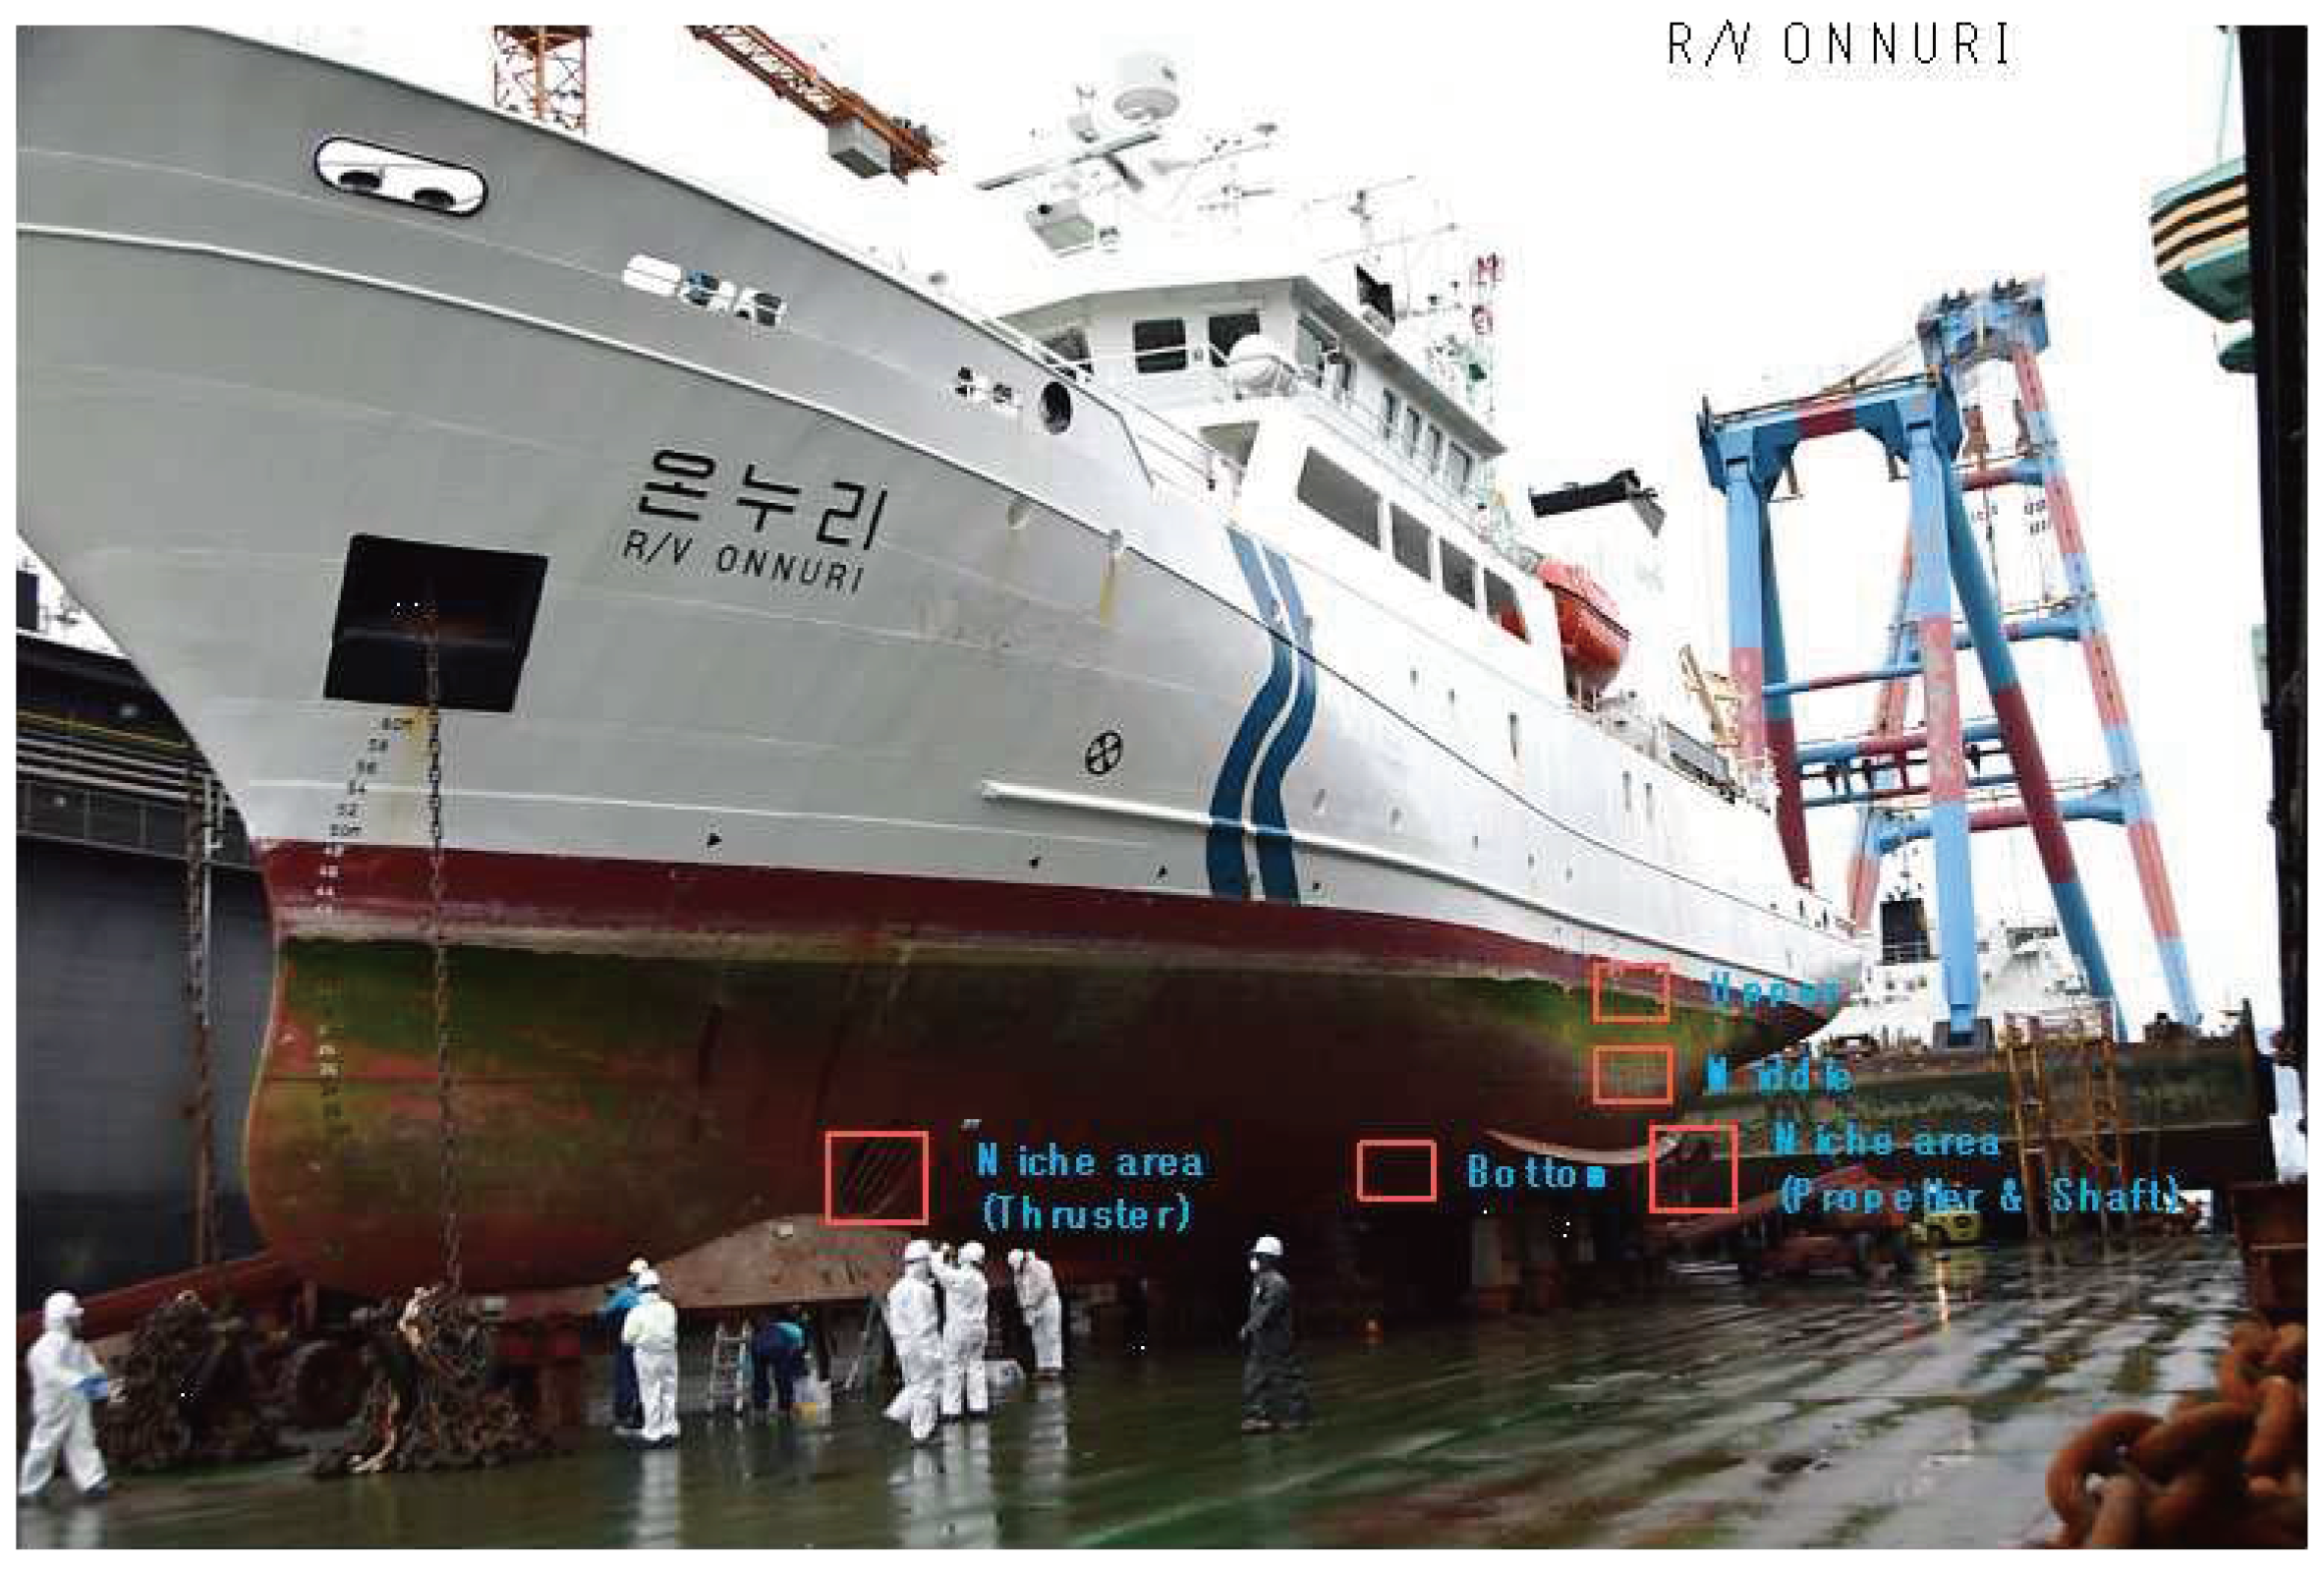
Figure 1. Sampling locations for attached hull-fouling macroinvertebrates. Samples were collected 3–5 times repeatedly using quadrats (15 х 15 cm) in each sector: upper, middle, bottom, and niche areas (propeller shaft or thruster).
Preprints 98963 g001
Figure 2. Map showing the navigation areas of the Korea Institute of Ocean Science and Technology (KIOST) research vessels during 2016–2017 (green line: ocean worldwide class the Isabu, yellow line: ocean class the Onnuri, blue line: coastal class the Eardo, magenta line: local class the Jangmok 1, ocher line: coastal-local class the Jangmok 2; http://kumos.kiost.ac.kr).
Preprints 98963 g002
Figure 4. The number of species by taxa of attached macroinvertebrates on the vessels.
Preprints 98963 g004
Figure 5. The number of individuals by taxa of attached macroinvertebrates on the vessels.
Preprints 98963 g005
Figure 6. The biomass by taxa of attached macroinvertebrates on the vessels.
Preprints 98963 g006
Figure 7. The number of species by hull sector of attached macroinvertebrates on the vessels.
Preprints 98963 g007
Figure 8. The number of individuals by hull sector of attached macroinvertebrates on the vessels.
Preprints 98963 g008
Figure 9. The biomass by hull sector of attached macroinvertebrates on the vessels.
Preprints 98963 g009
Figure 10. Distribution of dominant species of hull-fouling macroinvertebrates by vessel.
Preprints 98963 g010
Figure 11. Distribution of dominant species of hull-fouling macroinvertebrates in each ship hull sector. The Isabu and Onnuri have a different scale than the other three vessels. Vertical lines are standard errors.
Preprints 98963 g011
Figure 12. Diversity and evenness indices of hull-fouling macroinvertebrate communities on the vessels. Vertical lines are standard errors.
Preprints 98963 g012
Figure 13. Eight non-indigenous species of hull-fouling macroinvertebrates introduced by five research vessels. Bryozoans B. californica and B. neritina; bivalve M. galloprovincialis; polychaete P. nuntia; amphipods C. californica and J. slatteryi; barnacles A. amphitrite and A. improvisus.
Preprints 98963 g013
Figure 14. Non-metric multidimensional scaling (nMDS) ordination of Bray–Curtis similarities of fourth-root transformed species abundance data from the five KIOST research vessels (SIMPROF test: the groups are separated by red lines; ANOSIM results: Global test R = 0.90, p < 0.001). The stress value is a representation of the spatial dispersion based on resemblances among 69 samples. Vector and species overlays were produced using Pearson correlations between the species variables and the ordination MDS 1 and MDS 2 axes (blue lines). This is offered purely as an exploratory tool to visualize potential linear or monotonic relationships between a given set of variables and ordination axes.
Preprints 98963 g014
Table 1. Sampling sectors of hull-fouling macroinvertebrates on the research vessels.
Hull Sectors Sampling Parts of the Ship’s Surface
Upper Just around waterline (ship’s central and prow parts)
Middle Mid depth (between the waterline and flat bottom)
Bottom Flat bottom (ship’s bottom including the seawater inlet part)
Niche areas Propeller and shaft, thruster
Table 2. Information on the research vessels such as the navigation area, tonnage, dimension, and sampling date based on KIOST operating guidelines.
Navigation Area Name of
R/Vs
Tonnage
(ton)
Length (m) Speed (kn) Cleaning date Sampling Date Sampling Dock
Ocean ISABU 5,894 99.8 12–15 12th–13th Jan. 2017 12th–13th Jan. 2018 ORIENT shipyard
ONNURI 1,370 63.8 12.5 28th–29th Mar. 2016 28th–29th Mar. 2017 ORIENT shipyard
Coastal EARDO 357 49.0 12.0 15th Mar. 2016 15th Mar. 2017 SUNJIN shipbuilding
Coastal
& Local
JANGMOK 2 35 24.0 16.0 15th Mar. 2016 15th Mar. 2017 SUNJIN shipbuilding
Local JANGMOK 1 41 24.2 13.0 19th Sep. 2016 19th Sep. 2017 SUNJIN shipbuilding
http://www.kiost.ac.kr
Table 3. Operational records of the research vessels for one year from 2016 to 2017 (Abbreviations: Sail, sailing days; Anchor, anchoring days).
Research Vessel Operating Region Sail/Anchor
by Region
Month
(Sail, Anchor)
Operating
Route
Anchorage
Harbor
ISABU Ocean 186/22 Jan (5, 26)
Feb (27, 1)
Mar (13, 18)
Apr (0, 30)
May (13, 18)
Jun (20, 10)
Jul (30, 1)
Aug (30, 1)
Sep (26, 4)
Oct (16, 15)
Nov (28, 2)
Dec (11, 20)
Indian Ocean, Northwest Pacific Ocean Guam and Palau port, Colombo, Port Louis
South Sea 25/124 South coast of Korea Jangmok, Gwangyang and Busan port
East Sea 8/0 Dokdo Is. -
West Sea 0/0 - -
ONNURI Ocean 101/9 Jan (0, 31)
Feb (7, 21)
Mar (11, 20)
Apr (18, 12)
May (17, 14)
Jun (8, 22)
Jul (29, 2)
Aug (29, 2)
Sep (19, 11)
Oct (21, 10)
Nov (5, 25)
Dec (1, 30)
Indian Ocean, Northwest Pacific Ocean Colombo, Port Louis and Guam port
South Sea 44/189 South coast of Korea,
Korea strait, East China Sea
Siljeon, Seogwipo, Jeju, Mokpo, Jangmok, Busan and Jangcheon port
East Sea 14/1 Ulleung Is., Dokdo Is. Sadong and Pohang port
West Sea 6/1 Yellow sea -
EARDO South Sea 77/151 Jan (0, 31)
Feb (21, 7)
Mar (16, 15)
Apr (16, 14)
May (22, 9)
Jun (10, 20)
Jul (15, 16)
Aug (19, 12)
Sep (27, 3)
Oct (11, 20)
Nov (13, 17)
Dec (10, 21)
South coast of Korea, East China Sea, Heuksan Is. Jeju Is. Jangmok, Seogwipo, Jangcheon, Busan, Gangjeong, Wando, Jeju, Gamcheon, Jinhae, Gwangyang, Yeosu and Jangseungpo port
East Sea 91/33 Ulleung Is., Dokdo Is., Yeongil Bay Sadong, Pohang, Mukho, Sokcho, Ulsan and Imwon port
West Sea 12/1 Yellow Sea Gunsan port
JANGMOK 1 South Sea 102/186 Jan (0, 31)
Feb (8, 20)
Mar (7, 24)
Apr (27, 3)
May (15, 16)
Jun (26, 4)
Jul (15, 16)
Aug (17, 14)
Sep (2, 28)
Oct (15, 16)
Nov (8, 22)
Dec (1, 30)
South coast of Korea, Korea strait, Jeju Is. Jangmok, Jangseungpo, Wando, Gangjeong, Swimi, Yeosu, Busan, Mokpo, Bigeumdo, Gukdong and Yokjido port
East Sea 39/38 Jumunjin and Ulsan coast Pohang, Mukho, Ulsan, Onsan, Imwon, Jukbyeon port
West Sea 0/0 - -
JANGMOK 2 South Sea 54/78 Jan (0, 31)
Feb (11, 17)
Mar (11, 20)
Apr (2, 28)
May (4, 27)
Jun (29, 1)
Jul (5, 26)
Aug (3, 28)
Sep (28, 2)
Oct (31, 0)
Nov (14, 16)
Dec (0, 31)
South coast of Korea Busan, Jangseungpo, Wando, Jinhae, Jangmok, Jangseungpo and Tongyeong port
East Sea 43/115 East coast of Korea, Ulleung Is., Dokdo Is. Pohang, Sokcho, Jumunjin, Jukbyeon, Hyeongpo and Mukho port
West Sea 41/34 Eocheong Is., Baengnyeong Is., Daecheong Is., Eocheongdo and Baengnyeongdo port
http://kumos.kiost.ac.kr
Table 6. Similarity percentage (SIMPER) results showing the average abundance, the average dissimilarity, the percentage contribution of each species to the dissimilarity among the vessel community groups, the percentage cumulative dissimilarity, and the average dissimilarity of the groups (Group A: Isabu, Group B: Onnuri, Group C: Jangmok 1, Group D: Eardo and Jangmok 2).
Species Av. Abund. Av. Abund. Av. Diss. Contrib. % Cum. % Group Av. Diss. %
Group A Group B
Amphibalanus improvisus 0.0 4.0 12.9 18.6 18.6 69.0
Balanus trigonus 0.0 2.7 8.6 12.5 31.1
Conchoderma auritum 2.0 0.0 6.3 9.1 40.3
Group A Group C
Amphibalanus improvisus 0.0 4.8 9.4 12.5 12.5
Balanus trigonus 0.0 4.4 8.6 11.4 23.9 75.5
Magallana gigas 0.0 2.7 5.2 6.8 30.7
Amphibalanus amphitrite 5.3 7.7 4.7 6.2 36.9
Group A Group D
Balanus trigonus 0.0 6.4 11.1 12.3 12.3
Magallana gigas 0.0 4.2 7.3 8.1 20.3 90.6
Hydroides ezoensis 0.0 3.9 7.0 7.7 28.1
Amphibalanus amphitrite 5.3 3.5 6.6 7.3 35.4
Mytilus galloprovincialis 0.0 3.2 5.6 6.2 41.6
Group B Group C
Amphibalanus amphitrite 3.9 7.7 6.8 13.2 13.2
Planocera reticulata 0.0 2.3 4.0 7.8 21.0 51.3
Nereis multignatha 0.0 2.0 3.5 6.7 27.8
Cirolana koreana 0.0 1.9 3.3 6.4 34.1
Balanus trigonus 2.7 4.4 3.0 5.9 40.0
Group B Group D
Balanus trigonus 2.7 6.4 5.8 8.9 8.9 64.8
Amphibalanus amphitrite 3.9 3.5 5.7 8.8 17.7
Amphibalanus improvisus 4.0 0.8 5.3 8.1 25.9
Group C Group D
Amphibalanus amphitrite 7.7 3.5 5.5 8.9 8.9
Amphibalanus improvisus 4.8 0.8 4.9 8.0 16.9 61.6
Hydroides ezoensis 0.0 3.9 4.8 7.7 24.6
Mytilus galloprovincialis 0.0 3.2 3.8 6.2 30.9
Table 7. One-way ANOSIM pairwise tests for differences between vessel groups for hull-fouling macroinvertebrates (Global R = 0.532, p < 0.001).
Vessel Clusters R Statistic Significance Level (p) Possible Permutations Actual Permutations Number ≥ Observed
Isabu vs. Onnuri 0.34 0.029 35 35 1
Isabu vs. Eardo 0.35 0.057 35 35 2
Isabu vs. Jangmok 1 1.00 0.029 35 35 1
Isabu vs. Jangmok 2 1.00 0.029 35 35 1
Onnuri vs. Eardo 0.08 0.229 35 35 8
Onnuri vs. Jangmok 1 0.32 0.029 35 35 1
Onnuri vs. Jangmok 2 0.39 0.029 35 35 1
Eardo vs. Jangmok 1 0.46 0.029 35 35 1
Eardo vs. Jangmok 2 0.64 0.029 35 35 1
Jangmok 1 vs. Jangmok 2 1.00 0.029 35 35 1
Table 8. Spearman rank correlation (ρ) of the variables of the biological indices and operating conditions of vessels (Abbreviations: TODs, total operation days; TADs, total anchoring days; CODs, coastal operation days; OODs, ocean operation days).
Variables No. of Species No. of Individuals Biomass H′ J′ TOD TAD COD
No. of species
No. of individuals (ind./㎡) 0.760***
Biomass (gWWt./㎡) 0.755*** 0.755***
H′(loge), Diversity index 0.742*** NS 0.48*
J′, Evenness index NS NS NS 0.82***
Total operation days (TODs) NS NS NS -0.625** -0.576**
Total anchoring days (TADs) NS NS NS 0.625** 0.576** -1***
Coastal operation days (CODs) 0.668** 0.658** 0.686** 0.507* NS -0.671** 0.671**
Ocean operation days (OODs) -0.668** -0.658** -0.686** -0.507* NS 0.671** -0.671** -1***
Significance level alpha = 0.05 (*p < 0.05, **p < 0.01, ***p < 0.001, NS: non-significant)
Disclaimer/Publisher’s Note: The statements, opinions and data contained in all publications are solely those of the individual author(s) and contributor(s) and not of MDPI and/or the editor(s). MDPI and/or the editor(s) disclaim responsibility for any injury to people or property resulting from any ideas, methods, instructions or products referred to in the content.
Copyright: This open access article is published under a Creative Commons CC BY 4.0 license, which permit the free download, distribution, and reuse, provided that the author and preprint are cited in any reuse.
Prerpints.org logo

Preprints.org is a free preprint server supported by MDPI in Basel, Switzerland.

Subscribe

© 2024 MDPI (Basel, Switzerland) unless otherwise stated