Introduction
The human phospholipase B precursor (HPLB-P) was originally purified from white blood cells obtained from healthy human blood donors and was at that time only known as a hypothetical protein based on sequence analysis of the human genome [
1]. Subsequently we identified the nature of this protein since it displayed phospholipase activities with the ability to remove fatty acids from both sn-1 and sn-2 bonds in phospholipids, thus potentially giving rise to a broad panel of active fatty acid molecules when released from its cellular origin.
By means of our specific polyclonal antibodies most human organ tissues were screened by immunohistochemistry for the expression of HPLBII-P [
2]. Three organ tissues expressed the protein particularly well. These were neuronal cells, gastrointestinal and kidney tissues in addition to bone marrow cells. By means of ELISA we measured HPLB-P in gastrointestinal material and found interesting relations to GI diseases such as IBS [
3] and IBD [
2]. Our assay also allows for the measurement of the very low concentrations found in urine and such measurements showed in a cohort of COVID-19 this biomarker to be closely related to acute kidney injury (AKI). We also observed in this cohort highly raised urine concentrations of HPLBII-P in a subgroup of patients with diabetes mellitus which prompted us to investigate such a relationship further. For this purpose, we have measured HPLBII-P in urine in two community-based cohorts of elderly men and women i.e. the ULSAM and PIVUS cohorts. The ULSAM study (t
he Uppsala Longitudinal Study of Adult Men) was initiated in 1969-1974 with focus on the study of diabetes and cardiovascular disease [
4]
. The PIVUS cohort (The Prospective Investigation of the Vasculature in Uppsala Seniors (PIVUS) Study) was collected in the early 2000 and consisted of both males and females [
5]. Our object was to compare the urine concentrations of HPLBII-P in these two cohorts to other currently used biomarkers of diabetes mellitus. The question that we raised was whether HPLBII-P might be a useful biomarker in urine for the management of diabetes mellitus.
Material and Methods
The urine samples of the ULSAM cohort of men were collected at 77 years of age (n=839). The collection was finalized 2001 (sampling period 1998–2001). The urine samples of the PIVUS cohort were collected when 75 years of age and contained 401 samples from women and 387 samples from men. All samples were stored in aliquots at -80oC.
The healthy control group consisted of 45 women (median age 32 years, range 22-64 years) and 19 men (median age 26 years, range 22-63 years).
The studies were approved by the ethics committee of Uppsala University (ULSAM: Dnr97329, October 14, 1997 and PIVUS: Dnr 2005-M079) and the Declaration of Helsinki and its subsequent revisions were followed.
Immunohistochemistry of kidney tissue was performed by the use of the rabbit polyclonal antibody raised against HPLBII-P and documented in the Human Protein Atlas (The Human Protein Atlas,
www.proteinatlas.org).
HPLBII-P was measured by ELISA (Diagnostics Development, Uppsala, Sweden). The measurement of Cathepsin S (DY1183), NGAL (DY1757) and KIM-1 (DY1750) were performed by ELISA kits purchased from R&D systems (Minneapolis, MN, USA). All clinical data were blinded to the analysing personal. The analytical performances of the ELISA:s were acceptable with CVs (Coefficient of Variation) in the range of 4-10% of duplicate samples.
Albumin, Creatinine, Cystatin C were all measured in urine or serum/plasma as part of the clinical routine and performed by the clinical chemistry laboratory at the University Hospital, Uppsala, Sweden.
Statistics
Non-parametric statistics was applied throughout unless otherwise indicated. For comparison between independent results Mann-Whitney U test was used and for the comparison of the results of multiple groups Kruskal-Wallis ANOVA was used. Correlations between biomarkers were calculated by Spearman rank correlations. The statistical programme Medcalc was used in all calculations: MedCalc® Statistical Software version 20.106 (MedCalc Software Ltd, Ostend, Belgium;
https://www.medcalc.org; 2022)
Results
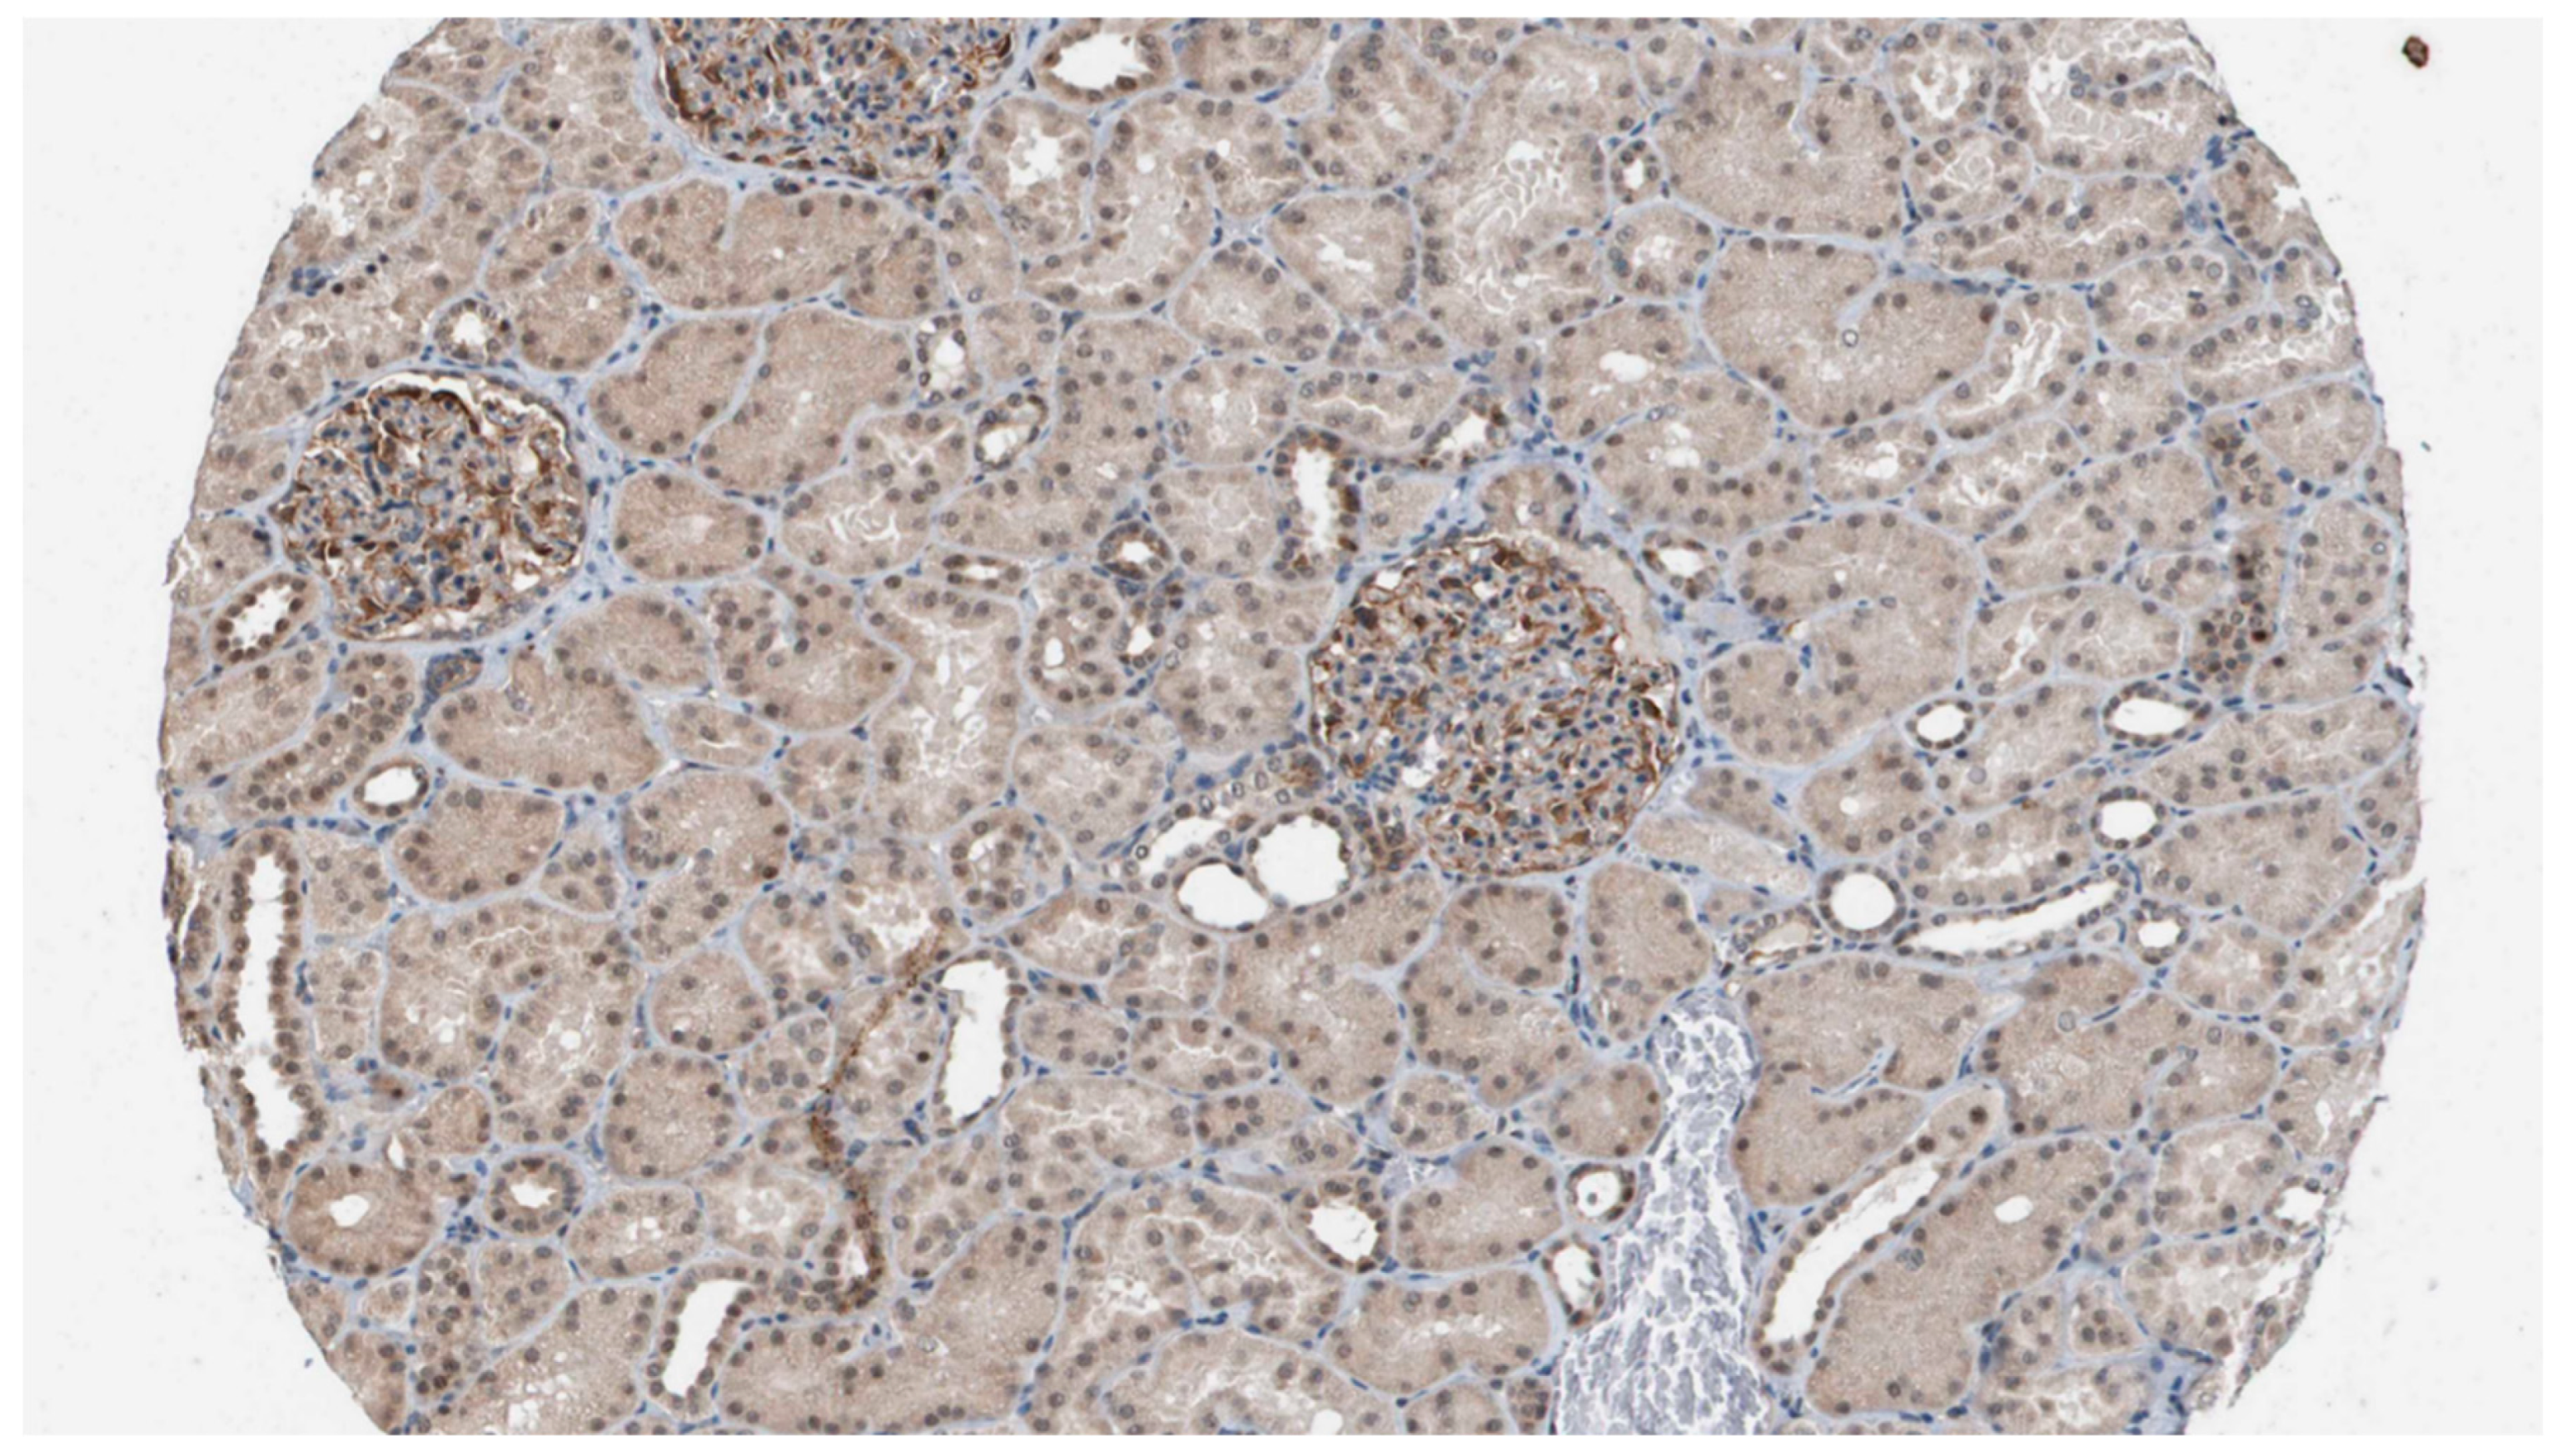
Staining of kidney tissue with the polyclonal antibodies raised against HPLBII-P showed distinct staining of podocytes in the glomeruli (
Figure 1). Weak staining was also seen in some collecting ducts, but in few tubular cells.
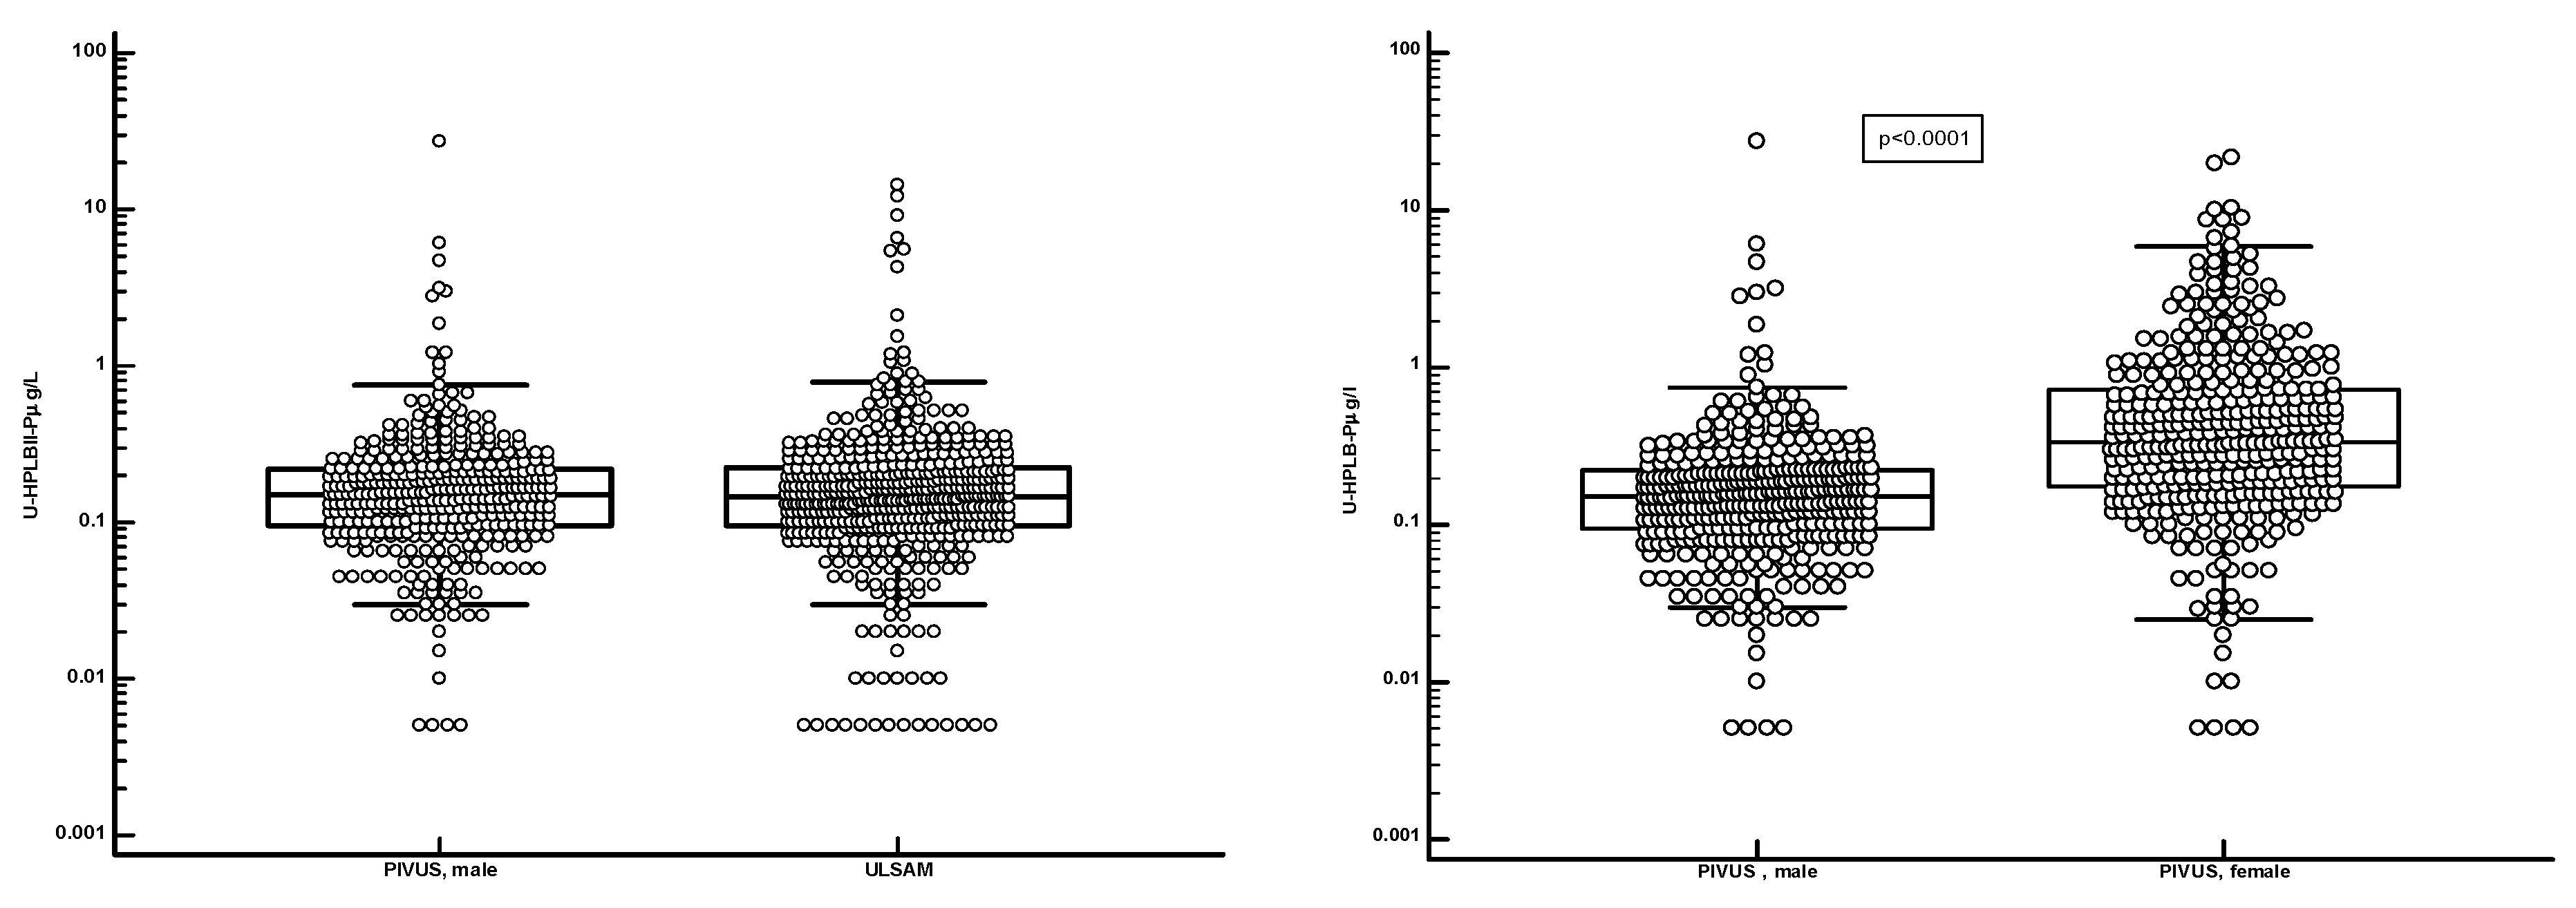
Figure 2 shows the distribution of HPLBII-P in urine of the ULSAM and PIVUS cohorts. The concentrations of HPLBII-P were similar in the male ULSAM cohort and in the male subcohort of PIVUS. A highly significant difference (p<0.0001), however, was observed between males and females in the PIVUS cohort. It is shown in
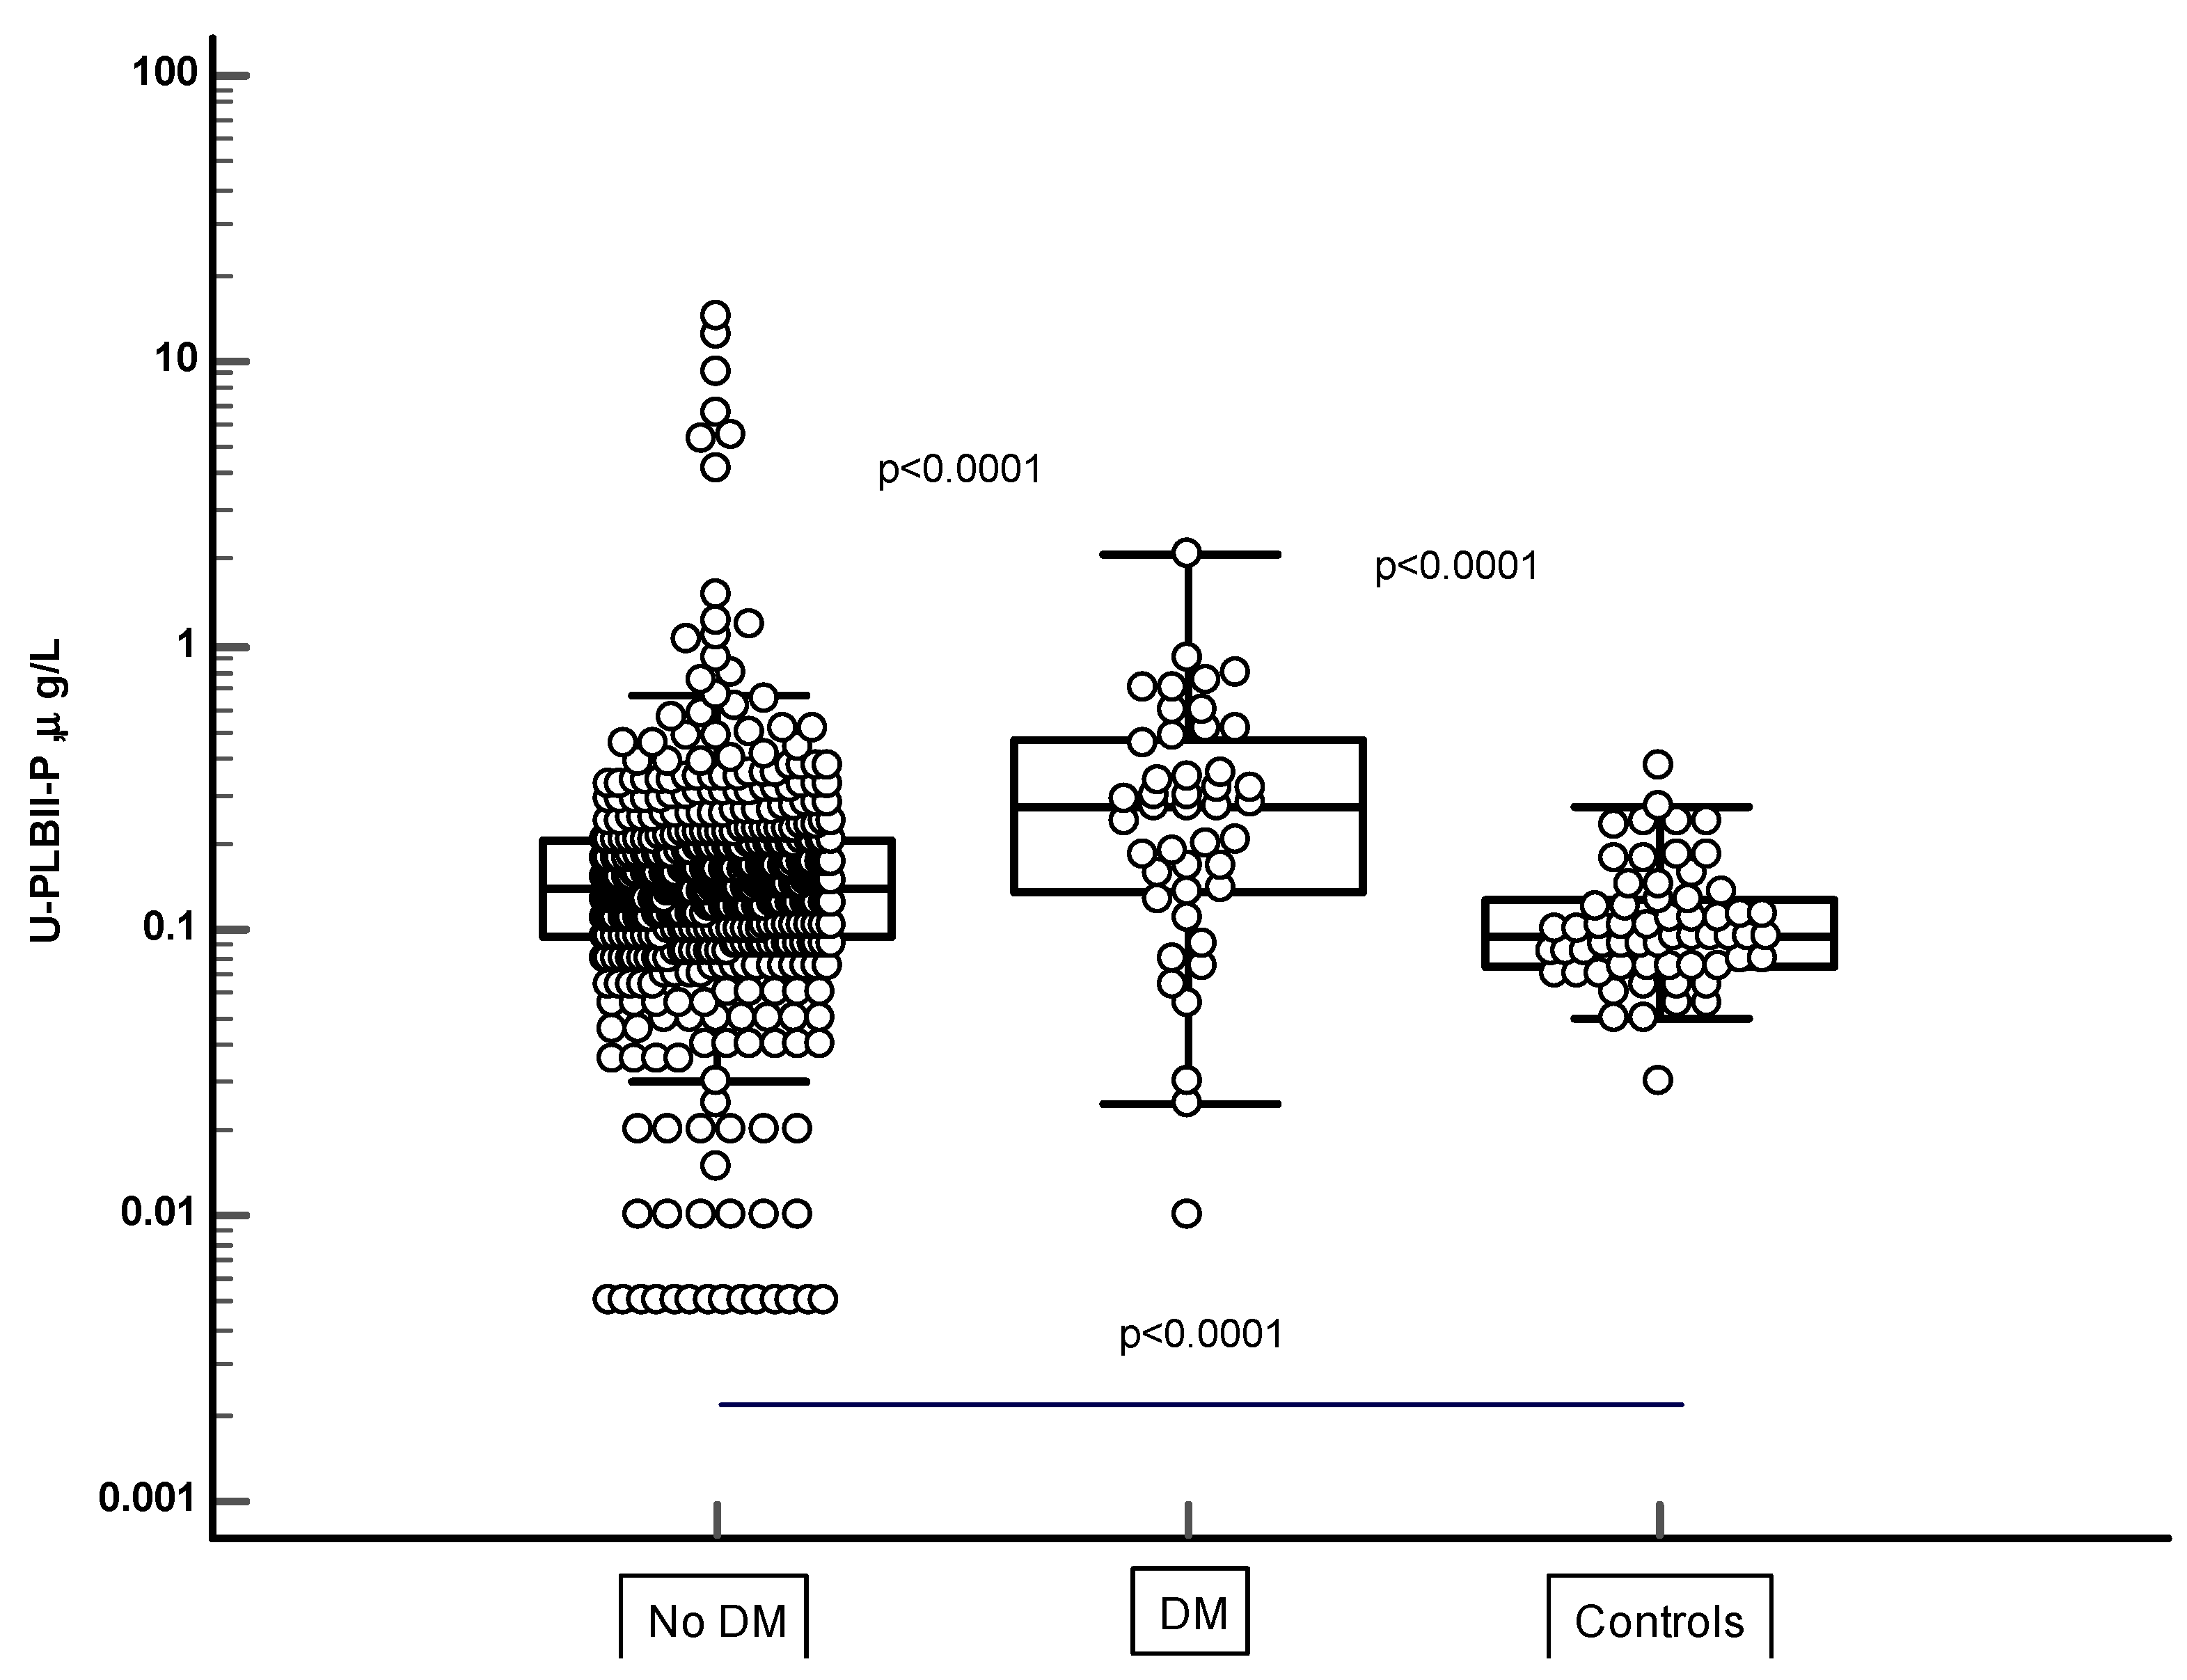
Figure 3 that the concentrations were significantly elevated in the PIVUS cohorts, both in males and in females, as compared to a group of younger healthy controls [females; age 35 years (95% CI 27-45) and males; age 27 years (95% CI 26-34)]. No difference between genders was seen in the control group. Also, the concentrations in the ULSAM cohort were significantly elevated as compared to the male subgroup of the healthy controls (p<0.0001) (
Figure 4). In the supplementary file we show the results in the PIVUS cohort after correction for urine Creatinine concentrations. The difference between males and females became even larger after such correction (p<0.0001).
In
Figure 4 the HPLBII-P concentrations in urine are shown in two populations of the ULSAM cohort i.e. in those with no diagnosis of diabetes mellitus ( n=466) and in those with the diagnosis of diabetes mellitus (n=44). The HPLBII-P concentrations were significantly higher in diabetes mellitus (p<0.0001). In the PIVUS cohort, a significant elevation of the concentrations of HPLBII-P in the diabetics was only seen among males (p=0.018 and p=0.003 after urine Creatinine correction), but not in females (
Table 1). Significantly higher concentrations were observed in subjects with diabetes treated with insulin as compared to those with no insulin treatment, either in comparison with the whole cohort without insulin (p=0.026), or in comparison with the subjects who were treated with oral antidiabetics only (p=0.028). A similar trend was seen in the ULSAM population although the number of insulin-treated subjects was low i.e. n=3.
Plasma glucose and HbA1c were recorded in the ULSAM study.
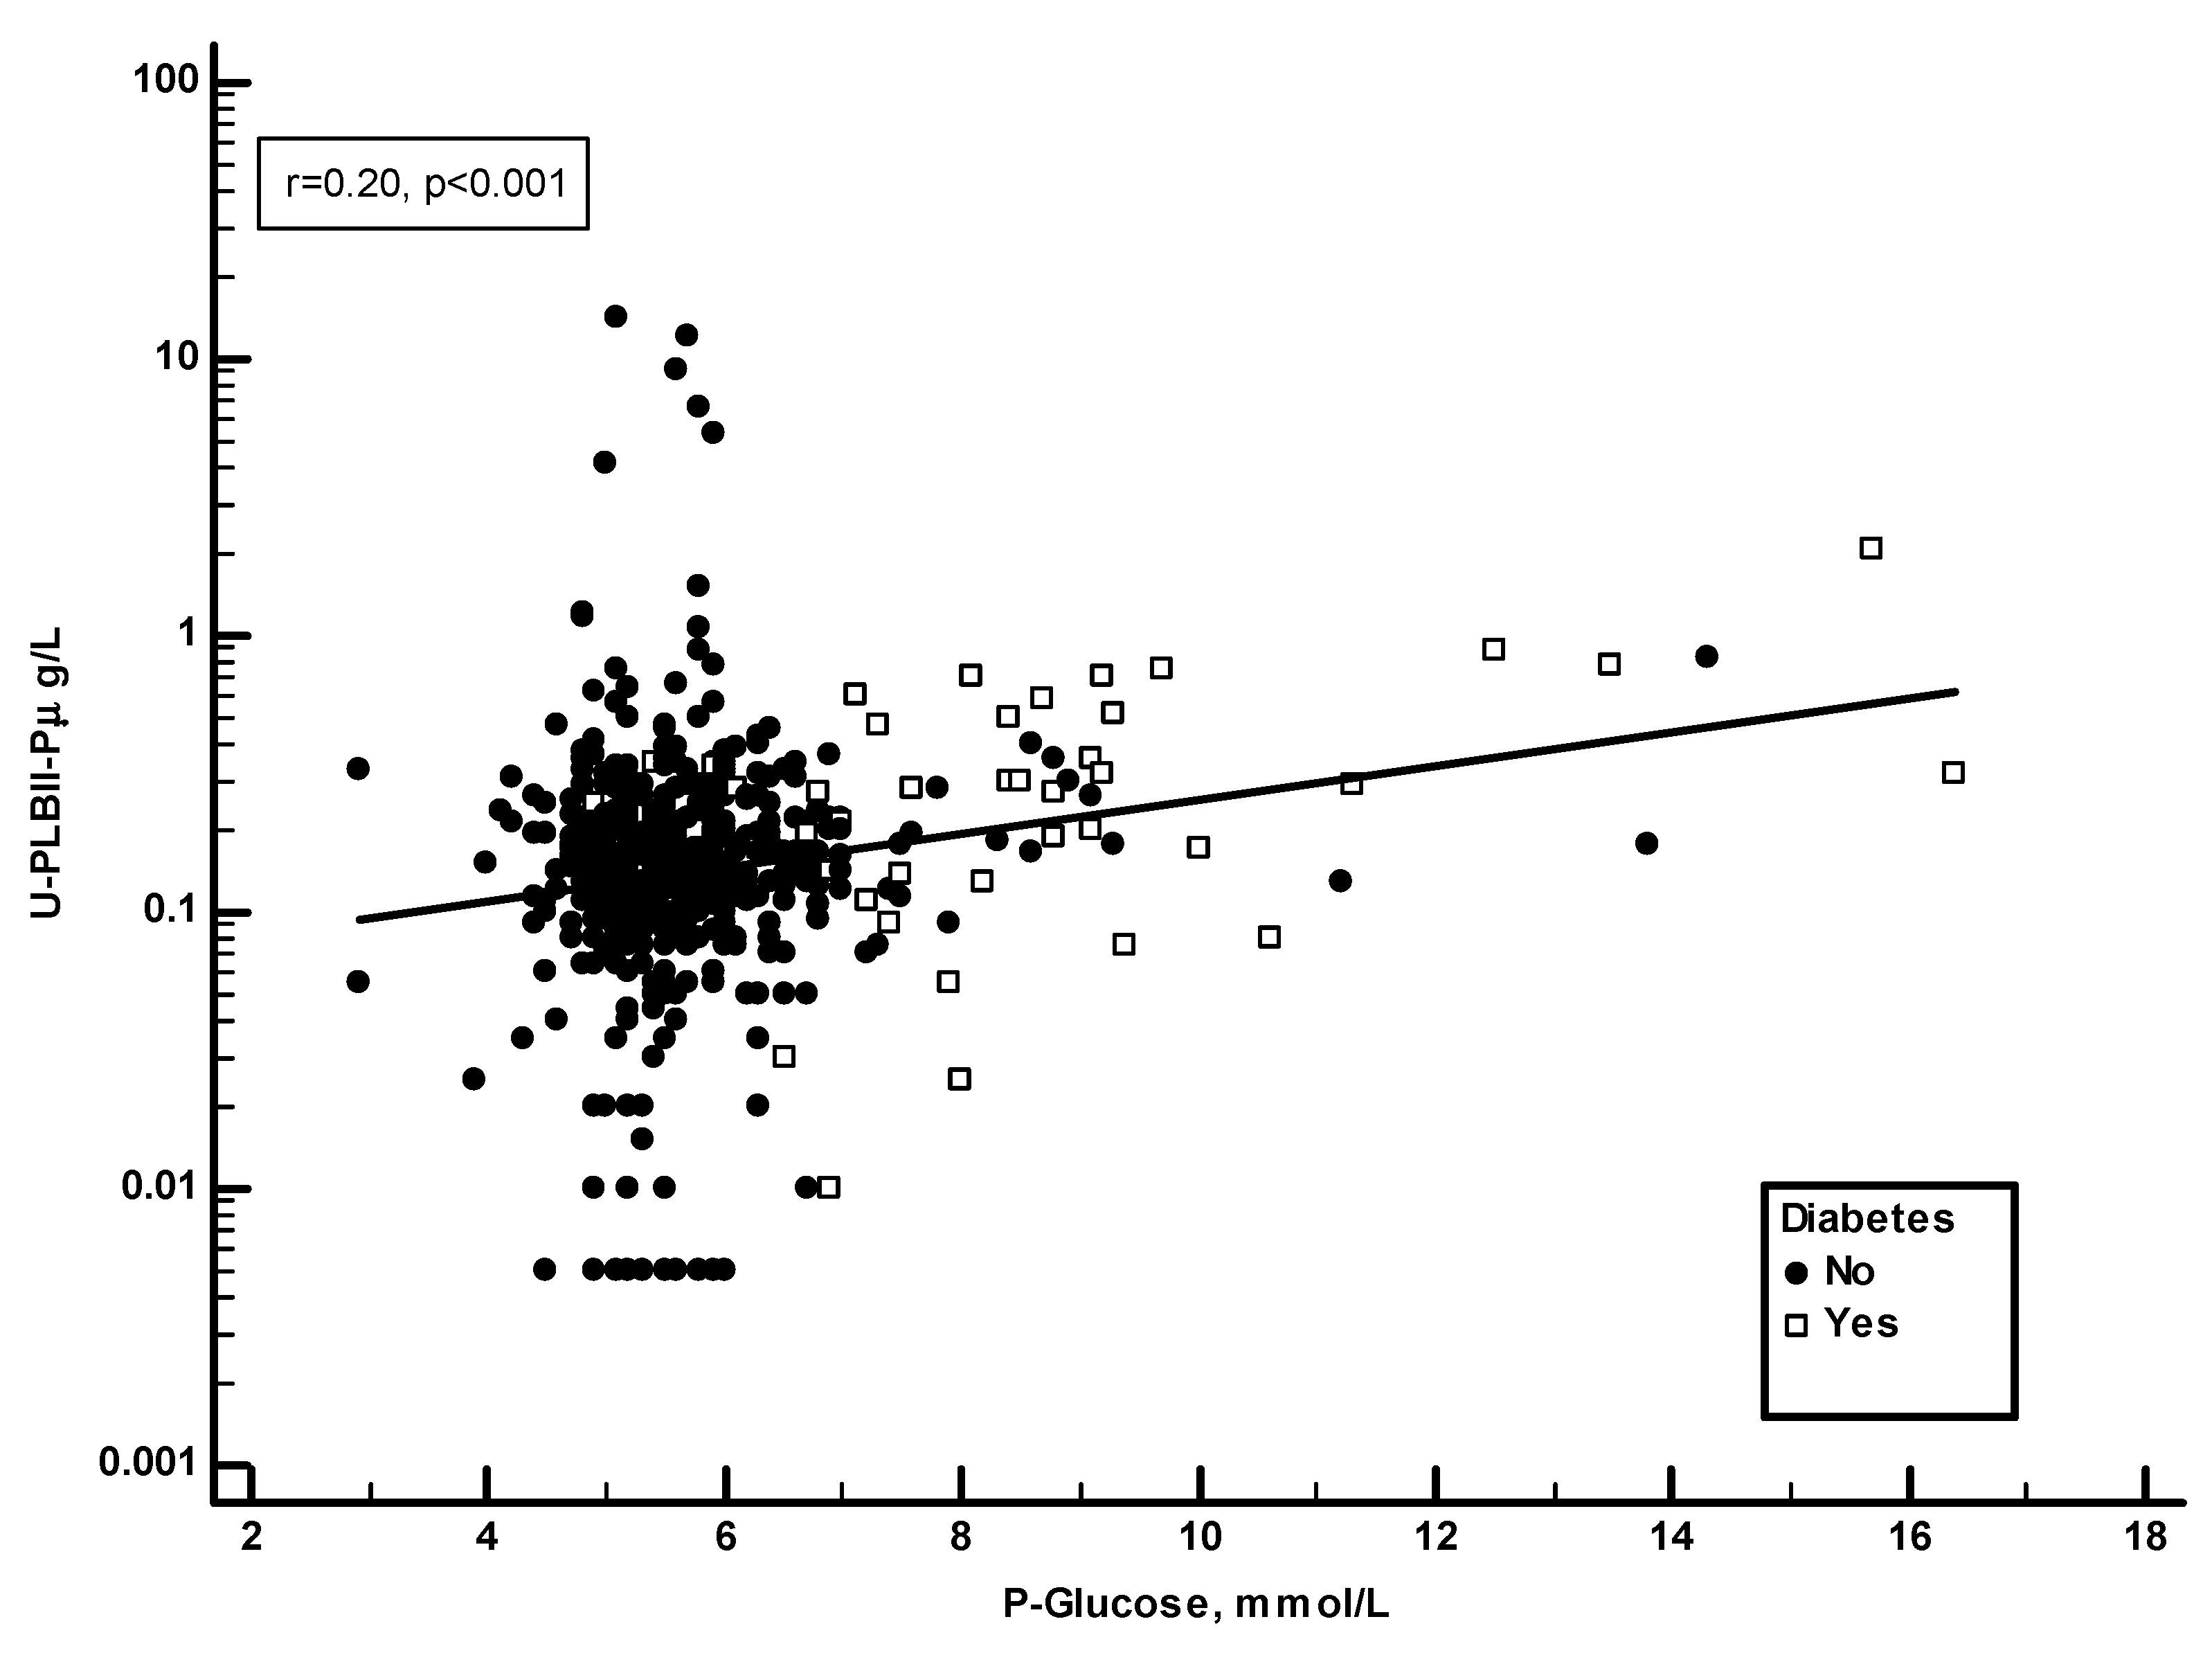
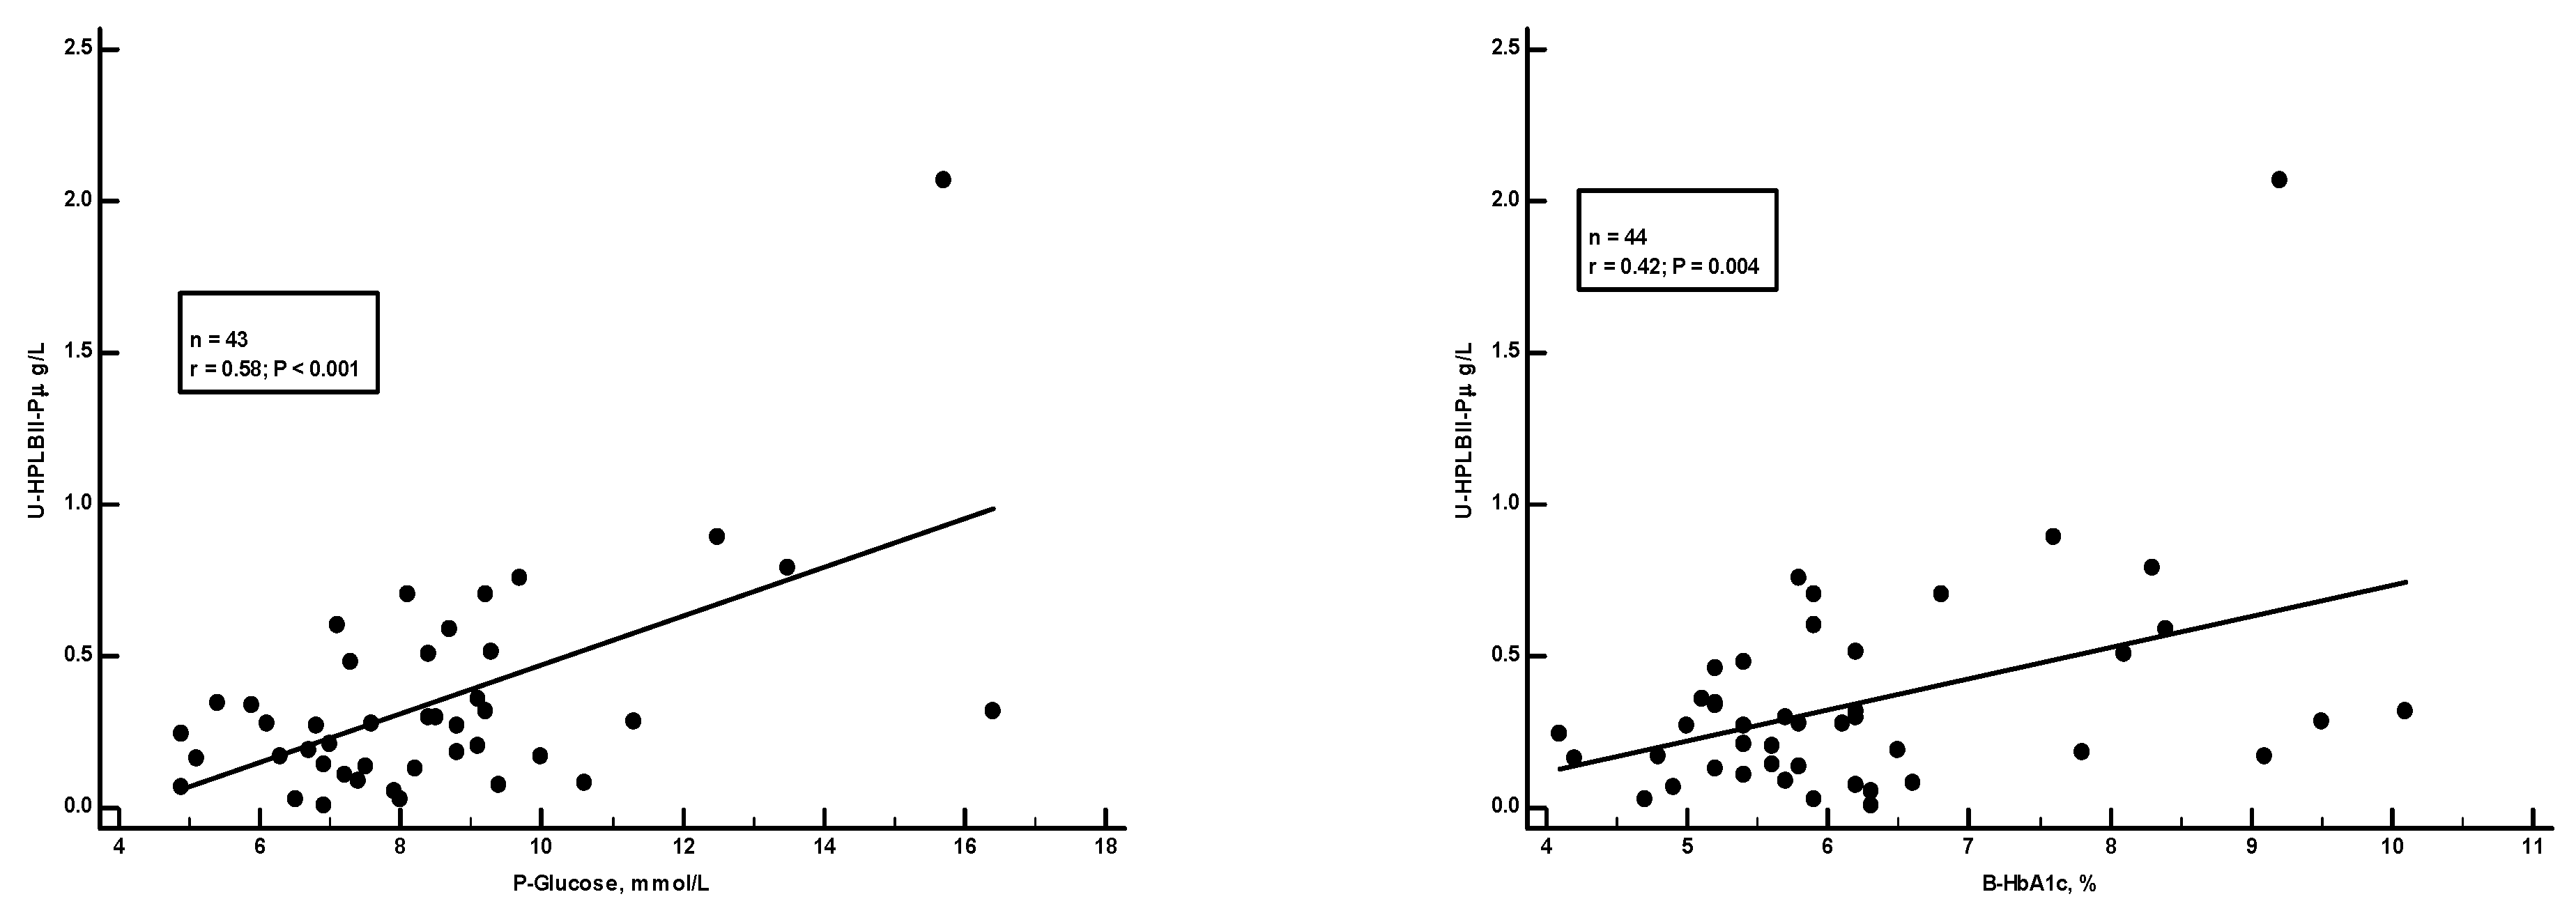
Figure 5 shows a significant positive correlation in the ULSAM cohort between HPLBII-P and plasma glucose (r=0.20, p<0.001). However, as suggested on the figure, this correlation was mainly due to findings in those subjects with diabetes mellitus. By the calculation of correlations on the subgroup of diabetics separately a strong correlation (r=0.58, p<0.001) was found to plasma glucose, but also to the proportion of HbA1c in blood (r=0.42, p=0.004) (
Figure 6).
In
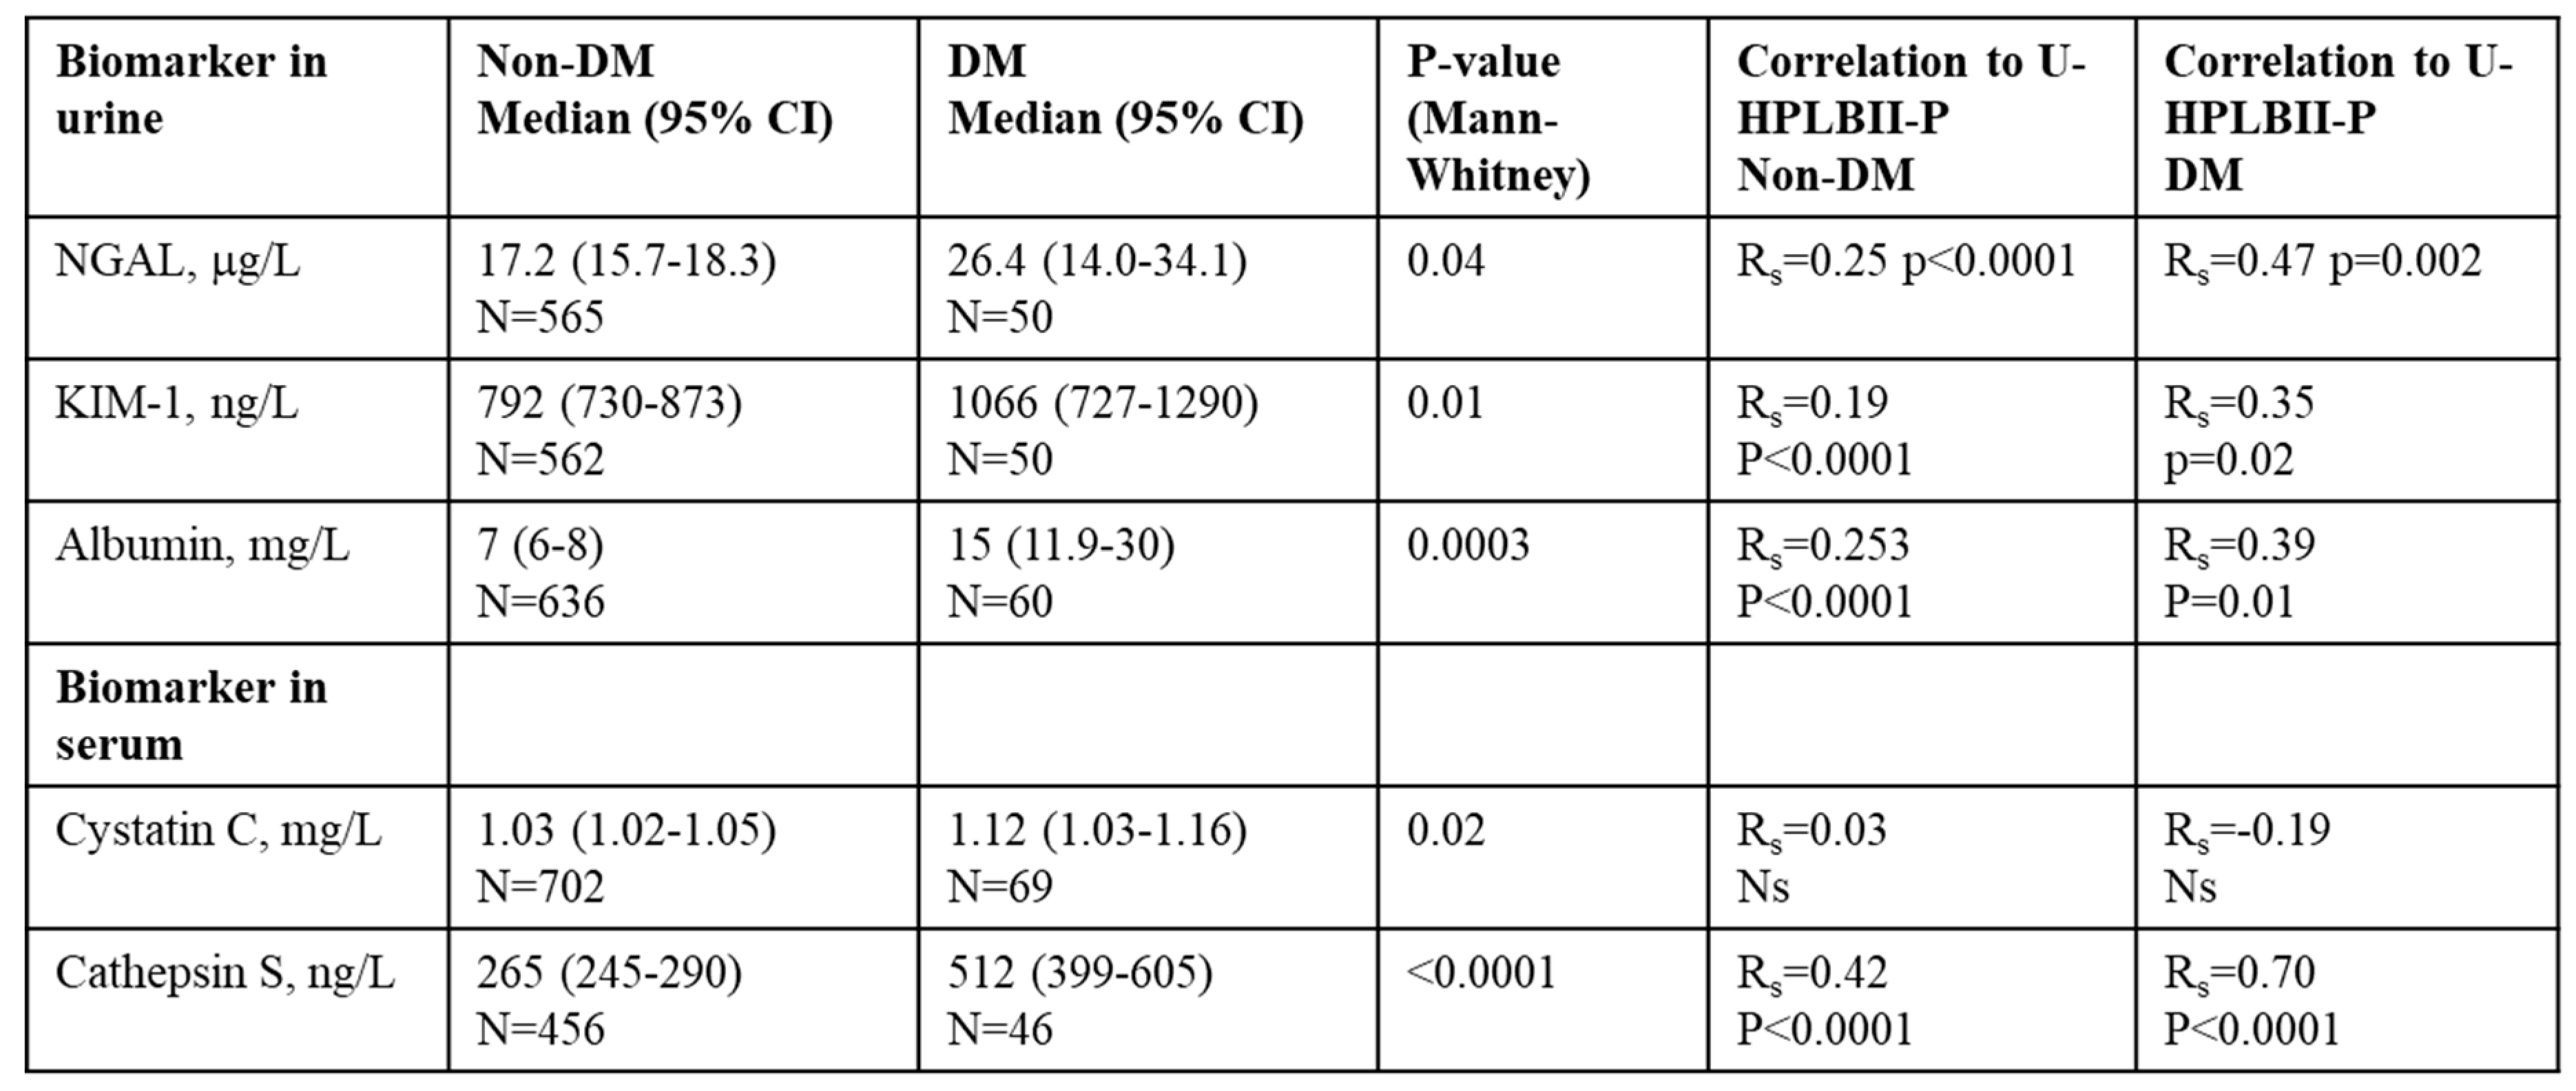
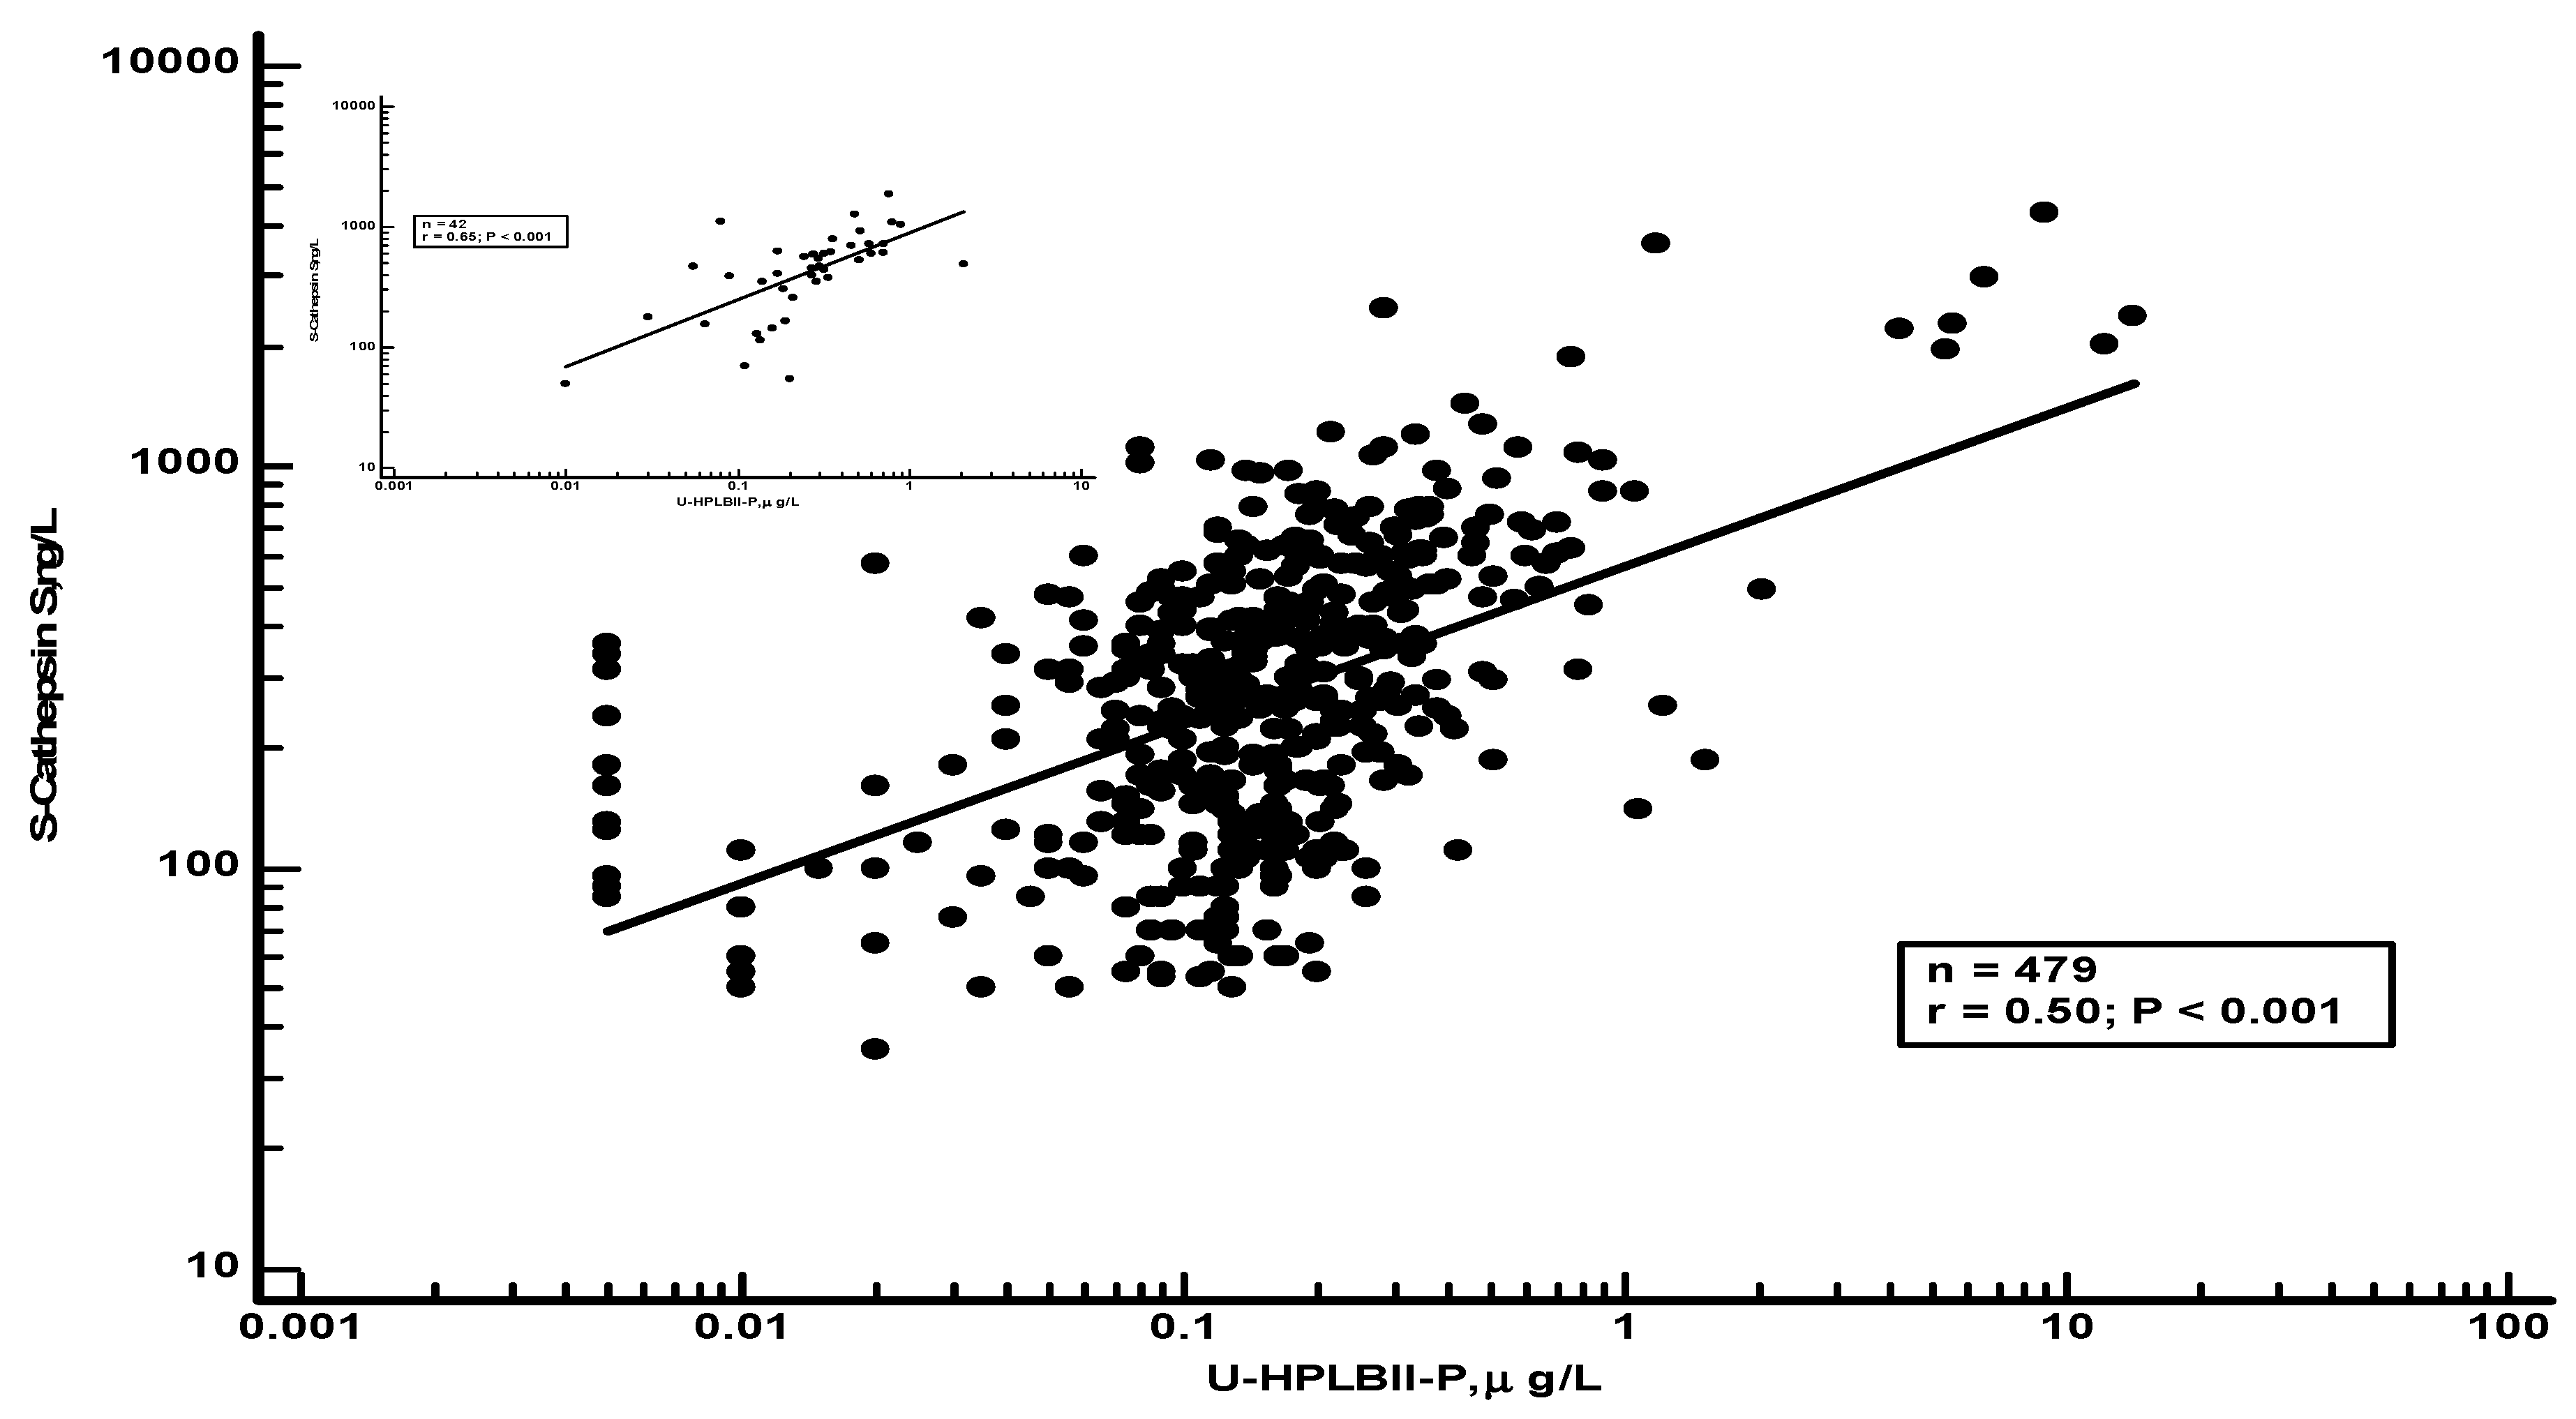
Table 2 we show results of selected biomarkers and their correlations to HPLBII-P in urine from non-diabetics or diabetics. Significant correlations were found to the kidney tubular biomarkers NGAL and KIM-1 in urine, as well as to the glomerular biomarker albumin in urine. However, the strongest correlations were seen between Cathepsin S in serum and the urine concentrations of HPLBII-P (
Figure 7). After correction for Creatinine concentrations in urine similar results were obtained as without correction (Supplementary table 1).
Table 2.
Biomarkers in urine and serum in the subpopulations of diabetes and non-diabetes in the ULSAM cohort and their correlations to HPLBII-P in urine.
Table 2.
Biomarkers in urine and serum in the subpopulations of diabetes and non-diabetes in the ULSAM cohort and their correlations to HPLBII-P in urine.
No relations of urine concentrations of HPLBII-P to filtration biomarkers such as serum creatinine (PIVUS) or plasma cystatin C (ULSAM) were observed.
Discussion
The data in this report confirms our previous findings of HPLBII-P being closely related to the glomerular function of diabetes mellitus as measured by albumin excretion and to the tubular function as measured by the close relationships to the tubular biomarkers KIM-1 and NGAL (submitted). The association of these biomarkers to diabetes have been investigated previously in numerous studies [
6]. The relationships of these biomarkers to HPLBII-P were also true for the two community-based populations of females and males in the ULSAM and PIVUS cohorts. However, several other key findings were also obtained in the study of these two cohorts. One was the much higher overall urine concentrations of HPLBII-P in females as compared to males and with no significant differences between those with diabetes mellitus and the non-diabetics. Another was the higher concentrations in both cohorts as compared to a healthy cohort of younger people. Thus, both gender and age seemed to determine the excretion of HPLBII-P. The third unexpected observation was the higher concentrations of HPLBII-P in urine in patients treated with insulin and which was most obvious in females of the PIVUS cohort. A fourth intriguing observation was the very close correlation to the biomarker Cathepsin S in serum.
Given the fact that the presence of HPLBII-P most likely is a consequence of local processes in the kidney, the raised concentrations of this biomarker probably reflect the conditions of the glomeruli. One may be the structural changes and injury of the glomeruli and their podocytes as part of a nephrosclerotic process which is known to affect the majority of elderly people [
7]. An alternative interpretation is the increased secretory activity of the podocytes for which interpretation no support or evidence is presently at hand. However, hyperglycaemia was shown to affect podocytes directly [
8] and we indeed found significant correlations between HPLBII-P in urine and plasma glucose concentration in this and in our previous report. Also injury to the podocytes might result in increased concentrations of HPLBII-P in urine and increased podocyte mRNA [
9] and nephrin [
10]in the urine were suggested to reflect podocyte injury in patients with diabetes mellitus. Against the simple interpretation of the raised urine output of HPLBII-P being a consequence of aging is the fact that elderly women were found to have much higher concentrations in their urine than the elderly males. Thus, the aging processes of the kidney was previously shown to affect sexes differently with a faster decline in kidney function in males [
11,
11,
12]. The higher output of HPLBII-P in women therefore remains unexplained. The elevated risk of patients with diabetes type 1 to develop organ failure such as kidney failure is well established [
6] and may also be reflected in our findings by the highly elevated concentrations of HPLBII-P in urine in these patients. In this regard we did not see any gender differences although the number of patients was small.
In our earlier studies we found that the serum biomarker Cathepsin S was associated with the risk of developing diabetes probably by impairing insulin sensitivity [
13]. In this report we found a remarkable association between Cathepsin S and the urine output of HPLBII-P, not only in the subgroup of patients with diabetes mellitus, but also in the whole ULSAM cohort of elderly men. Cathepsin S is a macrophage derived proteolytic enzyme and has been implicated in the destruction of glomerular structures in many renal diseases [
14]. The close correlation with HPLBII-P, therefore, indicates that HPLBII-P may be an interesting biomarker in the monitoring of glomerular function in diabetes mellitus and other renal disease.
We conclude from this study that the urine biomarker HPLBII-P is a sensitive reflection of glomerular function and activity in patients with diabetes mellitus, but also in non-diabetic aging populations. We hypothesize that HPLBII-P is a reflection of podocyte function, the function of which is a possible key to the understanding of diabetic nephropathy as suggested by Reddy et al several years ago [
15]. This biomarker therefore has the potential to become a clinical tool in the monitoring of the kidney function and in the prevention of the development of chronic kidney disease. Our findings merit further investigations of the potential clinical utility of HPLBII-P in urine.
References
- Xu, S.; Zhao, L.; Larsson, A.; Venge, P. The identification of a phospholipase B precursor in human neutrophils. FEBS J 2009, 276, 175–186. [Google Scholar] [CrossRef] [PubMed]
- Xu, S.; Cai, L.; Zhao, L.; Douhan-Hakansson, L.; Kristjansson, G.; Pauksen, K.; et al. Tissue localization and the establishment of a sensitive immunoassay of the newly discovered human phospholipase B-precursor (PLB-P). J Immunol Methods 2010, 353, 71–77. [Google Scholar] [CrossRef] [PubMed]
- Castro, T. ; V; Ohman, L. ; Aabakken, L.; Fellstrom, B.; Hausken, T.; Hovde, O.; et al. Randomised clinical trial and meta-analysis: Mesalazine treatment in irritable bowel syndrome-effects on gastrointestinal symptoms and rectal biomarkers of immune activity. Aliment Pharmacol Ther 2022, 56, 968–979. [Google Scholar]
- Lithell, H.; Sundstrom, J.; Arnlov, J.; Bjorklund, K.; Hanni, A.; Hedman, A.; et al. Epidemiological and clinical studies on insulin resistance and diabetes. Ups J Med Sci 2000, 105, 135–150. [Google Scholar] [CrossRef] [PubMed]
- Lind, L.; Fors, N.; Hall, J.; Marttala, K.; Stenborg, A. A comparison of three different methods to evaluate endothelium-dependent vasodilation in the elderly: The Prospective Investigation of the Vasculature in Uppsala Seniors (PIVUS) study. Arterioscler Thromb Vasc Biol 2005, 25, 2368–2375. [Google Scholar] [CrossRef] [PubMed]
- Pavkov, M.E.; Collins, A.J.; Coresh, J.; Nelson, R.G. Kidney Disease in Diabetes. 2018 Aug.
- O'Sullivan, E.D.; Hughes, J.; Ferenbach, D.A. Renal Aging: Causes and Consequences. J Am Soc Nephrol 2017, 28, 407–420. [Google Scholar] [CrossRef] [PubMed]
- Mohandes, S.; Doke, T.; Hu, H.; Mukhi, D.; Dhillon, P.; Susztak, K. Molecular pathways that drive diabetic kidney disease. J Clin Invest 2023, 133. [Google Scholar] [CrossRef] [PubMed]
- Sato, Y.; Wharram, B.L.; Lee, S.K.; Wickman, L.; Goyal, M.; Venkatareddy, M.; et al. Urine podocyte mRNAs mark progression of renal disease. J Am Soc Nephrol 2009, 20, 1041–1052. [Google Scholar] [CrossRef]
- Kondapi, K.; Kumar, N.L.; Moorthy, S.; Silambanan, S. A Study of Association of Urinary Nephrin with Albuminuria in Patients with Diabetic Nephropathy. Indian J Nephrol 2021, 31, 142–148. [Google Scholar]
- Valdivielso, J.M.; Jacobs-Cacha, C.; Soler, M.J. Sex hormones and their influence on chronic kidney disease. Curr Opin Nephrol Hypertens 2019, 28, 1–9. [Google Scholar] [CrossRef] [PubMed]
- Ricardo, A.C.; Yang, W.; Sha, D.; Appel, L.J.; Chen, J.; Krousel-Wood, M.; et al. Sex-Related Disparities in CKD Progression. J Am Soc Nephrol 2019, 30, 137–146. [Google Scholar] [CrossRef]
- Jobs, E.; Riserus, U.; Ingelsson, E.; Sundstrom, J.; Jobs, M.; Nerpin, E.; et al. Serum cathepsin S is associated with decreased insulin sensitivity and the development of type 2 diabetes in a community-based cohort of elderly men. Diabetes Care 2013, 36, 163–165. [Google Scholar] [CrossRef]
- Ren, X.; Wang, W.; Cao, H.; Shao, F. Diagnostic value of serum cathepsin S in type 2 diabetic kidney disease. Front Endocrinol (Lausanne) 2023, 14, 1180338. [Google Scholar] [CrossRef]
- Reddy, G.R.; Kotlyarevska, K.; Ransom, R.F.; Menon, R.K. The podocyte and diabetes mellitus: Is the podocyte the key to the origins of diabetic nephropathy? Curr Opin Nephrol Hypertens 2008, 17, 32–36. [Google Scholar] [CrossRef]
|
Disclaimer/Publisher’s Note: The statements, opinions and data contained in all publications are solely those of the individual author(s) and contributor(s) and not of MDPI and/or the editor(s). MDPI and/or the editor(s) disclaim responsibility for any injury to people or property resulting from any ideas, methods, instructions or products referred to in the content. |
© 2024 by the authors. Licensee MDPI, Basel, Switzerland. This article is an open access article distributed under the terms and conditions of the Creative Commons Attribution (CC BY) license (http://creativecommons.org/licenses/by/4.0/).
