Preprint
Article

Simulation and Experimental Results for Energy Production Using Hybrid Photovoltaic Thermal Technology

Altmetrics

Downloads

126

Views

36

Comments

0

A peer-reviewed article of this preprint also exists.

Submitted:

17 February 2024

Posted:

18 February 2024

You are already at the latest version

Alerts
Abstract
This paper offers a theoretical and experimental examination of the concurrent production of electricity and heat using photovoltaic thermal (PV/T) technology. The efficiency performance of the PV/T system is meticulously analyzed using MATLAB/Simulink software environments. Notably, the proposed PV/T system shows reliable performance, and its validity is confirmed through experimental validation on a test stand with a single PV/T panel positioned at a 45-degree angle to the horizontal and a 0-degree azimuth angle.
Keywords: 
Subject: Engineering  -   Energy and Fuel Technology

1. Introduction

According to the graph presented by Our World Data, in the year 2022, humanity covered its primary energy needs in a proportion of 81.79% from coal, oil, and natural gas, exhaustible and polluting resources, primarily through greenhouse gas emissions, which is the leading cause of climate change [1]. The remaining 3.99% of the primary energy requirement was covered by nuclear sources and 14.22% by renewable energy. Hannah Ritchie and Pablo Rosado (2020) emphasize that burning fossil fuels and biomass brings an excessive cost to human health; at least 5 million deaths are attributed to air pollution yearly [2].

1.1. Background

Renewable energy sources, whether derived directly or indirectly from the sun, can be used for both the direct generation of heat and the conversion into electricity [3]. The revised Renewable Energy Directive EU/2023/2413 elevates the EU’s binding renewable target for 2030 to a minimum of 42.5%, a significant increase from the prior 32% target, with the goal of reaching 45% [4]. To meet this target, the states are actively promoting renewable energy sources and implementing policies and strategies to help access to such energy sources, as well as to support investments in this area [5].
By harnessing the sun’s energy directly, we can generate electricity, heat, and cold. Photovoltaic thermal panels (PV/T) represent a combination of photovoltaic (PV) panels and thermal solar collectors, enabling the simultaneous production of electricity and heat, like in Figure 1. The excess heat generated in the PV cells is reduced by solar collectors, turning it into useful thermal energy.

1.2. Brief Literature Review

Solar PV/T technology appeared during the 1970s and has now completed 50 years of existence. Over this period, the technology has been successfully proven with various design options, as shown by numerous review articles covering different themes on its progress over the last five decades [6]. Throughout this time span, hybrid PV/T panels have been studied from multiple perspectives, and their manufacturing technology has evolved to enhance electrical efficiency and perfect the use of heat extracted from the PV side [7].
A considerable number of researchers have extensively explored and modelled diverse types of hybrid panels, continually seeking more advanced technologies to improve their production [8,9,10,11,12]. Diverse ways of using PV/T panels have been proposed: systems consisting only of hybrid panels or combinations of hybrid panels with other systems for generating electricity, heat and cold [13,14,15,16,17,18,19,20,21,22].
These systems have been examined for both energy and exergy efficiency [18,23,24]. The values of electrical efficiency and exergetic efficiency of PV/T systems are higher than those of PV systems. PV/T hybrid solar panels are a practical choice for industry as well as building use, standing for a promising alternative for energy efficiency and greenhouse gas reduction.

1.3. Contribution and Paper Organization

This paper provides a comprehensive theoretical and experimental study on simultaneous electricity and heat production using PV/T technology. The study was conducted on an experimental stand featuring a SUNSYSTEM PVT 240 panel at the Thermal Power Plant of “Vasile Alecsandri” University in Bacau, Romania. The efficiency performance of the examined PV/T system is thoroughly investigated using MATLAB/Simulink and MATHCAD software environments.
This work compares the efficiency performances of two models for PV/T hybrid solar panels to choose the required and suitable model under certain specific conditions. The studied models are analyzed and compared for the first time in this way. The main contribution of the paper can be the didactic approach of the authors such that the young and new researchers in this field can study more in detail this aspect.
The rest of the paper is organized as follows. Section 2 presents the description of the studied PV/T system and their mathematical analytical calculation and respectively their thermal, electrical, and optical modeling. Section 3 presents the results and discussions of the analyzed models considering the measured and simulated parameters, as well as the global performance efficiency evaluation of the studied models in real operation of PV/T hybrid solar panels. The last section of the paper presents the conclusions of this research.

2. Materials and Methods

This section presents both the physical complete PV/T power plant used for experimental measurements and respectively the implemented simulation PV/T hybrid solar panel model used for simulation to collect obtained simulation test data to compare them with the real measured data. The real PV/T power plant is fully operational, while the high level detailed implemented simulation system model has complex parameters, including the optics and effect of temperature in the solar PV cell module (thermal and electrical) which is tremendously important for the behavior of this kind of system.

2.1. Test Stand Description

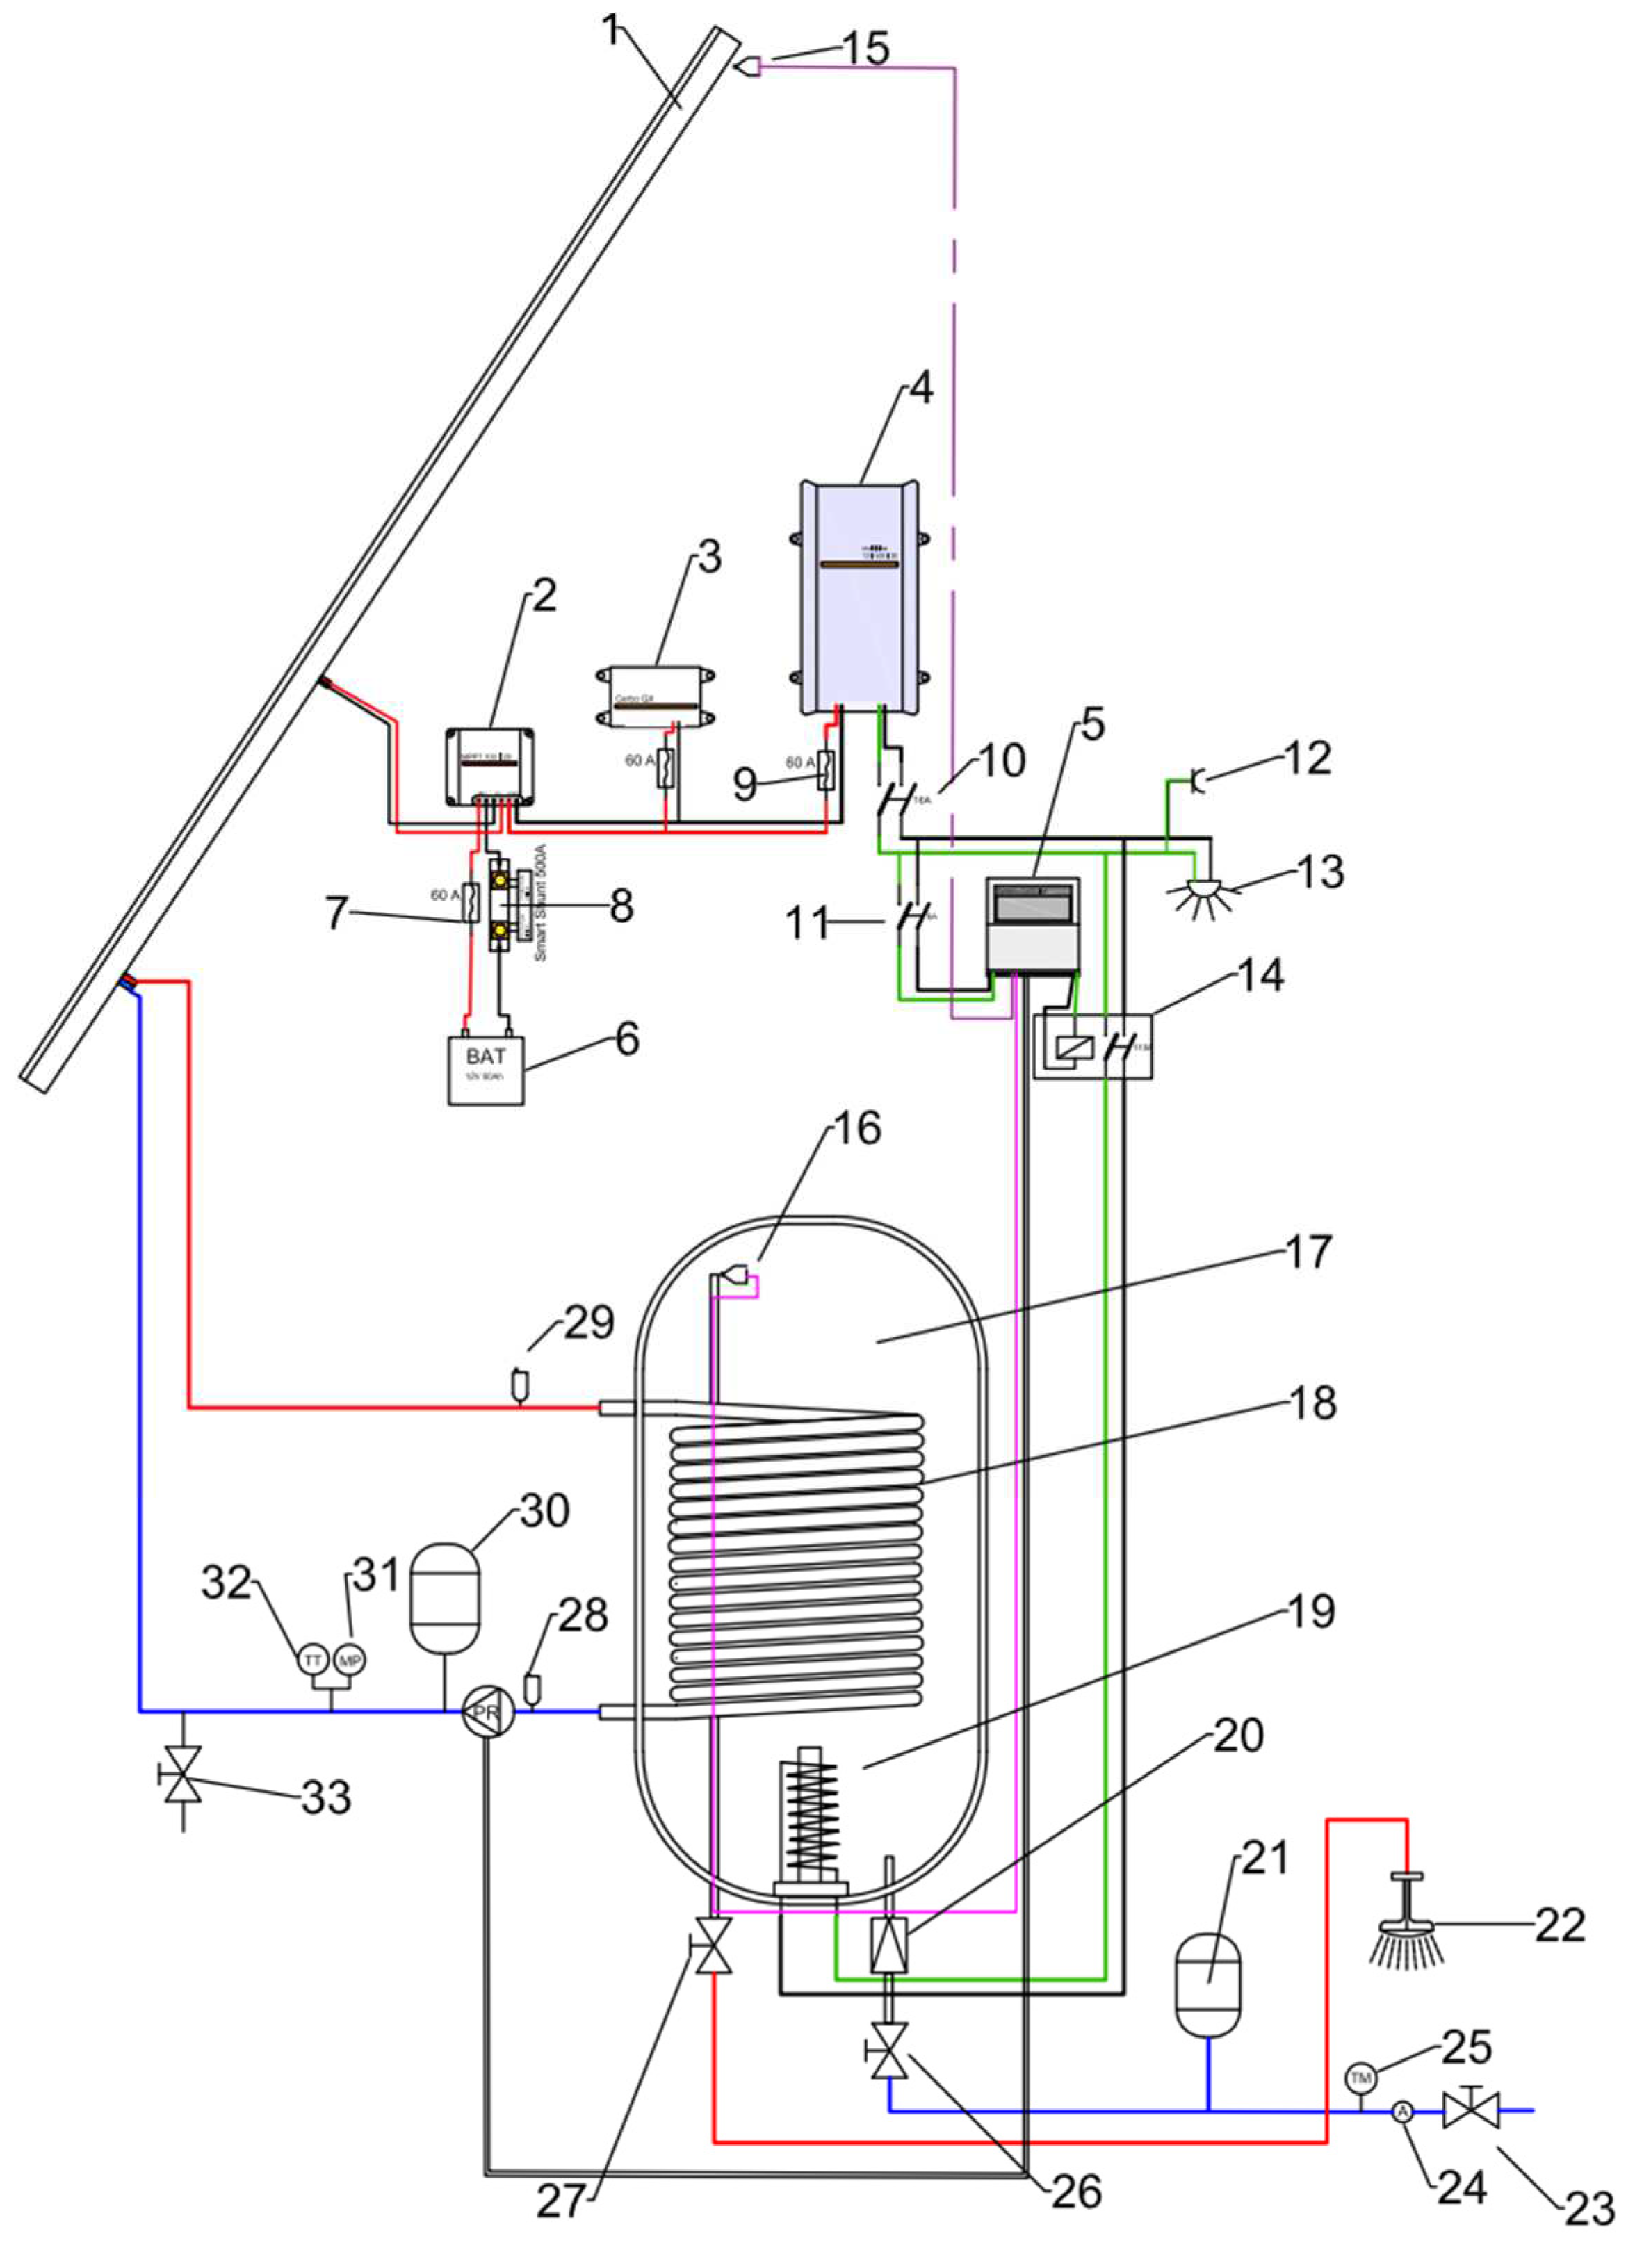
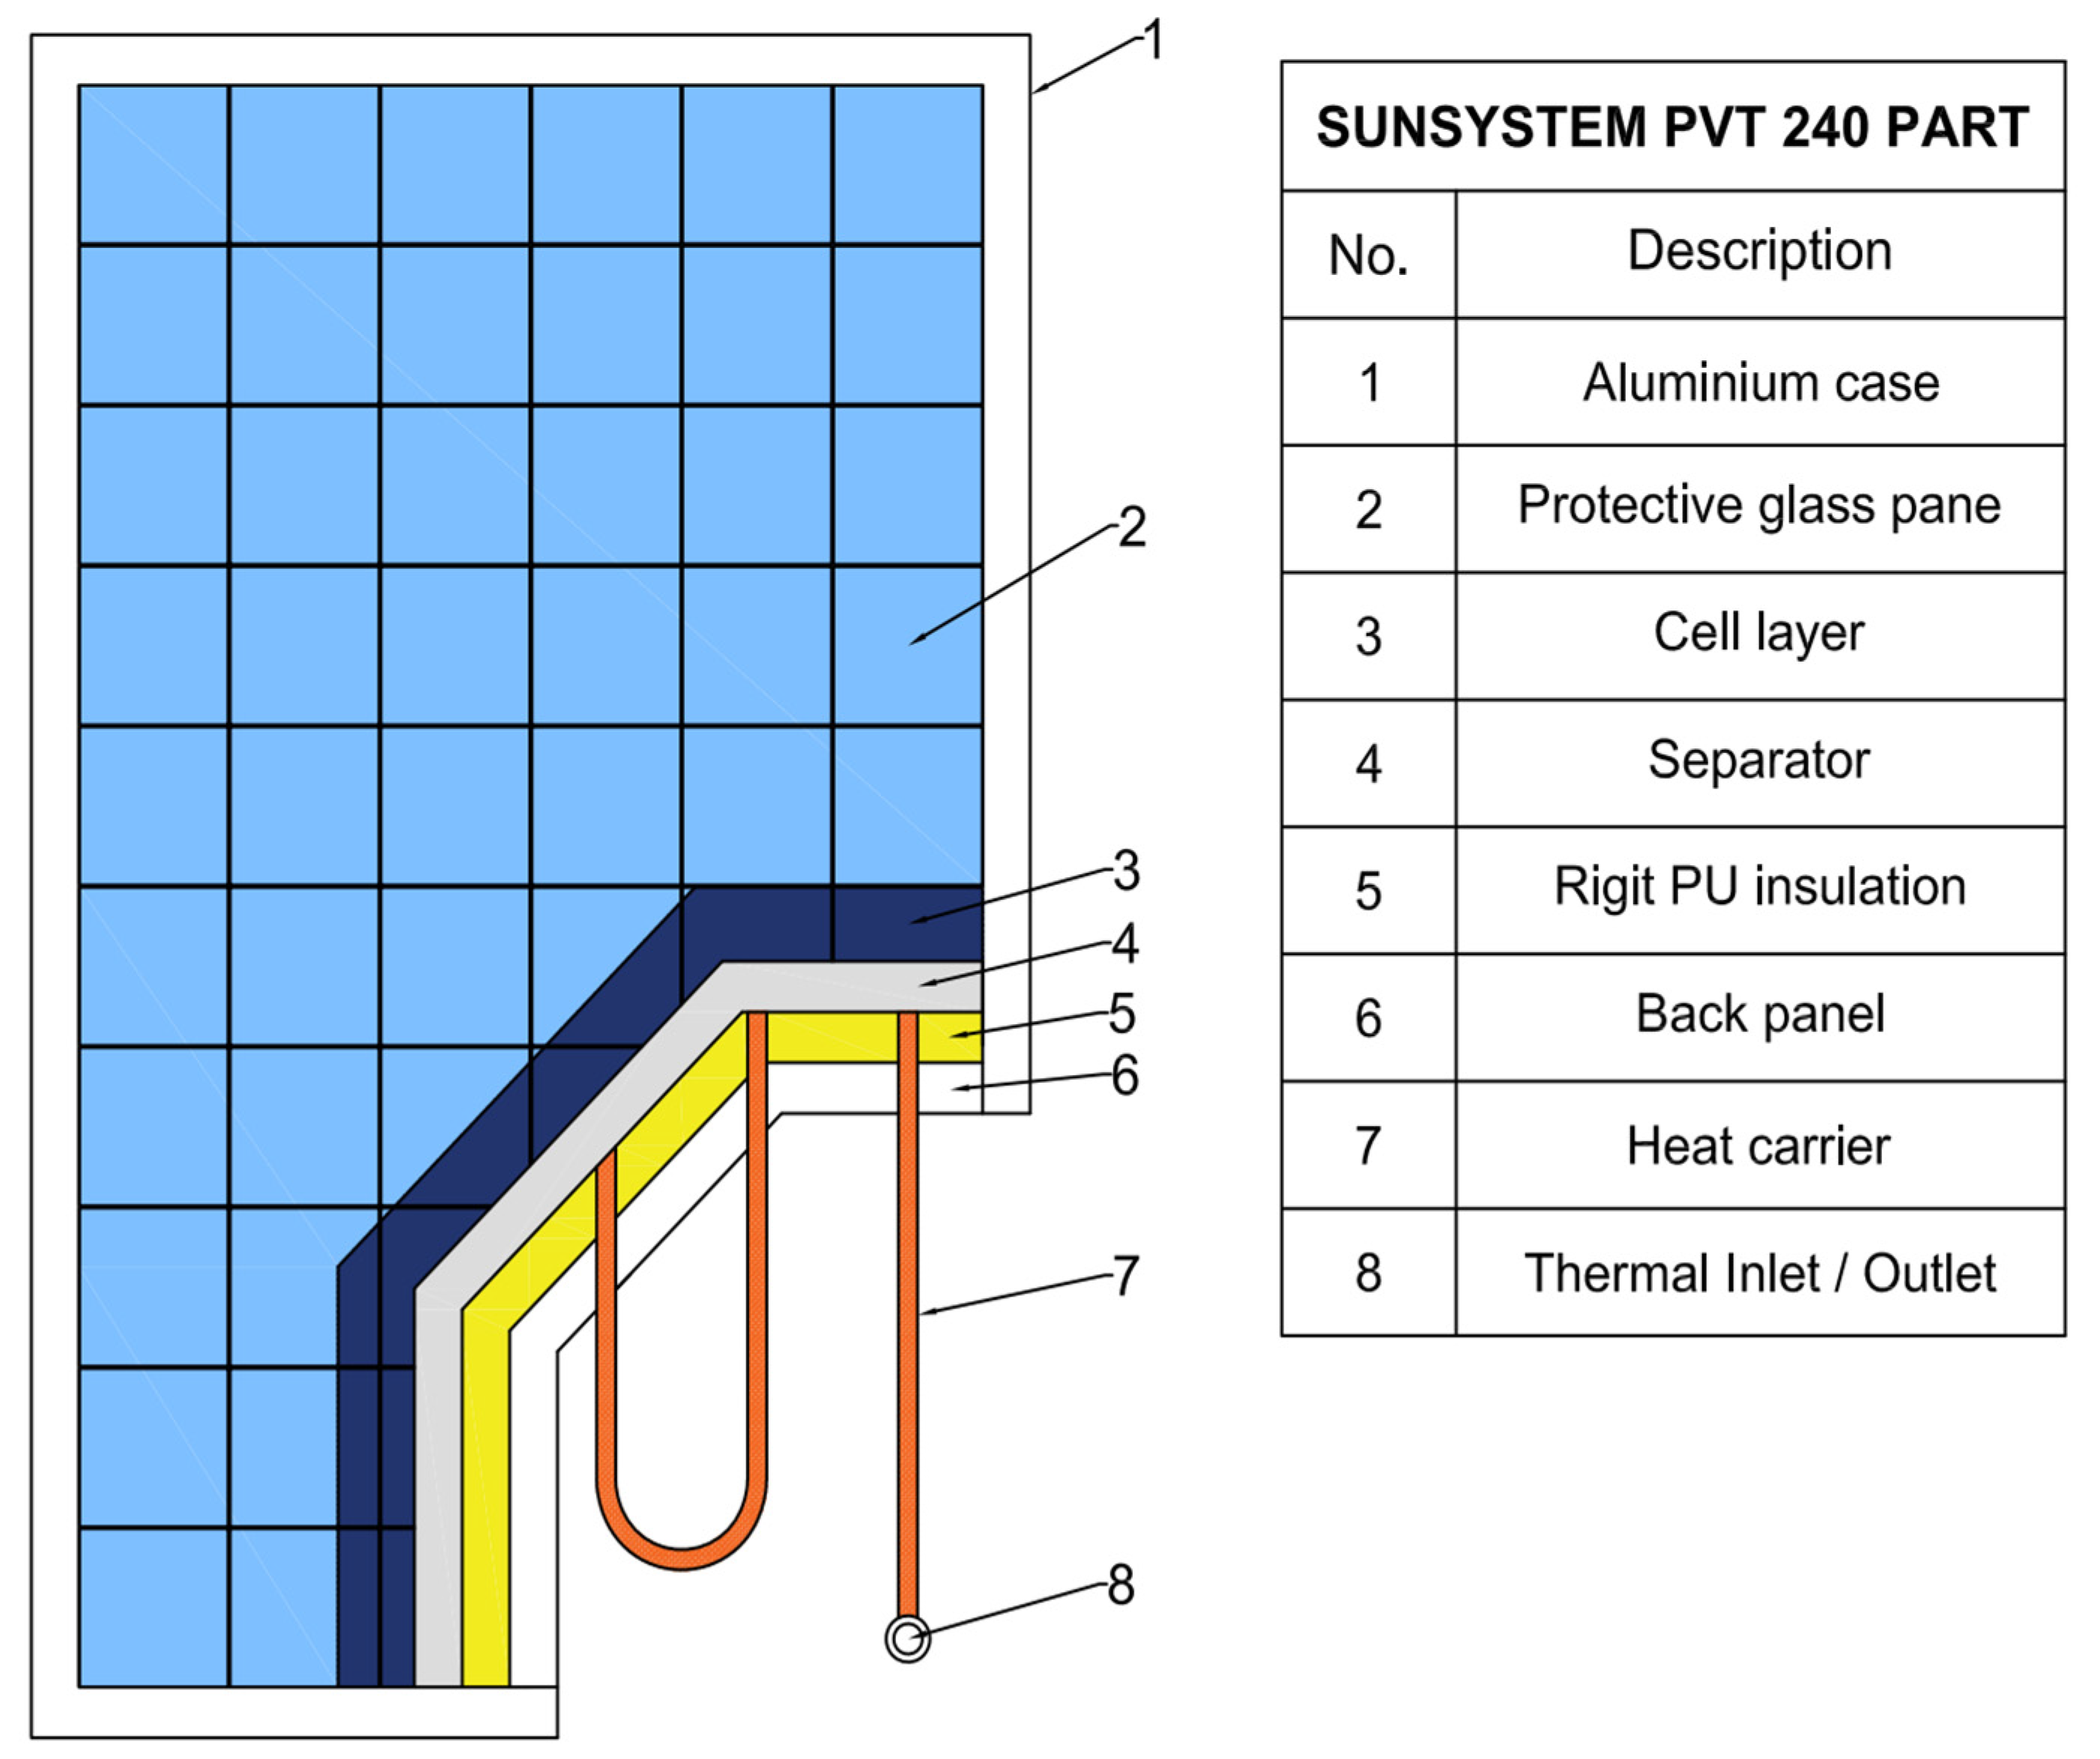
The measurements were conducted on the system illustrated in Figure 2. Positioned on the rooftop of the laboratory, the PV/T panel is set at a 45-degree angle to the horizontal and a 0-degree azimuth angle. The geographical coordinates of the site are as follows: latitude: 46.55354, longitude: 26.91509, and elevation: 167 m. The primary part of the proposed system is the hybrid panel SUNSYSTEM PVT 240, as depicted in Figure 3 and the main dimensions in Figure 4.
The technical data for the SUNSYSTEM PVT 240 panel is presented in Table 1 [41].
Table 2 presents the key properties of the 50% Propylene Glycol for calculations [34].

2.2. Experimental Measurements

The temperature of the water in the boiler and the thermal agent is measured using devices connected to temperature sensors. Global illumination on the panel surface is figured out by two solarimeters fixed parallel to the panel:
● Amprobe Solar-100 Solar power meter, Fluke, accuracy +/-10 W/m2.
● Multimetrix digital pyranometer SPM 72, accuracy +/-10 W/m2.
Surface temperature of the PV/T hybrid solar panel is measured using an infrared thermometer model VA 6530. Air speed, ambient temperature, external temperature, and humidity are measured with a Testo 410-2 device. The measurements were conducted on July 24, 2023, and the results are presented in the table below.
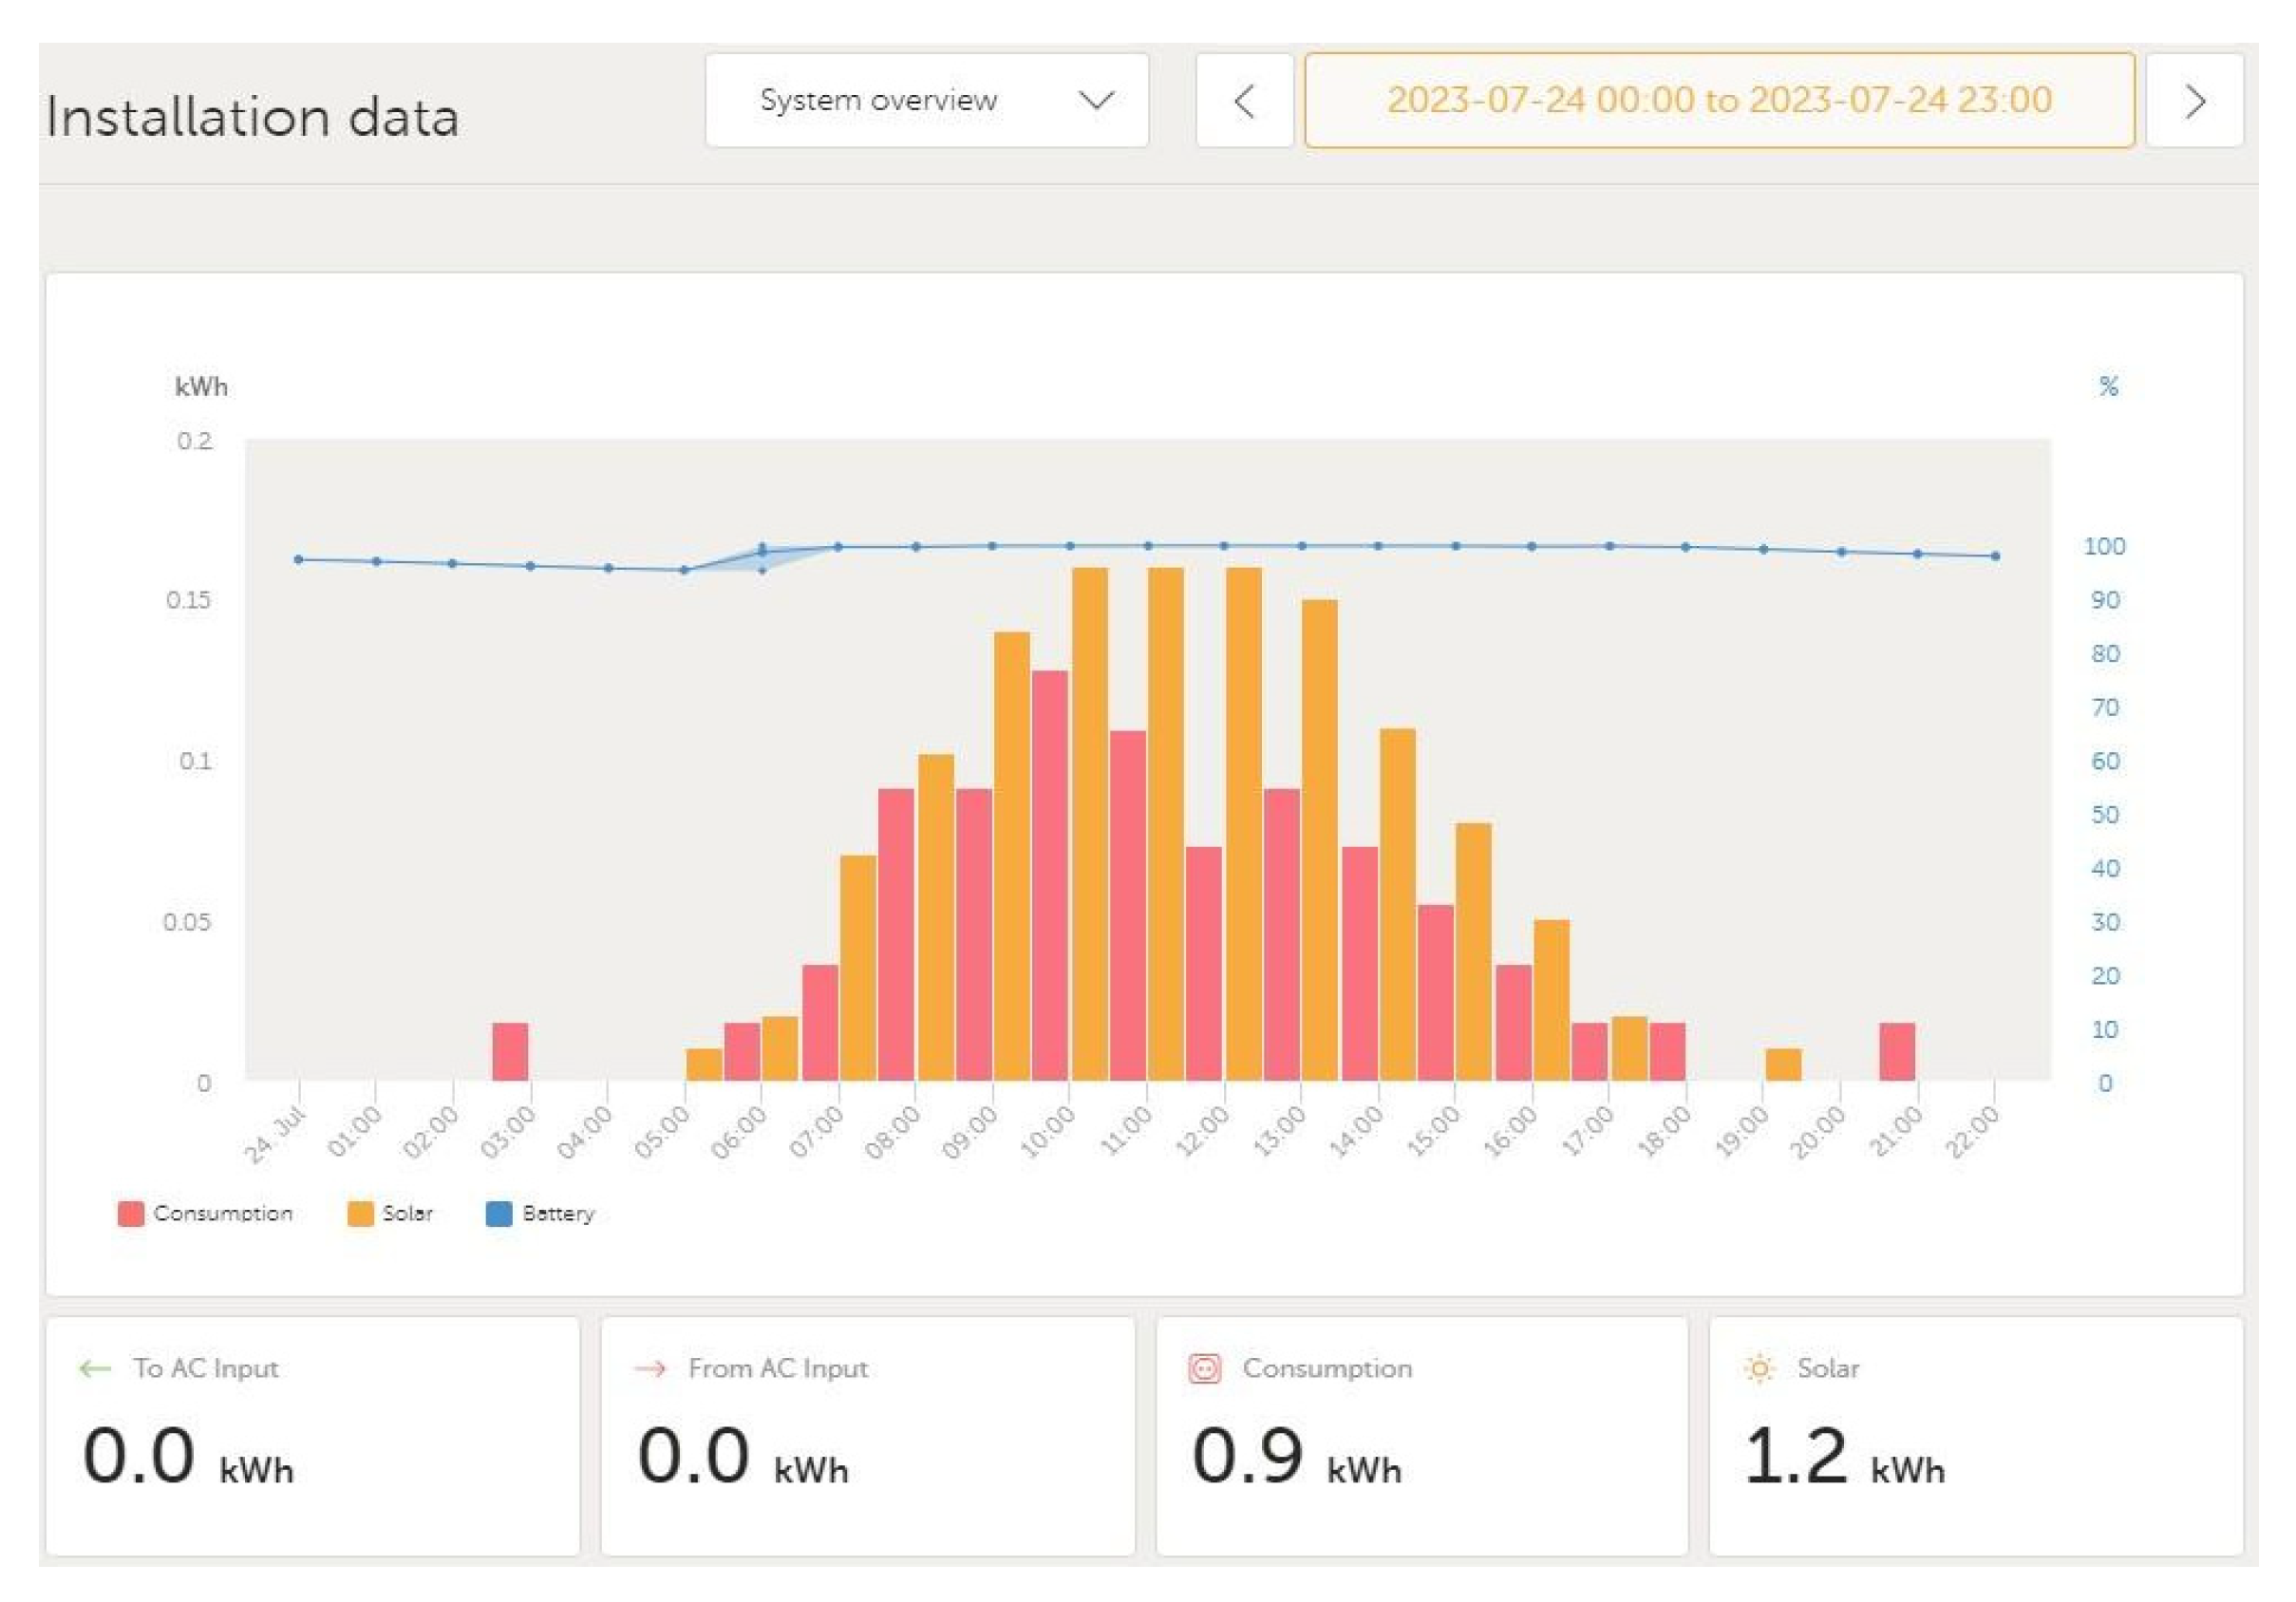
The system operation is visualized in real-time using VictronConnect software. On July 24, 2023, the panel produced 1.2 kWh of energy, and the energy consumed was 0.9 kWh, as shown in Figure 5.

2.3. Mathematical modelling of the system

Global efficiency is determined, according to [19,25,26,27] with (1):
η g l = η t h + η e l   ,
where ηth – thermal efficiency of the PV/T system, ηel – electrical efficiency of the PV/T system and ηgl - global efficiency of the PV/T system.
In this paper, two models are employed for calculating the global efficiency. The modelling and simulation are based on the following assumptions and limit conditions:
1. The material properties of the components of the PVT panel are constant.
2. The glass cover is at a uniform temperature.
3. Steady-state system (Model 1) and quasi-steady-state system (Model 2) are considered.
4. Uniform wind speed surrounds the PVT panel.
5. Negligible heat loss and pressure drop in the system.
6. The water flow is uniform during operation.
7. The thermal inertia of the PVT system is not considered.

2.4. Model 1: Analytical Calculation

The model employed in this paper is a simple, steady-state model used to calculate thermal efficiency, electrical efficiency, and the global efficiency using the measured values from Table 3.
Following ISO 9806-2017, ‘Solar thermal collectors, Test methods,’ the calculation of thermal efficiency involves the use of the (2) [28,29]:
η t h =   η o k 1 × T   G k 2 × T 2 G ,
where: k1, [W/m2K] – first thermal loss coefficient of the panel, k2, [W/m2K2] – second thermal loss coefficient of the panel, T = T f T e ,
T f = T f 1 + T f 2 2 ,
Electrical efficiency is calculated using (4), [29,30]:
η e l = η c e l l × 1 γ t × T p v T r e f ,
where reference ambient temperature is Tref = 25°C.

2.5. Model 2: Modeling and Simulation in Matlab/Simulink

This model is developed in the Matlab®/Simulink® environment based on [31]. The implementation simulates the cogeneration of electricity and heat using a hybrid PV/T solar panel with the characteristics of the SUNSYSTEM PVT panel. The generated heat is transferred to water for consumption. The detailed simulation model and related scripts are available on IEEE DataPort in [32].
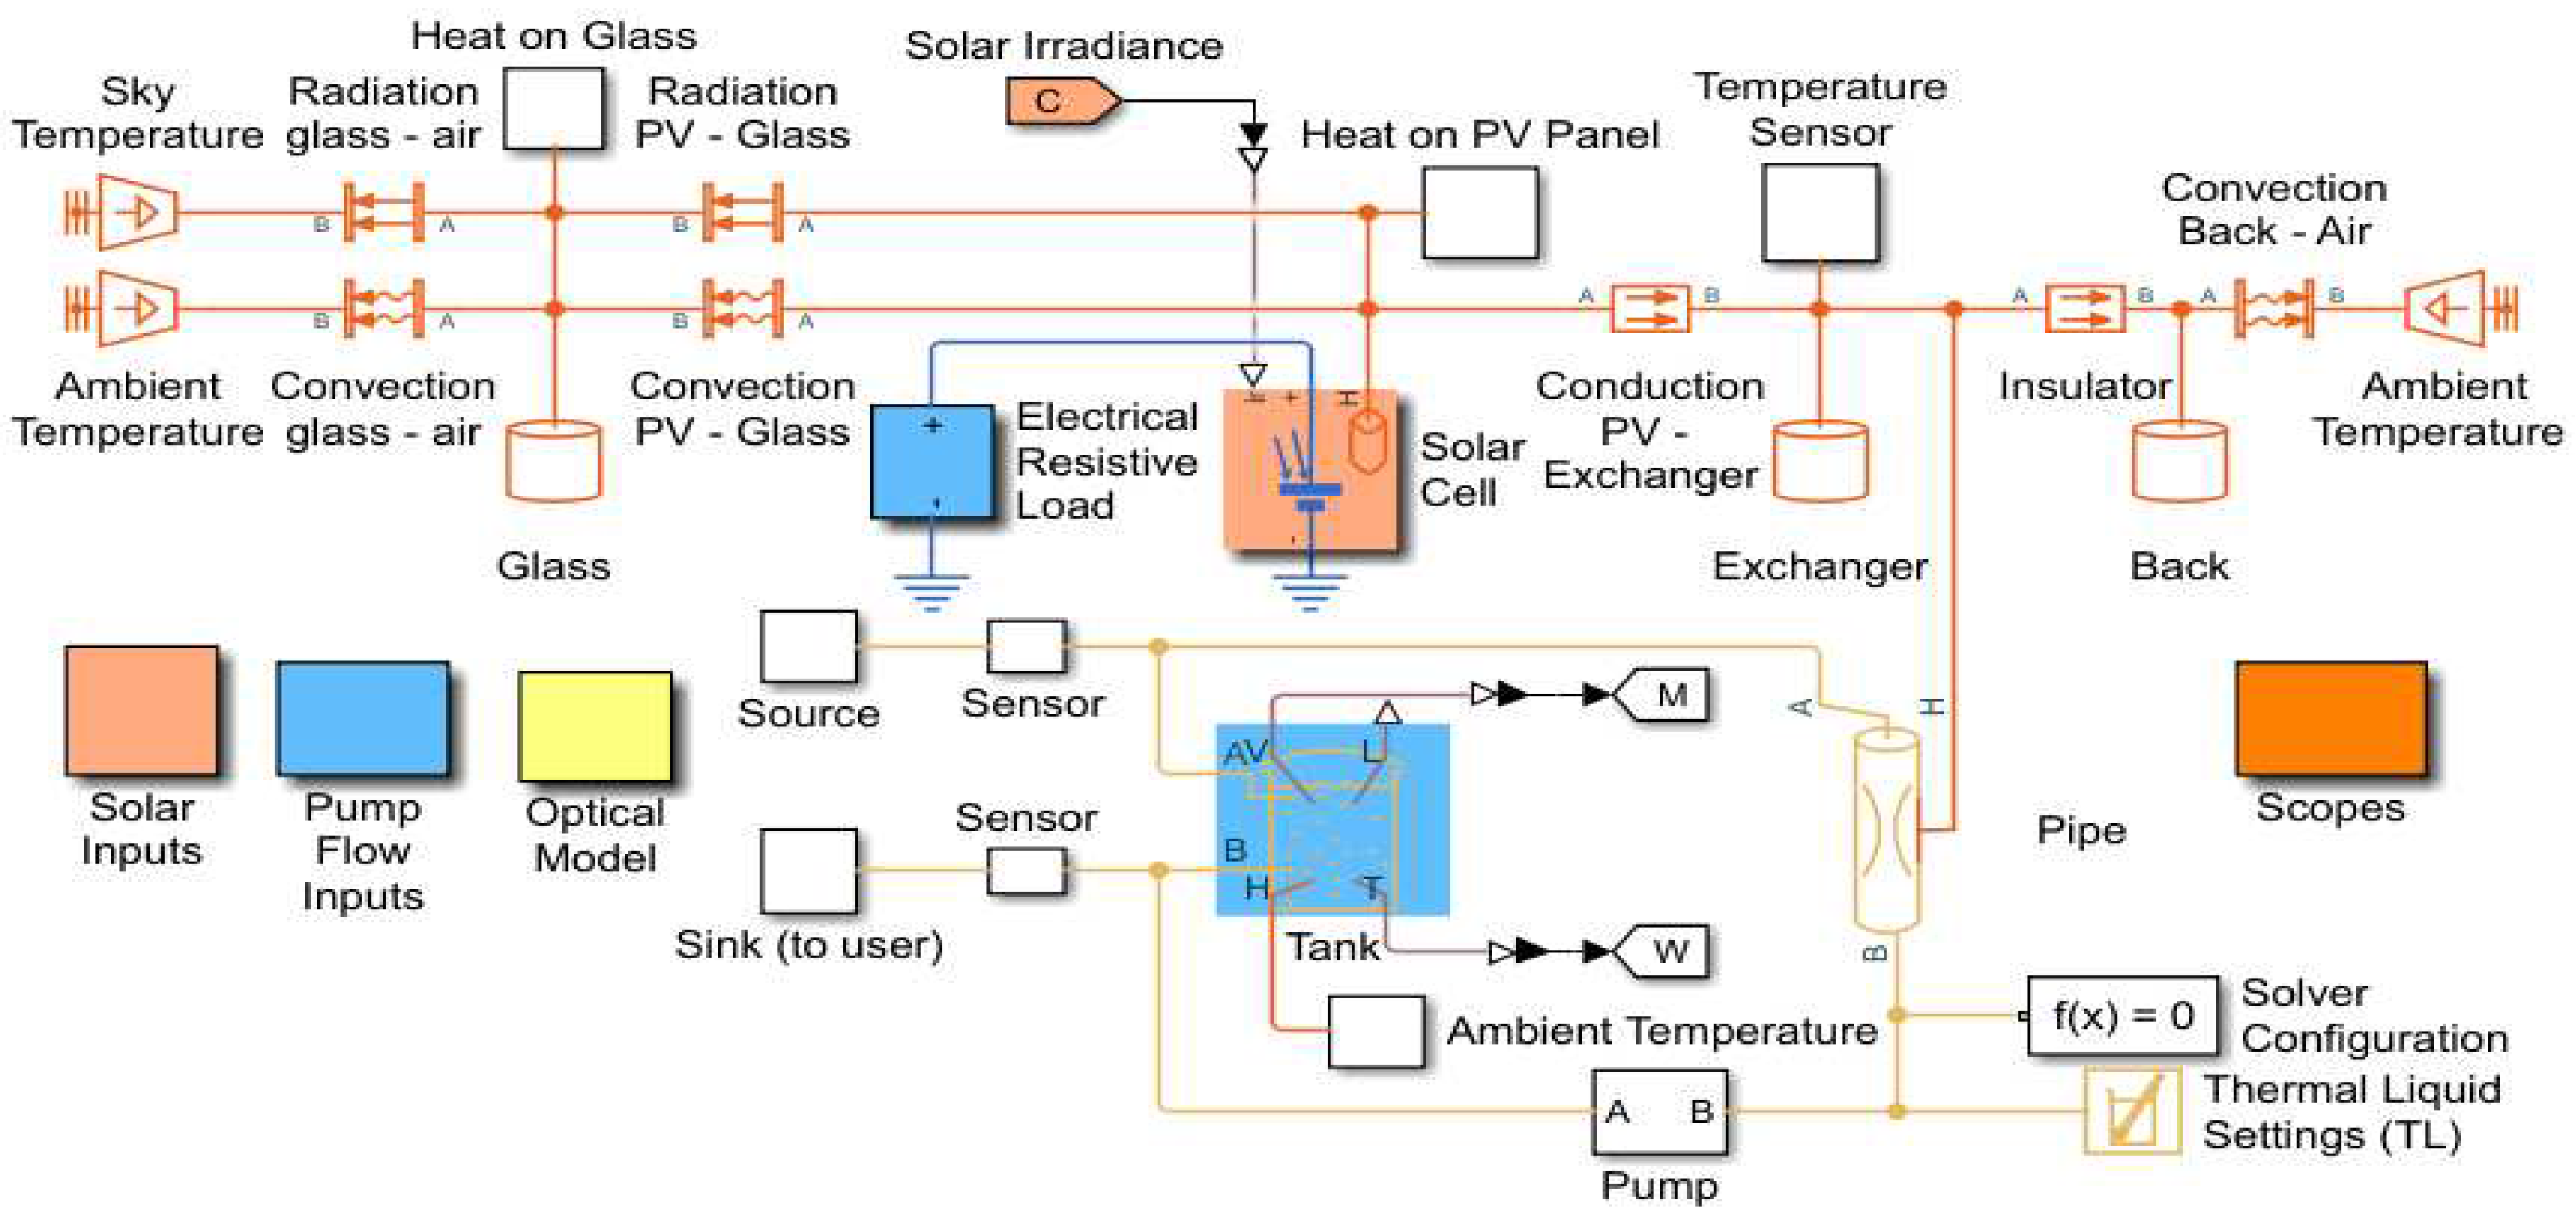
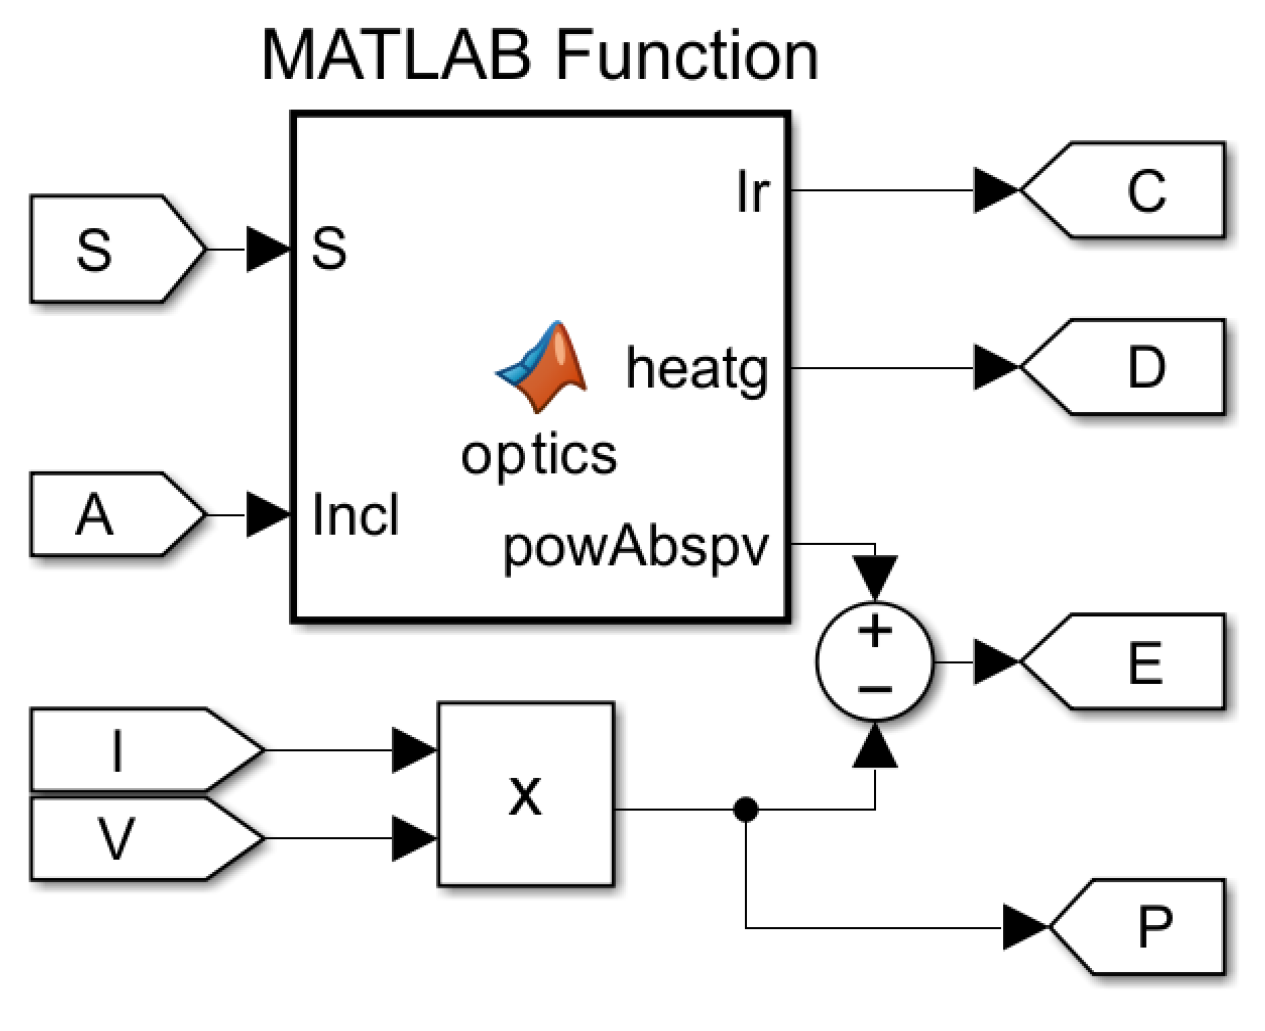
The structure of the PV/T model, presented in Figure 6, includes the electrical network in blue, the thermal heat network in red, and the thermal liquid network in yellow. The model features two solar inputs and a pump flow input. Additionally, an optical model is implemented with a Matlab Function block [31].
The electrical network part of the PV/T system has a module consisting of 60 solar PV cells connected in series and a resistive load. The thermal network models the heat exchange between the physical components of the PV/T hybrid solar panel (glass cover, heat exchanger, and back cover) and the surrounding environment. Heat exchange within the PV/T solar panel involves conduction, convection, and radiation. The thermal-liquid network encompasses a pipe, a tank, and pumps that control liquid flows within the system. The optical model, embedded in a Matlab Function block, simulates the reflection, absorption, and transmission of light in the glass cover [31].

2.5.1. Thermal modelling

Energy conservation laws are applied to each panel component. Heat transfer for the glass cover, PV/T module, absorber, absorber connection to the circulation tube, and fluid in the tubes are estimated, as detailed in the research paper [13]. The solar radiation used by the thermal system is diminished compared to a standalone thermal collector, as a part of the radiation is converted into electricity by the PV cells.
The thermal efficiency is determined using the following formula:
η t h = Q u G × A c ,
where: Ac – Collector surface area [m2], Qu – useful heat [W]:
Q u = m ˙ × c p f × T f 2 T f 1 ,
using thermal fluid temperatures, according to Hottel-Whiller model [8].
Q u = A C × F R × G × τ × α U L × T f i   T e ,
where: m ˙ – massflow of thermal agent, (kg/s), cpfv – specific heat of the heat carrier, (J/kgK), FR – the heat removal factor, UL – overall heat transfer coefficient (W/m2℃), α – absorption coefficient, τ – transmission coefficient.
The solar radiation used by the thermal system is diminished compared to a standalone thermal collector because a part of that solar radiation is converted into electricity by the PV cells. This relationship is expressed by the coefficient (τα) [30]:
τ α = τ g × α c e l l τ g × η P V × A a c t i v e A c ,
where: Aactive – actual area of capture of PV cells, (m2).
The heat removal factor FR is calculated using the (9) [8,30]:
F R = m ˙ × c p f × 1 e F × U L m ˙ × c p f ,
where: F′ is given by (10):
F = t a n h U L λ s e p × L s e p × W D o 2 U L λ s e p × L s e p × W D o 2 .
Heat transfer through the hybrid panel occurs via radiation (at the glass and absorber levels), convection (involving air, the thermal agent, and their adjacent elements), and conduction (in glass, cell, separator, absorber, insulator, copper tube, and back cover).
The thicknesses of the layers of these part elements and their thermal conductivity are provided in Table 4. The overall heat transfer coefficient, UL, accounts for thermal losses to the front, back, and sides. The data from Table 4 are used in the calculation of UL.
The temperature of the sky Tsky is found with (11) [8,30]:
T s k y = 0.0552 × T e 1,5 .
The heat transfer coefficient between the air and the glass hga, as well as between the air and the back cover hba is given by (12):
h g a = h b a = 2.8 + 3 × V W [ W/m 2 K ] .
The heat transfer coefficient between the thermal agent and the copper tube is:
h f = N u × k f D h [ W/m 2 K ] ,
where: Nu – Nusselt number, VW – wind air (m/s), Dh – hydraulic diameter, (m), kf – thermal conductivity of working fluid, [W/m·K].

2.5.2. Electrical Modelling: Solar Cell Modelling

Following specialized literature, a PV model is derived from diode behavior, providing the PV cell with its exponential characteristic. The solar cell block consists of a single solar cell, represented as a resistance connected in series with a parallel combination of a current source, two exponential diodes, and a parallel resistor Rp [31].
The output solar cell current is given by (14) [33,42]:
I = I p h I s 1 · e V + I · R s N 1 · V t 1 I s 2 · e V + I · R s N 2 · V t 1 V + I · R s R p .
where: Iph – the solar-induced current (A): I p h = I p h 0 × G / G o , Iph0 – the measured solar generated current for the reference irradiance G0 (A), G – the solar irradiance [W/m2], and V t = ( k × T ) / q . Here, k – the Boltzmann constant, q – the elementary charge of the electron, Is1 – the saturation current of the first diode (A), Is2 – the saturation current of the second diode (A), N1 – the quality factor of the first diode, N2 – the quality factor of the second diode, V – voltage at the solar cell terminals (V).
The calculation of electrical efficiency adheres to the Shockley-Queisser limit, employing formula (4), similar to the case of model 1.

2.5.3. Optical Model for the Glass Cover

The optical model, shown in Figure 7, is based on Fresnel’s laws, which depend on the incident angle of solar radiation. The optical model for the glass cover of a PV/T solar panel is implemented using a Matlab Function block. This model has two solar inputs: irradiation and inclination/incidence angle. It produces three outputs: the transmitted solar irradiance on the PV solar cells, the heat absorbed by the glass cover, and the radiative power absorbed by PV solar cells. This power is then transformed into electrical power (P = V·I) and heat absorbed by the PV solar cells [31].
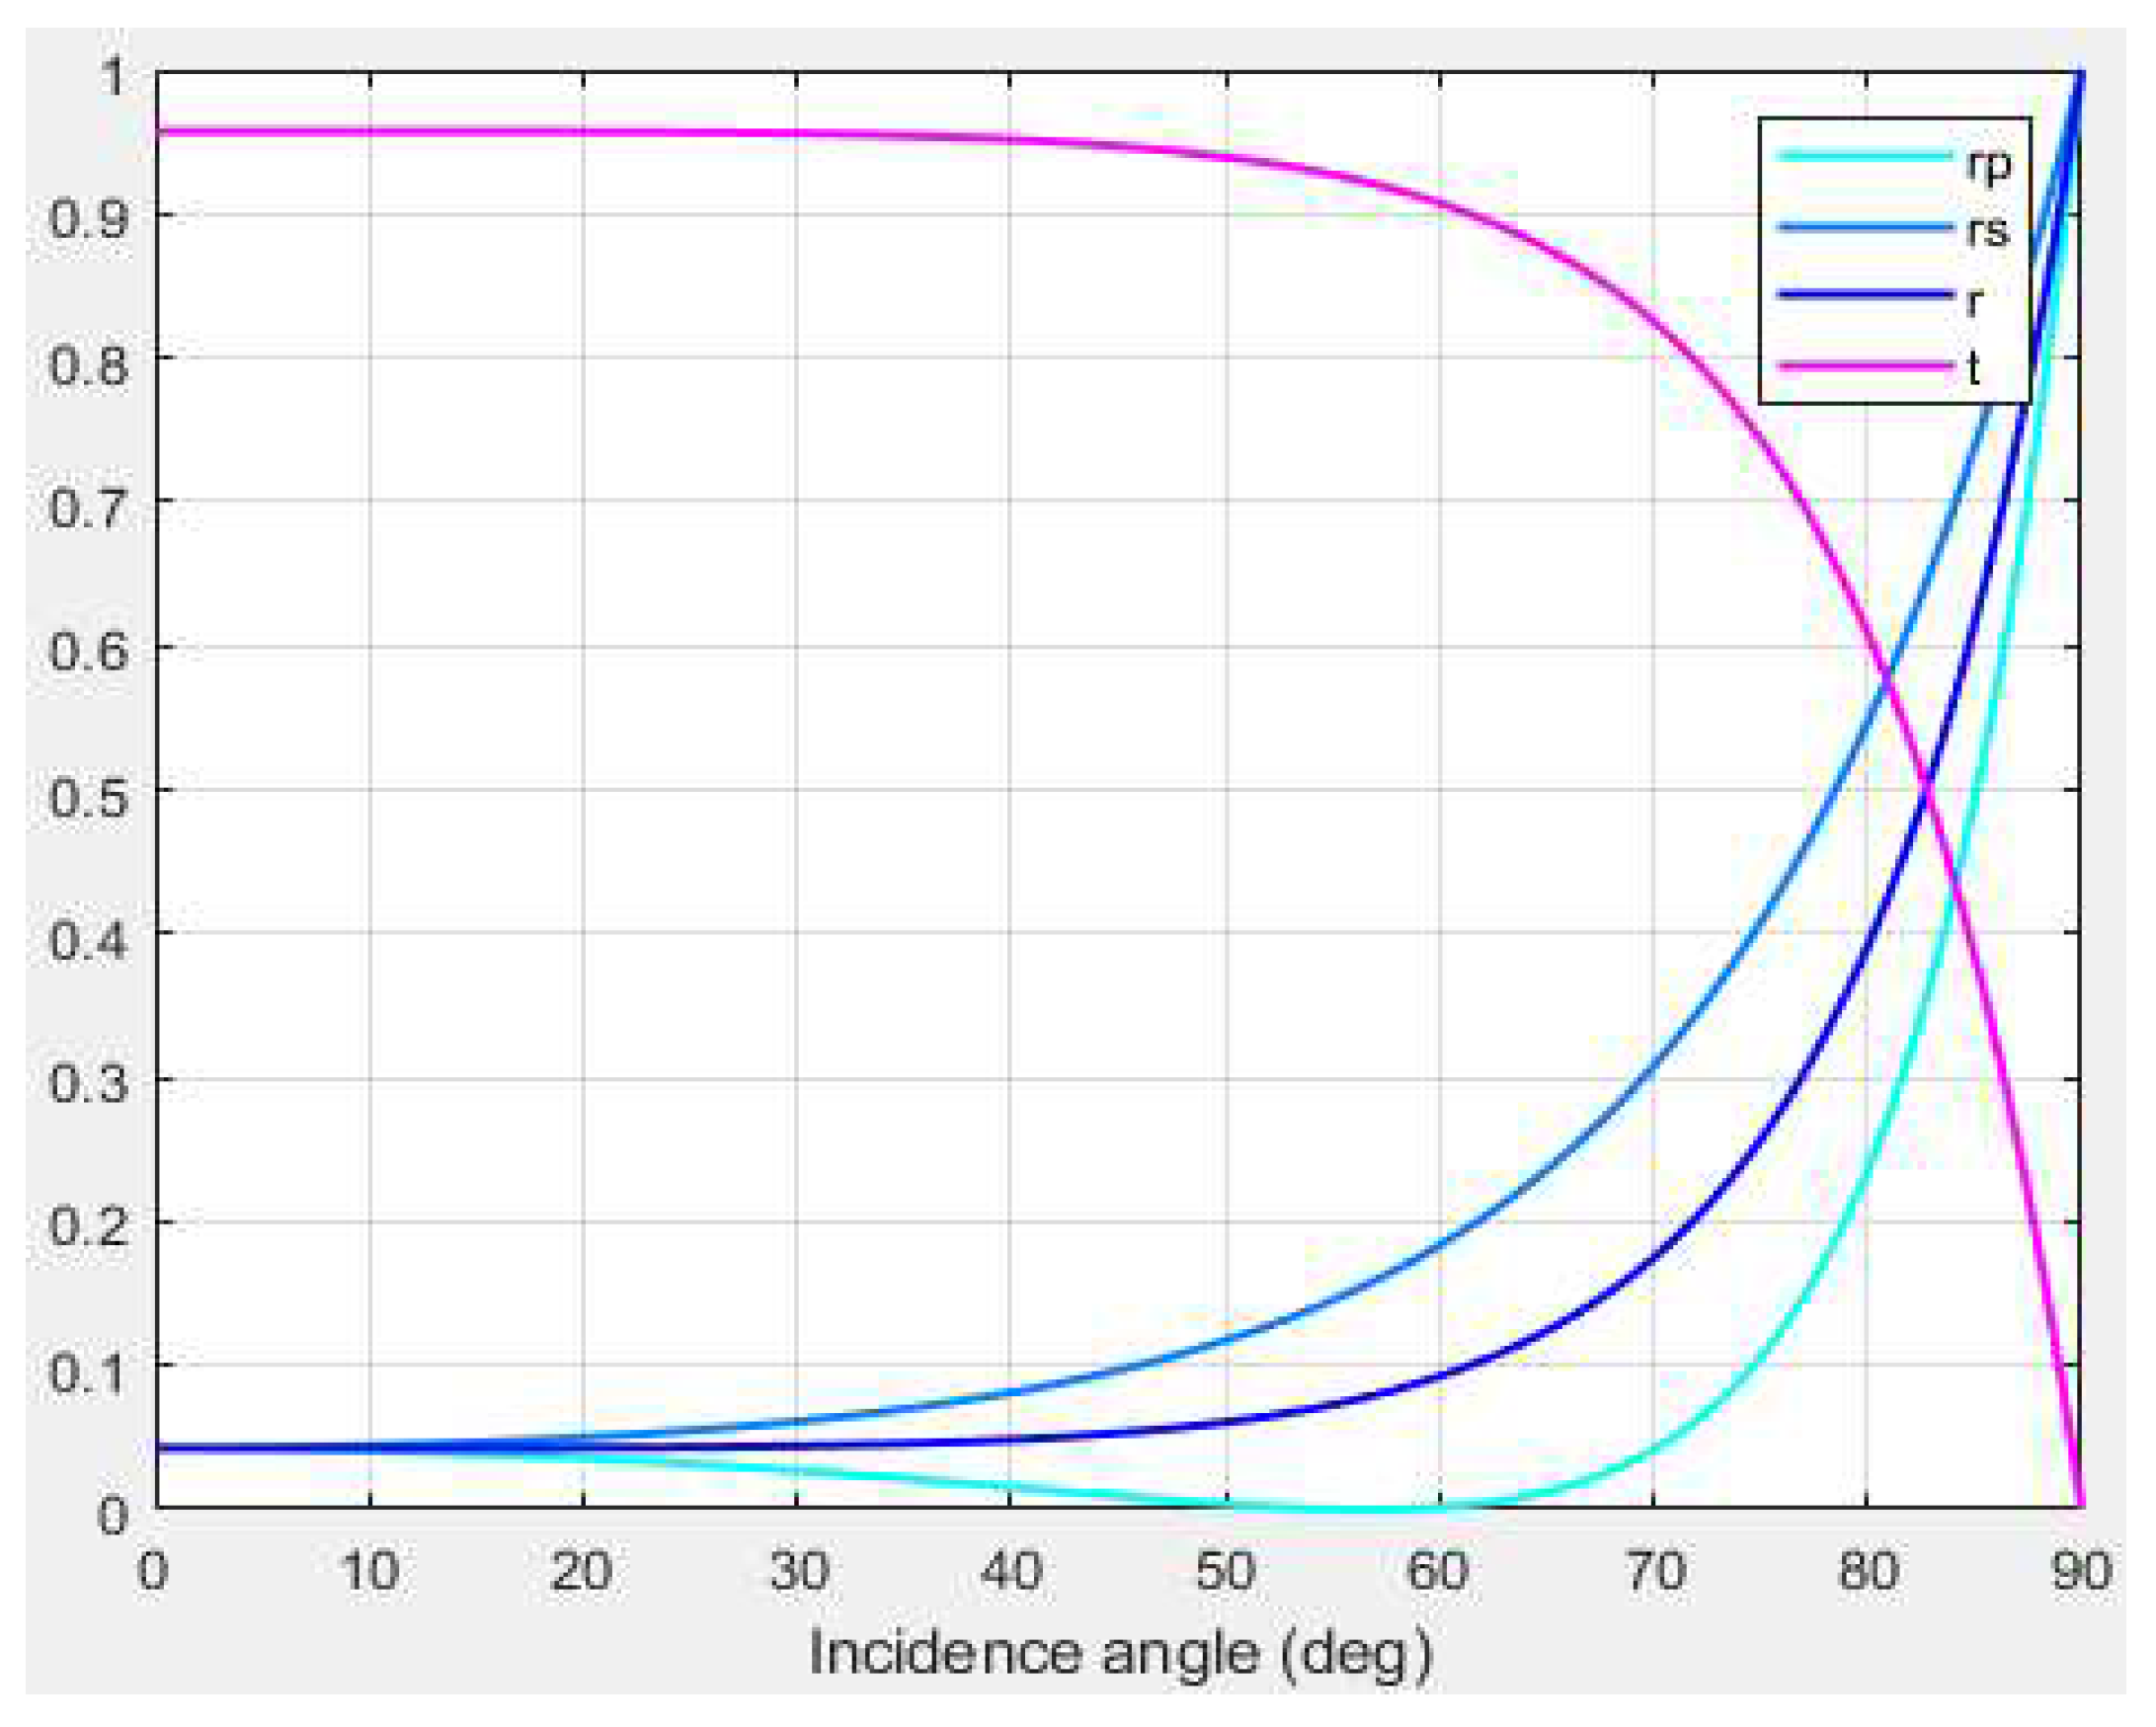
The Matlab function calculates the transmission, reflection, and absorption in the glass cover to figure out the irradiation reaching the PV cells, the heat absorbed in the glass, and the radiation power absorbed in the PV cells. Optically, the glass cover consists of two boundaries (air to glass and glass to air) that reflect and send light [31]. The reflection coefficient in a boundary is calculated using the Fresnel equations, as in (17) [31,36].
r p = n r e l 2 cos θ i n r e l 2 sin θ i 2   n r e l 2 cos θ i + n r e l 2 sin θ i 2 2 r s = cos θ i n r e l 2 sin θ i 2   cos θ i + n r e l 2 sin θ i 2 2 ,
where: rp is for P-polarization and rs for S-polarization, and nrel is the optical index from air to glass.
The total reflection (or effective reflectance) is the average of both P-polarization and S-polarization, as given in (16) [31]:
r   =   1 2   r p + r s .
The transmittance τ is given by (17), as there is no absorption so far [31,36,38]:
τ =   1     r .

2.5.4. Optical Characteristics of Glass Cover

Figure 8 illustrates the optical characteristics of the glass cover for the PV/T hybrid solar panel, showcasing reflection, absorption, and transmission coefficients as functions of the incidence angle [31]. While the described scenario pertains to one boundary, the glass cover features two parallel boundaries separated by dg [31].
The angle θ1, following the first boundary, becomes the angle of incidence θ1 on the second boundary, and it is calculated using Snell’s law (19) [36,37,38,39]:
n 1 s i n s i n   θ 1   =   n 2 s i n s i n   θ 2   .
where: n1 and n2 are the refractive indices of the two boundaries.
The glass absorbs a part of the light with the constant probability per unit length αg, resulting in an exponential decay from distance travelled dg for the transmittance coefficient in the glass τg (21) [37,40]:
τ g =   e x p e x p   α g d g c o s c o s   θ 2     .
As the light reaches the second boundary, it undergoes reflection and transmission again according to the Fresnel equations. The reflected light becomes trapped inside the glass, undergoing infinite reflections between the two boundaries until it is fully absorbed.
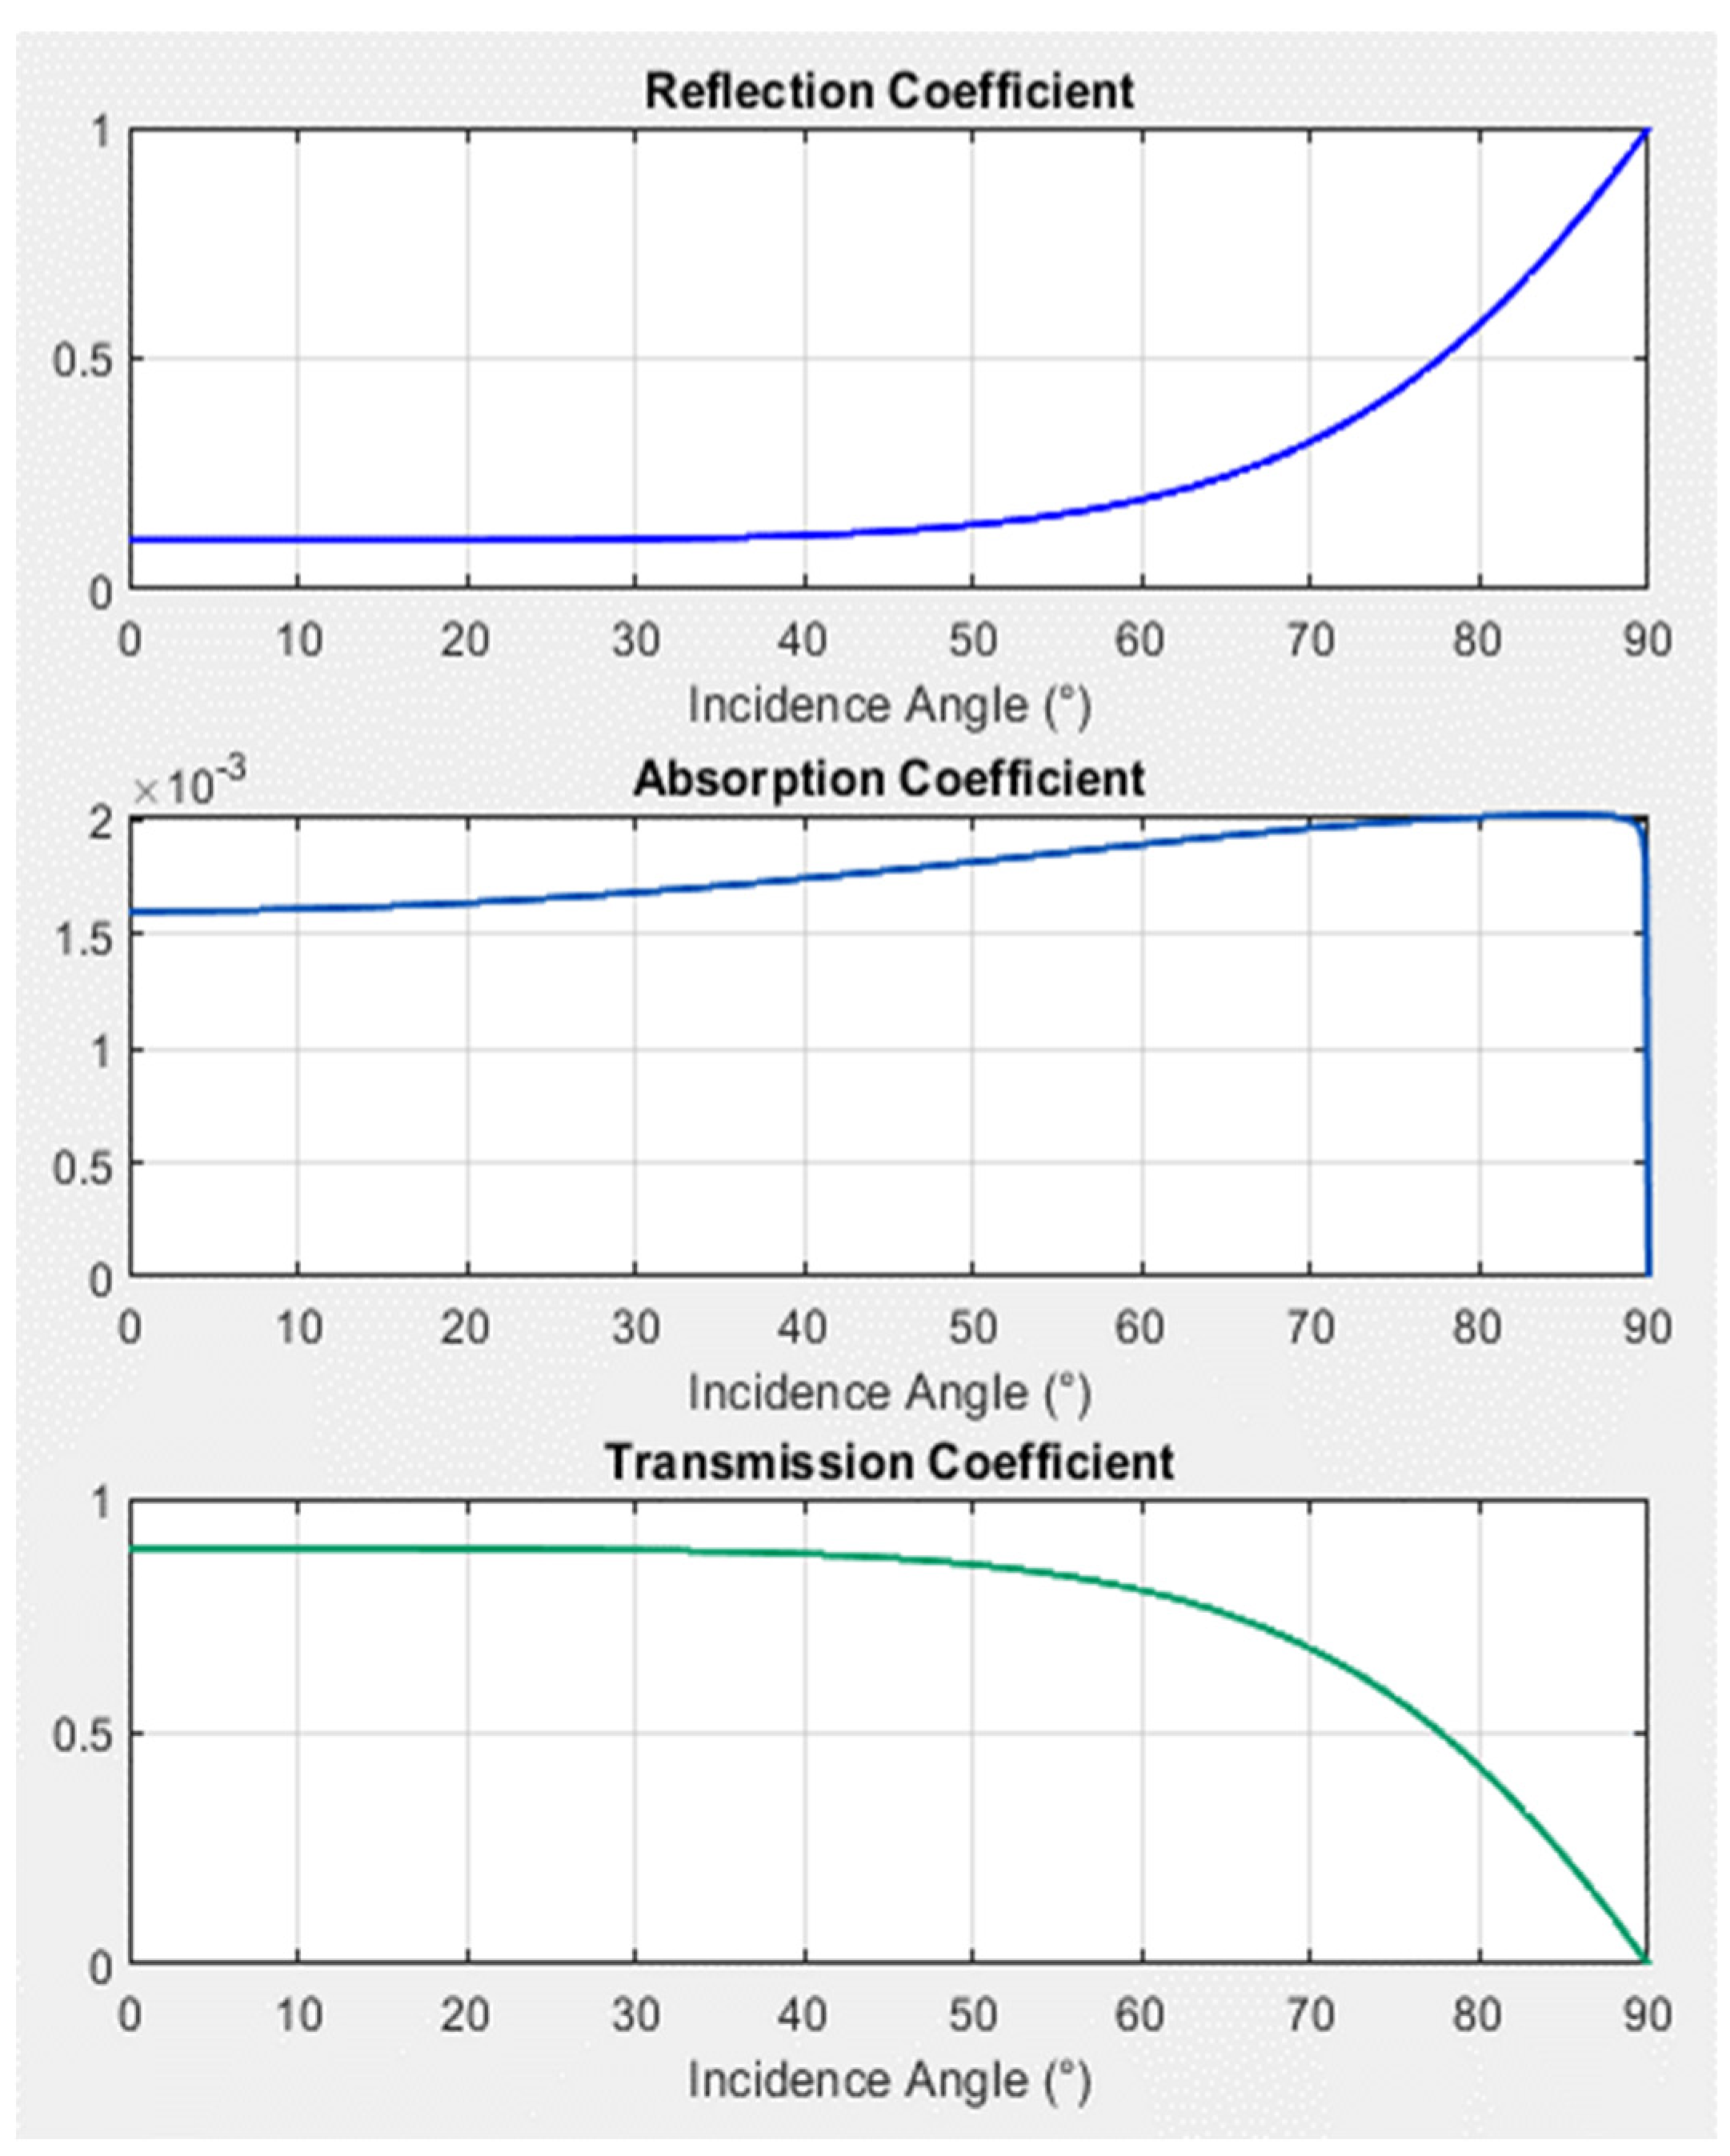
Then, the total reflection and transmission coefficients of the glass cover system are the sum of an infinite geometrical series, for which the total transmission Tg, reflection Rg, and absorption Ag coefficients for infinite reflections between two parallel boundaries are given by (20) [31,40]:
T g = t 1 τ g t 2 1 r 1 r 2 τ g 2   R g = r 1 + t 1 2 τ g 2 r 2 1 r 1 r 2 τ g 2   A g = 1 T g R g  
Finally, the total optical coefficients for the glass are depicted in Figure 9.
In Table 5 are given the full parameter values of the PV/T solar panel components, like the electrical load, PV solar cell, pipe, and tank.

3. Results and Discussion

In this section, two case studies illustrate the performances and effectiveness of the analyzed models of PV/T hybrid solar panel under different temperature and irradiance changes in real exploration to simultaneous production of electricity and heat. The real experimental stand and simulation model of a PV/T hybrid power plant have been studied in this paper by investigating and comparing them in Matlab/Simulink and Mathcad software environments to show their thermal, electrical, and global efficiency performance. To replicate the obtained simulation results presented in the next section, the detailed simulation data, including the implemented PV/T hybrid solar panel model in Matlab/Simulink and related scripts (data and parameter values, plot inputs, optics characteristics, and outputs, and efficiency calculation) are available in [32].
Applying model 1 (real PV/T system) yields the results presented in Table 6.
For all 12 measurements conducted on July 24, 2023, covering the entire period between sunrise and sunset, the following average values are obtained for thermal efficiency, electrical efficiency, and global efficiency, as given in (21):
ηth = 0.4786
ηel = 0.1210
ηgl = 0.5996
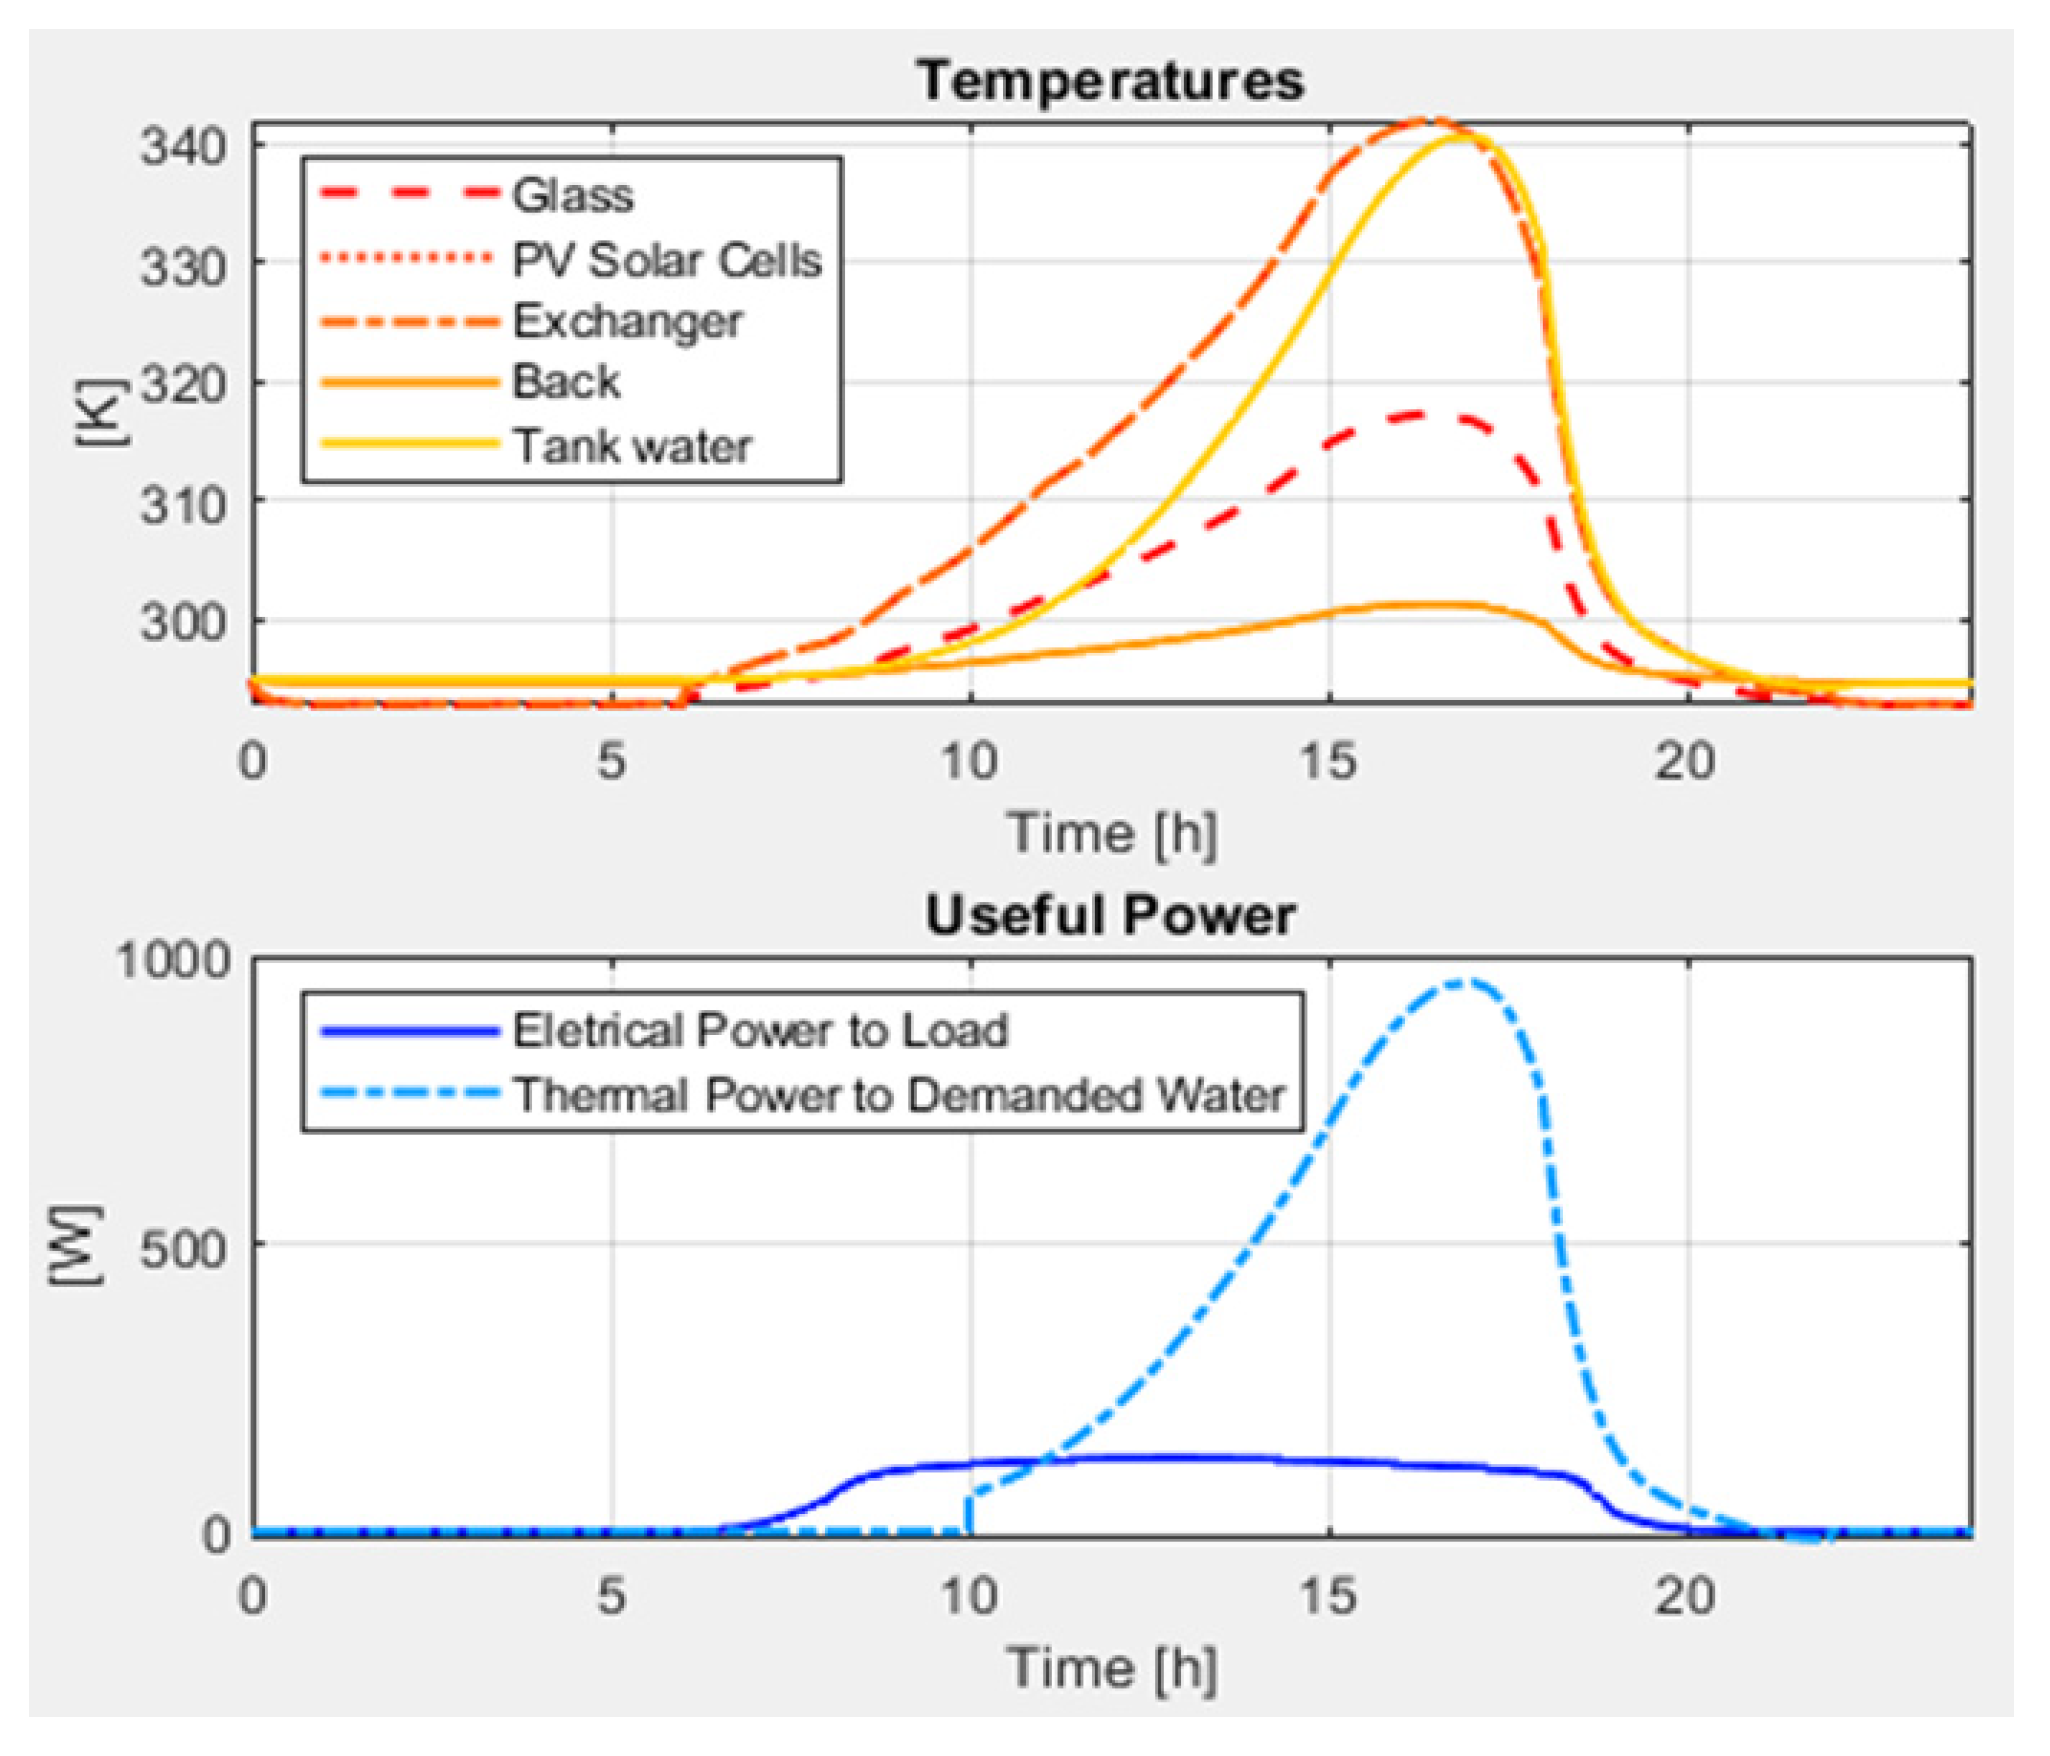
The outputs of model 2 (modeled and simulated in Matlab/Simulink) include temperatures for all components of the PV/T panel, as well as electrical and thermal power.
Figure 10 illustrates the outputs of the PV/T panel, displaying the temperatures of the thermal masses and the useful electrical and thermal power.
The efficiency is determined from the simulation output results. Table 7 presents the electrical, thermal, and total efficiency of the modeled PV/T hybrid solar panel, calculated from the output results. While electrical efficiency aligns with standard PV solar cells, the addition of thermal efficiency significantly improves energy production, resulting in a total system efficiency comparable to a cogeneration power plant.
The obtained results for the thermal, electrical, and global efficiency are shown in Table 8, for both model 1 and model 2.
Notice the remarkably close values obtained by applying the two models, with the difference being extremely small. It is important to highlight that the simulation conducted in Simulink did not include the inverter. When considering the efficiency of the inverter, ηel,model2 = 0.1213. In the realization of model 2, the thermal inertia of the system was not considered and for this reason the difference between the calculated values of the thermal efficiency appears. The values obtained by applying the two models closely align with those derived from similar models, [24],[10].

4. Conclusions

In this paper was presented the electrical and thermal efficiency performance of two models for PV/T hybrid solar panels.
It is important to notice that a PV/T system is examined for the first time in this manner, making a comparison between the values obtained by two different methods, confirming the proposed model in Matlab and the simulation performed in Simulink, by the values obtained from real measurements.
Notably, the simulation in the case of model 2 exhibits results in an increased accuracy that reflects the real functioning of the system. There is potential for further refinement of Model 2 by incorporating the simulation of the inverter operation.

Author Contributions

Conceptualization, R.G. and S.G.V.; methodology, R.G. and I.V.B.; software, R.G., I.V.B. and S.E.P.; validation, R.G. and I.V.B.; formal analysis, R.G.and I.V.B.; investigation, R.G. and S.G.V.; resources, R.G.; data curation, S.G.V.; writing—original draft preparation, R.G.; writing—review and editing, R.G., S.E.P. and I.V.B.; supervision, R.G. All authors have read and agreed to the published version of the manuscript.

Data Availability Statement

Data are contained within the article.

Conflicts of Interest

The authors declare no conflicts of interest.

References

  1. OurWorldInData.org. Available on line: https://ourworldindata.org/grapher/sub-energy-fossil-renewables-nuclear, (accessed on 28.01.2024).
  2. Ritchie, H; Rosado, P; Roser, M. Energy Production and Consumption, Published online at OurWorldInData.org. Retrieved from: https://ourworldindata.org/energy-production-consumption, 2020, (accessed on 28.01.2024).
  3. Badea, A; Necula, H. coordinators, Surse regenerabile de energie, Editura AGIR, 2013.
  4. Directive (EU) 2023/2413 of the European Parliament and of the Council of 18 October 2023 amending Directive (EU) 2018/2001, Regulation (EU) 2018/1999 and Directive 98/70/EC as regards the promotion of energy from renewable sources, and repealing Council Directive (EU) 2015/652, Available on line: https://eur-lex.europa.eu/legal-content/EN/TXT/?uri=CELEX%3A32023L2413&qid=1699364355105 , (accessed on 28.01.2024).
  5. Irimia, O.; Tomozei, C.; Panainte-Lehadus ,M.; Dinu,M.C. Evaluation of the potential of wind energy as a source of electricity generation: Case study – Vanatori Wind Power Plant, 2020 7th International Conference on Energy Efficiency and Agricultural Engineering (EE&AE), Ruse, Bulgaria. [CrossRef]
  6. Chandrasekar,M; Senthilkumar, T. Five decades of evolution of solar photovoltaic thermal (PVT) technology – A critical insight on review articles, Journal of Cleaner Production, 2021, Volume 322, 128997, ISSN 0959-6526.
  7. Motoasca, M; de la Fontaine, C; Vermeulen, B. Photovoltaic-Thermal (PV/T) Hybrid Systems State-of-the-art technology, challenges and opportunities, 2018, available at: https://www.interregsolarise.eu/wp-content/uploads/2018/12/FINAL-SOLARISE-EVENT-18_10-2018-presPVT.pdf, (accesed on: 28.01.2024).
  8. Ben cheikh el hocine, H.; Touafek, K.; Kerrour ,F.; Haloui, H.; Khelifa, A.. Model Validation of an Empirical Photovoltaic Thermal (PV/T) Collector, Energy Procedia , 2015, volume 74. [CrossRef]
  9. Ouhsiane, L; Siroux, M.; Ganaoui, M.E.; Mimet, A. Multi-Objective Optimization of Hybrid PVT Solar Panels, 2018 International Conference and Utility Exhibition on Green Energy for Sustainable Development (ICUE), Phuket, Thailand, 2018, pp. 1-5. [CrossRef]
  10. Rosli, M. A. M.; Misha, S; Sopian, K; Mat, S; Yusof Sulaiman, M; Salleh, E. Thermal Efficiency of the Photovoltaic Thermal System with Serpentine Tube Collector, Engineering, Environmental Science, Applied Mechanics and Materials, 2014. [CrossRef]
  11. Furbo, S; Perers, B; Dragsted, J; Gomes, J; Gomes, M; Coelho, P; Yıldızha, H; Yilmaz, I.H; Aksay, B; Bozkurt, A; Cabral, D; Hosouli, S; Hayati, A; Kaziukonytė, J; Sapeliauskas, E; Kaliasas, R. Best practices for PVT technology, International Solar Energy Society, SWC2021 Proceedings.
  12. Sciubba,E; Toro, C. Modeling and Simulation of a Hybrid PV/Thermal collector, 24th International Conference on Efficiency, Cost, Optimization, Simulation and Environmental Impact of Energy Systems, ECOS 2011.
  13. Ngunzi, V; Njoka, F; Kinyua, R. Modeling, simulation and performance evaluation of a PVT system for the Kenyan manufacturing sector, Heliyon, 2023, volume 9, issue 8, , e18823.
  14. Nualboonrueng, T; Tuenpusa, P; Ueda, Y; Akisawa, A. Field Experiments of PV-Thermal Collectors for Residential Application in Bangkok, Energies, 2012, volume 5, 1229-1244;. [CrossRef]
  15. A photovoltaic thermal panel for heat-pump houses, available online: https://www.pv-magazine.com/2020/04/20/a-photovoltaic-thermal-panel-for-heat-pump-houses/, (accesed on: 28.01.2024) .
  16. Diwania, S; Agrawal, S; Siddiqui, A.S; Singh, S. Photovoltaic–thermal (PV/T) technology: a comprehensive review on applications and its advancement, International Journal of Energy and Environmental Engineering, 2020, pp.33–54. [CrossRef]
  17. Pokorny, N; Matuška,T. Glazed Photovoltaic-thermal (PVT) Collectors for Domestic Hot Water Preparation in Multifamily Building, Sustainability, 2020, 12, 6071;. [CrossRef]
  18. Barbu, M; Minciuc, E; Frusescu, D.C; Tutica, D. Integration of Hybrid Photovoltaic Thermal Panels (PVT) in the District Heating System of Bucharest, 2021 10th International Conference on ENERGY and ENVIRONMENT (CIEM), DOI: 10.1109/CIEM52821.2021,14-15 Oct. 2021 Romania.
  19. Barbu, M; Darie, G; Siroux, M. Analysis of a Residential Photovoltaic-Thermal (PVT) System in Two Similar Climate Conditions, Energies, 2019, 12, 3595;. [CrossRef]
  20. Hazi, A; Hazi, G; Grigore, R; Vernica, S. Opportunity to use PVT systems for water heating in industry, Applied Thermal Engineering, 2014, volume 63, pp.151-157.
  21. Hazi, A; Grigore, R; Hazi, G. Energy efficiency of the PVT system used in industry, 2012 11th International Conference on Environment and Electrical Engineering, IEEE, 2012, pp.235-240. [CrossRef]
  22. Tsai, H.L. Design and Evaluation of a Photovoltaic/Thermal-Assisted Heat Pump Water Heating System, Energies, 2014, 7, 3319-3338;. [CrossRef]
  23. Al Tarabsheh,A; Etier, I; Fath, H; Ghazal, A; Morci, Y; Asad, M; El Haj, A. Performance of photovoltaic cells in photovoltaic thermal (PVT) modules, IET Renewable Power Generation, Online ISSN:1752-1424, 2016. [CrossRef]
  24. Kandilli, C. A comparative study on the energetic- energetic and economical performance of a photovoltaic thermal system (PVT), Res. Eng. Struct. Mat., Online Publication Date: 9 Feb 2019.
  25. Chow, T.T. A review on photovoltaic/thermal hybrid solar technology Applied Energy , 2010, 87, no. 2: 365- 379.
  26. Fujisawa, T; Tatsuo, T. Annual exergy evaluation on photovoltaic -thermal hybrid collector, Solar energy materials and solar cells, 1997, 47, no. 1-4 PP. 135-148.
  27. Lateef Abdullah, A; Misha,S; Tamaldin, N; Afzanizam, M; Rosli, M; Sachit, F.A. Hybrid Photovoltaic Thermal PVT Solar Systems Simulation via Simulink/Matlab, CFD Letters n11, Issue4(2019), 64-78.
  28. SR EN ISO 9806-2017, Solar thermal collectors, Test methods.
  29. Kramer, K. Status Quo of PVT Characterization, SHC Task 60 - Report B1, available at: https://task60.iea-shc.org/Data/Sites/1/publications/IEA-SHC-Task60-B1-Status-Quo-Report-PVT-Characterization.pdf , (accesed on: 31.01.2023).
  30. Boureima, D; Sikoudouin, T.M.Ky, Ouedraogo, E; Hayibo, K.S; Bathiebo, D.J. Theoretical Study of a Thermal Photovoltaic Hybrid Solar Collector, Indian Journal of Science and Technology, 2018, Vol 11(43). [CrossRef]
  31. The MathWorks, Inc., “Photovoltaic Thermal (PV/T) Hybrid Solar Panel”, Matlab Help Center, 2023. Retrieved 25.07.2023. https://www.mathworks.com/help/sps/ug/photovoltaic-thermal-pvt-hybrid-solar-panel.html.
  32. Grigore, R.M.; Vernica, S.G.; Popa, S.E.; Banu, I.V. PVT Hybrid Solar Panel - Simulink Model and Dataset. IEEE Dataport, January 17, 2024. [CrossRef]
  33. Banu, I.V.; Istrate, M. Modeling and Simulation of Photovoltaic Arrays. World Energy System Conference – WESC 2012, Buletinul AGIR, 2012, no. 3, 1-6.
  34. https://www.engineersedge.com/heat_transfer/thermal_conductivity_propylene_glycol_15916.htm , (accessed at 03.02.2024).
  35. Duffie, J.A; Beckman, W.A. Solar Engineering of Thermal Processes, Fourth Edition, Wiley, 2013.
  36. Fatehi, J. H; Sauer, K.J. Modeling the incidence angle dependence of photovoltaic modules in PVsyst, 2014 IEEE 40th Photovolt. Specialist Conf. (PVSC), Denver, CO, USA, 2014, pp. 1335-1338. [CrossRef]
  37. Santbergen, R; Goud, J.M; Zeman, M; van Roosmalen, J.A.M; van Zolingen, R.J.C. The AM1.5 absorption factor of thin-film solar cells, Sol. Energy Mater Sol. Cells, 2010, vol. 94, no. 5, pp. 715-723, ISSN 0927-0248. [CrossRef]
  38. Santbergen, R; van Zolingen, R.J.C. The absorption factor of crystalline silicon PV cells: A numerical and experimental study, Sol. Energy Mater Sol. Cells, 2008, vol. 92, no. 4, pp. 432-444, ISSN 0927-0248. [CrossRef]
  39. Li, W. et al., A coupled optical-thermal-electrical model to predict the performance of hybrid PV/T-CCPC roof-top systems, Renewable Energy, vol. 112, 2017, pp. 166-186, ISSN 0960-1481. [CrossRef]
  40. Ji, Y. et al., “Optical Design and Validation of an Infrared Transmissive Spectrum Splitting Concentrator Photovoltaic Module,” IEEE J. Photovolt., vol. 7, no. 5, pp. 1469-1478, Sept. 2017. [CrossRef]
  41. SUNSYSTEM, Solar Thermal System, catalogue, pg. 16-18, available at: https://www.amadeuscom.ro/wp-content/uploads/2021/08/Catalog-panouri-solare-Sunsystem.pdf.
  42. Banu, I. V.; Istrate, M.; Machidon, D.; Pantelimon, R. Study regarding modeling photovoltaic arrays using test data in MATLAB/Simulink. UPB Sci. Bull. C: Electr. Eng. Comput. Sci. 2015, 77:2, 227-234., available at : https://www.scientificbulletin.upb.ro/rev_docs_arhiva/full83f_148621.pdf.
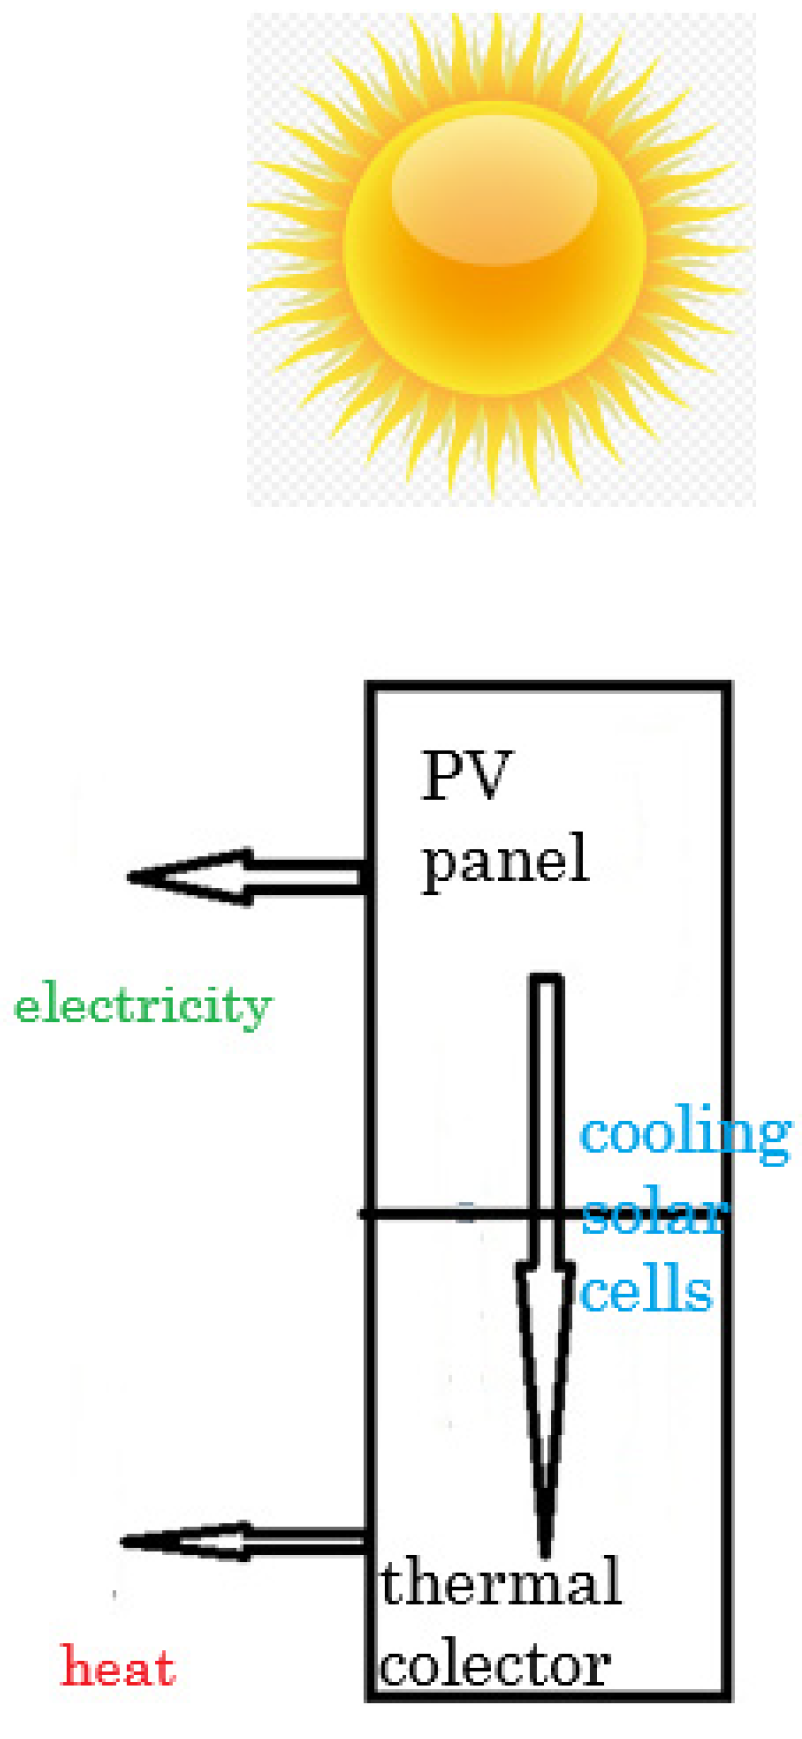
Figure 1. Scheme of electricity and heat production in a hybrid panel.
Preprints 99121 g001
Figure 2. Scheme of PV/T system: 1 – photovoltaic-thermal panel; 2 – solar charger; 3 – communication center; 4 – inverter; 5 – differential temperature controller; 6 – rechargeable battery; 7,9 – fuses; 8 – smart shunt; 10, 11 – automatic switches; 12 – AC outlet; 13 – AC bulb; 14 – optional power supply; 15 – panel temperature sensor; 16 – boiler water temperature sensor; 17 – electric boiler 120l; 18 – boiler coil; 19 – electrical resistance; 20 – one-way valve; 21, 30 – expansion vessels; 22 – hot water outlet; 23, 26, 27, 33 – water valves; 24 – water meter; 25 – thermos manometer; 28, 29 – solar aerator; 31 – manometer; 32 – thermometer.
Preprints 99121 g002
Figure 3. Schematic presentation of PV/T panel.
Preprints 99121 g003
Figure 4. Dimensions in mm of the hybrid panel.
Preprints 99121 g004
Figure 5. Produced energy on July 24, 2023, based on historical data from VictronConnect software.
Preprints 99121 g005
Figure 6. Proposed PV/T hybrid solar panel model.
Preprints 99121 g006
Figure 7. Diagram of optical model for the glass cover.
Preprints 99121 g007
Figure 8. Graph of optical characteristics of the glass cover of PV/T panel [31].
Preprints 99121 g008
Figure 9. Total optical coefficients of the glass cover infinite reflections between two parallel boundaries of the studied PV/T hybrid solar panel model.
Preprints 99121 g009
Figure 10. Diagram of temperatures and power of the PV/T system modeled in Matlab/Simulink.
Preprints 99121 g010
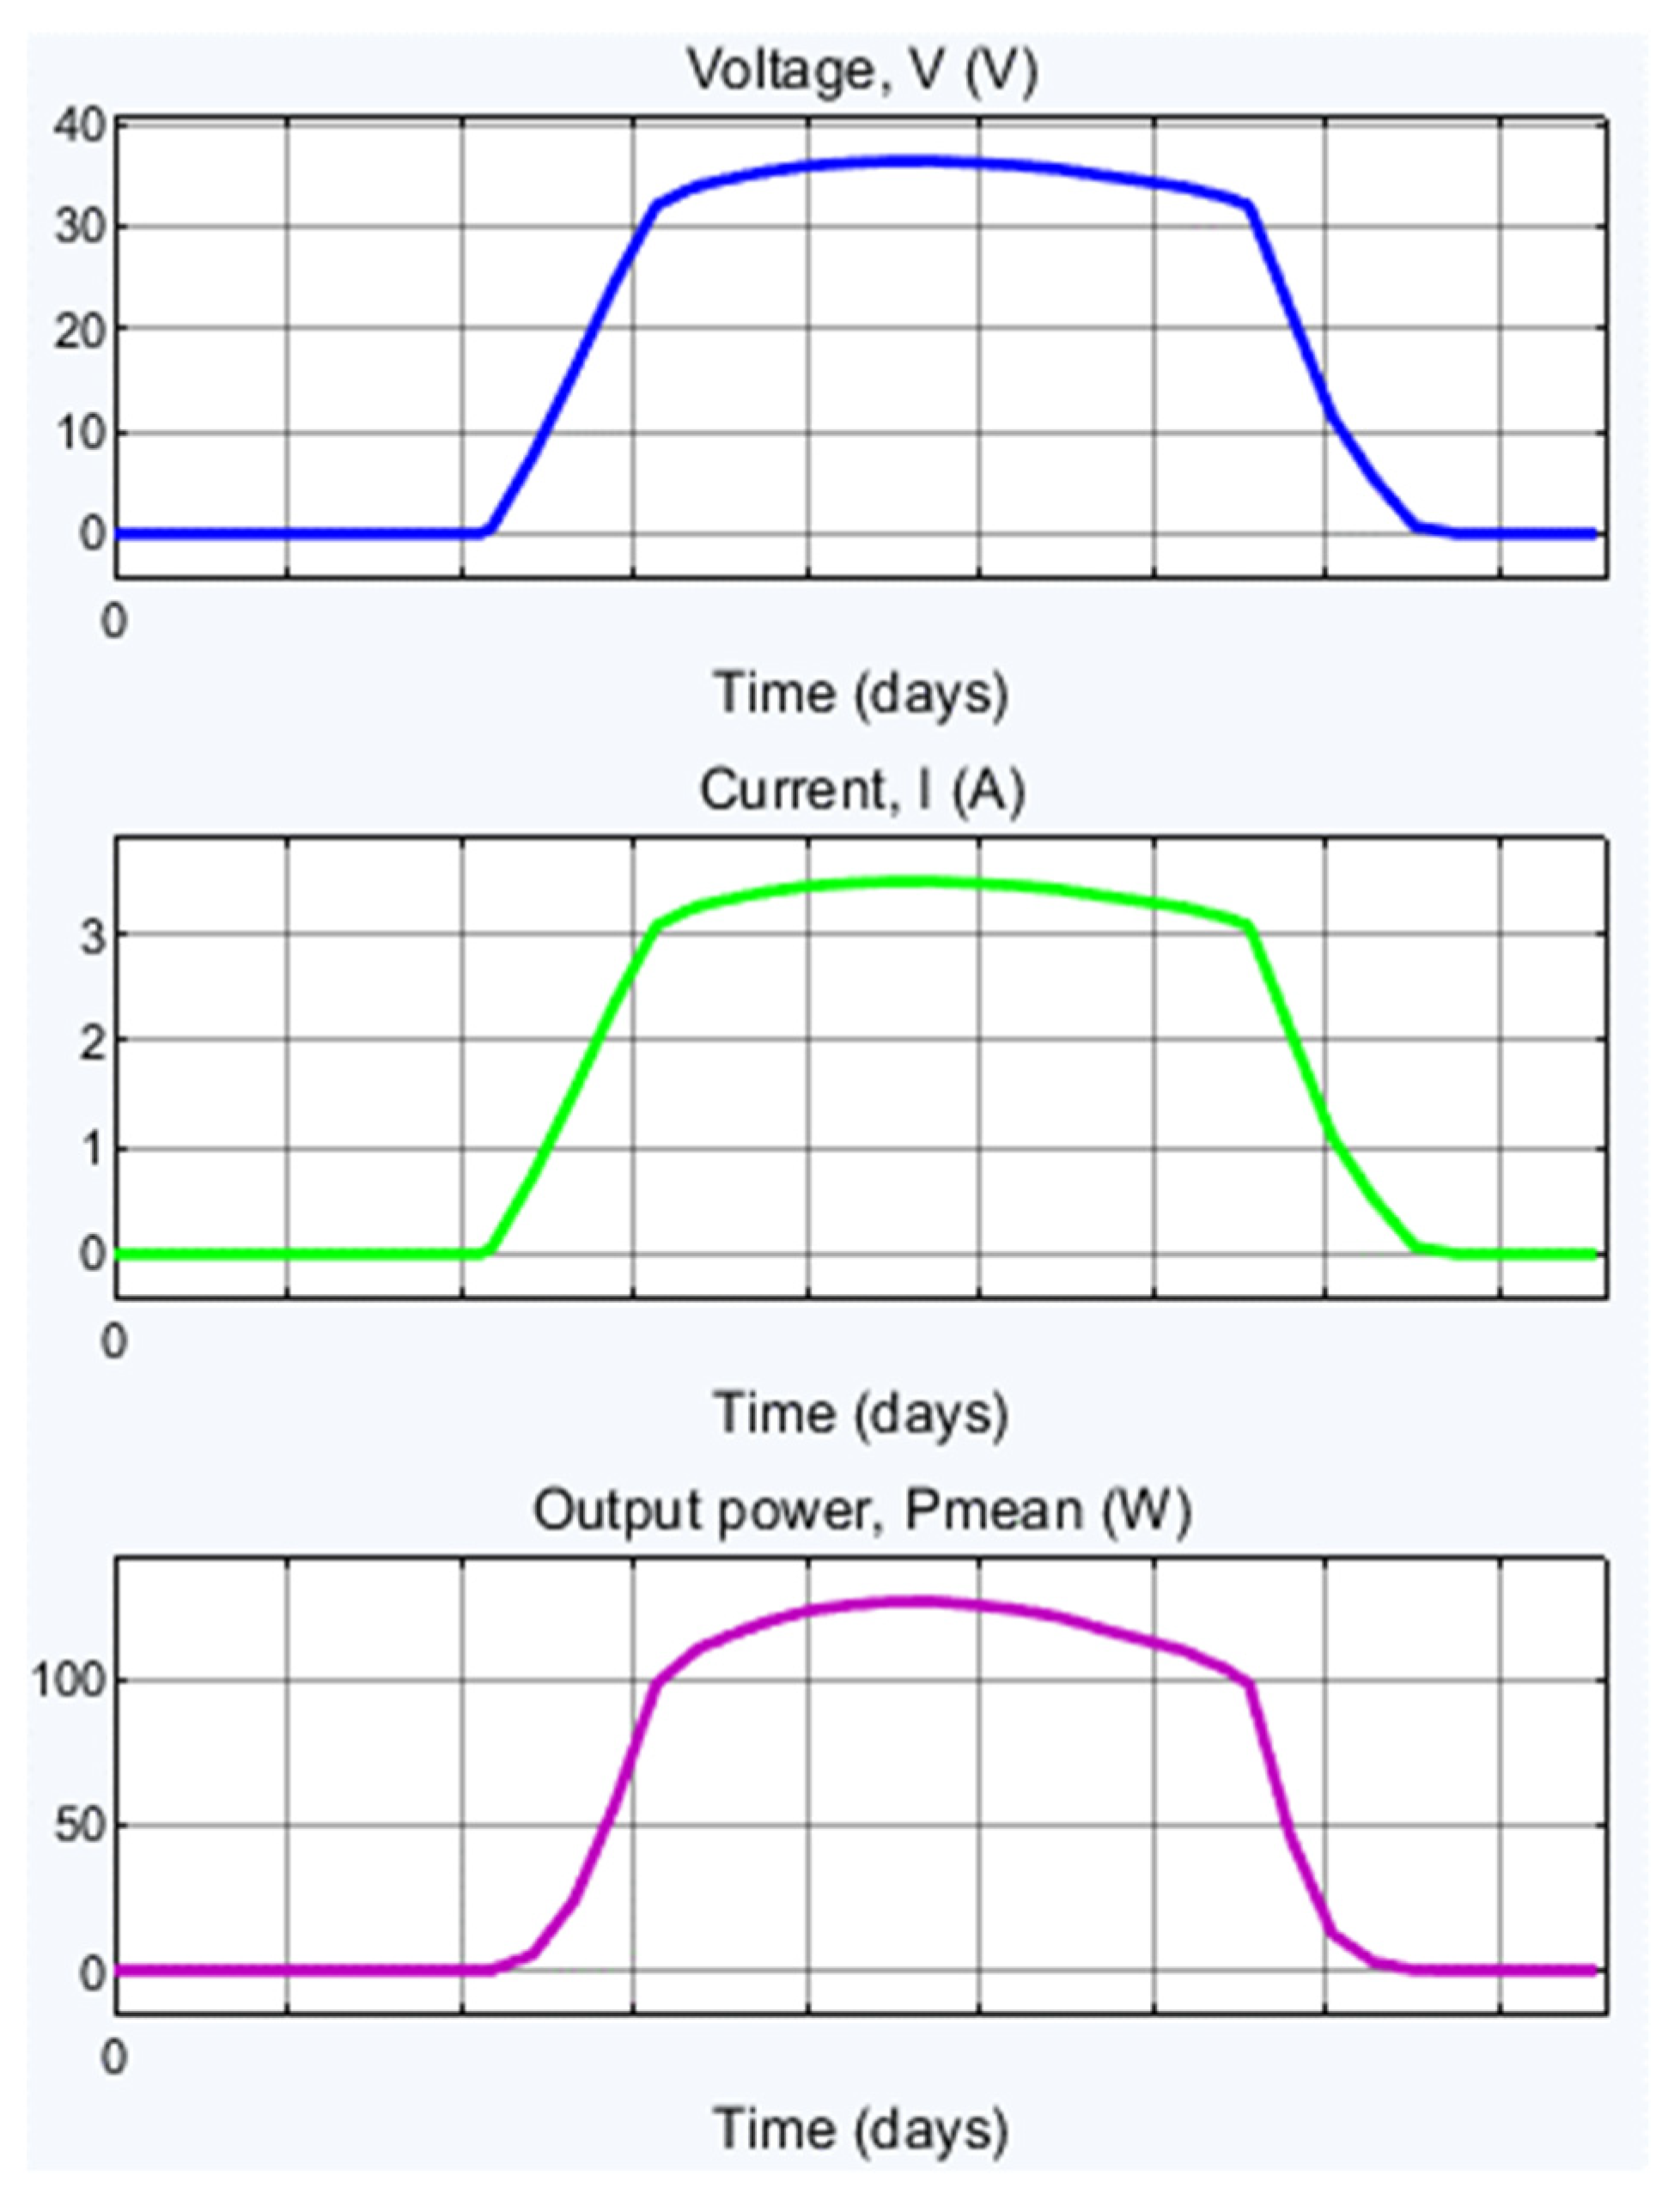
Figure 11. Output voltage, current, and power of the electrical part of the PV/T panel for one day.
Preprints 99121 g011
Table 1. Technical data SUNSYSTEM PANEL PVT 240.
Parameter Value/Type
Height · Width · Thickness 1650 x 990 x 40 mm
Weight 28 kg
Frame Aluminum
Front side Tempered solar glass 3.2 mm
Back side Aluminum panel
Type of PV module cells polycrystalline
Number of cells/module/Size of cell 60 (6x10) / 156 x 156 mm
Maximum power Pmax 240 Wp
Open circuit voltage Voc 37,2 V
Current at maximum power Imax 7,84 A
Short circuit current Isc 8.52 A
Voltage at maximum power Vmp 30,6 V
Cell/ Module efficiency 16.4 % / 14.7 %
Overall surface 1.62 m2
Nominal thermal capacity 900 W
Heat carrier inlet/outlet 2·G ½ ”
Distance between heat carrier inlet/outlet 840 mm
Thermal Agent PG 50%
Thermal Agent Volume 1.17 liter
Flow rate of Thermal Agent 1.5 ÷ 2,5 l/min.
Thermal loss coefficient k1 9.13 W/m2K
Thermal loss coefficient k2 0.00 W/m2K2
Efficiency in relation to aperture ηo 0.559
Material of separator Aluminum
Material of absorber pipe system Cooper
Insulation rigid PU– 20 mm
Table 2. Proprieties of Propylene Glycol 50% concentration.
Temperature [°C] Thermal Conductivity [W/mK] Specific Heat [J/kgK]
21.11 0.3632 3537.85
26.66 0.3649 3558.78
32.22 0.3684 3579.71
37.77 0.3701 3604.83
43.33 0.3719 3625.77
Table 3. Table of measurements.
Parameter G Ta Tpv Tt2 Tf1 Tf = (Tf1 + Tf2)/2
hour W/m2 °C °C °C °C °C
8am 315 21.85 22.45 33 24.9 28.95
9am 581 22.30 31.20 30 29.5 29.75
10am 781 24 38.46 34 33.9 33.95
11am 1005 25.9 44.48 38 37.7 37.85
12am 1106 30.6 47.50 41 40.4 40.7
1pm 1158 31.3 49.62 43.2 42.7 42.95
2pm 1123 33 52.90 46 44.8 45.4
3pm 1125 33.1 42.18 37 36.6 36.8
4pm 903 34.2 38.18 38 37.4 37.7
5pm 688 33.9 36.26 36 34 35
6pm 364 32.7 36.08 36 34.5 35.25
7pm 196 33.6 35.95 35.8 35.3 35.55
where: Ta – ambient temperature, Tf1 – inlet thermal agent temperature, Tf2 –outlet thermal agent temperature, Tpv – temperature at the surface of the PV/T panel, G – global incidence radiation on the tilted collector surface, Tf – thermal agent (PG 50%) medium temperature.
Table 4. Part elements of the PV/T panel.
PV/T Component, index Thickness, L (m) Thermal Conductivity k, (W/mK) Specific Heat, cp, (J/kgK)
glass, g 0.0032 1 800
solar cell, pv 0.000005 148 200
separator, sepT 0.0002 230 897
heat exchanger (copper tube), e 0.002 390 400
insulation layer, ins 0.002 0.022
backcover, b 0.035 230 897
Table 5. PV/T Solar Panel Parameters.
Initial Temperatures [K] Value
Glass cover, Tg0 [K] 295
PV solar cells, Tpv0 [K] 295
Heat exchanger, Te0 [K] 295
Water in the tank, Tw0 [K] 295
Back cover, Tb0 [K] 295
Geometry Value
Area of a PV solar cell, Acell [m2] 0.024336
Number of PV solar cells, Ncell 60
Optical Properties Value
Refractive index ratio glass/air, ng 1.62
Absorption coefficient of glass cover per unit length, Ag [1/m, m-1] 0.2
Thickness of glass cover, Lg [m] 0.0032
Reflection factor of PV solar cell, rpv 0.15
Heat Transfer Properties Value
Temperature of ambient air, Ta [K] 294.15
Temperature of sky (for radiative heat transfer), Tsky [K] 278.48
Mass of glass cover, Mg [kg] 11.6
Mass of one PV solar cell, Mpv [kg] 0.0726
Mass of heat exchanger, Me [kg 7.044
Mass of back cover, Mb [kg] 5
Specific heat of glass, Cg [J/kg/K] 800
Specific heat of PV solar cell, Cpv [J/kg/K] 200
Specific heat of heat exchanger, Ce [J/kg/K] 400
Specific heat of back cover, Cb [J/kg/K] 897
Emissivity of glass, εg 0.75
Emissivity of PV solar cell, εpv 0.7
Free convection coefficient between ambient air and glass, hga [W/m2/K] 6.1
Free convection coefficient between glass and PV solar cells, hgpv [W/m2/K] 24
Free convection coefficient between back cover and ambient air, hba [W/m2/K] 6.1
Thermal conductivity of heat exchanger, ke [W/m/K] 390
Thickness of heat exchanger, Le [m] 0.002
Thermal conductivity of insulation layer, kins [W/m/K] 0.022
Thickness of insulation layer, Lins [m] 0.02
PV Solar Cell Electrical Properties Value
Short-circuit current, Isc [A] 8.52
Open-circuit voltage, Voc [V] 0.62
Diode saturation current, Is [A] 1e-6
Diode saturation current, Is2 [A] 0
Solar-generated current for measurements, Iph0 [A] 8.5445
Solar irradiance used for measurements, G0 [W/m2] 1000
Quality factor, N1 1.5
Quality factor, N2 2
Series resistance, Rs [Ω] 0
Parallel resistance, Rp [Ω]
First order temperature coefficient for Iph, TIPH1 [1/K, K-1] 0.065
Energy gap, EG [eV] 1.11
Temperature exponent for Is, TXIS1 3
Temperature exponent for Is2, TXIS2 3/2
Temperature exponent for Rs, TRS1 1
Temperature exponent for Rp, TRP1 0
Measurement temperature, Tmeas [℃] 25
Pipe Parameters Value
Pipe length, length [m] 5.83
Cross-sectional area, area [m2] 0.000201
Hydraulic diameter, Dh [m] 0.016
Aggregate equivalent length of local resistances, lengthadd [m] 0.8
Internal surface absolute roughness, roughness [m] 0.000015
Laminar flow upper Reynolds number limit, Relam 2000
Turbulent flow lower Reynolds number limit, Retur 4000
Shape factor for laminar flow viscous friction, shapefactor 64
Nusselt number for laminar flow heat transfer, Nulam 3.66
Tank Parameters Value
Maximum tank capacity, Volmax [m3] 0.1
Tank cross-sectional area, Atank [m2] 0.148
Initial volume in the tank, Voltank0 [m3] 0.01
Initial temperature in the tank, Ttank0 [K] 295
Insulating layer thickness, Lins [m] 0.02
Thermal conductivity of insulation layer, kins [W/m/K] 0.022
Free convection coefficient between tank and ambient air, hta [W/m2/K] 10
Pump Flow Input Parameters Value
Internal circuit mass flow rate, mdotint [kg/s] 0.026
Demand mass flow rate (to the sink), mdotdem [kg/s] 0.005
Supply mass flow rate (from the source), mdotsup [kg/s] 0.005
Table 6. Efficiency calculated with the formulas from Model 1.
Hour T ηth ηel ηgl
8am 7.1 0.4456 0.1132 0.5587
9am 7.45 0.4421 0.1172 0.5592
10am 9.95 0.4428 0.1205 0.5633
11am 11.95 0.4506 0.1232 0.5738
12am 10.1 0.4757 0.1246 0.6003
1pm 11.65 0.4672 0.1256 0.5928
2pm 12.4 0.4583 0.1271 0.5854
3pm 3.7 0.5290 0.1222 0.6512
4pm 3.5 0.5237 0.1203 0.6440
5pm 1.1 0.5444 0.1195 0.6639
6pm 2.55 0.4951 0.1194 0.6145
7pm 1.95 0.4683 0.1193 0.5876
Table 7. PV/T hybrid solar panel efficiency calculation, model 2.
Parameter Value
Total input solar energy in the period [kWh] 10.1199
Total electricity supplied to the load [kWh] 1.2923
Total absolute thermal energy in the water supplied to the user 10.1358
Total absolute thermal energy in the water extracted from the source [kWh] 5.5004
Total used thermal energy (sink – source) [kWh] 4.6353
Electrical efficiency 0.12769
Thermal efficiency 0.45804
Total efficiency 0.58574
Table 8. Results for thermal, electrical, and global efficiency.
Model ηth ηel ηgl
Model 1 0.4786 0.1210 0.5996
Model 2 0.4580 0.1277 0.5857
Disclaimer/Publisher’s Note: The statements, opinions and data contained in all publications are solely those of the individual author(s) and contributor(s) and not of MDPI and/or the editor(s). MDPI and/or the editor(s) disclaim responsibility for any injury to people or property resulting from any ideas, methods, instructions or products referred to in the
Copyright: This open access article is published under a Creative Commons CC BY 4.0 license, which permit the free download, distribution, and reuse, provided that the author and preprint are cited in any reuse.
Prerpints.org logo

Preprints.org is a free preprint server supported by MDPI in Basel, Switzerland.

Subscribe

© 2024 MDPI (Basel, Switzerland) unless otherwise stated