1. Introduction
Inositol is a naturally occurring cyclitol with a six-hydroxylated carbon ring structure. It can be found in both free forms and as derivatives in plants, in phosphorylated forms (phytic acid) [
1,
2,
3], and in mammals as a membrane phospholipid (phosphatidyl inositol) of the skeletal, heart, and reproductive tissues of humans [
4,
5]. Reportedly, they play a pivotal role as a secondary messenger in various transduction pathways involving cell growth and survival [
6,
7,
8]. Furthermore, inositol can naturally exist in various optical forms and derivatives [
9,
10,
11]. Among those, myo-inositol and D-chiro-inositol are the most widely distributed in prokaryote and eukaryote cells. Its methyl derivative has been extensively studied and reported to possess diverse biological activities, including protection from cardiovascular disease, anti-inflammation, anticancer [
12,
13,
14], and anti-osteoporosis activities.
Osteoporosis is a critical bone-metabolic condition resulting from an imbalance between osteoblast-mediated bone formation and osteoclast-mediated bone resorption, leading to bone loss [
15,
16,
17]. It primarily affects elderly adults and is characterised by deteriorating bone architecture and increased fracture risk. In particular, excessive osteoclast-mediated bone resorption is considered a significant contributor to the onset and progression of osteoporosis. Treatment primarily involves the use of osteoclastogenesis inhibitors, such as bisphosphates, calcitonin, and oestrogens [
18,
19]. Osteoclastogenesis is the development of osteoclasts from hemopoietic progenitor cells, regulated by cytokines and hormones [
20]. Macrophage colony-stimulating factor (M-CSF) and receptor activator of nuclear factor-κB ligand (RANKL) play crucial roles in this process. M-CSF promotes the survival and proliferation of osteoclast precursors, while RANKL governs their differentiation and bone resorption [
21,
22]. Inhibition of RANKL prevents osteoporosis and bone loss [
23]. During osteoclast development, RANKL binds to its receptor, RANK, and activates signalling pathways, including nuclear factor-kappa B (NF-κB), mitogen-activated protein kinase (MAPK), phosphoinositide 3-kinase (PI3K), and the calcium-calmodulin pathway, facilitated by the adaptor protein TRAF6 [
20,
24,
25]. NF-κB is particularly recognised as a vital mechanism in osteoclastogenesis, and its deficiency reportedly leads to osteoporosis and impaired osteoclast formation [
26,
27]. Activation of NF-κB and other transcription factors, such as Fos proto-oncogene (c-Fos) and nuclear factor of activated T cells cytoplasmic 1 (NFATc1), promotes the expression of essential enzymes involved in bone resorption by osteoclasts, including tartrate-resistant acid phosphatase (TRAP), cathepsin K, and matrix metallopeptidase 9 (MMP-9) [
20,
28].
Notably, D-pinitol, a methyl derivative of D-chiro-inositol, suppressed osteoclast differentiation and alleviated bone loss in ovariectomized mice by inhibiting the NF-κB and MAPK pathways [
29]. L-Quebrachitol (2-O-methyl-L-inositol) is the isomer of D-pinitol found in several plants, including sea buckthorn (
Hippophae rhamnoides) [
30]. It is particularly abundant in
Hevea latex serum, produced as a by-product from the rubber industry. Interestingly, it has been used as an optically starting material for synthesis of various biologically active compounds such as antibiotics and enzyme inhibitor [
30,
31]. Moreover, L-Quebrachitol exhibits various pharmacological activities, including anti-platelet aggregation, PAF inhibition, gastroprotective effects, and antidiabetic properties [
32,
33,
34]. Despite being an isomer of D-pinitol, L-Quebrachitol, like most isomers, display significant differences in biological activities, such as toxicology, pharmacology and metabolism [
35]. The previous study clearly indicated that D-pinitol possesses inhibitory activity against osteoclastogenesis but has no effect on osteoblastogenesis [
29]. Conversely, our study obviously demonstrated that L-quebrachitol enhances osteoblastogenesis through involvement in the BMP-2/Runx2/MAPK/Wnt/β-Catenin signalling pathway [
36]. Furthermore, a recent study revealed that L-quebrachitol significantly augments bone mineral density and bone calcium content in ovariectomized rats [
37]. Nevertheless, its effect on RANKL-induced osteoclastogenesis remains unclear.
Therefore, this study examined the impact and mechanism of L-quebrachitol on RANKL-induced osteoclastogenesis in the RAW 264.7 pre-osteoclastic cell line. Our findings demonstrate that L-quebrachitol effectively inhibits osteoclast proliferation, differentiation, and bone resorptive function. These results suggest that L-quebrachitol has potential as a natural compound for addressing bone metabolic issues.
2. Materials and methods
2.1. Materials
Dulbecco’s modified eagle’s medium and foetal bovine serum were purchased from Gibco (Grand Island, NY, USA). Recombinant RANKL and M-CSF were purchased from R&D Systems (Minneapolis, MN, USA). Antibodies for c-Fos (No. 2250S), NFATc1 (No. 8032S), NF-κB-P65 (No. 8242S), P-NF-κB-P65 (No. 3033S), and β-actin (No. 4970S) were obtained from cell signalling technology (Danvers, MA, USA). D-Pinitol and 3-(4,5-dimethylthiazol-2-yl)-2,5-diphenyltetrazolium bromide (MTT) were purchased from Sigma Aldrich (St. Louis, MO, USA). L-Quebrachitol was obtained from the Center for Natural Rubber Latex Biotechnology Research and Innovation Development. Extraction and purification were performed based on previously reported methods [
36]. All other reagents and solvents of analytical grade were purchased locally.
2.2. Cell Culture and Differentiation
RAW 264.7 cells were received from the American Type Culture Collection (ATCC, Manassas, VA, USA) and cultured in Dulbecco’s modified eagle’s medium supplemented with 10% foetal bovine serum, 100 units/mL of penicillin, and 100 µg/mL of streptomycin at 37 ºC in an incubator with 5% CO2. To induce osteoclast differentiation, cells were cultured in the presence of M-CSF (20 ng/mL) and RANKL (20 ng/mL) for five days. The culture medium was replaced every two days.
2.3. Cell Viability Assay
To assess the effect of L-quebrachitol on the viability of RAW 264.7 cells, an MTT assay was performed. We seeded RAW 264.7 cells in 96-well plates at a density of 5 × 10³ cells/well. Then, they were incubated overnight for cell adherence and treated with L-quebrachitol at different concentrations for 24, 48, and 72 h. After incubation, PBS was added to wash the cells. Then, MTT (0.25 mg/mL) was added to each well, and the mixture was incubated for 3 h at 37 °C, after which it was replaced with 50 μL of DMSO to dissolve formazan crystals. Absorbance was detected at 570 nm using a microplate reader (BioTek Instruments, Winooski, VT, USA).
2.4. Osteoclast Differentiation Assay
To evaluate osteoclast formation, TRAP staining kits (Sigma Aldrich; St. Louis, MO, USA) were performed. First, the cells at a density of 1.4 × 10³ cells/well were seeded into 96-well plates. After overnight incubation, fresh media containing 20 ng/mL M-CSF + 20 ng/mL RANKL + varying non-cytotoxic concentrations of L-quebrachitol were replaced. D-Pinitol (30 µM) was used as a positive control. After five days of incubation, the cells were fixed with 4% paraformaldehyde for 30 s and then stained for 1 h at 37 °C with naphthol AS-BI phosphate and a tartrate solution, followed by counterstaining for 3 min with a haematoxylin solution. The cells that contained three or more nuclei were determined to be TRAP-positive via light microscopy (Olympus, Tokyo, Japan).
2.5. Pit Formation Assay
To measure the effect of L-quebrachitol on bone resorptive activity, RAW 264.7 cells were seeded onto 96-well osteoassay surface plates (corning osteoassay, Ariz, USA) at a density of 1.4 × 10³ cells/well. Cells were treated with RANKL (20 ng/mL), M-CSF (20 ng/mL), and several doses of L-quebrachitol for seven days. Following this, the medium was aspirated and incubated with a 100 µL/well bleach solution for 5 min at 25 °C; this was followed by washing with distilled water three times and air drying for 3–5 h. The resorption pits were then captured using a light microscope at a magnification of 20x and measured using Image J (National Institutes of Health, Bethesda, USA).
2.6. Real-Time Quantitative Polymerase Chain Reaction
The mRNA level of osteoclastogenic genes was measured using real-time quantitative polymerase chain reaction (qRT-PCR). In this study, a 2.5 µM BAY11-7082-treated group and NF-κB inhibitor were added to experiments to compare the suppressive ability of L-quebrachitol on NF-κB-P65. After incubating the cells with L-quebrachitol in a 6-well plate, TRIzol reagent (Thermo Fisher Scientific Inc., Waltham, UT, USA) was employed for the extraction of total RNA, according to the manufacturer’s instructions. Then, an oligo-dT primer and reverse transcriptase (Thermo Scientific Inc., Waltham, UT, USA) were used for the production of cDNA. Real-time PCR was performed using 5x HOT FIREPol
®Blend Master Mix (Solis Biodyne, Tartu, Estonia) according to the manufacturer’s instructions. The cycling of thermal was set at 95 °C for 15 min for initial denaturation, 40 cycles of denaturation at 94 °C for 15 s, annealing at 57 °C for 30 s, and final elongation at 72 °C for 30 s. The specific primers are shown in
Table 1 The relative mRNA levels of target genes were analysed using the 2
-ΔΔCT method with
GAPDH as an internal control.
2.7. Western Blot Analysis
For the western blot analysis, RAW 264.7 cells were cultured onto 6-well plates at a density of 1 × 10⁵ cells/well overnight. Subsequently, cells were treated with RANKL (20 ng/mL), M-CSF (20 ng/mL), and various doses (0.00005–60 µM) of L-quebrachitol for three days. In addition, to determine the suppressing activity of L-quebrachitol on NF-κB-P65, the cells were also treated with 2.5 µM BAY11-7082. Then, RIPA buffer supplemented with a proteinase inhibitor cocktail and a phosphatase inhibitor cocktail (Thermo Fisher Scientific Inc., Waltham, UT, USA) was added for protein extraction of cultured cells. Protein content in the samples was measured using the BCA Protein Assay Kit (Thermo Fisher Scientific Inc., Waltham, UT, USA). An equal amount of protein was loaded onto 12% SDS-PAGE gel electrophoresis and then transferred onto PVDF membranes (Millipore, Jaffrey, NH, USA). After that, nonspecific binding was blocked for 1 h in 5% non-fat dried milk and then incubated overnight with the primary antibody (1:1000) at 4 °C. Next, they were washed with Tris-buffered saline Tween 20 and incubated with horseradish peroxidase-conjugated secondary antibodies (1:5,000) (N0. 7074S, Cell Signaling Technology). The signals were detected using the ECL Substrate Kit (Thermo Fisher Scientific Inc., Waltham, UT, USA), and the data were analysed using Image J.
2.8. Immunofluorescence Staining
To assess the effect of L-quebrachitol on the expression of RANK, an immunofluorescence assay was conducted. RAW 264.7 cells were plated into a chambered coverslip with 18 wells at a density of 2 × 10⁴ cells/well and treated with varying concentrations of L-quebrachitol in the presence of RANKL 20 (ng/mL) and M-CSF (20 ng/mL) for 24 h. Then, cells were fixed with 4% paraformaldehyde and permeabilised with 0.1% Triton X-100. After blocking with 5% goat serum, cells were incubated with the primary antibody anti-mouse RANK (1:500, Santa Cruz Biotechnology, sc-390655) at 4 °C overnight, incubated with the secondary antibody (1:200, Santa Cruz Biotechnology, sc-516141) for 3 h, and counterstained with DAPI (1 μg/mL) for 5 min. Finally, a drop of the mounting medium was carefully added, and fluorescence images were captured under a fluorescence microscope (Olympus, Tokyo, Japan) and analysed using Image J. The percentage of fluorescence intensity was subsequently calculated with following equation [Fluorescence intensity (Treated group)/ Fluorescence intensity (Control group)] x 100.
2.9. Statistical Analysis
All experiments were performed in triplicate. Data were presented as the mean ± standard error of the mean. All results were analysed with SPSS 23 (SPSS Inc., Chicago, IL, USA). Statistical differences were determined by a one-way ANOVA followed by Duncan’s and Tukey’s multiple range tests. The statistical significance of the data was considered at P < 0.05.
4. Discussion
Inositol is a sugar alcohol that plays a crucial role in the physiological system. Myo-inositol and D-chiro inositol are the two major stereoisomers of inositol distributed in the human body. Myo-inositol plays a crucial role in cell membranes, where it is found in the form of phosphatidyl-myo-inositol. Additionally, it serves as a secondary messenger that regulates hormonal activities, including insulin, follicle-stimulating hormone, and thyroid-stimulating hormone [
39,
40,
41]. Normally, inositols do not act liberally but interact with several biomolecules, such as sphingolipids, inositol pyrophosphates, and inositol methyl ethers [
6,
42,
43]. In particular, methyl-inositol exhibited anti-inflammatory, anticancer, and antiosteoporosis activities [
13,
14]. According to a prior study, D-pinitol, a methyl derivative of D-chiro-inositol, attenuates osteoclast differentiation by interrupting NF-ƘB and MAPK signalling pathway [
29]. Apparently, most isomers exhibit significant differences in effects. Consequently, one isomer may provide the desired therapeutic efficacy, while the other may be inactive [
35]. Accordingly, our previous research demonstrated that L-quebrachitol promotes osteoblast proliferation, differentiation, and mineralisation [
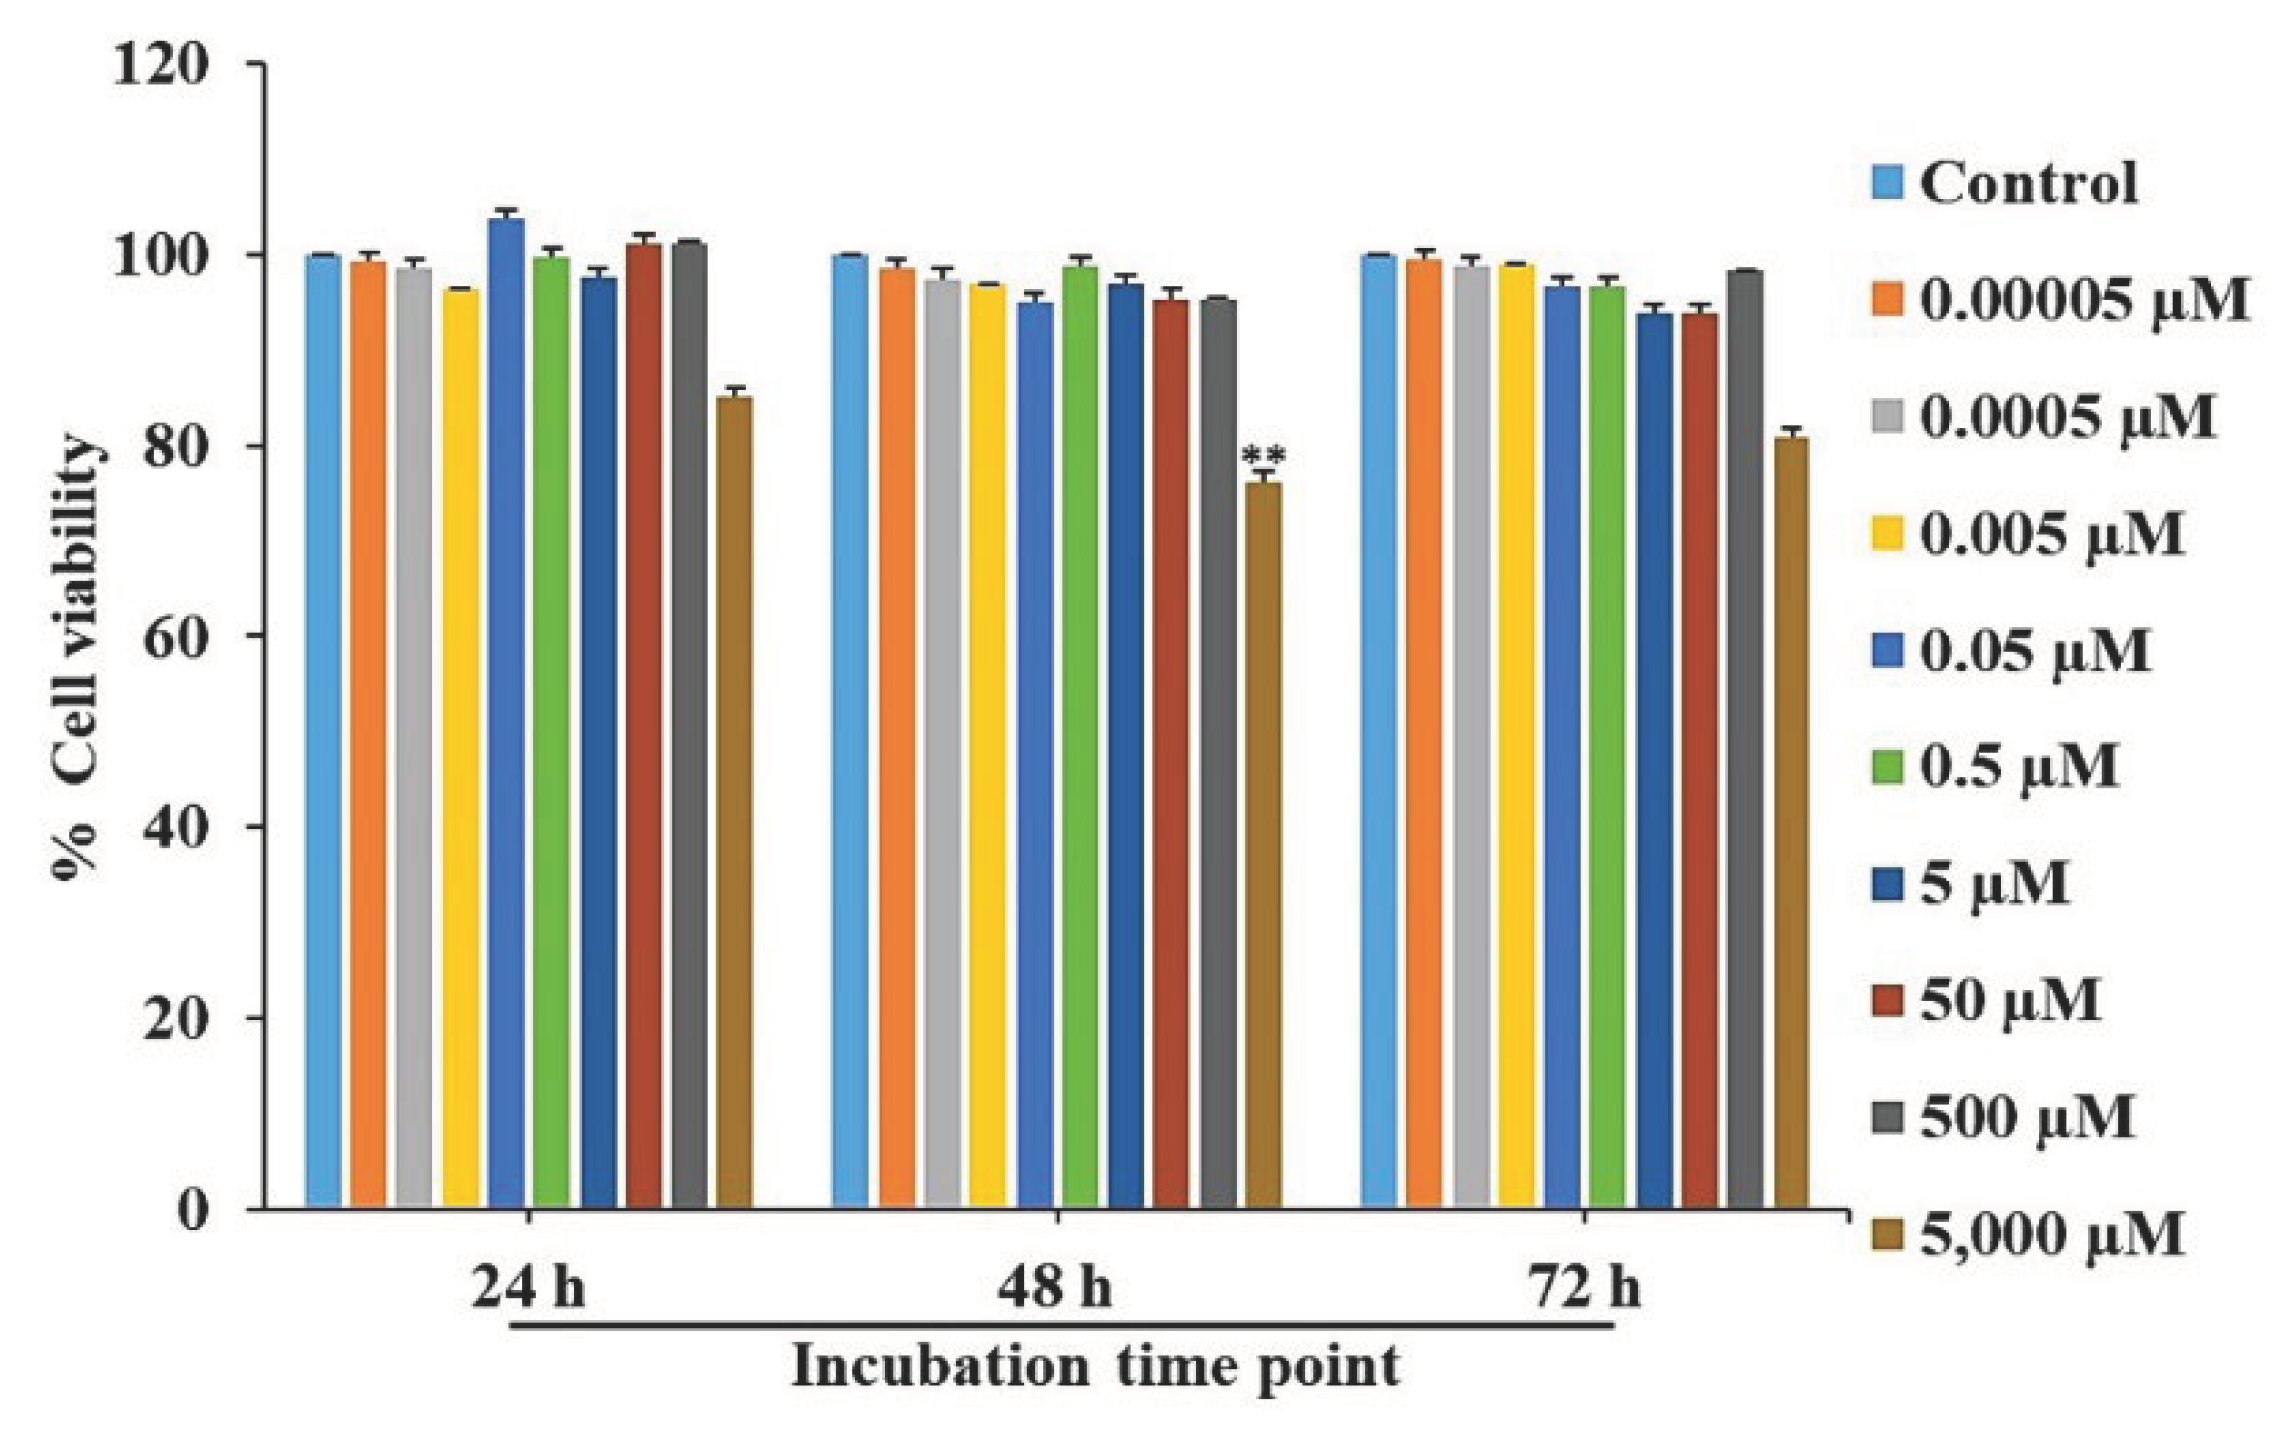
36], whereas, D-pinitol shows no modulatory effect on osteoblasts. However, the effect of L-quebrachitol on osteoclastogenesis remains unexplored. Therefore, this study is the first to report that L-quebrachitol can potentially suppress osteoclast differentiation and function. Cell viability assays showed that at concentrations lower than 500 µM, no cytotoxic effects were observed on the cells at any time.
Several collagenolytic enzymes, such as TRAP, MMP-9, and cathepsin K, were used to evaluate the maturation of osteoclasts. Among those, TRAP is widely used as a crucial histochemical marker of osteoclast maturity [
44,
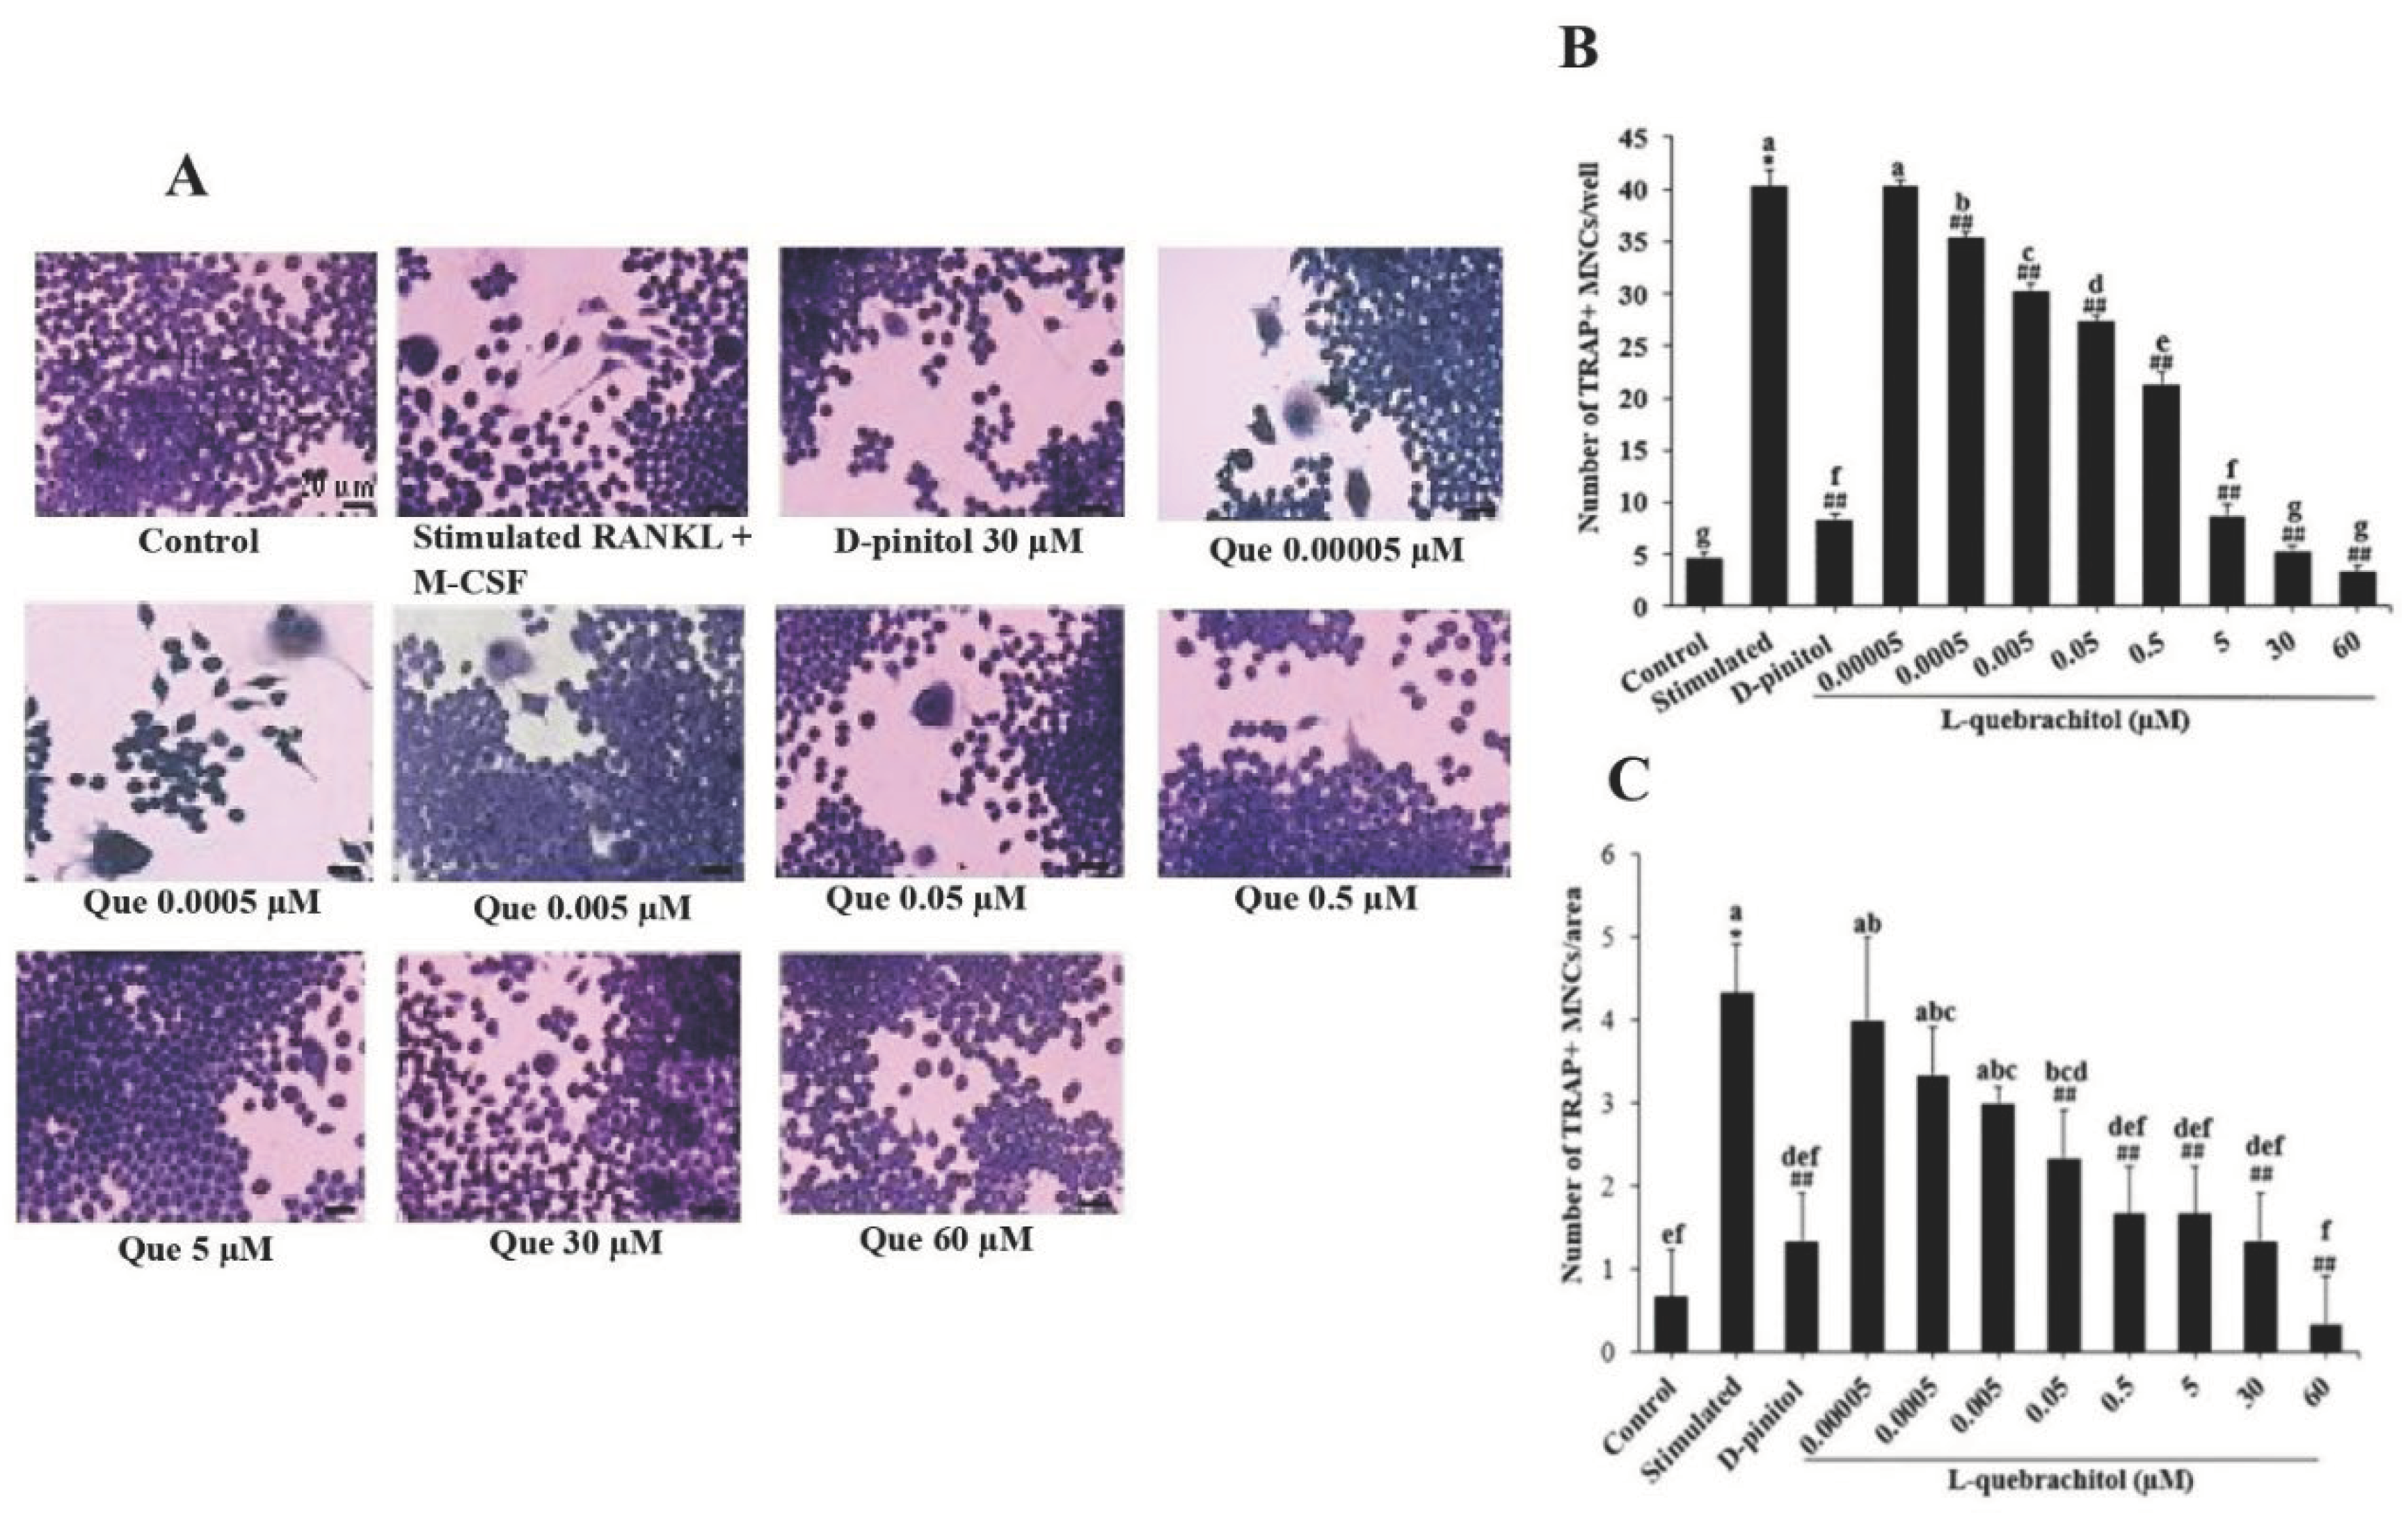
45]. TRAP staining results showed that L-quebrachitol significantly suppressed the number of multinucleated cells compared with that in the RANKL-stimulated group, consistent with the positive control group treated with D-pinitol, which has also been shown to inhibit the number of TRAP-positive cells.
This result confirms that L-quebrachitol can attenuate the fusion of mature osteoclasts, implying that the bone resorption function of osteoclasts is likely to be reduced.
During bone resorption, osteoclasts attach to the bone surface and initiate the resorption process by creating an acidic environment and secreting digestive enzymes. Thereafter, they leave behind resorption lacunae or pit formation areas [
44,
46,
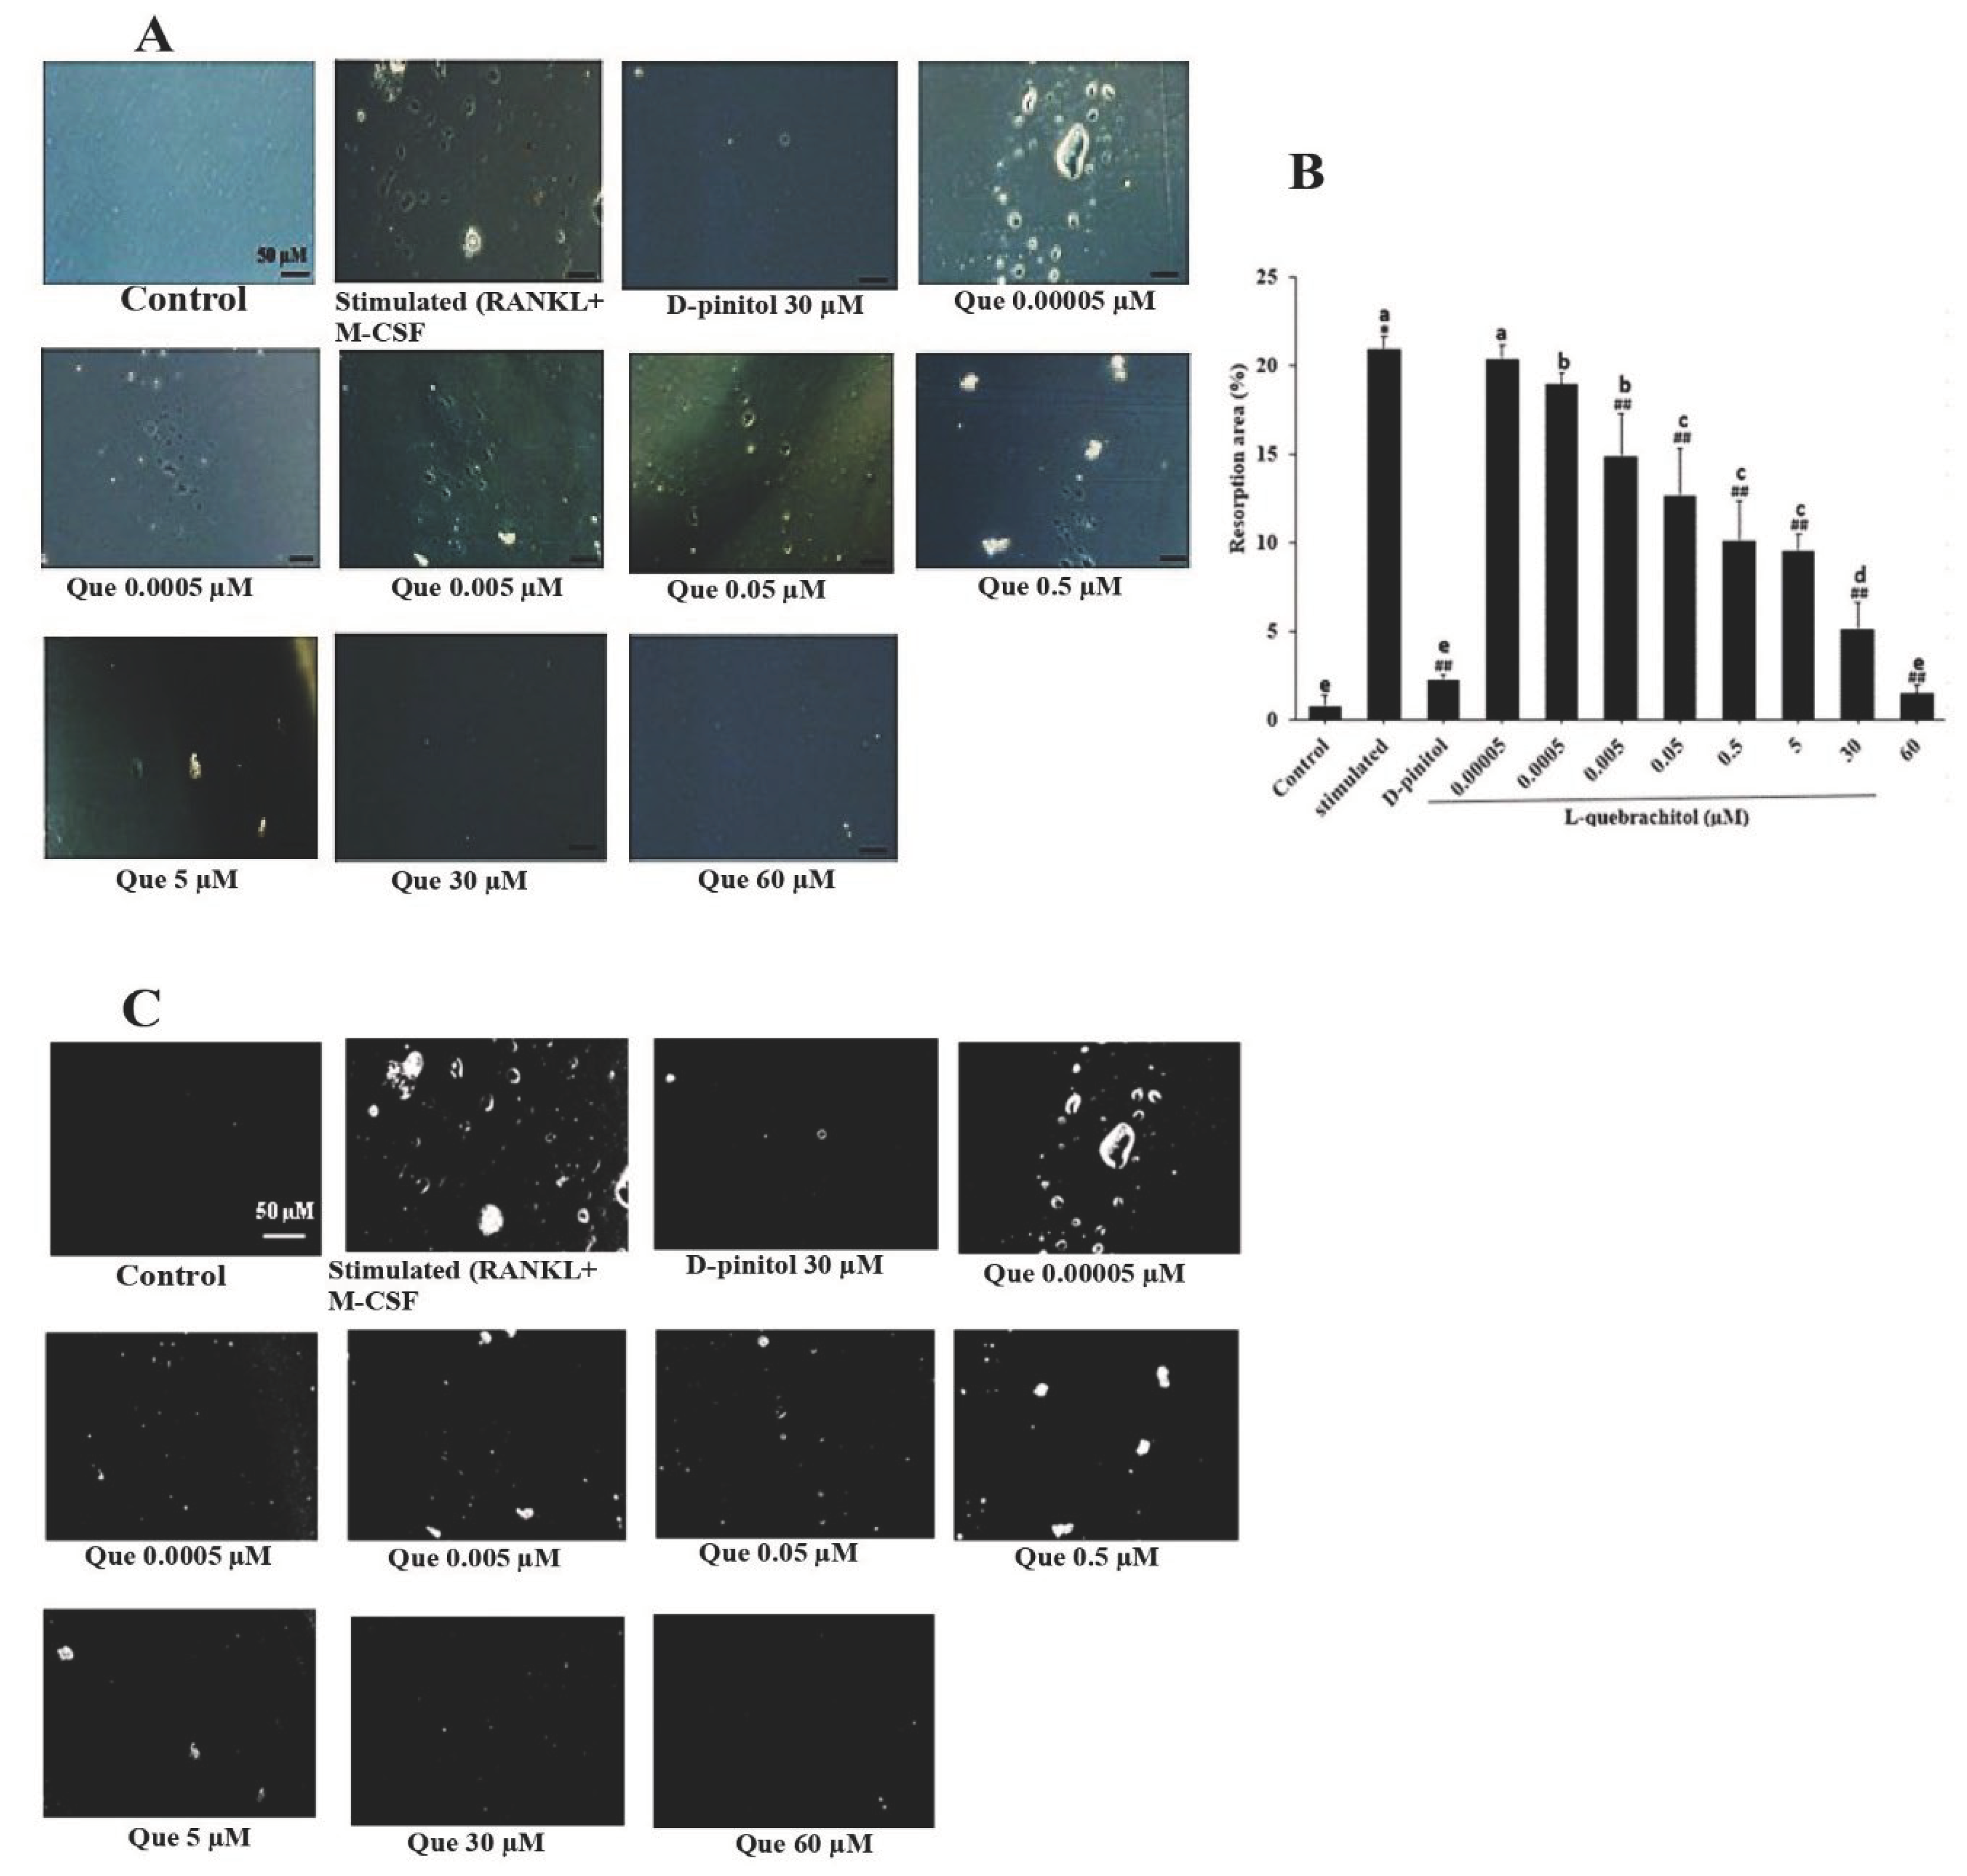
47]. Hence, the resorption level in these areas can represent the bone resorption ability of mature osteoclasts. The pit formation assay revealed that L-quebrachitol significantly and dose-dependently reduced the pit formation areas compared with those in the stimulation group. Furthermore, it was similar to that in the D-pinitol-treated group, which significantly suppressed pit formation. This result confirms that L-quebrachitol not only inhibits osteoclast differentiation but also potentially attenuates osteoclast resorption activity.
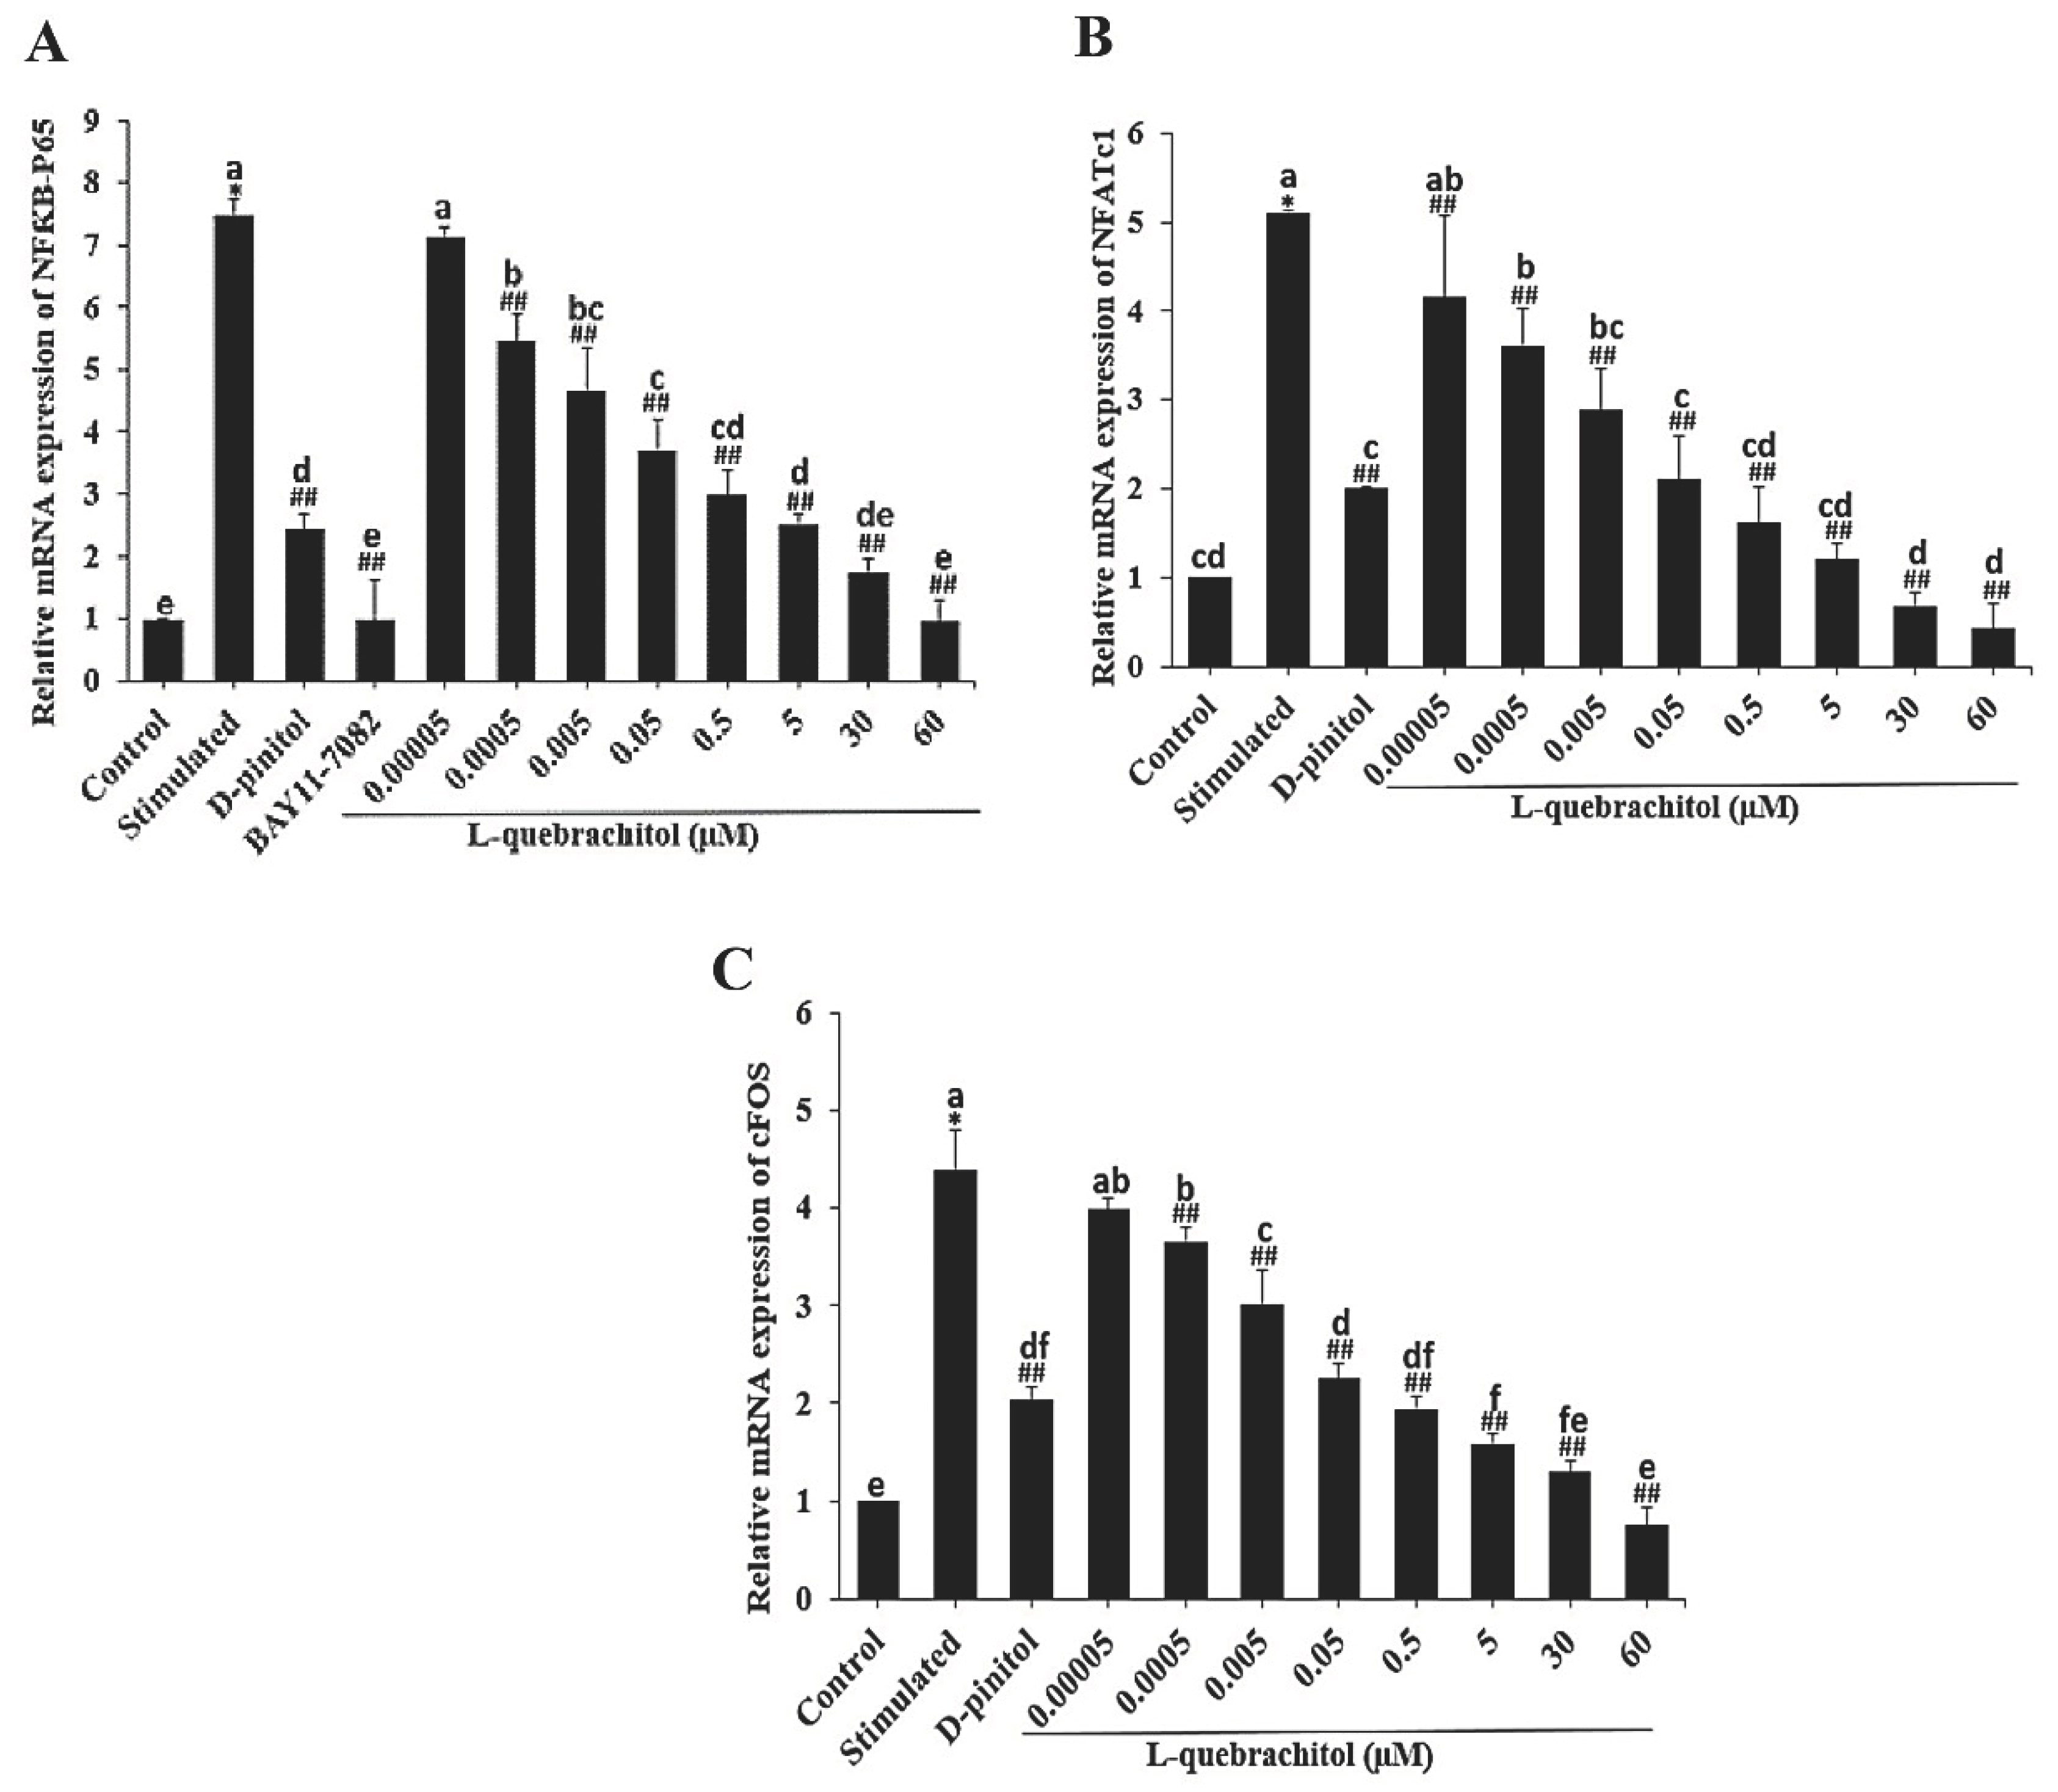
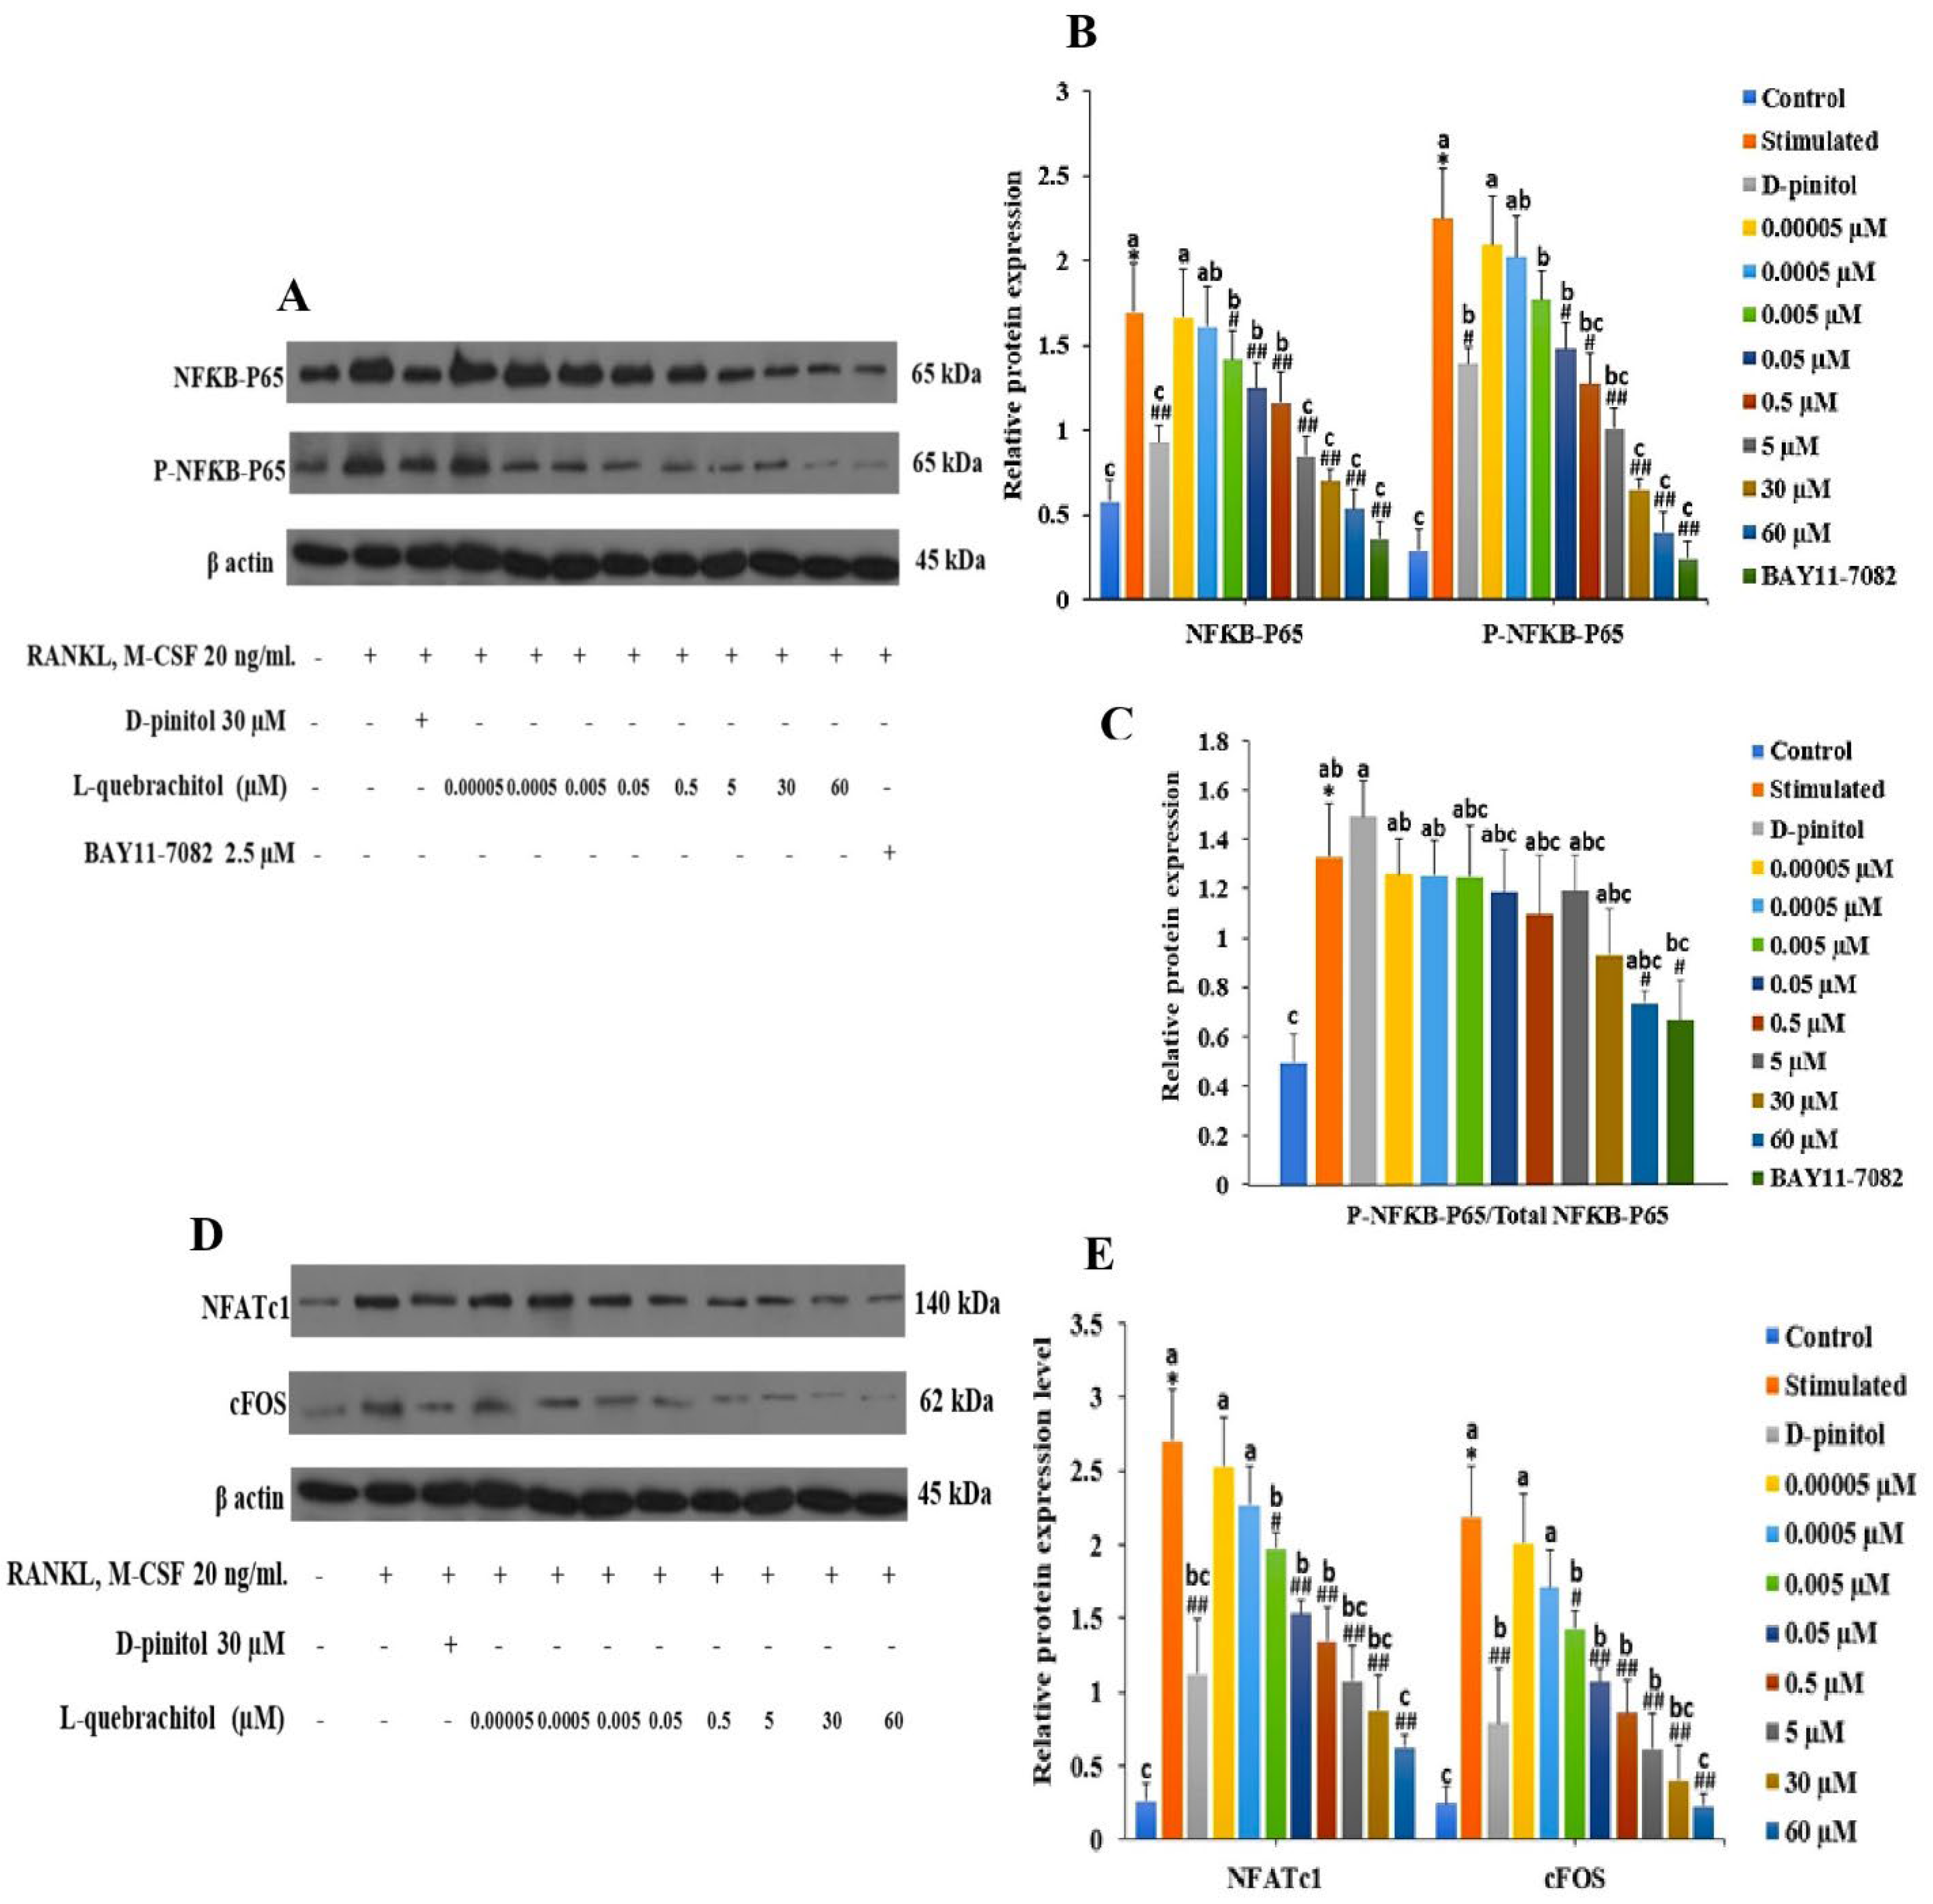
In this study, NF-κB-P65 expression was evaluated at both the mRNA and protein levels. The result showed that NF-κB-P65 expression was dose-dependently decreased, consistent with a recent study that showed that a rare sugar, D-allose, could strongly inhibit TRAP-positive cells through the NF-κB pathway [
48]. Furthermore, after treatment with BAY11-7082, an NF-κB inhibitor, the expression level distinctly decreased, confirming the inhibitory effect of L-quebrachitol on the NF-κB canonical pathway.
NFATc1 and c-Fos are well-established as key transcription factors involved in osteoclast differentiation and are regulated by NF-κB. NFATc1-knockout mice reportedly exhibit the failure of osteoclast differentiation and develop an osteoporotic bone phenotype [
49,
50]. We investigated the effect of L-quebrachitol on the expression of NFATc1 and c-Fos. Our results demonstrated that L-quebrachitol significantly suppressed the expression of both NFATc1 and c-Fos at both the transcriptional and protein levels. This suggests that L-quebrachitol can exert a negative effect on osteoclast differentiation by attenuating master modulators such as NFATc1 and c-Fos. Consistent with previous findings, D-chiro-inositol strongly suppressed multinucleated osteoclast formation and bone resorption activity through the attenuation of the NF-κB/NFATc pathway and proteolytic enzymes like TRAP and cathepsin K [
51]. Furthermore, an in vivo study demonstrated that D-pinitol significantly decreased bone loss in ovariectomised mice by suppressing NF-κB-P65 activation [
29]
A previous study demonstrated the suppressive effect of inositol hexakisphosphate (IP6) on osteoclast activity by reducing the expression of digestive enzymes [
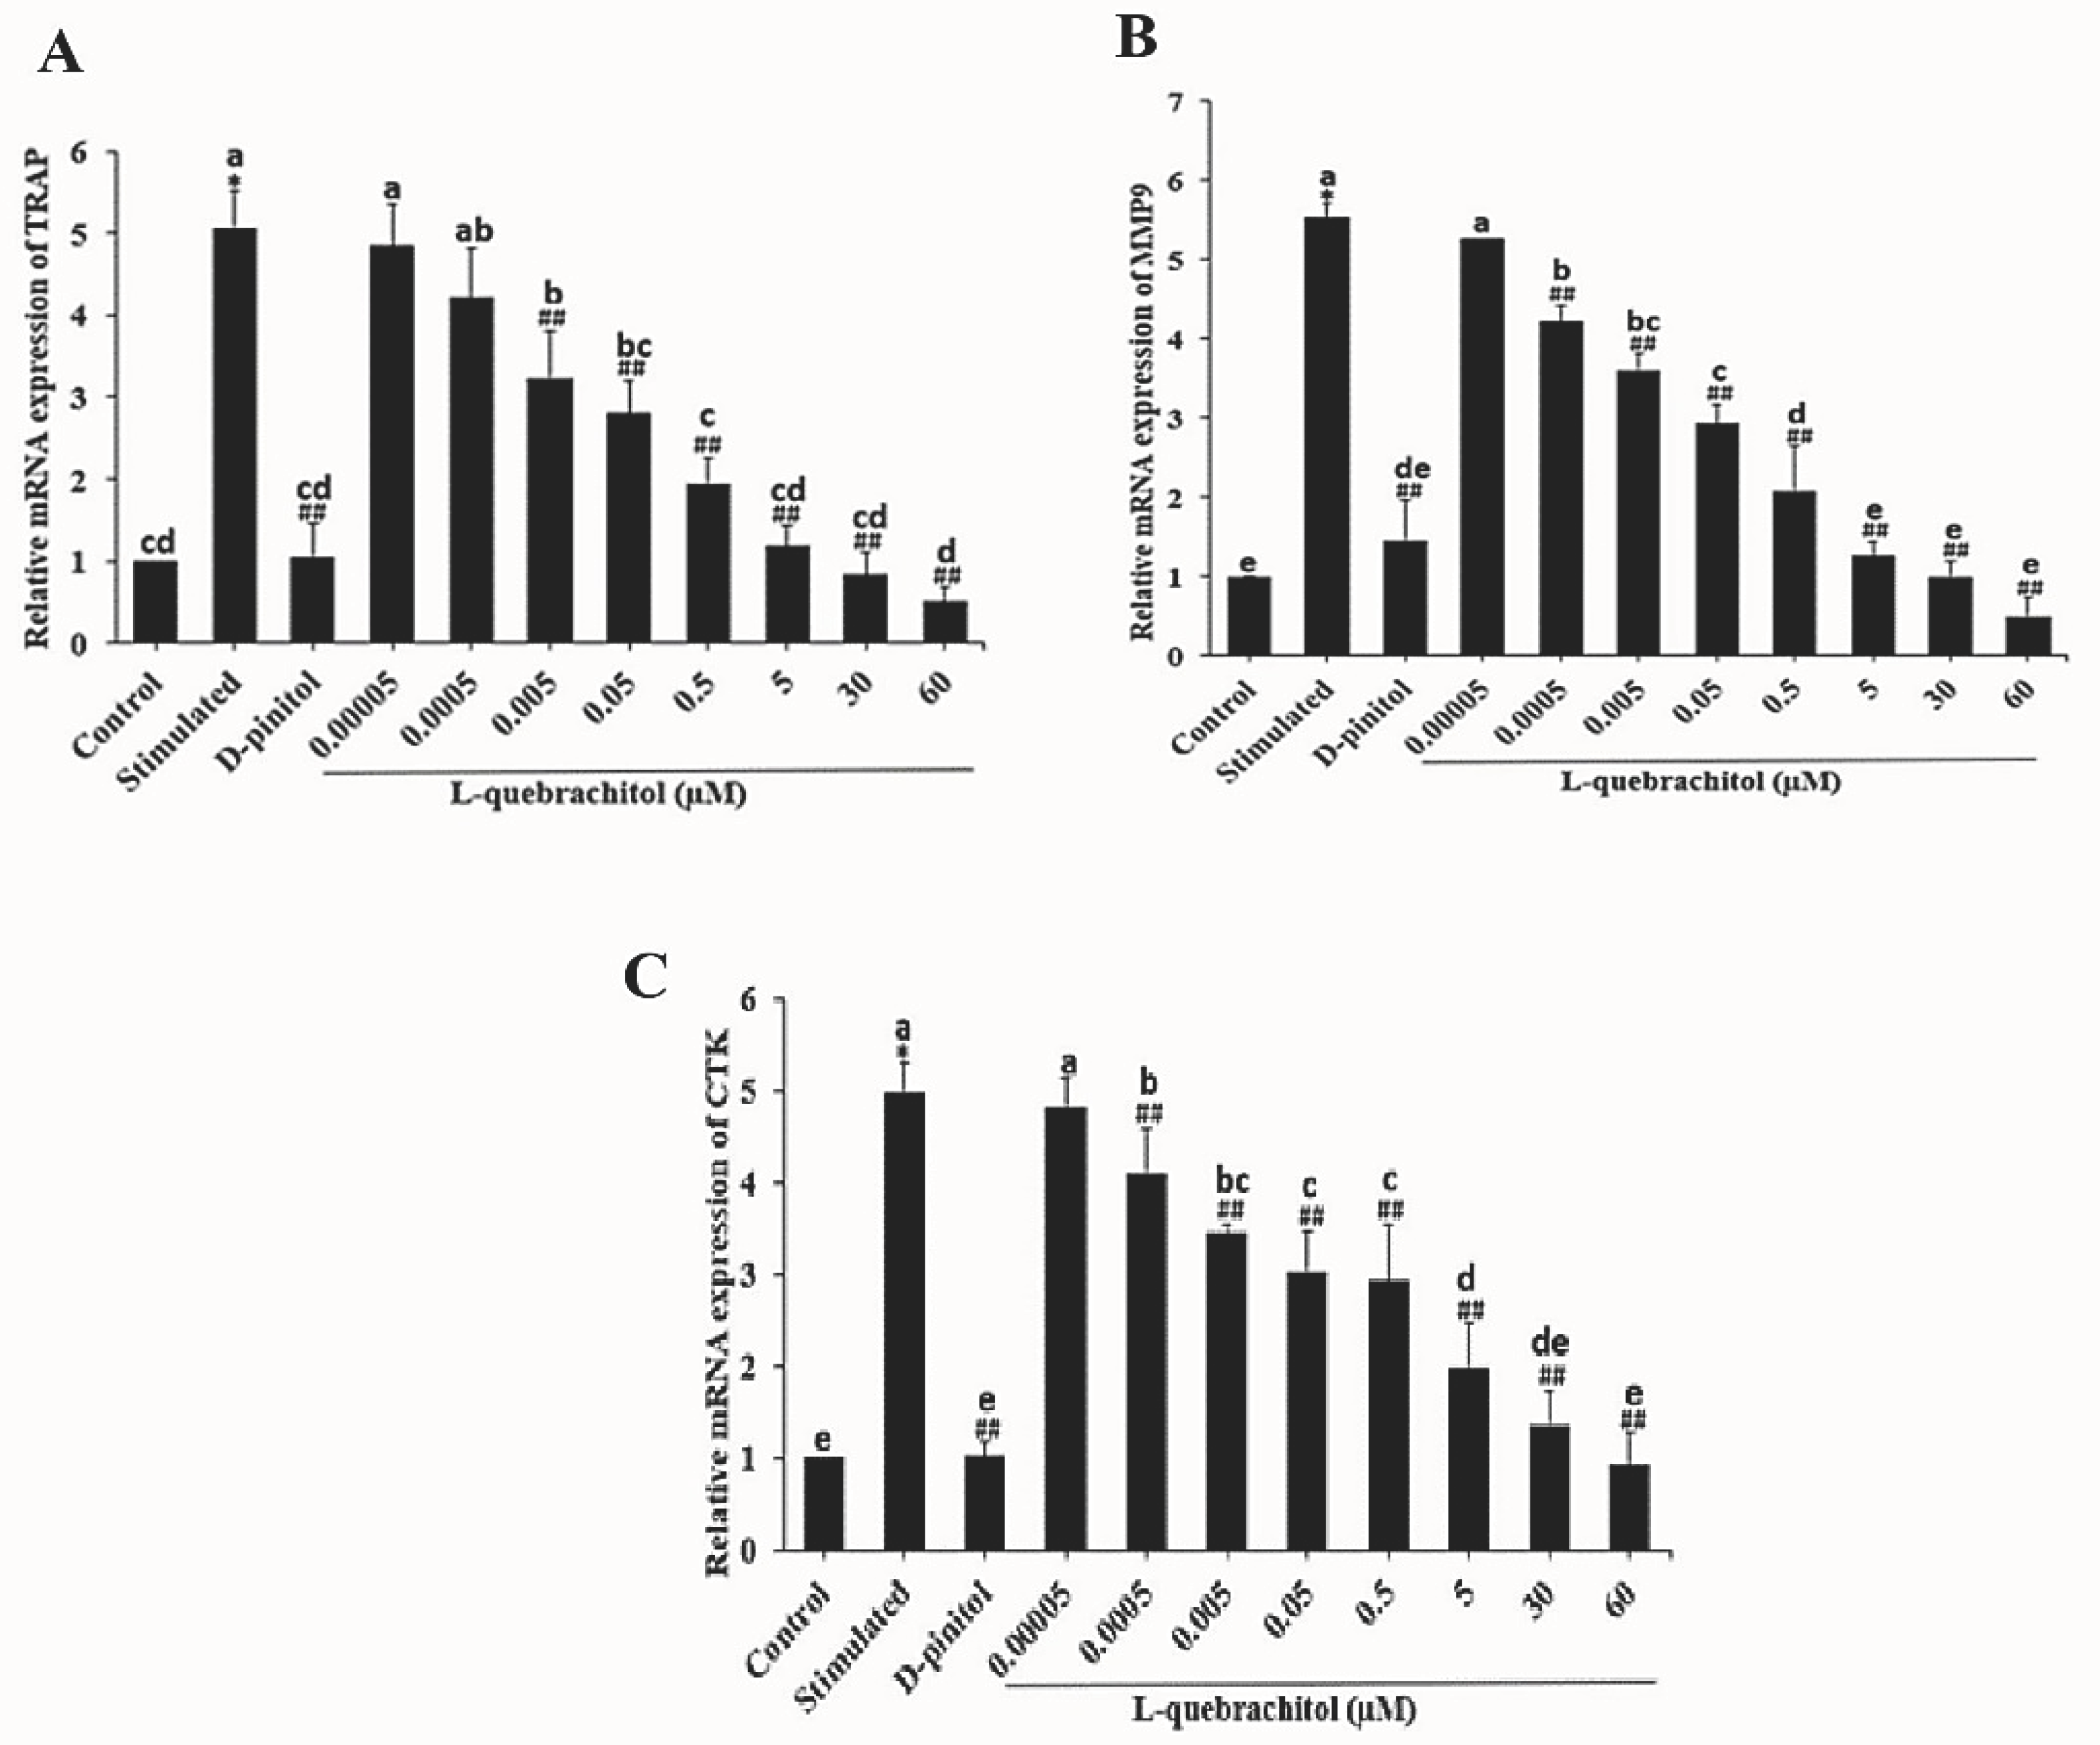
52]. Consistent with this, L-quebrachitol significantly downregulated the expression of proteolytic enzymes TRAP, MMP-9, and cathepsin K, which are crucial for bone resorption by osteoclasts. This was also consistent with the observed reduction in pit formation areas.
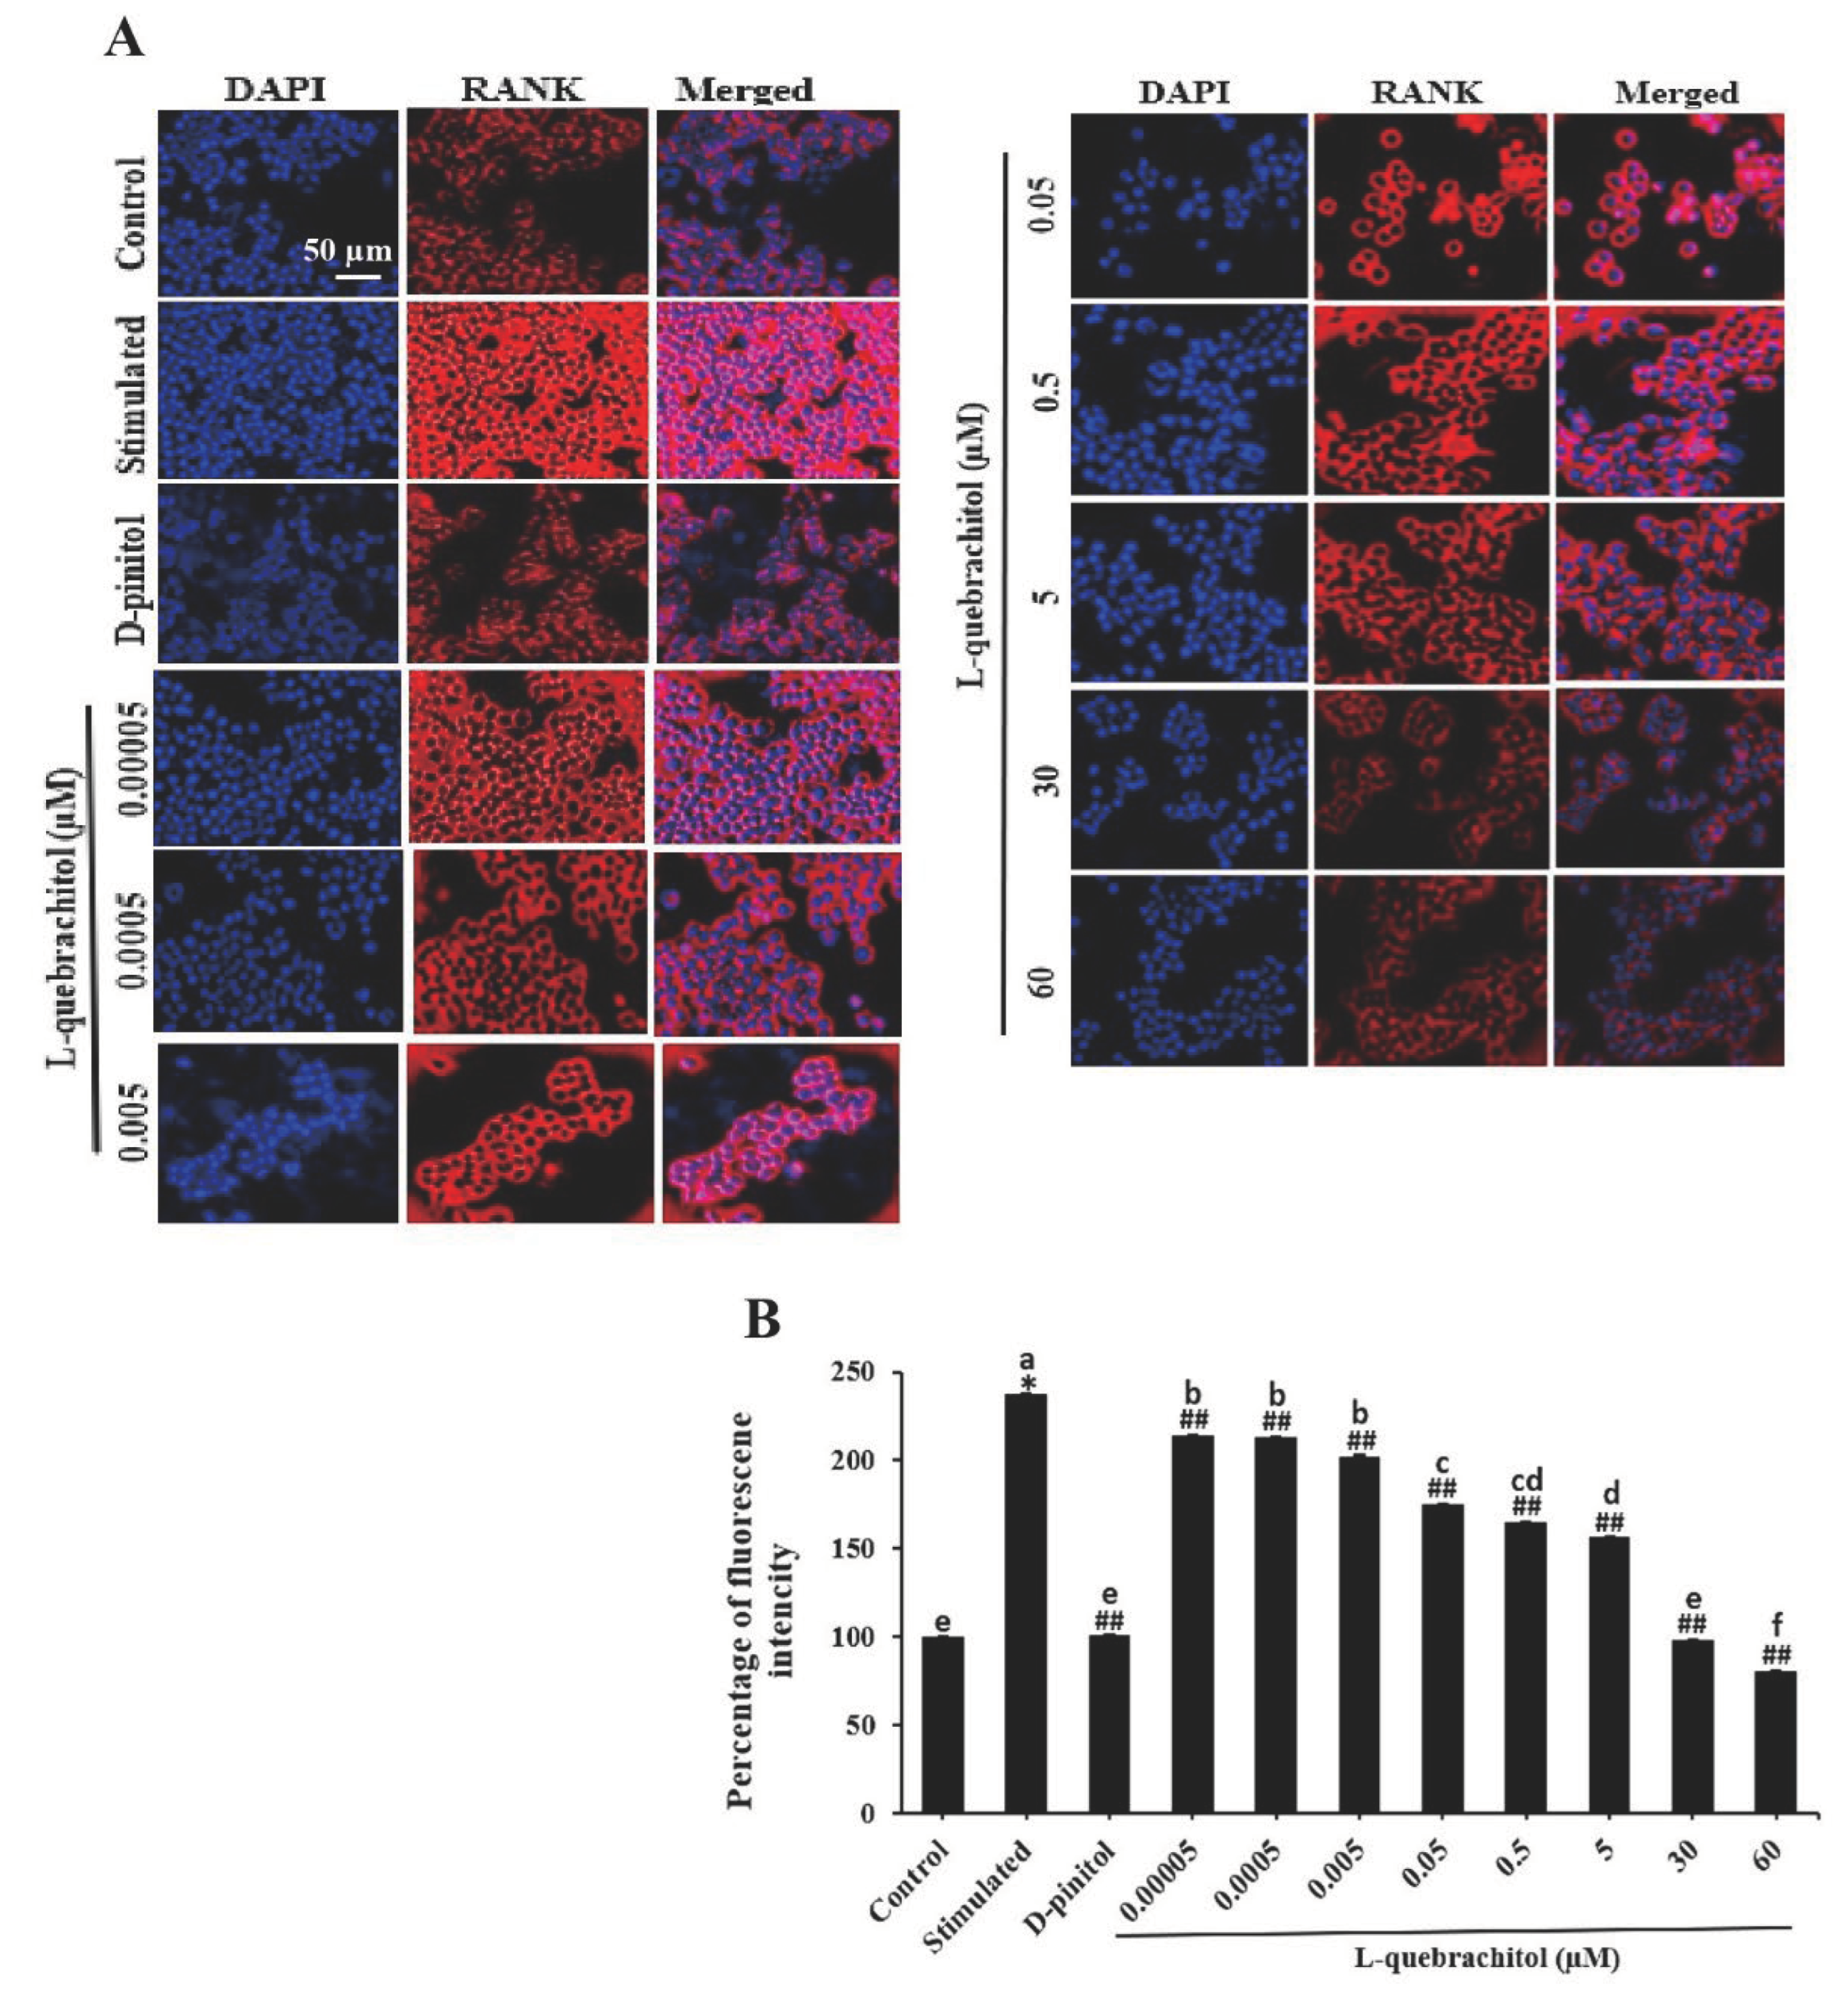
The RANK/RANKL/OPG system is a critical mechanism that regulates bone remodelling and osteoclastogenesis. The binding of RANK to its receptor triggers several downstream signalling pathways essential for osteoclast differentiation. However, OPG, a decoy receptor, can also bind with RANKL and inhibit osteoclastogenesis, this mechanism is naturally occurred for regulation of osteoclastogenesis [
53,
54]. Therefore, RANK could be the primary target of L-quebrachitol to suppress osteoclast differentiation. In this regard, the expression of RANK was subsequently detected by immunofluorescence staining. As expected, the expression of RANK was significantly induced by RANKL after 24 h of induction. However, L-quebrachitol treatment led to a dose-dependent suppression of its expression level, demonstrating that L-quebrachitol could significantly reduce RANK expression. This reduction might result in a decrease in RANK/RANKL interaction, leading to the inhibition of many osteoclastogenic modulators, including NF-κB-P65, NFATc1, and c-Fos, as shown in the western blot analysis. This finding correlates with previous results of other candidate therapeutic agents such as Necrostatin-7 and Decitabine, which have demonstrated suppressive activities on osteoclastogenesis through the RANK/NF-κB/NFATc1 pathway and prevented bone loss in ovariectomised mice [
55,
56]. Additionally, a recent study demonstrated that L-quebrachitol could significantly increase bone mineral density and bone calcium content in ovariectomized rats [
37], which also provided strong evidence on the effect of L-quebrachitol on bone metabolic homeostasis.
In conclusion, this study is the first to investigate the inhibitory effect of L-quebrachitol, extracted from Hevea latex serum, on osteoclast differentiation. L-Quebrachitol attenuated osteoclast differentiation and function by reducing the expression of RANK and crucial osteoclast transcription factors, including NF-κB-P65, NFATc1, and c-Fos, along with inhibiting bone digestive enzymes such as TRAP, MMP-9, and cathepsin K. Thus, these findings not only contribute to a better understanding of underlying molecular mechanism of L-quebrachitol in osteoclastogenesis but also suggested that L-quebrachitol has the potential to inhibit bone resorption while promoting bone formation; this would create value for Hevea brasiliensis latex serum, an abundant source of L-quebrachitol that is largely discarded by the rubber industry.
Author Contributions
Conceptualisation, Methodology, Investigation, Project administration, Data curation, Writing—original draft: PR. Methodology, Investigation, Project administration, Data curation, Writing—review & editing: AA. Formal analysis, Validation, Writing—review & editing: CS. Resources, Supervision: RW. Resources, Supervision, Conceptualisation, Methodology, Investigation, Project administration, Data curation, Validation, Funding acquisition, Writing—review & editing: TP.
Figure 1.
Cell viability evaluation of L-quebrachitol on RAW 264.7 cells. Cells were incubated with varying dosages of L-quebrachitol for 24, 48, and 72 h, and cell viability was detected using an MTT assay. All data was expressed as mean ± standard error of the mean for three experiments that were independently conducted. *P < 0.05 or **P < 0.01 compared with the control group.
Figure 2.
Effect of L-quebrachitol on RANKL-induced multinucleated osteoclast formation. (A) RAW 264.7 cells were treated with L-quebrachitol (0.05 nM–60 µM) under the stimulation of RANKL and M-CSF, and the differentiation of precursor cells to multinucleated osteoclasts was determined using TRAP staining. (B) Quantification of TRAP-positive cells/well and (C) TRAP-positive cells/area with more than three nuclei in each well (96-well plate). The data are shown as the mean ± standard error of the mean for three independent experiments. *P < 0.05 compared with the control group. ##P < 0.01 compared with the stimulated group treated with RANKL (20 ng/mL) and M-CSF (20 ng/mL). Letters on each column represent statistical significance at P < 0.05.
Figure 3.
Effect of L-quebrachitol on the bone resorptive ability of osteoclasts. RAW 264.7 cells were cultured in an osteoassay 96-well plates and treated with RANKL (20 ng/mL), M-CSF (20 ng/mL), and different doses of L-quebrachitol for seven days. (A) Resorption pit areas observed under a microscope (scale bar = 50 μm) and (B) quantification and (C) analyzation of bone resorption area with Image J. Data are expressed as the mean ± standard error of the mean of three independent experiments. *P < 0.05 compared with the control group. ##P < 0.01 compared with the stimulated group that was treated with RANKL (20 ng/mL) and M-CSF (20 ng/mL). Letters on each column represent statistical significance at P < 0.05.
Figure 4.
Effect of L-quebrachitol on the RANKL-induced NF-κB signalling pathway. RAW 264.7 cells were treated with various doses of L-quebrachitol and 2.5 µM BAY11-7082 in the presence of RANKL 20 ng/mL, M-CSF 20 ng/mL for 3 days. (A) Relative mRNA levels of NF-κB-P65, (B) NFATc1, and (C) c-Fos were evaluated using quantitative RT-PCR analysis. Data are expressed as the mean ± SEM of three independent experiments. *P < 0.05 compared with the control group. #P < 0.05, ##P < 0.01 compared with the stimulated group treated with RANKL 20 ng/mL. and M-CSF 20 ng/mL. Letters on each columns represent statistical significance at P < 0.05.
Figure 5.
L-Quebrachitol downregulates the expression of osteoclastogenic genes. RAW 264.7 cells were treated with different doses of L-quebrachitol in the presence of RANKL (20 ng/mL) and M-CSF (20 ng/mL) for three days. (A) Relative mRNA levels of TRAP, (B) MMP-9, and (C) cathepsin K were evaluated using RT-PCR analysis. Data are expressed as the mean ± standard error of the mean of three independent experiments. *P < 0.05 compared with the control group. #P < 0.05, ##P < 0.01 compared with the stimulation group treated with RANKL (20 ng/mL) and M-CSF (20 ng/mL). Letters on each column represent statistical significance at P < 0.05.
Figure 6.
L-Quebrachitol downregulates the protein expression of master transcription factors in osteoclasts (RAW 264). Briefly, cells were treated with different doses of L-quebrachitol or BAY11-7082 in the presence of RANKL (20 ng/mL) and M-CSF (20 ng/mL) for three days. Protein expression levels of (A) NF-κB-P65 and P-NF-κB-P65 and (D) NFATc1 and c-Fos were evaluated using western blot analysis, and (B), (C), (E) the protein intensity was quantified using ImageJ. Data are expressed as the mean ± standard error of three independent experiments. *P < 0.05 compared with the control group. #P < 0.05, ##P < 0.01 compared with the stimulated group treated with RANKL (20 ng/mL) and M-CSF (20 ng/mL). Letters on each column represent statistical significance at P < 0.05.
Figure 7.
L-Quebrachitol remarkably downregulates the expression of RANK. RAW 264.7 cells were treated with different doses of L-quebrachitol in the presence of RANKL (20 ng/mL) and M-CSF (20 ng/mL) for 24 h. (A) Expression of RANK was measured by immunofluorescence staining; the fluorescence image was captured with a fluorescence microscope at a magnification of 20 x and (B) analysed using Image J software. Data are expressed as the mean ± standard error of the mean of three independent experiments. *P < 0.05 compared with the control group. #P < 0.05, ##P < 0.01 compared with the stimulated group that was treated with RANKL (20 ng/mL) and M-CSF (20 ng/mL). Letters on each column represent statistical significance at P < 0.05.
Table 1.
Primer sequences of qRT-PCR.
Table 1.
Primer sequences of qRT-PCR.
| Gene |
Sequence |
GenBank Accession No. |
| NF-κB-P65 |
F: TCACCGGCCTCATCCACAT |
XM_006531694.4 |
| R: TGGCTAATGGCTTGCTCCAG |
| NFATc1 |
F: CACACACCCCGCATGTCA |
NM_001164110.1 |
| R: CGGGCCGCAAAGTTTCTC |
| c-Fos |
F: AGCTCCCACCAGTGTCTACC |
NM_010234.3 |
| R: TCACCGTGGGGATAAAGTTGG |
| TRAP |
F: TGGATTCATGGGTGGTGCTG |
XM_006509946.3 |
| R: CGTCCTCAAAGGTCTCCTGG |
| MMP-9 |
F: CTCTGCTGCCCCTTACCAG |
NM_013599.5 |
| R: CACAGCGTGGTGTTCGAATG |
| Cathepsin K |
F: AGTAGCCACGCTTCCTATCC |
NM_007802.4 |
| R: GAGAGGCCTCCAGGTTATGG |
| GAPDH |
F: AGGTCGGTGTGAACGGATTTG |
XM_036165840.1 |
| R:TGTAGACCATGTAGTTGAGGTCA |
